1. Introduction
The issue of electricity constraint is currently being faced by cities due to the rapid growth in economic volume and population [
1]. During periods of extreme weather conditions, there is a prevalence of extensive power limitations or disruptions [
2]. The aforementioned events have detrimental effects on urban productivity and quality of life, and can even result in fatalities among susceptible populations due to severe heat or cold weather [
3,
4], along with significant economic repercussions.
Given these pragmatic concerns, the extensive implementation of distributed photovoltaic (PV) power sources in urban regions has become progressively vital. Distributed PV electricity has the potential to mitigate the scarcity of urban power resources and effectively address sudden power outages [
5]. Additionally, it has the potential to reduce carbon emissions in metropolitan areas [
6,
7], promoting the advancement of environmentally sustainable cities [
8]. Furthermore, the rapid growth of distributed PVs can enhance the flexibility of urban energy systems and significantly enhance the capacity of the electrical supply [
9], particularly in light of the substantial rise in the number of new energy vehicles (NEVs) [
10].
Calculating the power generation capability of a distributed PV in an entire city or neighborhood requires determining the total available area. A geographic information system (GIS) can be utilized to ascertain the extent of the roof area that is accessible for rooftop PV systems [
11,
12,
13]. Nevertheless, the determination of the accessible building facade area presents challenges as a result of the uneven characteristics of the urban morphology and the shadowing impact caused by adjacent structures. The main difficulty lies in measuring the differences in space between neighboring buildings and determining the range of heights displayed by accessible building facades. The spatial qualities of surrounding buildings have an impact on the solar radiation within the street space. Consequently, this has a significant impact on both the energy usage of the structure and the power production of photovoltaic integrated shading device (PVSD) systems located on the building’s exterior [
14].
Recent studies have characterized the area between buildings as an urban street canyon [
15] and have employed the aspect ratio (AR) [
16,
17,
18] as a measure to define its visual characteristics. AR considers the impact of the heights of nearby buildings and the distance between buildings on the total amount of solar radiation received. The establishment of a direct connection between the bottom of a street canyon and the study target is the sole suitable approach. As an illustration, Deng et al. [
15] employed ENVI-met software to investigate the impact of AR and direction on the microclimate and outdoor thermal comfort within the central business area of Nanjing. The investigation was conducted at a vertical distance of 1.5 m above the ground level of the street canyon. The findings indicated a significant association between the geometric configuration of urban streets and the level of outdoor thermal comfort. This relationship warrants careful consideration in the context of street planning and design. In the study conducted by Wang et al. [
19], the researchers utilized the street canyon enclosure ratio (SCER) as a quantitative measure to represent street scenes with different building heights on opposite sides of the street, as AR is not suitable for such scenes.
Nevertheless, when it comes to PVSDs positioned at various heights on building facades within street canyons, these indices remain inadequate in accurately and comprehensively characterizing the street area above the PV panels. Consequently, they fail to provide meaningful guidance for the design and implementation of PVSDs. Hence, this research examined the spatial separation between the PV panel and the ground, employing an AR framework. The present study presents a novel space aspect ratio index, referred to as AR(h). A quantitative analysis of the performance of PV power generation at various heights may be conducted using AR(h). This analysis allows for the identification of the essential location on the building façade that has the potential for application.
This study aimed to establish a strong correlation between street space characteristics, PVSDs power generation, and building energy consumption based on the AR(h) index. The objective was to efficiently determine the optimal location for installing PVSDs on building facades in various street canyons. This study investigated the impact of the shading effect caused by neighboring buildings, in conjunction with PVSDs, on the internal temperature climate and natural illumination of buildings. Additionally, this study assessed the changes in energy consumption, photovoltaic performance, and energy-saving rate using the AR(h) index. Subsequently, based on the variation law, the essential prerequisites for the establishment of PVSDs in various street areas were identified, and the appropriate strategies for their development were suggested. The feasibility of developing PVSDs in various street scenes was further examined through an assessment of the AR(h) index’s applicability. This analysis will aid practitioners in promptly identifying the building facades suitable for PVSD implementation in different street scenes.
2. Literature Review
The optimum design of solar systems should prioritize considerations of the diverse range of real-world scenarios. When developing and designing solar systems in urban areas, it is crucial to take into account several elements, including latitude, angle, vertical spacing, control method, and installation location. The research conducted by Siraki et al. [
20] demonstrated a notable association between the tilt angle of solar systems and the latitude. Nevertheless, variations in solar radiation intensity across different locations result in distinct disparities in the tilt angle of photovoltaic panels. According to Zhang et al. [
21], the optimal orientation for the installation of PVSDs in Hong Kong is south, with an optimal inclination angle of 20°. Nevertheless, a study conducted by Fouad et al. [
22] in Egypt revealed that the optimal tilt angle for PVSDs falls between 64 degrees and 70 degrees. When designing solar arrays, it is imperative to take into account not only the angle of incidence but also the self-shading phenomenon. The overall performance of the solar system is substantially influenced by the vertical distance between photovoltaic panels. The research conducted by Shi et al. [
23] revealed that the mean comprehensive energy conservation rate of PVSDs ranges from 16.12% to 51.95%. In a study conducted by Kim et al. [
24], it was shown that a PV blinds system with narrow spacing exhibited a noticeable self-shading effect, resulting in a considerable decrease in solar performance. Furthermore, the impact of PVSDs control tactics on power generation potential was investigated by Paydarr [
25] Their study revealed that when the tilt angle was modified biannually, it resulted in a mere 2% increase in power generation compared to the fixed mode. Specifically, various placements of photovoltaic panels result in distinct shading consequences.
According to Wang et al. [
26], the slanted rooftop photovoltaic shading effect is most effective during the summer for a solar system put on a roof. Installing horizontal rooftop photovoltaics during winter can effectively mitigate heat loss. Installing PVSDs on the building facade will have a substantial impact on the internal thermal and light conditions, similar to a conventional shading device. The research conducted by Zhao et al. [
27] demonstrated that shade has a substantial impact on reducing energy usage and enhancing comfort. The total energy consumption in Tianjin, Shanghai, and Guangzhou declined by 8.08%, 11.70%, and 26.70%, correspondingly.
Scholars have employed or devised diverse optimization methods to comprehensively assess the influence of different factors on solar performance. Liu et al. [
14] utilized EnergyPlus to simulate the impact of geometric factors on the energy-saving capacity of PVSDs. They then optimized the design of PVSDs using an adaptive control model (ACM) to effectively respond to real-time weather changes. The office cooling and lighting requirements were decreased by 48.7% through optimization. Sadatifar et al. [
28] conducted a comprehensive analysis to address the conflict between photovoltaic power generation, cooling, heating, and lighting. They examined the variations in photovoltaic power generation, indoor lighting quality, and thermal environment. They then proceeded to perform a multi-objective optimization of the design of PVSDs and developed optimized models.
Furthermore, an in-depth analysis of Zhang et al.’s review provides valuable insights into the advancements made in the field of PVSDs [
29]. This study examined the impact of several elements, such as research location, material qualities, economic cost, angle, and other variables, on the performance of PVSDs. Nevertheless, prior research has neglected to account for the impact of shadowing caused by adjacent structures on PVSD power generation, as well as the energy consumption of buildings situated in street canyons. Hence, these investigations fail to offer adequate direction for specialists aiming to ascertain the appropriate spectrum of building facades that can be efficiently employed.
Table 1 presents a concise overview of the literature review.
3. Materials and Methods
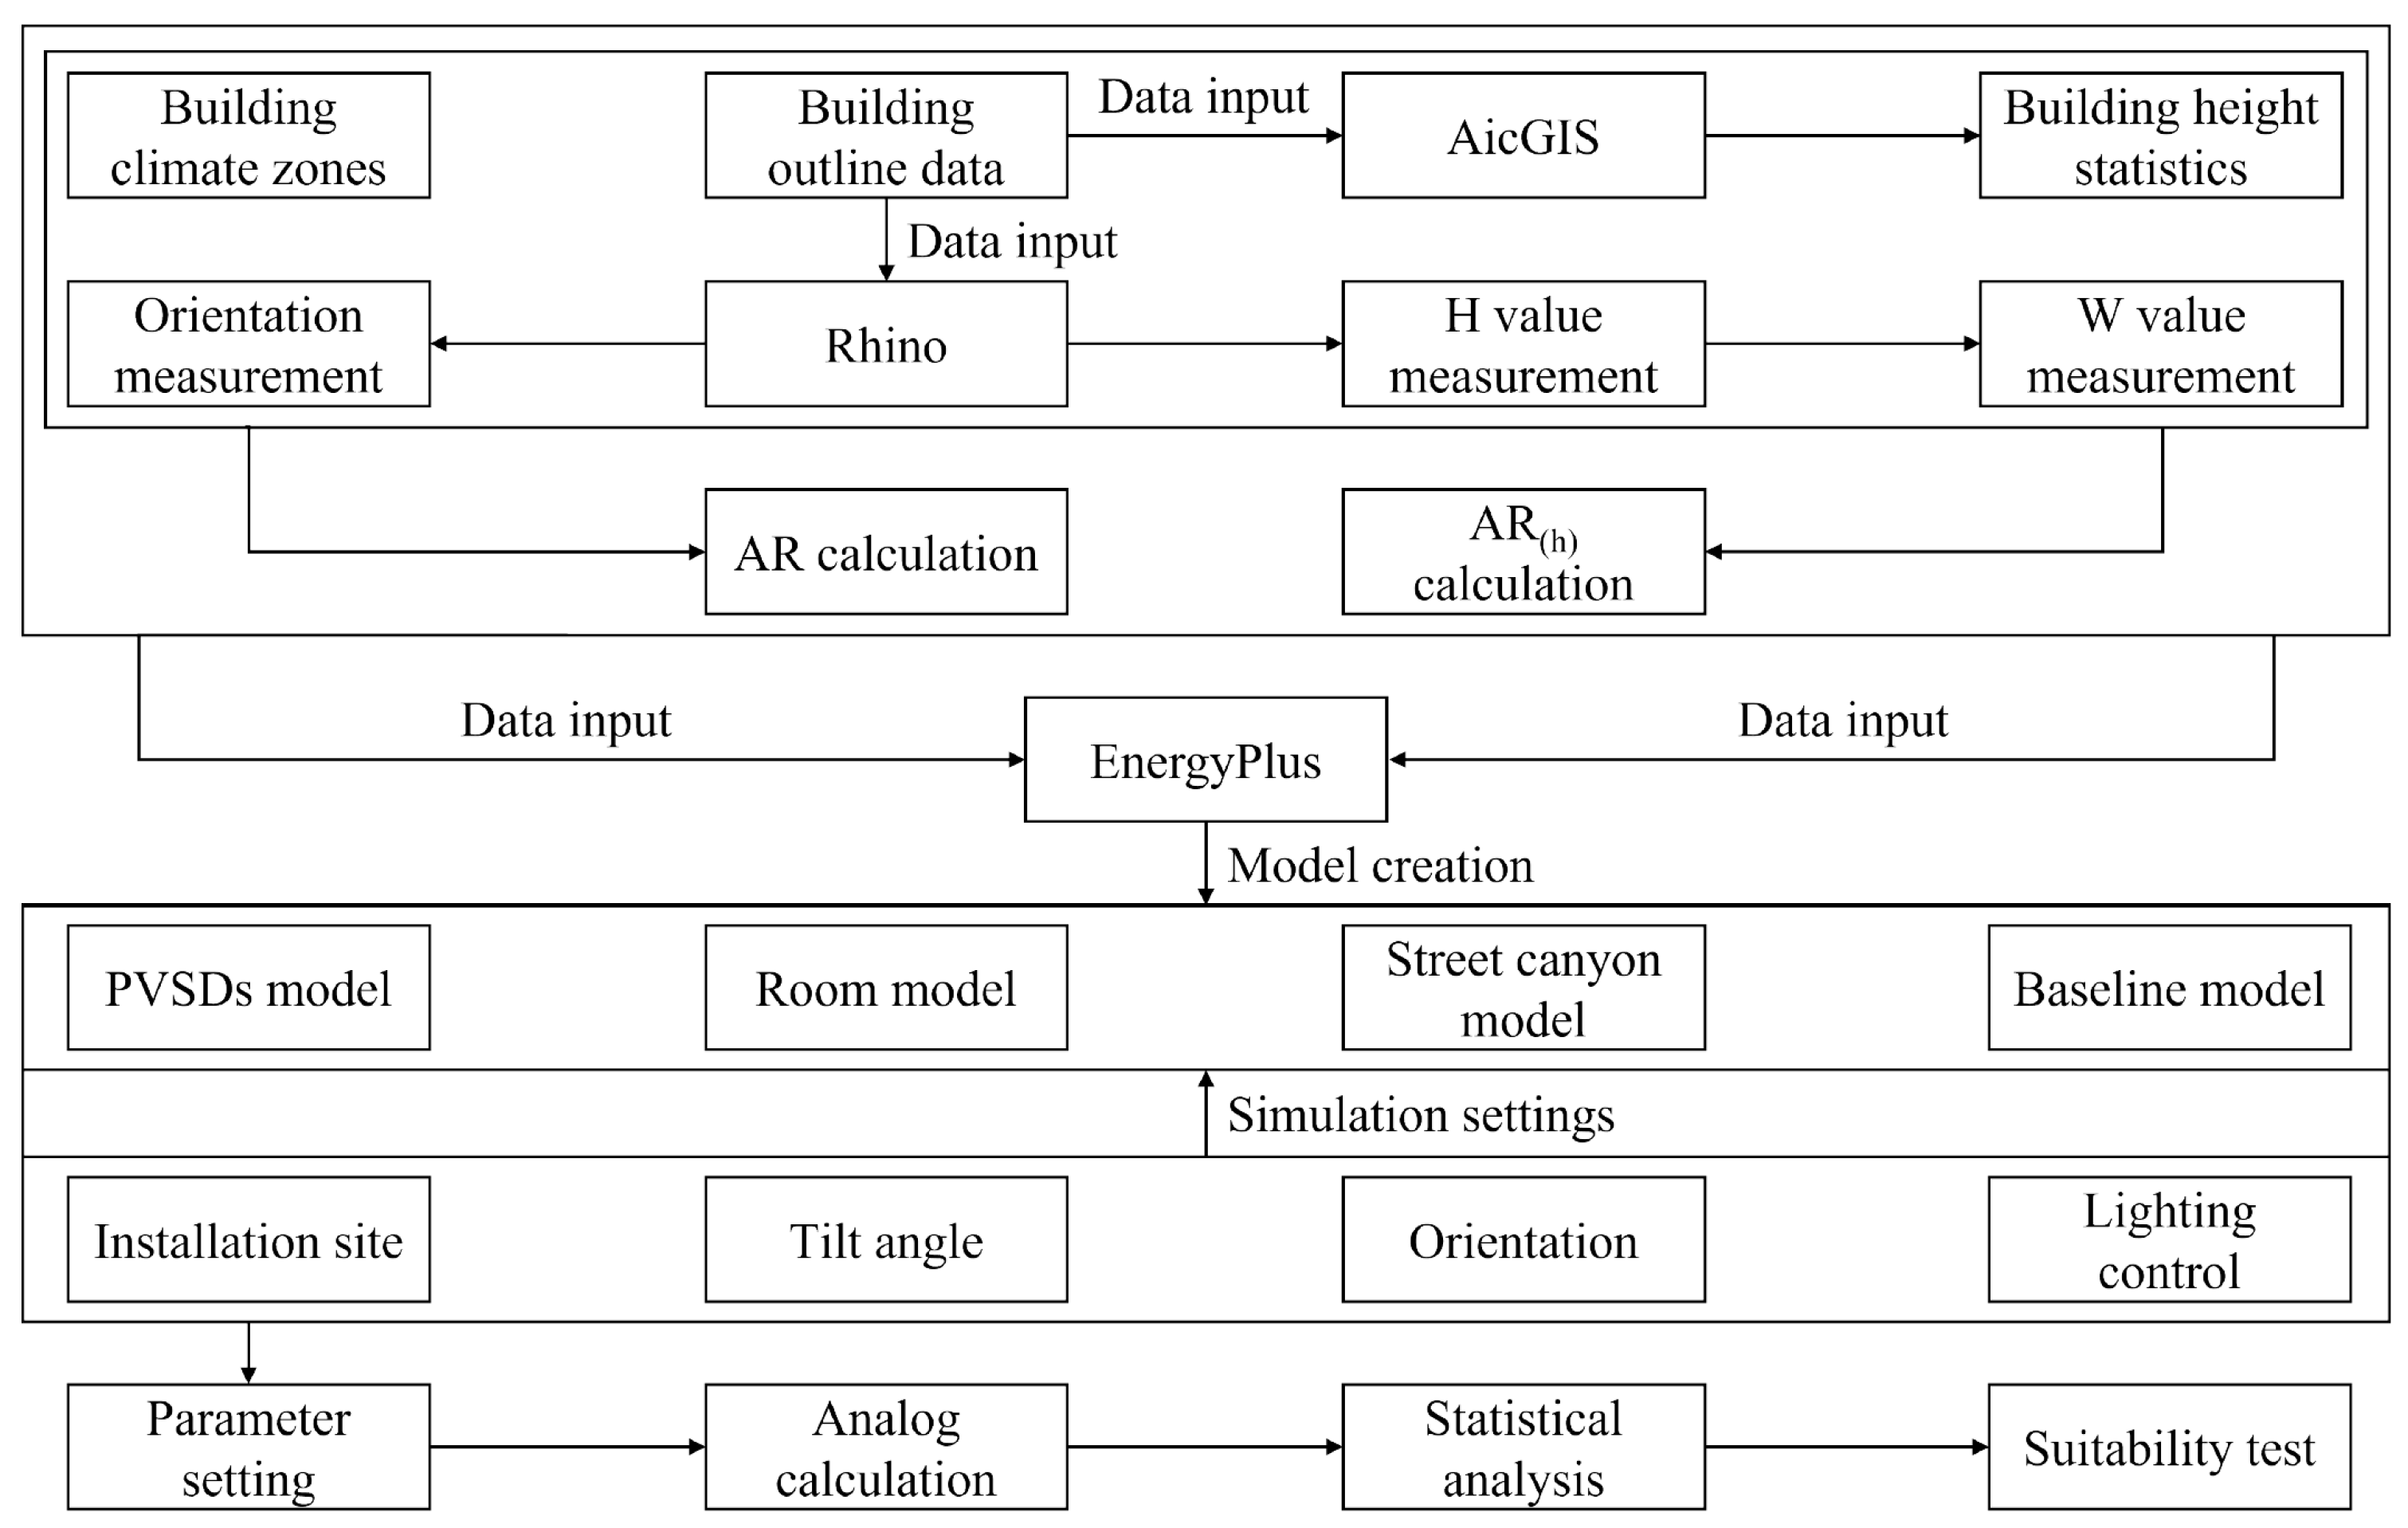
This section provides a comprehensive explanation of the modeling process employed in this study. The text introduces the approach and process of creating an urban street canyon model using real scenes. It also provides the foundation for determining building height and the range of augmented reality values. Subsequently, the equations for the AR index and AR
(h) index are presented, followed by an examination of their interrelationships and the factors that influence them. Subsequently, the PVSDs system and the independent room energy consumption calculation model are developed using the EnergyPlus simulation program, and the model’s parameters are meticulously established. In conclusion, this section presents the simulation scenarios and statistical analysis methodologies, along with certain precautions.
Figure 1 illustrates the process of creating the calculating model.
3.1. Study Area and Urban Street Canyon Model
The focus of this research pertains to the Xuanwu District located in Nanjing [
31,
32]. The classification of Xuanwu District assigns it to the hot summer and cold winter zone [
33]. The area under question is situated in the core region of Nanjing. The area under consideration encompasses a total of seven sub-districts. Xinjiekou sub-district has achieved an urbanization rate of around 100% [
34]. This study employed ArcGIS software to examine the distribution of urban building height based on the building outline data provided [
35,
36]. Furthermore, this study employed Rhino software to import building outline data in order to quantify the width and height of street canyons, taking into account the fluctuating distance between different structures within the metropolitan region. Following this, the calculating range of AR was established within the interval of 0 to 5, a range that adequately encompasses the bulk of real-world scenarios.
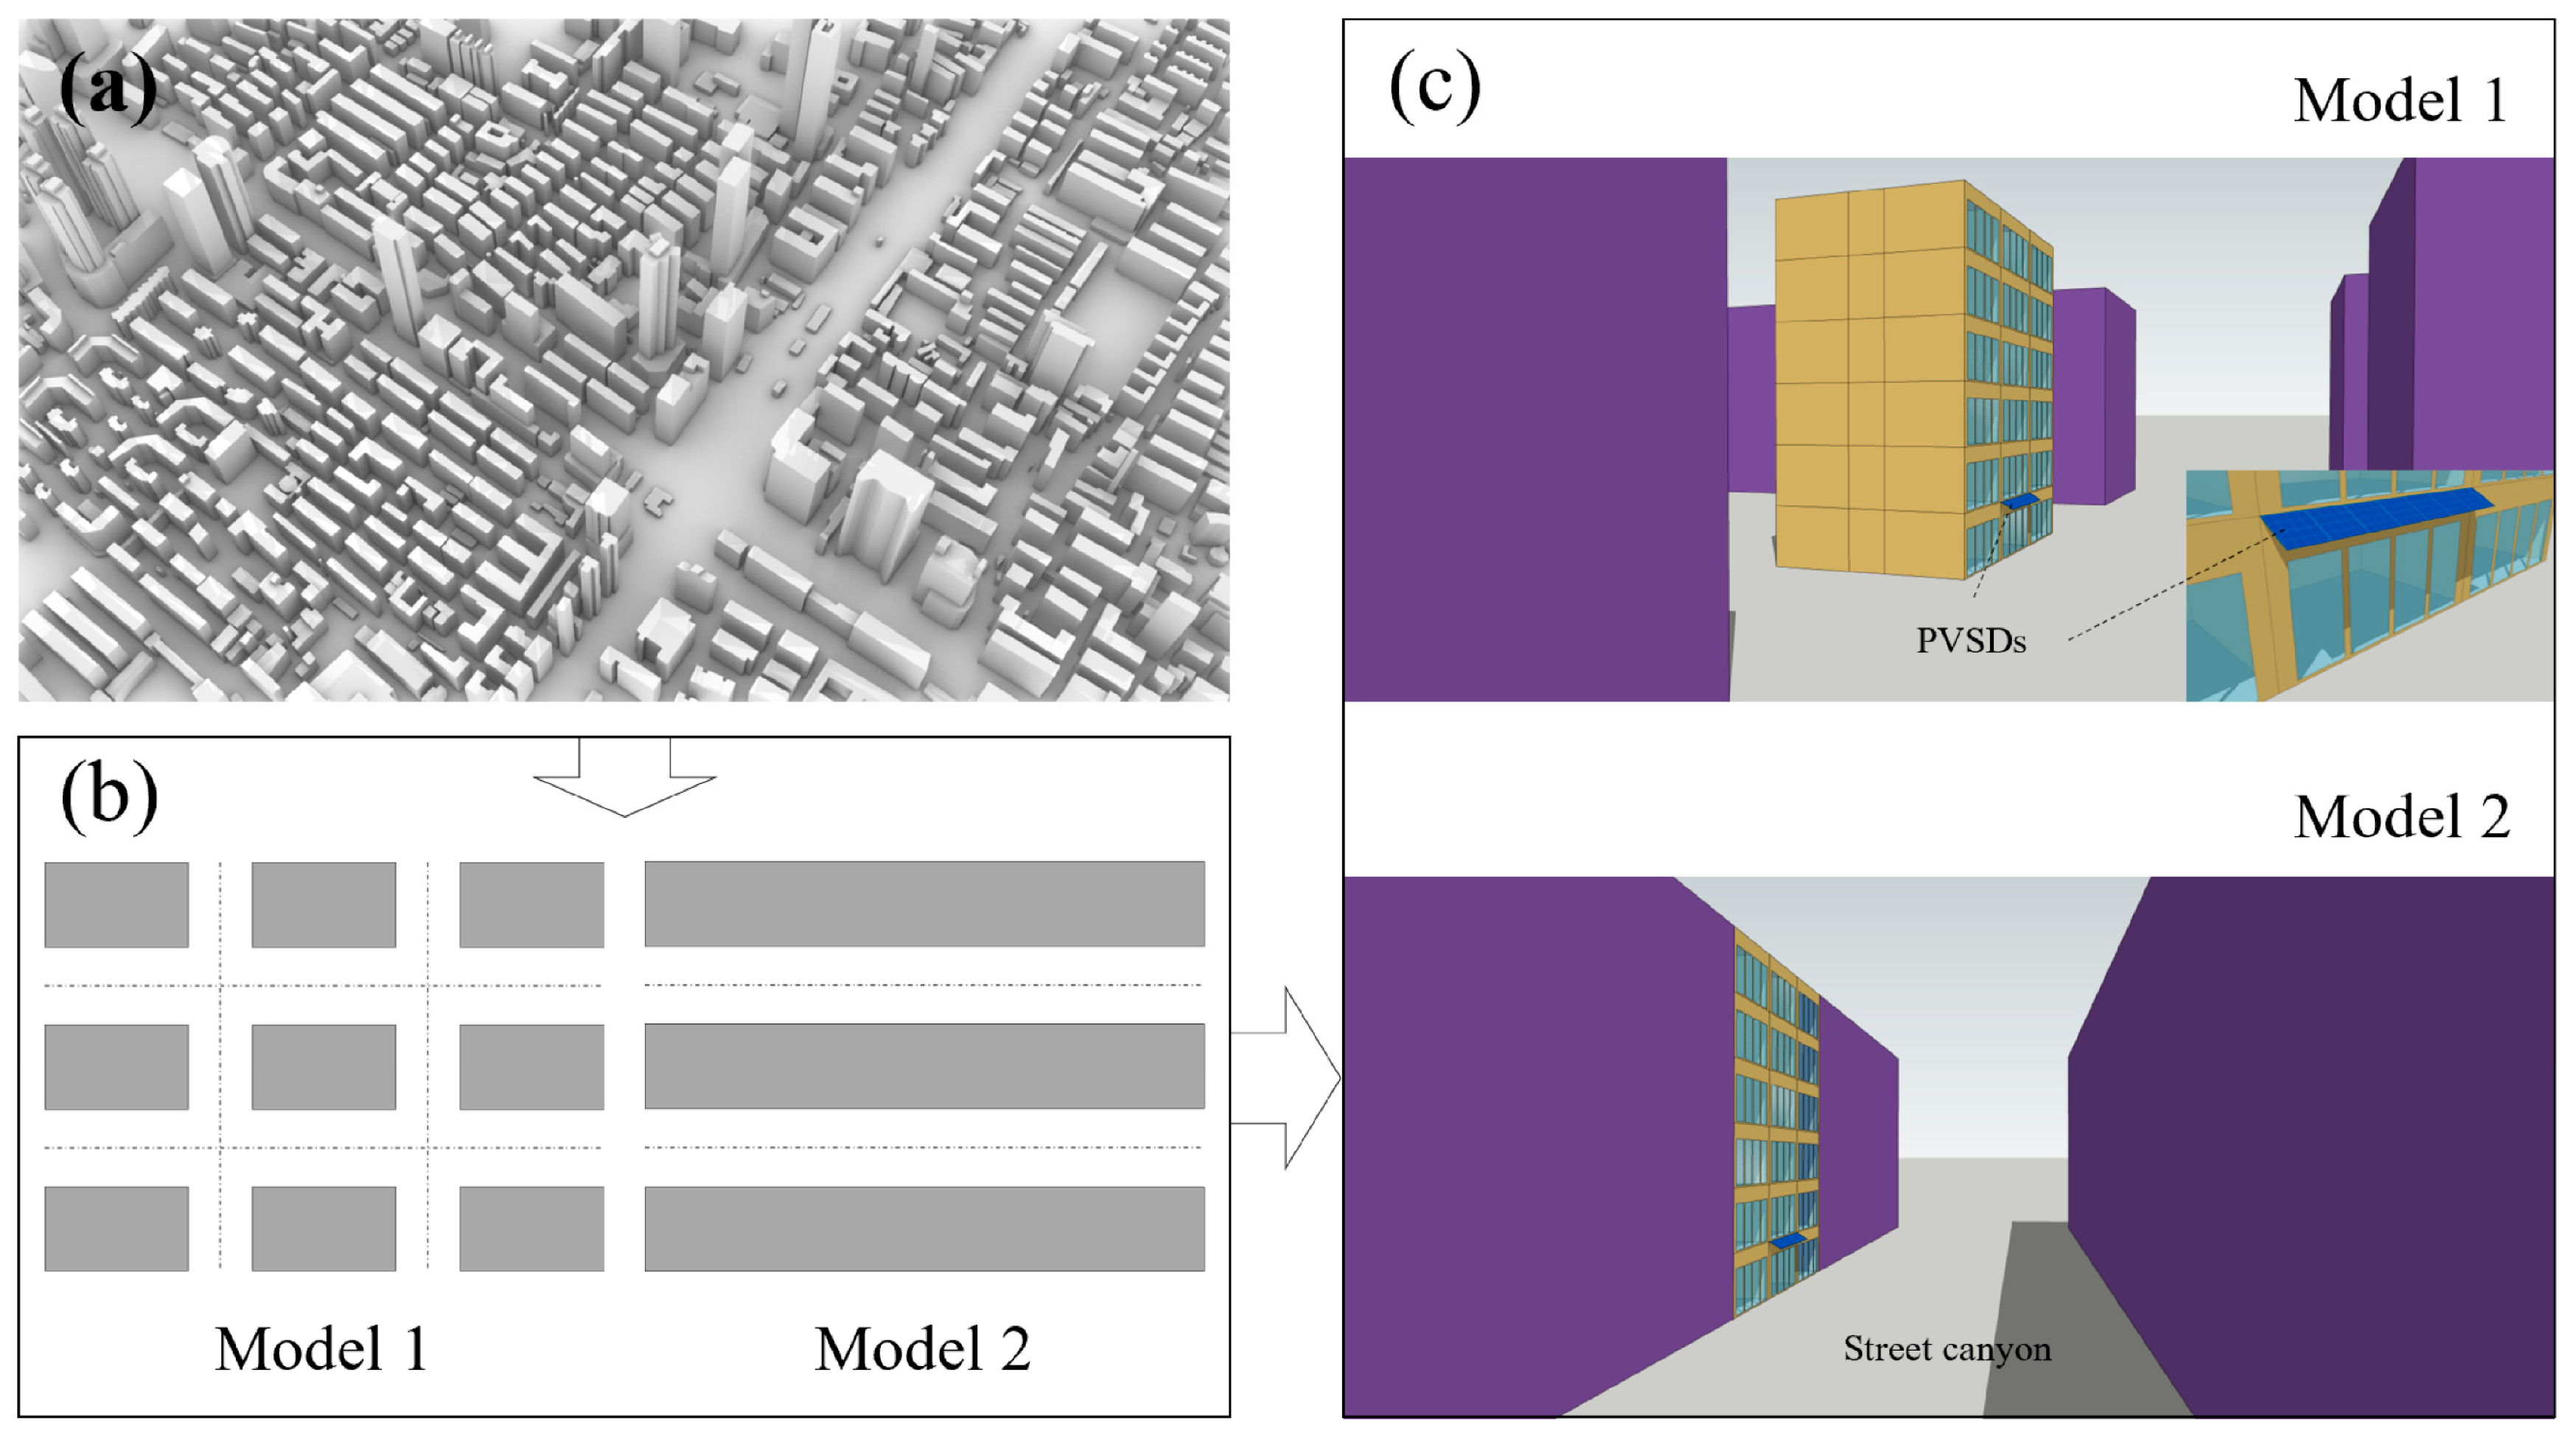
The present study presents two street canyon models that are derived from the model proposed by Deng et al. [
15], as well as the characteristics of the urban building layout [
37,
38]. These models are visually represented in
Figure 2a,b. This study used these models to assess and validate the influence of building layout on the research outcomes. Incorporating shading blocks representing adjacent buildings into EnergyPlus [
39,
40,
41] allows for an examination of the impact of shading from nearby buildings on the performance of PVSDs and the energy consumption of indoor areas. These shading blocks have the ability to provide shading and reflect light, as depicted in
Figure 2c.
3.2. The Equation of AR and AR(h)
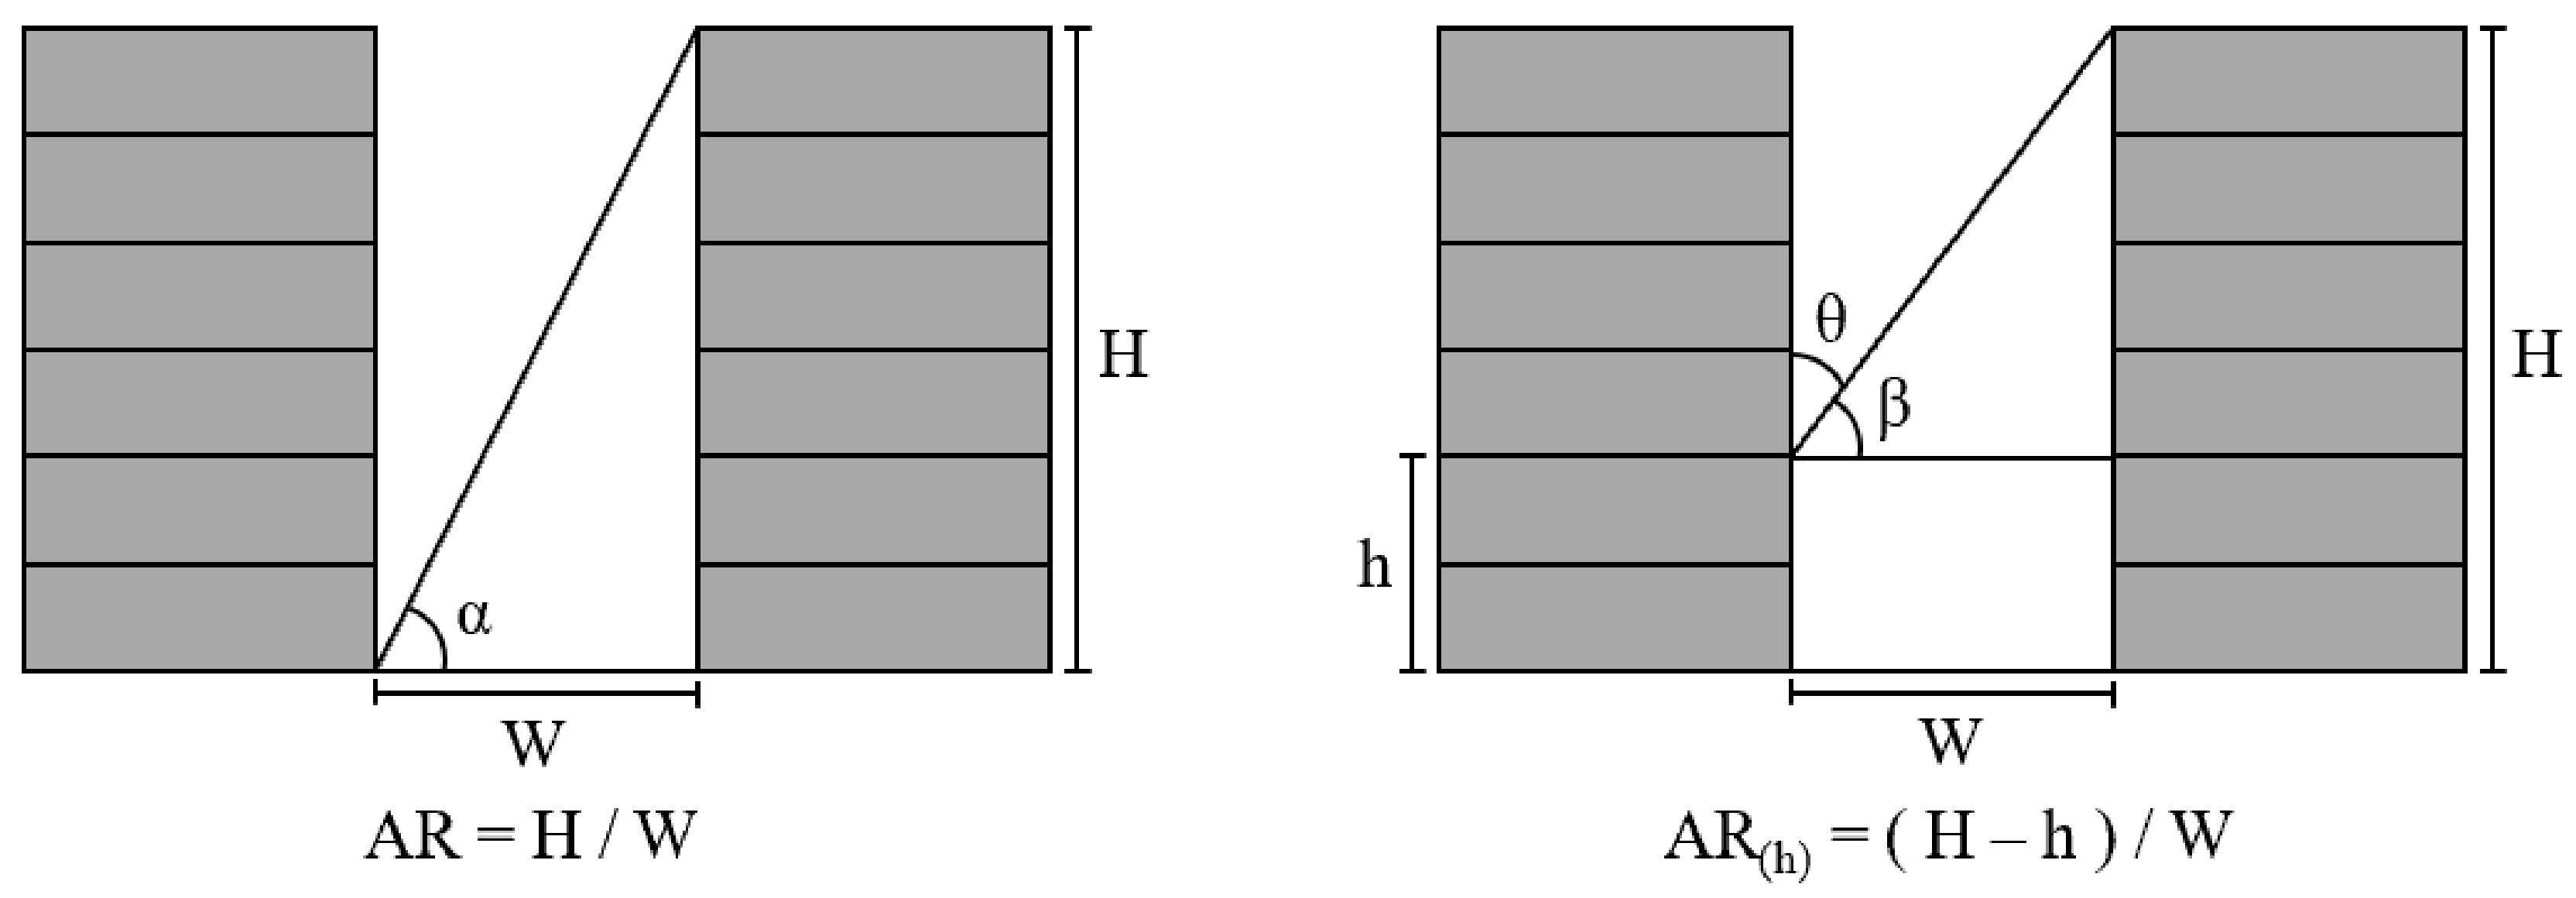
The equation to calculate AR is shown in Equation (1):
The equation to calculate the AR
(h) proposed in this study is shown in Equation (2):
In this context, the variable H represents the vertical dimension of the street canyon, while W represents the horizontal dimension of the street canyon. Additionally, the variable h denotes the vertical dimension of the bottom end of the PVSD panel from the ground, and it is measured in meters (m), as depicted in
Figure 3. The relationships between the magnitude of the β angle or θ angle and the amount of photovoltaic power generation and energy-saving efficiency are not directly proportional to the building height, as indicated by Equation (2). Specifically, when the value of h is equal to zero, the equation AR = AR
(h) signifies the presence of an inclusive relationship between the variables. AR
(h) exhibits superior applicability compared to AR and provides more effective guidance for the implementation and development of PVSDs.
3.3. PVSDs System and Energy Consumption Calculation Model
The objective of this study was to assess the viability of implementing PVSDs in various street canyons and ascertain the optimum height range for building facades that can be employed. These investigations have acknowledged the utilization of EnergyPlus for simulating the performance of PVSDs and buildings [
21,
22,
23,
24,
25]. Furthermore, the study conducted by Zhang et al. [
21] has confirmed the dependability of EnergyPlus simulation in assessing PVSD performance. Hence, within the context of a street canyon, the present study employed EnergyPlus software to develop a distinct model for room energy consumption [
42,
43,
44], as depicted in
Figure 2. The utilization of a room-scale model is more advantageous in accurately representing the variations in thermal conditions and natural illumination across different elevations inside the street canyon. In order to account for the similar orientations of the structures in the study region, this study utilized Rhino to measure the building orientation. The model’s orientation was adjusted to be 10 degrees south by west. PVSDs are positioned at the uppermost section of the office room front, exhibiting a slightly inclined angle of 30 degrees. In accordance with construction codes, the thermal parameters of the building were established.
Table 2 presents data pertaining to the offices, windows, and PV panels, together with the thermal parameters of the building. Additionally, the temperature setpoint and energy efficiency ratio of the split air-conditioner were determined based on the specific circumstances.
In order to investigate the influence of the outdoor environment on the energy efficiency of buildings, the thermal parameters of the external walls of a room located within the street canyon were established based on the guidelines provided in
Table 2. The remaining walls, including the internal partition walls, were designated as adiabatic boundaries [
45,
46]. According to the literature review of O’Brien et al. [
47], the timetable of building operation was established. To cater to the requirements of the initial advancement of shading photovoltaics and ensure the broad applicability of the study findings, the PV performance model was generated in EnergyPlus using the Simple model option. This study employed a linear control method [
48] to investigate the impact of shading on interior lighting. The simulation utilized natural lighting to effectively regulate indoor lighting. Furthermore, to concentrate on examining the impact of shading from neighboring buildings and PVSDs on the indoor thermal and light conditions, the model does not incorporate supplementary window shading techniques, such as drapes, etc.
In this study, the street canyon height (H) was measured at 24 m and 48 m in order to assess and validate the impact of street canyon height on the research findings. Furthermore, the augmented reality (AR) was manipulated within the range of 0 to 5 by manipulating the width of the street canyon (W), with a change step of 0.5. AR = 0 signifies the absence of shade from the adjacent building. The alteration of the h value was accomplished by simultaneously manipulating the height of the PVSDs and the simulated room, with a change step of 4 m. The energy modeling technique involved simulating and calculating the energy consumption and PV power generation of offices located at various heights in different street canyons using the orthogonal combination approach. The obtained calculations were compared to the baseline, which consisted of energy consumption results without PVSDs. Simultaneously, the AR values of various roadway canyons and the AR(h) values of PV panel locations were computed, which were subsequently utilized for statistical analysis.
The analysis indicates that the street canyon model 1 has better solar radiation and daylighting capabilities than model 2. Nevertheless, both models exhibit comparable fluctuations in PV efficiency and energy usage in buildings.
Appendix A and
Appendix B present the results. Furthermore, it can be observed that the height (H) of the street canyon does not exert a substantial influence on the variability of the performance of PVSDs and the energy consumption of buildings. Through the process of comparing the data provided in
Appendix B with the subsequent results stated, it is feasible to determine the performance. As an illustration example, the subsequent analysis and discussion employ model 2 of the 48 m high street canyon.
4. Results
This section initially examines and deliberates on the change regulation pertaining to the rate of energy conservation in buildings and the performance of solar power generation using the AR index. It also assesses the feasibility of implementing PVSDs in various street canyons and highlights the limitations of the AR index. Next, we evaluate and discuss the variation rules of energy consumption, PVSD power output, and energy-saving rate based on AR(h). These rules are then used to explore the conditions that are ideal for the development of PVSDs.
4.1. The Impact of Implementing PVSDs at Varying Heights in Street Canyons on the Building’s Energy-Saving Rate and PV Performance
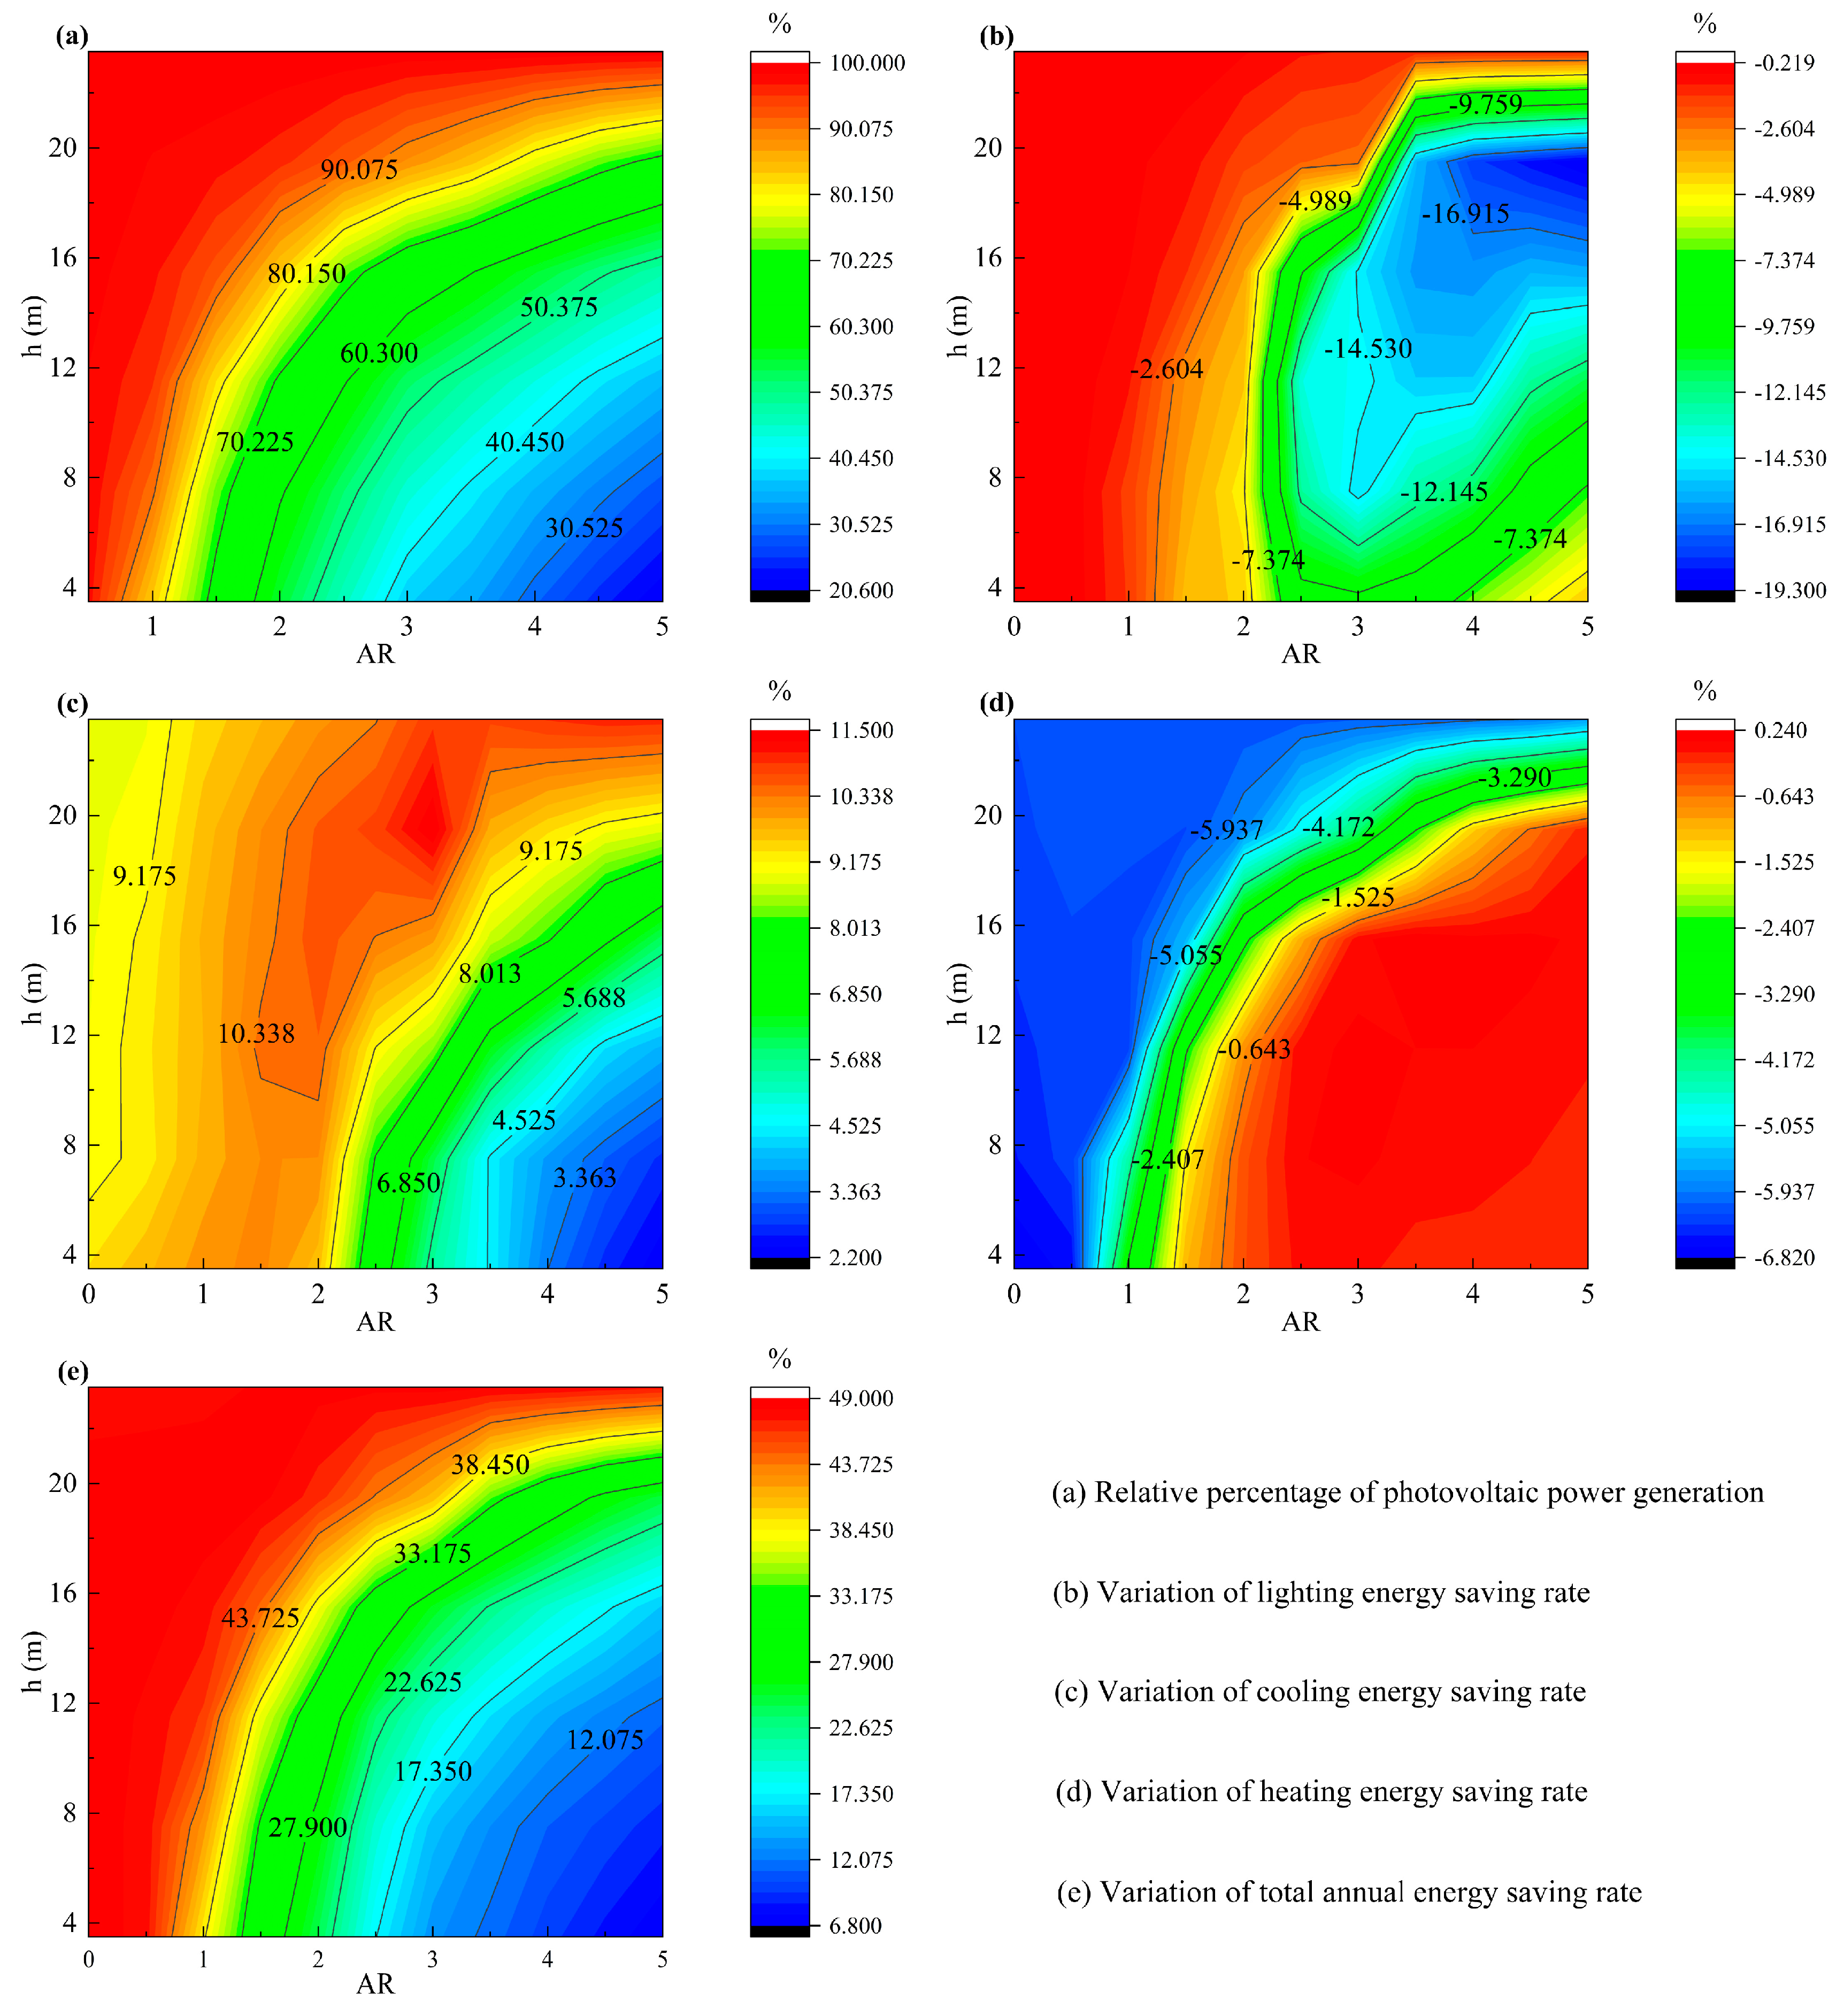
The AR has a substantial impact on the generation of PV power. PV power generation is most efficient at the uppermost part of the street canyon and least efficient at the lowermost part of the canyon.
Figure 4a illustrates the proportion of PV power generated in the street canyon compared to the situation where AR is zero. These findings indicate that a decrease in the AR value corresponds to an increase in the width of the street canyon, an improvement in solar radiation, and an expansion in the range of building facades that can be utilized. Nevertheless, as AR grows more prevalent, the shadowing effect caused by nearby buildings diminishes, resulting in a limited selection of building facades that may be used in street canyons. Specifically, within the limited street area, only the exterior of the building located toward the upper portion of the street canyon is appropriate for the construction and use of PVSDs. Nevertheless, it is not easily comprehensible to ascertain the appropriate area range for implementing PVSDs on the building front based on the provided figure.
According to the data presented in
Figure 4b, the implementation of PVSDs in street canyons results in a negative lighting energy-saving rate. This indicates that the use of PVSDs will lead to a substantial rise in lighting energy consumption. These findings indicate that the optimal natural lighting is found at the uppermost part of the street canyon, while the impact of PVSDs is minimal. Nevertheless, as AR becomes more prevalent, the level of illumination within the canyon gradually diminishes, leading to a substantial rise in lighting energy usage. In a small street canyon, an office located in the upper section has the most significant change in illumination and the highest rise in lighting energy consumption, as indicated by a bigger AR value. The reason for this phenomenon is that when the AR value increases, the street canyon becomes smaller, resulting in reduced illumination within the canyon. Consequently, the implementation of PVSDs has a comparatively minor effect on the illumination within the canyon. In contrast, the natural lighting in the upper section of the street canyon is superior, and the internal lighting will undergo a significant transformation with the implementation of PVSDs.
Figure 4c demonstrates that the implementation of PVSDs in street canyons leads to a substantial enhancement in the rate of cooling energy conservation. Furthermore, the cooling energy-saving rate increases as one moves closer to the top of the canyon. The elevated solar radiation intensity in the upper section of the street canyon during the summer season leads to a rise in the inside temperature of the building and subsequently an increase in the demand for cooling energy. By implementing PVSDs, PV panels may effectively mitigate excessive solar radiation entering the room, leading to a significant energy conservation impact. Nevertheless, as the prevalence of AR grows, the street canyon experiences a gradual reduction in width, resulting in a diminishing energy-saving impact of implementing PVSDs as one moves from the upper to the lower sections of the canyon. The reason for this phenomenon is that within the confines of the tight canyon, the magnitude and quantity of solar radiation diminish, resulting in few alterations to the indoor temperature subsequent to the implementation of photovoltaic solar panels. Specifically, when the AR is minimal, the cooling energy conservation rate at the upper and lower sections of the street canyon is nearly the same due to the minimal shade impact of the surrounding buildings.
As depicted in
Figure 4d, the heating energy-saving rate of the building at the upper section of the street canyon exhibits a negative value subsequent to the implementation of PVSDs. This observation suggests a comparatively higher level of heating energy consumption. The reason for this is that during winter, solar radiation promotes a rise in interior temperature, whereas PVSDs decrease the likelihood of sunlight entering the room. The solar radiation at the highest point of the street canyon is the most significant, resulting in the greatest relative rise in heating energy demand following the implementation of PVSDs at that location. Furthermore, as the AR increases, the impact of PVSDs on heating energy consumption diminishes progressively as one moves from the upper to the lower regions of the canyon. Specifically, the positive rate of energy savings in heating becomes noticeable once the PVSDs are placed at the bottom of the canyon with an AR value greater than 1.5. This occurs because of the rise in temperature of the PVSDs during power generation, resulting in a modest alteration of the surrounding outside thermal conditions. This aligns with the findings of Pham et al. [
49].
Given the fluctuation in building energy usage and the power generation capacity of PVSDs, it is possible to create and implement PVSDs in street canyons, resulting in a substantial annual energy savings, as depicted in
Figure 4e. These findings indicate that the upper section of the street canyon exhibits the most suitability for the development and implementation of PVSDs, while being minimally influenced by the AR. Nevertheless, as the AR becomes more prevalent, the annual energy conservation impact within the street canyon diminishes progressively from the uppermost to the lowermost section. Consequently, the available space for development and utilization of PVSDs on the building facade diminishes.
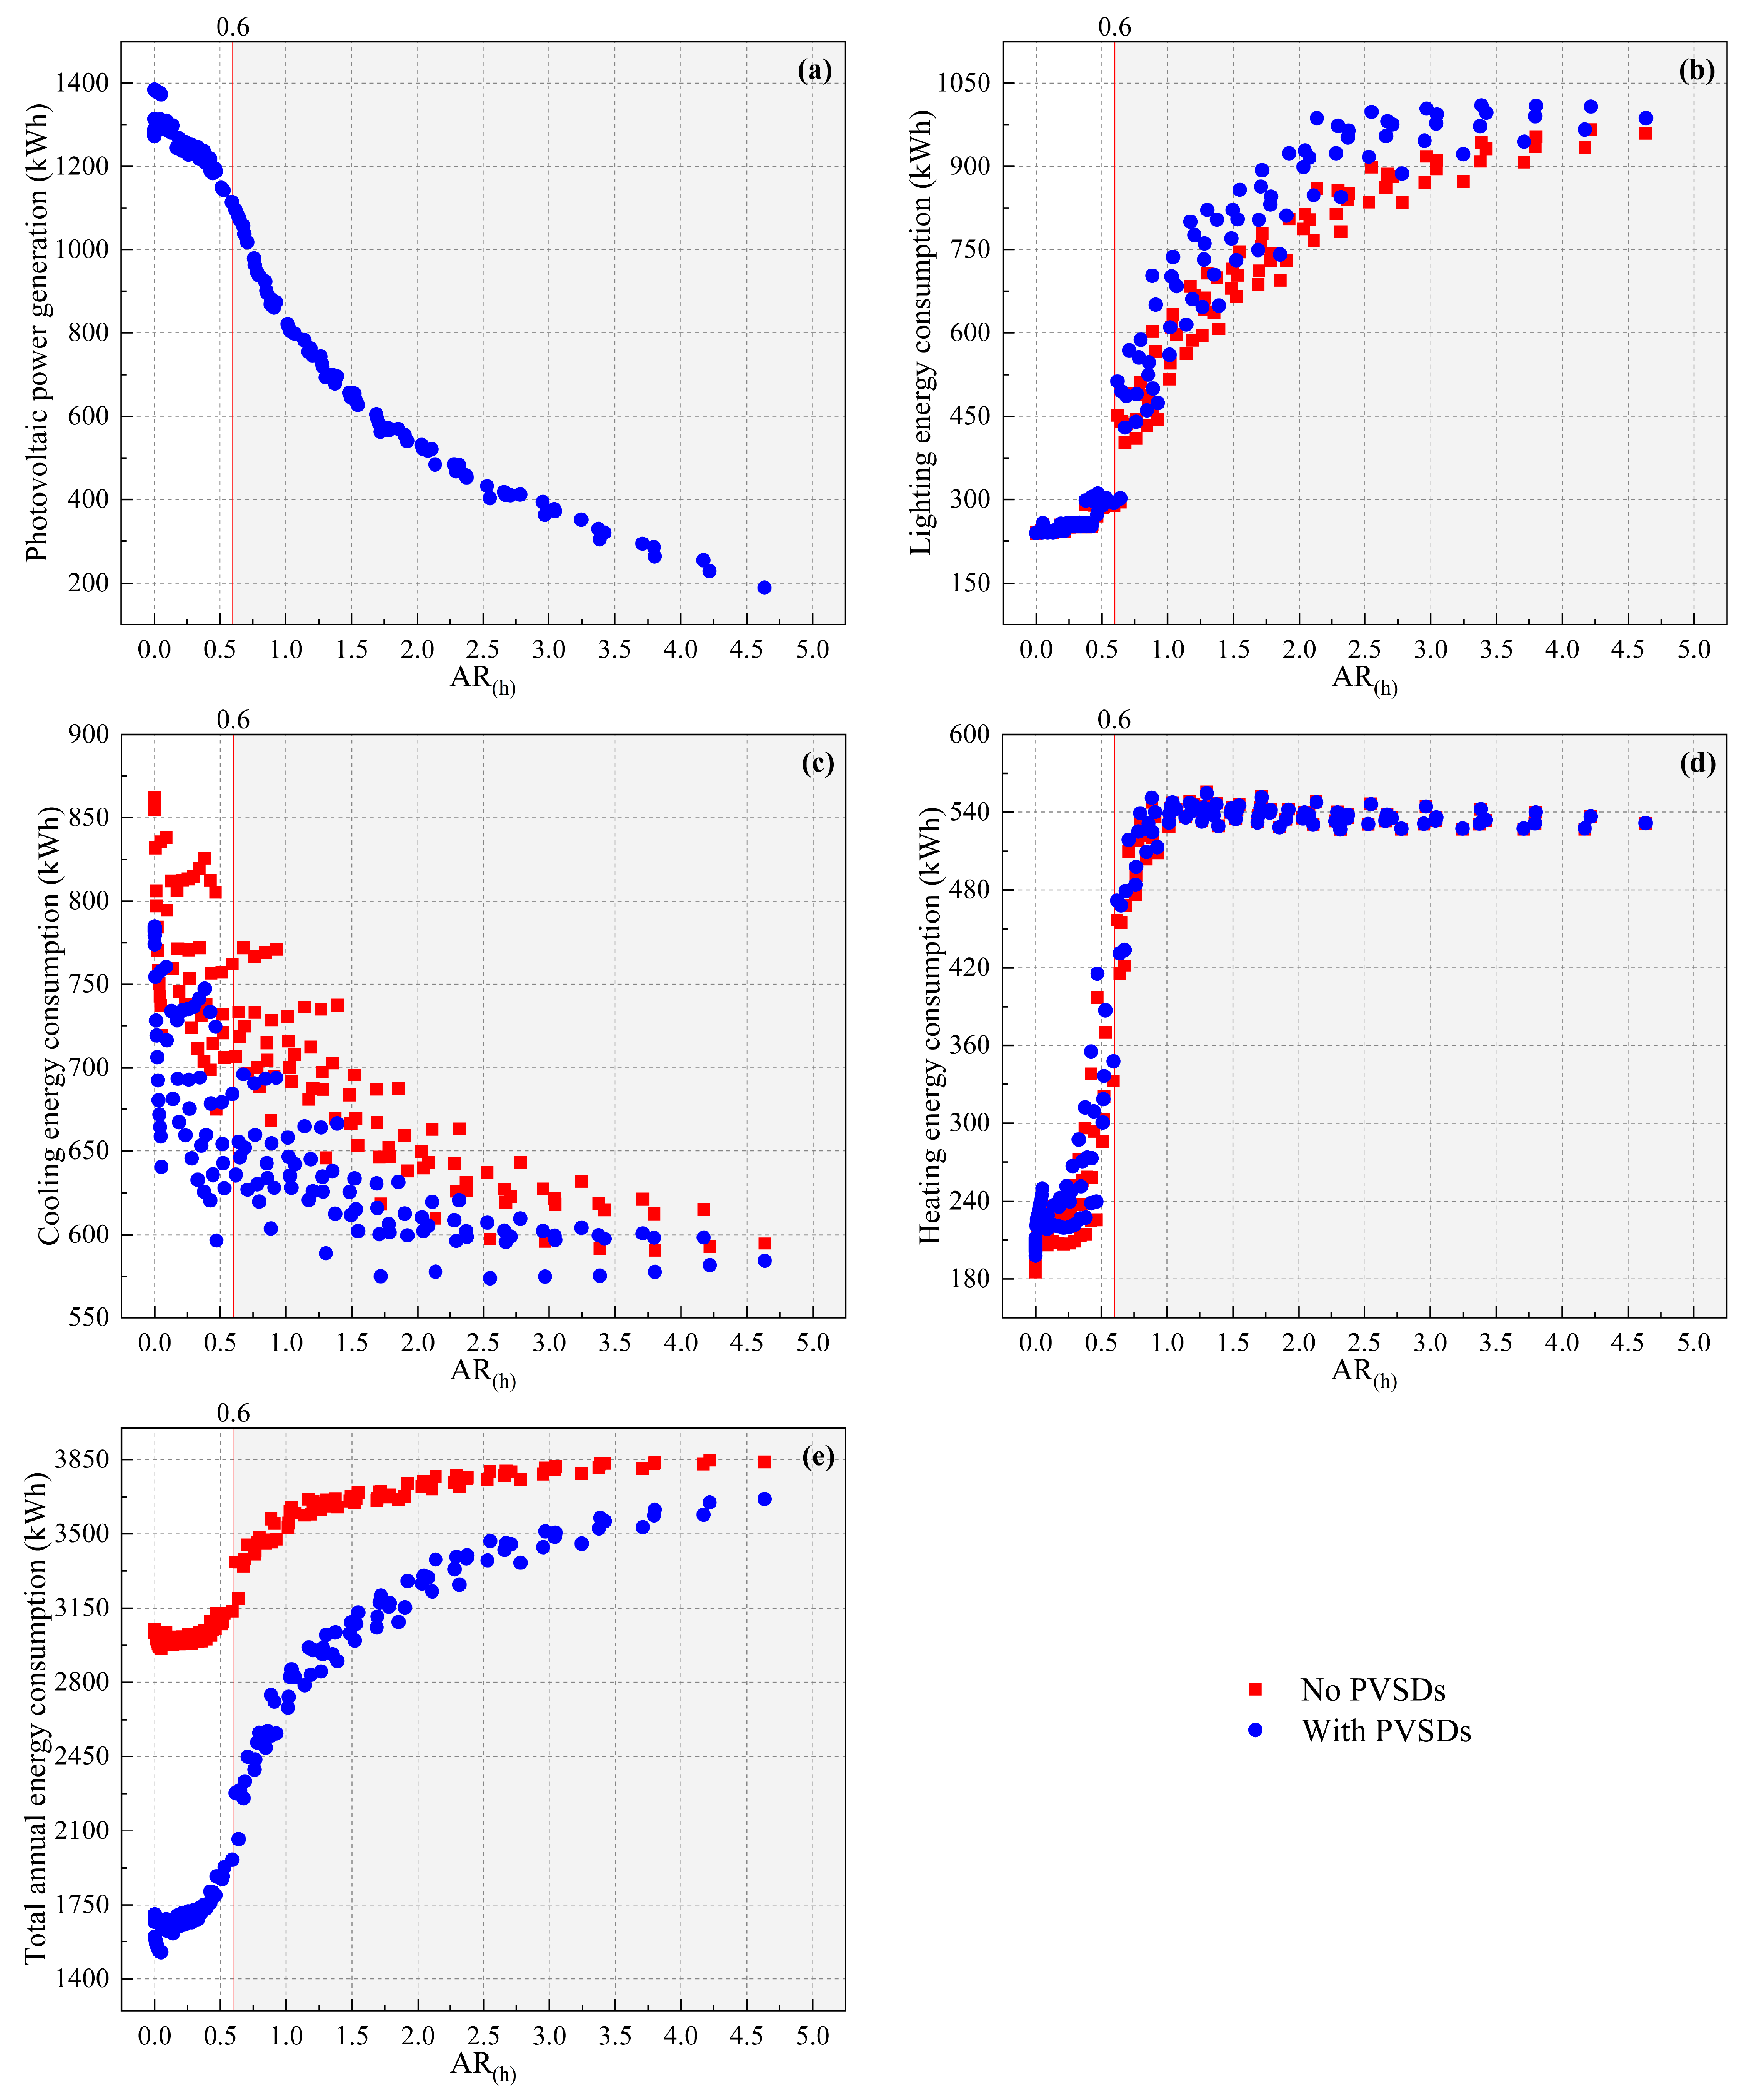
4.2. The Impact of AR(h) on the Fluctuation of PV Power Generation and Commercial Energy Consumption
In contrast to AR, AR
(h) provides a more understandable representation of the variations in power generation from PVSDs and building energy consumption. It allows for the consideration of factors such as the impact of neighboring buildings on PV power generation, as well as the influence of shading effects from nearby buildings and PVSDs on building energy consumption.
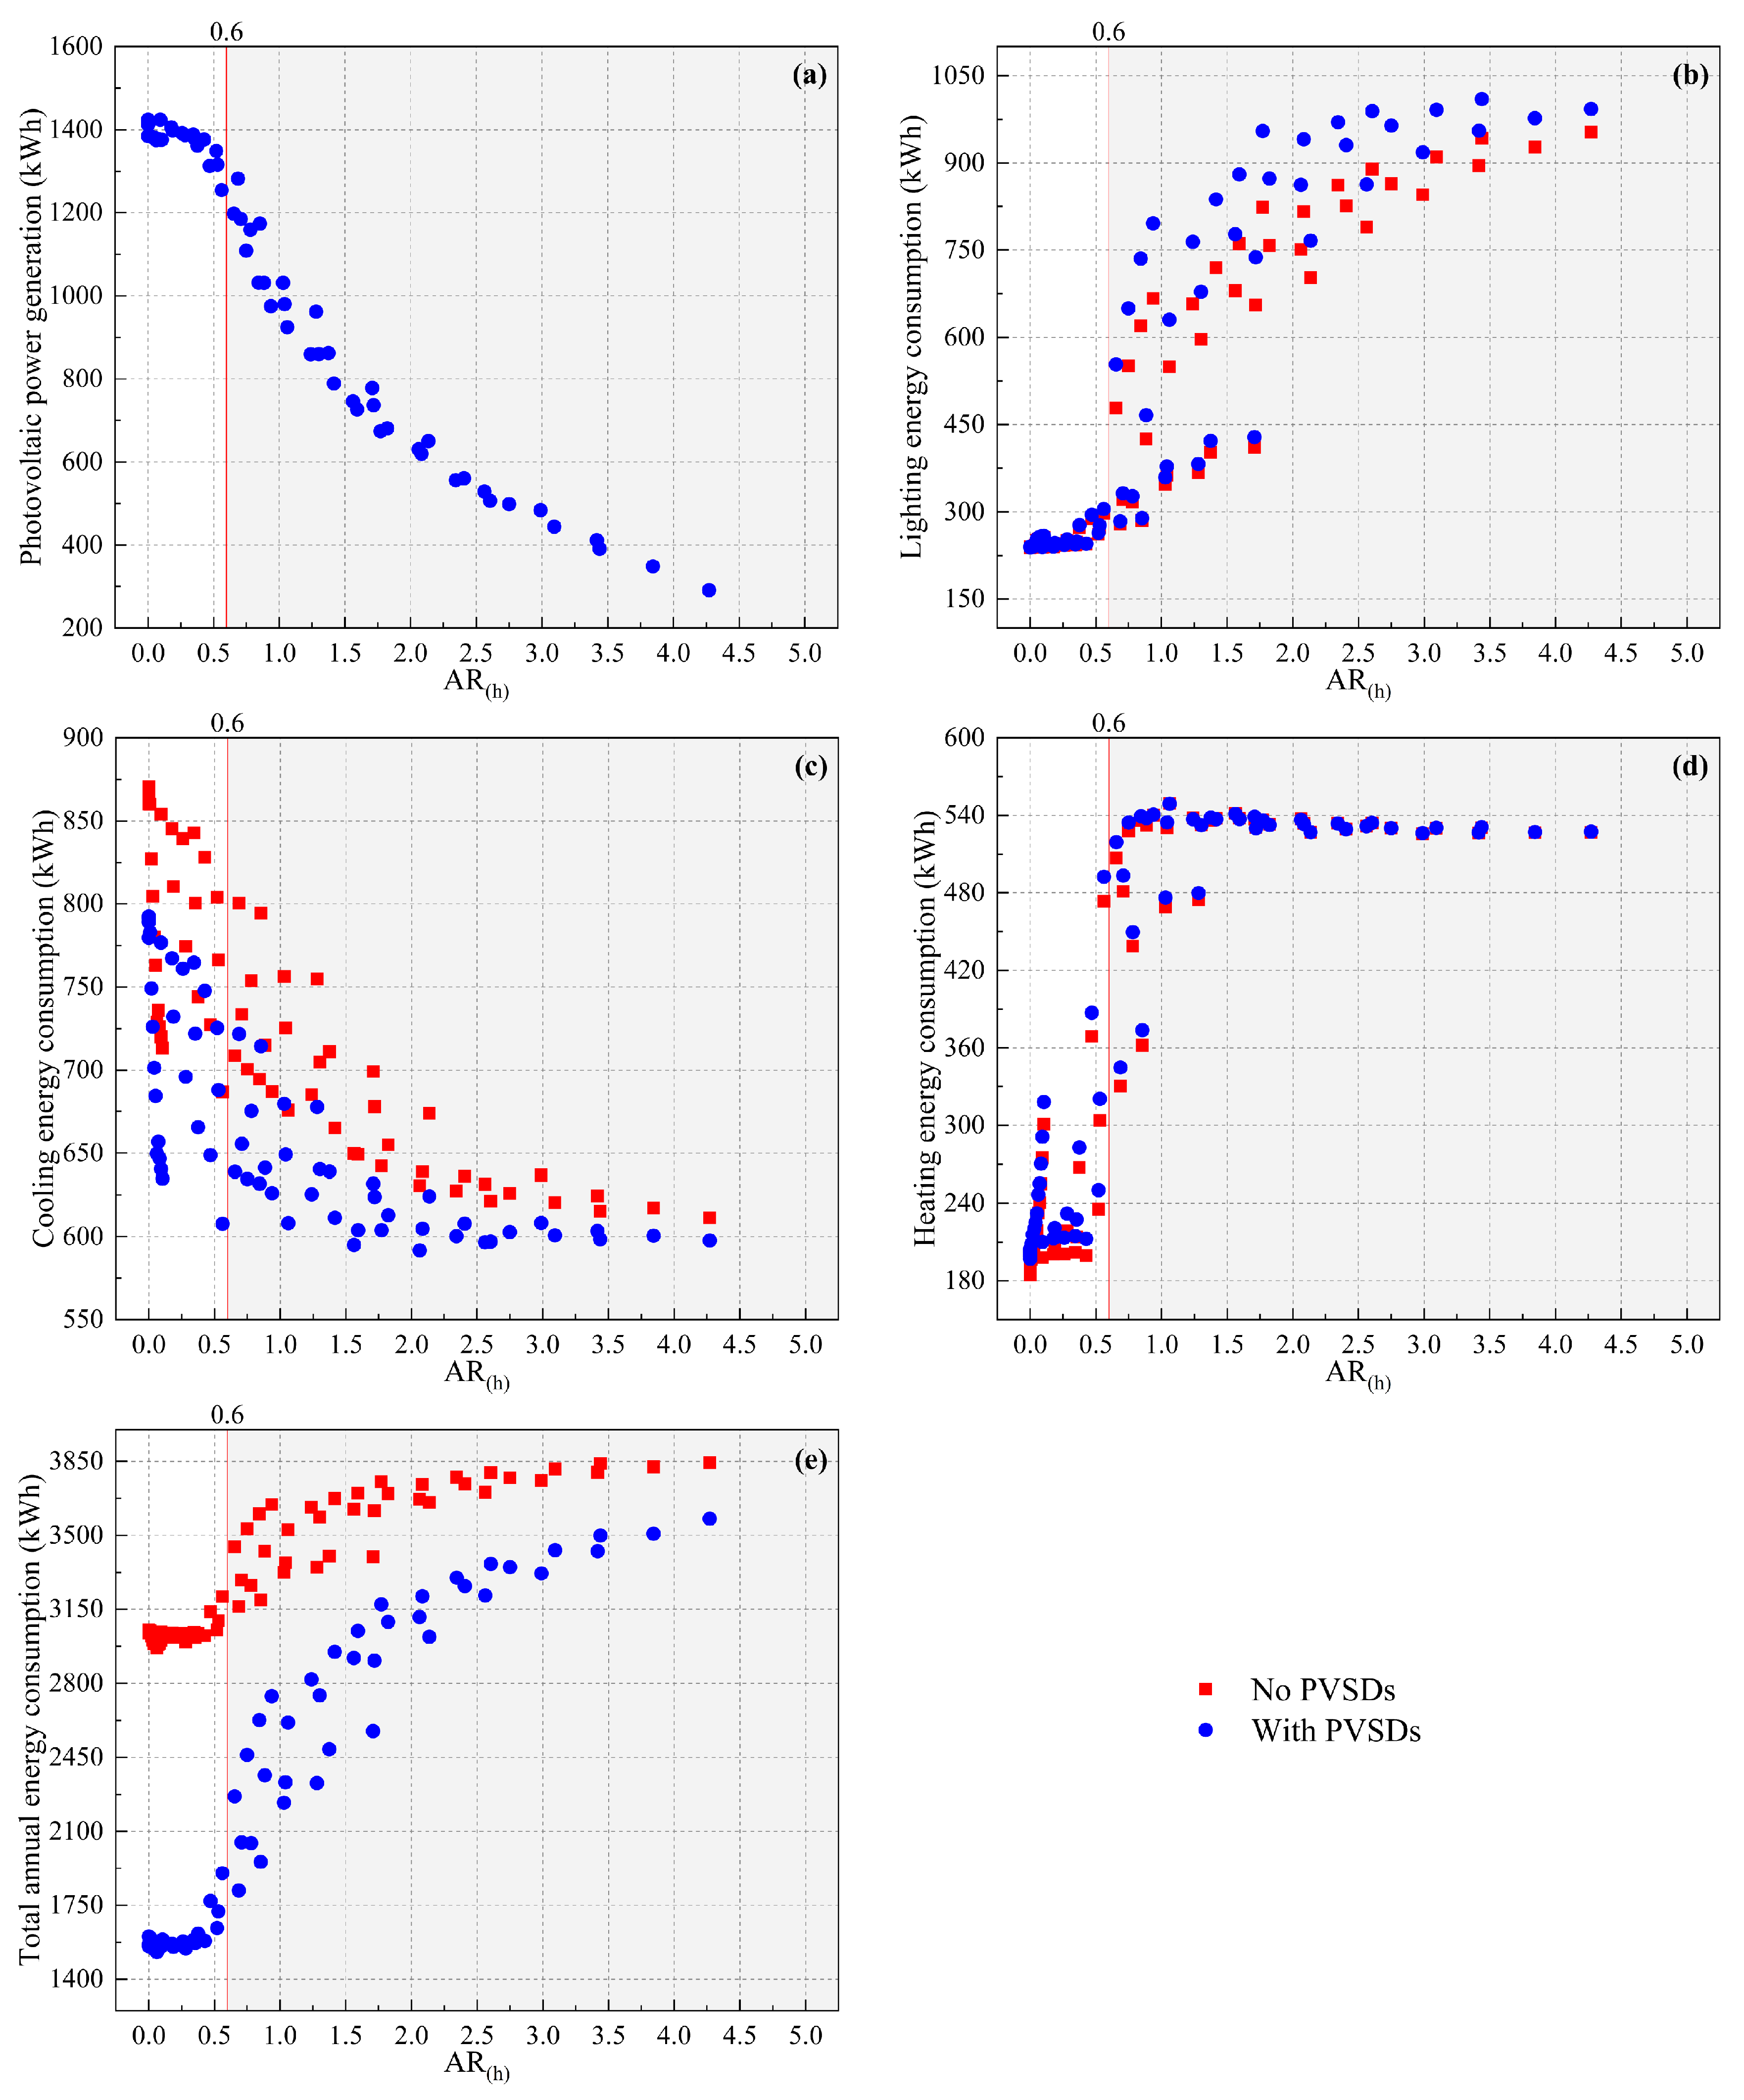
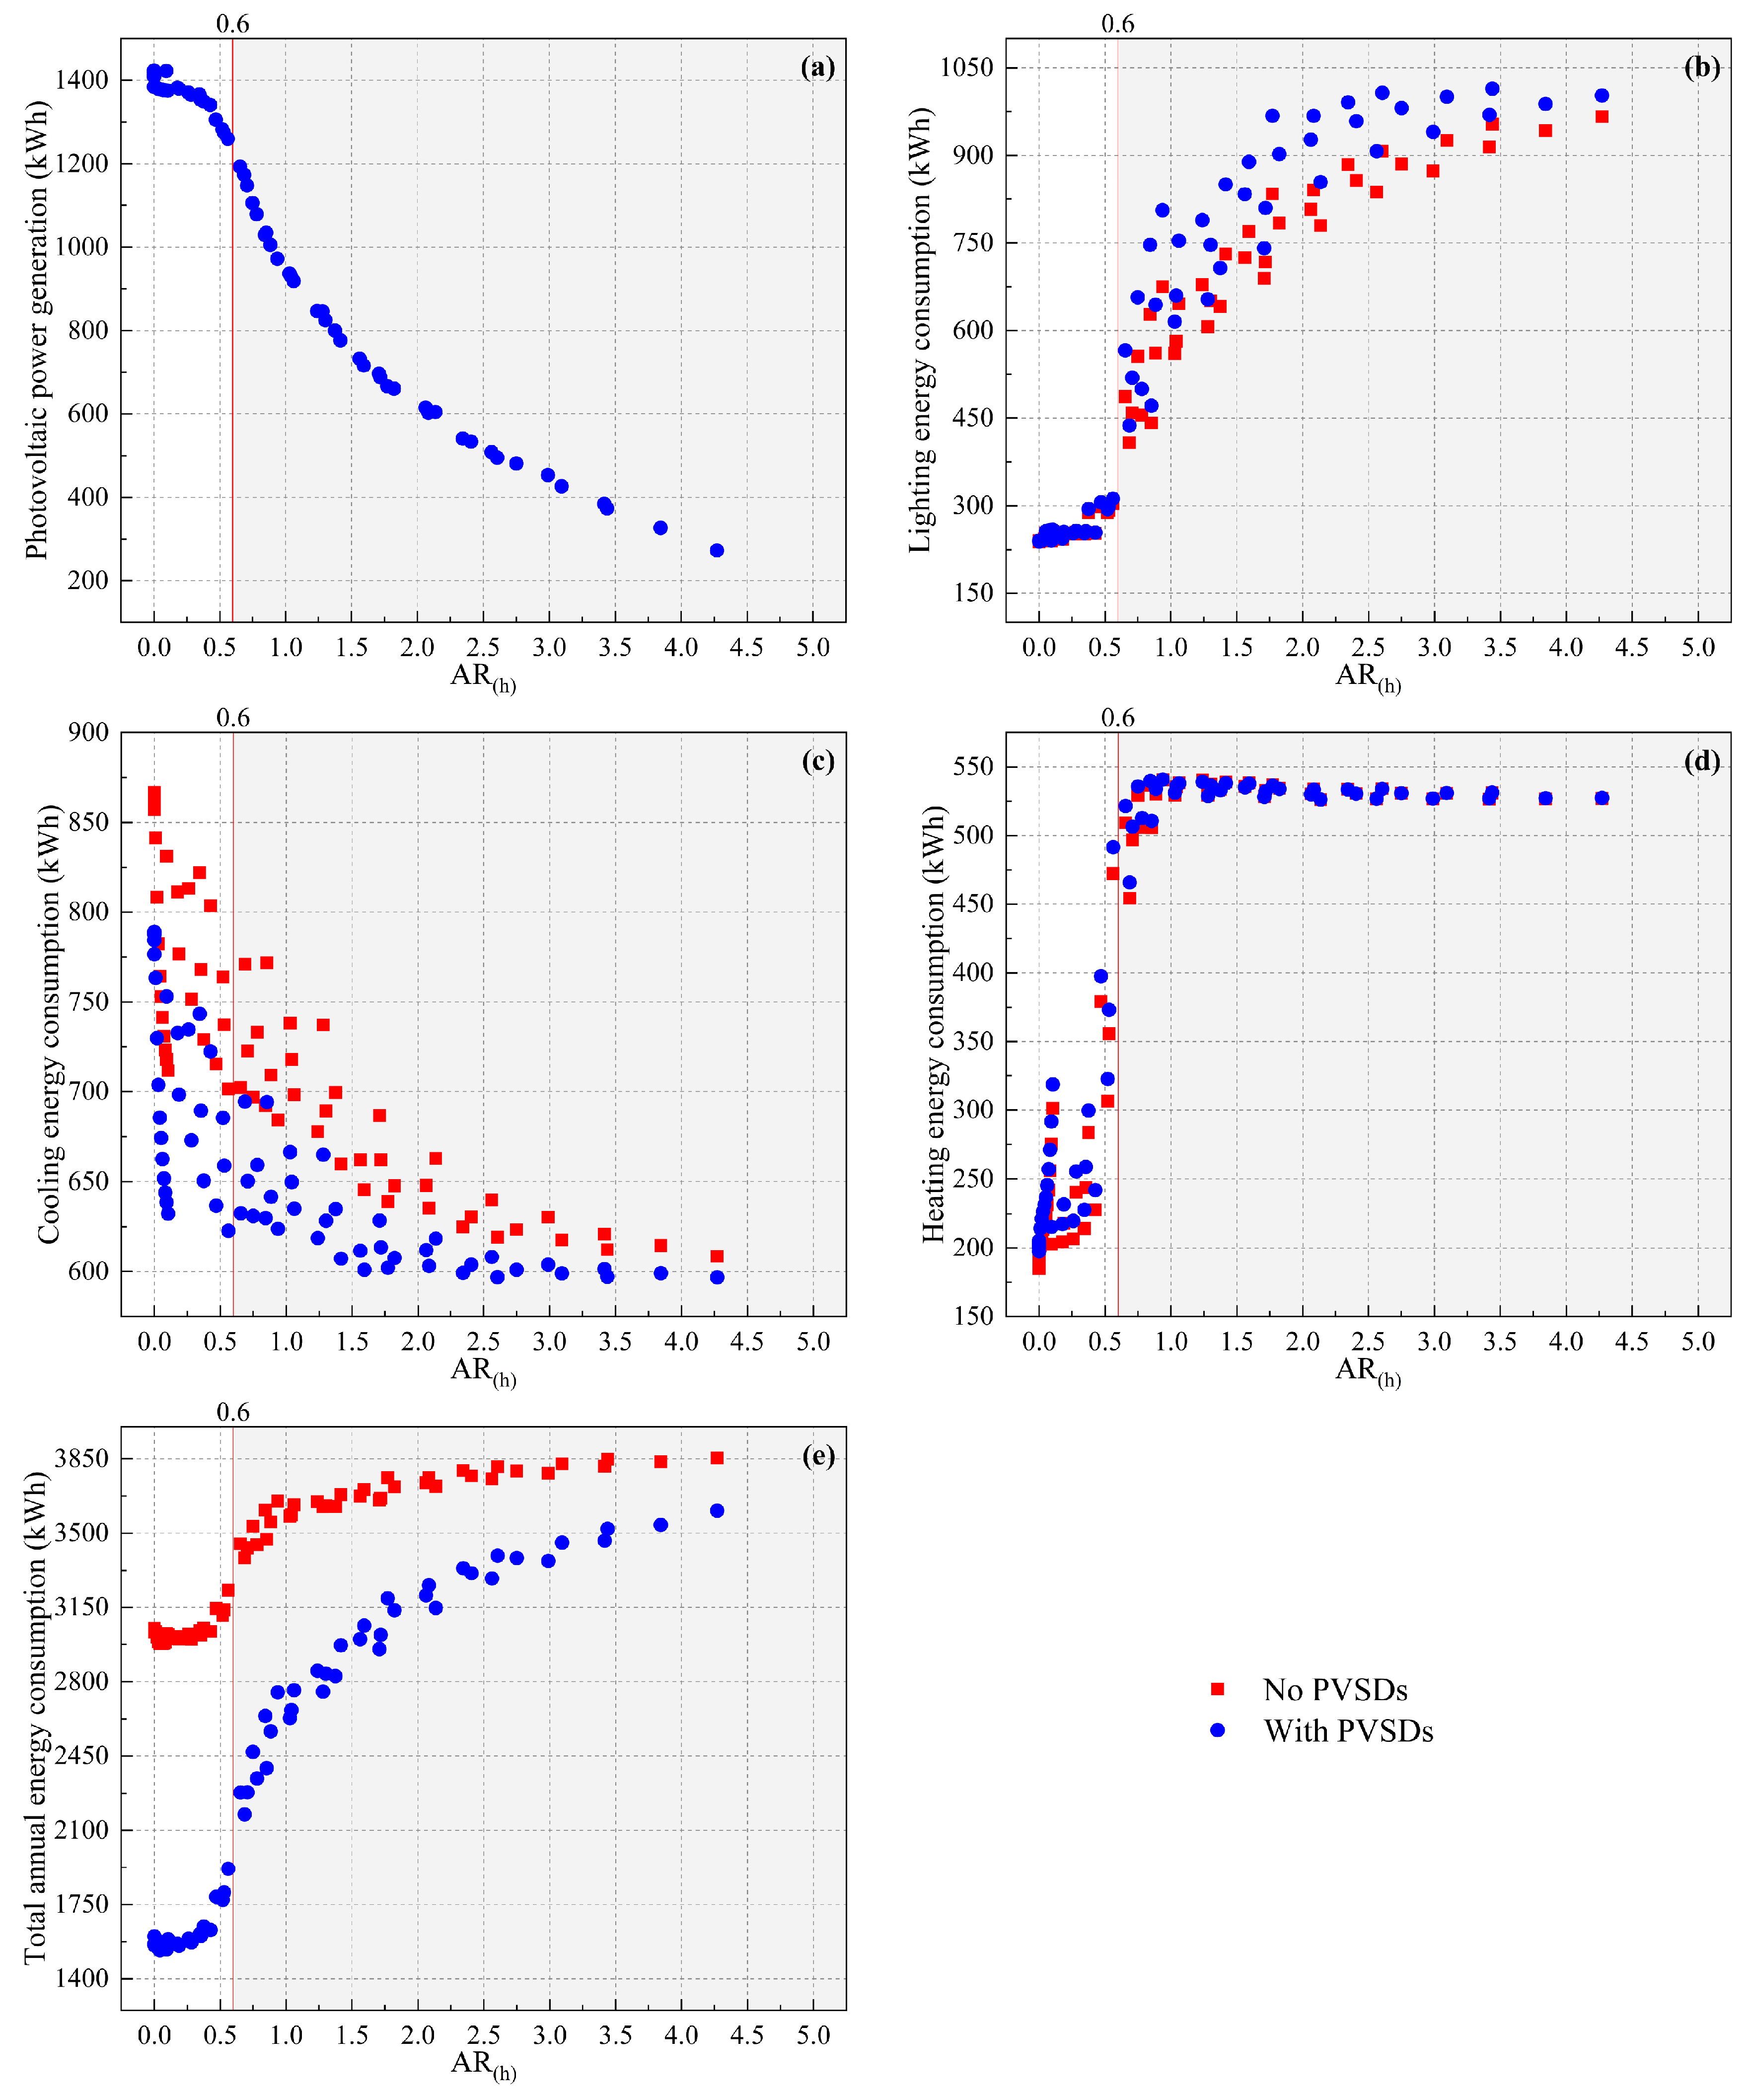
Figure 5a demonstrates that the power generation of PVSDs diminishes as AR
(h) increases, suggesting a reduction in the available space above the PVSDs and a significant fall in the total annual solar radiation received by the PV panel. This study revealed that in model 1, which has a height of 48 m, the power generation of PVSDs remains consistent across all heights of the building facade in different street canyons, assuming that the AR
(h) remains constant. This observation suggests that the θ angles of the two entities are almost the same, as depicted in
Figure 3. Additionally, their total annual solar radiation exhibits a similarity. The primary rationale for proposing the AR
(h) in this work is based on this discovery.
The energy consumption of buildings in the street canyon is influenced by the shadowing caused by surrounding buildings and PVSDs.
Figure 5b demonstrates that PVSDs have a substantial impact on the energy consumption of rooms. As AR
(h) grows, the lighting energy consumption steadily rises, initially increasing and then gradually decreasing. These findings indicate that when AR
(h) is less than 0.6, the lighting energy consumption is minimal. Additionally, the addition of PVSDs results in the smallest increase in lighting energy consumption. This suggests that nearby buildings have minimal impact on indoor illumination, and the indoor natural lighting conditions are superior. However, when AR
(h) exceeds 0.6, there is a dramatic increase in lighting energy consumption. This leads to the emergence of a gap in the figure, indicating that the surrounding buildings start to have a substantial influence on the illuminance within the room.
Regarding the energy consumption of the air-conditioner, as depicted in
Figure 5c, the cooling energy consumption diminishes as the AR
(h) increases. Furthermore, in cases when AR
(h) is less than 0.6, the PVSDs exhibit a substantial decrease in cooling energy usage. Nevertheless, as the AR
(h) decreases to 0.6, the shading impact of the PVSDs steadily diminishes. During the winter season, as depicted in
Figure 5d, there is an initial rise in heating energy consumption followed by a minor drop as the AR
(h) increases. The primary reason for this is the obstruction of solar radiation by nearby buildings, which leads to a gradual rise in heating energy consumption until it reaches its peak. Additionally, as the space within the street canyon becomes narrower, the dissipation of heat within the canyon slows down. Consequently, the heating energy consumption of the room gradually decreases, aligning with the findings of Mortezazadeh et al. [
50]. When AR
(h) is less than 0.6, the implementation of PVSDs will result in an increase in heating energy consumption. This is mostly due to the fact that PVSDs decrease the likelihood of sunlight entering the room. However, once AR
(h) exceeds 0.6, the impact of PVSDs on heating energy usage diminishes steadily and eventually becomes negligible.
When examining the influence of adjacent structures and PVSDs, as depicted in
Figure 5e, it is observed that when the AR
(h) value grows, there is a steady rise in the annual total energy consumption of buildings, followed by a subsequent drop. Specifically, when the value of AR
(h) is less than 0.6, the overall yearly energy consumption of the building is quite low. However, when the AR
(h) value exceeds 0.6, there is a large rise in the total yearly building energy consumption. Additionally, a gap is observed in the figure, indicating that surrounding structures start to have a substantial impact on both the building energy consumption and PV performance. The overall yearly energy usage of offices that meet the conditions of AR
(h) < 0.6 remains the lowest even after the implementation of PVSDs. As the value of AR
(h) increases, there is a gradual decrease in energy savings. One primary factor contributing to this phenomenon is the progressive decline in PV electricity generation. Conversely, shading has negative consequences, leading to higher energy usage for lighting and heating.
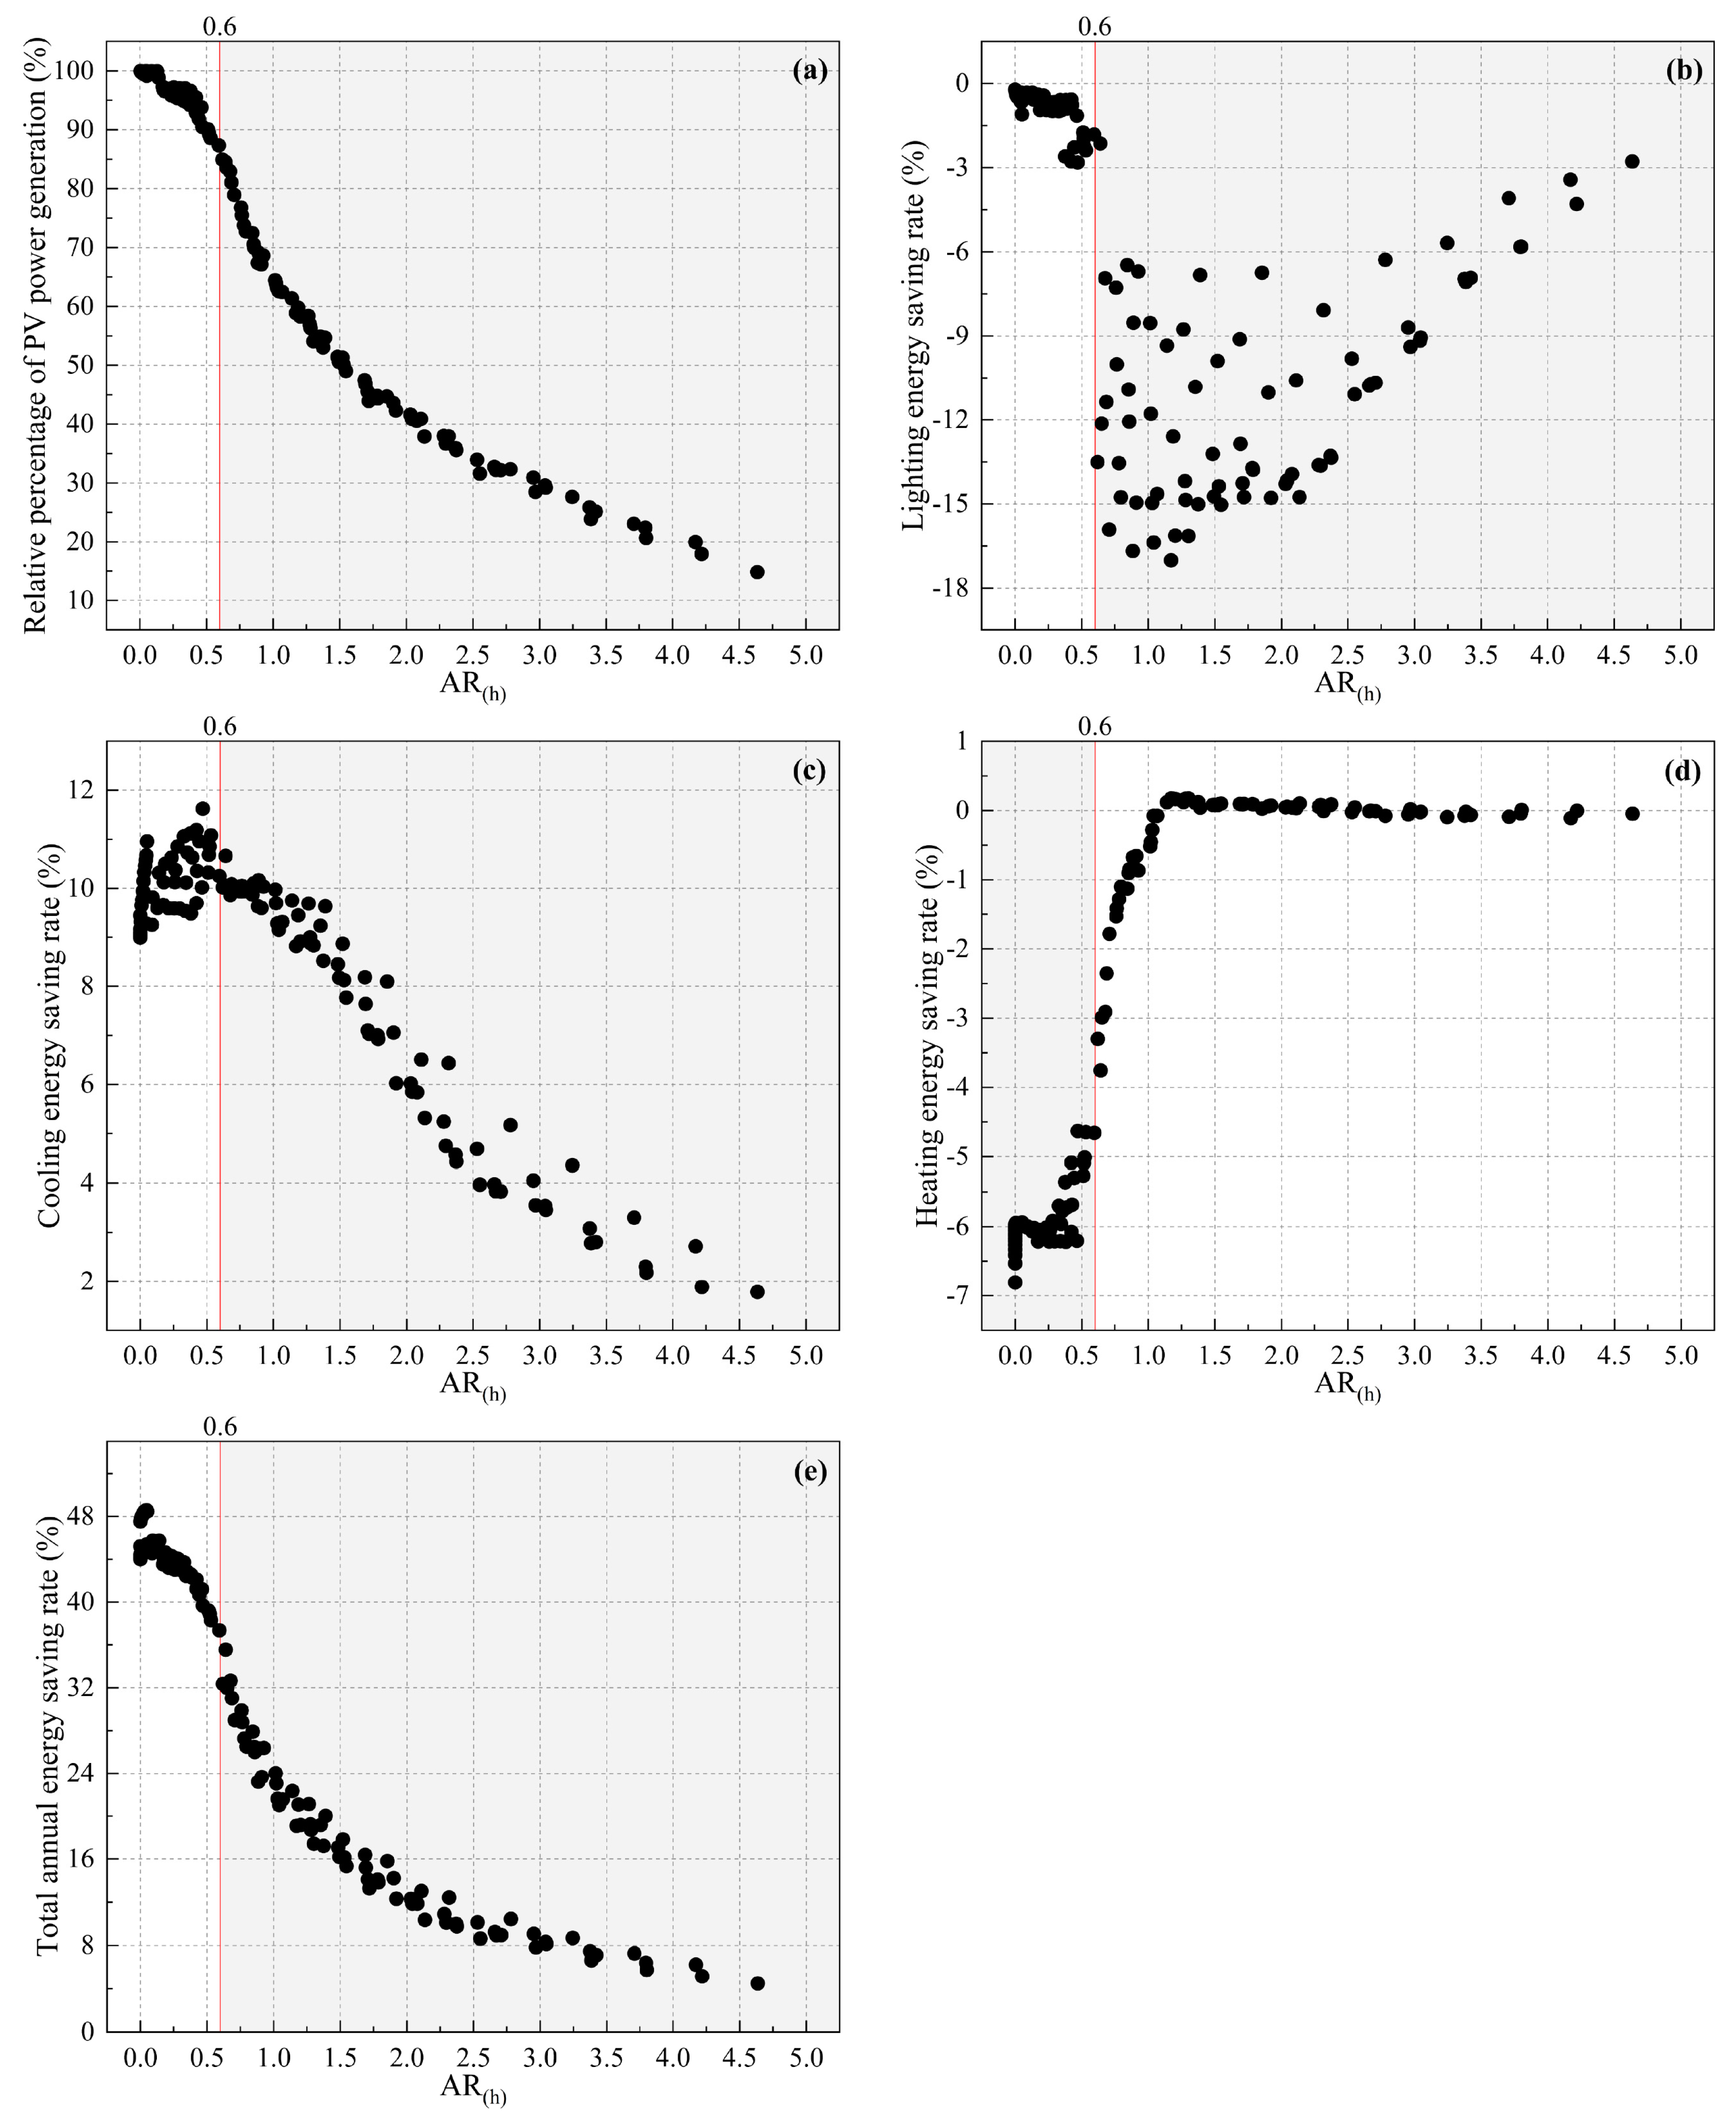
4.3. The Relationship between the Efficiency of PV Power Generation and the Pace of Energy Savings in Buildings
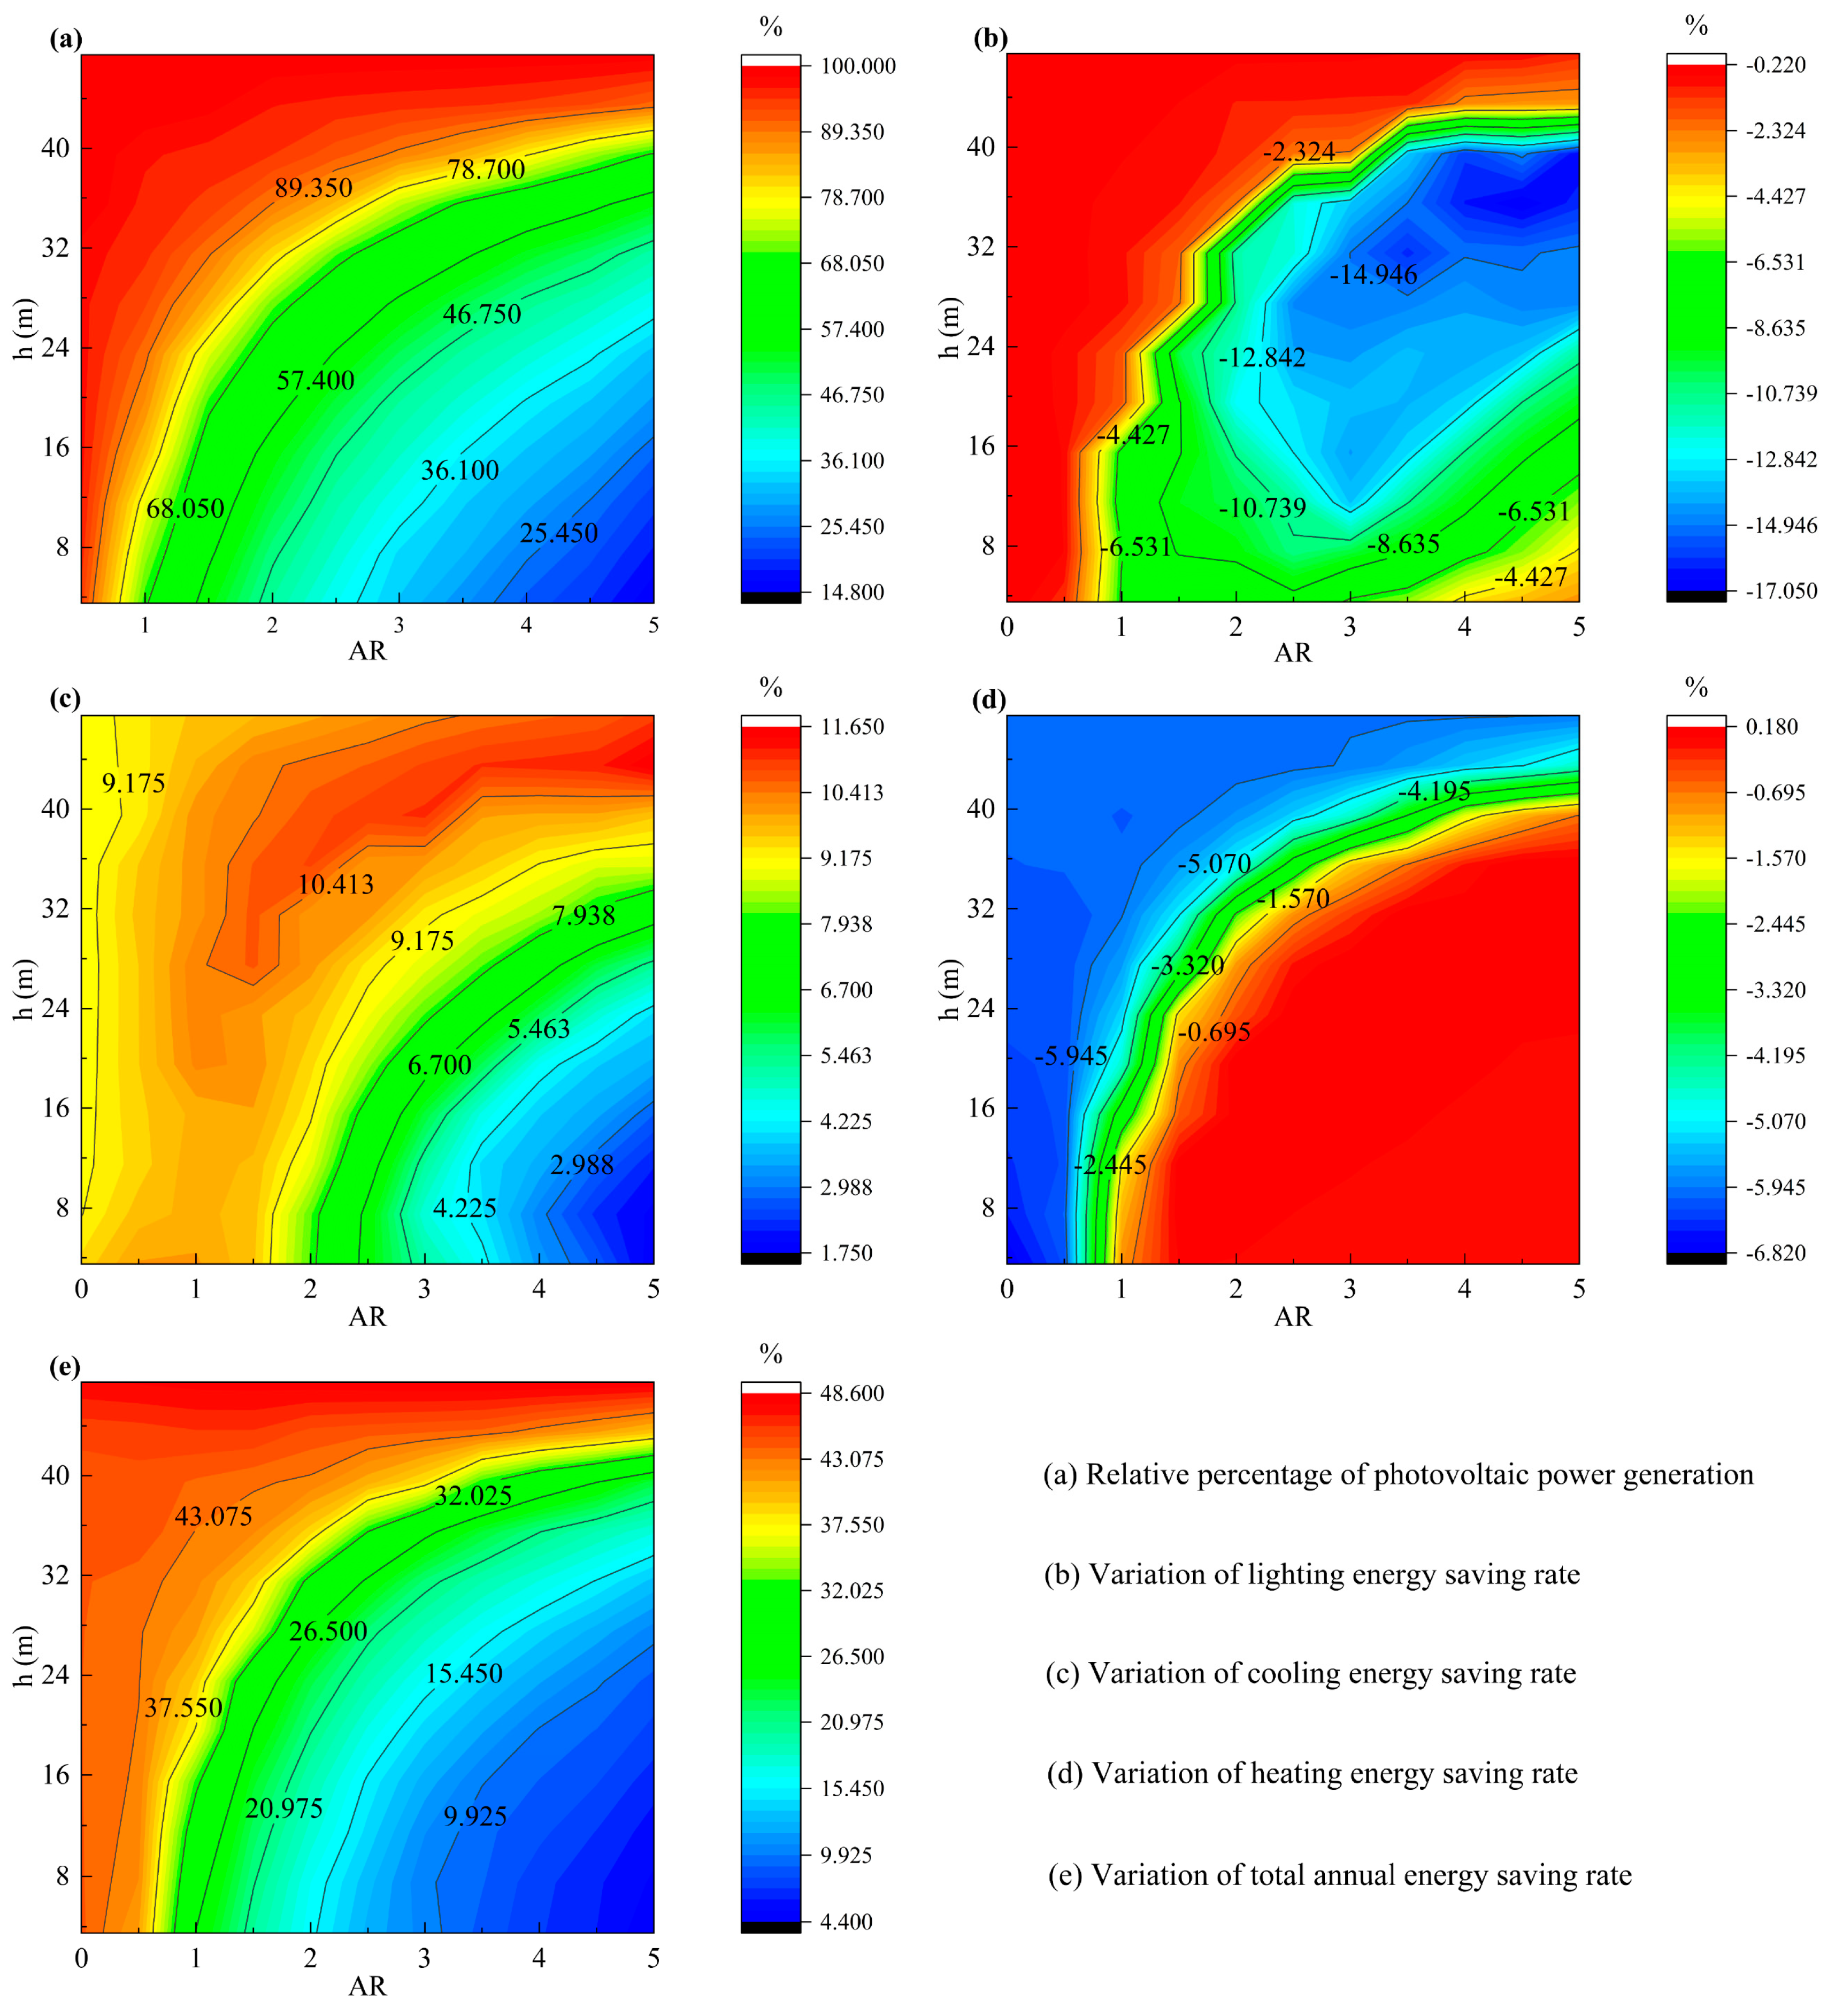
In
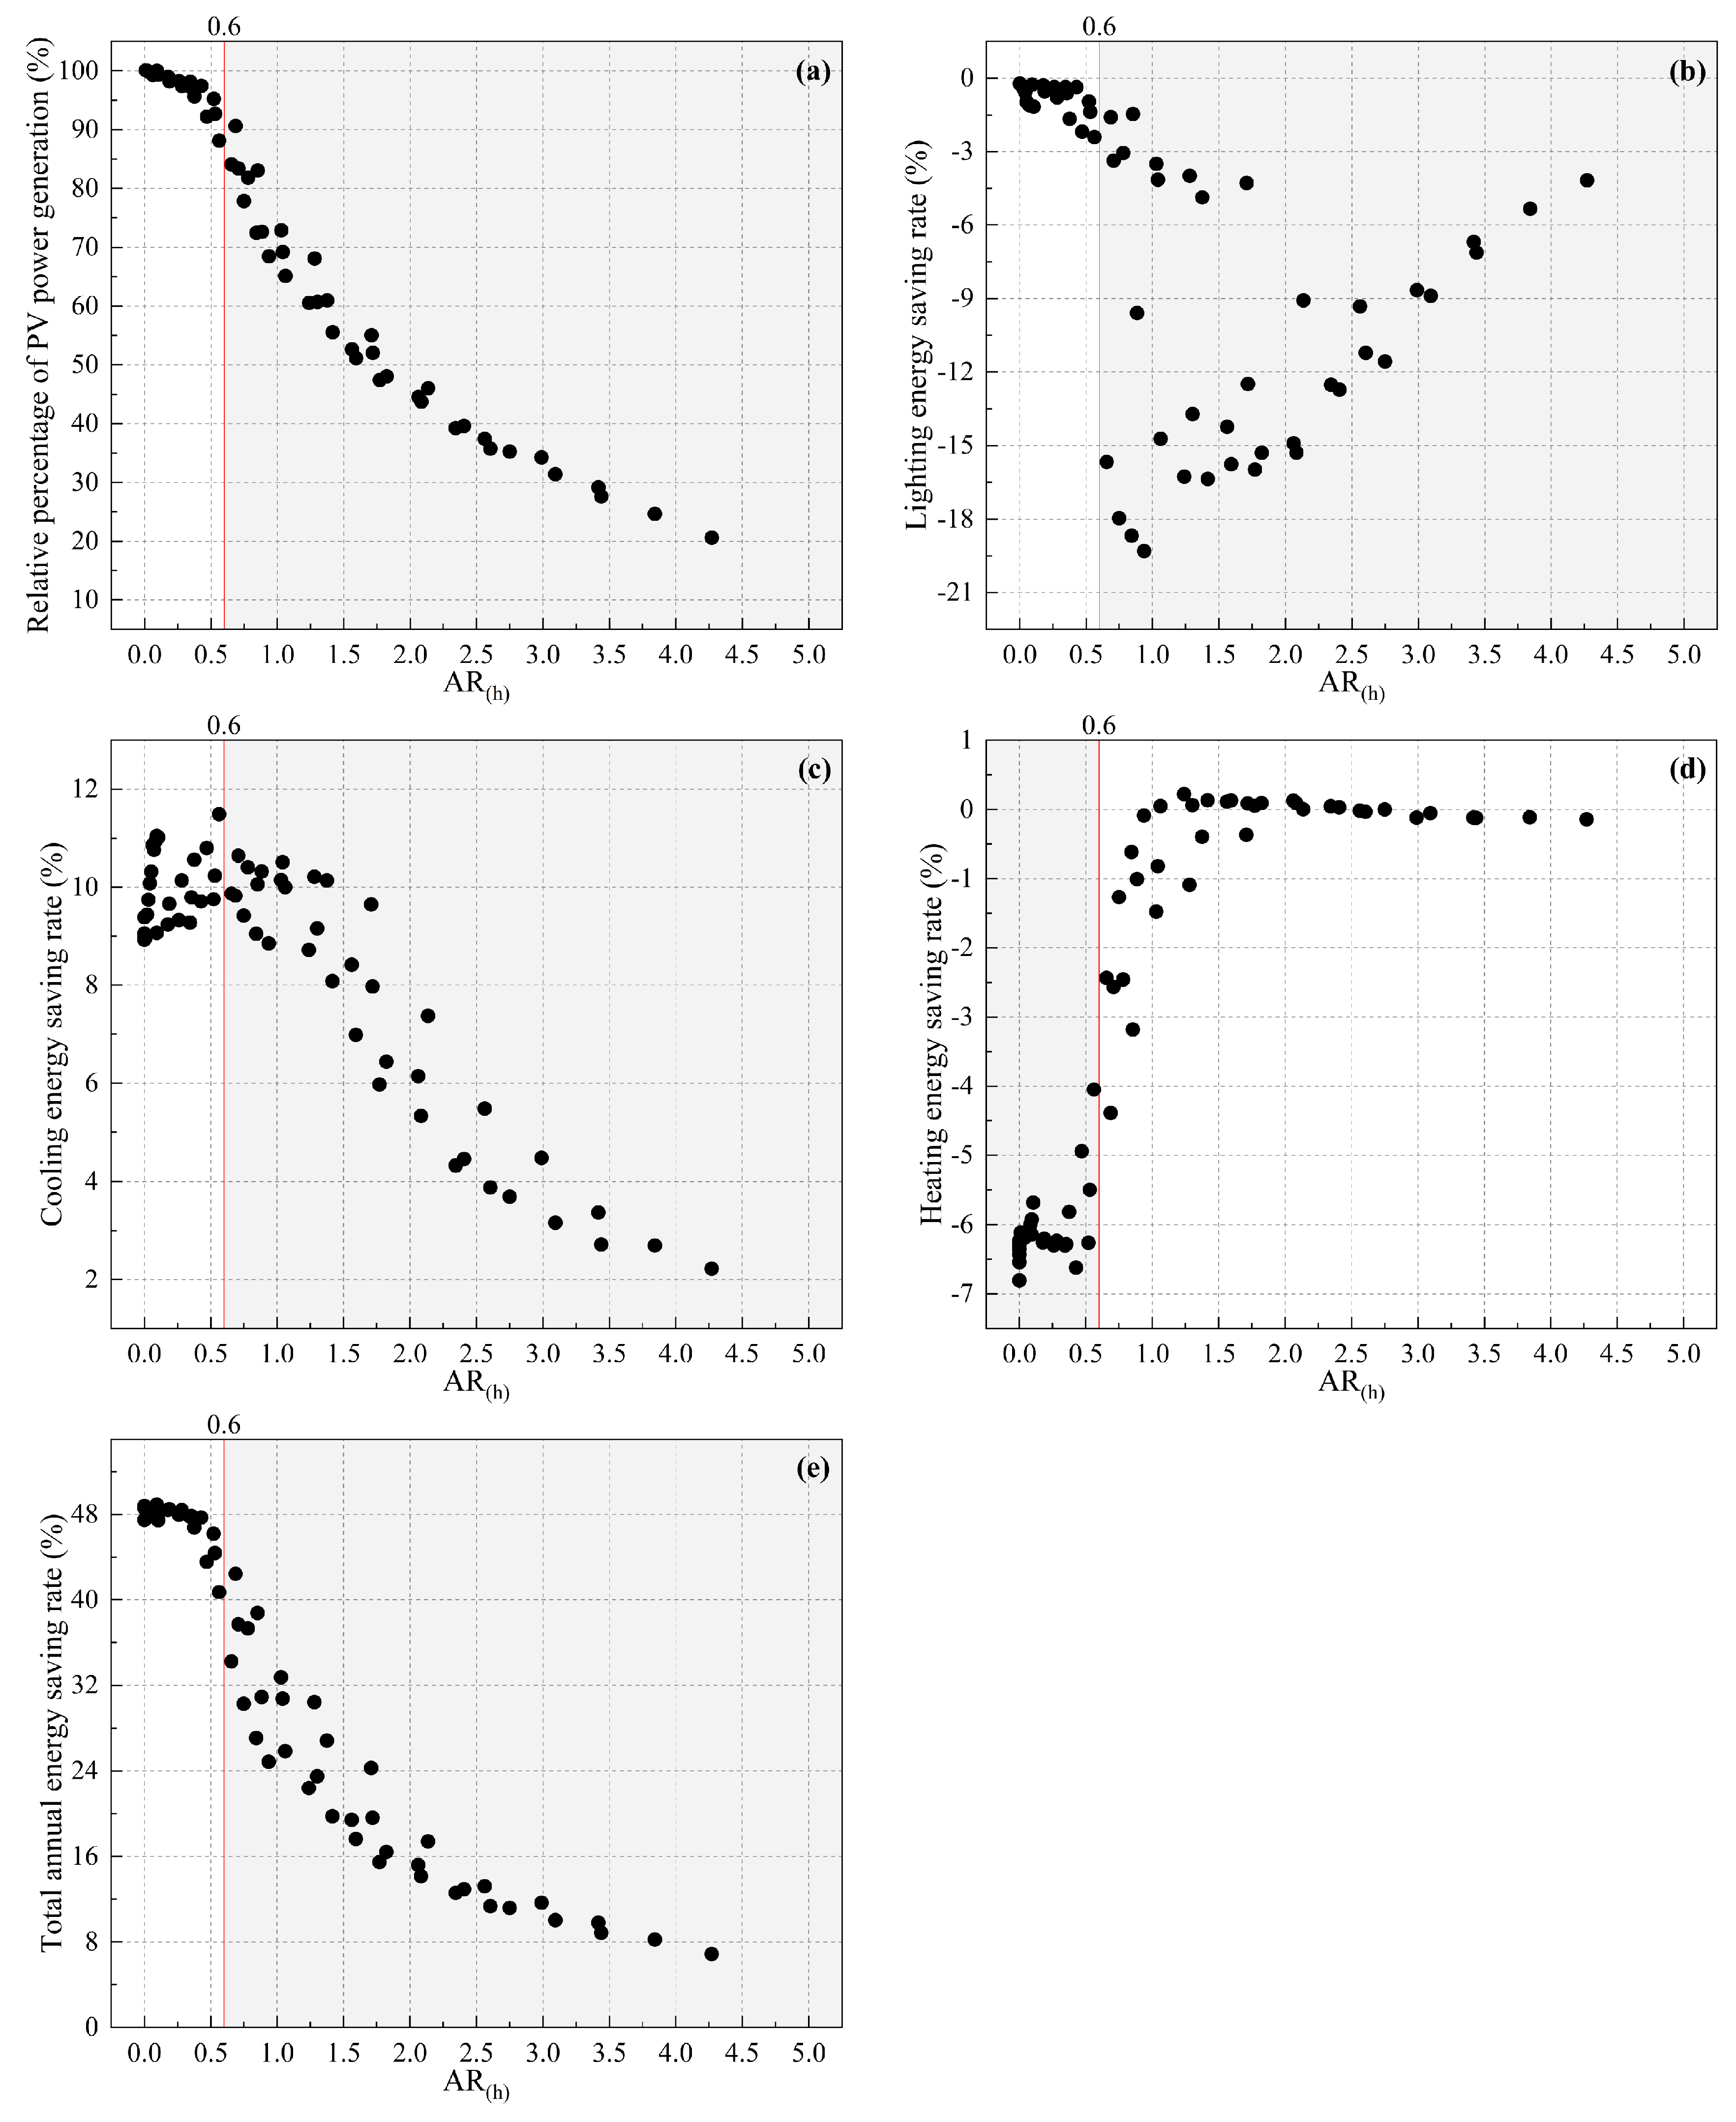
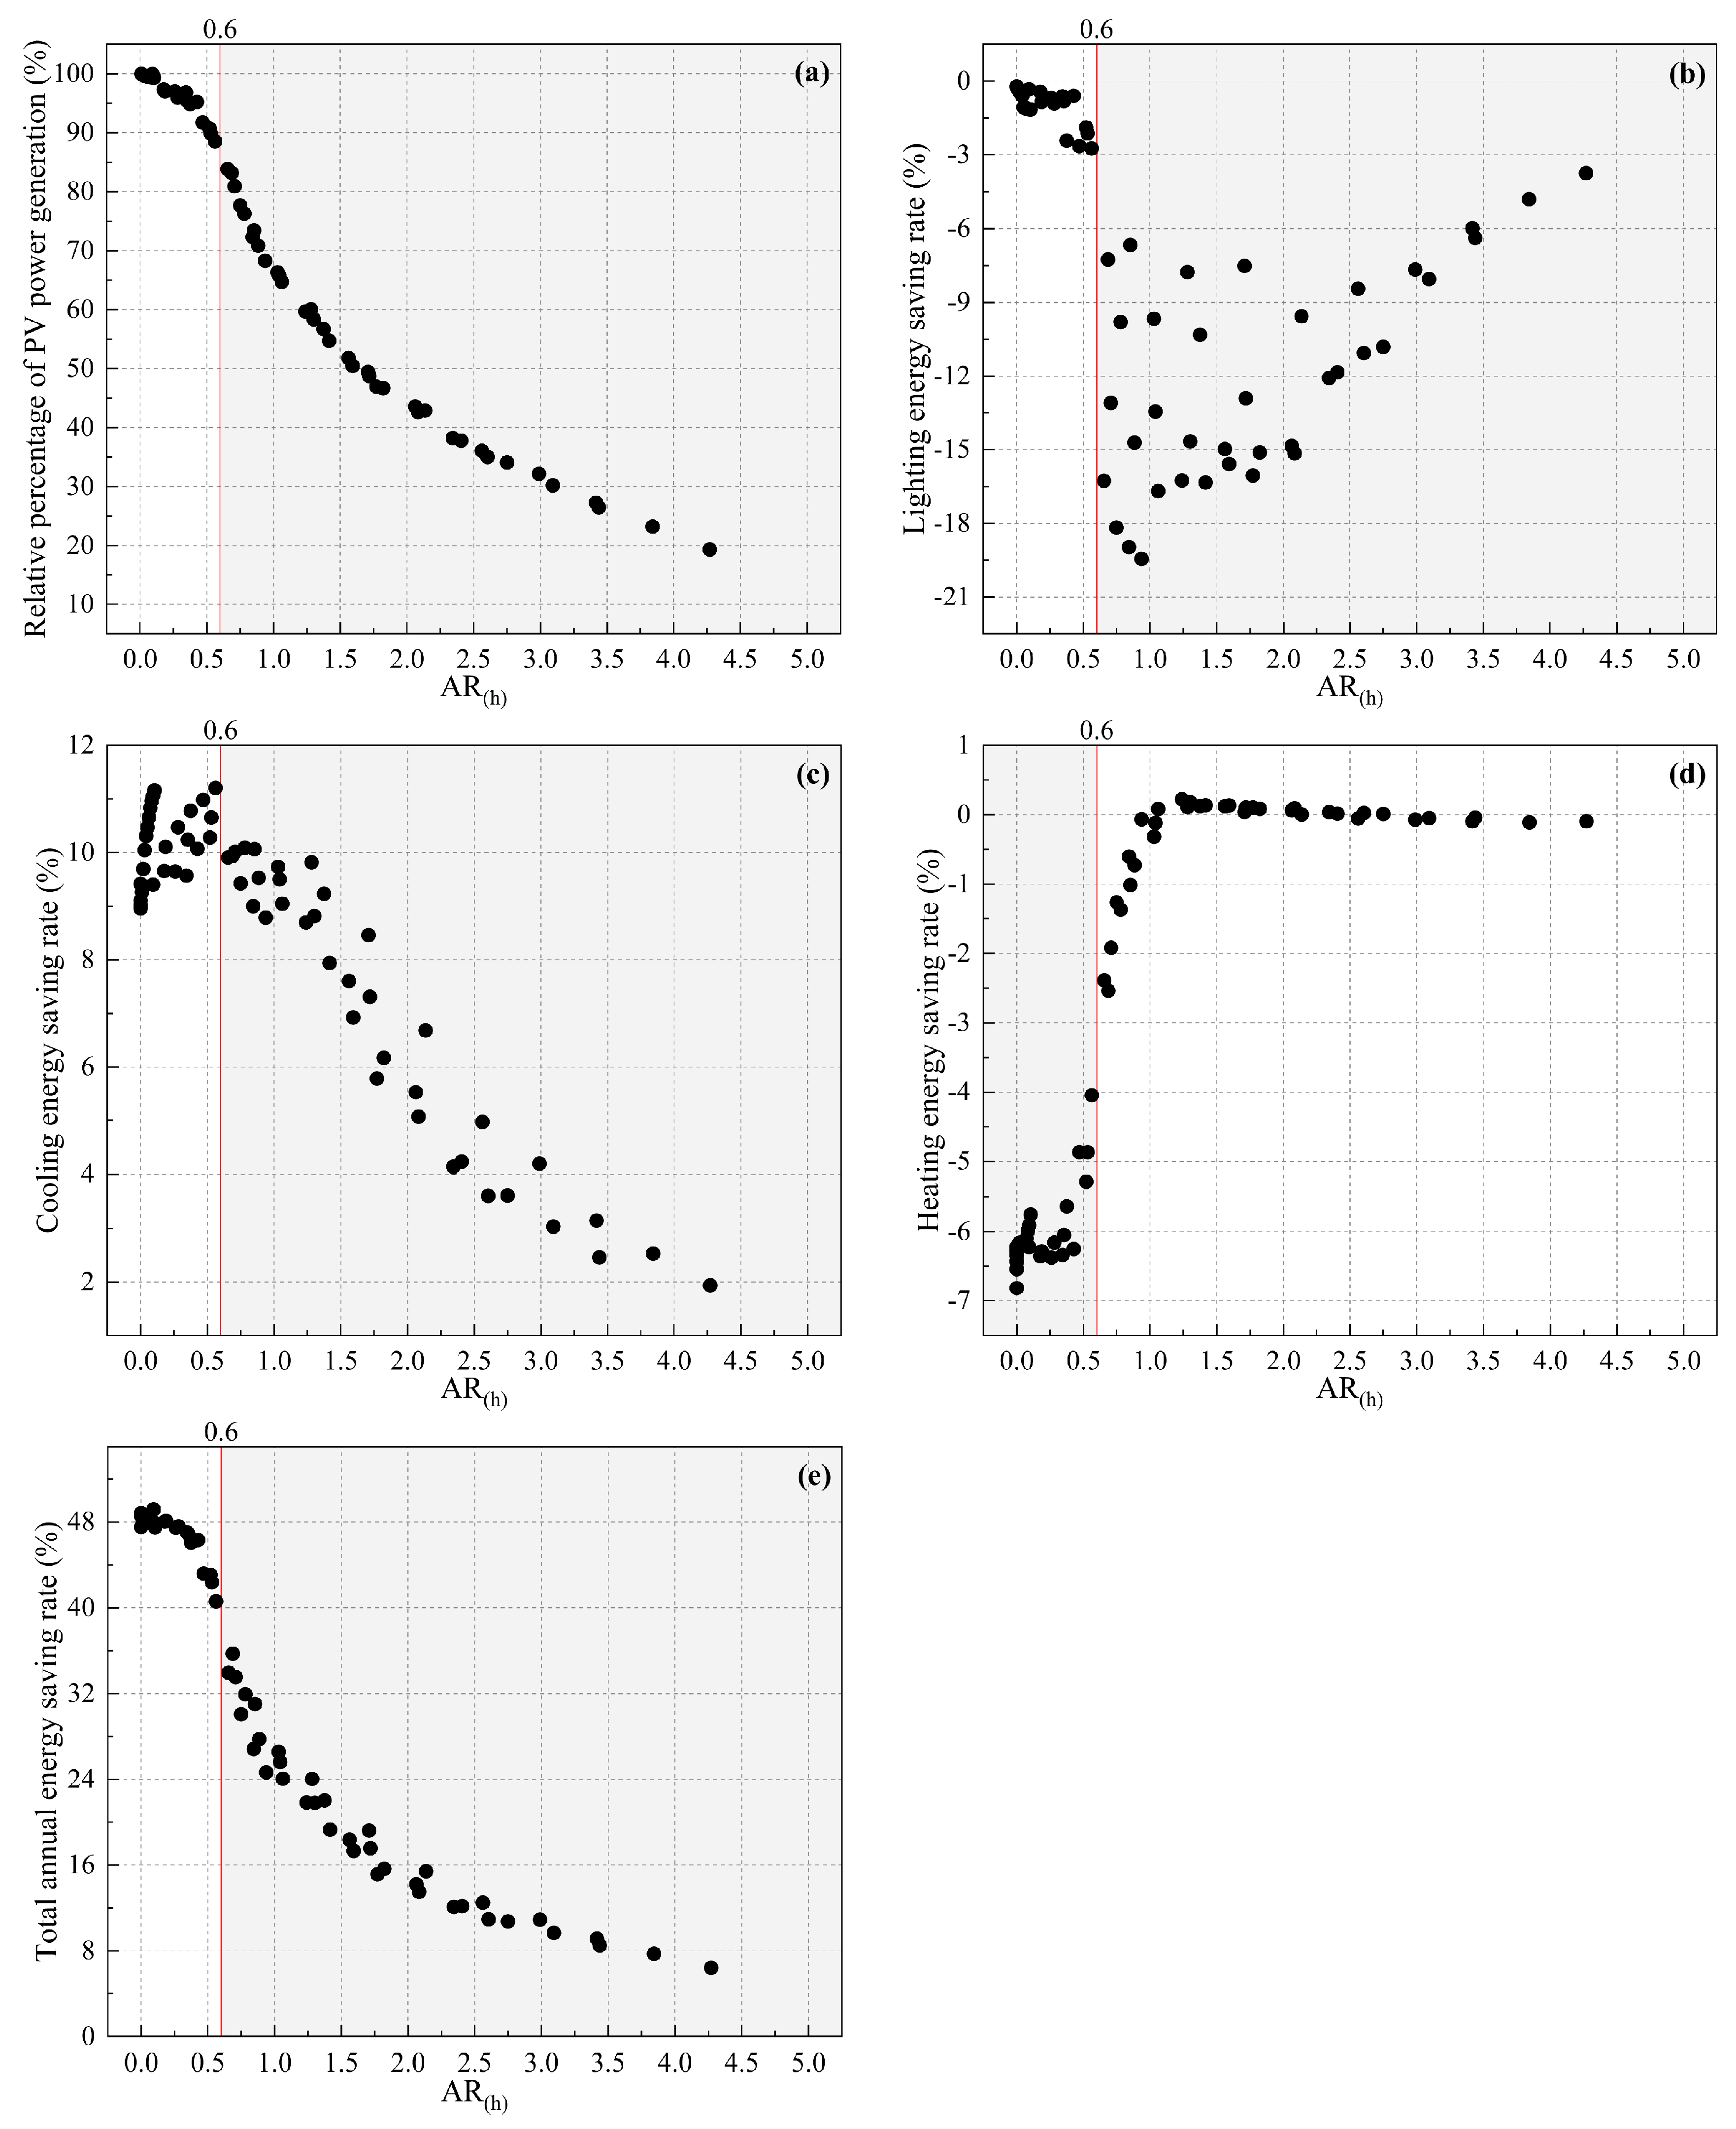
Figure 6a, it can be observed that the power generation efficiency of PVSDs in street canyons remains largely unaffected by the presence of neighboring buildings, as indicated by the AR
(h) value being less than 0.1. In scenarios where AR
(h) is less than 0.6, the impact of nearby buildings on the power output of PVSDs in various street canyons is minimal. In this scenario, the PV power generation can reach a range of 87.344% to 99.958% under AR = 0. Nevertheless, when the AR
(h) exceeds 0.6, the presence of surrounding structures exerts a substantial influence on the generation of PV electricity. As the value of AR
(h) increases, there is a corresponding fall in PV power output, leading to a progressive decline in its potential for development and utilization. Specifically, AR
(h) is equal to tan β, as depicted in
Figure 3. The value of AR
(h) is 0.6, indicating that the β angle is less than 30.964°. The largest value of the β angle is observed in close proximity to the latitude of Nanjing, specifically between 31°14′ and 32°37′ N. Exploring the correlation between the angle of β and latitude could be a promising avenue for future research.
According to the data presented in
Figure 6b, it can be observed that the lighting energy-saving rate is minimally affected by the creation and utilization of PVSDs when the AR
(h) value is less than 0.6. Following the implementation of PVSDs, the energy consumption for lighting experiences a mere rise of 0.220% to 2.815%. When AR
(h) exceeds 0.6, the building’s lighting energy consumption experiences a significant surge, reaching a peak increase of 17.008%. This rise can be attributed to the shading effect caused by surrounding buildings and PVSDs. As the AR
(h) increases, the PVSDs in the street canyon have a diminishing impact on the room’s illumination. Regarding the cooling energy-saving rate, as depicted in
Figure 6c, the optimal cooling energy-saving impact occurs when AR
(h) is less than 0.6. This is achieved by implementing PVSDs in various street canyons, resulting in a significant reduction of cooling energy consumption by 8.992% to 11.623%. However, when AR
(h) is greater than 0.6, the shading effect of PVSDs diminishes significantly as a result of the presence of surrounding buildings. During winter, as depicted in
Figure 6d, the consumption of heating energy initially rises and subsequently declines as the AR
(h) increases. When the AR
(h) value is less than 0.6, the PVSDs exhibit the most significant influence on the heating energy consumption, resulting in an increase of 4.632% to 6.808% in heating energy consumption. When the value of AR
(h) exceeds 0.6, there is a progressive decline in the impact of PVSDs on heating energy usage. The figure illustrates that PVSDs have the potential to marginally decrease heating energy usage. This implies that PVSDs have the ability to modify the temperature conditions within street canyons.
The highest annual total energy-saving rate of PVSDs in different street canyons is observed when AR
(h) is less than 0.6, as depicted in
Figure 6e. The annual total energy-saving rate of 37.363% becomes 48.564% when the utilization rate of the office external wall is 12.5%. However, when the AR
(h) value is more than 0.6, the annual total building energy-saving rate steadily decreases due to the shading impact of surrounding structures. This decrease prevents the achievement of the intended energy-saving benefit. In this study, it can be concluded that street spaces that satisfy the requirement of AR
(h) < 0.6 are deemed appropriate for the establishment and use of PVSDs. Furthermore, it is important to highlight that in this research, the integration of linear lighting control, PVSDs, and effective envelope performance can result in over 85% conservation efficiency of the overall yearly energy. Hence, the integration of these energy-saving methods merits widespread adoption and implementation.
5. Discussion
Section 4 examined the relationship between energy consumption and photovoltaic performance in various street canyons using the AR index and AR
(h) index. It also briefly explored the factors influencing changes in the indoor thermal environment, light environment, and power generation This section provides a detailed comparison and analysis of the feasibility of using the AR index and AR
(h) index in real-world scenarios. Additionally, this section evaluates the suitability of the AR
(h) index and examines the approach for developing PVSDs in various street settings.
5.1. Comparative Analysis and Deliberation on the Feasibility of AR and AR(h)
This study initially investigated the viability of constructing PVSDs in street canyons based on the AR index.
Figure 4 illustrates that there are similarities in the changes observed in both the building energy-saving rate and the performance of photovoltaic power generation. Adjacent buildings’ shading adversely affects the power generation, internal illumination, and temperature environment of PVSDs. However, it is advantageous in terms of reducing cooling energy usage during the summer. The reason for this is that adequate solar exposure promotes indoor natural lighting year-round, enhancing indoor illumination and elevating indoor temperature during winter, hence decreasing heating energy usage. However, the presence of adjacent buildings and PVSDs will result in a decrease in the overall amount of solar radiation received indoors. Additionally, their impact on the cooling energy-saving rate is only beneficial during the summer season. Nevertheless, it is worth noting that cooling energy consumption and heating energy consumption are exclusively observed during the summer and winter seasons, respectively. In contrast, lighting energy consumption and solar power generation are continuous throughout the year, constituting distinct shares of the overall yearly energy consumption. Hence, overall, the fluctuations in photovoltaic power generation and the annual energy conservation rate of buildings exhibit a comparable pattern. The energy efficiency of buildings is determined by the electricity generation of PVSDs, and the benefits of implementing PVSDs in various street canyons surpass the drawbacks.
While AR has the capability to capture the fluctuations in PV performance and building energy consumption, its efficiency remains insufficient. When designing and implementing PVSDs in various street canyon areas, it is essential to individually assess the energy-saving impact of each canyon and thereafter establish the correlation between the energy-saving effect, AR, and the height (h). Ultimately, based on this correlation, the desired height range for the development and utilization of building facades is determined. Nevertheless, given the vast number of structures inside the urban area, it is evidently unsuitable to ascertain the feasible height range for building facades alone by the utilization of AR in every street canyon. Hence, the AR is exclusively appropriate for evaluating the possible deployment of PVSDs in certain street canyons. One of the rationales for proposing the AR(h) in this work is as follows.
This study examined the fluctuation of building energy and photovoltaic performance in relation to AR
(h), as depicted in
Figure 5 and
Figure 6. This study revealed the existence of facades that are conducive to the growth of PVSDs in various urban street canyons. Furthermore, there is a similarity in the fluctuation of power output from PVSDs and building energy consumption. Additionally, the key parameters that are favorable for the development of PVSDs in different street canyons are also consistent. This finding can efficiently steer the advancement of PVSDs in urban areas. The reason for this is that the AR
(h) index is solely associated with the θ angle. When the angle of incidence θ is constant, the photovoltaic power generation exhibits a tendency toward similarity, with the minor variation attributed to the reflection of light from the wall. After implementing PVSDs on building facades that satisfy the AR
(h) < 0.6 criteria, the energy consumption of the building and the power output of PVSDs are minimally influenced by surrounding buildings, resulting in the highest yearly energy savings. This work presents a comprehensive and effective index for the widespread implementation and utilization of PVSDs in urban street canyons. During the installation, measurements are taken on-site to determine the width and height of the street canyon. This allows for the determination of the height range of the building facade that is acceptable for the placement of PVSDs.
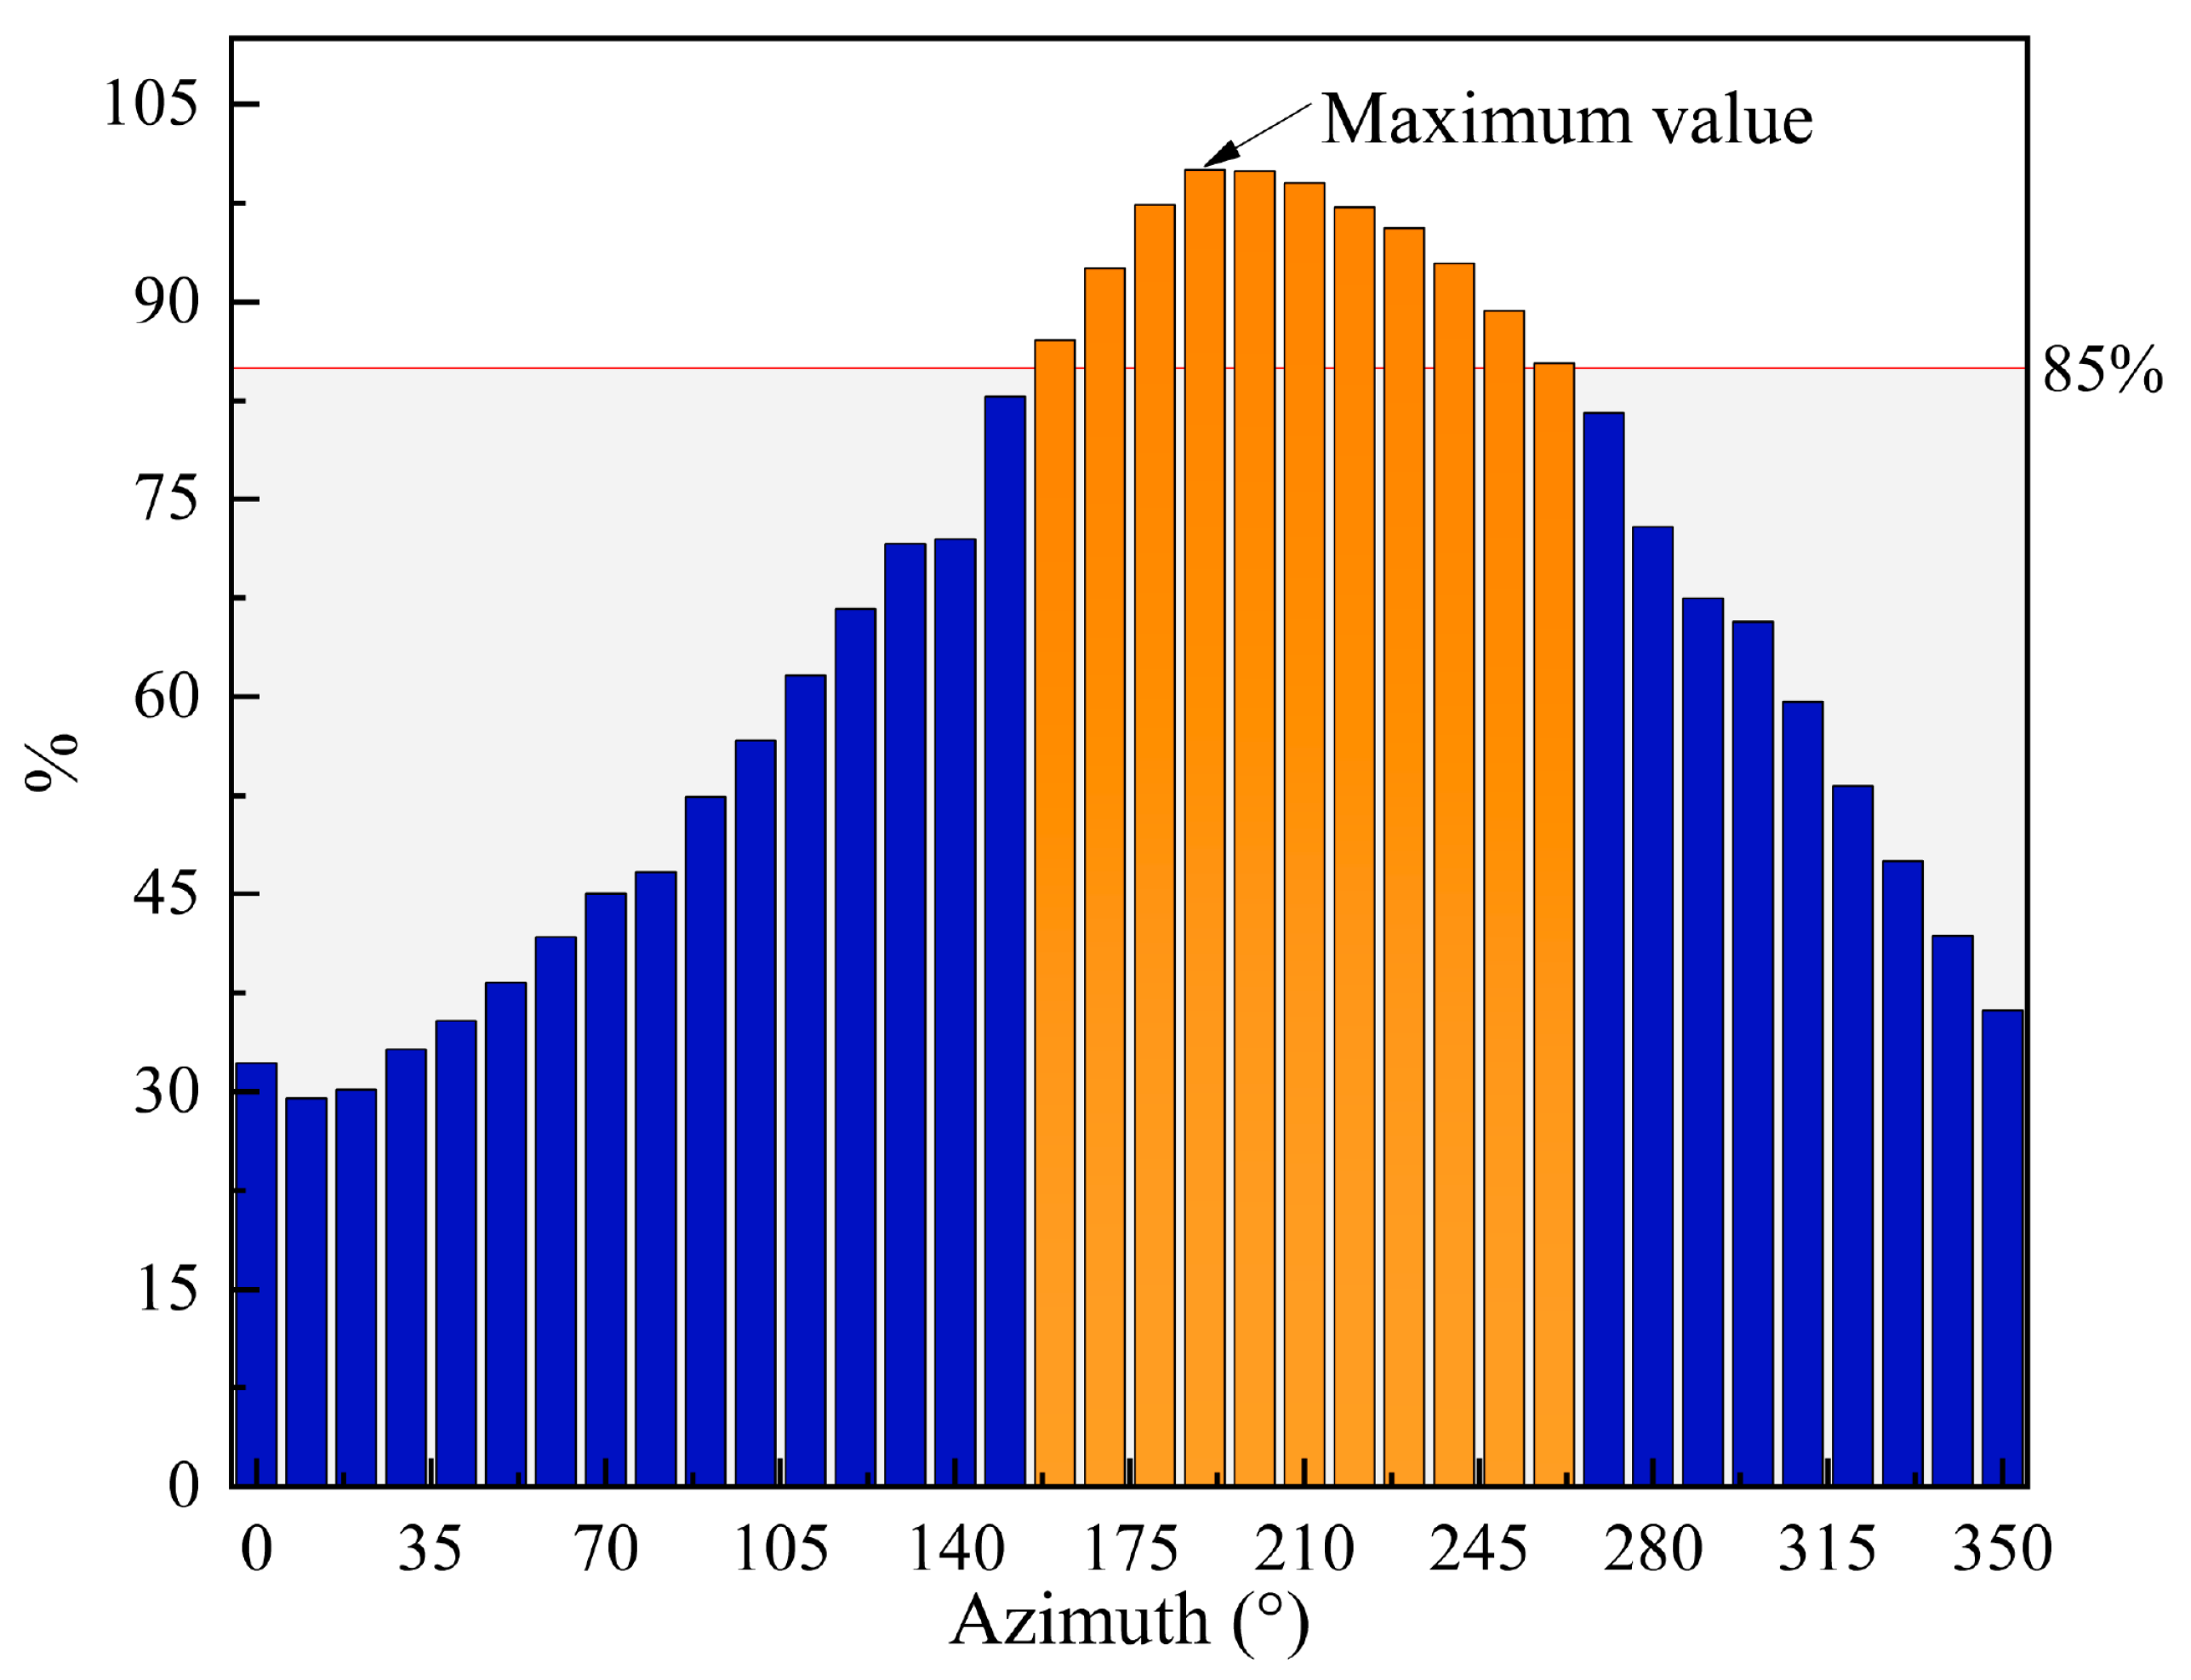
5.2. Analysis of the Suitability of AR(h) in Various Street Situations and the Approach to Developing PVSDs
Only a portion of the building façade in actual cities is appropriate for the implementation of PVSDs. The analysis revealed that when the impact of neighboring buildings is disregarded, the optimal azimuth angle for the placement of PVSDs is between 160 and 260 degrees. Within this specified range, the PV power generation has the potential to exceed 85% of its maximum value, as depicted in
Figure 7. The orientation of the building and the PV panel is indicated by the azimuth angle depicted in the figure. To minimize the impact of neighboring buildings and maximize the energy efficiency of the building, it is necessary to repeat the steps mentioned above within the range of 160 to 260 degrees. It has been determined that the PVSDs must have an installation position where the AR
(h) value is less than 0.6.
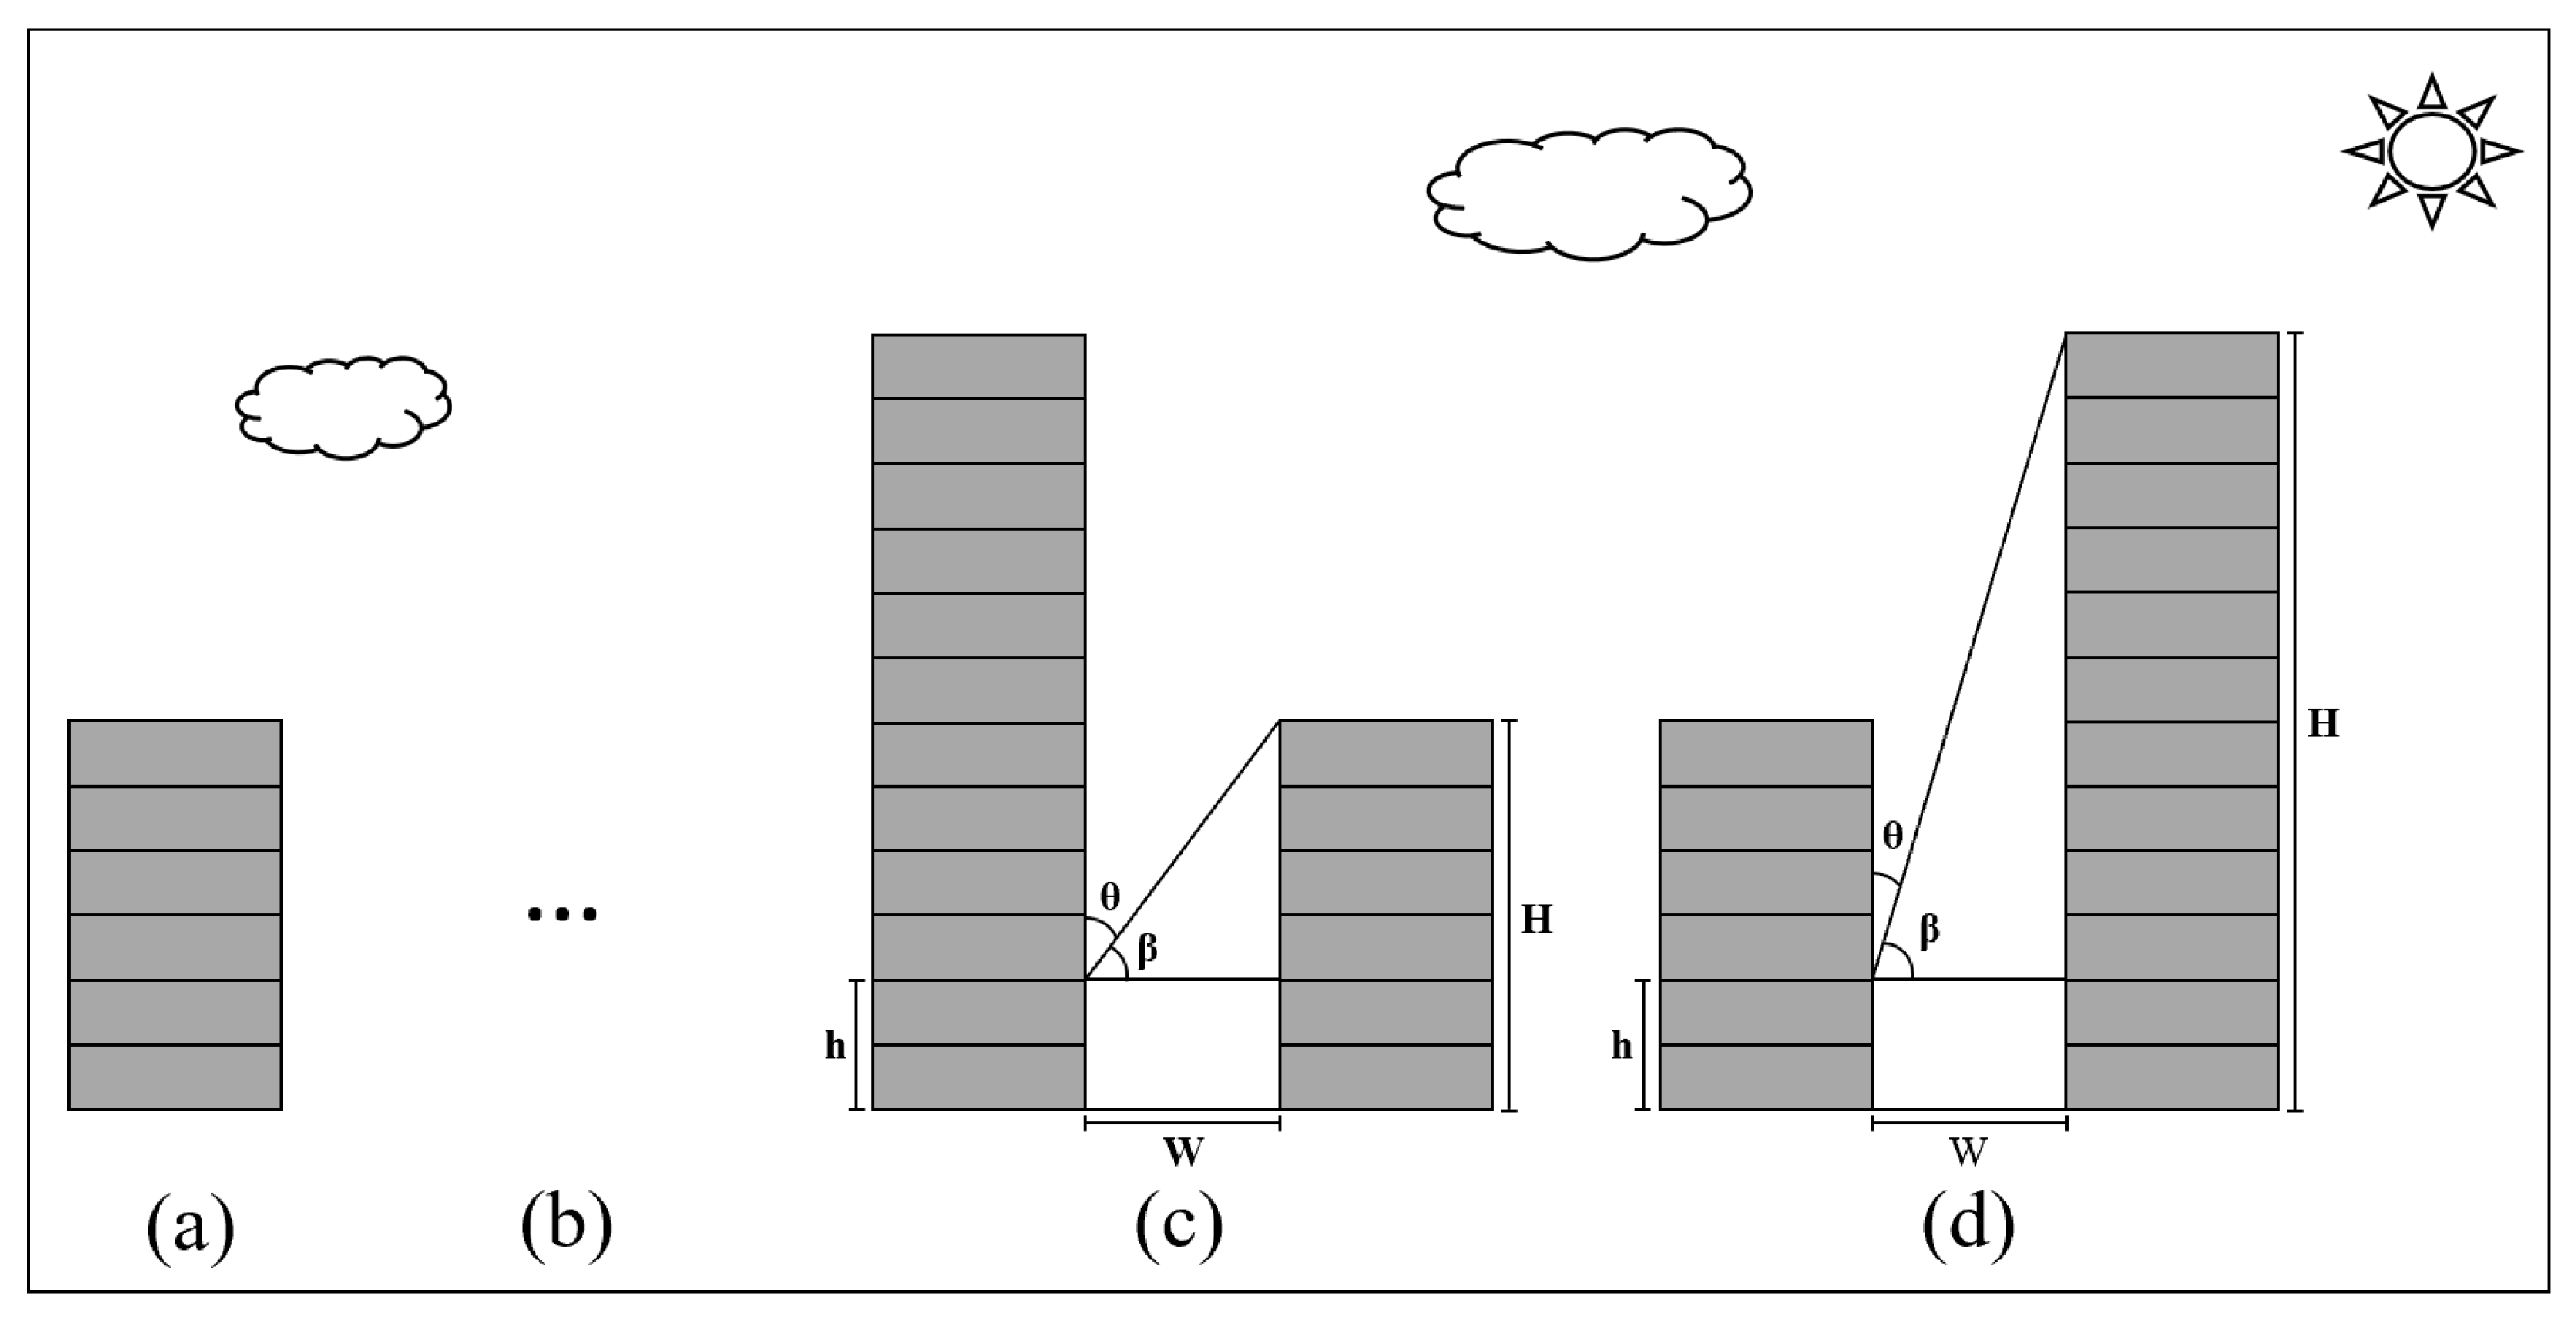
Furthermore, this research examined the attributes of urban streets using the ArcGIS platform and provided a concise overview of four scenarios where PVSDs are applied, as depicted in
Figure 8. PVSDs are highly ideal for scene (a) because of the absence of any interference from neighboring buildings. In scenario (b), the model is identical to the one shown in
Figure 3. It is only appropriate to implement PVSDs when AR
(h) is less than 0.6. Specifically, in the case of scene (c), when the value of h is greater than H, the AR
(h) is negative. This requirement is met when AR
(h) is less than 0.6, making it appropriate for the implementation of PVSDs. The model is considered equivalent to the model of scene (b) when h is less than H. It is important to mention that the building facade in the street canyon in scene (d) is not appropriate for PVSD installation since it is often shaded by surrounding buildings. However, this can be overcome if the width of the street space (W) is sufficiently large to meet the criteria of AR
(h) < 0.6. Considering the adverse effects of PVSDs, this study proposes that the use of PVSDs in street areas should be complemented by the implementation of lighting control technologies and the enhancement of building envelope performance, particularly for older buildings.
6. Conclusions
This study introduces the AR(h) index as a means to assist practitioners in effectively identifying the optimal location for implementing PVSDs on building facades in various street canyons. The AR(h) index addresses the limitations of the current quantitative index by establishing a strong correlation between street canyon characteristics, PVSD power generation, and building energy consumption. According to this index, the essential requirements for the advancement of photovoltaics in various street canyons are identical. This study aimed to compare and assess the variation in energy consumption, performance of PVSDs, and energy-saving rate across different street canyons using the AR index and AR(h) index. The viability of implementing PVSDs in various street canyons was confirmed, and the optimal conditions for PVSD development were identified. In summary, the suitability of the AR(h) index in various street scenes was evaluated, and a matching technique for developing PVSDs was suggested.
The findings indicate that the implementation of lighting control technology in energy-efficient buildings leads to a notable rise in total yearly energy consumption due to shade caused by surrounding structures. The presence of PVSDs will have a significant impact on both the internal temperature climate and the natural lighting conditions due to the shading effect they produce. Furthermore, the research findings indicate that within different street canyons, there is a distinct range of street areas that experience low influences from adjacent structures and demonstrate the most significant rate of energy conservation in buildings. These specific regions are considered appropriate for the implementation of PVSDs on building exteriors.
In this study, the impact of nearby buildings on PV power output and building energy consumption was negligible when AR(h) was below 0.6. Furthermore, this condition was linked to the minimum overall yearly energy usage of buildings and the most efficient energy conservation result. Furthermore, within this specific context, the PV power generation exhibited the capacity to attain a range of 87.344% to 99.958% when compared to the situation where AR was equal to zero. The overall yearly energy-saving rate ranged from 37.363% to 48.564% when the utilization rate of the external wall of the room was 12.5%. The geographical characteristics of urban street canyons significantly influence the effectiveness of PVSDs and the conservation of building energy. The recently suggested index was demonstrated to apply to many street settings, offering useful insights for the progress and execution of PVSDs in street canyons.
Ultimately, it is crucial to recognize that the results of this study are particularly relevant to the construction of clusters or communities that exhibit consistent arrangements. The generalizability of the study’s findings is constrained when confronted with situations with non-uniform arrangements, hence requiring an independent assessment. Furthermore, with regard to study methodologies, there exist areas that could be enhanced. The integration of simulation and experimentation can enhance the precision of determining the key conditions necessary for the advancement of PVSDs. It is imperative that the measurement duration covers a minimum of one year. The extensive use of PVSDs in urban areas will also give rise to certain subjects that merit scholarly investigation. In the context of an old building energy-saving renovation project, it is imperative to reassess the safety and stability of the building due to the potential increase in load caused by PVSDs. Furthermore, it is imperative to take into account the supplementary factors of light pollution, tree cover, and the economic advantages associated with PVSDs. One of the factors that can reduce the available surface area of building facades is the existence of trees in large roadway canyons. This research proposes that there is a relationship between the AR(h) value and latitude, and that latitude influences the most advantageous positioning of PVSDs on the building front. Hence, future studies will focus on investigating the development strategy and economic advantages of PVSDs in non-uniform building clusters. Additionally, they will aim to explore the correlation between AR(h) and geographic latitude.
Author Contributions
Conceptualization, P.W.; Methodology, P.W.; Software, C.J. and L.J.; Formal analysis, W.W., H.Z. and C.W.; Investigation, W.W., H.Z., C.W., W.Z. and L.H.; Resources, L.H.; Data curation, W.Z.; Writing—original draft, W.W.; Writing—review & editing, C.J., H.Z., L.J. and C.W.; Visualization, C.J. and L.J.; Supervision, C.J., L.J. and L.H.; Funding acquisition, P.W. All authors have read and agreed to the published version of the manuscript.
Funding
This research was funded by the National Natural Science Foundation of China [Grant No. 51908249], the Natural Science Foundation of Jiangsu Province [Grant No. BK20231327], the Natural Science Foundation of the Jiangsu Higher Education Institutions of China [Grant No. 19KIB560012], the High-level Scientific Research Foundation for the Introduction of Talent for Jiangsu University [Grant No. 18JDG038], the Innovative Approaches Special Project of the Ministry of Science and Technology of China [Grant No. 2020IM020300], and the Science and Technology Planning Project of Suzhou [Grant No. ST202218].
Data Availability Statement
The datasets in the current study are available from the corresponding author upon reasonable request.
Conflicts of Interest
The authors declare no conflicts of interest.
Appendix A. The Variation Law of PVSDs Power Generation Performance and Building Energy Saving Effect of 24 m High Street Canyon Model 1
Figure A1.
The variation of building energy-saving rate and PV performance after installing PVSDs at different heights of 24 m high street canyon model 1.
Figure A1.
The variation of building energy-saving rate and PV performance after installing PVSDs at different heights of 24 m high street canyon model 1.
Figure A2.
The relationship between AR(h), PV power generation, and building energy consumption of 24 m high street canyon model 1: (a) Photovoltaic power generation; (b) Lighting energy consumption; (c) Cooling energy consumption; (d) Heating energy consumption; (e) Total annual energy consumption.
Figure A3.
Variation of PV power generation efficiency and building energy-saving rate of 24 m high street canyon model 1: (a) Relative percentage of photovoltaic power generation; (b) Lighting energy saving rate; (c) Cooling energy saving rate; (d) Heating energy saving rate; (e) Total annual energy saving rate.
Appendix B. The Variation Law of PVSDs Power Generation Performance and Building Energy Saving Effect of 24 m High Street Canyon Model 2
Figure A4.
The variation of building energy-saving rate and PV performance after installing PVSDs at different heights of 24 m high street canyon model 2.
Figure A4.
The variation of building energy-saving rate and PV performance after installing PVSDs at different heights of 24 m high street canyon model 2.
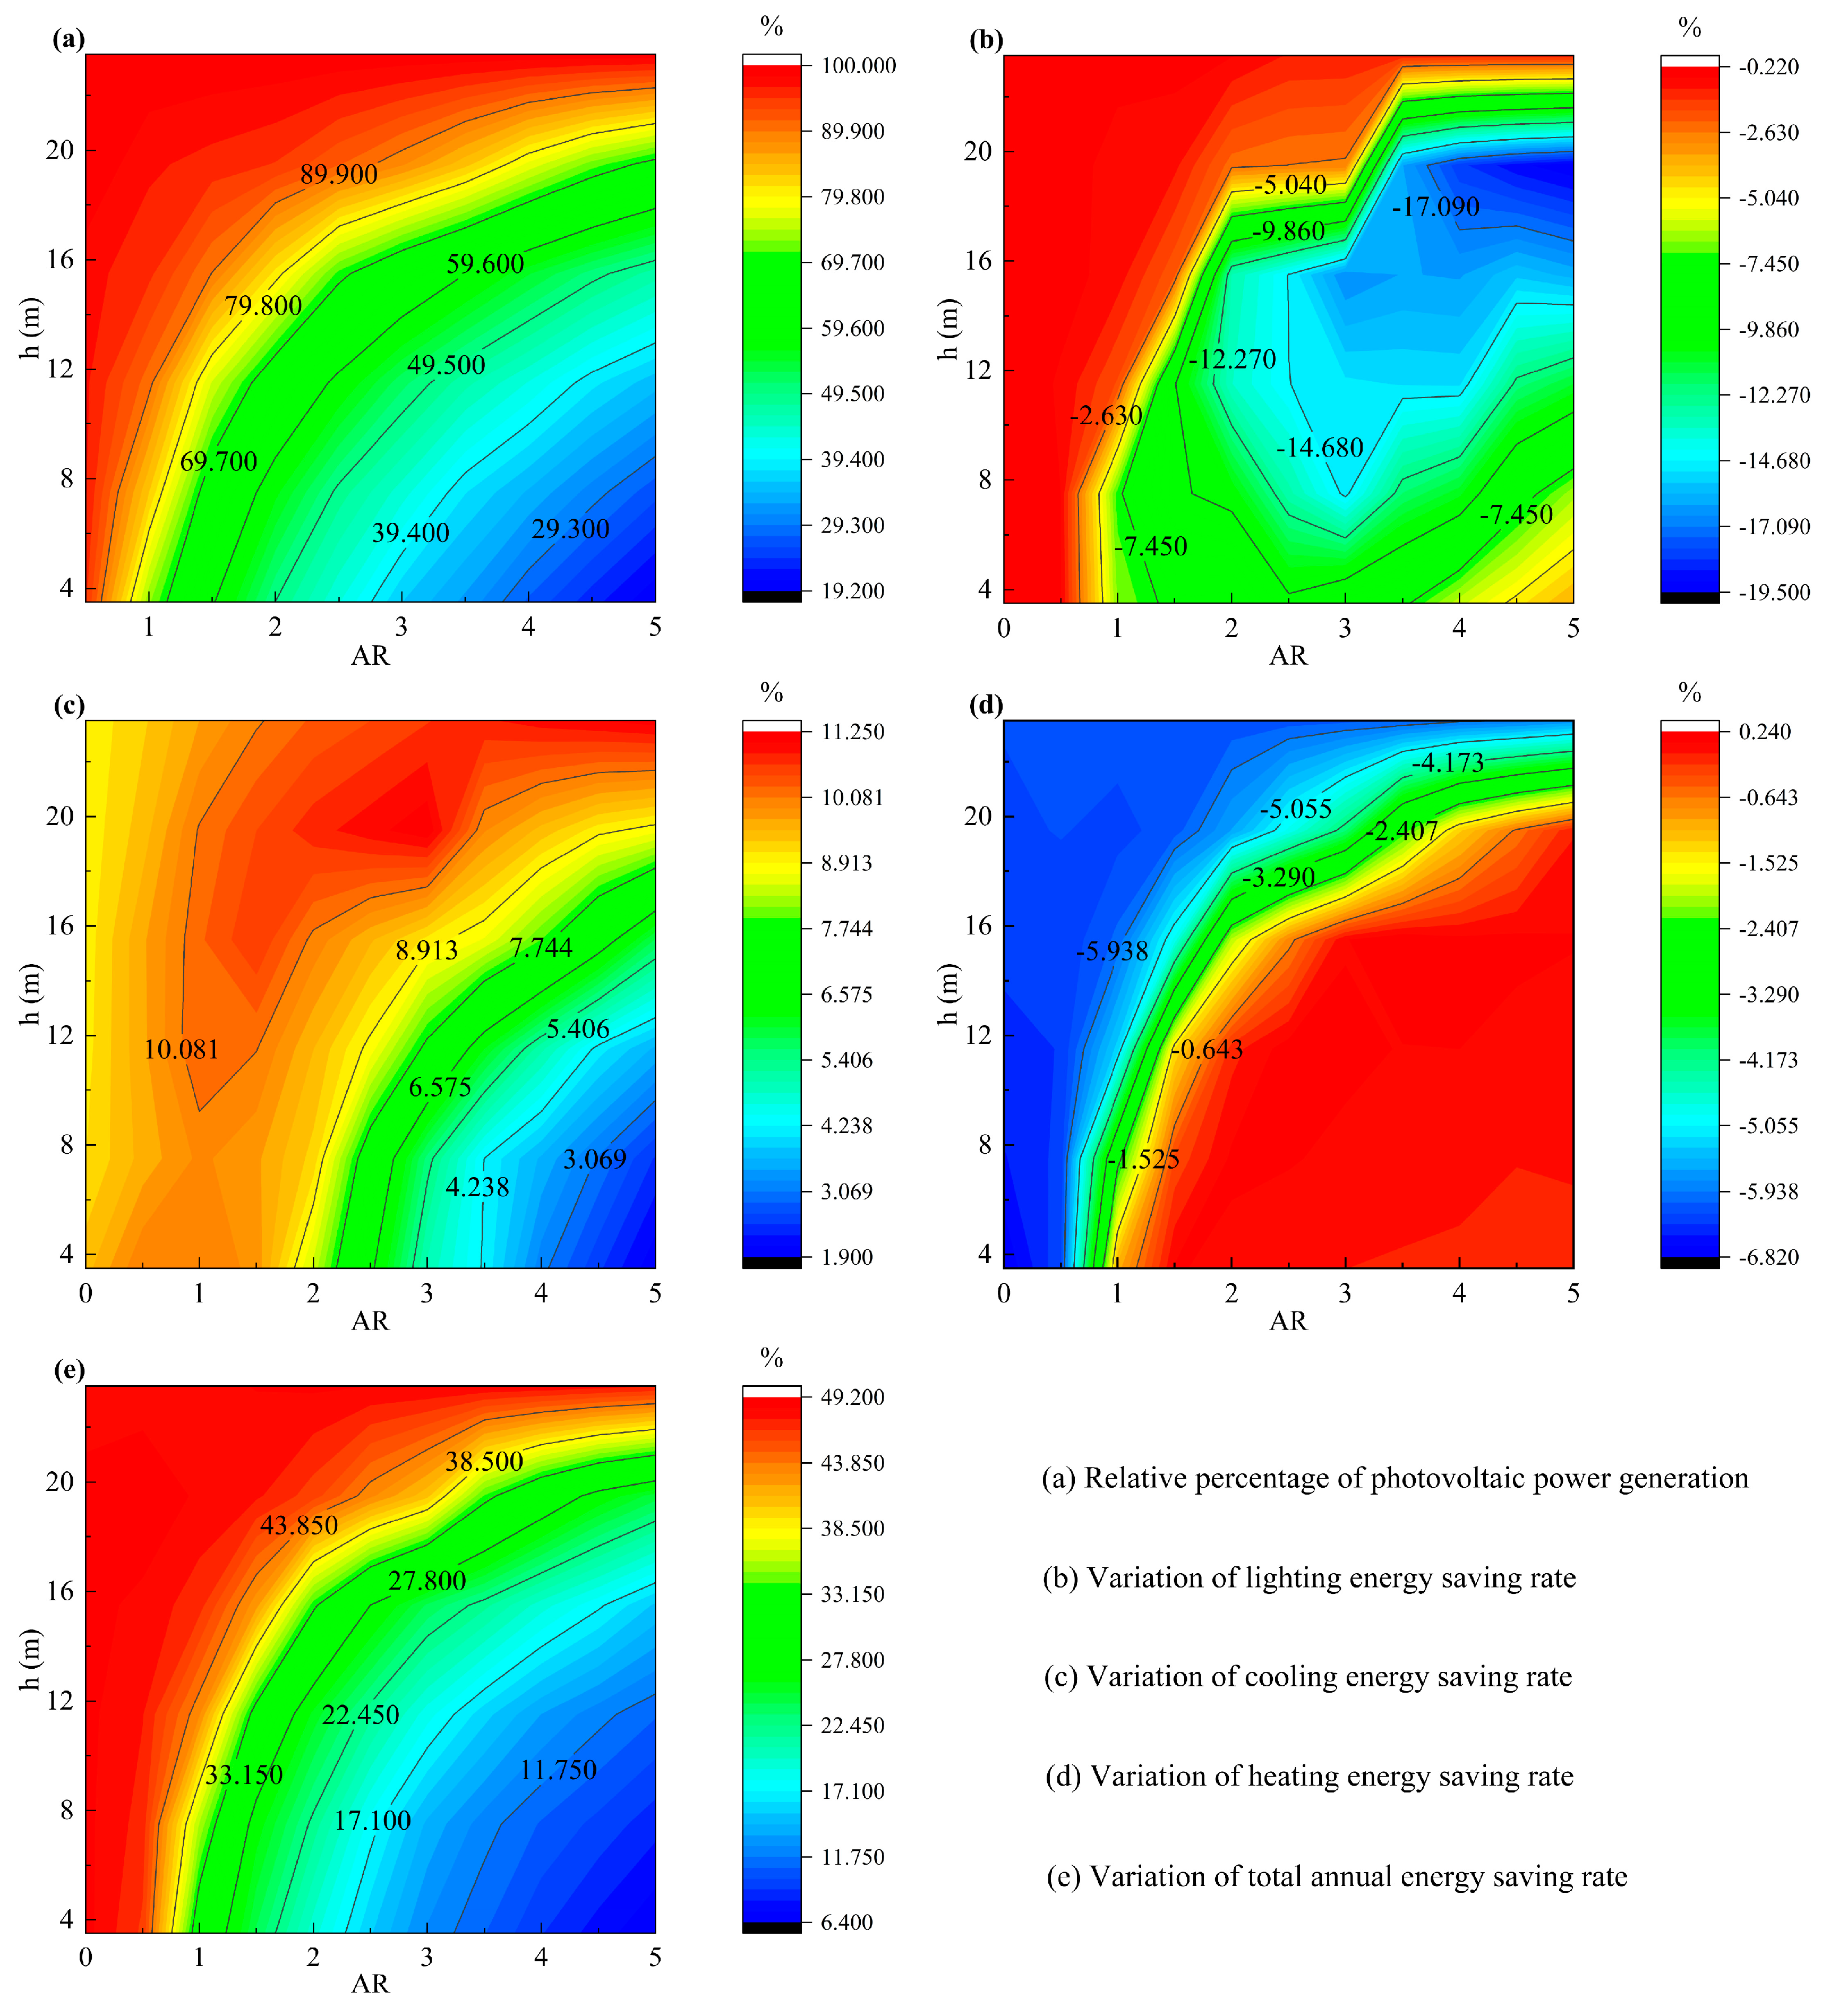
Figure A5.
The relationship between AR(h), PV power generation, and building energy consumption of 24 m high street canyon model 2: (a) Photovoltaic power generation; (b) Lighting energy consumption; (c) Cooling energy consumption; (d) Heating energy consumption; (e) Total annual energy consumption.
Figure A6.
Variation of PV power generation efficiency and building energy-saving rate of 24 m high street canyon model 2: (a) Relative percentage of photovoltaic power generation; (b) Lighting energy saving rate; (c) Cooling energy saving rate; (d) Heating energy saving rate; (e) Total annual energy saving rate.
References
- Li, M.; Long, K. Regional Differences and Threshold Characters of the Impact of Energy Use Efficiency on Energy Scarcity in China. Chin. J. Popul. Resour. Environ. 2021, 19, 265–273. [Google Scholar] [CrossRef]
- Amada, K.; Kim, J.; Inaba, M.; Akimoto, M.; Kashihara, S.; Tanabe, S.-i. Feasibility of Staying at Home in a Net-Zero Energy House during Summer Power Outages. Energy Build. 2022, 273, 112352. [Google Scholar] [CrossRef]
- Rajput, M.; Augenbroe, G.; Stone, B.; Georgescu, M.; Broadbent, A.; Krayenhoff, S.; Mallen, E. Heat Exposure during a Power Outage: A Simulation Study of Residences across the Metro Phoenix Area. Energy Build 2022, 259, 111605. [Google Scholar] [CrossRef]
- Silveira, I.H.; Hartwig, S.V.; Moura, M.N.; Cortes, T.R.; Junger, W.L.; Cirino, G.; Ignotti, E.; de Oliveira, B.F.A. Heat Waves and Mortality in the Brazilian Amazon: Effect Modification by Heat Wave Characteristics, Population Subgroup, and Cause of Death. Int. J. Hyg. Environ. Health 2023, 248, 114109. [Google Scholar] [CrossRef] [PubMed]
- Sun, X.; Lin, Y.; Zhu, Z.; Li, J. Optimized Design of a Distributed Photovoltaic System in a Building with Phase Change Materials. Appl. Energy 2022, 306, 118010. [Google Scholar] [CrossRef]
- Wang, P.; Zhong, P.; Yu, M.; Pu, Y.; Zhang, S.; Yu, P. Trends in Energy Consumption under the Multi-Stage Development of ICT: Evidence in China from 2001 to 2030. Energy Rep. 2022, 8, 8981–8995. [Google Scholar] [CrossRef]
- Tu, Q.; Betz, R.; Mo, J.; Fan, Y. The Profitability of Onshore Wind and Solar PV Power Projects in China—A Comparative Study. Energy Policy 2019, 132, 404–417. [Google Scholar] [CrossRef]
- Pan, D.; Bai, Y.; Chang, M.; Wang, X.; Wang, W. The Technical and Economic Potential of Urban Rooftop Photovoltaic Systems for Power Generation in Guangzhou, China. Energy Build 2022, 277, 112591. [Google Scholar] [CrossRef]
- Wang, Q.Y.; Lv, X.L.; Zeman, A. Optimization of a Multi-Energy Microgrid in the Presence of Energy Storage and Conversion Devices by Using an Improved Gray Wolf Algorithm. Appl. Therm. Eng. 2023, 234, 121141. [Google Scholar] [CrossRef]
- Xiong, Y.; Cheng, Q. Effects of New Energy Vehicle Adoption on Provincial Energy Efficiency in China: From the Perspective of Regional Imbalances. Energy 2023, 281, 128324. [Google Scholar] [CrossRef]
- An, Y.; Chen, T.; Shi, L.; Heng, C.K.; Fan, J. Solar Energy Potential Using GIS-Based Urban Residential Environmental Data: A Case Study of Shenzhen, China. Sustain. Cities Soc. 2023, 93, 104547. [Google Scholar] [CrossRef]
- Jones, C.B.; Vining, W.; Haines, T. Spatial Adoption Forecast Methodology for Photovoltaic Systems throughout a City. Sustain. Cities Soc. 2023, 93, 104430. [Google Scholar] [CrossRef]
- Wang, P.; Yu, P.; Huang, L.; Zhang, Y. An Integrated Technical, Economic, and Environmental Framework for Evaluating the Rooftop Photovoltaic Potential of Old Residential Buildings. J. Environ. Manag. 2022, 317, 115296. [Google Scholar] [CrossRef] [PubMed]
- Liu, J.; Bi, G.; Gao, G.; Zhao, L. Optimal Design Method for Photovoltaic Shading Devices (PVSDs) by Combining Geometric Optimization and Adaptive Control Model. J. Build. Eng. 2023, 69, 106101. [Google Scholar] [CrossRef]
- Deng, J.Y.; Wong, N.H. Impact of Urban Canyon Geometries on Outdoor Thermal Comfort in Central Business Districts. Sustain. Cities Soc. 2020, 53, 101966. [Google Scholar] [CrossRef]
- Huang, Z.R.; Zhang, Y.J.; Wen, Y.B.; Tang, Y.F.; Liu, C.W.; Zhao, F.Y. Synoptic Wind Driven Ventilation and Far Field Radionuclides Dispersion across Urban Block Regions: Effects of Street Aspect Ratios and Building Array Skylines. Sustain. Cities Soc. 2022, 78, 103606. [Google Scholar] [CrossRef]
- Yang, H.; Chen, G.; Wang, D.; Hang, J.; Li, Q.; Wang, Q. Influences of Street Aspect Ratios and Realistic Solar Heating on Convective Heat Transfer and Ventilation in Full-Scale 2D Street Canyons. Build Environ. 2021, 204, 108125. [Google Scholar] [CrossRef]
- Battista, G.; de Lieto Vollaro, E.; Ocłoń, P.; Vallati, A. Effect of Mutual Radiative Exchange between the Surfaces of a Street Canyon on the Building Thermal Energy Demand. Energy 2021, 226, 120346. [Google Scholar] [CrossRef]
- Wang, W.; Cheng, X.; Dai, M. Strategies for Sustainable Urban Development and Morphological Optimization of Street Canyons: Measurement and Simulation of PM2.5 at Different Points and Heights. Sustain. Cities Soc. 2022, 87, 104191. [Google Scholar] [CrossRef]
- Gharakhani Siraki, A.; Pillay, P. Study of Optimum Tilt Angles for Solar Panels in Different Latitudes for Urban Applications. Sol. Energy 2012, 86, 1920–1928. [Google Scholar] [CrossRef]
- Zhang, W.; Lu, L.; Peng, J. Evaluation of Potential Benefits of Solar Photovoltaic Shadings in Hong Kong. Energy 2017, 137, 1152–1158. [Google Scholar] [CrossRef]
- Fouad, M.M.; Shihata, L.A.; Mohamed, A.H. Modeling and Analysis of Building Attached Photovoltaic Integrated Shading Systems (BAPVIS) Aiming for Zero Energy Buildings in Hot Regions. J. Build. Eng. 2019, 21, 18–27. [Google Scholar] [CrossRef]
- Shi, S.; Sun, J.; Liu, M.; Chen, X.; Gao, W.; Song, Y. Energy-Saving Potential Comparison of Different Photovoltaic Integrated Shading Devices (PVSDs) for Single-Story and Multi-Story Buildings. Energies 2022, 15, 9196. [Google Scholar] [CrossRef]
- Kim, J.; Lee, H.; Choi, M.; Kim, D.; Yoon, J. Power Performance Assessment of PV Blinds System Considering Self-Shading Effects. Sol. Energy 2023, 262, 111834. [Google Scholar] [CrossRef]
- Akbari Paydar, M. Optimum Design of Building Integrated PV Module as a Movable Shading Device. Sustain. Cities Soc. 2020, 62, 102368. [Google Scholar] [CrossRef]
- Wang, D.; Qi, T.; Liu, Y.; Wang, Y.; Fan, J.; Wang, Y.; Du, H. A Method for Evaluating Both Shading and Power Generation Effects of Rooftop Solar PV Panels for Different Climate Zones of China. Sol. Energy 2020, 205, 432–445. [Google Scholar] [CrossRef]
- Zhao, J.; Du, Y. Multi-Objective Optimization Design for Windows and Shading Configuration Considering Energy Consumption and Thermal Comfort: A Case Study for Office Building in Different Climatic Regions of China. Sol. Energy 2020, 206, 997–1017. [Google Scholar] [CrossRef]
- Sadatifar, S.; Johlin, E. Multi-Objective Optimization of Building Integrated Photovoltaic Solar Shades. Sol. Energy 2022, 242, 191–200. [Google Scholar] [CrossRef]
- Zhang, X.; Lau, S.K.; Lau, S.S.Y.; Zhao, Y. Photovoltaic Integrated Shading Devices (PVSDs): A Review. Sol. Energy 2018, 170, 947–968. [Google Scholar] [CrossRef]
- Huo, H.; Xu, W.; Li, A.; Lv, Y.; Liu, C. Analysis and Optimization of External Venetian Blind Shading for Nearly Zero-Energy Buildings in Different Climate Regions of China. Sol. Energy 2021, 223, 54–71. [Google Scholar] [CrossRef]
- Zheng, M.; Liu, F.; Guo, X.; Lei, X. Assessing the Distribution of Commuting Trips and Jobs-Housing Balance Using Smart Card Data: A Case Study of Nanjing, China. Sustainability 2019, 11, 5346. [Google Scholar] [CrossRef]
- Wang, C.; Sheng, Y.; Wang, J.; Wang, Y.; Wang, P.; Huang, L. Air Pollution and Human Health: Investigating the Moderating Effect of the Built Environment. Remote Sens. 2022, 14, 3703. [Google Scholar] [CrossRef]
- Jiang, H.; Yao, R.; Han, S.; Du, C.; Yu, W.; Chen, S.; Li, B.; Yu, H.; Li, N.; Peng, J.; et al. How Do Urban Residents Use Energy for Winter Heating at Home? A Large-Scale Survey in the Hot Summer and Cold Winter Climate Zone in the Yangtze River Region. Energy Build 2020, 223, 110131. [Google Scholar] [CrossRef]
- Ji, H.; Peng, Y.; Ding, W. A Quantitative Study of Geometric Characteristics of Urban Space Based on the Correlation with Microclimate. Sustainability 2019, 11, 4951. [Google Scholar] [CrossRef]
- Mahphood, A.; Arefi, H. Grid-Based Building Outline Extraction from Ready-Made Building Points. Autom. Constr. 2022, 139, 104321. [Google Scholar] [CrossRef]
- Zhang, Y.; Qin, K.; Bi, Q.; Cui, W.; Li, G. Landscape Patterns and Building Functions for Urban Land-Use Classification from Remote Sensing Images at the Block Level: A Case Study of Wuchang District, Wuhan, China. Remote Sens. 2020, 12, 1831. [Google Scholar] [CrossRef]
- Srivanit, M.; Jareemit, D. Modeling the Influences of Layouts of Residential Townhouses and Tree-Planting Patterns on Outdoor Thermal Comfort in Bangkok Suburb. J. Build. Eng. 2020, 30, 101262. [Google Scholar] [CrossRef]
- Othman, H.A.S.; Alshboul, A.A. The Role of Urban Morphology on Outdoor Thermal Comfort: The Case of Al-Sharq City–Az Zarqa. Urban Clim. 2020, 34, 100706. [Google Scholar] [CrossRef]
- Mendis, T.; Huang, Z.; Xu, S.; Zhang, W. Economic Potential Analysis of Photovoltaic Integrated Shading Strategies on Commercial Building Facades in Urban Blocks: A Case Study of Colombo, Sri Lanka. Energy 2020, 194, 116908. [Google Scholar] [CrossRef]
- Liu, H.; Pan, Y.; Yang, Y.; Huang, Z. Evaluating the Impact of Shading from Surrounding Buildings on Heating/Cooling Energy Demands of Different Community Forms. Build Environ. 2021, 206, 108322. [Google Scholar] [CrossRef]
- Ma, R.; Geng, C.; Yu, Z.; Chen, J.; Luo, X. Modeling City-Scale Building Energy Dynamics through Inter-Connected Distributed Adjacency Blocks. Energy Build 2019, 202, 109391. [Google Scholar] [CrossRef]
- Artmann, N.; Manz, H.; Heiselberg, P. Parameter Study on Performance of Building Cooling by Night-Time Ventilation. Renew Energy 2008, 33, 2589–2598. [Google Scholar] [CrossRef]
- Ye, Y.; Xu, P.; Mao, J.; Ji, Y. Experimental Study on the Effectiveness of Internal Shading Devices. Energy Build 2016, 111, 154–163. [Google Scholar] [CrossRef]
- Bonte, M.; Thellier, F.; Lartigue, B. Impact of Occupant’s Actions on Energy Building Performance and Thermal Sensation. Energy Build 2014, 76, 219–227. [Google Scholar] [CrossRef]
- Beagon, P.; Boland, F.; Saffari, M. Closing the Gap between Simulation and Measured Energy Use in Home Archetypes. Energy Build 2020, 224, 110244. [Google Scholar] [CrossRef]
- Ng, P.K.; Mithraratne, N.; Kua, H.W. Energy Analysis of Semi-Transparent BIPV in Singapore Buildings. Energy Build 2013, 66, 274–281. [Google Scholar] [CrossRef]
- O’Brien, W.; Tahmasebi, F.; Andersen, R.K.; Azar, E.; Barthelmes, V.; Belafi, Z.D.; Berger, C.; Chen, D.; De Simone, M.; d’Oca, S.; et al. An International Review of Occupant-Related Aspects of Building Energy Codes and Standards. Build Environ. 2020, 179, 106906. [Google Scholar] [CrossRef]
- Hyun, J.Y.; Park, B.R.; Kim, N.H.; Moon, J.W. Building Energy Performance of DSSC BIPV Windows in Accordance with the Lighting Control Methods and Climate Zones. Sol. Energy 2022, 244, 279–288. [Google Scholar] [CrossRef]
- Pham, J.V.; Baniassadi, A.; Brown, K.E.; Heusinger, J.; Sailor, D.J. Comparing Photovoltaic and Reflective Shade Surfaces in the Urban Environment: Effects on Surface Sensible Heat Flux and Pedestrian Thermal Comfort. Urban Clim. 2019, 29, 100500. [Google Scholar] [CrossRef]
- Mortezazadeh, M.; Jandaghian, Z.; Wang, L.L. Integrating CityFFD and WRF for Modeling Urban Microclimate under Heatwaves. Sustain. Cities Soc. 2021, 66, 102670. [Google Scholar] [CrossRef]
| Disclaimer/Publisher’s Note: The statements, opinions and data contained in all publications are solely those of the individual author(s) and contributor(s) and not of MDPI and/or the editor(s). MDPI and/or the editor(s) disclaim responsibility for any injury to people or property resulting from any ideas, methods, instructions or products referred to in the content. |
© 2024 by the authors. Licensee MDPI, Basel, Switzerland. This article is an open access article distributed under the terms and conditions of the Creative Commons Attribution (CC BY) license (https://creativecommons.org/licenses/by/4.0/).


 ,
, 


