Article

Impacts of Static Lighting in Confined Spaces on the Circadian Parameters, Alertness, Performance and Well-Being

1
Shanghai Yangzhi Rehabilitation Hospital (Shanghai Sunshine Rehabilitation Center), School of Medicine, Tongji University, Shanghai 201619, China
2
School of Architecture and Urban Planning, Tongji University, Shanghai 200092, China
3
Key Laboratory of Ecology and Energy-Saving Study of Dense Habitat, Tongji University, Ministry of Education, Shanghai 200092, China
*
Author to whom correspondence should be addressed.
Buildings 2024, 14(4), 1115; https://doi.org/10.3390/buildings14041115
Submission received: 15 February 2024 / Revised: 29 March 2024 / Accepted: 8 April 2024 / Published: 16 April 2024
(This article belongs to the Special Issue Indoor Environmental Quality and Human Wellbeing)

Abstract

:
The static lighting condition (SLC) in confined spaces may pose great challenges to the health of long-stay workers, inducing sleep disorders, cognitive decline, and negative emotions such as depression or anxiety. To explore human responses to the SLC (300 lx and 6000 K), 20 young subjects (22.6 ± 1.88 years old) were recruited in the underground confined lab for a week by measuring melatonin, core body temperature (CBT), subjective alertness (KSS score), sleep quality (Pittsburgh Sleep Quality Index, PSQI), Psychomotor Vigilance Task (PVT), Hamilton Depression Scale (HAMD) and Self-rating Anxiety Scale (SAS). The results showed a posterior shift in circadian rhythm after 1 week of confinement, with 0.62 h delay of dim light melatonin onset (DLMO), higher melatonin concentrations in the evening, lower melatonin concentrations at midnight, a day-by-day increase in KSS and CBT at bedtime, but this decreased daily when waking up, with cumulative effects. There was a progressive increase in sleep latency, PSQI scores, response time and scores of subjective emotion scales, meaning worse sleep, performance and emotional state. Due to limited exposure to high-lighting stimuli during the daytime, the initial concentrations of melatonin increased in the evening and decreased before sleep. In confined spaces, active health interventions by dynamic lighting patterns were proposed to safeguard human health and performance.

1. Introduction

The human biological clock is influenced by the natural light and dark cycles and synchronized with the sunrise and sunset [1]. Light is an important circadian rhythm regulator and is sensed by intrinsically photosensitive retinal ganglion cells (ipRGCs) [2,3], as well as rods and cones. They are transmitted through the neural pathways to the suprachiasmatic nuclei (SCN) in the hypothalamus, via the paraventricular nucleus (PVN) and the superior cervical ganglia to the pineal gland, which in turn controls the concentration of hormones such as melatonin and cortisol [4], adjusts core body temperature and subjective alertness, regulates circadian rhythms and sleep–wake cycles [5], and also causes cognitive and psycho-emotional changes [6].
However, in isolated and confined extreme (ICE) environments, such as submarines, underground control centers and Antarctic research stations during the polar night, where daylight is lacking [7], the artificial lighting is always static, with the same illuminance and color temperature and lacking dynamic changes. It is difficult for people to sense the changes in time, which may lead to health problems such as circadian rhythm disturbances and sleep disorders. As confined time increases, sleep latency and reaction time gradually increase, and sleep quality and cognitive ability may gradually deteriorate [8,9]. As the period of people’s biological clock is about 24.2 h, the circadian phase may shift backwards gradually [10,11]. The “Mars 500” project conducted a simulated Mars travel experiment on six subjects for 520 consecutive days and found that the ratio of sleep and rest time increased, and showed changes in their sleep–wake cycles and poorer sleep quality, cognitive performance and mood states [12,13]. In the “Moon Palace 365” experiment, Liu H [14] found the delay trend of the peak urinary melatonin concentrations in four subjects and suggested the use of dynamic lighting to simulate daylight for active interventions on physical and mental health. Sleep and waking times were gradually delayed in people living in underground caves for long periods, but a sleep–wake cycle of around 24 h was maintained [15]. A higher rate of insomnia, drowsiness and sleep disturbance was observed among those working in the underground compared to workers with access to daylight on the ground [16]. Office workers in the windowless spaces showed higher PSQI scores and poorer sleep than those in the windowed rooms [17]. It was evident that the lack of daylight in the confined spaces has detrimental effects on human hormonal rhythms, sleep quality and cognitive performance.
What is more, confined spaces are relatively closed and depressing, with less contact with the outside world and a lack of affectionate care and social activities, exacerbating the risk of negative emotions such as depression and anxiety, causing poorer cognitive performance in operational ability and memory [18], even accidents [19,20]. Similar to the polar night period at Antarctic research stations, prolonged lack of daylight would lead to the disturbance of circadian rhythms, delayed rhythmic phases and poor sleep quality [21,22], triggering Winter-over Syndrome and Polar T3 Syndrome [23,24,25,26], including feelings of isolation, cognitive decline, interpersonal tension, seasonal affective disorder [27], increased tension and anxiety [28]. In addition, the significant reduction in outdoor exposure to daylight during the pandemic control for COVID-19 induced delays in sleep duration, reduced sleep quality, and resulted in the deterioration of physical and mental health. It was recommended to receive as much daylight stimulation as possible during the daytime to mitigate the negative effects of the social restrictions [29,30,31,32].
In addition, the prevalence of shift work schedules in confined spaces has led to sleep deprivation and exacerbates sleep disorder problems [33]. Inappropriate lighting stimulation during shift work predisposed workers to difficulties in falling asleep, sleep deprivation [34], deterioration of mood [35,36], increased metabolic stress on the heart, and loss of short-term memory [37]. It was also associated with increased body weight/BMI, risk of obesity and reduced glucose tolerance [38,39], predisposing workers to cardiovascular diseases such as coronary heart disease and stroke [40]. Wang F. et al. [41] found that the risk of breast cancer increased by 3% with every 5-year increase in night shift work. And exposure to bright light at night or the use of electronic devices would negatively affect sleep and circadian rhythms [42]. So there was a need for integrative lighting that took both physical and psychological needs into account [43].
The current lighting environment in confined spaces was mostly designed according to traditional functional lighting requirements, mainly to meet visual needs, with fixed illuminance, single correlated color temperature (CCT) and static lighting scenes, making it difficult to meet the needs of emotion, circadian rhythm and elimination of sensory deprivation. To understand the cumulative effects of lighting on human sleep, circadian rhythm, emotion and cognition in confined spaces, this study conducted a continuous confined experiment in an underground laboratory for a week and a static lighting pattern was used to simulate the current lighting situation. A series of human responses were monitored, including the melatonin concentration at night, subjective sleepiness (KSS scores) and CBT during the morning and evening, daily PSQI scores, sleep quality indicators (sleep latency, number of awakenings and sleep efficiency), PVT tests (response time and errors), and changes in emotional states.

2. Materials and Methods

2.1. Participants

Since most workers in the confined spaces were male, there was an influence of female physiological factors on the melatonin secretion pattern, as the experimental period was long [44]. Young males of similar age were selected as experimental subjects in this study to reduce the influence of gender and age. Due to the limited space in the laboratory, 20 male subjects were finally selected to participate in the experiment, and a repeated-measures experimental design was used to reduce the effects of individual differences. The subjects were all university students, aged 22.6 ± 1.88 years old. Their body mass indexes (BMIs) were 23.74 ± 3.32 and they had normal corrected visual acuity, good health, regular work and rest, without smoking or alcohol abuse.
This study was approved by the Medical and Life Sciences Ethics Committee of Tongji University (No. 2021tjdx069), and all the participants signed an informed consent form and were financially compensated for participation.

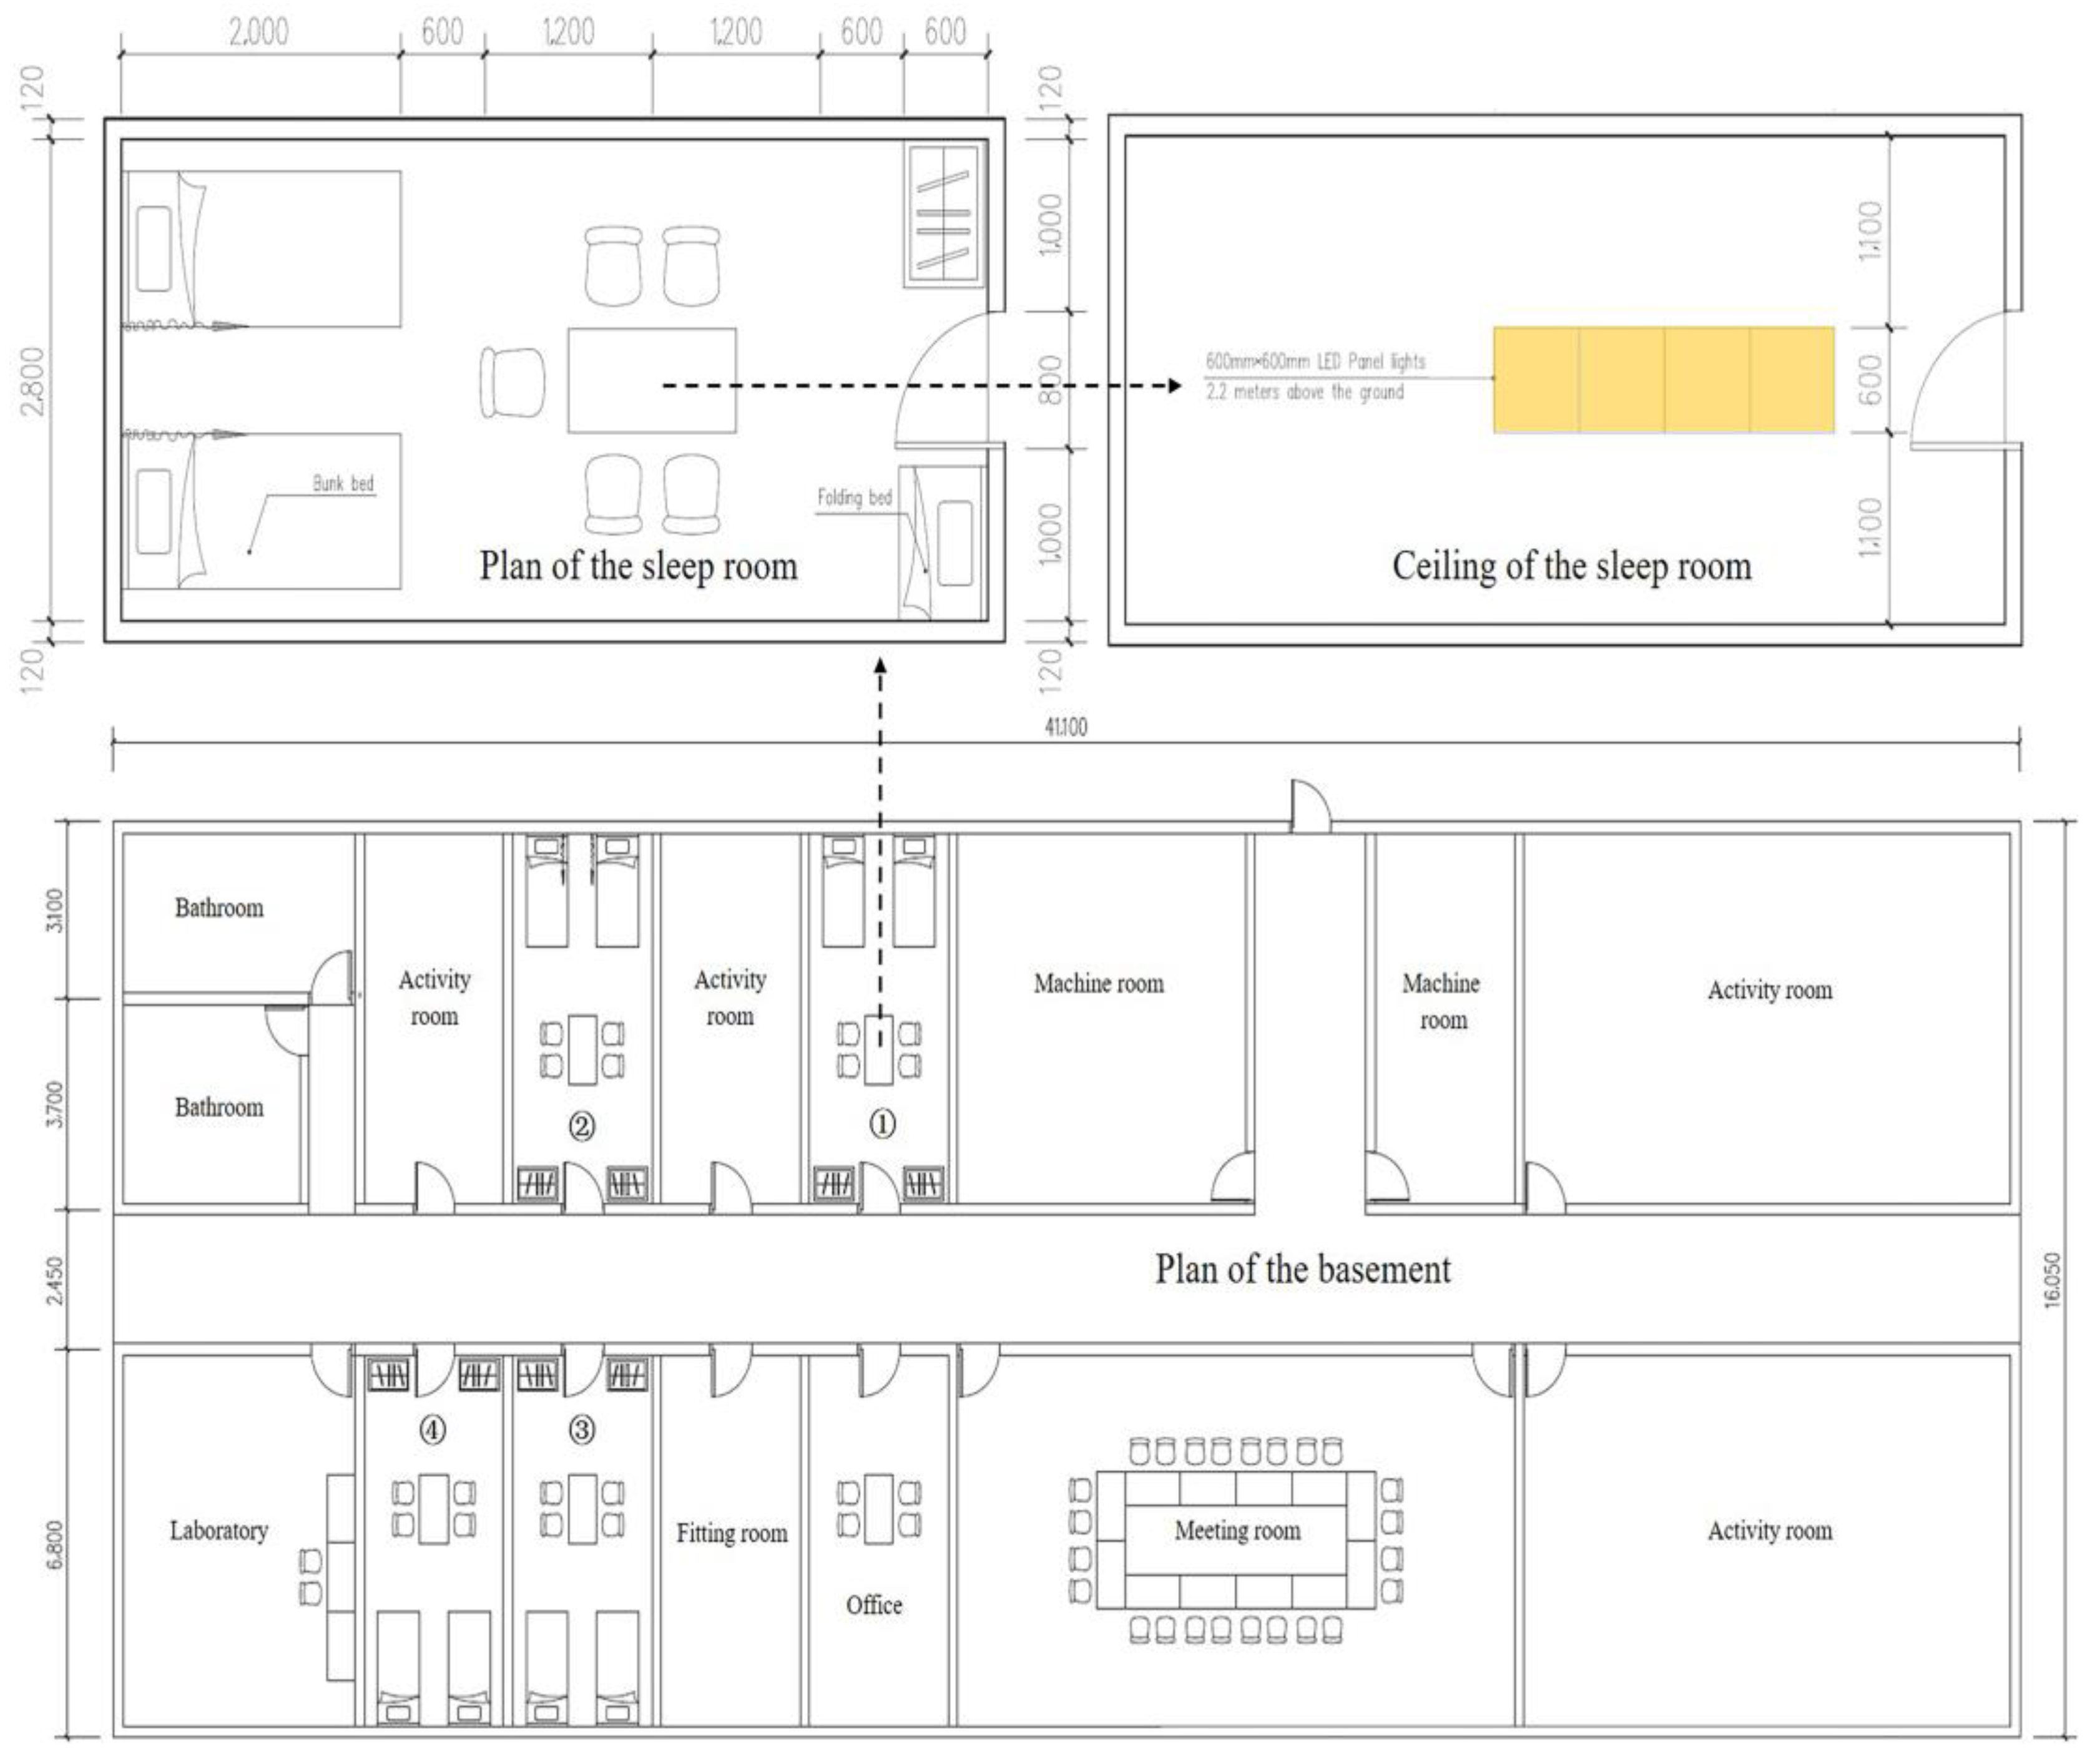
2.2. Experimental Setup

The laboratory was converted from a basement to simulate the ICE environment. Four rooms were transformed into sleep rooms for lighting intervention and equipped with a central air-conditioning and ventilation system to maintain the consistency of temperature, humidity, and air quality in different rooms (Figure 1). In addition, the underground laboratory was not affected by daylight or outdoor noise. Each room can accommodate five people and is furnished identically, with four dimmable LED panel lights installed directly above the table. The subjects worked in a fixed position and slept on the same bed each day. They could spend their afternoons in the activity room and gym, or the conference room for group activities. In addition, there were supporting facilities such as a laboratory room, office, machine room, lavatories and toilets, which were able to meet the needs of daily life over a long period.

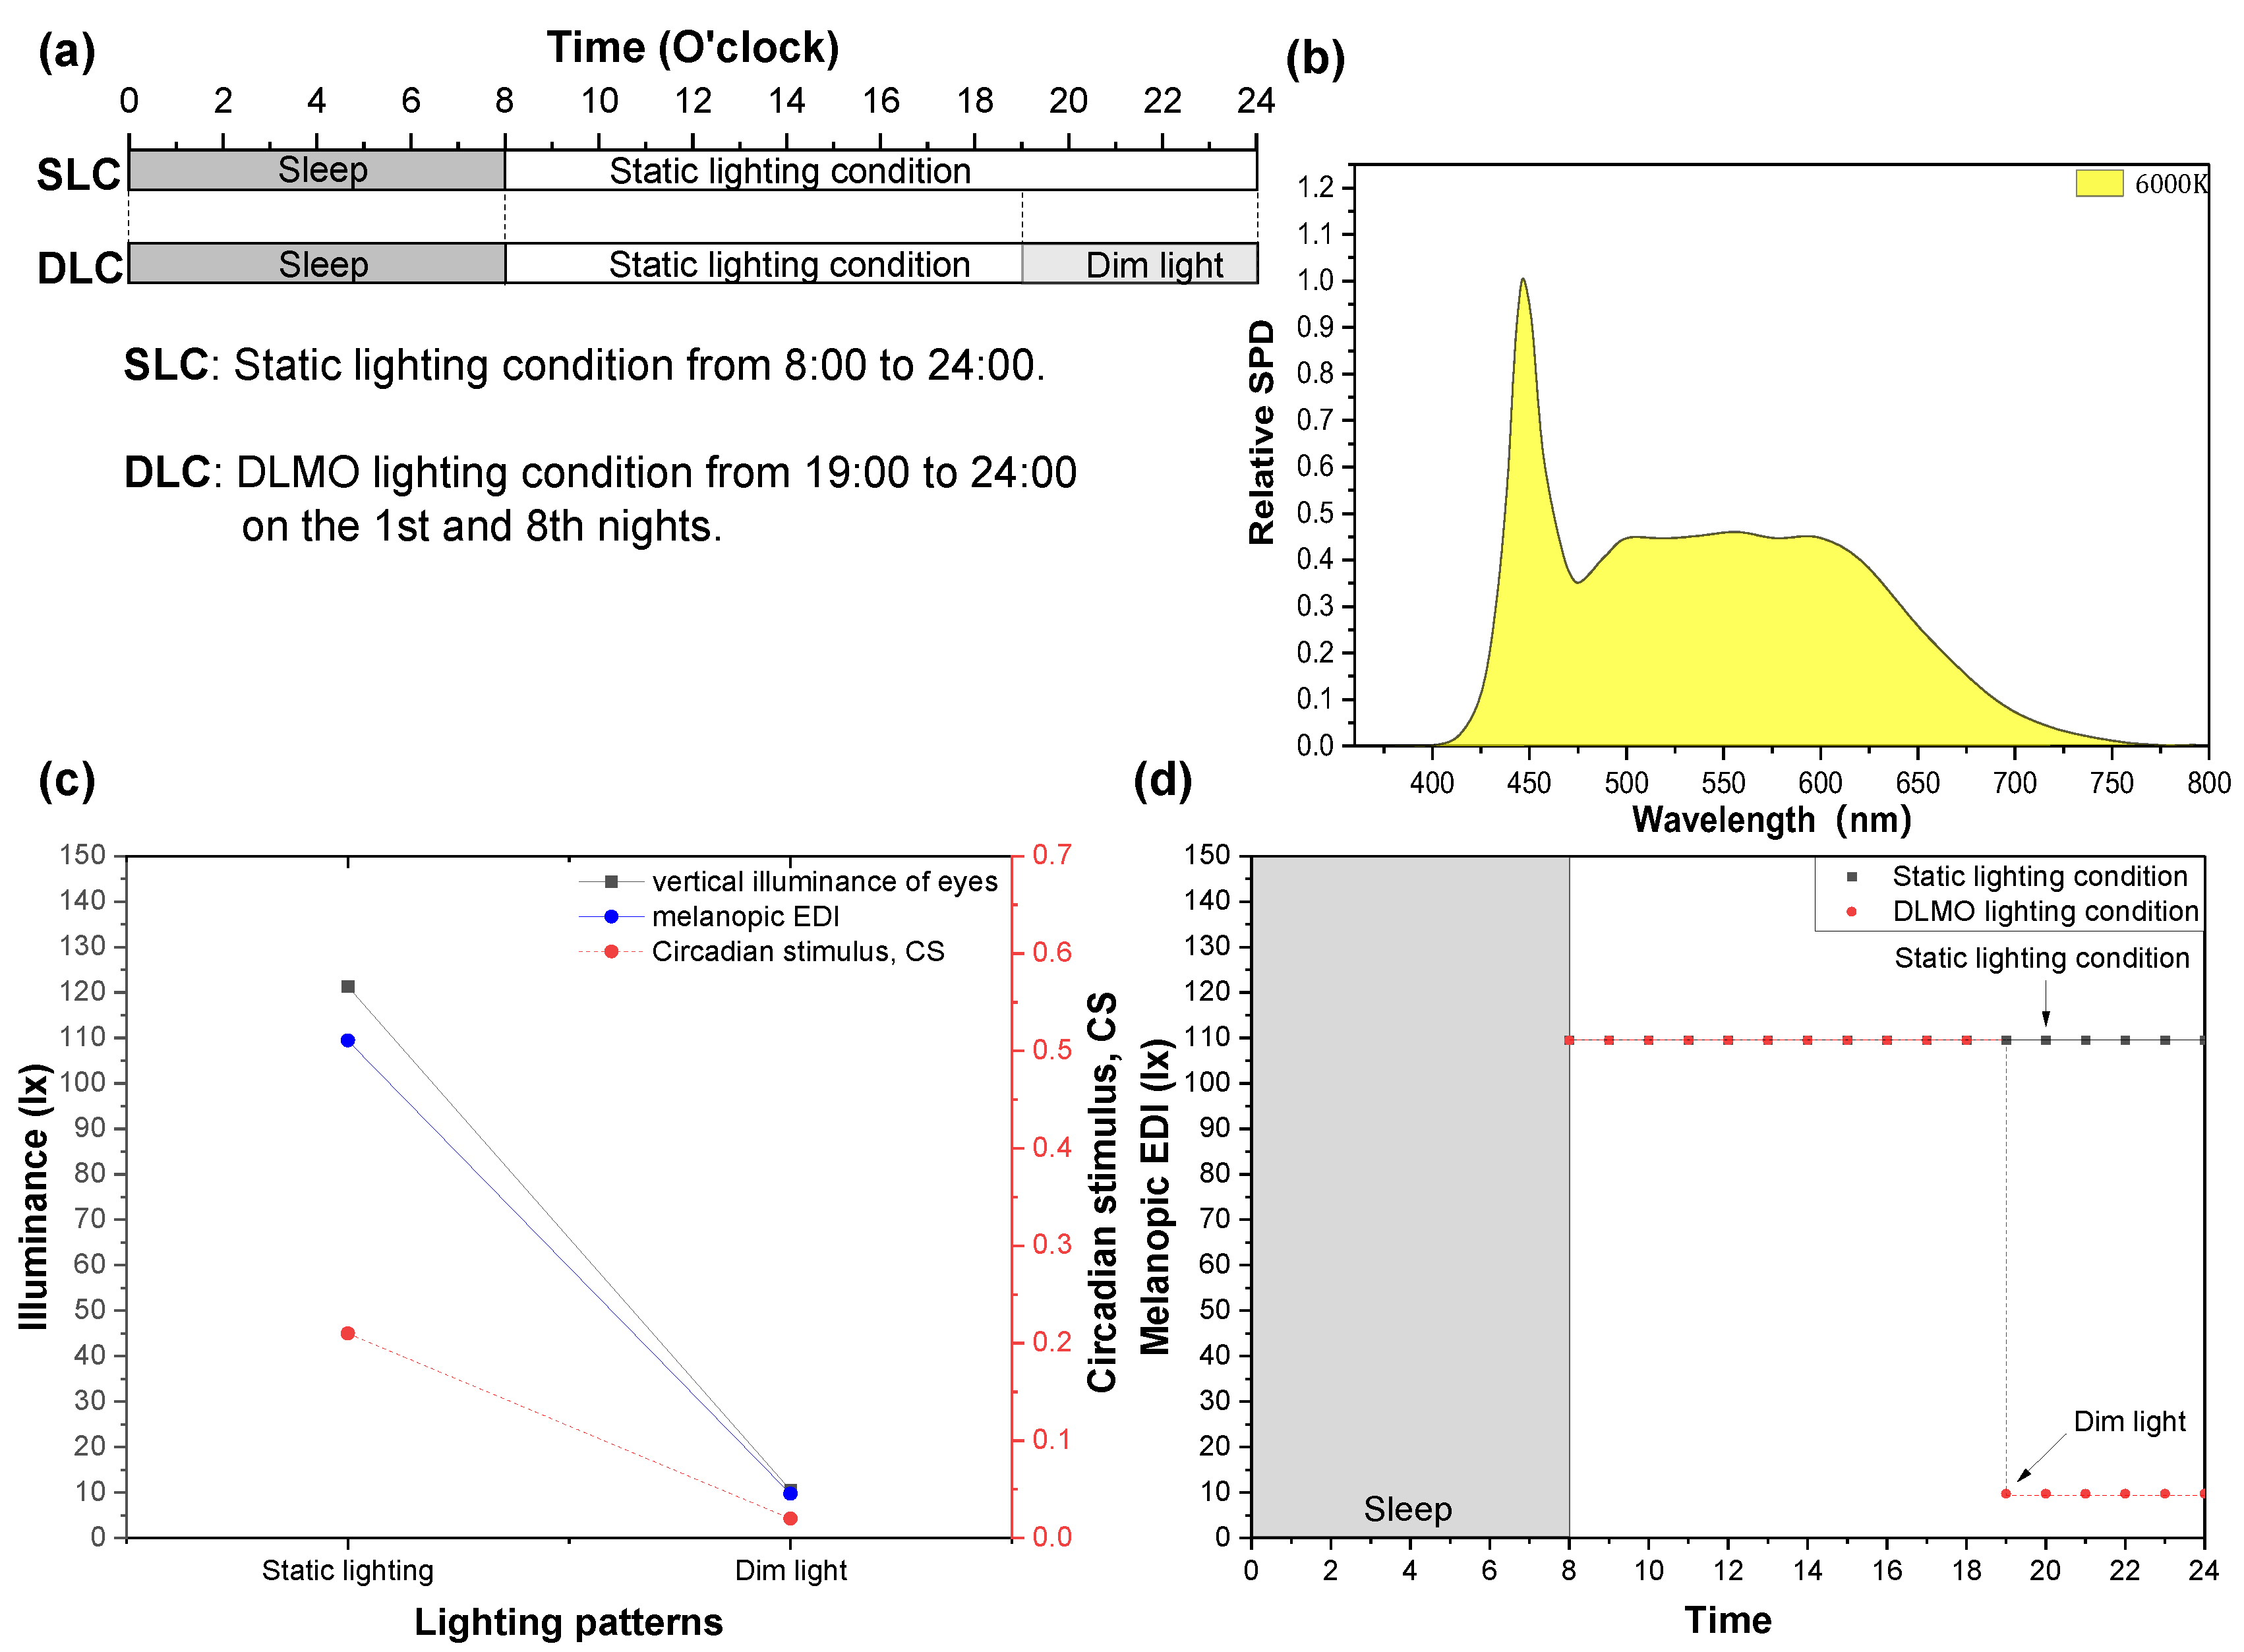
2.3. Light Treatment

According to the current lighting situation in the underground space and the relevant lighting design standards [45], the static lighting condition (SLC) was targeted with a common CCT of 6000 K and a horizontal illuminance of 300 lx on the desks of the sleep room (Figure 2a,b). The actual average vertical illuminance of the eyes was 121.38 lx, the melanopic equivalent daylight illuminance (melanopic EDI) was 109.45 lx and the circadian stimulus (CS) was 0.21. The same color temperature and horizontal illuminance of the desktop were used in the meeting room and activity rooms, except that the lamps were not dimmable or color-adjustable.
As a marker of the circadian phase, dim light melatonin onset (DLMO) was a useful method for evaluating the delayed or advanced phase of human rhythms [46]. It needed to be measured in dim light (less than 30 lx), as exposure to light will cause a decrease in melatonin levels [47,48]. The DLMO lighting condition (DLC) was used from 19:00 to 24:00 on the nights of the 1st and 8th days, reducing the horizontal illuminance on the table to less than 30 lx, with an average vertical illuminance at the eyes of 10.61 lx (melanopic EDI = 9.75 lx, CS = 0.02) to minimize the disturbance of sleep and circadian rhythm (Figure 2c,d).
The horizontal illuminance in the sleep rooms was averaged by the grid method of measurement on the tables at a height of 0.75 m above the floor. The mean value of the vertical illuminance at the eyes’ position in the direction of the subject’s sight when sitting was taken as the illuminance at the eyes. The measurements were carried out with an Illuminance Spectrophotometer (CL-500A, KONICA MINOL, JPN). Field measurements were taken at 4 points around the table where people were sitting in each room. The melanopic EDI, Circadian stimulus (CS) and Circadian Light (CLA) were calculated at each point and finally averaged. The results of the specific lighting parameters obtained from the measurements are shown in Table 1.

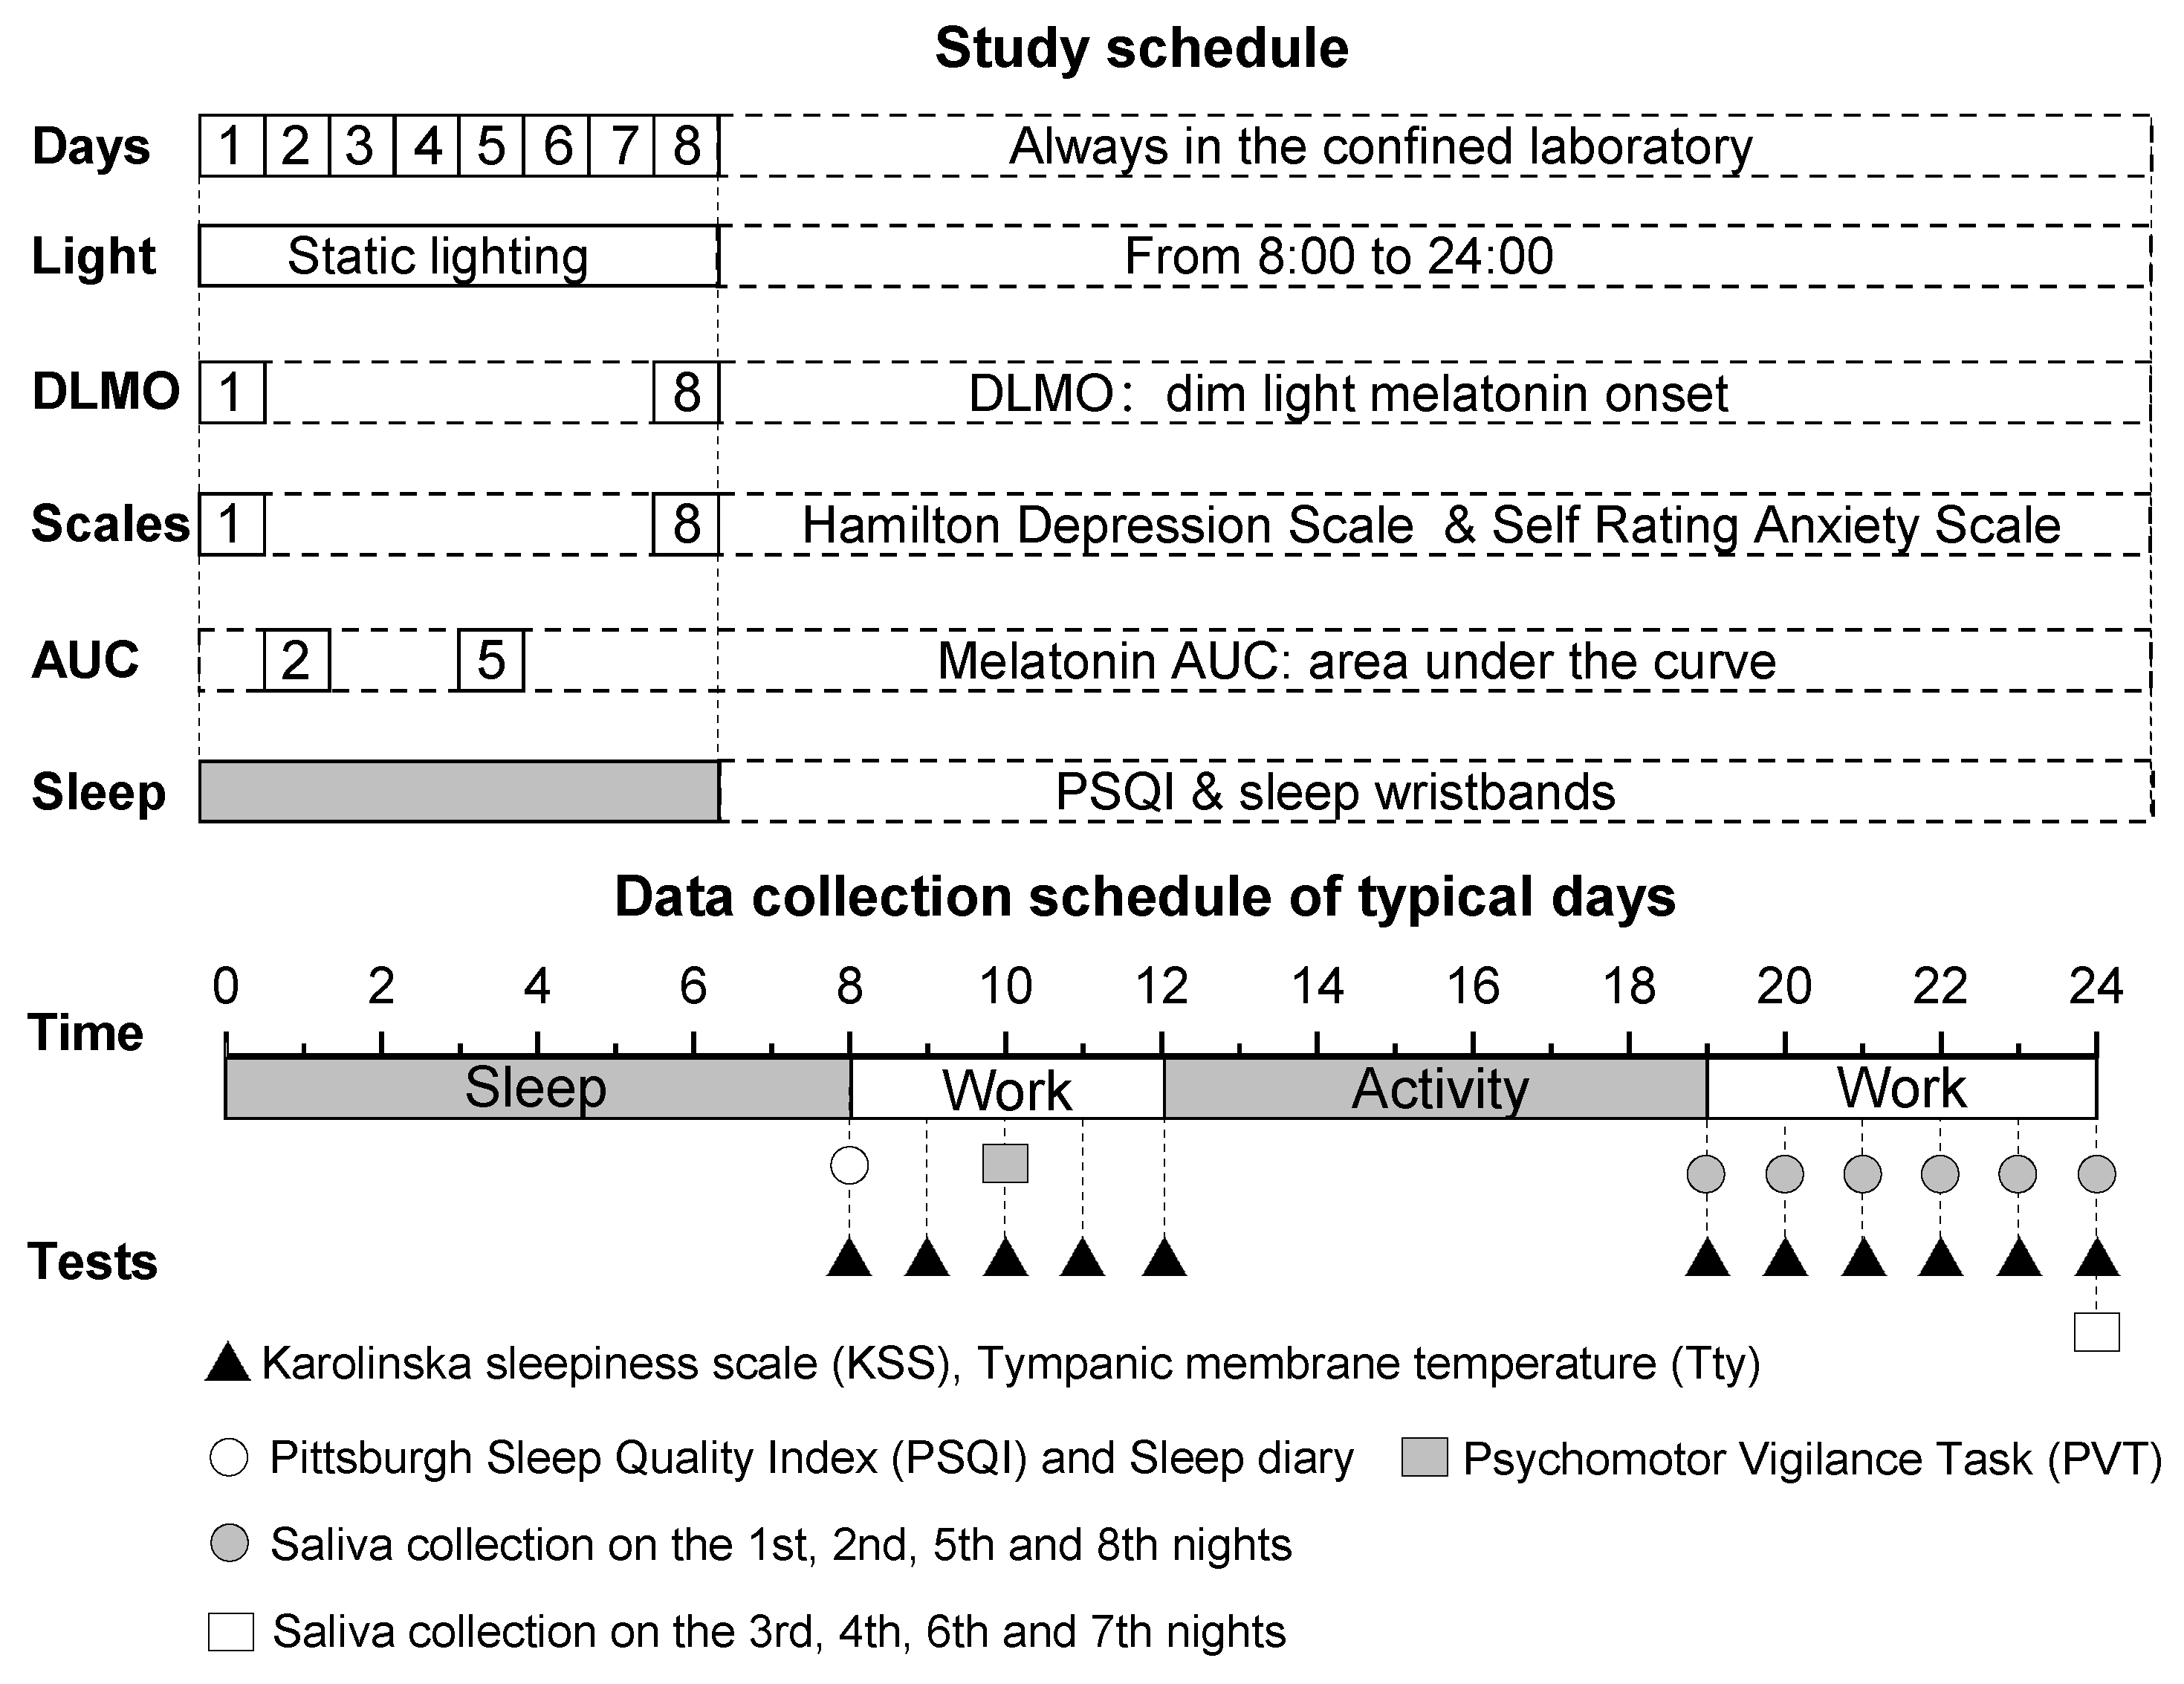
2.4. Experimental Protocol

To guarantee a regular schedule, the subjects started wearing sleep bracelets (Huawei B4 Pro) one week before the experiment. During the experiment, the subjects had a uniform diet and were not allowed to consume food containing alcohol or coffee to avoid disturbing their sleep.
Considering that people may not be used to unfamiliar environments which can interfere with sleep, for the 3 days before the experiment, they were free to enter and leave the confined laboratory, sleeping in the laboratory at night to acclimatize and moving freely during the daytime to be familiarized with the environment and the beds. After entering the underground laboratory at 15:00 on the first day, they were not allowed to go outside or receive daylight until the end of the experiment. During the 8 days, a static lighting pattern was used to simulate the current lighting situation. They got up at 8:00 and started working at 9:00. They could use computers to simulate office work in the morning, ending at 12:00, and were free to move around in the afternoon. Work started from 19:00 to midnight again. They could not use electronic devices, such as mobile phones or computers, only reading and writing assignments in the evening. Finally, they went to bed immediately after finishing work at 24:00 (Figure 3).
To evaluate the changes in circadian rhythms, salivary melatonin concentrations were measured hourly in the dim lighting pattern from 19:00 to midnight on the 1st and 8th nights to calculate the timing of DLMO. The hourly melatonin was also collected on the 2nd and 5th nights to evaluate the changing trends of melatonin in the static lighting pattern and the area under the curve (AUC) [49]. Saliva was collected at 24:00 on the 3rd, 4th, 6th and 7th nights to measure the melatonin concentrations at midnight. The HAMD and SAS scales were completed on the 1st and 8th nights to evaluate the emotional changes during the confinement. Subjects completed the PSQI and a sleep diary each morning immediately upon awakening, and a five-minute PVT test was administered at 10:00. CBT and KSS were measured every hour from 8:00 to 12:00 and 19:00 to 24:00 each day to evaluate the changes in alertness and arousal.

2.5. Testing Methods

2.5.1. Subjective Variables

The Karolinska Sleepiness Scale (KSS) is a subjective sleepiness score from 1 to 9, with higher KSS scores indicating greater sleepiness [50]. The KSS scale was completed every hour from 8:00 to 12:00 and 19:00 to 24:00 every day to evaluate the changes in subjective alertness.

2.5.2. Tympanic Membrane Temperature (Tty)

Tty is a good indicator of core body temperature (CBT) and easily measured [51]. In parallel with the KSS, CBT was measured on the same side of the ear with a Braun infrared electronic ear thermometer (IRT6520, accuracy 0.1 °C). Measurements were also taken hourly, for a total of five times, from 8:00 to 12:00, and six times from 19:00 to 24:00.

2.5.3. Melatonin

The saliva was collected every night at 24:00 to measure melatonin concentration at bedtime and collected hourly from 19:00 to 24:00 on the 1st, 2nd, 5th and 8th nights to evaluate changes in melatonin during the 5 h before bedtime. A dim lighting environment was used starting at 19:00 on the 1st and 8th nights, respectively, and saliva was collected hourly to measure melatonin concentrations and calculate the time of the DLMO to evaluate the circadian rhythm phase [52]. Similar to the measurements of DLMO, the hour-by-hour melatonin concentrations were measured on the 2nd and 5th nights, respectively, with the static lighting pattern to calculate the melatonin area under the curve (AUC) [24]. And saliva was collected at the end of lighting (24:00) on the remaining nights to evaluate the changes in melatonin concentration when the subjects went to sleep. It was collected with saliva collection tubes and centrifuged. A total of 1 mL of supernatant was stored in a cold refrigerator (−40 °C) [44,53]. The saliva ELISA kit from IBL International GmbH was used for the analysis by a professional biological company (Wayen Biotechnologies (Shanghai), Inc., Shanghai, China). The range of the salivary melatonin assay was 0–50 pg/mL. Its intra-assay coefficient of variation (CV) was less than 10.8% and the inter-assay CV was less than 13.0%.

2.5.4. Sleep Quality

Smart sleep wristbands (Huawei B4 Pro, Huawei Technologies Co., Ltd., Shenzhen, China) were worn by the participants and recorded the time of falling asleep and waking up each day. The Pittsburgh Sleep Quality Index Questionnaire (PSQI) [54,55] was completed immediately after waking up each day to subjectively evaluate sleep quality. In terms of objective indicators, the number of awakenings and time of falling asleep were recorded in the sleep diary. Then, sleep latency and sleep efficiency (time spent asleep as a percentage of total time in bed) were calculated.

2.5.5. Cognitive Performance

To evaluate the subjects’ cognitive and operational performance, the Psychomotor Vigilance Task (PVT) [56] was used. The PVT was administered for five minutes at 10:00 each day with an iPad, measuring the reaction time (in milliseconds) between the time the subject saw the number flash and the time he clicked on the screen. If the screen was tapped earlier than the number flashed, it was recorded as an incorrect action. The final mean reaction time and the number of errors over the five minutes were derived to evaluate changes in the subjects’ cognitive performance. Subjects underwent task familiarization and trials to reduce the effects of proficiency before the formal experiment.

2.5.6. Emotional State

The Hamilton Depression Scale (HAMD) was the most commonly used scale to assess depressive status in clinical practice, with higher scores indicating higher levels of depression in the subject. And the Self-rating Anxiety Scale (SAS), an internationally used psychological scale, can better reflect the subjective feelings of people with a tendency towards anxiety, with higher scores on the scale indicating more severe anxiety. To assess changes in the subjects’ emotional state in the prolonged confined space, subjective questionnaires were administered on the 1st and 8th nights of the experiment by the HAMD and SAS.

2.6. Data Statistics and Analysis Methods

Based on the experimental design of repeated measures, the Shapiro–Wilk (S–W) test was used to test the normal distribution. As melatonin concentration, AUC and DLMO were not normally distributed, Friedman’s Analysis of Variance (ANOVA) was used. Then the Wilcoxon signed-rank test was used to determine if the difference between days was significant [53]. For the discrete variables, such as KSS, PSQI, HAMD, SAS scores, number of awakenings and errors, the same non-parametric analyses were also used. For continuous variables which were normally distributed, such as CBT and sleep latency, the one-way repeated-measures ANOVA and paired t-test were used. The statistical analysis software was IBM SPSS Statistics 23.0, and p < 0.05 indicated that the differences were significant.

3. Results

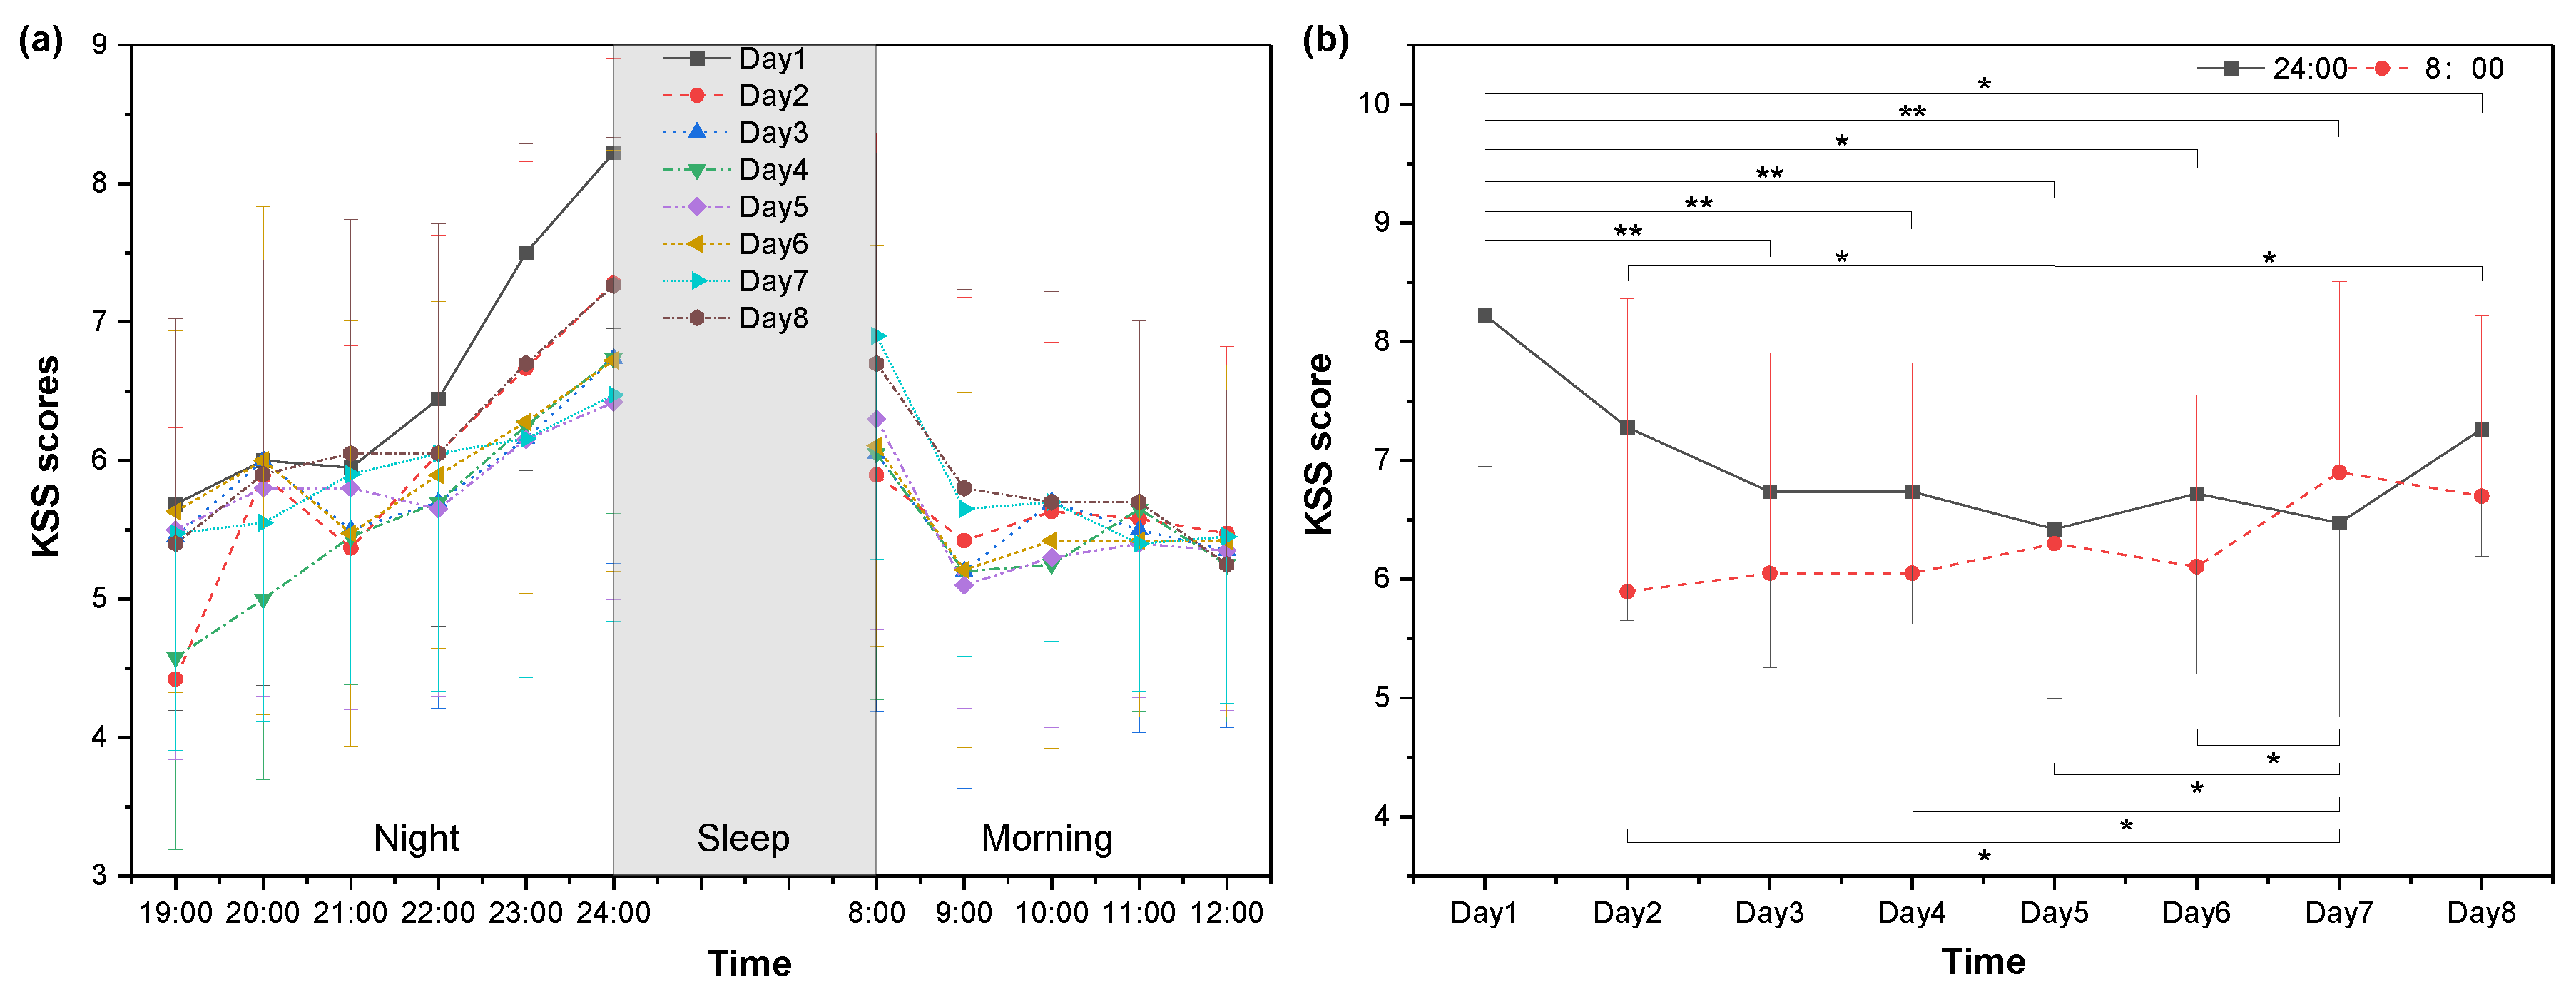
3.1. Subjective Sleepiness

Under the static lighting pattern, the KSS scores showed a general upward trend during the evening (5 h before bedtime), with the highest level of sleepiness at 24:00 and a lower level of sleepiness upon awakening at 8:00, after which they gradually decreased to a stable level during the daytime (Figure 4a). Since the dim lighting pattern during the first and eighth nights provided minimal lighting stimulation, KSS scores remained consistently high and rose the most. KSS scores at 24:00 before sleep from the third night to the eighth night were significantly lower than that of the first day. In particular, the nighttime light environment on the eighth day was the same as the first day, but the KSS score at bedtime was still significantly lower (p = 0.021) and alertness was significantly decreased (Figure 4b). Even with a static lighting pattern, KSS scores at 24:00 showed a general decreased trend. The scores on the fifth day were significantly lower than the second day (p = 0.030). The results suggested that sleepiness before sleep decreased as the number of days increased. The trend of sleepiness after waking up was the opposite, with KSS scores at 8:00 showing a day-by-day increase, and the seventh day was significantly higher than the second, fourth, fifth and sixth days. The level of sleepiness after waking up gradually increased, coinciding with the trend of a backward shift in circadian rhythm.

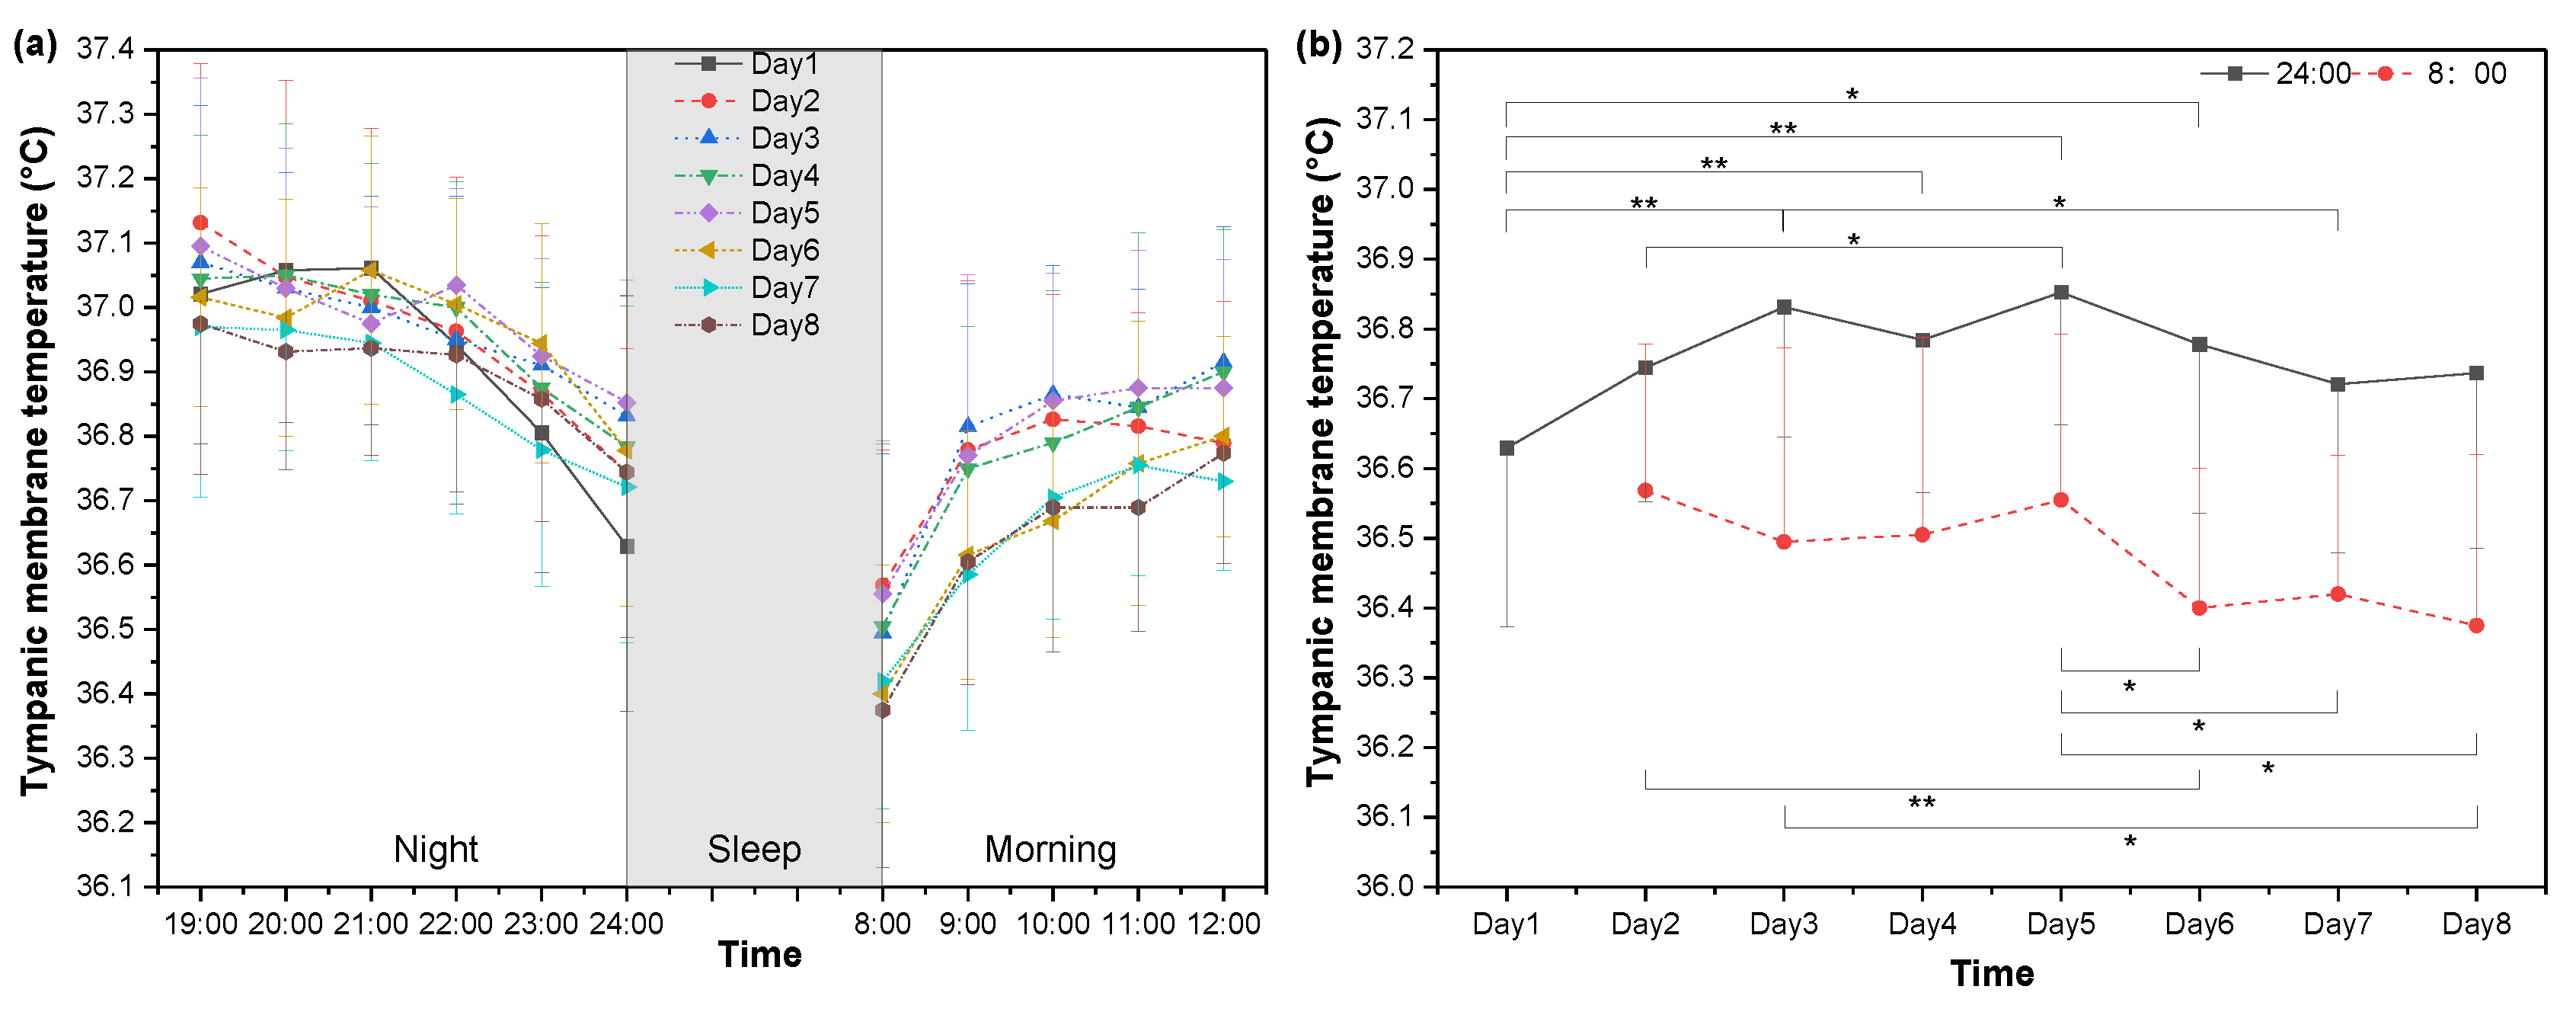
3.2. Core Body Temperature

Core body temperature (CBT) reflected the level of arousal and showed the opposite trend of the KSS scores characterizing sleepiness [57,58]. CBT decreased overall during the evening and gradually increased to a stable level during the daytime upon awakening in the morning (Figure 5a). Figure 5b shows that the first day had a significantly lower CBT at 24:00 than the third to sixth days, and the fifth day was significantly higher than the second day (p = 0.011). The CBT at bedtime gradually increased with the number of days of confinement and began to show a decreasing trend from the fifth day. The CBT when waking up showed a trend of decreasing overall, with the sixth, seventh and eighth days being significantly lower than the fifth day (p < 0.05), the sixth day significantly lower than the second day (p = 0.005) and the eighth day significantly lower than the third day (p = 0.043). It indicated a gradual decrease in arousal levels after waking up as confined time increased, also confirming the trend of a backward shift in the rhythm phase.

3.3. Melatonin

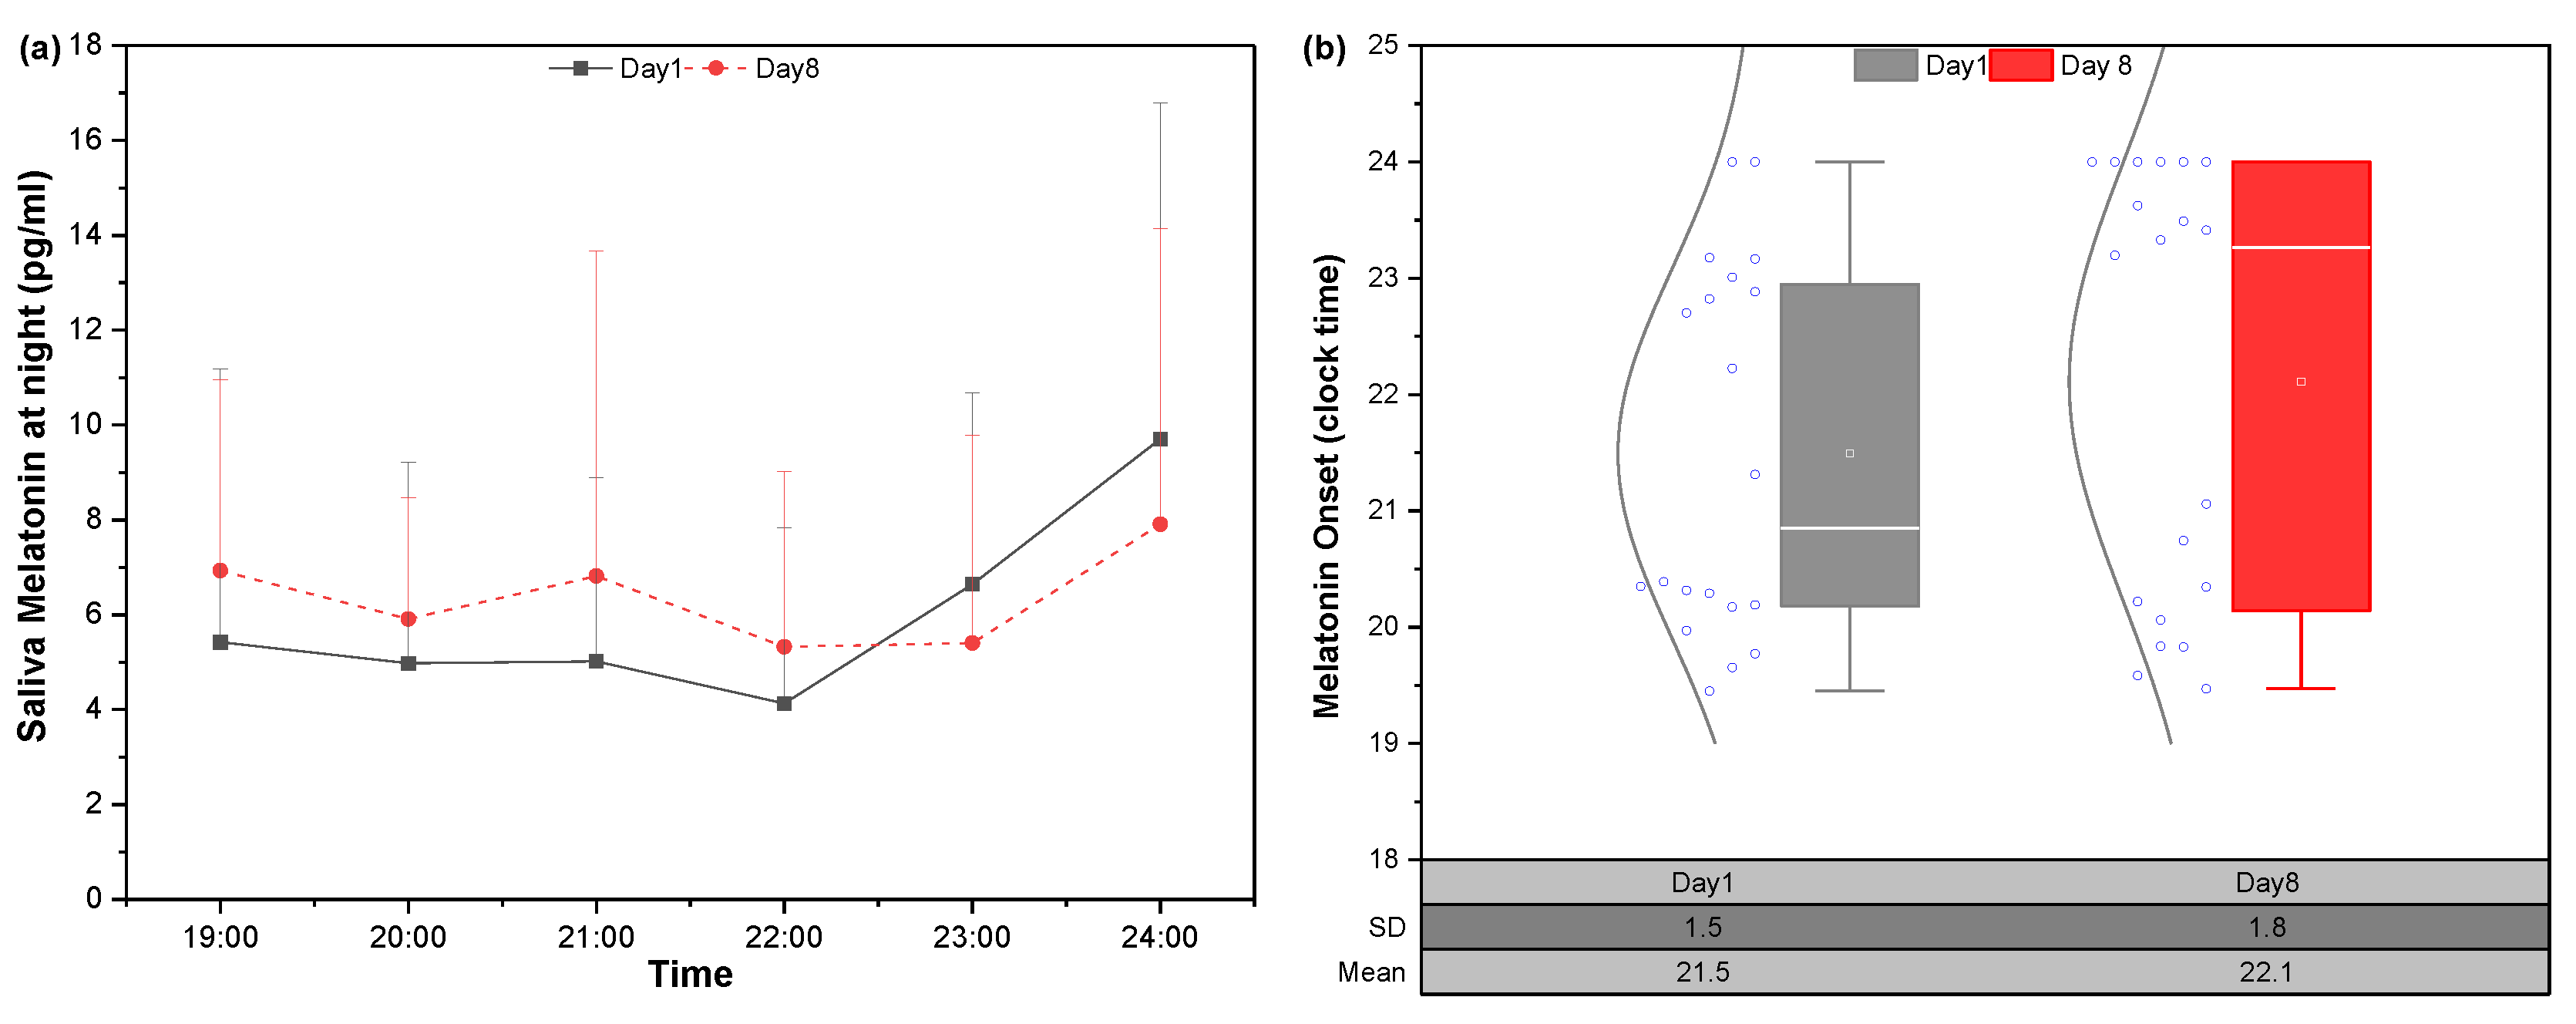
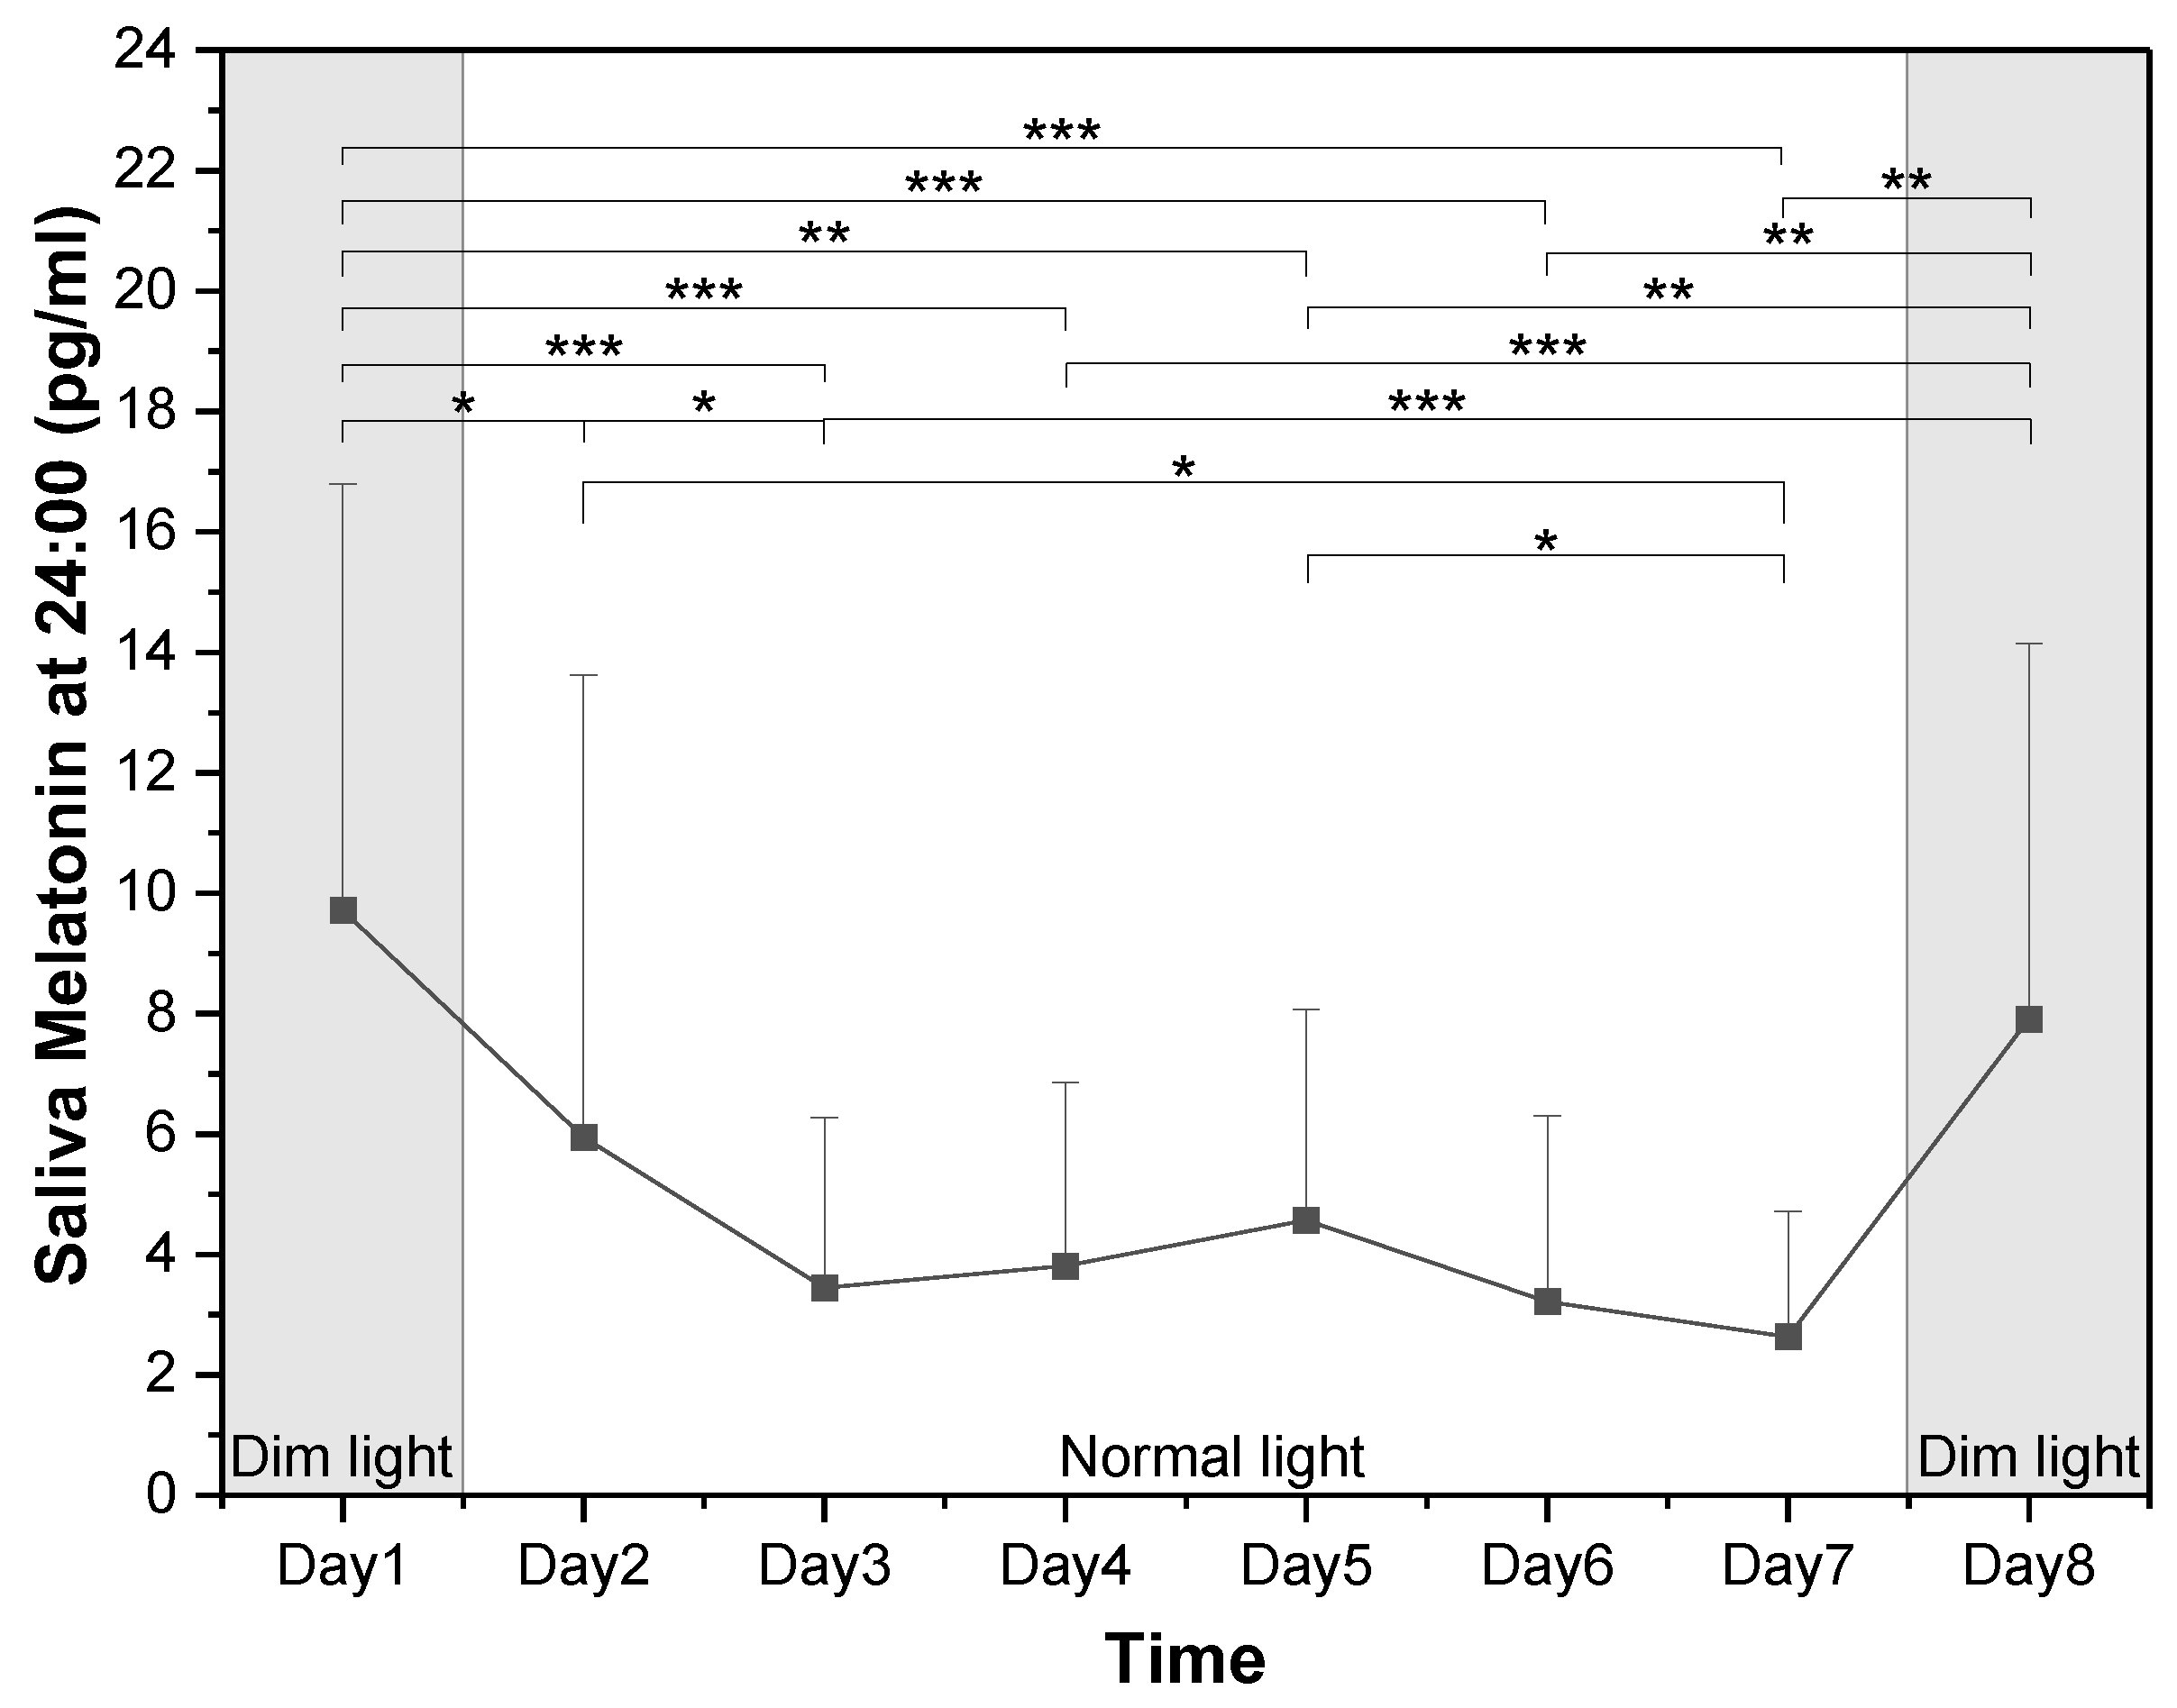
3.3.1. Salivary Melatonin and DLMO Changes in Dim Lighting Condition

Since melatonin concentrations in saliva are lower than in the blood [59], studies used a fixed threshold of 3 pg/mL [60,61] or 4 pg/mL [62] to calculate the DLMO time with salivary melatonin. However, melatonin concentrations varied greatly between subjects because of individual differences, and some individuals showed consistently lower concentrations that could not reach these fixed thresholds, so relative thresholds are used for calculation [63]. The average concentration at the beginning of the first 2 h (19:00, 20:00 and 21:00) was set as the relative threshold for DLMO calculation [52], and it was used for DLMO. If the time when the melatonin concentration was higher than the relative threshold did not occur during the evening, the moment of the final hour (24:00) was set as the DLMO [64].
Figure 6a shows a general upward trend in melatonin concentrations at night. The initial concentration on the eighth day (19:00) was higher than the first day (p = 0.100), but the increasing trend occurred much later and melatonin concentrations at bedtime were lower than the first day (p = 0.191). After 1 week of confinement in the static lighting pattern, the time of DLMO was relatively delayed by 0.62 h (Figure 6b) and the rhythm phase showed a trend of backward shift, but not significantly (p = 0.295).

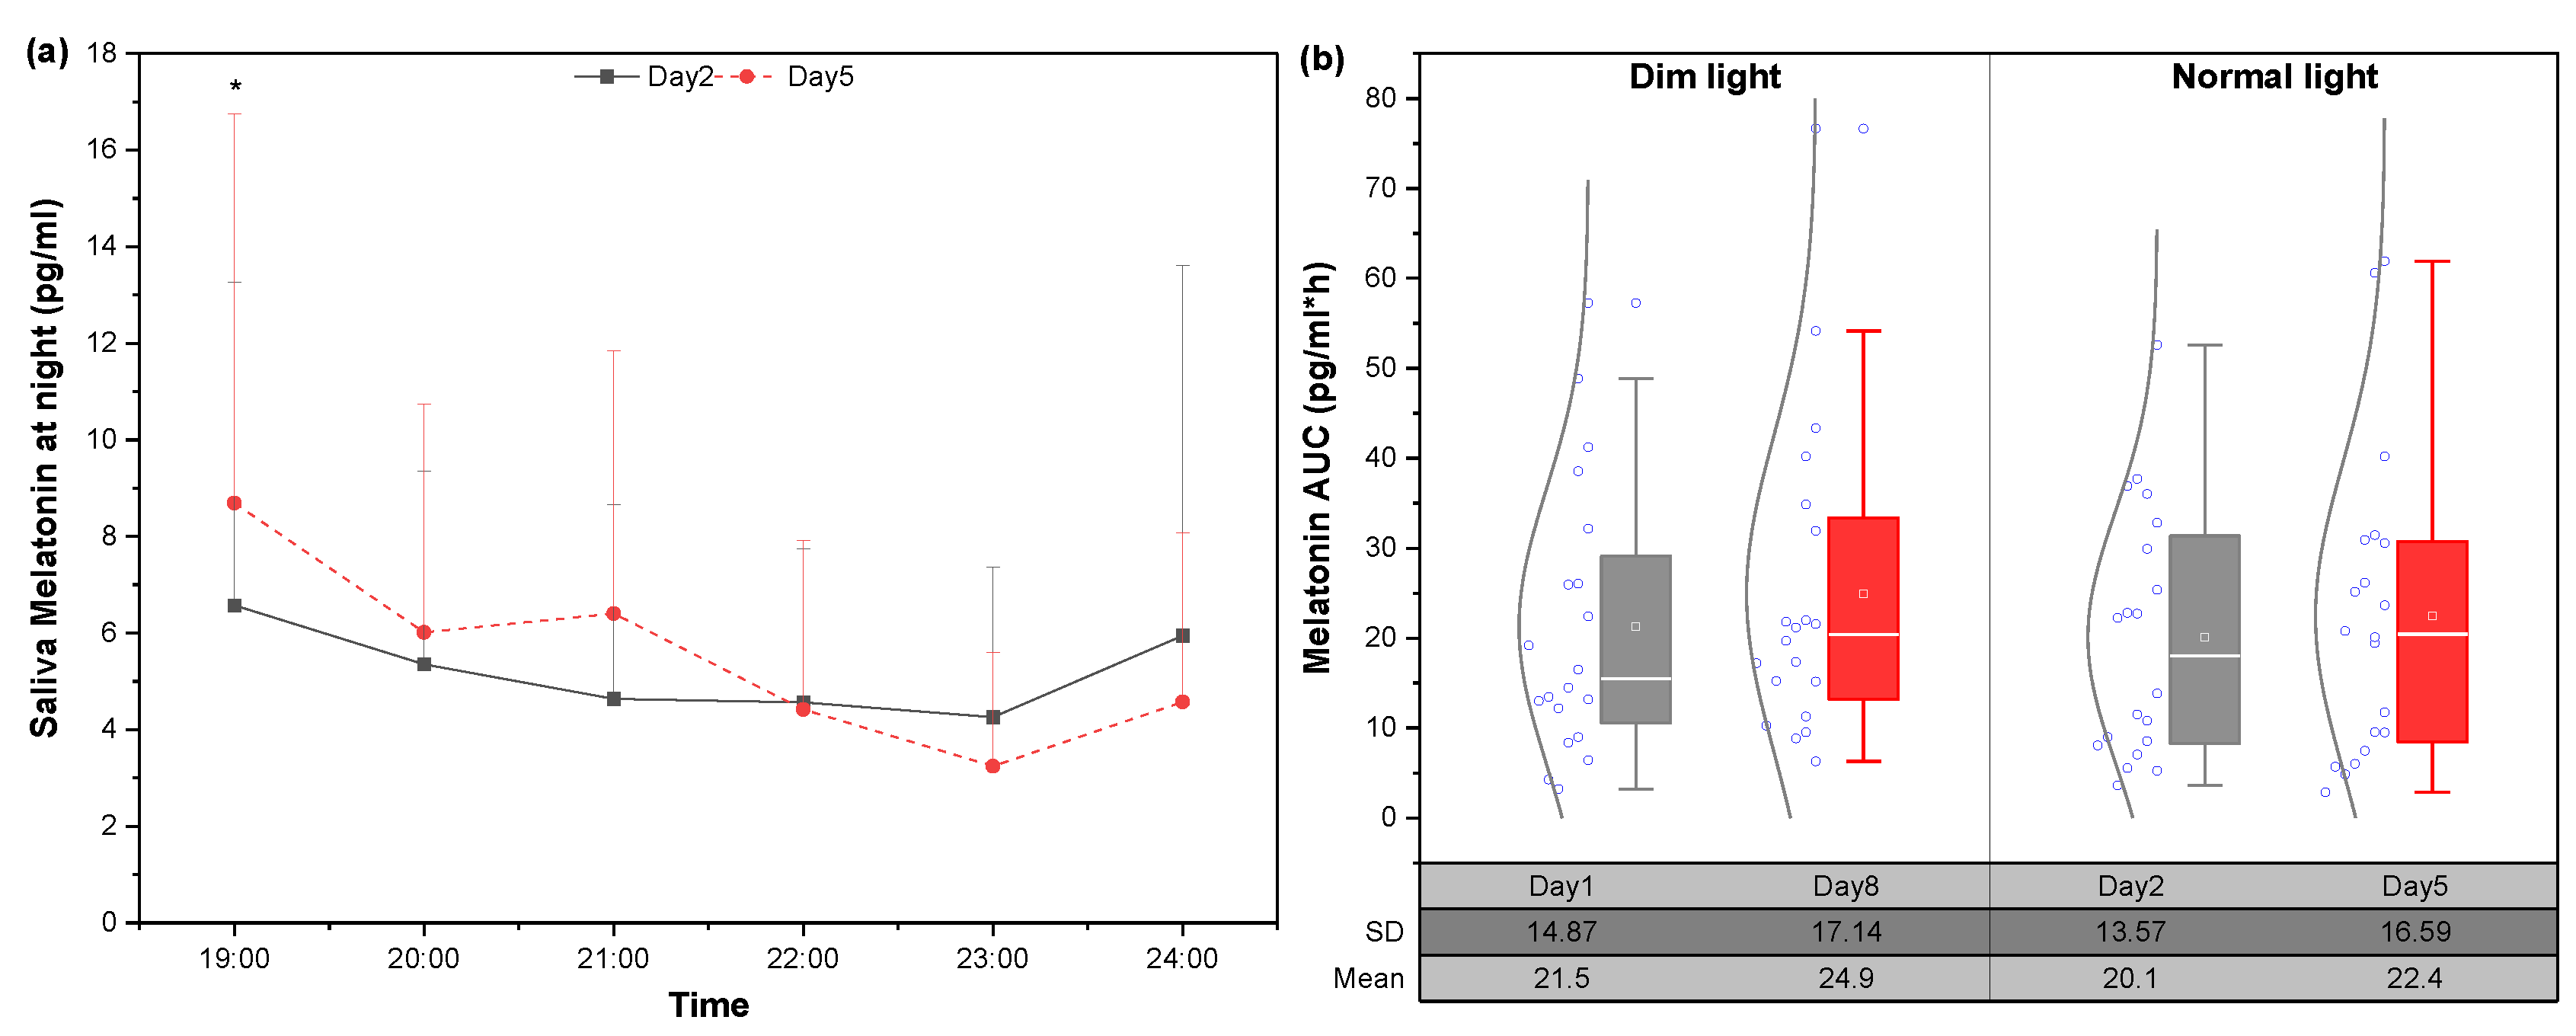
3.3.2. Changes in Melatonin under Static Lighting Conditions

Under the static lighting pattern, melatonin concentrations at night showed a pattern of decreasing and then increasing, indicating that there was a relationship between the normal secretion of melatonin and the inhibitory effects of lighting. Figure 7a shows that melatonin concentrations on the second and fifth days under normal lighting were relatively lower than those on the first and eighth days under dim lighting. After 4 days of confinement, the initial concentrations at 19:00 of the fifth day were significantly higher than the second day (p = 0.038), but the melatonin concentrations were lower before sleep (p = 0.370). The time of melatonin onset appeared later, consistent with the trend of a posterior shift in DLMO, indicating the backward shift in circadian rhythm.
Figure 7b shows the AUC values of melatonin concentrations five hours before sleep to characterize nighttime melatonin levels, and it can be seen that the AUC of the eighth night was increased relative to the first night, as well as the fifth night relative to the second night, but these were not significantly different (p > 0.05). It can be hypothesized that melatonin concentrations will increase during the daytime and decrease at night before sleep in confined spaces with a prolonged lack of daylight, and the AUC values cannot simply be used to characterize the nighttime melatonin levels.

3.3.3. Changes in Melatonin Concentrations at Midnight
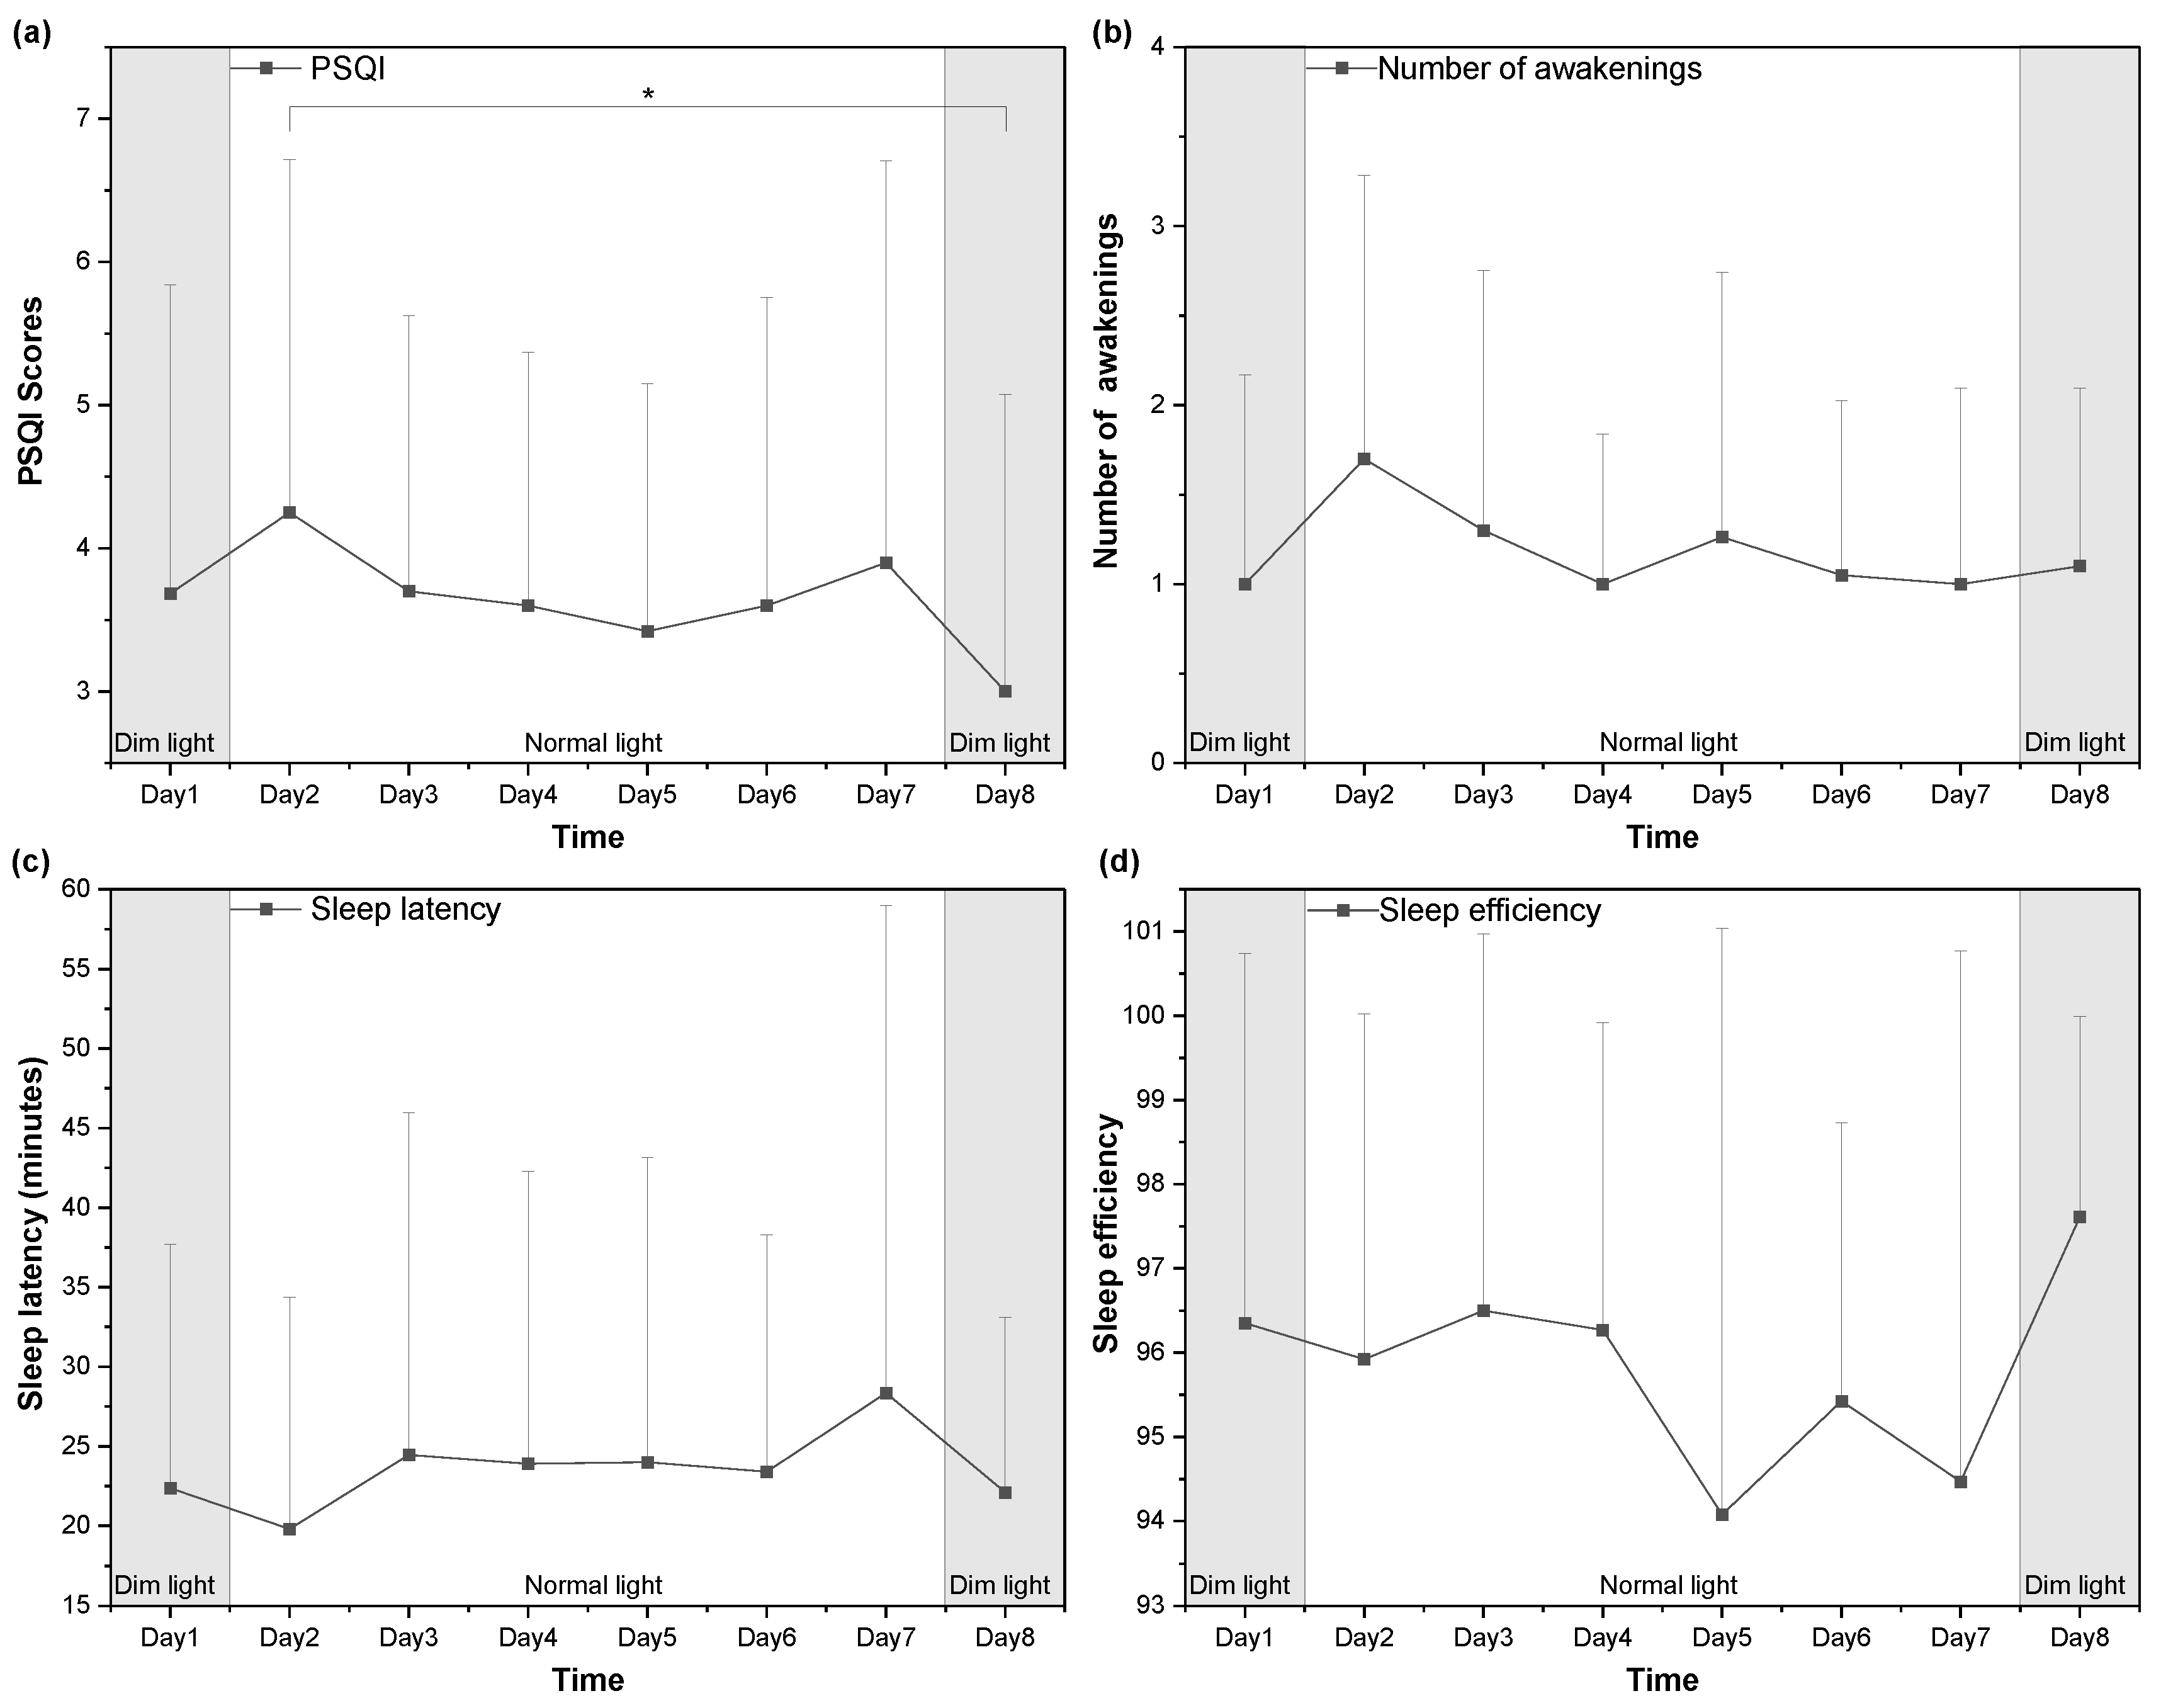
Figure 8 shows that the melatonin concentrations at 24:00 were significantly higher on the first and eighth nights in the dim light than the other days in the static lighting condition. The concentrations of the eighth night showed a decrease relative to the first night, but not significantly (p = 0.191). The overall trend of melatonin concentration at bedtime under static lighting during the other six nights was decreasing day by day, with the seventh night being significantly lower than the second night (p = 0.014) and the fifth night (p = 0.037), and the third night being significantly lower than the second night (p = 0.028). The melatonin concentrations of the remaining nights were not statistically different, but showed a gradual decrease, coinciding with the backwards trend of the circadian rhythm.

3.4. Sleep Quality

The PSQI, the number of awakenings, sleep latency and sleep efficiency were used to evaluate the changing trends of sleep quality (Figure 9). There was a tendency for the PSQI to decrease and then increase from the second to the seventh day, presumably due to the subjects gradually adapting to the environment, and the quality of their sleep became better at first, and then gradually deteriorated from the fifth day onwards (Figure 9a). The main signs were a gradual increase in sleep latency and decreased sleep efficiency overall (Figure 9c,d), but the number of awakenings decreased and stabilized (Figure 9b). The first and eighth nights had the lowest lighting stimulation during the dim lighting pattern, with a slight, but non-significant, reduction in PSQI scores, the number of awakenings and sleep latency. The PSQI score of the eighth night was significantly lower than the second night (p = 0.025) and sleep quality was significantly improved. The sleep efficiency improved rapidly on the eighth night relative to the seventh night, with improved sleep quality. Under the static lighting pattern, sleep quality gradually deteriorated with increasing days of confinement, and an appropriate reduction in lighting stimulation on the eighth night was more effective in reducing sleep latency and improving sleep quality than the previous days under the normal lighting.

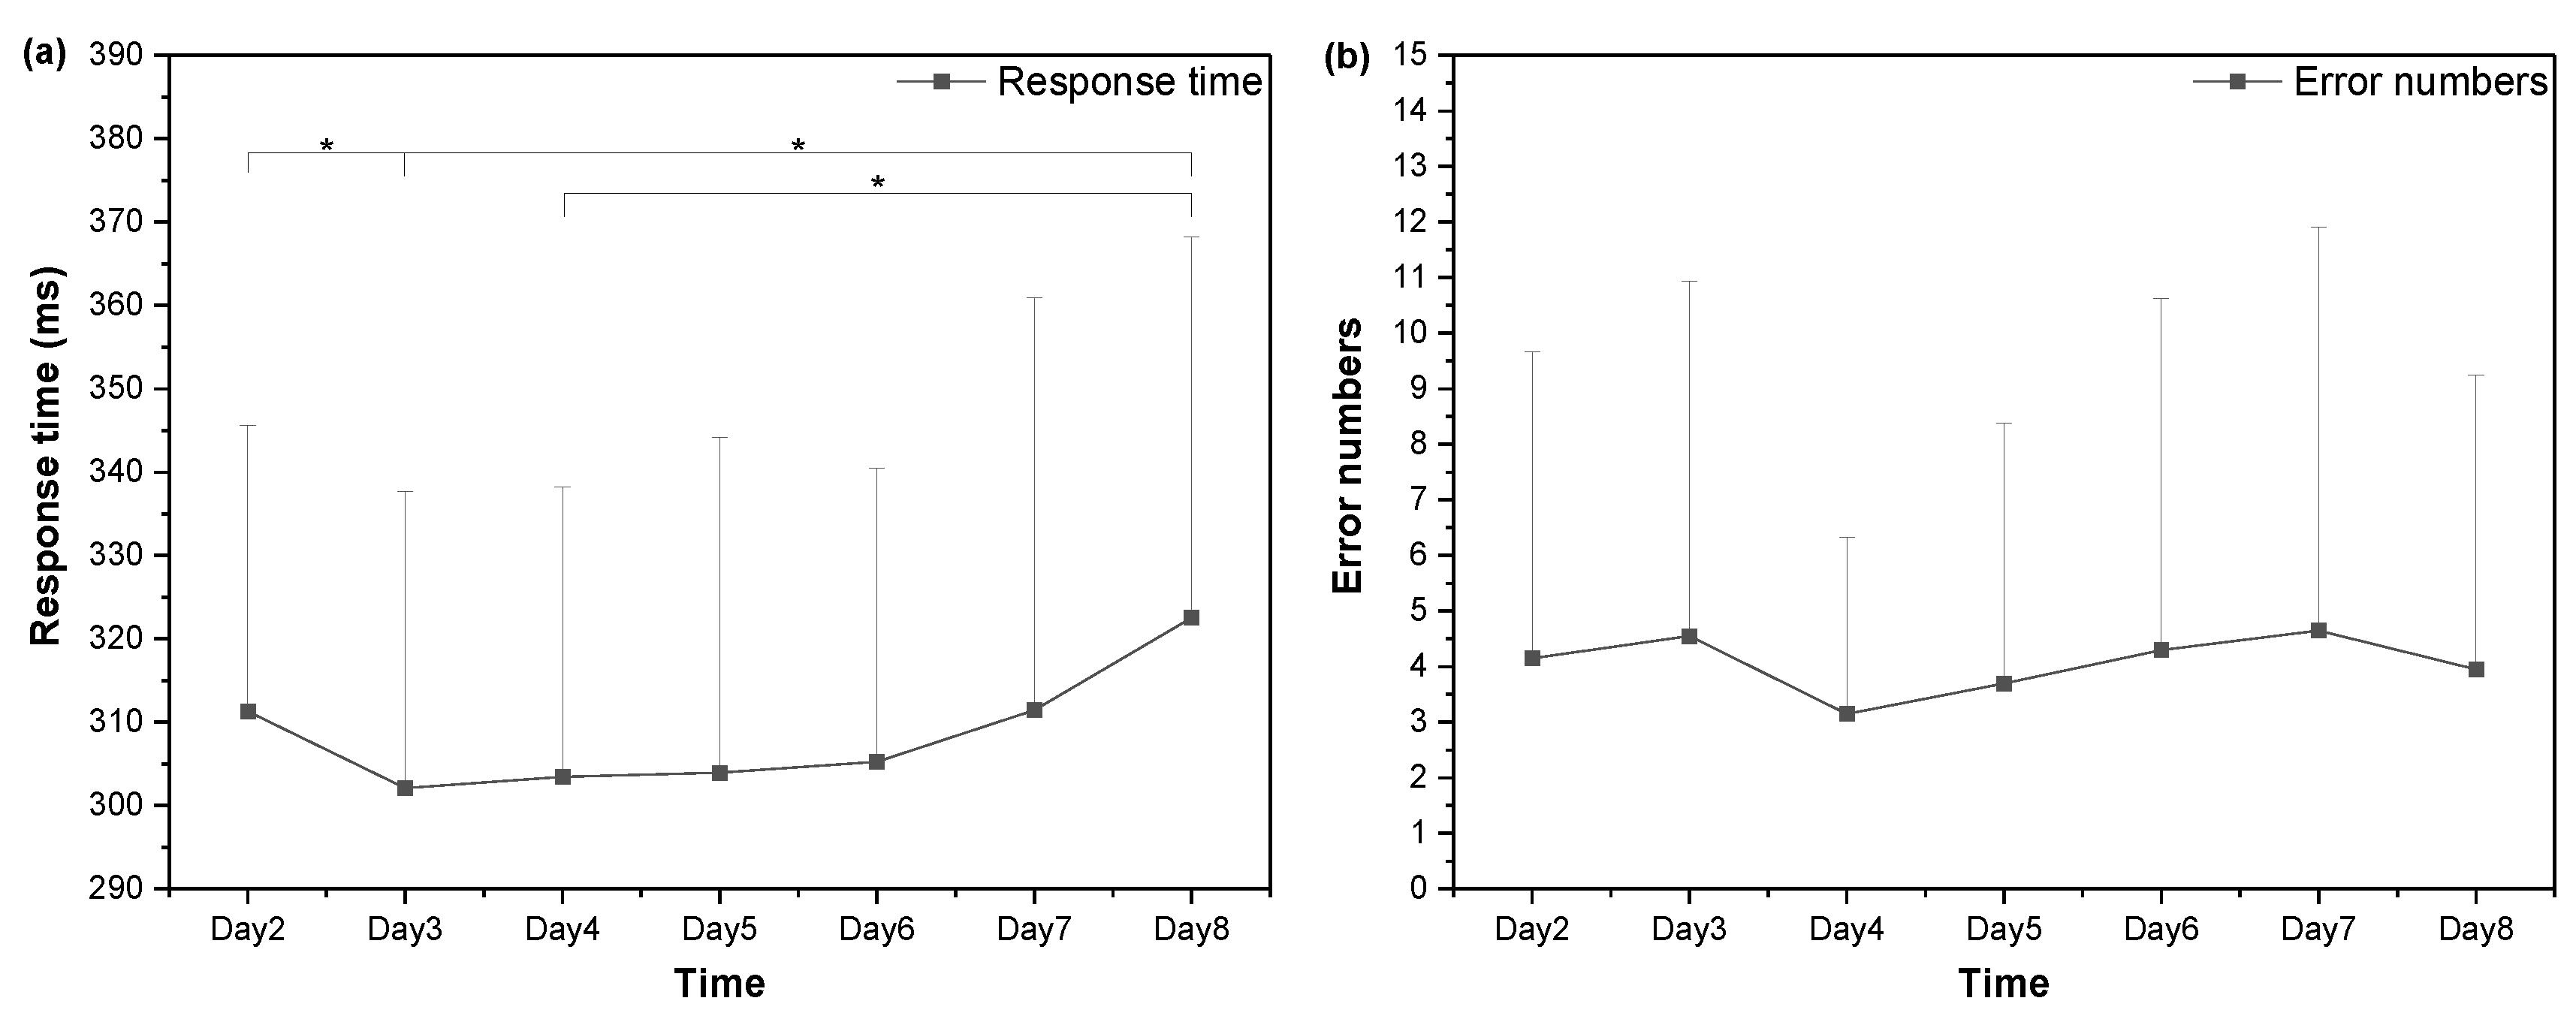
3.5. Cognitive Performance
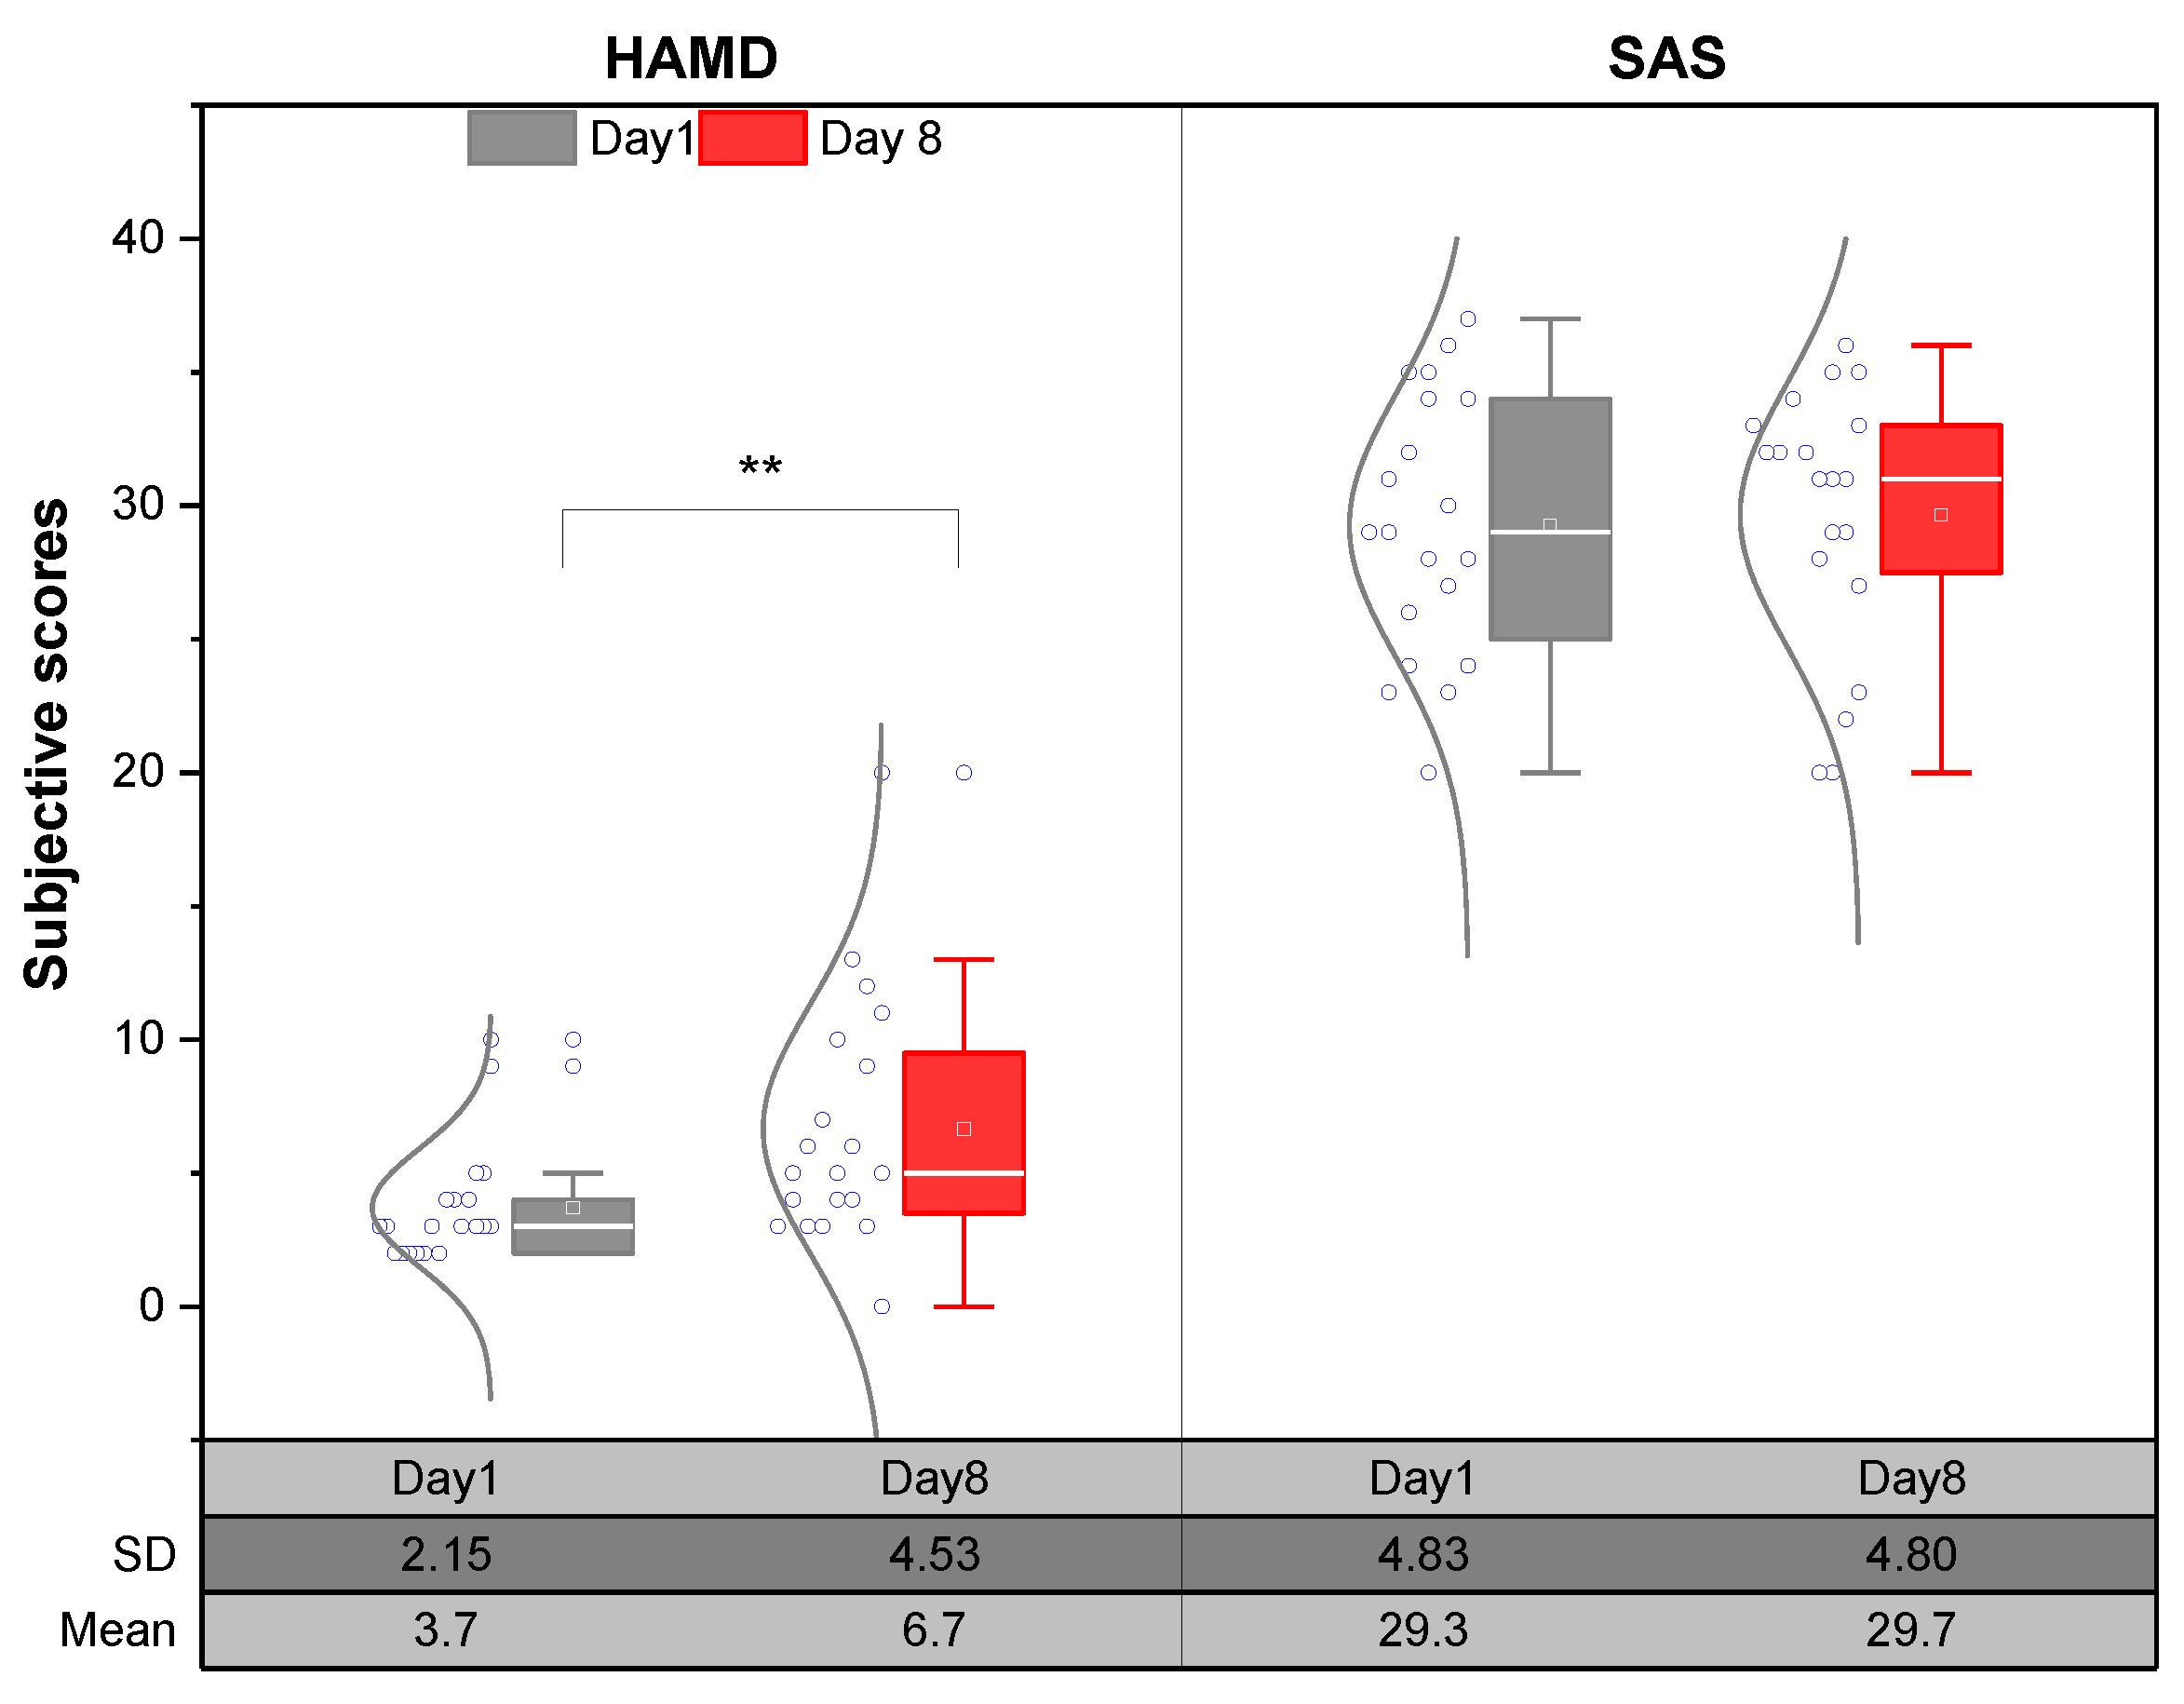
The PVT test at 10:00 each day reflected changes in subjects’ cognitive performance. Reaction times on the PVT decreased rapidly on the third day (p = 0.050) and then tended to increase day by day, possibly due to a practice effect, resulting in a significant decrease on the third day (Figure 10a). Reaction times gradually increased on the subsequent days, with the eighth day showing significantly longer reaction times than the third day (p = 0.026) and the fourth day (p = 0.016). The changes in the number of errors were similar (Figure 10b), but not significantly. This indicated that in a confined space with a static lighting pattern, the cognitive performance gradually decreased with increasing confined time, and the error rate increased at the same time.

3.6. Emotion Scale

Figure 11 showed that the HAMD score was significantly higher (p = 0.002) and depression increased significantly after 1 week of confinement. As the number of experimental days increased, the subjects’ SAS scores showed an overall increasing trend, but there was no statistical difference (p = 0.704). Thus, confined spaces with static lighting will lead to a gradual increase in negative emotions such as depression and anxiety in long-term residents, requiring timely intervention.

4. Discussion

In this study, under a static lighting pattern for 1 week, initial concentrations of melatonin increased on the eighth night (19:00) relative to the first night, but the time of melatonin onset occurred much later, with lower concentrations at 24:00 and a delayed but non-significant DLMO (p = 0.295). Longer validation may be needed, which had been demonstrated in the previous experiment of caves with no concept of time [15]. It was also possible that the fixed working schedule limited the magnitude of the circadian phase shift. In the static lighting pattern, melatonin concentrations and sleepiness (KSS scores) decreased day by day at 24:00, with a gradual increase in sleepiness on awakening at 8:00. The trend of CBT was reversed, with a gradual increase before sleep, indicating increased levels of arousal, and a day-by-day trend of decreasing CBT when waking up, consistent with a posterior shift in circadian rhythm. Melatonin concentrations and subjective sleepiness scores at 24:00 in static lighting were significantly lower than that of the DLMO lighting pattern. This indicated that inappropriate lighting stimulation during the nighttime working hours would lead to symptoms such as a posterior shift in DLMO, reduced melatonin concentration and increased CBT before sleep, as well as increased sleepiness and lower CBT upon waking up the next morning. It showed cumulative day-by-day effects, gradually inducing a posterior shift in circadian rhythm, indicating a role for light history, consistent with seasonal changes in rhythm variation [21]. This was consistent with the results of Christopher et al. [65] and the stronger the circadian stimulus of lighting before sleep, the more pronounced the effects of the posterior shift in circadian rhythm.
Under the static lighting pattern, the hour-by-hour melatonin concentrations were first suppressed at nighttime on the second and fifth days, with an upward trend occurring much later, suggesting a mutual relationship between normal melatonin secretion and the suppressive effects of lighting. Under the same lighting condition, initial melatonin concentrations at 19:00 were higher on the fifth day than the second day, and lower at 24:00 before sleep, similar to the first and eighth days under the DLMO lighting pattern. It suggested that a backward shift in the phase of the melatonin rhythm was induced under the static lighting pattern. It has been shown that the nocturnal melatonin concentration would be decreased if people did not receive enough lighting stimulus during the daytime [66]. In modern society, where people generally work and live indoors in relative isolation from nature, the intensity of light stimulus received is greatly reduced and the risk of circadian disturbances is high [11]. Therefore, appropriate dynamic lighting stimulation during the daytime is needed to keep the sleep and circadian rhythm stable [67,68].
The sleep latency increased day by day and sleep efficiency gradually decreased, indicating that sleep quality gradually deteriorated with increasing days of confinement. Lighting stimulation at night leads to difficulty in falling asleep and a decrease in sleep efficiency, which in turn leads to a decrease in sleep quality. The HAMD scores were significantly higher after 1 week of confinement (p = 0.002) and SAS scores showed an overall upward trend but no statistical difference (p = 0.704), suggesting that confined spaces with static lighting conditions would lead to a gradual increase in negative emotions such as depression and anxiety in the long term [69], requiring timely proactive healthy lighting interventions. The chronic lack of daylight and isolated social environment can also lead to symptoms similar to “overwintering syndrome” [70], such as depressed emotion and delayed sleep [71,72], leading to problems such as cognitive impairment and interpersonal tension [23], which have negative impacts on human physiology and psychology [73,74]. Both response time and the number of errors on the PVT each morning indicated that in the confined environment with a static lighting pattern, human operational performance gradually decreased and error rates increased as the confined time increased. Disturbances in circadian rhythms may also reduce operational performance and cognitive ability [75], lead to sleep problems or fatigue and require dynamic lighting interventions to help alleviate negative emotions and improve cognitive performance [9,76].
A series of healthy lighting studies have been conducted in confined spaces such as submarines [76,77], space capsules [78], underground spaces [79] and polar stations [80], attempting to proactively intervene in the physical and mental health of people using different spectrum and illuminance levels at different clock time. Nie et al. [81] used a dynamic light model that simulated changes in the color temperature and circadian action factor (CAF) of daylight for 38 consecutive days on three male shift workers in an underground nuclear power plant. It showed a significant increase in the peak melatonin concentration of the subjects, and the LED dynamic light model effectively enhanced the stability of circadian rhythms in the subjects. For the tendency of circadian rhythm phase delays due to confined spaces, dynamic lighting patterns can be used to induce rhythm phase advancement or to maintain consistency with working schedules [44]. For symptoms of the delayed circadian phase due to prolonged static lighting, bright lighting stimulation can be used in the morning and dim light with low melanopic EDI [82] can be used at night to induce forward shifting of the circadian phase [83,84]. To address the problem of melatonin suppression and reduced sleep quality due to light exposure during night work, light rich in long waves, such as red light (630 nm) [85], can be maximized at night, which may improve reaction time and alertness in shift workers, while reducing intrusion into circadian rhythms. Rather than exposing individuals to the same lighting environment, the light strategy should be developed with full consideration of their respective shifts and visual operational needs to increase the effectiveness of light interventions.
This study focused on the simulation of the traditional static lighting pattern in confined spaces to explore the changes in human melatonin rhythms, sleep quality, cognitive performance, and emotional state. The subjects were all young males and there was a lack of experimental data from female samples. So the follow-up studies should expand the sample size, select subjects of different genders for in-depth studies [44], and also consider the effects of light history [86,87]. In addition, the age and work patterns of the university subjects differed from those of the workers in the actual confined spaces. Follow-up studies need to be conducted in the field spaces and with real working conditions to obtain more authentic data. More long-term field validation experiments need to be conducted to derive more refined human experimental data to provide the basis for the design of healthy lighting.

5. Conclusions

In this study, 20 young male subjects were recruited for a continuous week of experiments with static lighting in an underground confined laboratory. A static lighting pattern simulating the current situation (6000 K, horizontal illuminance of 300 lx on working surface, melanopic EDI = 109.45 lx, CS = 0.21) was used to evaluate the changing trends of circadian rhythm and cognitive performance under a fixed work-and-rest regime in the ICE environment, such as submarines and Antarctic research stations during polar night. The cumulative effects of traditional lighting patterns on the physical and mental health of people were verified by comprehensively evaluating the indicators of melatonin, circadian rhythm, sleep quality, cognitive performance and emotional state. To sum up, the results of this study suggested that static lighting patterns in confined spaces had negative impacts on human psychological and physiological health. It caused posterior shifts, suppressions of melatonin concentration and KSS scores, a gradual increase in CBT before sleep, and a day-by-day decrease in CBT and subjective alertness upon waking up, and there were cumulative changes that coincided with a posterior shift in the circadian rhythm. In confined spaces with a prolonged lack of daylight, melatonin concentrations would increase in the evening and decrease at bedtime, and the melatonin levels cannot be characterized simply by AUC values. Under a static lighting pattern, the melatonin onset tended to increase later at night. Indicators such as PSQI, sleep latency, sleep efficiency and number of awakenings indicated progressively worse sleep quality. The reaction time and the number of errors on the PVT gradually increased, and operational capacity gradually decreased with the increasing confined time. Negative emotions such as depression and anxiety were evident after confinement. These results provided a better understanding of the comprehensive effects of static lighting on human well-being in ICE environments. Dynamic lighting, which simulated daylight, needed to be introduced to help adjust people’s circadian rhythms, performance, and well-being and reduce the hazards in the spaces which lack daylight.

Author Contributions

Conceptualization, T.W. and L.H.; methodology, T.W.; software, T.W. and J.L.; validation, T.W., R.S. and L.H.; formal analysis, T.W., J.L. and Y.W.; investigation, R.S.; resources, R.S. and L.H.; data curation, T.W. and R.S.; writing—original draft preparation, T.W., J.L. and Y.W.; writing—review and editing, R.S. and L.H.; visualization, T.W., J.L. and Y.W.; supervision, R.S. and L.H.; project administration, L.H.; funding acquisition, L.H. All authors have read and agreed to the published version of the manuscript.

Funding

This research was funded by the National Key R&D Program of China (2023YFC3805300), China Postdoctoral Science Foundation (2023M742642) and Scientific Research Project of Shanghai Municipal Science and Technology Commission (No. 22dz1202400).

Institutional Review Board Statement

The study was conducted in accordance with the Declaration of Helsinki, and approved by the Ethics Committee of Tongji University (protocol code 2021tjdx069 and date of approval 20 July 2021).

Informed Consent Statement

Informed consent was obtained from all subjects involved in the study. Written informed consent has been obtained from the participants to publish this paper.

Data Availability Statement

The data presented in this study are available on reasonable request from the corresponding author.

Acknowledgments

The authors would like to acknowledge the Polar Research Institute of China and Shujian Dai, Chuang Yu, Runqi Liang, Junliang Li, Ka Feng, Miaotong Zhang, Zhongyuan Li and Li Wei for their technical and resource assistance to this project.

Conflicts of Interest

The authors declare no conflicts of interest.

References

  1. Häfker, N.S.; Tessmar-Raible, K. Rhythms of behavior: Are the times changin’? Curr. Opin. Neurobiol. 2020, 60, 55–66. [Google Scholar] [CrossRef]
  2. Brown, T.; Wright, K. Opinion: How do we define ‘healthy’ lighting? Light. Res. Technol. 2022, 54, 310. [Google Scholar] [CrossRef]
  3. Berson, D.M.; Dunn, F.A.; Takao, M. Phototransduction by retinal ganglion cells that set the circadian clock. Science 2002, 295, 1070–1073. [Google Scholar] [CrossRef]
  4. Vetter, C.; Pattison, P.M.; Houser, K.; Herf, M.; Phillips, A.J.; Wright, K.P.; Skene, D.J.; Brainard, G.C.; Boivin, D.B.; Glickman, G. A review of human physiological responses to light: Implications for the development of integrative lighting solutions. Leukos 2022, 18, 387–414. [Google Scholar] [CrossRef]
  5. CIE. CIE 158: 2009 Ocular Lighting Effects on Human Physiology and Behaviour; Commission Internationale de l’Eclairage: Vienna, Austria, 2009. [Google Scholar]
  6. Fernandez, F.X. Current insights into optimal lighting for promoting sleep and circadian health: Brighter days and the importance of sunlight in the built environment. Nat. Sci. Sleep 2022, 14, 25. [Google Scholar] [CrossRef] [PubMed]
  7. Palinkas, L.A.; Suedfeld, P. Psychosocial issues in isolated and confined extreme environments. Neurosci. Biobehav. Rev. 2021, 126, 413–429. [Google Scholar] [CrossRef]
  8. Jiang, N.; LI, Y.; Lai, H.; Yao, J.; Zhu, C.; Zhou, H.; WU, J. A tracking study on sleep characteristics of submariners during a long-term voyage. Med. J. Chin. People’s Lib. 2017, 42, 723. [Google Scholar]
  9. Nieuwenhuys, A.; Dora, J.; Melanie, K.-M.; Beckers, D.; Rietjens, G.; Helmhout, P. “20,000 leagues under the sea”: Sleep, cognitive performance, and self-reported recovery status during a 67-day military submarine mission. Appl. Ergon. 2021, 91, 103295. [Google Scholar] [CrossRef]
  10. Schlangen, L.J.; Price, L.L. The lighting environment, its metrology, and non-visual responses. Front. Neurol. 2021, 12, 624861. [Google Scholar] [PubMed]
  11. Smolensky, M.H.; Sackett-Lundeen, L.L.; Portaluppi, F. Nocturnal Light Pollution and Underexposure to Daytime Sunlight: Complementary Mechanisms of Circadian Disruption and Related Diseases; Taylor & Francis: Oxford, UK, 2015; Volume 32, pp. 1029–1048. [Google Scholar]
  12. Basner, M.; Dinges, D.F.; Mollicone, D.J.; Savelev, I.; Ecker, A.J.; Di Antonio, A.; Jones, C.W.; Hyder, E.C.; Kan, K.; Morukov, B.V. Psychological and behavioral changes during confinement in a 520-day simulated interplanetary mission to mars. PLoS ONE 2014, 9, e93298. [Google Scholar] [CrossRef] [PubMed]
  13. Pagel, J.I.; Choukèr, A. Effects of isolation and confinement on humans-implications for manned space explorations. J. Appl. Physiol. 2016, 120, 1449–1457. [Google Scholar] [CrossRef]
  14. Meng, C.; Wang, W.; Hao, Z.; Liu, H. Investigation on the influence of isolated environment on human psychological and physiological health. Sci. Total Environ. 2020, 716, 136972. [Google Scholar] [CrossRef]
  15. Mills, J. Circadian rhythms during and after three months in solitude underground. J. Physiol. 1964, 174, 217. [Google Scholar] [CrossRef]
  16. Leger, D.; Bayon, V.; Elbaz, M.; Philip, P.; Choudat, D. Underexposure to light at work and its association to insomnia and sleepiness: A cross-sectional study of 13,296 workers of one transportation company. J. Psychosom. Res. 2011, 70, 29–36. [Google Scholar] [CrossRef]
  17. Boubekri, M.; Cheung, I.N.; Reid, K.J.; Wang, C.; Zee, P.C. Impact of windows and daylight exposure on overall health and sleep quality of office workers: A case-control pilot study. J. Clin. Sleep Med. 2014, 10, 603–611. [Google Scholar] [CrossRef]
  18. LoPresti, M.L.; Anderson, J.A.; Saboe, K.N.; McGurk, D.L.; Balkin, T.J.; Sipos, M.L. The impact of insufficient sleep on combat mission performance. Mil. Behav. Health 2016, 4, 356–363. [Google Scholar] [CrossRef]
  19. Luyster, F.S.; Strollo, P.J.; Zee, P.C.; Walsh, J.K. Sleep: A health imperative. Sleep 2012, 35, 727–734. [Google Scholar] [CrossRef]
  20. Jiang, N.; Sheng, X.; Jiang, D.; Chen, W. Relationship between work stress and health in submariners. Jie Fang Jun Yi Xue Za Zhi 2013, 38, 665. [Google Scholar]
  21. Kawasaki, A.; Wisniewski, S.; Healey, B.; Pattyn, N.; Kunz, D.; Basner, M.; Münch, M. Impact of long-term daylight deprivation on retinal light sensitivity, circadian rhythms and sleep during the Antarctic winter. Sci. Rep. 2018, 8, 16185. [Google Scholar] [CrossRef] [PubMed]
  22. Xu, C.; Liu, S.; Kong, Z.; Chen, N. Sleep architecture, periodic breathing and mood disturbance of expeditioners at Kunlun Station (4087 m) in Antarctica. Adv. Polar Sci. 2020, 31, 215–223. [Google Scholar]
  23. Sandal, G.M.; van de Vijver, F.J.; Smith, N. Psychological hibernation in Antarctica. Front. Psychol. 2018, 9, 2235. [Google Scholar] [CrossRef] [PubMed]
  24. Alfano, C.A.; Bower, J.L.; Connaboy, C.; Agha, N.H.; Baker, F.L.; Smith, K.A.; So, C.J.; Simpson, R.J. Mental health, physical symptoms and biomarkers of stress during prolonged exposure to Antarctica’s extreme environment. Acta Astronaut. 2021, 181, 405–413. [Google Scholar] [CrossRef]
  25. Kuwabara, T.; Naruiwa, N.; Kawabe, T.; Kato, N.; Sasaki, A.; Ikeda, A.; Otani, S.; Imura, S.; Watanabe, K.; Ohno, G. Human change and adaptation in Antarctica: Psychological research on Antarctic wintering-over at Syowa station. Int. J. Circumpolar Health 2021, 80, 1886704. [Google Scholar] [CrossRef] [PubMed]
  26. Palinkas, L.A.; Suedfeld, P. Psychological effects of polar expeditions. Lancet 2008, 371, 153–163. [Google Scholar] [CrossRef] [PubMed]
  27. Chen, N.; Wu, Q.; Xiong, Y.; Chen, G.; Song, D.; Xu, C. Circadian rhythm and sleep during prolonged Antarctic residence at Chinese Zhongshan station. Wilderness Environ. Med. 2016, 27, 458–467. [Google Scholar] [CrossRef] [PubMed]
  28. Palinkas, L.A.; Houseal, M. Stages of change in mood and behavior during a winter in Antarctica. Environ. Behav. 2000, 32, 128–141. [Google Scholar] [CrossRef] [PubMed]
  29. Korman, M.; Tkachev, V.; Reis, C.; Komada, Y.; Kitamura, S.; Gubin, D.; Kumar, V.; Roenneberg, T. Outdoor daylight exposure and longer sleep promote wellbeing under COVID-19 mandated restrictions. J. Sleep Res. 2022, 31, e13471. [Google Scholar] [CrossRef] [PubMed]
  30. Theberath, M.; Bauer, D.; Chen, W.; Salinas, M.; Mohabbat, A.B.; Yang, J.; Chon, T.Y.; Bauer, B.A.; Wahner-Roedler, D.L. Effects of COVID-19 pandemic on mental health of children and adolescents: A systematic review of survey studies. SAGE Open Med. 2022, 10, 20503121221086712. [Google Scholar] [CrossRef] [PubMed]
  31. Beck, F.; Léger, D.; Fressard, L.; Peretti-Watel, P.; Verger, P.; Group, C. COVID-19 health crisis and lockdown associated with high level of sleep complaints and hypnotic uptake at the population level. J. Sleep Res. 2021, 30, e13119. [Google Scholar] [CrossRef]
  32. Sharma, M.; Aggarwal, S.; Madaan, P.; Saini, L.; Bhutani, M. Impact of COVID-19 pandemic on sleep in children and adolescents: A systematic review and meta-analysis. Sleep Med. 2021, 84, 259–267. [Google Scholar] [CrossRef]
  33. Boivin, D.B.; Boudreau, P.; Kosmadopoulos, A. Disturbance of the circadian system in shift work and its health impact. J. Biol. Rhythm. 2022, 37, 3–28. [Google Scholar] [CrossRef] [PubMed]
  34. Blask, D.E. Melatonin, sleep disturbance and cancer risk. Sleep Med. Rev. 2009, 13, 257–264. [Google Scholar] [CrossRef] [PubMed]
  35. Blaxton, J.M.; Bergeman, C.S.; Whitehead, B.R.; Braun, M.E.; Payne, J.D. Relationships among nightly sleep quality, daily stress, and daily affect. J. Gerontol. Ser. B 2017, 72, 363–372. [Google Scholar] [CrossRef] [PubMed]
  36. Walker, M.P.; van Der Helm, E. Overnight therapy? The role of sleep in emotional brain processing. Psychol. Bull. 2009, 135, 731. [Google Scholar] [CrossRef] [PubMed]
  37. Kecklund, G.; Axelsson, J. Health consequences of shift work and insufficient sleep. BMJ 2016, 355, 5210. [Google Scholar] [CrossRef] [PubMed]
  38. Proper, K.I.; Van De Langenberg, D.; Rodenburg, W.; Vermeulen, R.C.; Van Der Beek, A.J.; Van Steeg, H.; Van Kerkhof, L.W. The relationship between shift work and metabolic risk factors: A systematic review of longitudinal studies. Am. J. Prev. Med. 2016, 50, e147–e157. [Google Scholar] [CrossRef] [PubMed]
  39. Livingston, W.S.; Rusch, H.L.; Nersesian, P.V.; Baxter, T.; Mysliwiec, V.; Gill, J.M. Improved sleep in military personnel is associated with changes in the expression of inflammatory genes and improvement in depression symptoms. Front. Psychiatry 2015, 6, 59. [Google Scholar] [CrossRef] [PubMed]
  40. Vyas, M.V.; Garg, A.X.; Iansavichus, A.V.; Costella, J.; Donner, A.; Laugsand, L.E.; Janszky, I.; Mrkobrada, M.; Parraga, G.; Hackam, D.G. Shift work and vascular events: Systematic review and meta-analysis. BMJ 2012, 345, e4800. [Google Scholar] [CrossRef] [PubMed]
  41. Wang, F.; Yeung, K.; Chan, W.; Kwok, C.; Leung, S.; Wu, C.; Chan, E.; Yu, I.; Yang, X.; Tse, L. A meta-analysis on dose–response relationship between night shift work and the risk of breast cancer. Ann. Oncol. 2013, 24, 2724–2732. [Google Scholar] [CrossRef]
  42. Benke, K.K.; Benke, K.E. Uncertainty in health risks from artificial lighting due to disruption of circadian rhythm and melatonin secretion: A review. Hum. Ecol. Risk Assess. Int. J. 2013, 19, 916–929. [Google Scholar] [CrossRef]
  43. Van de Putte, E.; Kindt, S.; Bracke, P.; Stevens, M.; Vansteenkiste, M.; Vandevivere, L.; Ryckaert, W.R. The influence of integrative lighting on sleep and cognitive functioning of shift workers during the morning shift in an assembly plant. Appl. Ergon. 2022, 99, 103618. [Google Scholar] [CrossRef] [PubMed]
  44. Wang, T.; Li, J.; Wang, Y.; Dai, S.; Shao, R.; Hao, L. Active interventions of dynamic lighting on human circadian rhythm and sleep quality in confined spaces. Build. Environ. 2022, 226, 109766. [Google Scholar] [CrossRef]
  45. Zhao, J.P. GB 50034-2013; Standard for Lighting Design of Buildings. China Architecture & Building Press: Beijing, China, 2013.
  46. Pandi-Perumal, S.R.; Smits, M.; Spence, W.; Srinivasan, V.; Cardinali, D.P.; Lowe, A.D.; Kayumov, L. Dim light melatonin onset (DLMO): A tool for the analysis of circadian phase in human sleep and chronobiological disorders. Prog. Neuro-Psychopharmacol. Biol. Psychiatry 2007, 31, 1–11. [Google Scholar] [CrossRef] [PubMed]
  47. Silva, A.; Simón, D.; Pannunzio, B.; Casaravilla, C.; Díaz, Á.; Tassino, B. Chronotype-dependent changes in sleep habits associated with dim light melatonin onset in the antarctic summer. Clocks Sleep 2019, 1, 352–366. [Google Scholar] [CrossRef] [PubMed]
  48. Figueiro, M.G.; Bullough, J.D.; Bierman, A.; Fay, C.R.; Rea, M.S. On light as an alerting stimulus at night. Acta Neurobiol. Exp. 2007, 67, 171. [Google Scholar] [CrossRef] [PubMed]
  49. Stefani, O.; Freyburger, M.; Veitz, S.; Basishvili, T.; Meyer, M.; Weibel, J.; Kobayashi, K.; Shirakawa, Y.; Cajochen, C. Changing color and intensity of LED lighting across the day impacts on circadian melatonin rhythms and sleep in healthy men. J. Pineal Res. 2021, 70, e12714. [Google Scholar] [CrossRef] [PubMed]
  50. Kaida, K.; Takahashi, M.; Åkerstedt, T.; Nakata, A.; Otsuka, Y.; Haratani, T.; Fukasawa, K. Validation of the Karolinska sleepiness scale against performance and EEG variables. Clin. Neurophysiol. 2006, 117, 1574–1581. [Google Scholar] [CrossRef] [PubMed]
  51. Sato, K.T.; Kane, N.L.; Soos, G.; Gisolfi, C.V.; Kondo, N.; Sato, K. Reexamination of tympanic membrane temperature as a core temperature. J. Appl. Physiol. 1996, 80, 1233–1239. [Google Scholar] [CrossRef] [PubMed]
  52. Hou, D.; He, S.; Dai, C.; Chen, S.; Chen, H.; Lin, Y. Lighting scheme recommendation for interior workplace to adjust the phase-advance jet lag. Build. Environ. 2021, 198, 107913. [Google Scholar] [CrossRef]
  53. Wang, T.; Shao, R.; Hao, L. Effects of Different Nocturnal Lighting Stimuli on Melatonin, Sleep and Cognitive Performance of Workers in Confined Spaces. Buildings 2023, 13, 2112. [Google Scholar] [CrossRef]
  54. Zitser, J.; Allen, I.E.; Falgàs, N.; Le, M.M.; Neylan, T.C.; Kramer, J.H.; Walsh, C.M. Pittsburgh Sleep Quality Index (PSQI) responses are modulated by total sleep time and wake after sleep onset in healthy older adults. PLoS ONE 2022, 17, e0270095. [Google Scholar] [CrossRef] [PubMed]
  55. Liu, D.; Kahathuduwa, C.; Vazsonyi, A.T. The Pittsburgh Sleep Quality Index (PSQI): Psychometric and clinical risk score applications among college students. Psychol. Assess. 2021, 33, 816. [Google Scholar] [CrossRef] [PubMed]
  56. Thomann, J.; Baumann, C.R.; Landolt, H.-P.; Werth, E. Psychomotor vigilance task demonstrates impaired vigilance in disorders with excessive daytime sleepiness. J. Clin. Sleep Med. 2014, 10, 1019–1024. [Google Scholar] [PubMed]
  57. Mendt, S.; Maggioni, M.A.; Nordine, M.; Steinach, M.; Opatz, O.; Belavy, D.; Felsenberg, D.; Koch, J.; Shang, P.; Gunga, H.C.; et al. Circadian rhythms in bed rest: Monitoring core body temperature via heat-flux approach is superior to skin surface temperature. Chronobiol. Int. 2017, 34, 666–676. [Google Scholar] [CrossRef] [PubMed]
  58. Lack, L.C.; Gradisar, M.; Van Someren, E.J.; Wright, H.R.; Lushington, K. The relationship between insomnia and body temperatures. Sleep Med. Rev. 2008, 12, 307–317. [Google Scholar] [CrossRef] [PubMed]
  59. Reiter, R.J.; Tan, D.X. What constitutes a physiological concentration of melatonin? J. Pineal Res. 2003, 34, 79–80. [Google Scholar] [PubMed]
  60. Molina, T.A.; Burgess, H.J. Calculating the dim light melatonin onset: The impact of threshold and sampling rate. Chronobiol. Int. 2011, 28, 714–718. [Google Scholar] [PubMed]
  61. Benloucif, S.; Burgess, H.J.; Klerman, E.B.; Lewy, A.J.; Middleton, B.; Murphy, P.J.; Parry, B.L.; Revell, V.L. Measuring melatonin in humans. J. Clin. Sleep Med. 2008, 4, 66–69. [Google Scholar] [PubMed]
  62. Nagtegaal, E.; Peeters, T.; Swart, W.; Smits, M.; Kerkhof, G.; van der Meer, G. Correlation between concentrations of melatonin in saliva and serum in patients with delayed sleep phase syndrome. Ther. Drug Monit. 1998, 20, 181–183. [Google Scholar] [CrossRef]
  63. Voultsios, A.; Kennaway, D.J.; Dawson, D. Salivary melatonin as a circadian phase marker: Validation and comparison to plasma melatonin. J. Biol. Rhythm. 1997, 12, 457–466. [Google Scholar]
  64. Figueiro, M.G.; Rea, M.S. Lack of short-wavelength light during the school day delays dim light melatonin onset (DLMO) in middle school students. Neuro. Endocrinol. Lett. 2010, 31, 92. [Google Scholar] [PubMed]
  65. Höhn, C.; Schmid, S.R.; Plamberger, C.P.; Bothe, K.; Angerer, M.; Gruber, G.; Pletzer, B.; Hoedlmoser, K. Preliminary Results: The Impact of Smartphone Use and Short-Wavelength Light during the Evening on Circadian Rhythm, Sleep and Alertness. Clocks Sleep 2021, 3, 66–86. [Google Scholar] [CrossRef] [PubMed]
  66. Hébert, M.; Martin, S.K.; Lee, C.; Eastman, C.I. The effects of prior light history on the suppression of melatonin by light in humans. J. Pineal Res. 2002, 33, 198–203. [Google Scholar] [CrossRef] [PubMed]
  67. Ru, T.; Kompier, M.E.; Chen, Q.; Zhou, G.; Smolders, K.C.H.J. Temporal tuning of illuminance and spectrum: Effect of a full-day dynamic lighting pattern on well-being, performance and sleep in simulated office environment. Build. Environ. 2023, 228, 109842. [Google Scholar]
  68. Schledermann, K.M.; Bjørner, T.; West, A.S.; Hansen, T.S. Evaluation of staff’s perception of a circadian lighting system implemented in a hospital. Build. Environ. 2023, 242, 110488. [Google Scholar] [CrossRef]
  69. Brasher, K.; Sparshott, K.; Weir, A.; Day, A.; Bridger, R. Two year follow-up study of stressors and occupational stress in submariners. Occup. Med. 2012, 62, 563–565. [Google Scholar] [CrossRef] [PubMed]
  70. Chen, N.; Wu, Q.; Li, H.; Zhang, T.; Xu, C. Different adaptations of Chinese winter-over expeditioners during prolonged Antarctic and sub-Antarctic residence. Int. J. Biometeorol. 2016, 60, 737–747. [Google Scholar] [PubMed]
  71. Arendt, J.; Middleton, B. Human seasonal and circadian studies in Antarctica (Halley, 75 S). Gen. Comp. Endocrinol. 2018, 258, 250–258. [Google Scholar] [CrossRef] [PubMed]
  72. Roenneberg, T.; Kantermann, T.; Juda, M.; Vetter, C.; Allebrandt, K.V. Light and the human circadian clock. Circadian Clocks 2013, 217, 311–331. [Google Scholar]
  73. Kanas, N.; Sandal, G.M.; Boyd, J.E.; Gushin, V.I.; Manzey, D.; North, R.; Leon, G.R.; Suedfeld, P.; Bishop, S.L.; Fiedler, E.R. Psychology and culture during long-duration space missions. In On Orbit and Beyond; Springer: Berlin/Heidelberg, Germany, 2013; pp. 153–184. [Google Scholar]
  74. Suedfeld, P. Antarctica and space as psychosocial analogues. Reach 2018, 9, 1–4. [Google Scholar] [CrossRef]
  75. Ahmad, M.; Md. Din, N.S.B.; Tharumalay, R.D.; Che Din, N.; Ibrahim, N.; Amit, N.; Farah, N.M.; Osman, R.A.; Abdul Hamid, M.F.; Ibrahim, I.A. The effects of circadian rhythm disruption on mental health and physiological responses among shift workers and general population. Int. J. Environ. Res. Public Health 2020, 17, 7156. [Google Scholar] [CrossRef] [PubMed]
  76. Young, C.R.; Jones, G.E.; Figueiro, M.G.; Soutière, S.E.; Keller, M.W.; Richardson, A.M.; Lehmann, B.J.; Rea, M.S. At-sea trial of 24-h-based submarine watchstanding schedules with high and low correlated color temperature light sources. J. Biol. Rhythm. 2015, 30, 144–154. [Google Scholar] [CrossRef] [PubMed]
  77. Trousselard, M.; Leger, D.; van Beers, P.; Coste, O.; Vicard, A.; Pontis, J.; Crosnier, S.-N.; Chennaoui, M. Sleeping under the ocean: Despite total isolation, nuclear Submariners maintain their sleep and wake patterns throughout their under sea mission. PLoS ONE 2015, 10, e0126721. [Google Scholar]
  78. Zhang, T.; Li, W.; Cheng, Z. Design of Scene Illumination System in Large Manned Spacecraft. Manned Spacefl. 2018, 24, 178–182. [Google Scholar]
  79. Dong, X.; Wu, Y.; Chen, X.; Li, H.; Cao, B.; Zhang, X.; Yan, X.; Li, Z.; Long, Y.; Li, X. Effect of thermal, acoustic, and lighting environment in underground space on human comfort and work efficiency: A review. Sci. Total Environ. 2021, 786, 147537. [Google Scholar]
  80. Francis, G.; Bishop, L.; Luke, C.; Middleton, B.; Williams, P.; Arendt, J. Sleep during the Antarctic winter: Preliminary observations on changing the spectral composition of artificial light. J. Sleep Res. 2008, 17, 354–360. [Google Scholar] [CrossRef] [PubMed]
  81. Nie, J.; Zhou, T.; Chen, Z.; Dang, W.; Jiao, F.; Zhan, J.; Chen, Y.; Chen, Y.; Pan, Z.; Kang, X.; et al. Investigation on entraining and enhancing human circadian rhythm in closed environments using daylight-like LED mixed lighting. Sci. Total Environ. 2020, 732, 139334. [Google Scholar] [CrossRef] [PubMed]
  82. Lowden, A.; Kecklund, G. Considerations on how to light the night-shift. Light. Res. Technol. 2021, 53, 437–452. [Google Scholar]
  83. Van Bommel, W.J. Non-visual biological effect of lighting and the practical meaning for lighting for work. Appl. Ergon. 2006, 37, 461–466. [Google Scholar] [CrossRef]
  84. Lowden, A.; Akerstedt, T. Assessment of a new dynamic light regimen in a nuclear power control room without windows on quickly rotating shiftworkers--effects on health, wakefulness, and circadian alignment: A pilot study. Chronobiol. Int. 2012, 29, 641–649. [Google Scholar] [CrossRef]
  85. Figueiro, M.G.; Pedler, D. Red light: A novel, non-pharmacological intervention to promote alertness in shift workers. J. Saf. Res. 2020, 74, 169–177. [Google Scholar] [CrossRef] [PubMed]
  86. Dumont, M.; Beaulieu, C. Light exposure in the natural environment: Relevance to mood and sleep disorders. Sleep Med. 2007, 8, 557–565. [Google Scholar] [CrossRef] [PubMed]
  87. Xiao, H.; Cai, H.; Li, X. Non-visual effects of indoor light environment on humans: A review. Physiol. Behav. 2021, 228, 113195. [Google Scholar] [CrossRef] [PubMed]
Figure 1. Floor plan of the underground laboratory. ①–④ indicated 4 sleep rooms. Each room was equipped with 2 bunk beds, a folding bed, a table and five chairs to accommodate 5 people at a time. The LED panel lights were 2.2 m above the floor directly above the table.
Buildings 14 01115 g001
Figure 2. Changes in parameters such as spectrum and illuminance under different lighting patterns. (a) illustrates the static lighting pattern used during the daytime, with only the dim lighting pattern used from 19:00 to 24:00 on the 1st and 8th nights for the determination of DLMO. (b) shows the relative spectral power distribution (SPD) of the 6000 K. (c) compares the vertical illuminance, melanopic EDI and CS values at the eyes in the static lighting pattern and dim lighting pattern. (d) shows the variation in melanopic EDI at the position of the eyes.
Buildings 14 01115 g002
Figure 3. Study schedule of the experiment and testing time on typical days. A static lighting pattern was used during the experiment, with saliva collected every hour from 19:00 to 24:00 pm on the 1st, 2nd, 5th and 8th night, and at 24:00 before sleep on the remaining days. A dim lighting environment was used on the 1st and 8th nights, and a static lighting pattern was used on the other days.
Buildings 14 01115 g003
Figure 4. Day-by-day trends of KSS scores before and after sleep. (a) shows an overall increase in KSS scores in the evening and a gradual decrease in KSS scores in the morning. (b) illustrates an overall decreasing trend in KSS scores at 24:00 before sleep and an increase in KSS scores day by day when waking up at 8:00. (* indicates p < 0.05, ** indicates p < 0.01).
Buildings 14 01115 g004
Figure 5. Daily changes in CBT before and after sleep. (a) indicates an overall decrease in CBT during the night and a gradual increase in CBT in the morning. (b) shows CBT before and after sleep on the 1st and 8th days is lower than the other days. CBT at 24:00 shows a tendency to increase and then decrease, and CBT at 8:00 decreased day by day. (* indicates p < 0.05, ** indicates p < 0.01).
Buildings 14 01115 g005
Figure 6. Changes in melatonin concentrations and DLMO under the dim lighting environment. (a) shows the initial concentration on the 8th night is higher than that of the 1st night in the dim light, but the time point of melatonin onset occurred later and the concentrations were lower at bedtime. (b) indicates DLMO is relatively delayed after 1 week but without significance. (Blue circles indicates raw scores for each subject).
Buildings 14 01115 g006
Figure 7. Hourly changes in melatonin concentrations and comparison of AUC values. (a) shows under the static lighting, the initial melatonin concentrations of the 5th night are slightly higher than the 2nd night, and the time of melatonin onset occurred later, with lower melatonin concentrations at bedtime. (b) indicates AUC values for nighttime melatonin are slightly higher on the 8th night than the 1st night, as well as the 5th night compared to the 2nd night, but these are not significant. (* indicates p < 0.05, and blue circles indicates raw scores for each subject).
Buildings 14 01115 g007
Figure 8. Changes in melatonin concentration at 24:00 each night. Melatonin concentrations at 24:00 are significantly higher on the 1st and 8th nights in the dim lighting environment. Under the static lighting pattern, melatonin concentrations before sleep shows a decreasing trend day by day. (* indicates p < 0.05, ** indicates p < 0.01, *** indicates p < 0.001).
Buildings 14 01115 g008
Figure 9. Daily changes in PSQI scores, number of awakenings, sleep latency and sleep efficiency. (a) shows the PSQI score decreases slightly and then increases and (b) indicates the number of awakenings gradually decreases and then stabilizes. (c) shows sleep latency under the static lighting tends to increase day by day. (d) indicates sleep efficiency decreases, and sleep quality gradually deteriorates. (* indicates p < 0.05).
Buildings 14 01115 g009
Figure 10. Daily changes in reaction time and the number of errors for the PVT test. As confined time increased, (a) indicates their reaction time increased and (b) shows the number of errors tend to increase gradually, meaning their cognitive performance decreased. (* indicates p < 0.05).
Buildings 14 01115 g010
Figure 11. Changes in HAMD and SAS scores. After 1 week, the HAMD scores increases significantly and SAS scores increases slightly, meaning that negative emotions such as depression and anxiety became progressively more severe. (** indicates p < 0.01, and blue circles indicates raw scores for each subject).
Buildings 14 01115 g011
Table 1. Average values of measured lighting parameters in different patterns.
Light PatternsStatic LightingDim Lighting
Illuminance on the table/lx310.7629.39
Illuminance at the eyes/lx121.3810.61
Melanopic EDI/lx109.459.75
S-cone-opic EDI/lx110.999.48
M-cone-opic EDI/lx118.710.28
L-cone-opic EDI/lx122.6210.62
Rhodopic EDI/lx112.079.86
CLA/lx16812
CS0.210.02
Disclaimer/Publisher’s Note: The statements, opinions and data contained in all publications are solely those of the individual author(s) and contributor(s) and not of MDPI and/or the editor(s). MDPI and/or the editor(s) disclaim responsibility for any injury to people or property resulting from any ideas, methods, instructions or products referred to in the content.

