
Adhesion Stability According to Adhesion Area of Traditional Tile Gluing Method


Abstract
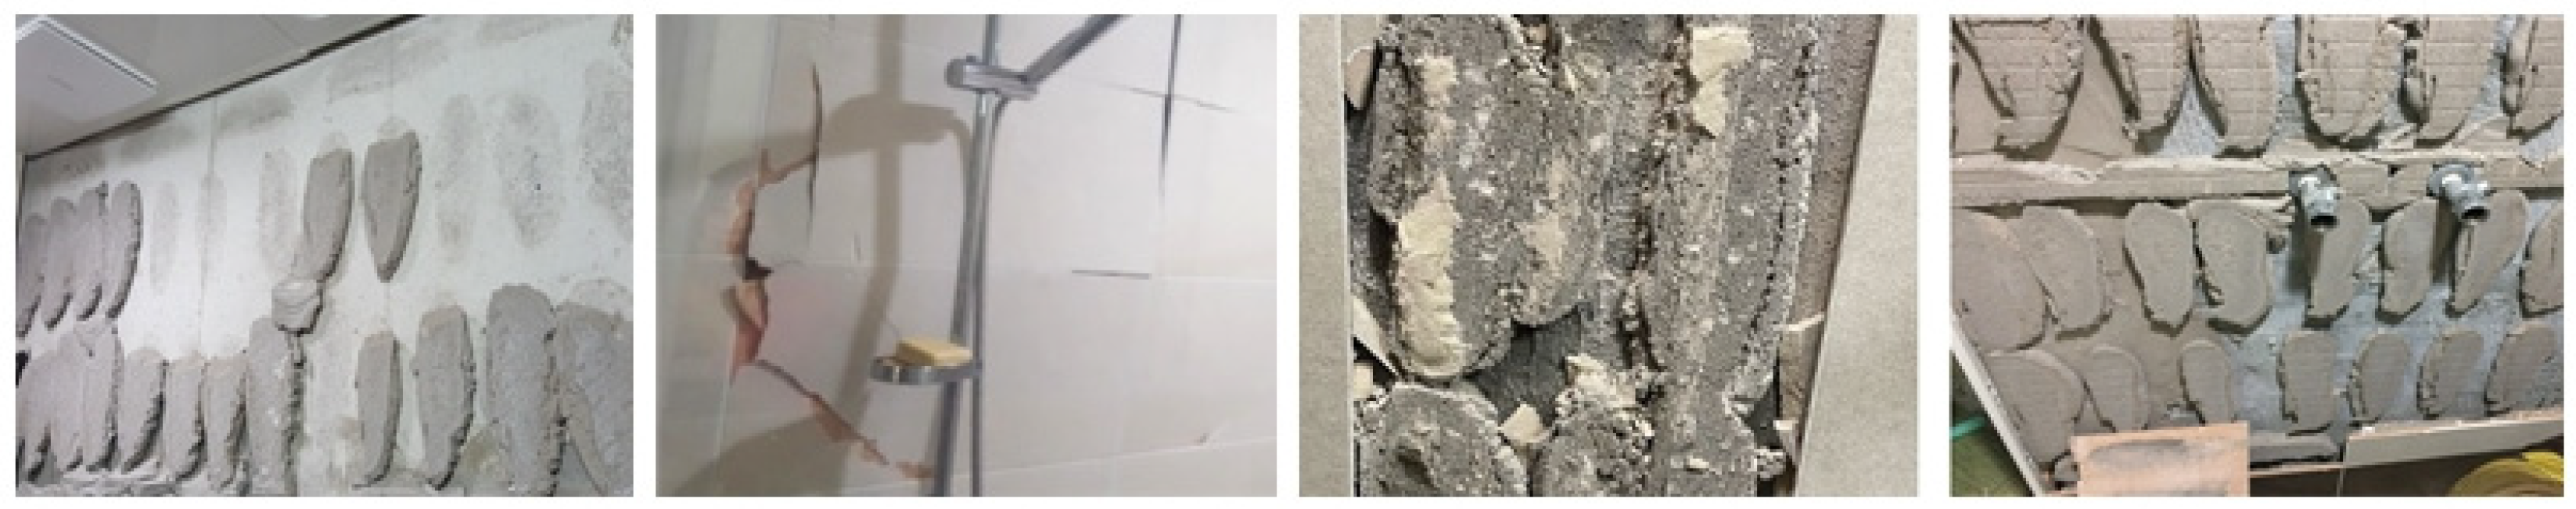
1. Introduction
2. Experimental Program
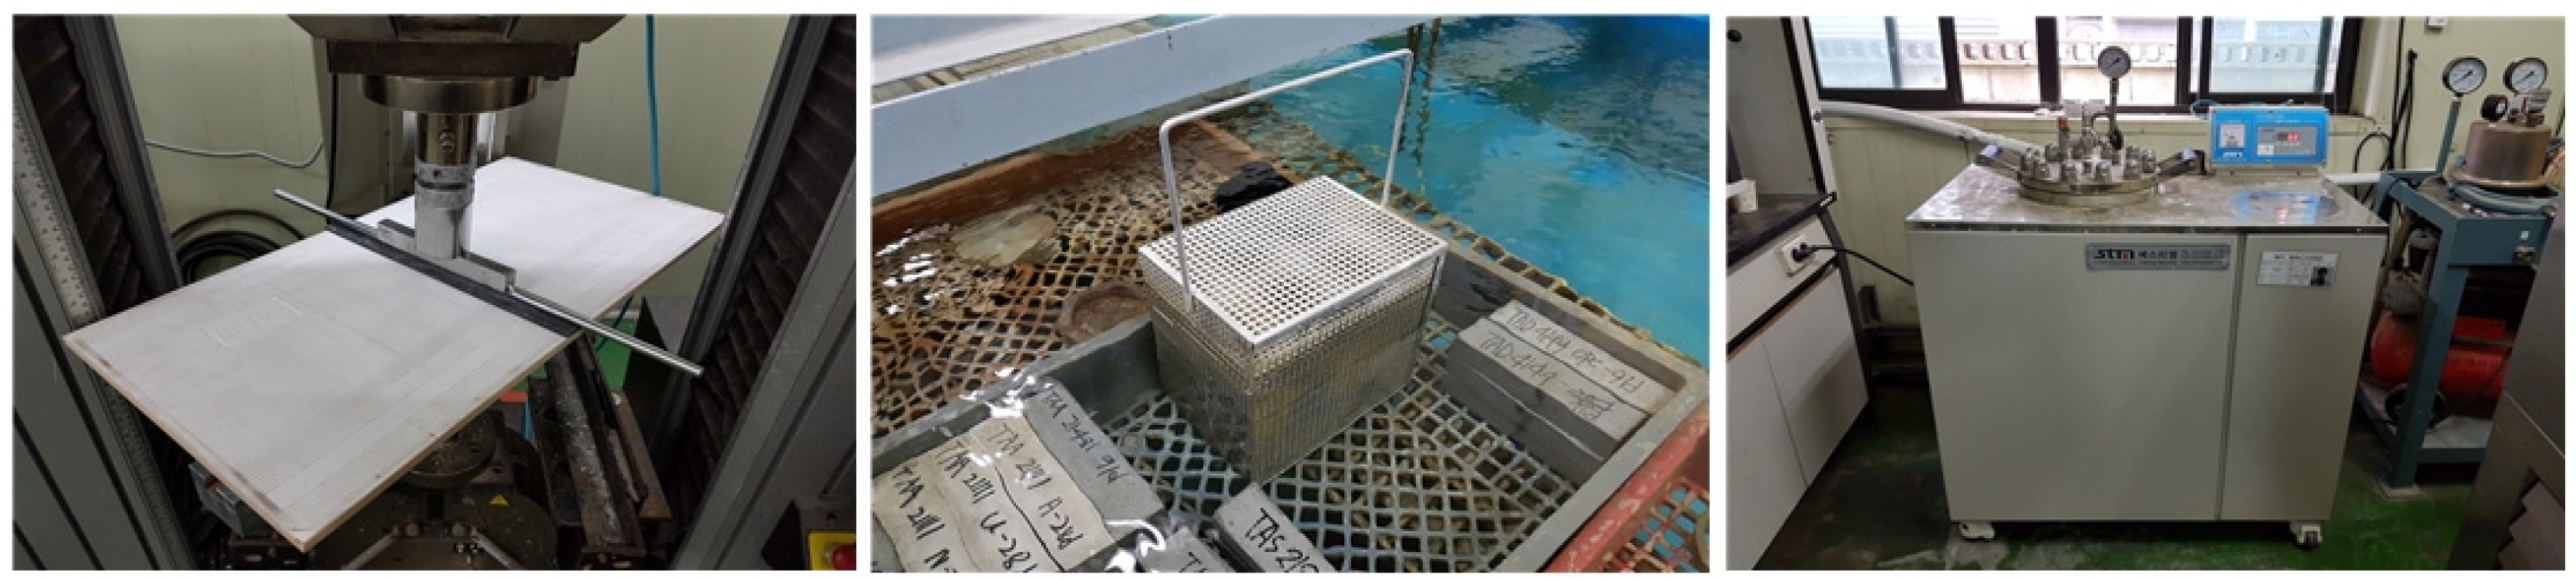
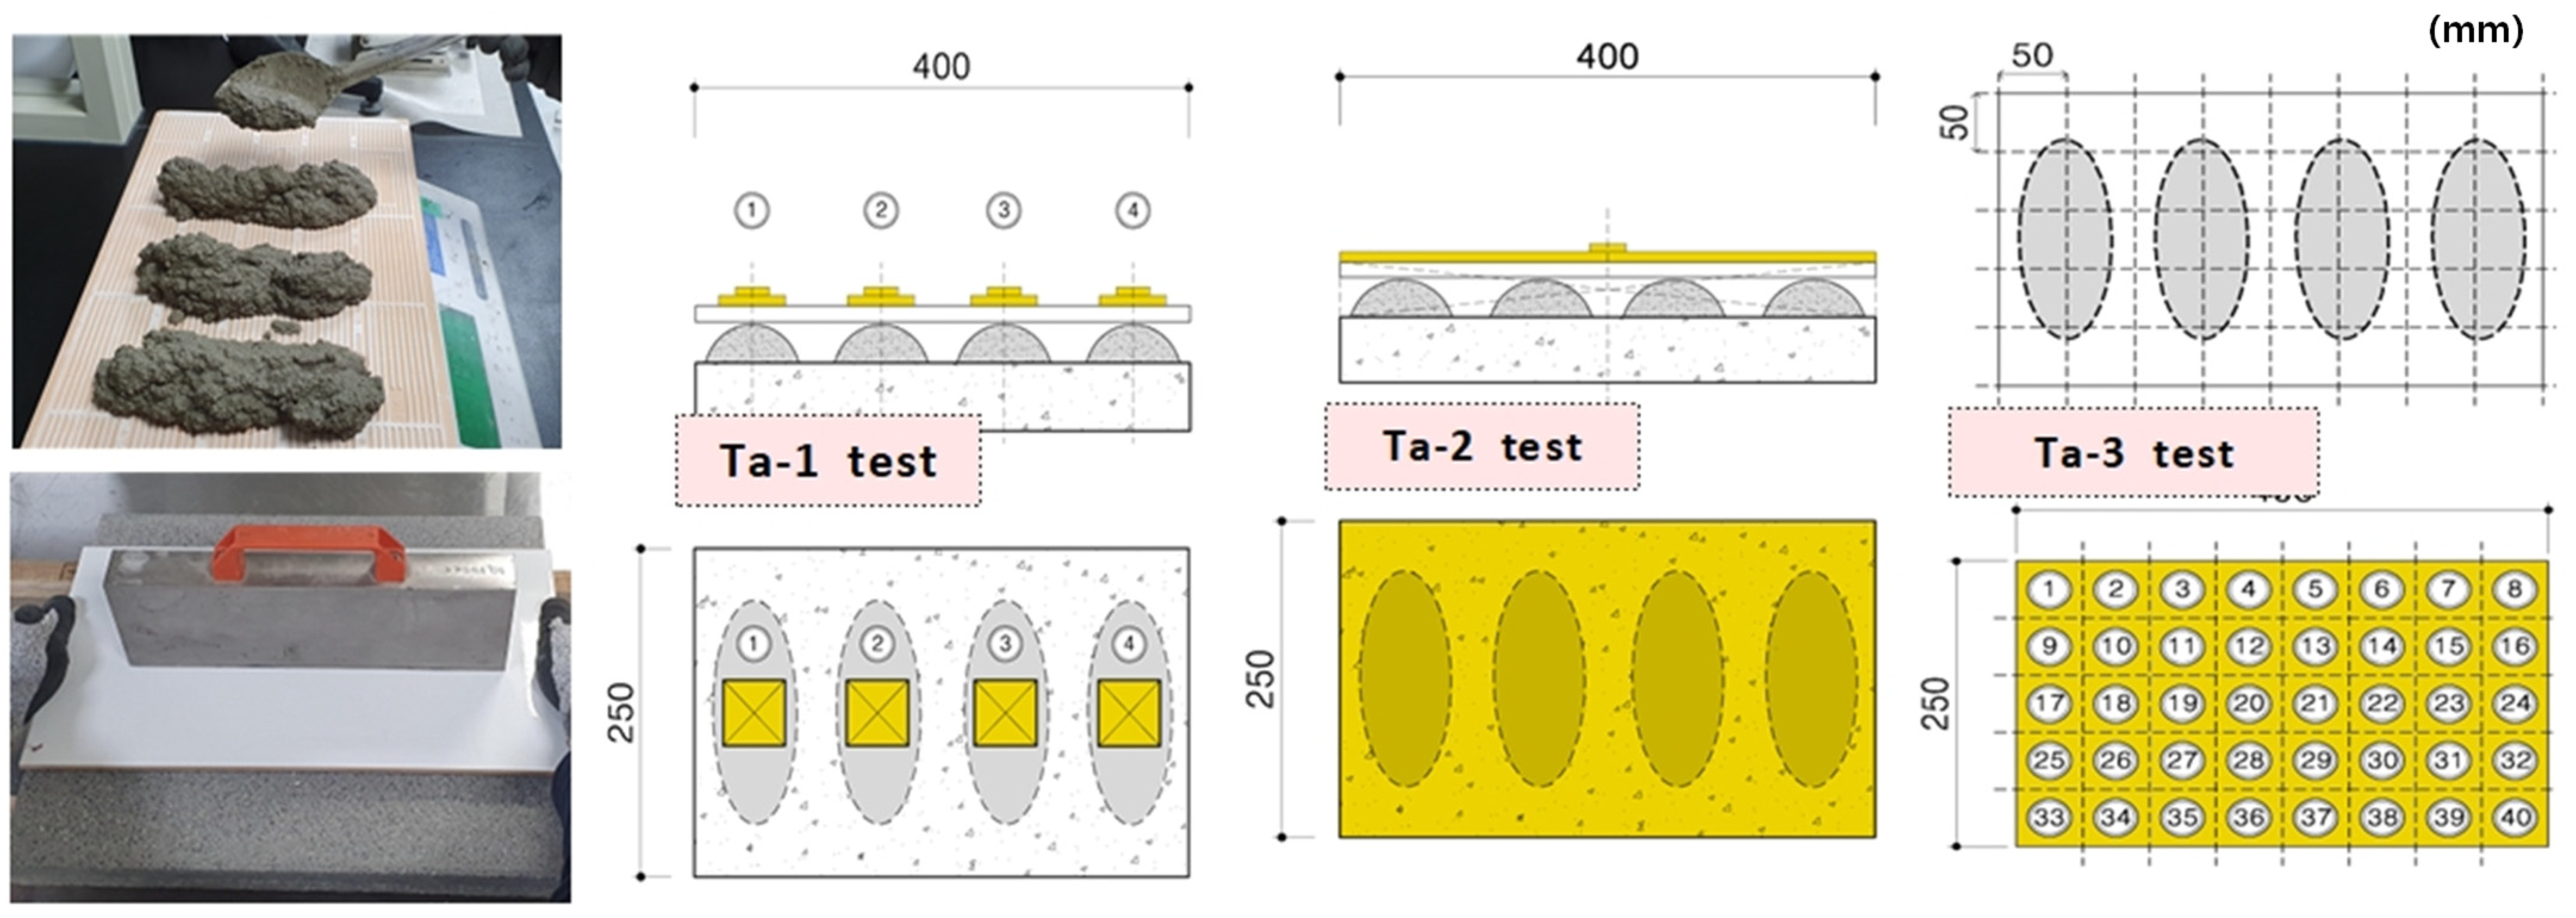
2.1. Tile Test (KS)
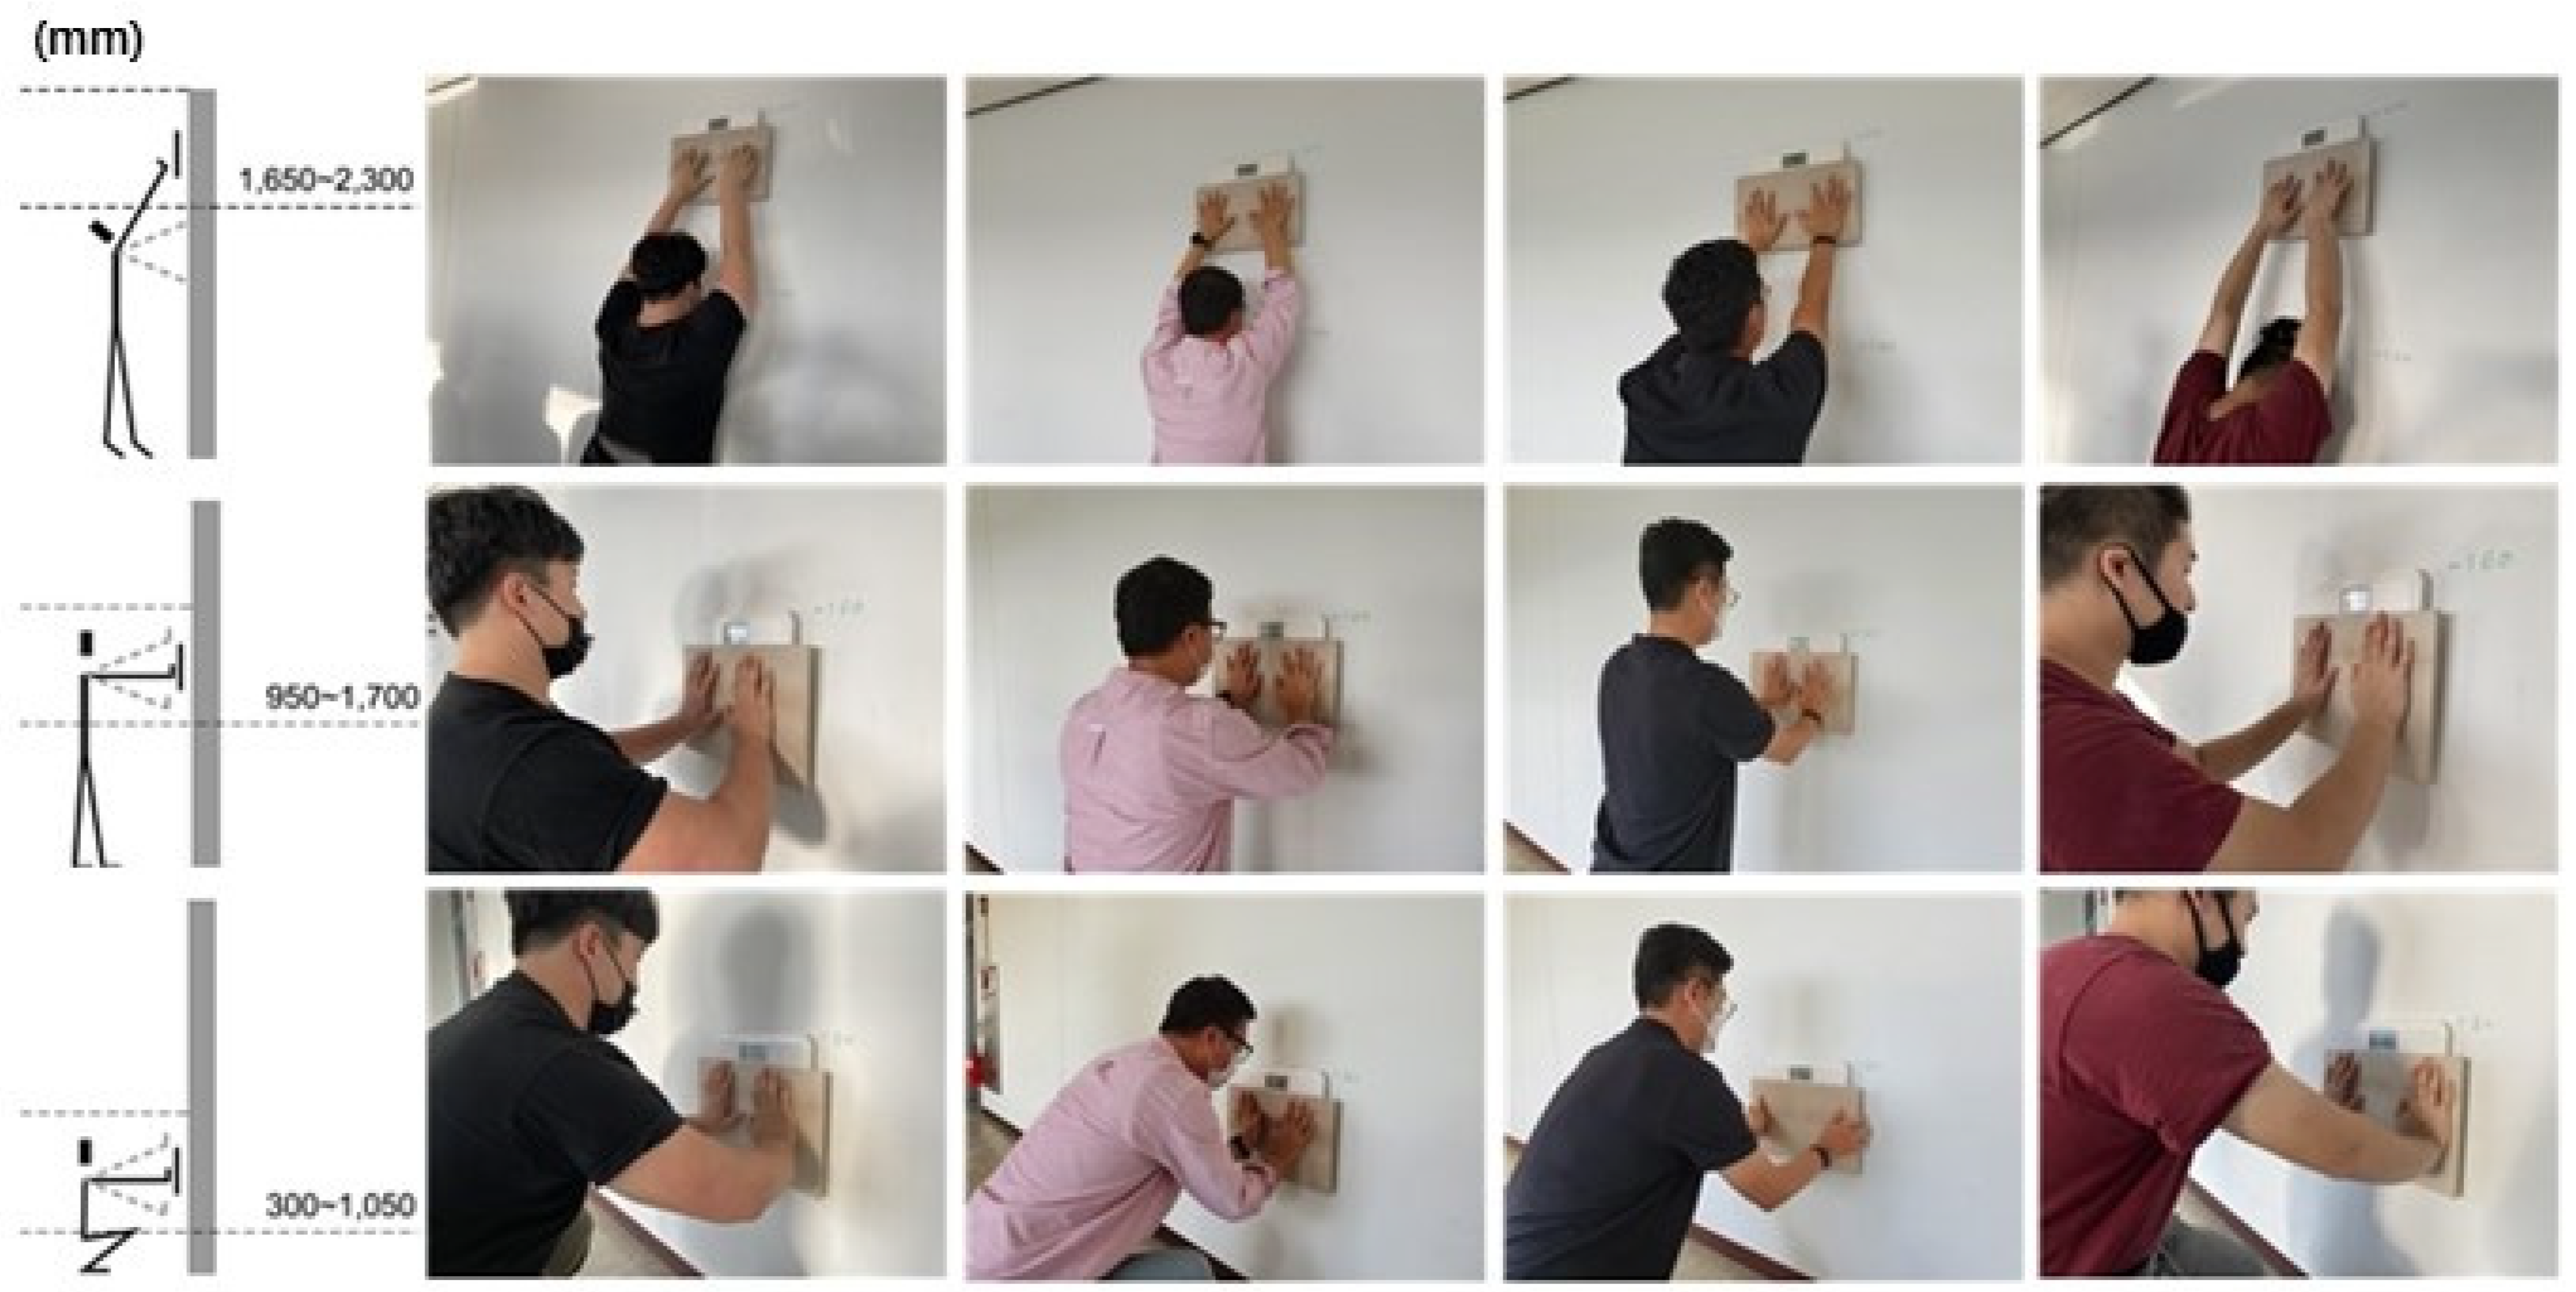
2.2. Pressure Setting with Pressure Experiments to Press and Glue Tiles
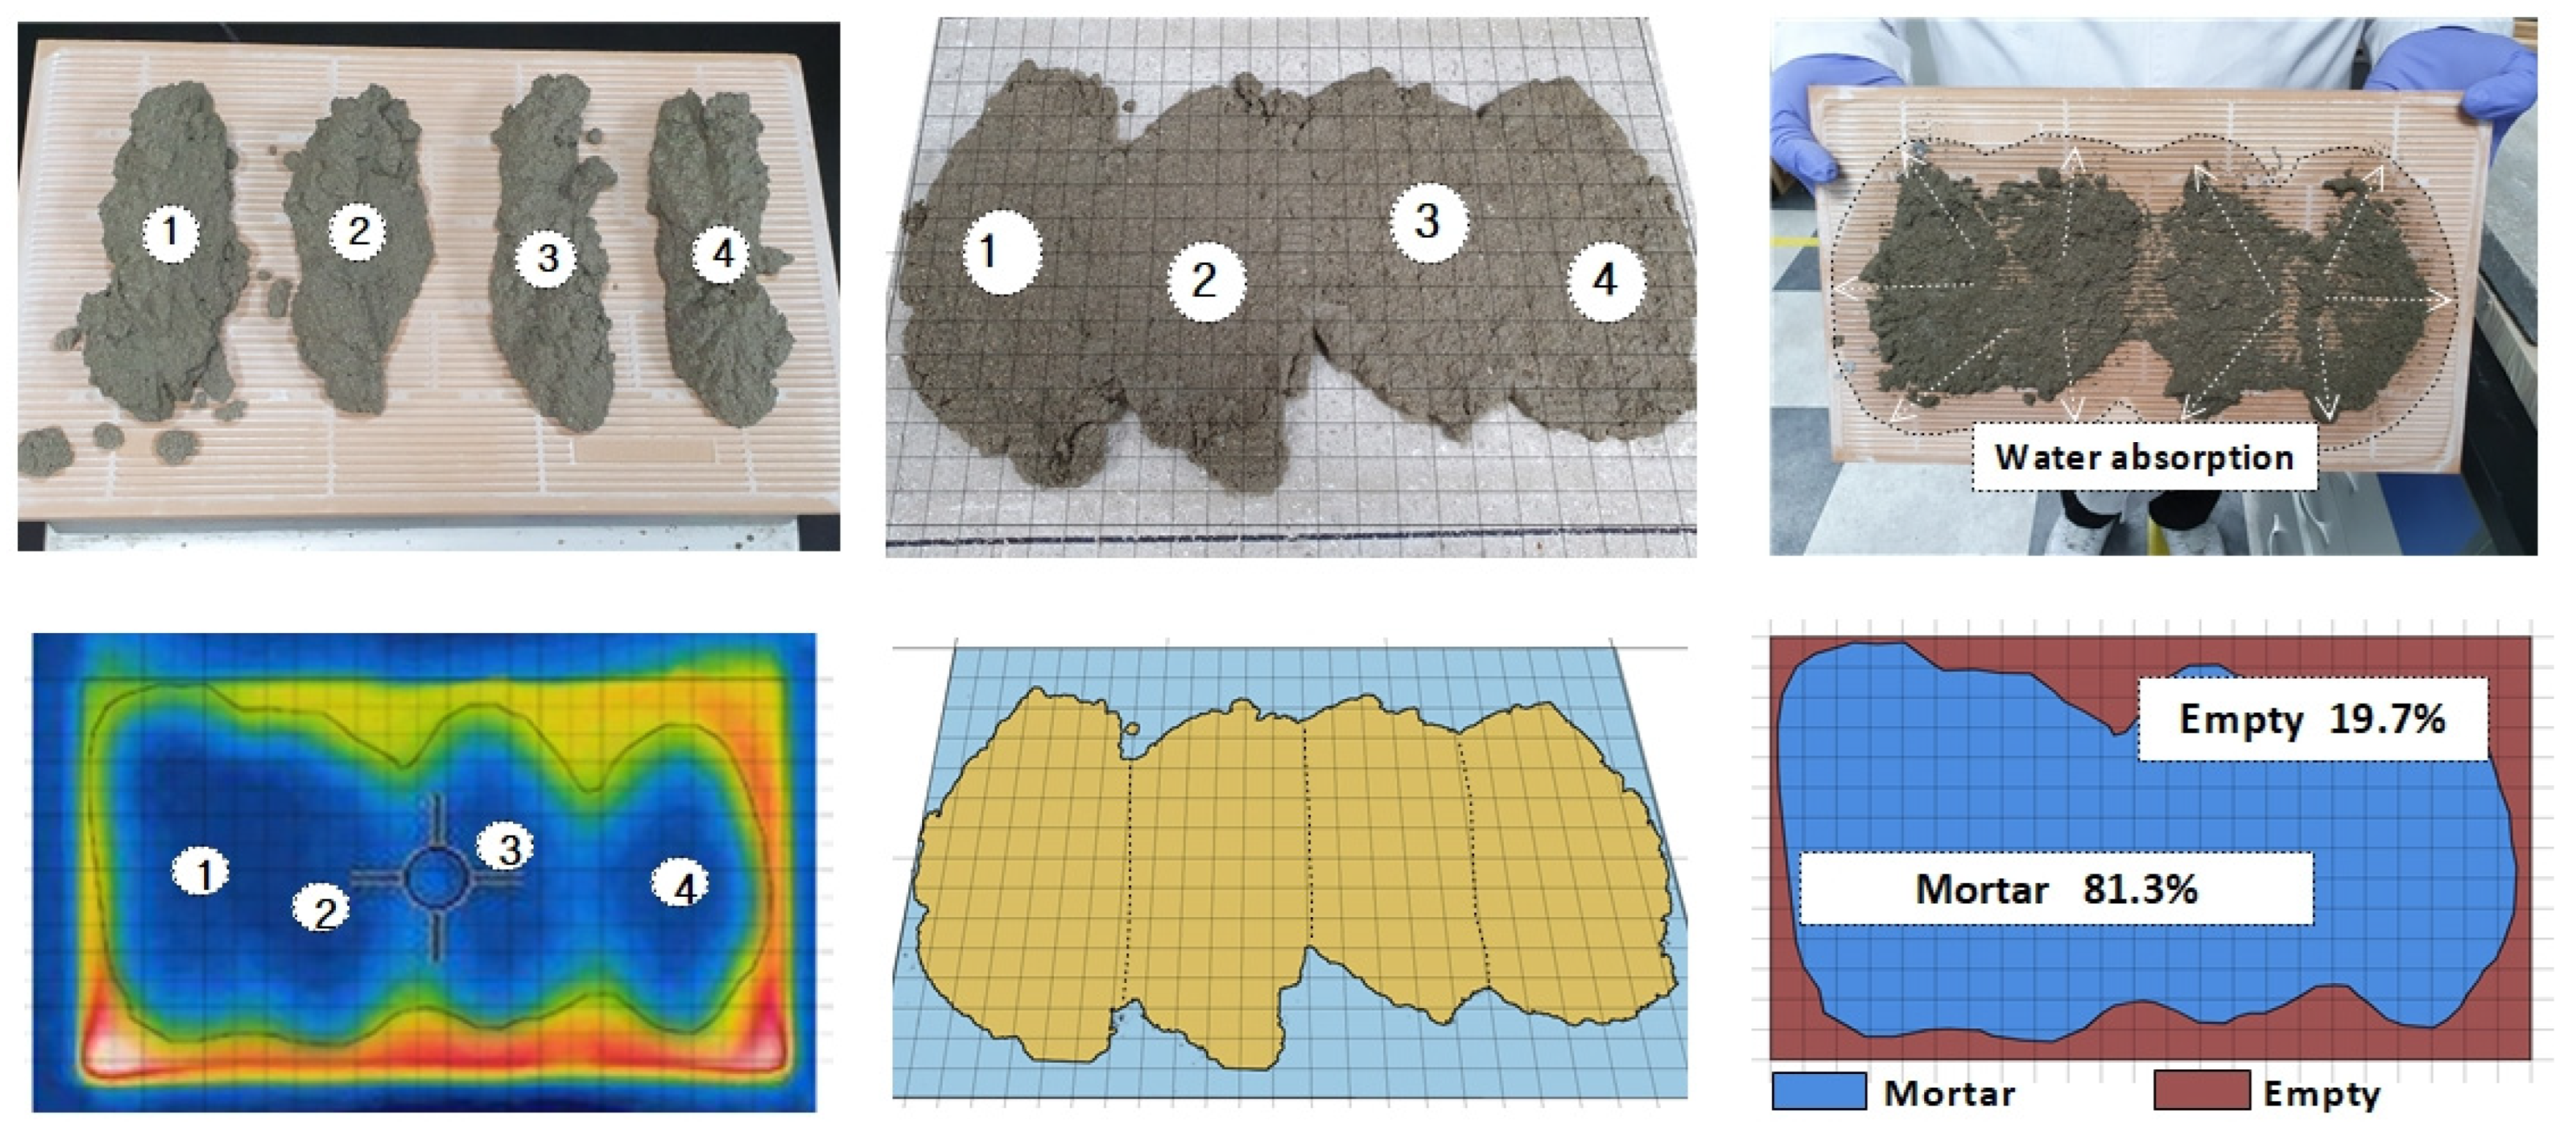
2.3. Adhesion Area Verification Method
2.4. Experimental Verification Method
3. Test Results
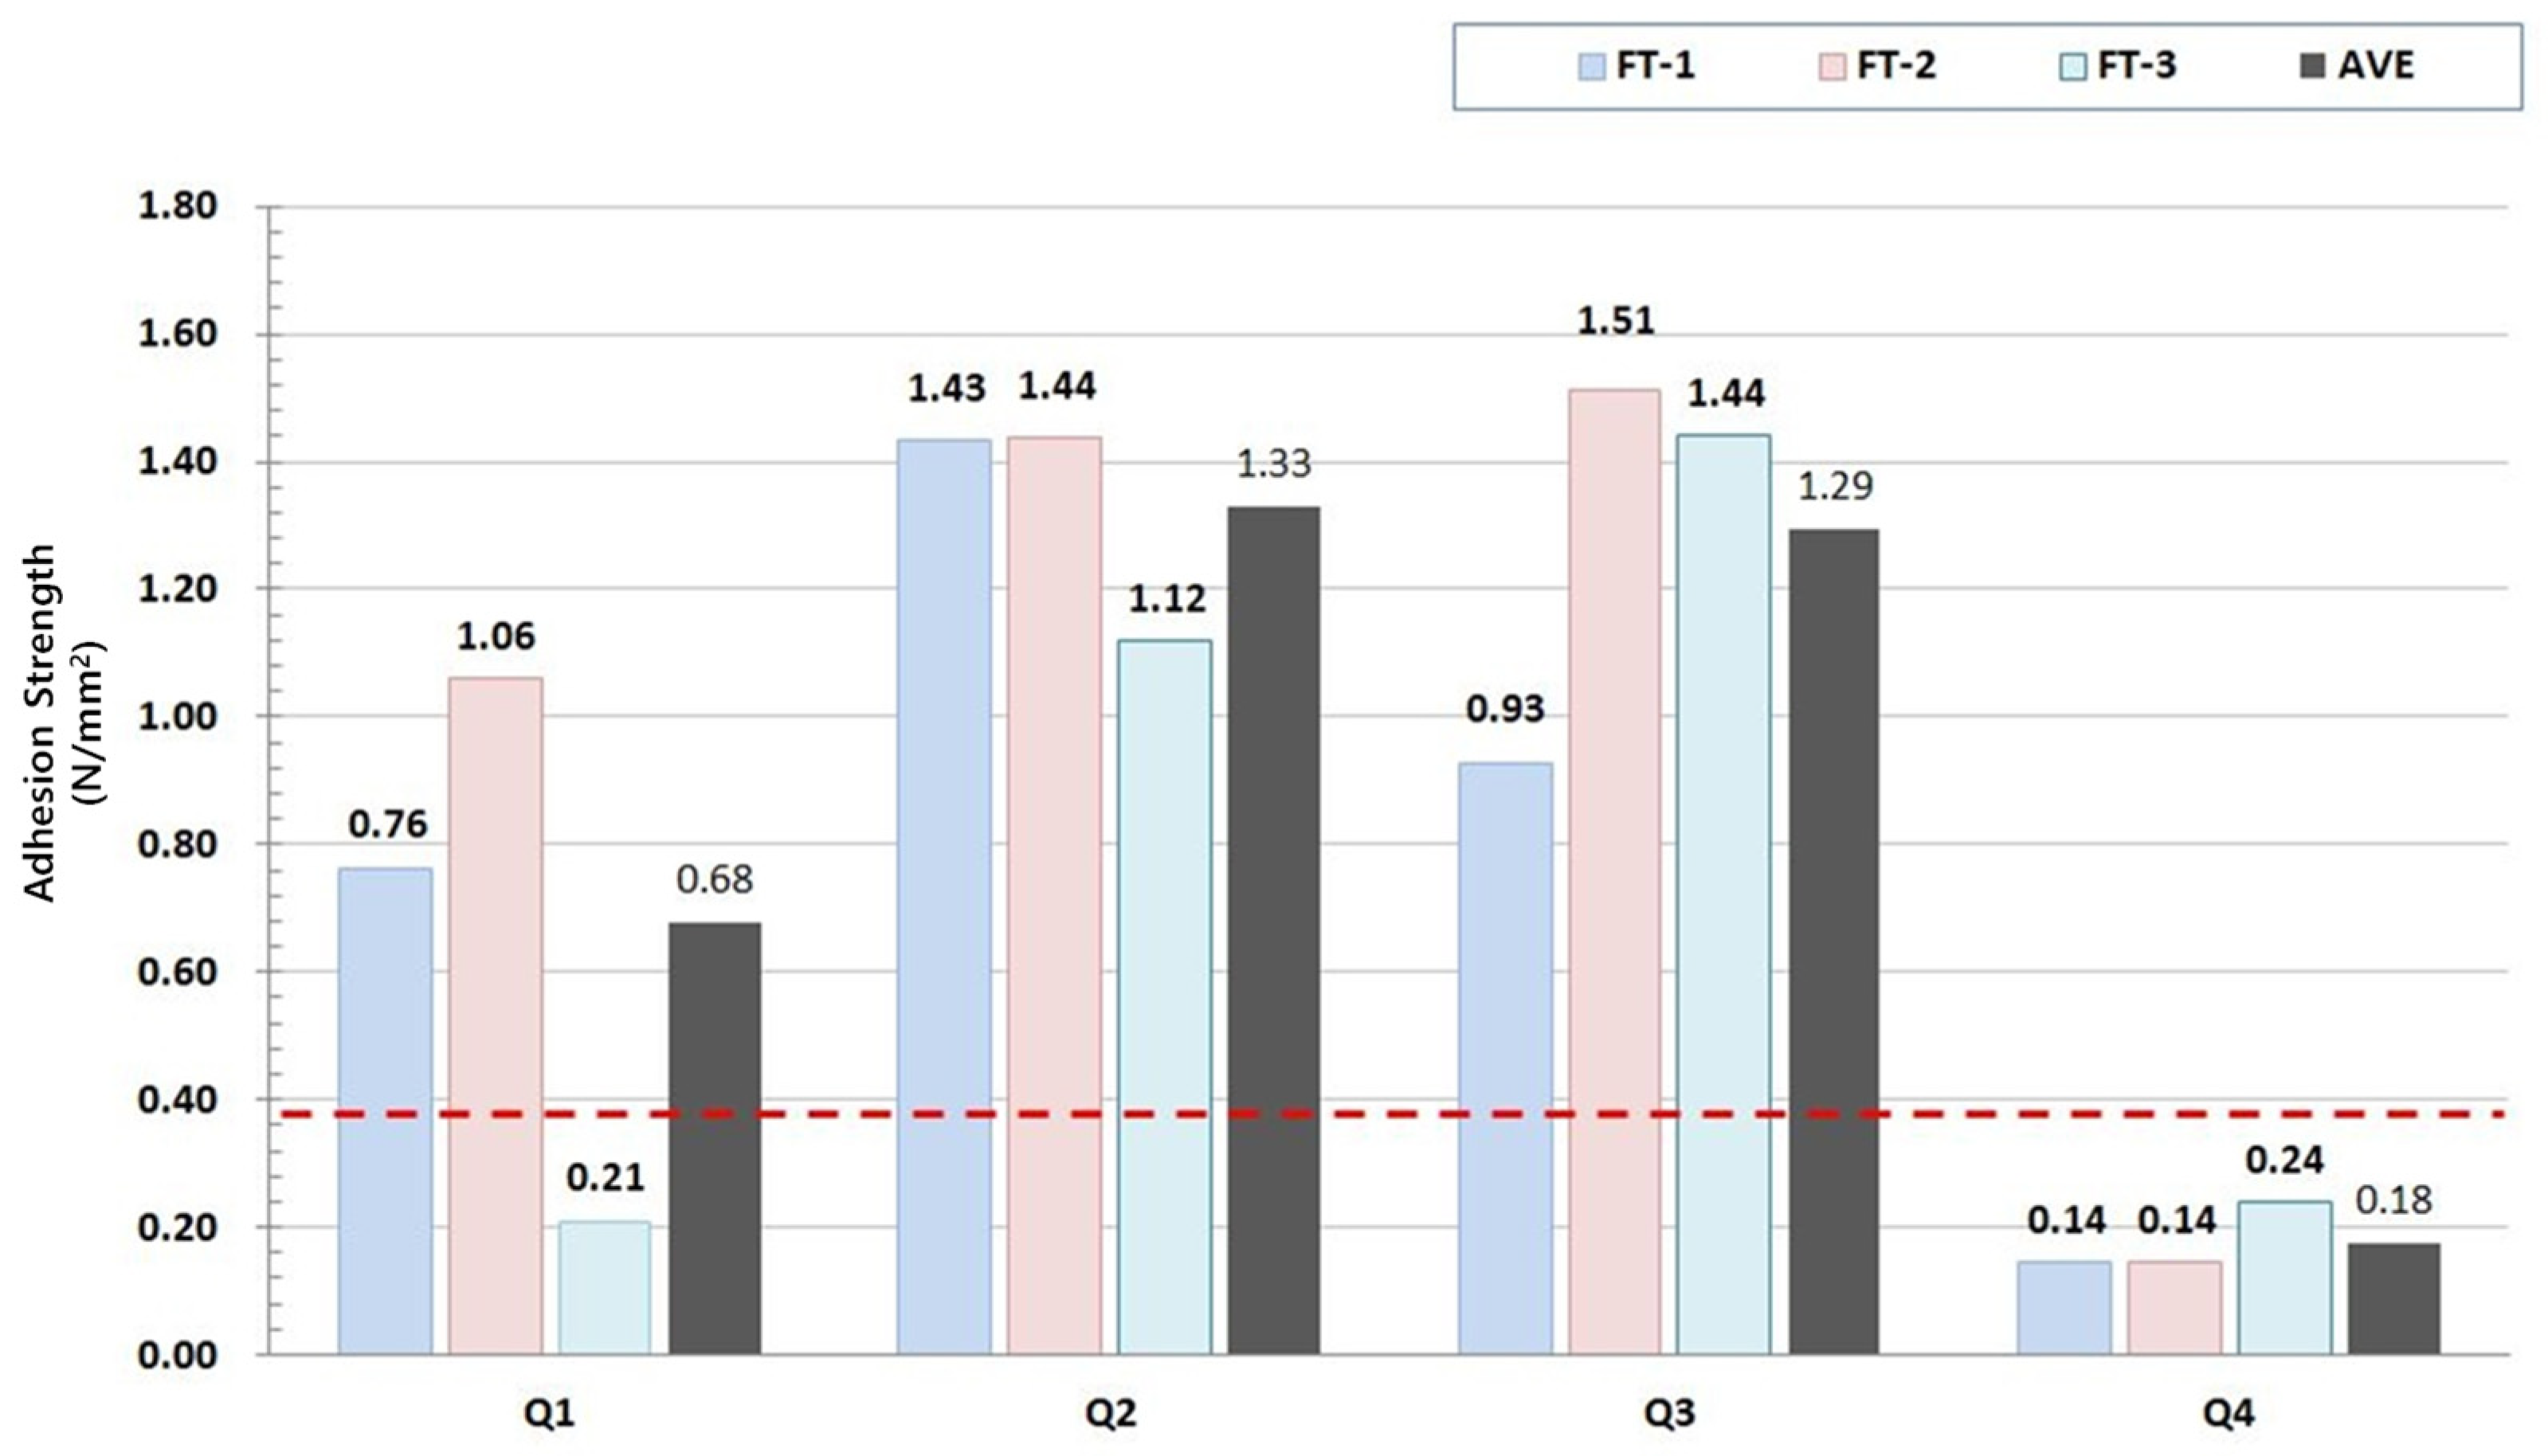
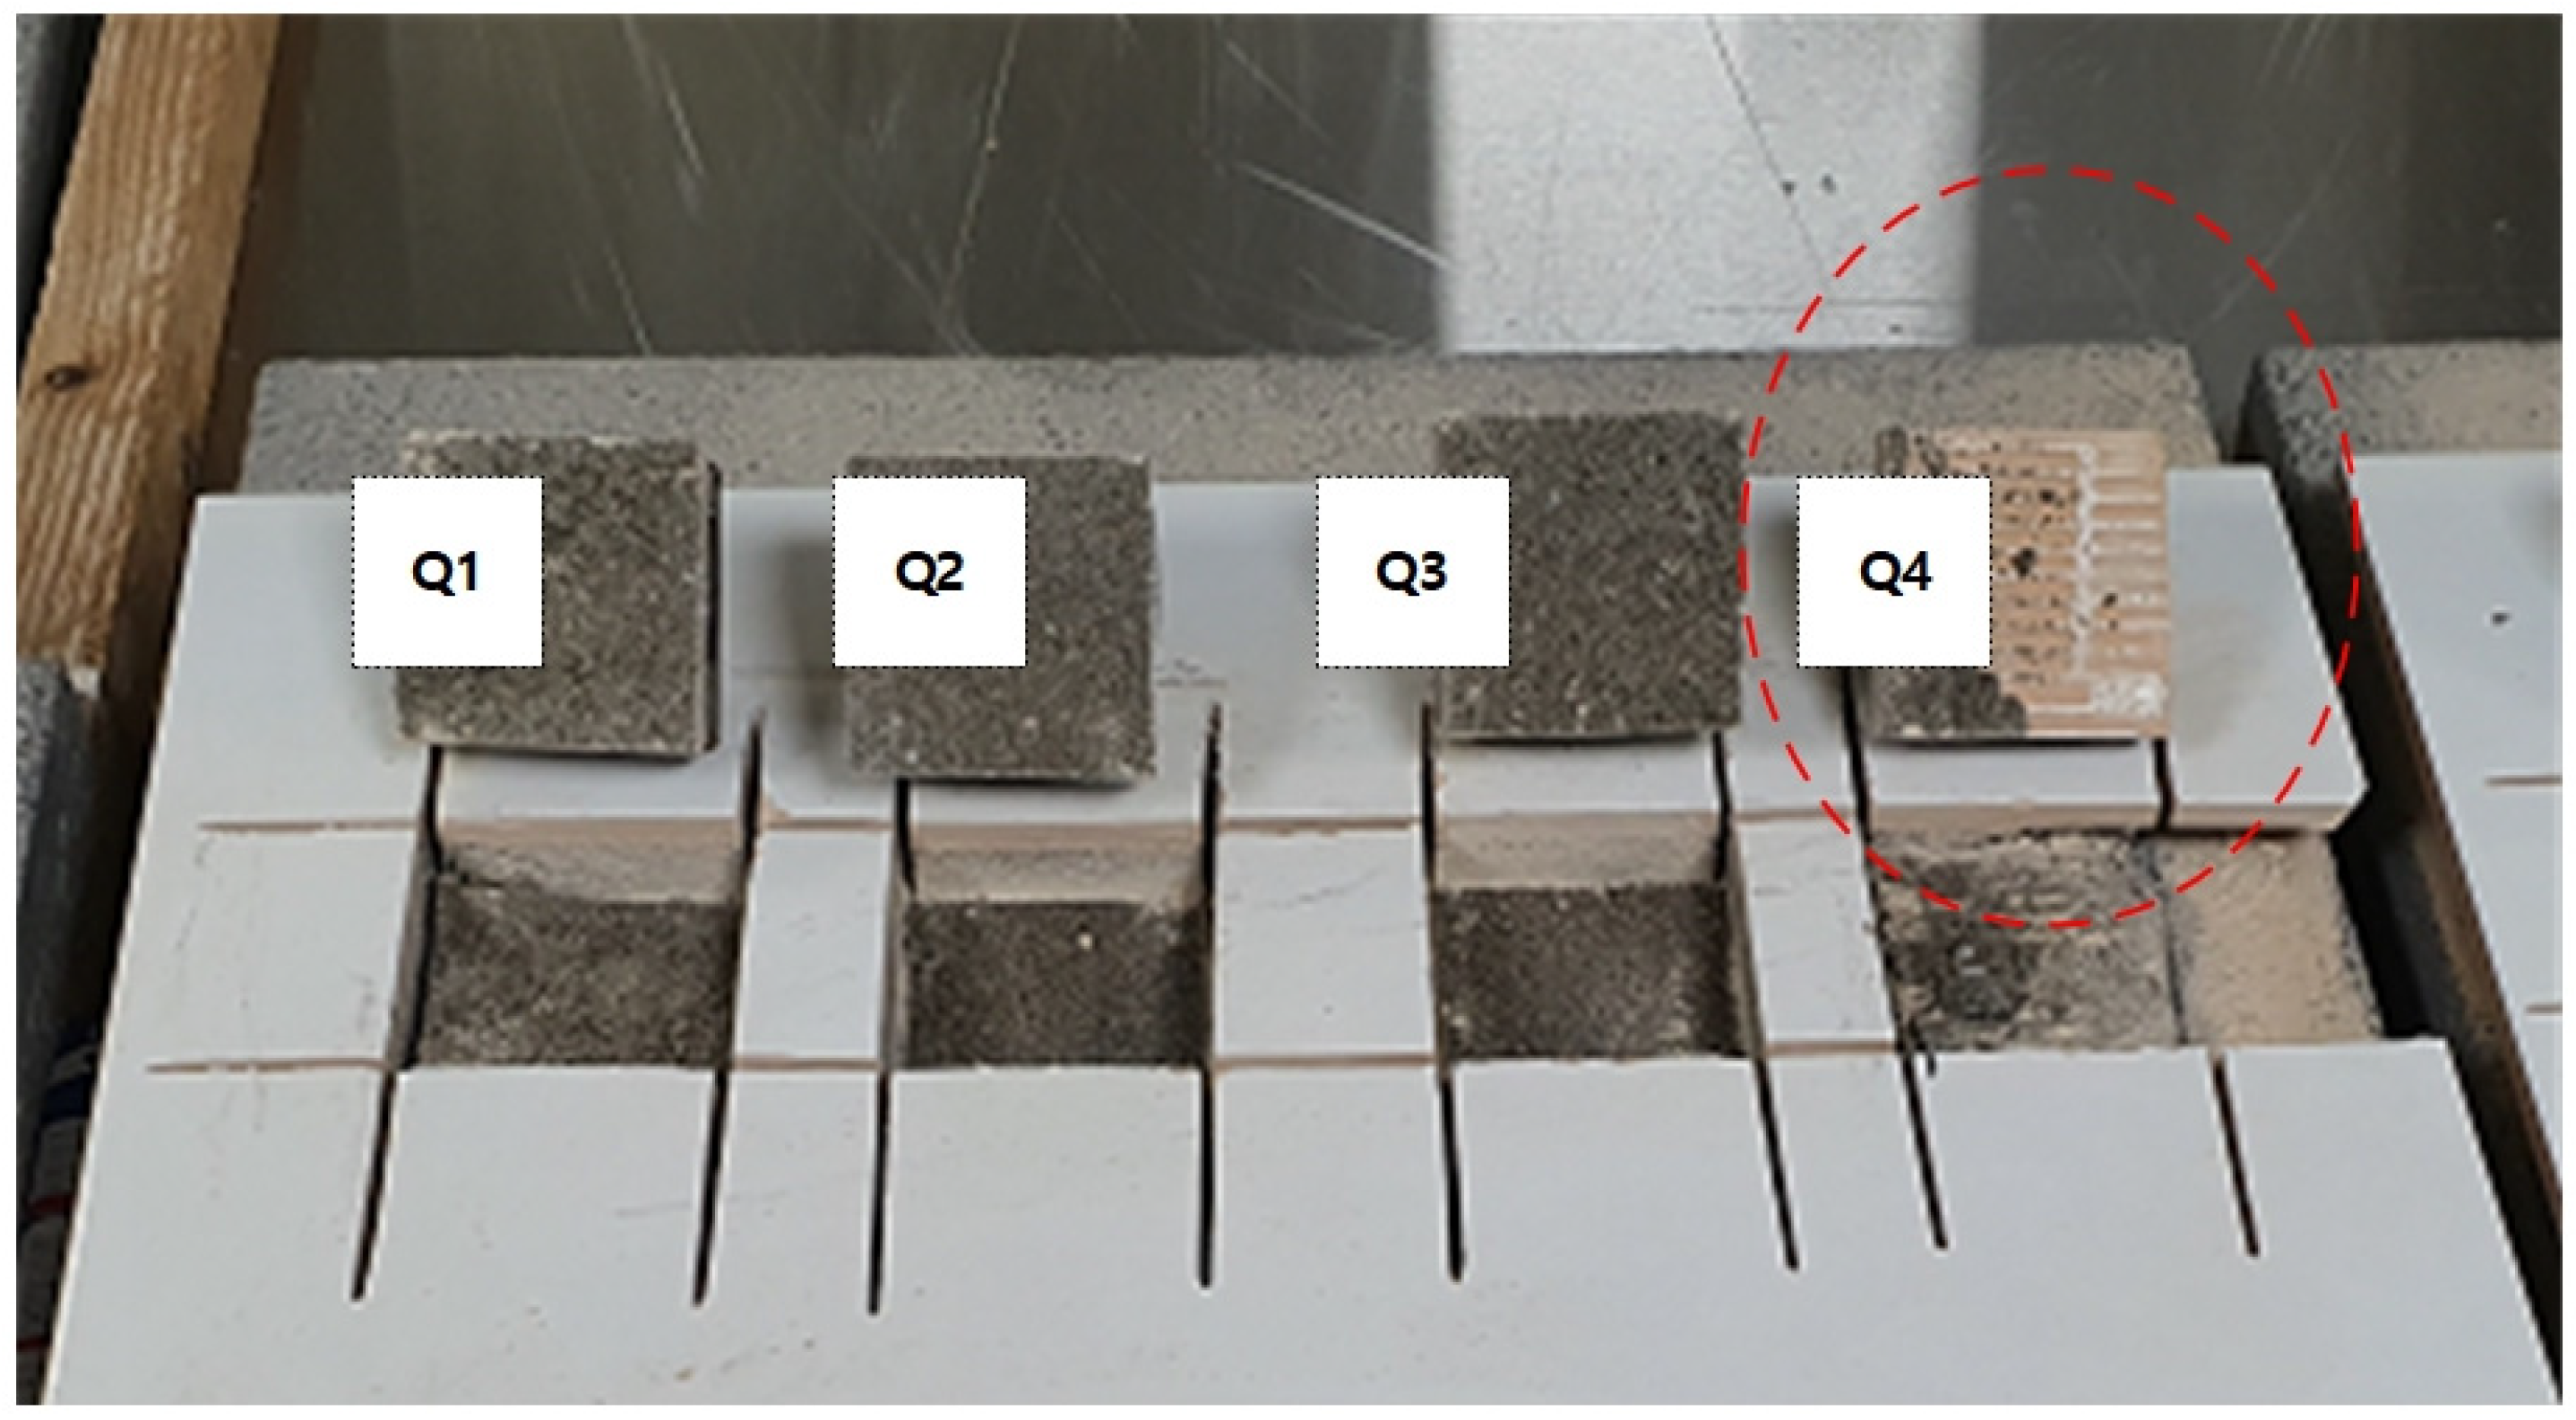
3.1. Partial Adhesive Strength (Ta-1) Experiment Results
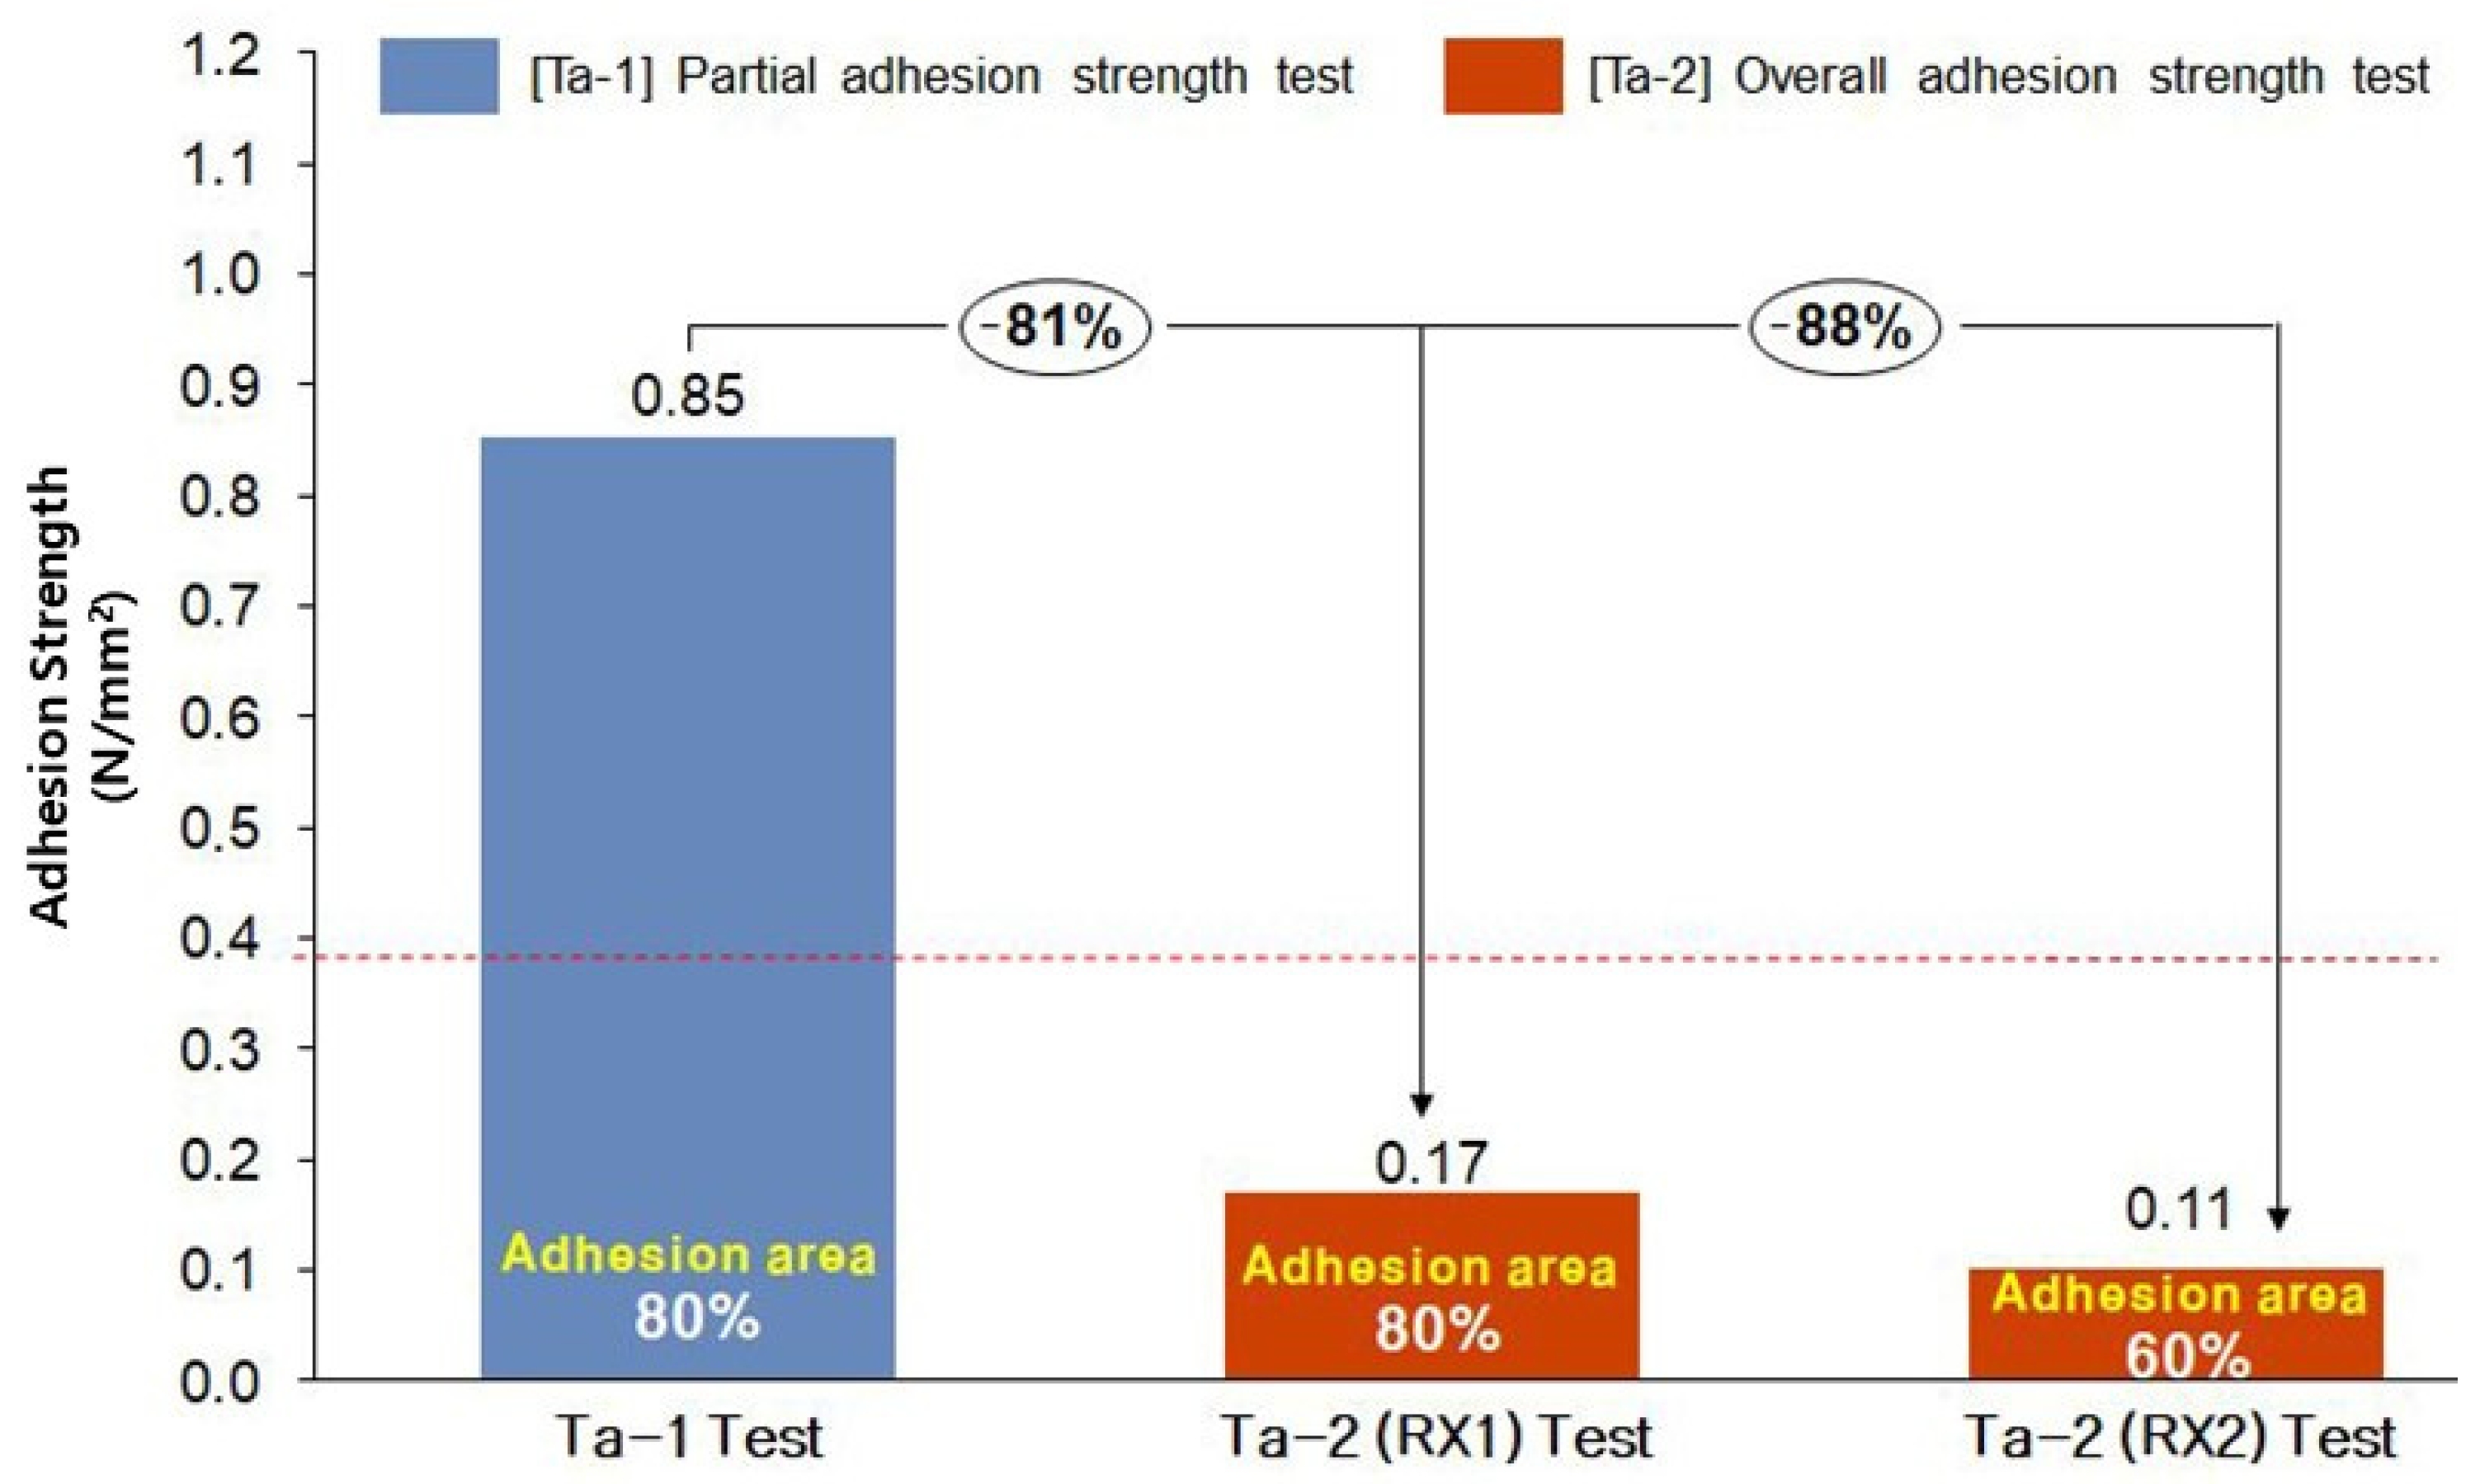
3.2. Overall Adhesive Strength (Ta-2) Experiment Results
3.3. Partial Adhesive Strength (Ta-3) Experiment Results after Splitting
4. Conclusions
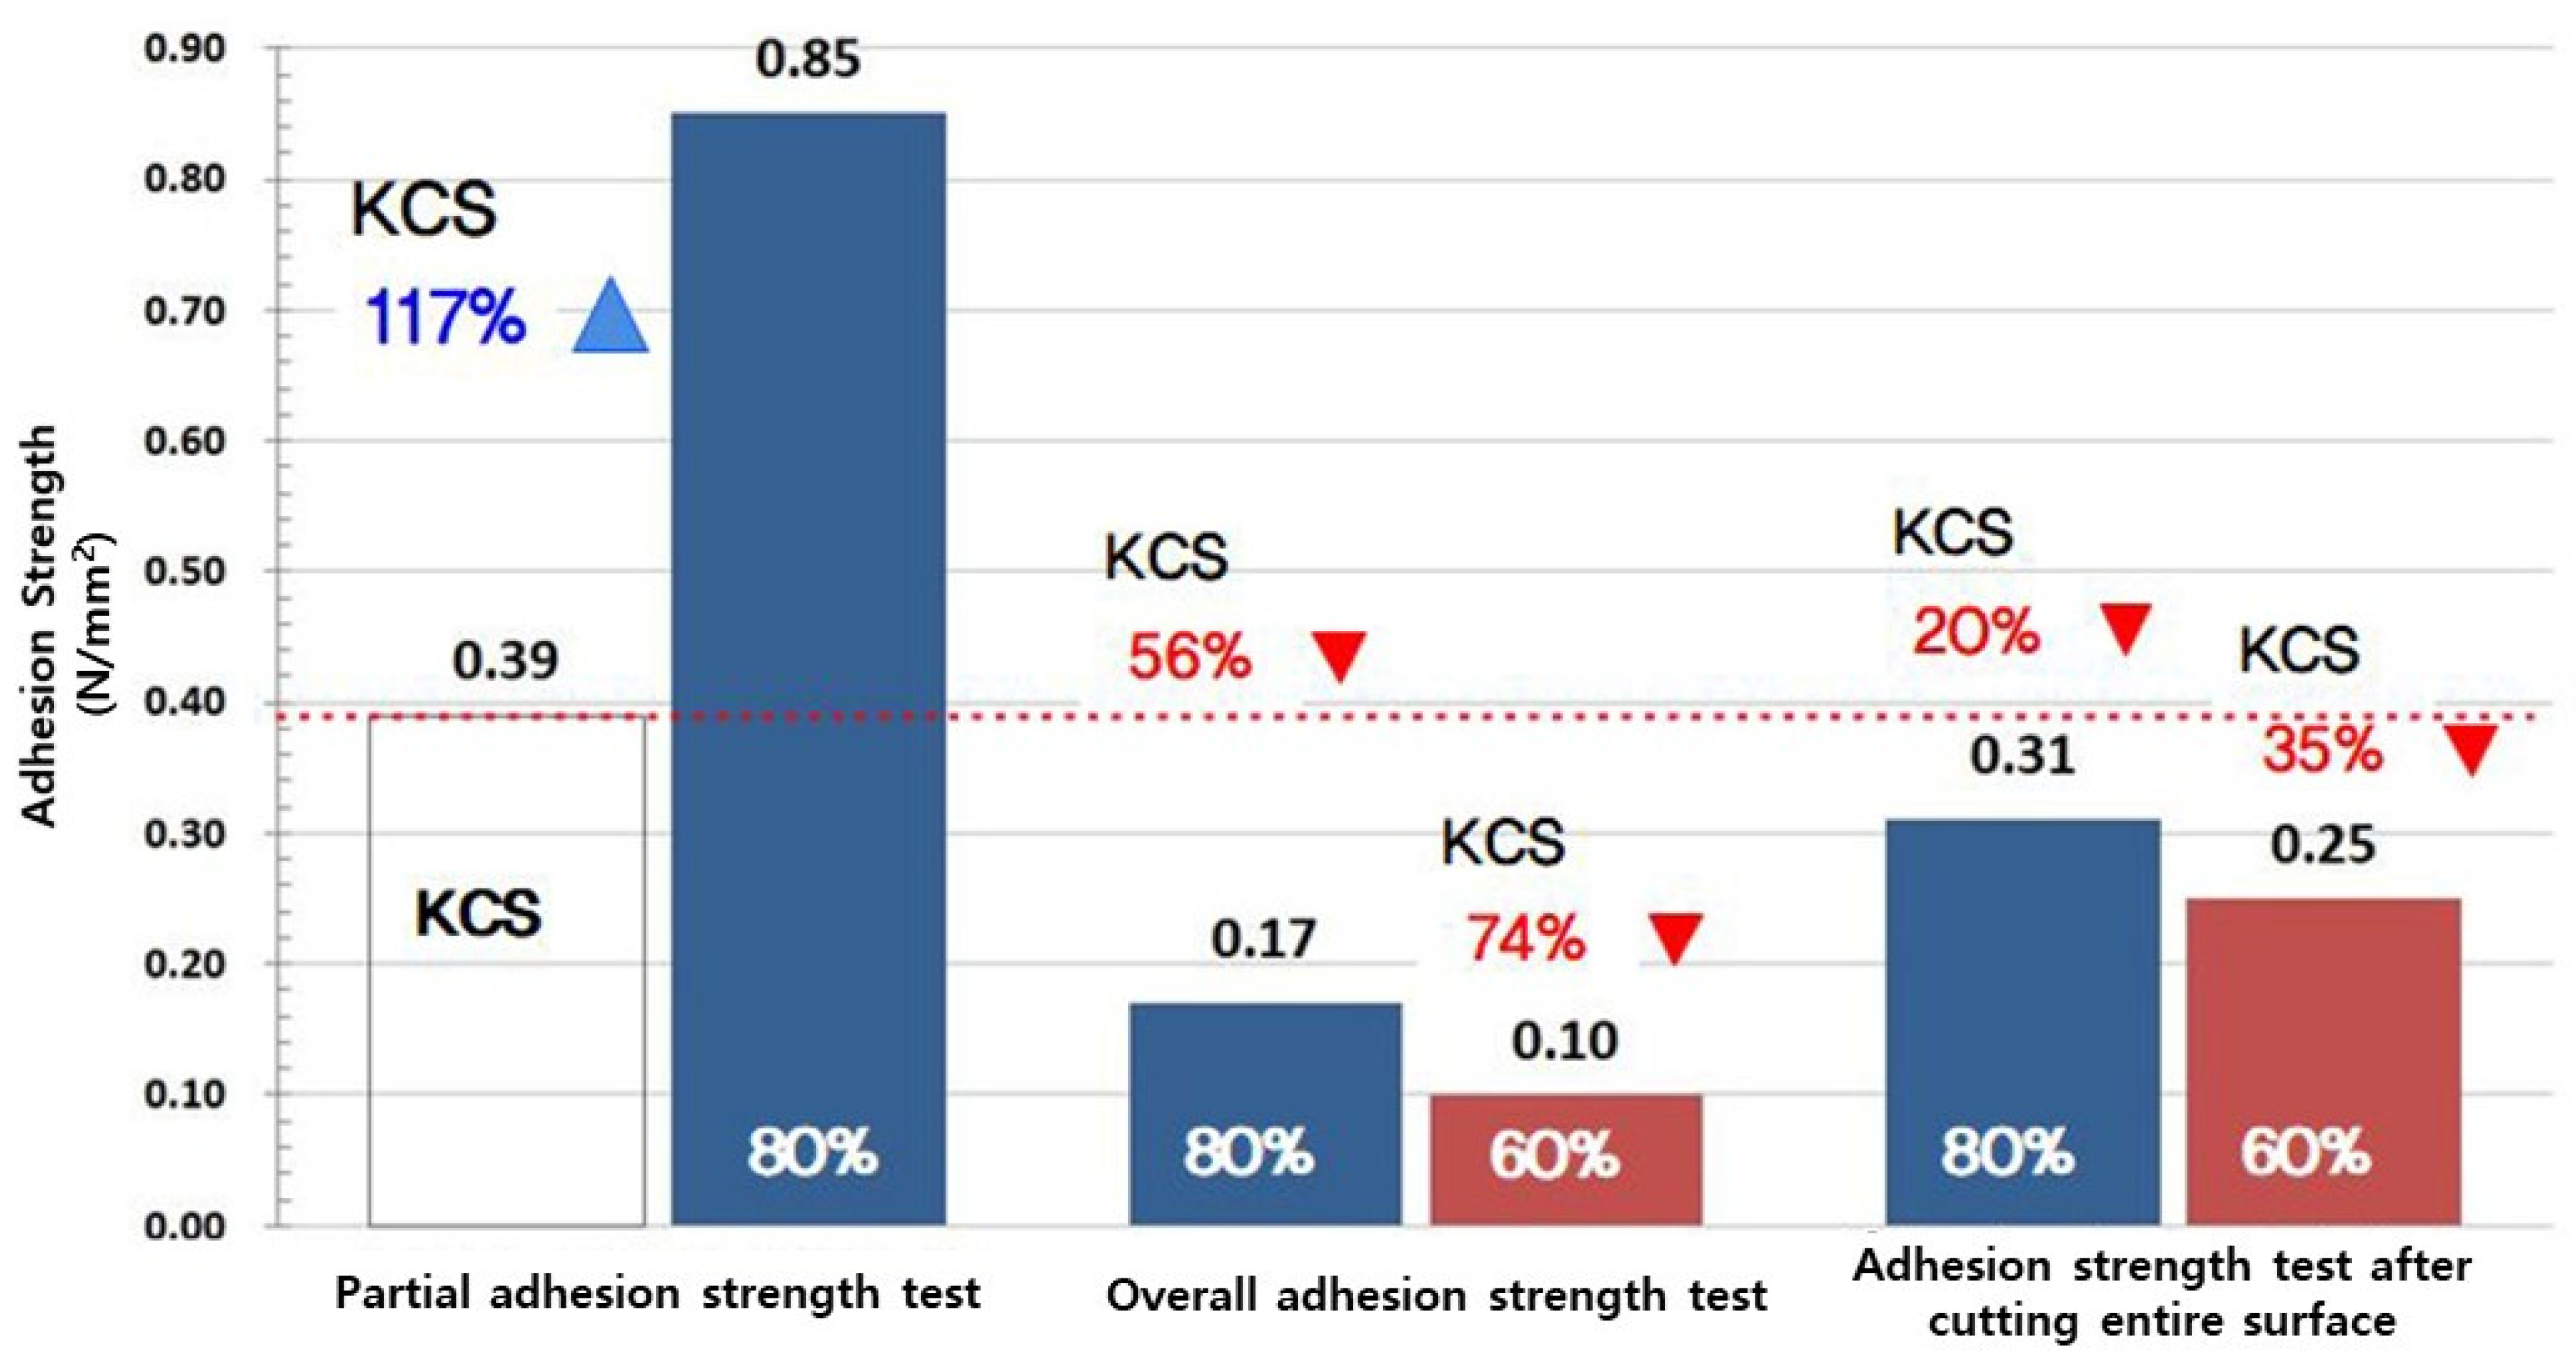
- Most of the bathroom wall tiles of apartment houses are being constructed using the mortar method, but the lack of attachment area for large tiles does not even fill the 80% mortar (adhesive), which is the minimum attachment area, so lawsuits for construction defects are constantly occurring every year. Tile adhesive strength was measured in three ways: ① partial adhesion strength measurement (KCS based on construction specification, 80% adhesion area), ② overall adhesion strength measurement (60% and 80% adhesion area), and ③ partial adhesion strength measurement (60% and 80% adhesion area) after cutting the overall tile to 50 × 50 mm size.
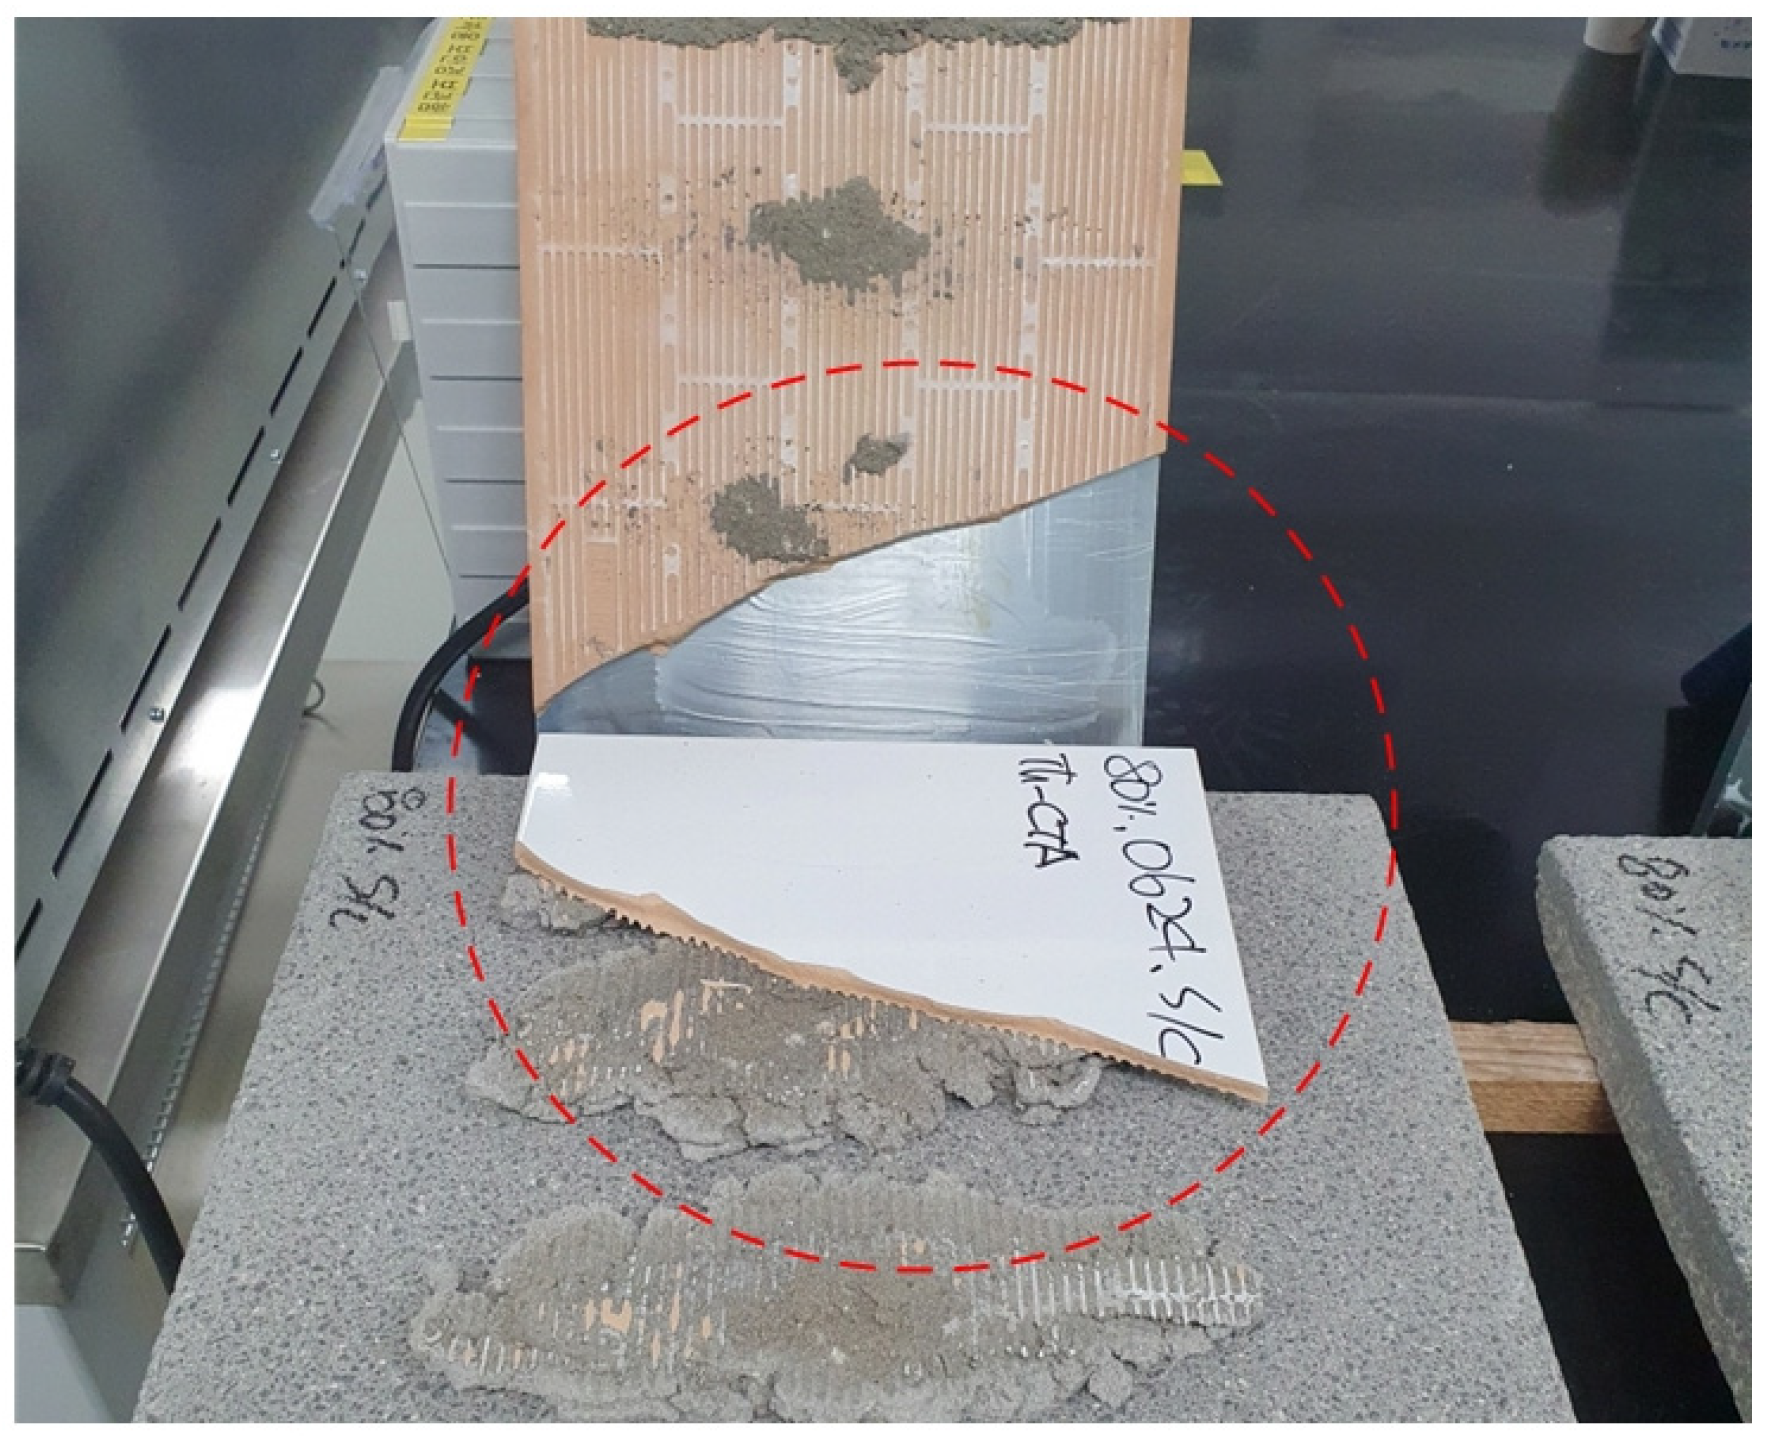
- As a result of the experiment for [Ta-1], the partial adhesion strength averaged 0.85 N/mm2 for four areas attached by the mortar having 80% of the adhesion area, which was more than 217% higher than the 0.39 N/mm2 suggested by the Korea Construction Specification (KCS). Looking at the shape of the destruction, it was confirmed that the Q2 and Q3 areas of the tile’s back face were eliminated in the form of more than 90% of the mortar, but Q4, the corner of the tile, confirmed that the combination of the mortar and the parent body, which is the tile-holding part, was eliminated with less than 30% adherence.
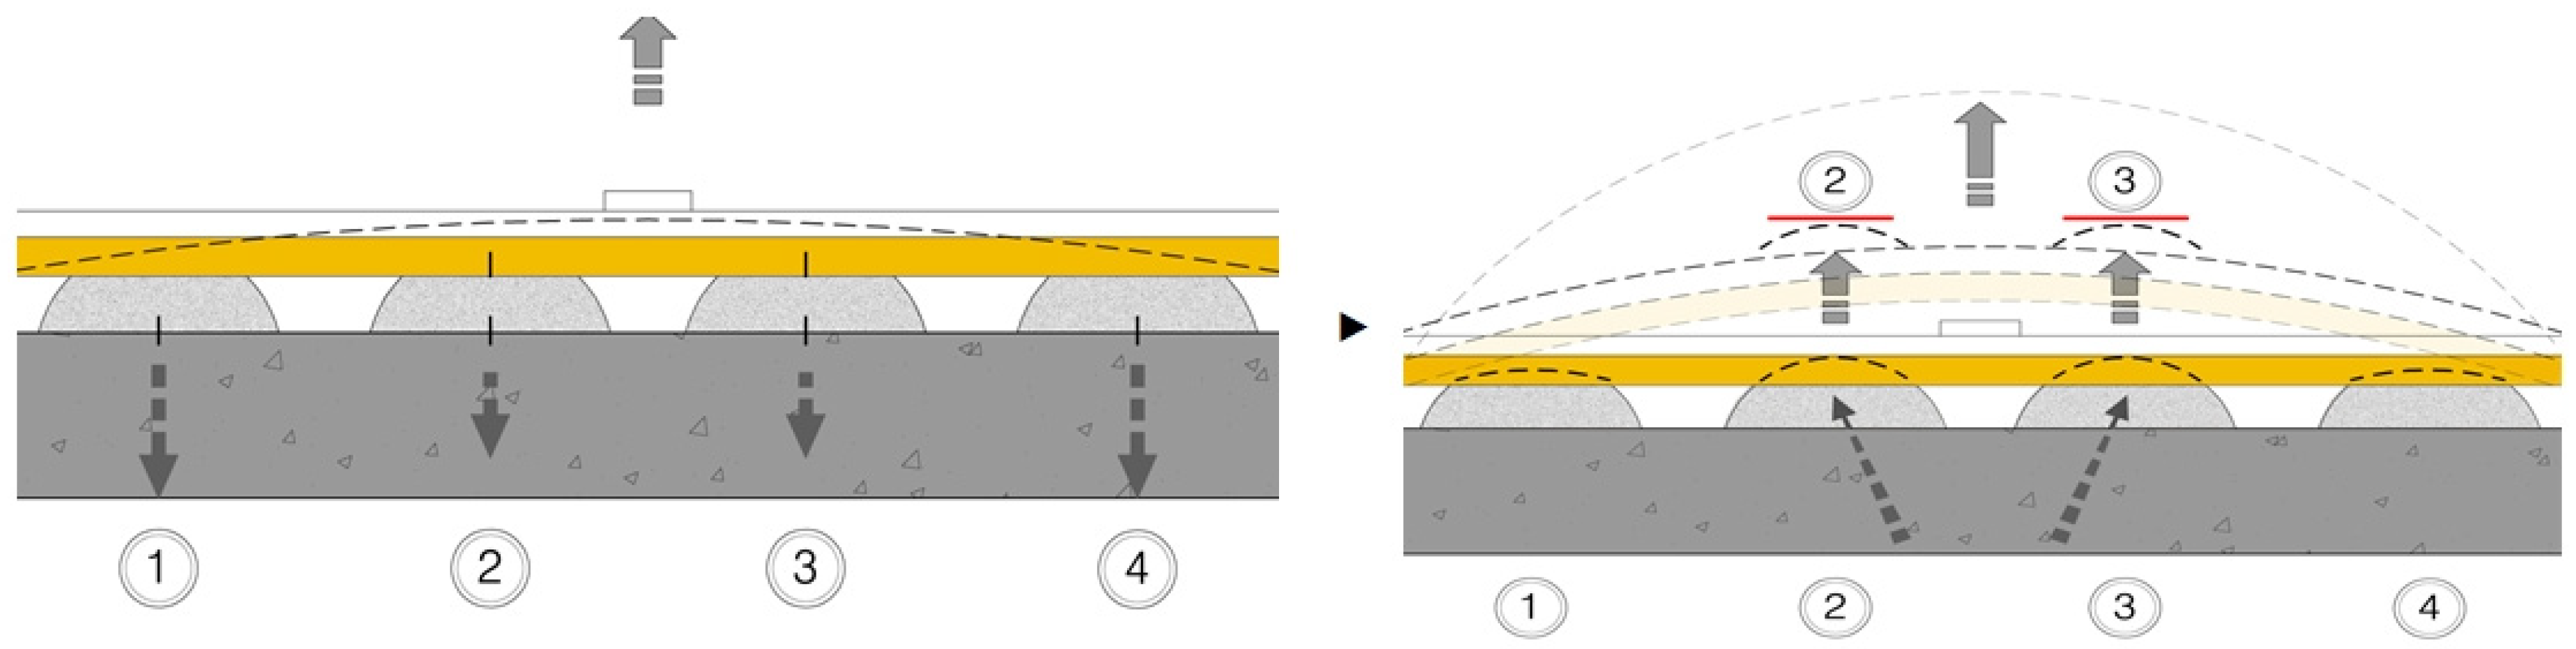
- As a result of the experiment for [Ta-2], the average adhesion strength of RX1 with an 80 ± 3% tile attachment area of 250 × 400 mm was measured to be 0.17 N/mm2, and the average adhesion strength of RX2 with 60% (±3) tile attachment area of 250 × 400 mm was measured to be 0.10 N/mm2. Compared with the average adhesion strength of 0.85 N/mm2 of the partial adhesion strength [Ta-1], RX1 was −81% (0.17 N/mm2), and that of RX2 was −88% (0.10 N/mm2), which was significantly lower. In the process of the experiment, a pin was fastened to one point in the center of the test body among four (80%) attached mortar and was drawn. As the central point’s concentration stress was a bending phenomenon that pulls the attachment on the parent (concrete substrate) + tile, the attachment area of the middle attachment mortar decreased first. It is judged that the adhesion of the edge attachment mortar was not expressed and had been eliminated.
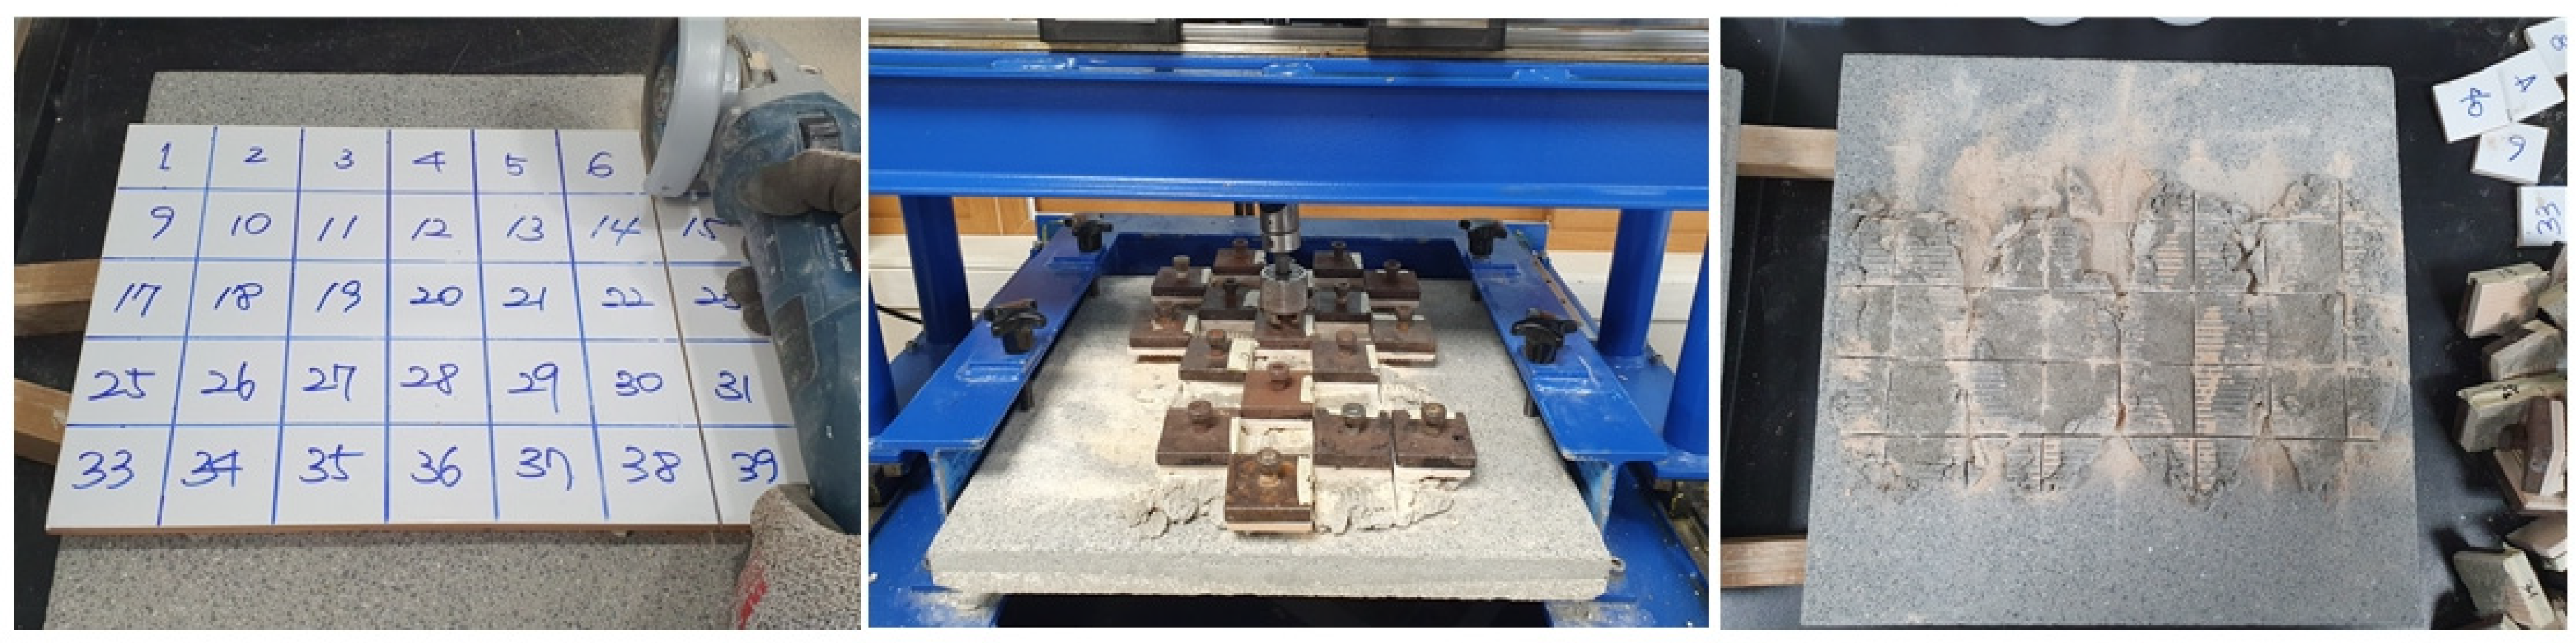
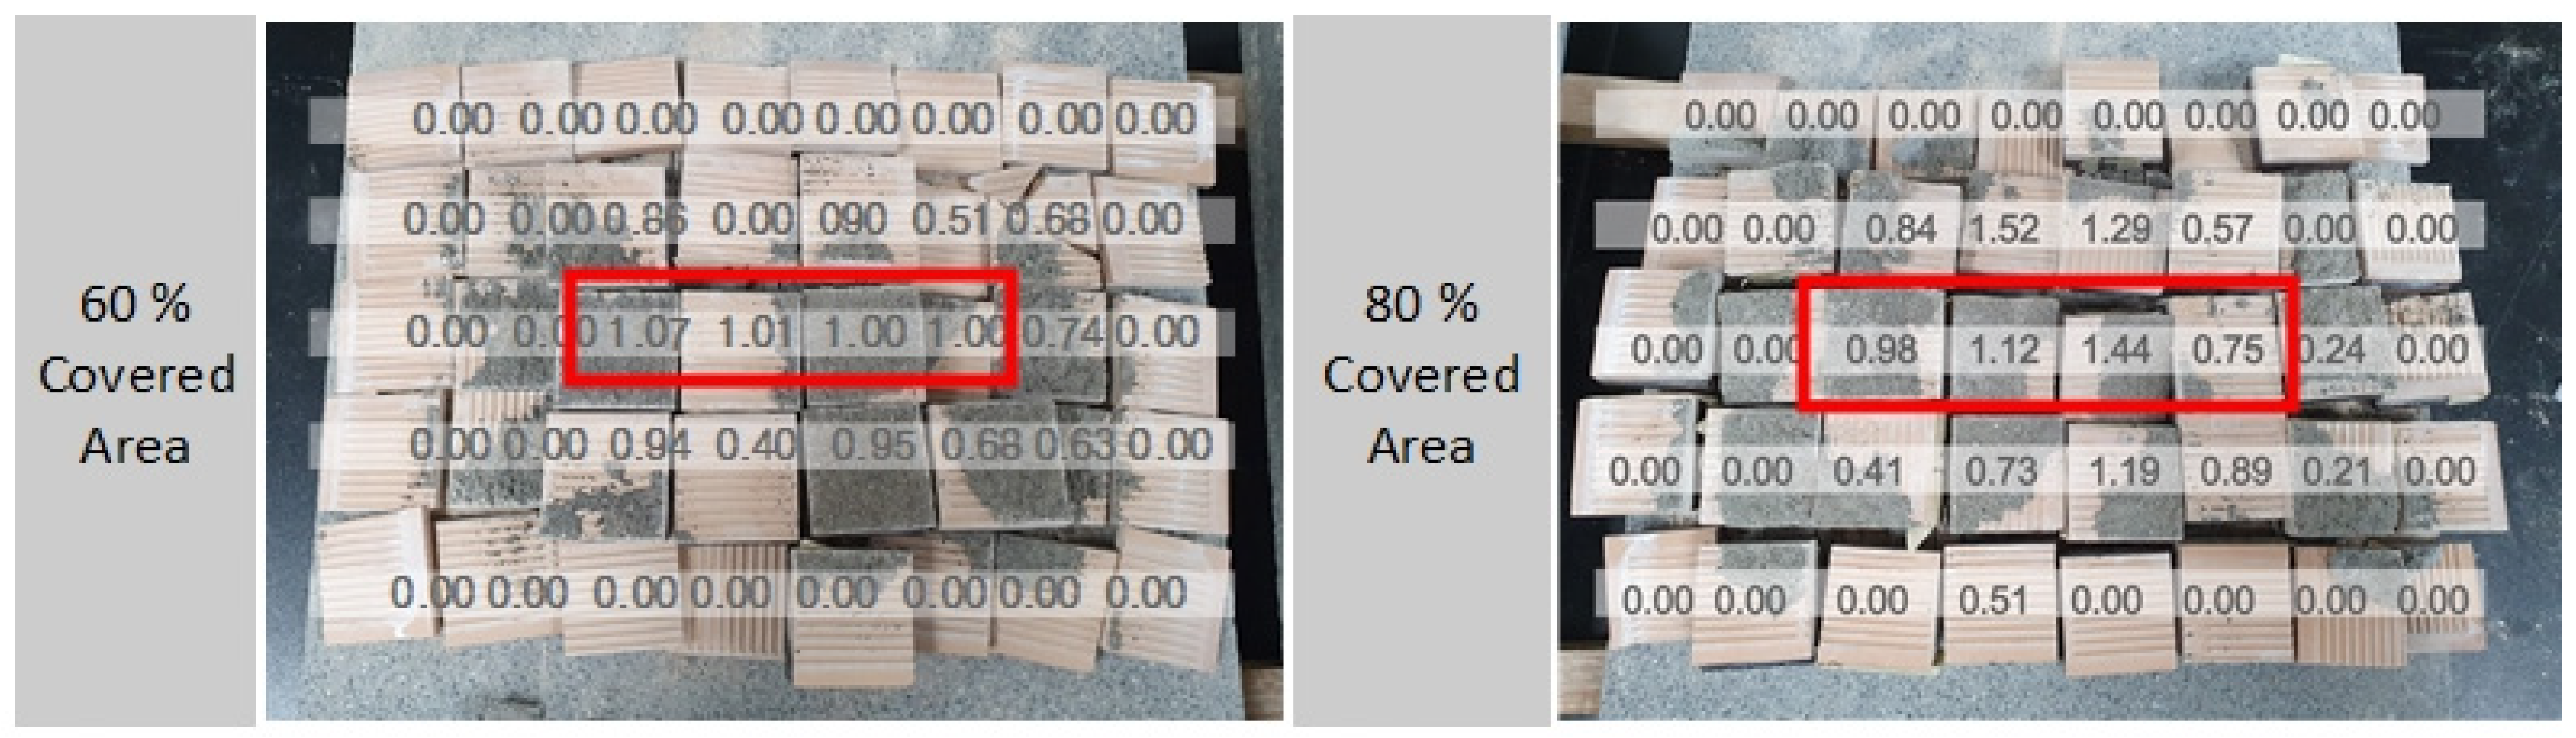
- As a result of the experiment [Ta-3], the partial adhesion strength with 80 ± 3% attachment area after cutting the overall title to 50 × 50 mm, the strength of 65 places (54.1%) was expressed in three experiments (120 places in total), and the overall average was measured to be 0.31 N/mm2. The average value of the total adhesion strength, including an 80% adherence area of the attached mortar and 20% of the empty area, was found to be an average of 0.31 N/mm2, which is about −20.5% less than 0.39 N/mm2 based on the KCS building standard.
Author Contributions
Funding
Data Availability Statement
Conflicts of Interest
References
- Curcia, H.C.F.; de Andradeb, R.P.; Maranh, L.; Gomesa, H.C.; Campello, E.M.B. Analysis of adhered tiling systems based on experimental evaluation and numerical modeling. Constr. Build. Mater. 2022, 325, 126746. [Google Scholar] [CrossRef]
- Ozkahraman, H.T.; Isik, E.C. The effect of chemical and mineralogical composition of aggregates on tensile adhesion strength of tiles. Constr. Build. Mater. 2005, 19, 251–255. [Google Scholar] [CrossRef]
- Winnefeld, F.; Kaufmann, J.; Hack, E.; Harzer, S.; Wetzel, A.; Zurbriggen, R. Moisture induced length changes of tile adhesive mortars and their impact on adhesion strength. Constr. Build. Mater. 2012, 30, 426–438. [Google Scholar] [CrossRef]
- Chew, M.Y.L. The study of adhesion failure of wall tiles. Build. Environ. 1992, 27, 493–499. [Google Scholar] [CrossRef]
- Shohet, I.M.; Paciuk, M. Service life prediction of exterior cladding components under standard conditions. Constr. Manag. Econ. 2004, 22, 1081–1090. [Google Scholar] [CrossRef]
- Wetzel, A.; Zurbriggen, R.; Herwegh, M. Spatially resolved evolution of adhesion properties of large porcelain tiles. Cem. Concr. Compos. 2010, 32, 327–338. [Google Scholar] [CrossRef]
- Wetzel, A.; Herwegh, M.; Zurbriggen, R. Winnefeld, Influence of shrinkage and water transport mechanisms on microstructure and crack formation of tile adhesive mortars. Cem. Concr. Res. 2012, 42, 39–50. [Google Scholar] [CrossRef]
- Yiu, C.Y.; Ho, D.C.W.; Lo, S.M. Weathering effects on external wall tiling systems. Constr. Build. Mater. 2007, 21, 594–600. [Google Scholar] [CrossRef]
- Mahaboonpachai, T.; Kuromiya, Y.; Matsumoto, T. Experimental investigation of adhesion failure of the interface between concrete and polymer-cement mortar in an external wall tile structure under a thermal load. Constr. Build. Mater. 2008, 22, 2001–2006. [Google Scholar] [CrossRef]
- Zhao, Z.Y.; Zhang, W.L. Influence of workmanship on the bonding strength of tiles to external walls. Int. J. Adhes. Adhes. 1997, 17, 47–53. [Google Scholar] [CrossRef]
- Melo, A.C.; Silva, A.J.C.E.; Torres, S.M.; Delgado, J.P.M.Q.; Azevedo, A.C. Influence of the contact area in the adherence of mortar—Ceramic tiles interface. Constr. Build. Mater. 2020, 243, 118274. [Google Scholar] [CrossRef]
- Lee, S.Y. Evaluation of tile adhesion characteristics according to injection of bisphenol-based epoxy resin adhesive. Ph.D. Thesis, Chungnam National University, Daejeon, Republic of Korea, 2020. [Google Scholar]
- Lee, Y.W. A Study on the Cause and Improvement of Ceramic Tile Side Damage. Master’s Thesis, Hanbat National University, Daejeon, Republic of Korea, 2015. [Google Scholar]
- Park, J.B. Study on Impact Resistance of Ceramic Tiles/Metal Composites by Surface Treatment of Ceramic Tiles. Master’s Thesis, KAIST, Daejeon, Republic of Korea, 2016. [Google Scholar]
- Yoo, Y.H. A Study on the Causes and Countermeasures of Tile Defects in School Buildings. Master’s Thesis, Chonbuk National University, Jeonju, Republic of Korea, 2003. [Google Scholar]
- KS L 1001; Ceramic Tiles. Korea Standard (KS): Chungbuk, Republic of Korea, 2020.
- KS L ISO 13007-2; Ceramic Tiles-Grouts and Adhesives-Part 2: Test Methods for Adhesives. Korea Standard (KS): Chungbuk, Republic of Korea, 2023.
- KS L ISO 13007-4; Ceramic Tiles-Grouts and Adhesives-Part 4: Test Methods for Grout. Korea Standard (KS): Chungbuk, Republic of Korea, 2023.
- KCS 41 48 01; Tile Construction. Korea Construction Specification (KCS): Chungbuk, Republic of Korea, 2021.


| Test | Absorption Rate (%) | Crack Resistance | Wear Resistance (g) | Bending Strength (N/cm) | Chemical Resistance | |
|---|---|---|---|---|---|---|
| Type | ||||||
| T-1 | 11.7 | clear | 0.05 | 120.8 | clear | |
| T-2 | 13.2 | clear | 0.03 | 103.7 | clear | |
| standard | 18 ↓ | cracks | 0.1 ↑ | 12 ↑ | no discoloration | |
| Distinction | Tile Size | Adhesion Area (%) | Attachment Size (mm) | Curing | ||
|---|---|---|---|---|---|---|
| 250 × 400 mm | 60 | 80 | ||||
| [Ta-1] | Partial adhesion strength test | ■ | ■ | 50 × 50 | 28 days standard curing | |
| [Ta-2] | Overall adhesion strength test | ■ | ■ | ■ | 250 × 400 | |
| [Ta-3] | Partial adhesion strength test after cutting the entire surface | ■ | ■ | ■ | 50 × 50 | |
| Distinction | Adhesion Strength (N/mm2) | Note | |||||
|---|---|---|---|---|---|---|---|
| Q1 | Q2 | Q3 | Q4 | Average (SD) | Overall Average | ||
| FT-1 | 0.76 | 1.43 | 0.93 | 0.14 | 0.82 (0.46) | 0.85 |  |
| FT-2 | 1.06 | 1.44 | 1.51 | 0.14 | 1.04 (0.55) | ||
| FT-3 | 0.21 | 1.12 | 1.44 | 0.24 | 0.70 (0.54) | ||
| Distinction | Adhesion Strength (N/mm2) | Note | |||||
|---|---|---|---|---|---|---|---|
| 1st | 2nd | 3rd | 4th | 5th | Average (SD) | ||
| RX1 (250 × 400 mm, 80%) | 0.17 | 0.16 | 0.19 | 0.18 | 0.17 | 0.17 (0.01) |  |
| RX2 (250 × 400 mm, 60%) | 0.10 | 0.11 | 0.09 | 0.12 | 0.11 | 0.10 (0.01) | |
| Distinction | X1 | X2 | X3 | X4 | X5 | X6 | X7 | X8 | Average (SD) | |
|---|---|---|---|---|---|---|---|---|---|---|
| Y1 | 0.00 | 0.00 | 0.00 | 0.00 | 0.00 | 0.00 | 0.13 | 0.00 | 0.02(0.04) | Overall average 0.31 N/mm2 26 measurable |
| Y2 | 0.00 | 0.20 | 0.19 | 0.16 | 0.40 | 0.17 | 0.99 | 0.13 | 0.28(0.29) | |
| Y3 | 0.00 | 0.71 | 1.06 | 1.14 | 0.99 | 0.69 | 1.19 | 0.00 | 0.74(0.45) | |
| Y4 | 0.14 | 0.81 | 0.45 | 0.81 | 0.59 | 0.25 | 0.78 | 0.13 | 0.50(0.28) | |
| Y5 | 0.14 | 0.15 | 0.00 | 0.14 | 0.00 | 0.16 | 0.00 | 0.00 | 0.06(0.07) | |
| Average (SD) | 0.06 (0.07) | 0.37 (0.32) | 0.34 (0.40) | 0.45 (0.44) | 0.39 (0.38) | 0.25 (0.23) | 0.62 (0.47) | 0.05 (0.06) | ||
 |  | |||||||||
| Distinction | X1 | X2 | X3 | X4 | X5 | X6 | X7 | X8 | Average (SD) | |
|---|---|---|---|---|---|---|---|---|---|---|
| Y1 | 0.00 | 0.00 | 0.00 | 0.00 | 0.00 | 0.00 | 0.00 | 0.00 | 0.00(0.00) | Overall average 0.31 N/mm2 15 measurable |
| Y2 | 0.00 | 0.00 | 0.84 | 1.53 | 1.29 | 0.57 | 0.00 | 0.00 | 0.53(0.59) | |
| Y3 | 0.00 | 0.00 | 0.98 | 1.12 | 1.44 | 0.75 | 0.24 | 0.00 | 0.57(0.54) | |
| Y4 | 0.00 | 0.00 | 0.41 | 0.73 | 1.19 | 0.89 | 0.21 | 0.00 | 0.43(0.43) | |
| Y5 | 0.00 | 0.00 | 0.00 | 0.51 | 0.00 | 0.00 | 0.00 | 0.00 | 0.06(0.17) | |
| Average (SD) | 0.00 (0.00) | 0.00 (0.00) | 0.45 (0.41) | 0.78 (0.52) | 0.79 (0.65) | 0.44 (0.37) | 0.09 (0.11) | 0.00 (0.00) | ||
 |  | |||||||||
| Distinction | X1 | X2 | X3 | X4 | X5 | X6 | X7 | X8 | Average (SD) | |
|---|---|---|---|---|---|---|---|---|---|---|
| Y1 | 0.12 | 0.23 | 0.00 | 0.00 | 0.00 | 0.06 | 0.00 | 0.00 | 0.05(0.08) | Overall average 0.29 N/mm2 24 measurable |
| Y2 | 0.00 | 0.34 | 0.17 | 0.16 | 0.77 | 0.35 | 0.71 | 0.00 | 0.31(0.28) | |
| Y3 | 0.00 | 0.65 | 0.81 | 0.88 | 0.44 | 0.54 | 0.65 | 0.00 | 0.50(0.31) | |
| Y4 | 0.23 | 0.74 | 0.55 | 0.97 | 0.71 | 0.77 | 0.59 | 0.00 | 0.57(0.29) | |
| Y5 | 0.00 | 0.00 | 0.00 | 0.00 | 0.00 | 0.00 | 0.06 | 0.08 | 0.02(0.03) | |
| Average (SD) | 0.07 (0.09) | 0.39 (0.27) | 0.31 (0.32) | 0.40 (0.43) | 0.38 (0.33) | 0.34 (0.29) | 0.40 (0.031) | 0.02 (0.03) | ||
 |  | |||||||||
| Distinction | X1 | X2 | X3 | X4 | X5 | X6 | X7 | X8 | Average (SD) | |
|---|---|---|---|---|---|---|---|---|---|---|
| Y1 | 0.00 | 0.00 | 0.00 | 0.00 | 0.00 | 0.00 | 0.00 | 0.00 | 0.00(0.00) | Overall average 0.20 N/mm2 14 measurable |
| Y2 | 0.00 | 0.23 | 0.16 | 0.36 | 0.95 | 0.43 | 0.71 | 0.00 | 0.35(0.31) | |
| Y3 | 0.00 | 0.27 | 1.02 | 0.40 | 0.97 | 0.92 | 0.52 | 0.00 | 0.51(0.39) | |
| Y4 | 0.00 | 0.00 | 0.38 | 0.00 | 0.89 | 0.00 | 0.00 | 0.00 | 0.16(0.30) | |
| Y5 | 0.00 | 0.00 | 0.00 | 0.00 | 0.00 | 0.00 | 0.00 | 0.00 | 0.00(0.00) | |
| Average (SD) | 0.00 (0.00) | 0.50 (0.12) | 0.91 (0.38) | 0.95 (0.19) | 1.56 (0.46) | 1.47 (0.37) | 1.65 (0.31) | 0.00 (0) |
| Distinction | X1 | X2 | X3 | X4 | X5 | X6 | X7 | X8 | Average (SD) | |
|---|---|---|---|---|---|---|---|---|---|---|
| Y1 | 0.00 | 0.00 | 0.00 | 0.00 | 0.00 | 0.00 | 0.00 | 0.00 | 0.00(0.00) | Overall average 0.28 N/mm2 14 measurable |
| Y2 | 0.00 | 0.00 | 0.86 | 0.00 | 0.90 | 0.51 | 0.68 | 0.00 | 0.37(0.38) | |
| Y3 | 0.00 | 0.00 | 1.07 | 1.01 | 1.00 | 1.00 | 0.74 | 0.00 | 0.60(0.48) | |
| Y4 | 0.00 | 0.00 | 0.94 | 0.40 | 0.95 | 0.68 | 0.63 | 0.00 | 0.45(0.38) | |
| Y5 | 0.00 | 0.00 | 0.00 | 0.00 | 0.00 | 0.00 | 0.00 | 0.00 | 0.00(0.00) | |
| Average (SD) | 0.00 (0.00) | 0.00 (0.00) | 1.17 (0.47) | 1.08 (0.40) | 1.57 (0.47) | 1.64 (0.39) | 1.81 (0.34) | 1.60 (0.00) |
| Distinction | X1 | X2 | X3 | X4 | X5 | X6 | X7 | X8 | Average (SD) | |
|---|---|---|---|---|---|---|---|---|---|---|
| Y1 | 0.00 | 0.00 | 0.00 | 0.00 | 0.21 | 0.00 | 0.00 | 0.00 | 0.03(0.07) | Overall average 0.26 N/mm2 16 measurable |
| Y2 | 0.00 | 0.18 | 0.47 | 0.65 | 0.00 | 0.00 | 0.85 | 0.00 | 0.27(0.32) | |
| Y3 | 0.00 | 0.41 | 1.21 | 0.94 | 0.97 | 0.78 | 0.75 | 0.00 | 0.63(0.42) | |
| Y4 | 0.00 | 0.00 | 0.77 | 0.47 | 0.88 | 0.81 | 0.00 | 0.00 | 0.37(0.38) | |
| Y5 | 0.00 | 0.00 | 0.00 | 0.21 | 0.00 | 0.00 | 0.00 | 0.00 | 0.03(0.07) | |
| Average (SD) | 0.00 (0.00) | 0.52 (0.16) | 1.09 (0.46) | 1.21 (0.33) | 1.41 (0.43) | 1.52 (0.39) | 1.72 (0.39) | 1.60 (0.00) |
| Distinction | ① Partial adhesionstrength test result [Ta-1] | ② Overall adhesionstrength test result [Ta-2] | ③ Attachment strength testresult after front cutting [Ta-3] | |
 |  |  | ||
 |  |  | ||
| Attachment | 50 × 50 mm | 250 × 400 mm | 50 × 50 mm | |
| Result | 80% | 0.85 N/mm2 | 0.17 N/mm2 | 0.31 N/mm2 |
| 60% | - | 0.10 N/mm2 | 0.25 N/mm2 | |
Disclaimer/Publisher’s Note: The statements, opinions and data contained in all publications are solely those of the individual author(s) and contributor(s) and not of MDPI and/or the editor(s). MDPI and/or the editor(s) disclaim responsibility for any injury to people or property resulting from any ideas, methods, instructions or products referred to in the content. |
© 2024 by the authors. Licensee MDPI, Basel, Switzerland. This article is an open access article distributed under the terms and conditions of the Creative Commons Attribution (CC BY) license (https://creativecommons.org/licenses/by/4.0/).
Share and Cite
Kim, J.-G.; Kim, B.-S.; Jiang, B.; Kim, B. Adhesion Stability According to Adhesion Area of Traditional Tile Gluing Method. Buildings 2024, 14, 1117. https://doi.org/10.3390/buildings14041117
Kim J-G, Kim B-S, Jiang B, Kim B. Adhesion Stability According to Adhesion Area of Traditional Tile Gluing Method. Buildings. 2024; 14(4):1117. https://doi.org/10.3390/buildings14041117
Chicago/Turabian StyleKim, Jae-Gyu, Bum-Soo Kim, Bo Jiang, and Byoungil Kim. 2024. "Adhesion Stability According to Adhesion Area of Traditional Tile Gluing Method" Buildings 14, no. 4: 1117. https://doi.org/10.3390/buildings14041117
APA StyleKim, J.-G., Kim, B.-S., Jiang, B., & Kim, B. (2024). Adhesion Stability According to Adhesion Area of Traditional Tile Gluing Method. Buildings, 14(4), 1117. https://doi.org/10.3390/buildings14041117