1. Introduction
In recent years, the rapid growth of the construction industry has led to an increase in project size and complexity [
1]. The complexity of multi-dimensional project requirements means that traditional construction project leaders face increasingly severe challenges [
2]. Due to the large scale, dynamic nature, unknown risks, and complexity of complex construction projects, traditional leaders encounter great challenges in navigating complex projects, which can easily lead to schedule delays, cost overruns, and uncontrolled goals [
3]. To improve the ability of leaders of complex construction projects, it is necessary to conduct in-depth research on organizational leadership from the perspective of complexity [
4]. This has become a prominent practical problem faced by complex construction project organizations.
Although many scholars have conducted extensive studies on leadership, most have been from the perspective of project managers based on the belief that the personality of leaders is a key factor affecting leadership [
5]. At present, scholars mainly study organizational leadership from a static perspective. They do not dynamically consider the interactions of influencing factors and the impact on organizational leadership, not to mention deeply exploring the dynamic change rule of organizational leadership over time. In addition, the existing models do not allow for dynamic simulation analysis of project organization leadership. Therefore, it is necessary to propose a simulation approach that can consider the dynamic changes in organizational leadership over time for complex construction projects.
The purpose of this paper is to break through the traditional mode of studying organizational leadership from a static perspective to solve the problem of the dynamics of organizational leadership in complex construction projects, to provide a new way of thinking about the study of the dynamic characteristics of organizational leadership in complex construction projects, to identify the factors affecting organizational leadership in complex construction projects, and to construct a dynamic Bayesian network model of organizational leadership in complex construction projects.
The Bayesian belief network (BBN) is a graphical framework for modeling uncertainty, which contains the unique characteristics of capturing interactions between elements [
6]. BBN only considers the role of the influencing factors of organizational leadership at a single point in time. Therefore, as an effective tool for Bayesian networks, it is necessary to extend temporal modeling in order to evaluate the time process in real time. A dynamic Bayesian network (DBN) can be obtained by extending the BBN to form a model capable of processing time series data.
DBN has the following advantages: (1) DBN is an efficient and intuitive probability graph model, which can evaluate uncertain problems and practical problems more effectively. (2) DBN can represent the important factors in practical problems that apply to discrete or continuous variables. It can capture and explain the uncertainties in the degradation process and the dependencies between variables well. (3) DBN modeling has Bayesian information updating ability, which can use the prior knowledge of the actual problem and can update the model dynamically with the posterior information of the actual problem [
7]. In summary, the intuitive probabilistic graphical model of DBN can be used to study the long-term stochastic process of organizational leadership, and it can effectively determine the relationship between the influencing factors and the dynamic change pattern of organizational leadership over time. Therefore, DBN applies to the process of organizational leadership research of complex construction projects in this study.
This study identifies the factors influencing organizational leadership in complex construction projects and constructs a dynamic Bayesian network model of organizational leadership in complex construction projects. First, the influencing factors of organizational leadership in complex construction projects are identified. Second, the dynamic Bayesian model of complex construction organizational leadership is constructed and simulated. Finally, empirical analysis of the model is conducted based on sample data to verify the feasibility and scientificity of the model. Through the above content, we identify the key influencing factors in organizational leadership and explore the dynamic change law of organizational leadership over time so as to better improve the management ability of project managers when dealing with complex construction projects.
The organizational structure of this study is as follows.
Section 1 reviews recent work on the status of leadership research in project organizations.
Section 2 proposes a novel DBN-based measurement method of project organizational leadership.
Section 3 develops the measurement model of project organizational leadership, including model development and validation.
Section 4 conducts the model analysis, including the influence chain analysis, predictive analysis, and diagnostic analysis.
Section 5 provides discussions and conclusions of the findings of this study.
2. Literature Review
2.1. Factors of Organizational Leadership
Project organizational leadership has been discussed for many years. As a key factor in the realization of complex construction project objectives, the study of organizational leadership is receiving an increasing amount of attention [
4]. There has been a lot of research from different angles to define leadership. For example, through empirical research, some scholars [
8] have categorized the generative sources of leadership into intellectual, emotional, and managerial sources and have argued that the three main components of leadership are the leader’s personality, methodology, and methods of contingency [
9].
The study of leadership first originated from the study of leaders in the late 19th and early 20th centuries [
10], which focused on the study of leaders’ personality traits, to the 1940s, which explored the impact of leaders’ leadership behaviors on their subordinates, to the 1960s, when scholars began to explore the impact of situational factors related to leadership behaviors on the effectiveness of leadership, which gave rise to the theory of leadership power change. Gradually, it has expanded from individual studies of leaders’ personality traits and behavior to the study of the interaction effects of the entire organizational context.
Many scholars have conducted in-depth analysis and elaboration of organizational leadership, and Avolio, as a major representative of contemporary research on transformational leadership, focuses on the intrinsic connection between leadership and organizational behavior [
11]. Ahi and Bmkz [
12], based on shared leadership behaviors in a project setting, examined the mediating role of knowledge sharing, cohesion, and trust among project leaders. Aarons et al. [
13] quantitatively and qualitatively analyzed the feasibility, acceptability, and perceived utility of LOCI training and strategic organizational interventions and the impact on leader and supervisee assessment outcomes. Akhtar et al. [
14] suggested that transformational leadership has a greater impact on organizational learning than servant leadership.
According to research, leadership consists of three dimensions: personal leadership, relational leadership, and strategic leadership [
15]. The personal dimension refers to leadership as personal development, which includes the capacity for managing stress, setting goals, engaging in effective communication, resolving conflicts, and changing one’s leadership style. The relationship dimension refers to the leadership between a leader and followers, which is reflected in worker initiative, team building, spiritual inspiration, cultural construction, vision implementation, team cohesiveness, and situational interaction. The strategic dimension means the leader is a constructor in the organization, including resource allocation, talent cultivation mechanism, communication mechanism, incentive mechanism, and institutional support.
2.2. Existing Measurement Methods
Researchers use different methods to study organizational leadership and explore its impact [
16]. The impact of project managers’ organizational leadership behaviors on project performance could be studied through questionnaires [
17]. Some scholars have explored the mechanism of leadership influence on safety performance in construction projects through confirmatory factor analysis and structural equation modeling (SEM) [
18].
In general, existing studies involve the influence of organizational leadership on project performance, project safety performance, and activities of different stakeholder groups. Existing research methods are unable to dynamically analyze the interactions between the factors that study organizational leadership. For example, AHP does not take into account the correlation between factors in the research analysis, and SEM cannot dynamically model the impact of changes in factors on organizational leadership. The connection between the variables affecting organizational leadership and the mechanism of the factors influencing organizational leadership at various stages of creation is not adequately examined in current studies. Therefore, this study proposes a simulation model of the influencing factors of organizational leadership in complex construction projects based on DBN.
DBN is an extension of BBN for modeling time series processes. The dynamics are that the network structure changes over time, and also that the sample data or observations of the model change over time. Thus, DBN has significant advantages in describing temporality, dynamics, stochasticity, and uncertainty [
19]. Considering the characteristics that organizational leadership changes dynamically with time in different construction phases, the DBN model is suitable for simulating the influence mechanism of project organizational leadership. Therefore, this study can fill this research gap by analyzing the influencing factors of organizational leadership through the DBN model.
3. Research Methodology
The DBN model is effective in dealing with uncertainty, timing, and dynamic evolution. It inherits the advantages of BBN and considers the influence of the time factor on the model. The process of constructing the organizational leadership measurement model for complex construction projects using DBN is as follows. The approach consists of four main stages. The first stage is the identification of the organizational leadership nodes. The second stage is the model design of DBN, and model validation is carried out in the third stage. In the fourth stage of model analysis, the software GeNIe 2.2 is used to conduct a simulation analysis, including an influence chain analysis, predictive analysis, and diagnostic analysis.
3.1. Identification of Nodes
Based on the characteristics of complex construction projects, this study summarizes organizational leadership into three components of personal leadership, relationship leadership [
13], and strategic leadership (SL) through existing research [
15]. From the perspective of project complexity, 17 potential influencing factors of organizational leadership in complex construction projects are systematically analyzed based on the three dimensions and the characteristics of complex construction projects. The summary of the potential influencing factors of organizational leadership in complex construction projects is shown in
Table 1.
According to the context and description of these variables, a survey regarding organizational leadership of complex construction projects was designed. The questionnaire was designed in conjunction with the constructed organizational leadership factors. The questionnaires were distributed and collected using a web-based newsletter account or e-mail. The questionnaire is based on a Likert five-point scale (1 = very bad, 5 = very good) for each observed variable, and the higher the score, the better the organization’s ability in this area. In the questionnaire, experts scored the 17 organizational leadership-related factors based on the degree of conformity between their descriptions and the actual organizational leadership, which was assessed using the following assessment criteria and scores, with 5 being the highest score, for the degree of conformity of the following factors: 1-very poorly conforms; 2-does not conform very well; 3-average; 4-conforms; and 5-completely conforms.
A total of 150 questionnaires was distributed for this study, and 143 were collected, for a 95 percent recovery rate. Of these, 138 valid questionnaires were obtained, indicating an effective recovery rate of 92%, and the ratio of valid questionnaires to scale questions was 8:1, which meets the requirements of factor analysis for this paper.
Based on the valid sample data collected, descriptive statistics on the background of the sample respondents and information on the programs they participated in were conducted, and the specific results are shown in
Table 2.
3.2. Model Design
- (1)
Construction of BBN model
The 128 training samples were imported into the GeNIe software, and the BBN network structure was constructed using structured learning. In this study, the minimum description length principle (MDL) was used to score, and the greedy algorithm was adopted to search; thus, the preliminary BBN structure was obtained by machine learning. The EM algorithm was adopted to finish the parameter learning of the BBN in the GeNIe software, and further parameter learning was then carried out to determine the conditional probability of each node variable and acquire the CPT of all nodes. The CPT is a table of conditional probabilities between nodes, that is, a series of probability values. If a Bayesian network provides enough conditional probability values, any given joint probability can be computed.
- (2)
Structural optimization
The initial BBN structure was obtained through machine learning, but there was an unreasonable causal relationship between nodes in the initial structure. To further optimize the network structure, specialists were needed to evaluate and enhance the causal relationship between variables in the initial structure. The causal relationships between variables of the initial structure were judged and refined through expert knowledge to further optimize the network structure. In this study, the network structure was adjusted by means of interviews with an expert group consisting of three project managers, each of whom had more than 15 years of experience in construction projects. Finally, the network structure was re-optimized by modifying and improving the logical relationships of the nodes in the initial structure after discussion and combining the experts’ opinions.
- (3)
Determination of conditional probability table
The parameters of BBN were further investigated by determining the optimal BBN structure, and the CPT of each node variable was determined. Due to the computing efficiency of MLE, prior probability did not need to be manually defined. In this study, MLE was selected for parameter learning to obtain the CPT of the nodes. According to the maximum probability of the sample data and network parameters, the principle of the MLE method was used to identify the network parameters.
3.3. Model Validation
Model accuracy refers to how well the outcomes of the simulated state match the true value of organizational leadership under a set of changeable circumstances. Based on the structure and causality of BBN, a cross-validation method was used to verify the model [
32]. The data collected from the questionnaire were randomly divided into one set of training data and one set of test data. Data from the training set were used to construct the model, while data from the test set were used to validate the model. The model validation process was as follows. Firstly, the evidence information of the sample data was input into the newly created BBN. Secondly, the posterior probability distribution of organizational leadership was calculated by using model reasoning. The simulated state was then compared with the actual value to get the verification result. Finally, the above steps were repeated, and other data were checked separately to obtain the validation results of all sample data. When the accuracy reached more than 80%, the model was considered effective [
33].
4. Model Development and Validation
4.1. Identification of Factors
Bayesian network nodes were obtained using a literature review, data gathering, data transformation, and other methods. A framework for organizational leadership was obtained from the literature, including 17 influencing factors for complex construction projects [
15]. In addition, these influencing factors were validated by methods such as questionnaires and factor analysis. Therefore, these 17 influencing factors were selected as model nodes for constructing a Bayesian network for organizational leadership.
Also, to simplify the calculations, the 138 data samples collected from the questionnaire were processed into three states: high, medium, and low. Organizations with very poor and poor capacity in this area were indicated as “low state”, those with average capacity were indicated as “moderate state”, and those with good and very good capacity were indicated as “high state”. The percentage of the total number of people corresponding to each state is the statistical distribution of nodes in different states.
Table 3 shows the statistical distribution of organizational leadership nodes after transformation in different states.
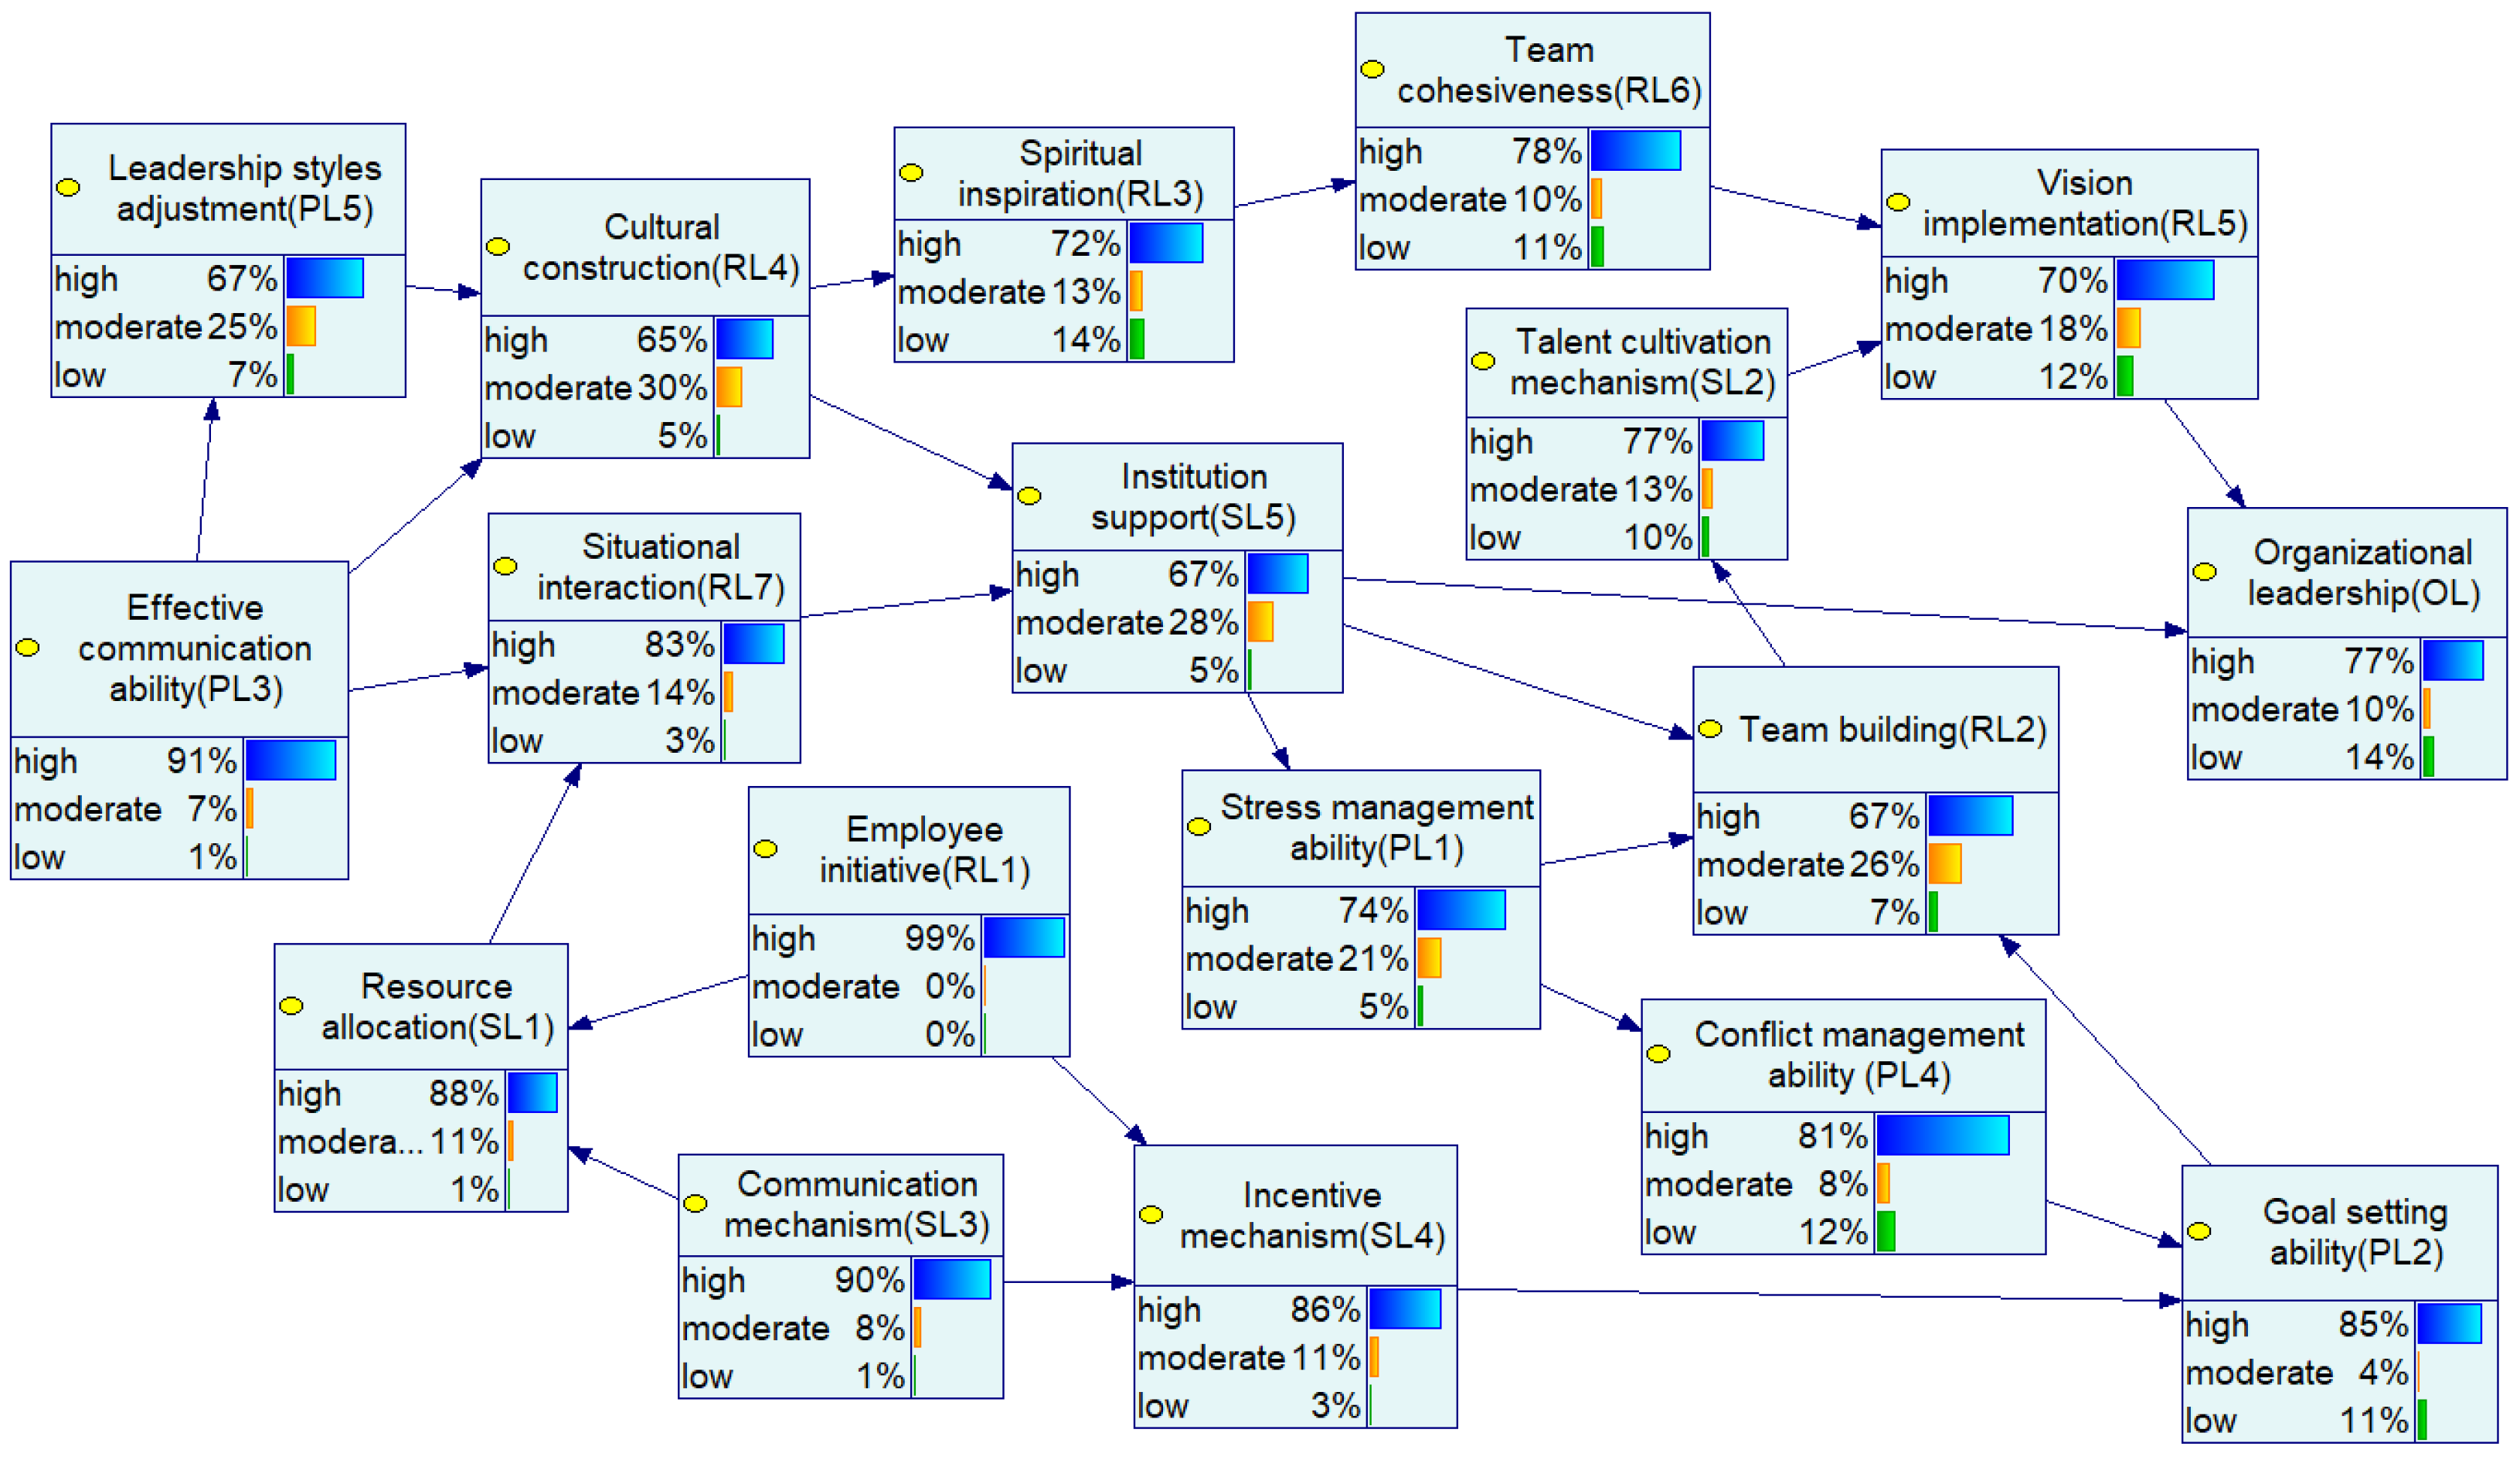
4.2. DBN Model Construction
The BBN model is the foundation of DBN model construction, and BBN model construction is a complex process. The gathered information was used in the construction of the Bayesian network model and parameter learning, which avoided the subjectivity and fuzziness of expert knowledge and made the causal relationship between nodes in the model closer to reality [
34]. After structure learning and parameter learning, a BBN model with structure and data was obtained, as shown in
Figure 1.
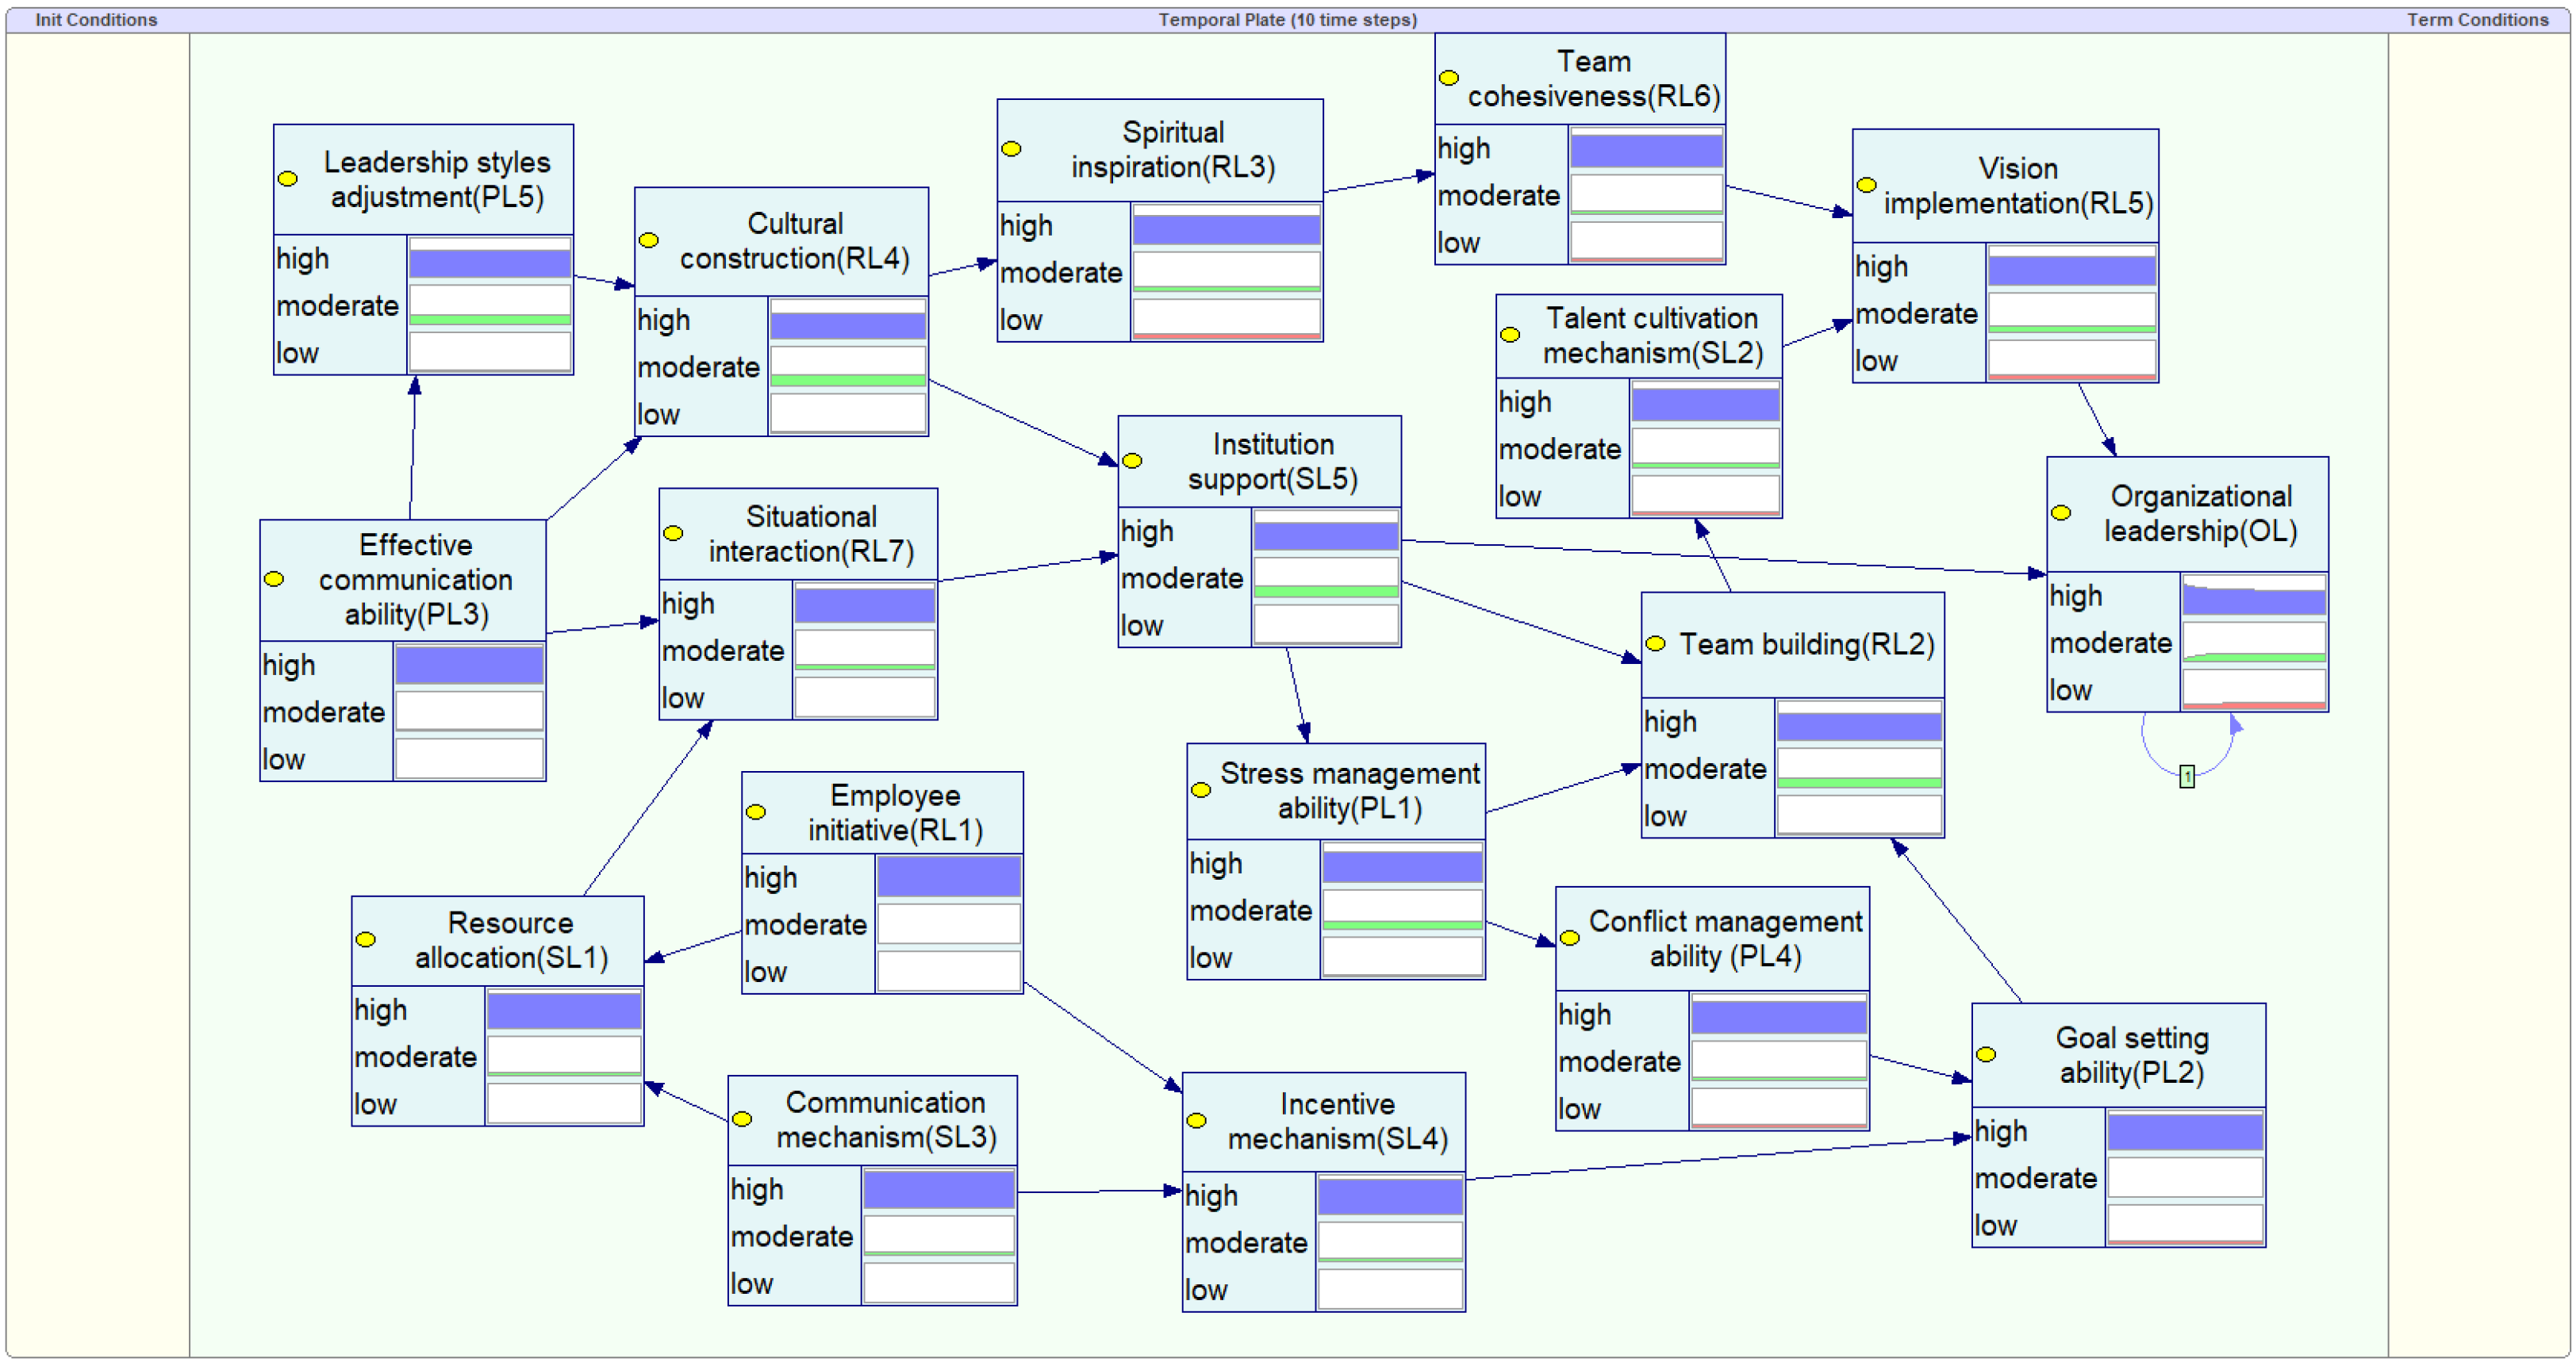
DBN is an extension of BBN in the time dimension and a dynamic model that changes with time [
35]. DBN represents the system as a series of snapshots from the start time to the end time. Each snapshot represents the current state of the system as a whole Bayesian network. The DBN model can be used to obtain the posterior probability of organizational leadership for complex construction projects over time to better understand the dynamics of organizational leadership. The expansion from BBN to DBN can be realized by the transfer probability table (TPT). In this study, the network structure was adjusted using interviews with an expert group consisting of three project managers, each of whom had more than 15 years of experience in construction projects. The TPT of organizational leadership from t − 1 moment to t-moment is defined based on expert knowledge, and the results are shown in
Table 4.
As can be seen from
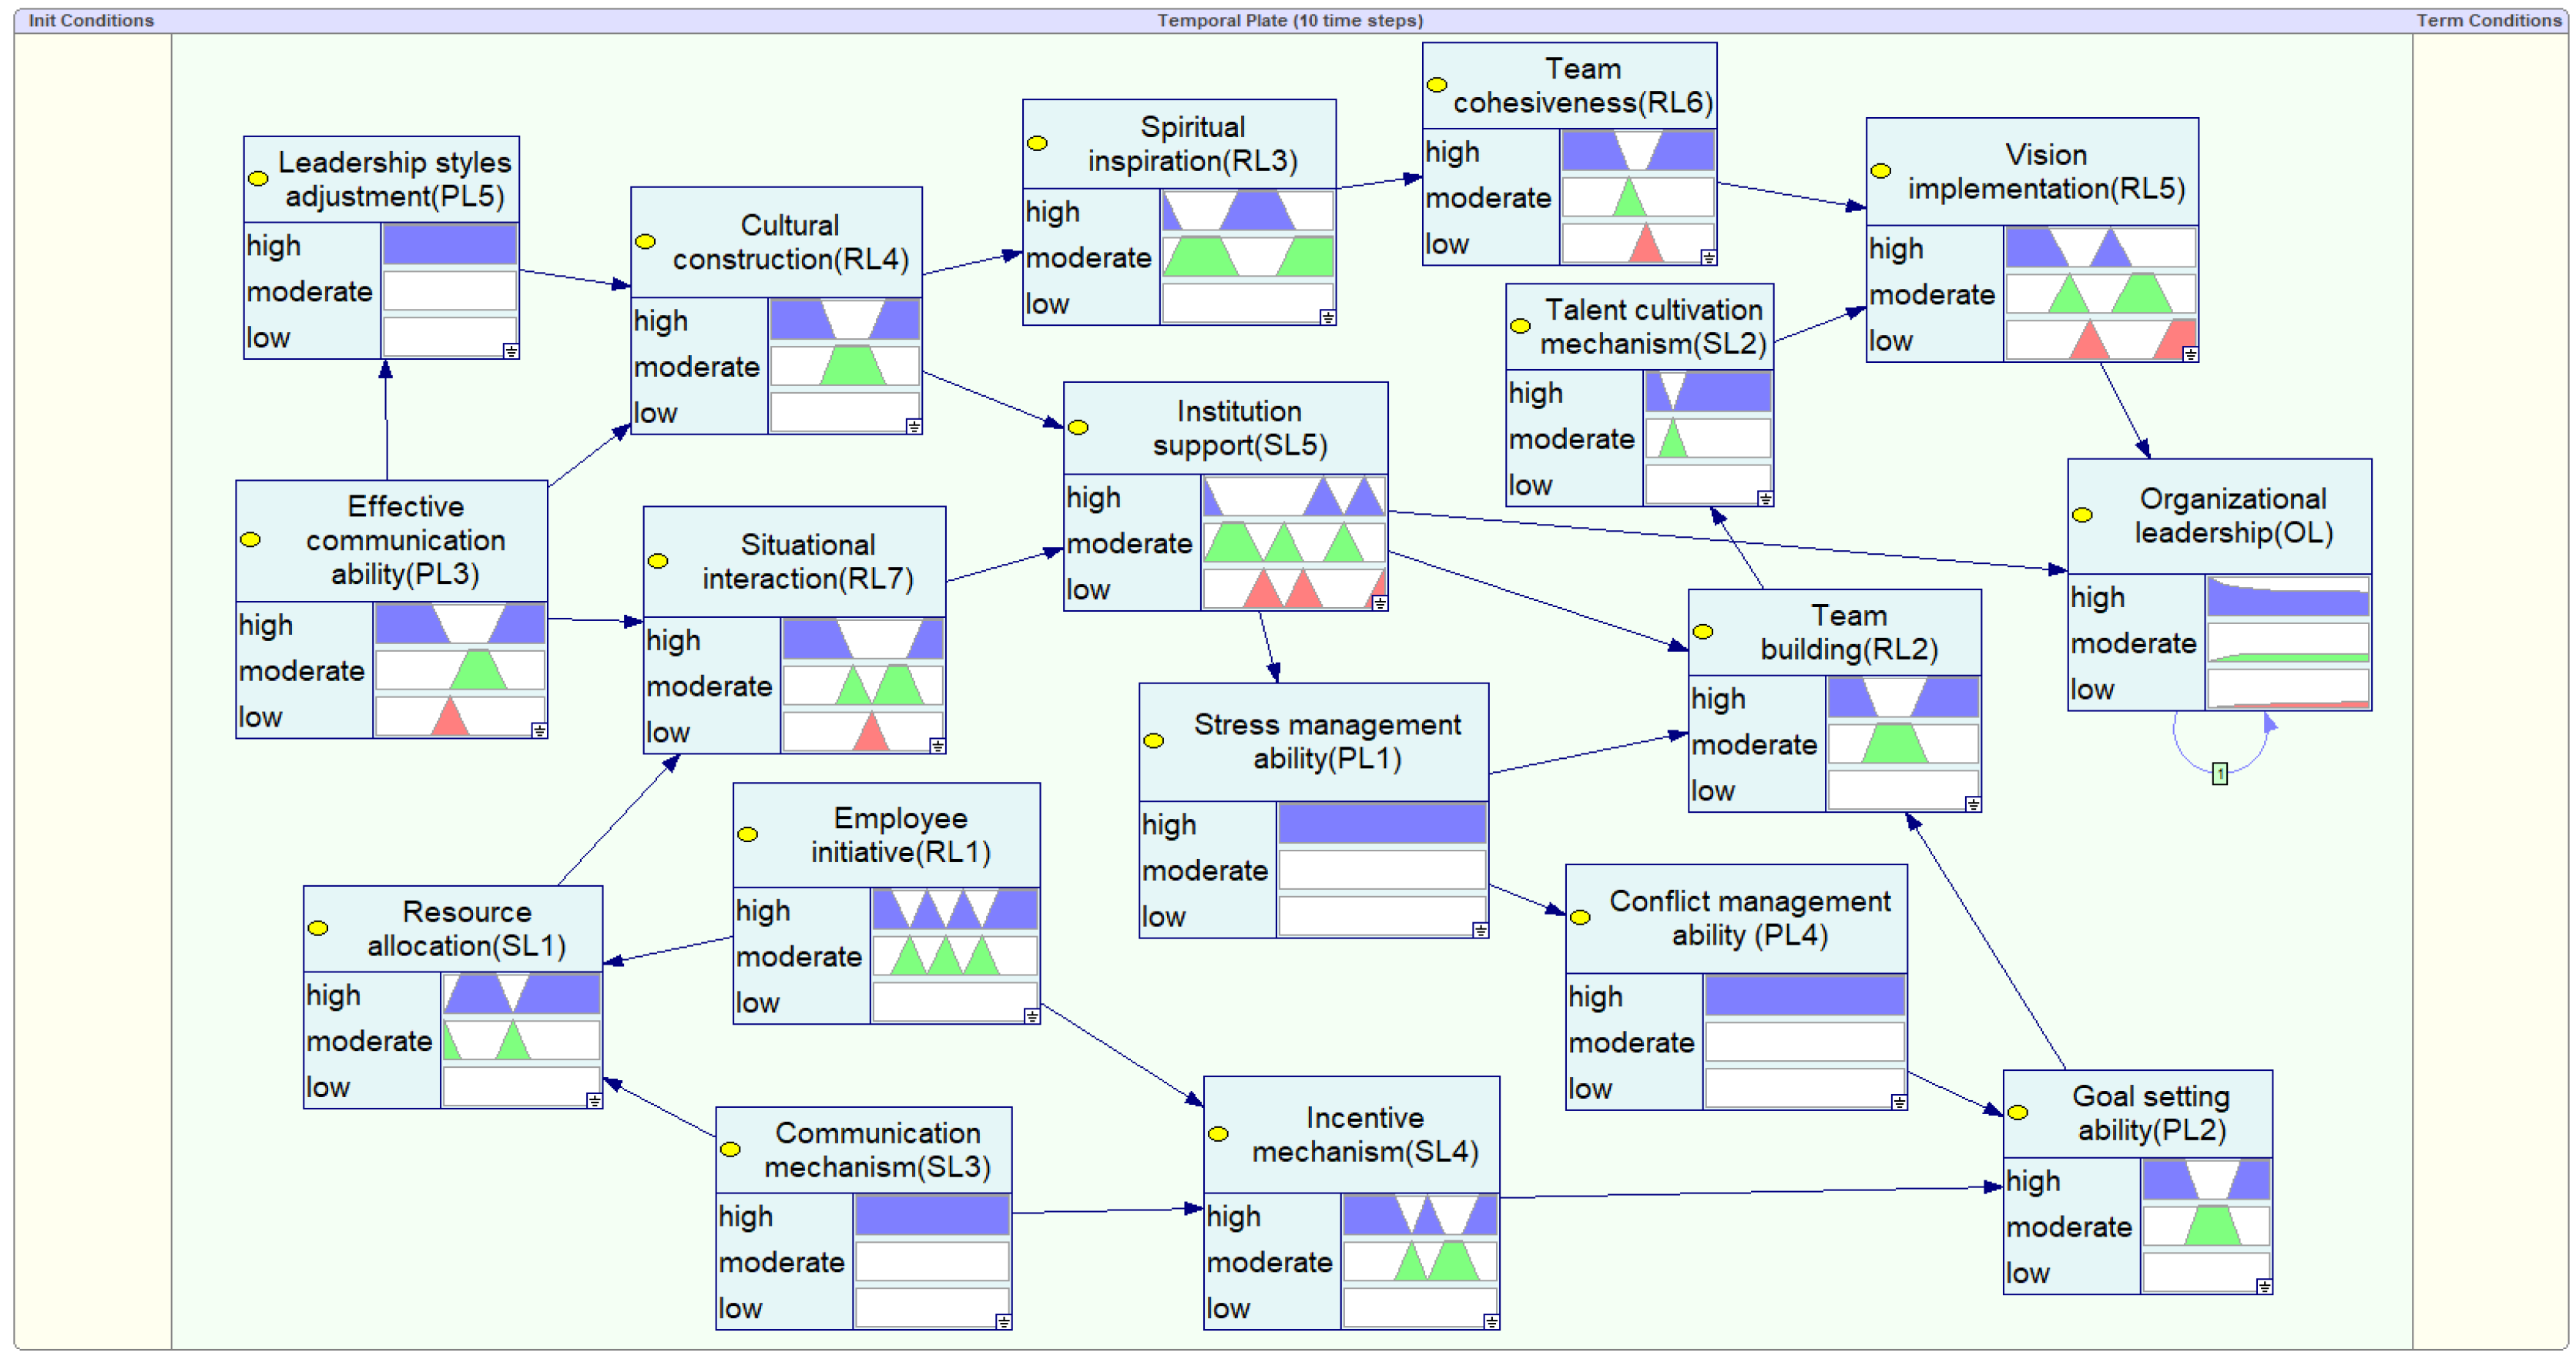
Table 3, if organizational leadership is in a high state at time t − 1, the probability of organizational leadership being in a high state at time t is 0.80, the probability of changing to a moderate state is 0.15, and the probability of changing to a low state is 0.05. Similarly, according to the practical experiences of project management, the TPT of organizational leadership in other states from time t − 1 to time t can be obtained. The DBN model can be built after the original network model and TPT are defined, as shown in
Figure 2.
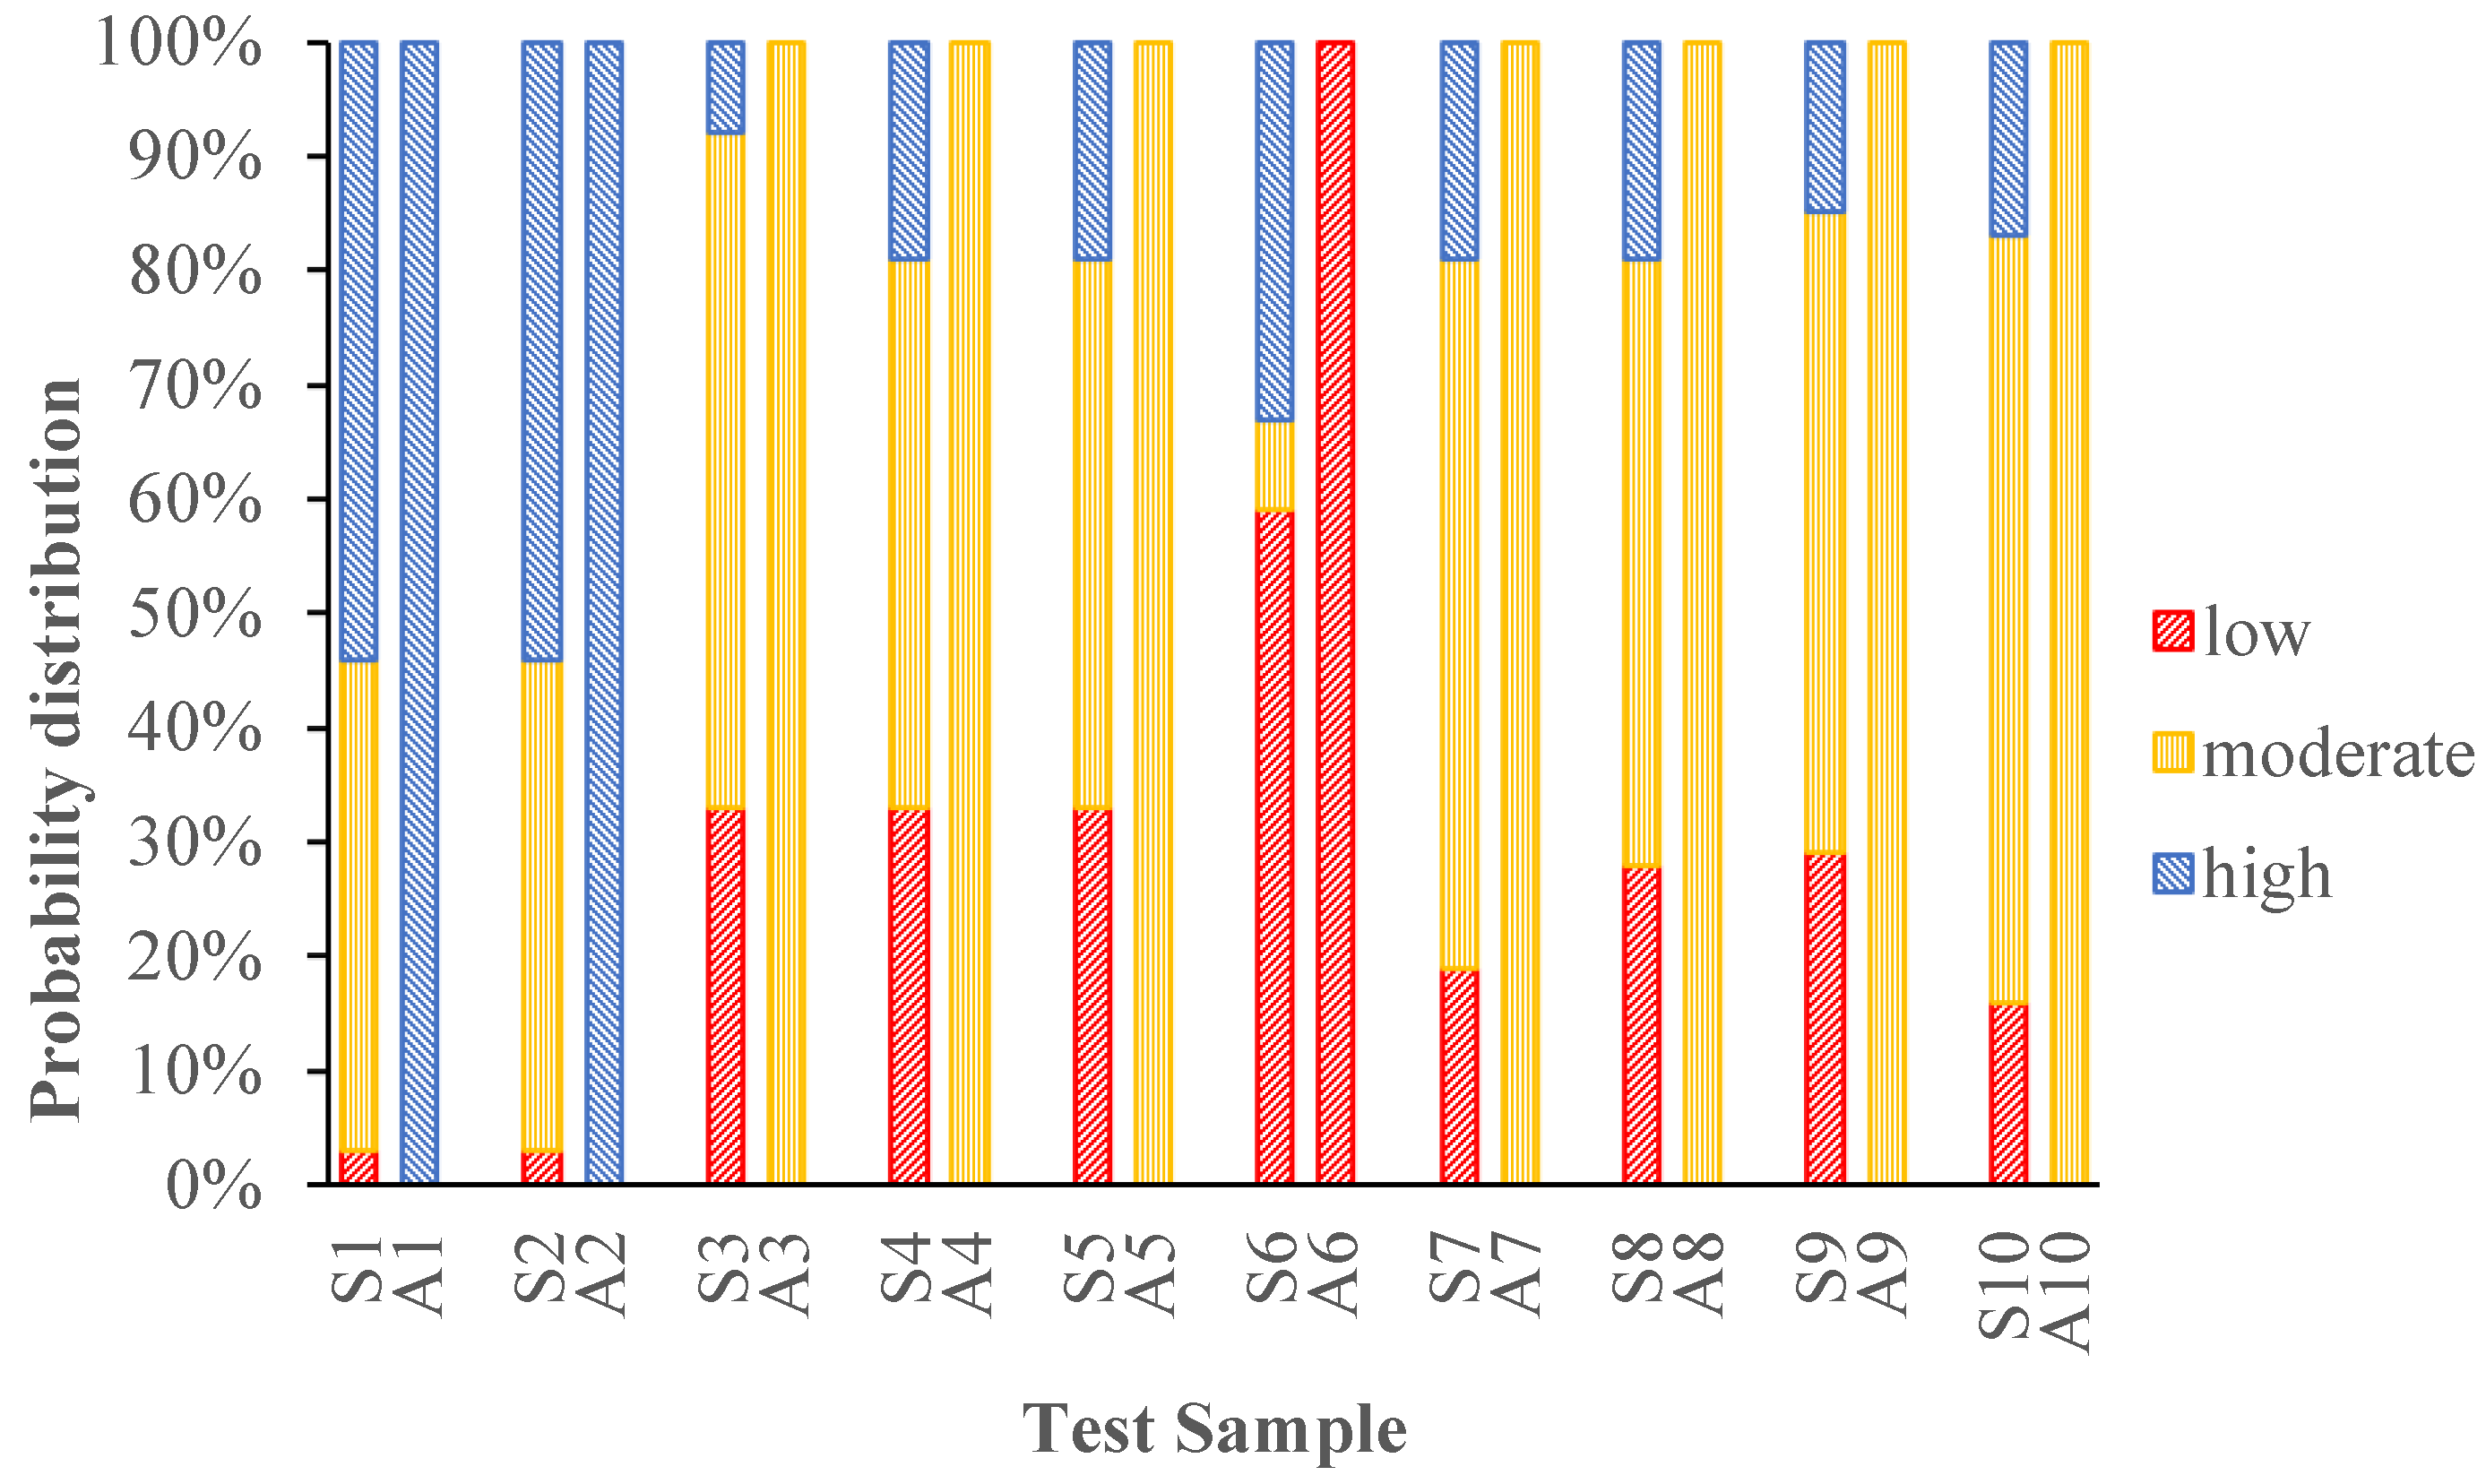
4.3. Model Validation
Through the above study, the BBN model of organizational leadership was constructed, and the CPT of all nodes was obtained for complex construction projects. On this basis, we took test samples as verification data and input them into the constructed BBN model for model validation. The probability distribution of organizational leadership was obtained through model reasoning, and the predicted state and actual value were compared to obtain the verification results. Model validation aims to demonstrate whether the logical relationships and conditional probabilities of the nodes in the model are consistent with the actual organizational leadership situation of construction projects, thus reflecting the accuracy and validity of the model measurements. The above iterations were repeated to validate the remaining nine samples. Finally, the verification results were obtained comprehensively. The model is valid once the percentage of accurate measurements to the total quantity of test data approaches 80%. The model verification results of this study are shown in
Figure 3.
The state with the highest probability in the probability distribution is regarded as the final decision in the optimal Bayesian decision theory, and the state with the highest probability in the probability distribution is regarded as the anticipated state.
Figure 3 shows that the probability distribution of organizational leadership corresponding to sample S1 was 3% in the low state, 43% in the moderate state, and 54% in the high state, so the predicted state of this sample through model inference is the high state. The actual value of organizational leadership was also found to be high by comparison. Therefore, it can be shown that the predicted state of the sample matches the actual value completely, and the measurement result is very accurate. Similarly, the predicted state of the remaining nine test samples also matched the actual value, which proves the effectiveness of the model. As a result, the BBN model developed in this study is suitable for model analysis and further research.
5. Model Analytics
Organizational leadership shows dynamic characteristics and will change dynamically during the life cycle of project management. Through the reasoning function of the DBN, the following three hypothetical scenario analyses were conducted: influence chain analysis, predictive analysis, and diagnostic analysis. On this basis, the key influencing factors and dynamic change rules of organizational leadership were further explored for complex construction projects.
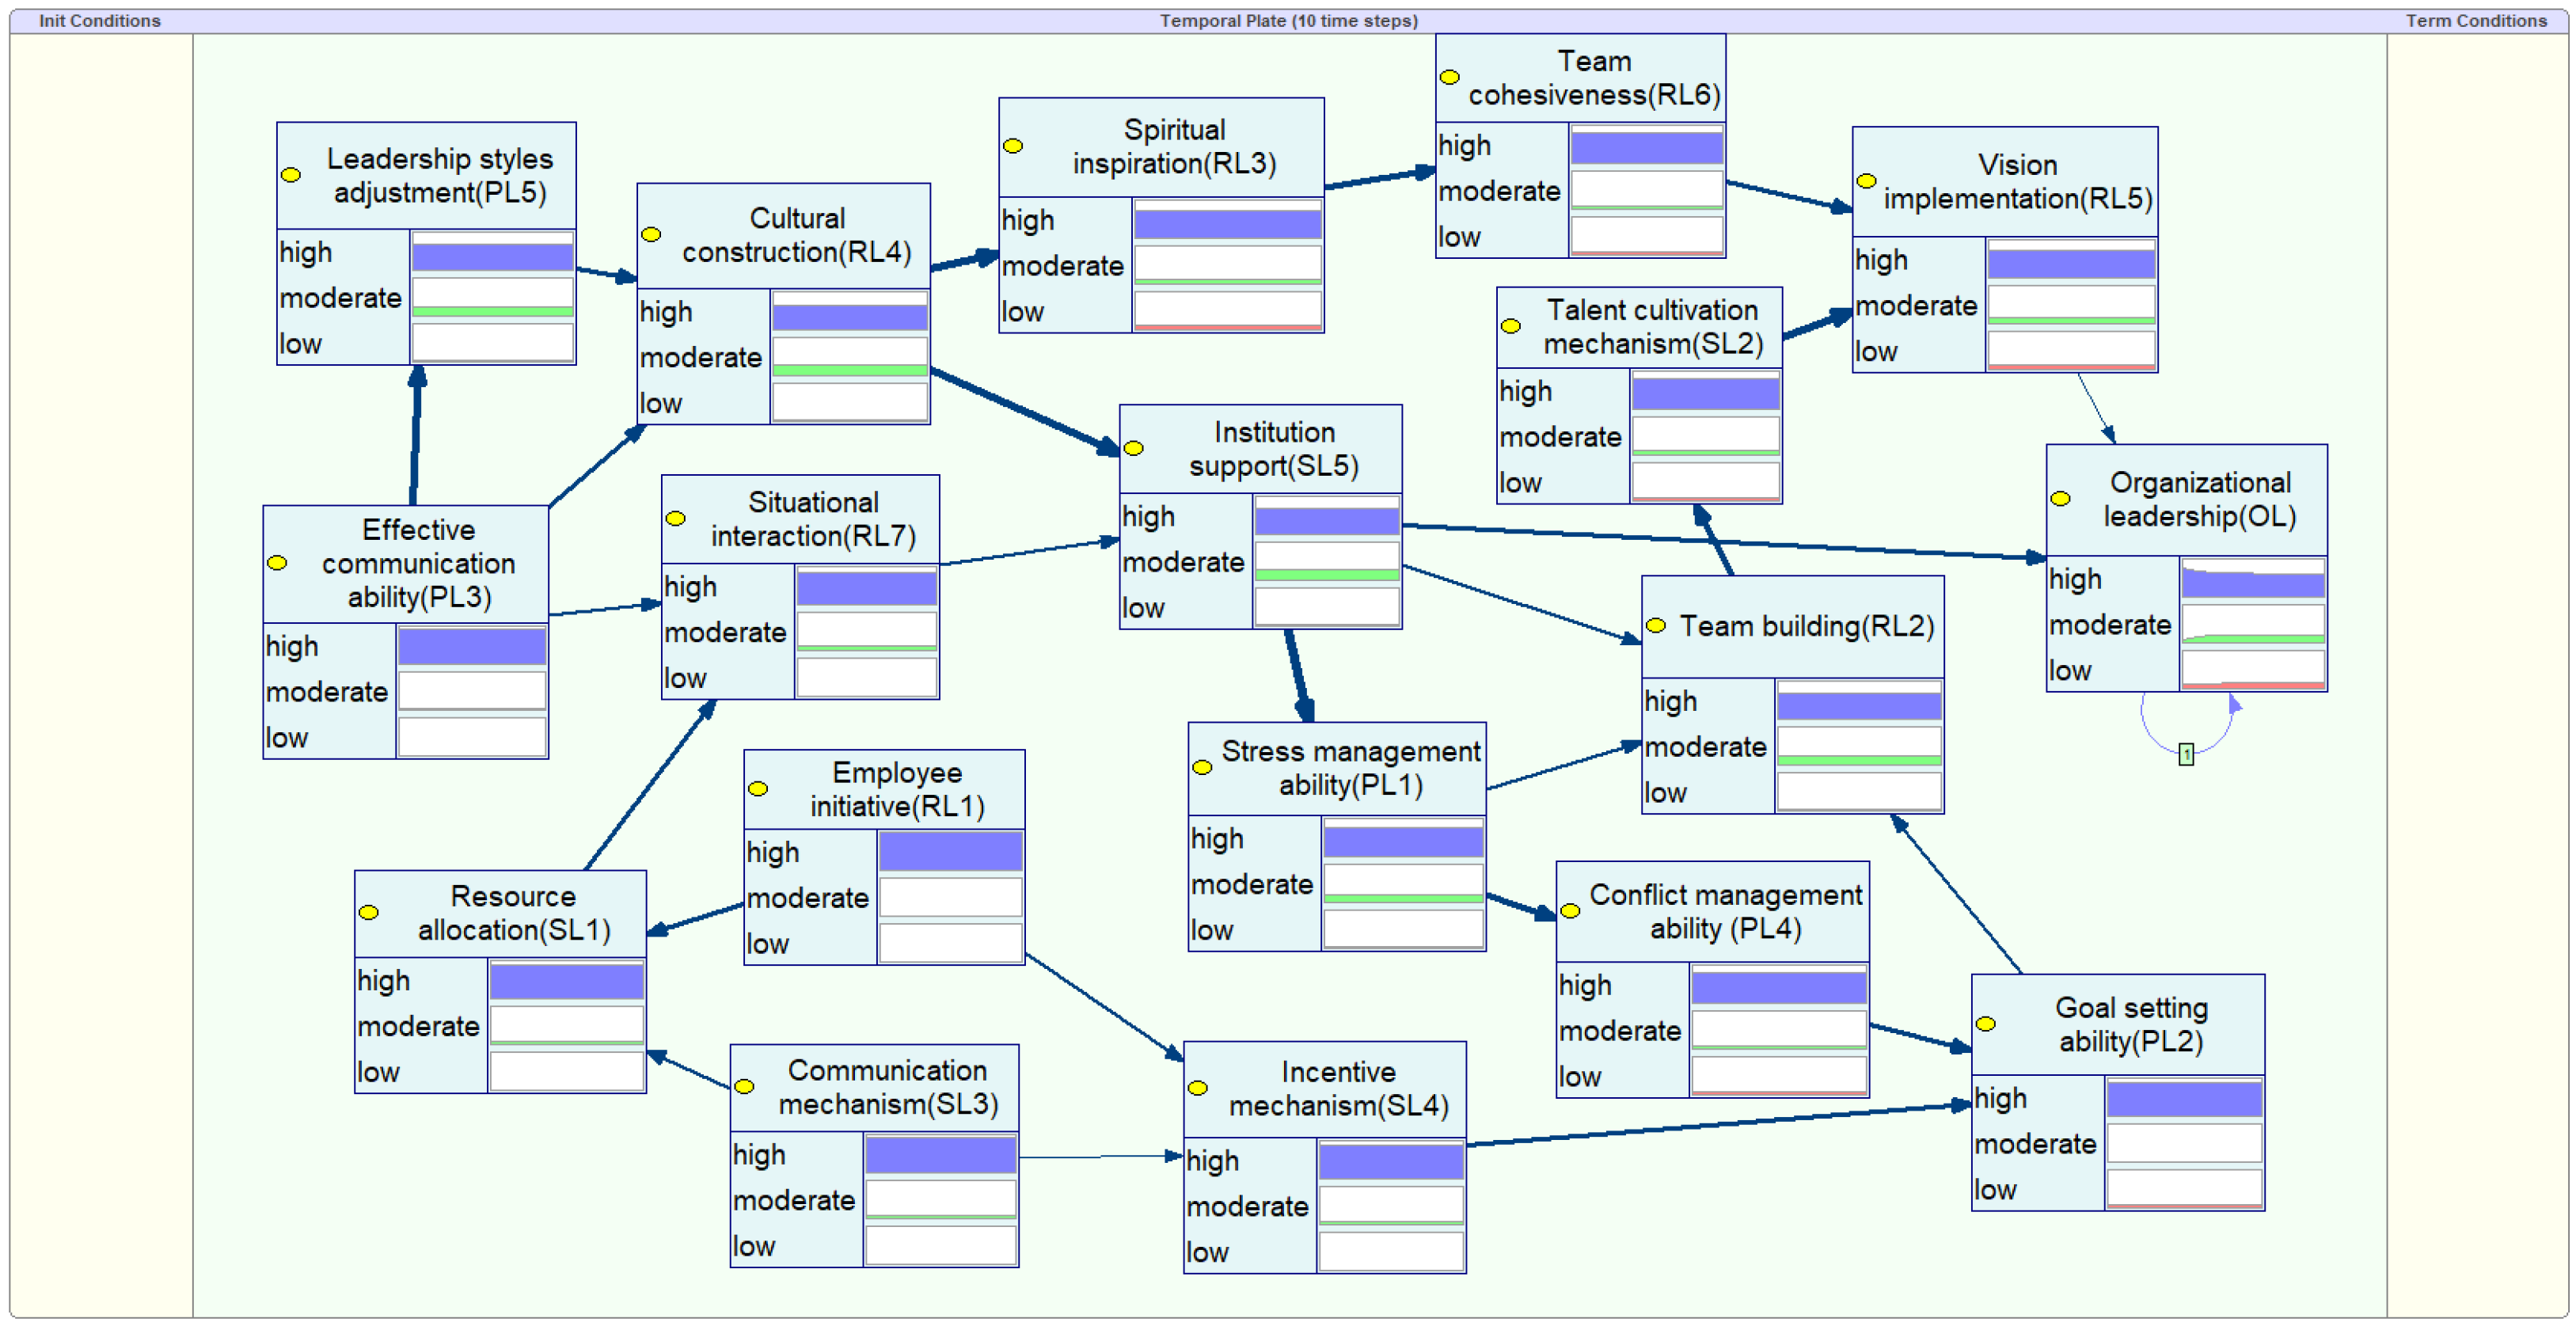
5.1. Influence Chain Analysis
Influence chain analysis can be used to examine the causal chain of greatest influence leading to outcomes by describing the mutual influence between nodes. When the target node is one of the multiple nodes that have a significant influence relationship, the link in the causal chain has the most influence. The software GeNIe 2.2 was adopted to analyze the influence chain of the DBN model, and the results are shown in
Figure 4.
As can be seen from
Figure 4, two chains of influence appear, as shown by the thickening chain. The biggest influence chain nodes are “effective communication ability (PL3) → leadership styles adjustment (PL5) → cultural construction (RL4) → Institution support (SL5) → stress management ability (PL1) → team building (RL2) → talent cultivation mechanism (SL2) → vision implementation (RL5), organizational leadership (OL)”. Therefore, according to the results of the influence chain analysis, individual pressure management ability, team building, and institutional support play an important role in the organizational leadership of complex construction projects.
5.2. Predictive Analysis
The predictive analysis aims to use a given piece of evidence to predict the level of organizational leadership. The strength of the factors influencing organizational leadership is determined by the probability distribution of each state of organizational leadership in a Bayesian network. Several key factors of organizational leadership were set as “high” evidence, and the software GeNIe 2.2 was used to predict the probability of organizational leadership under different scenarios.
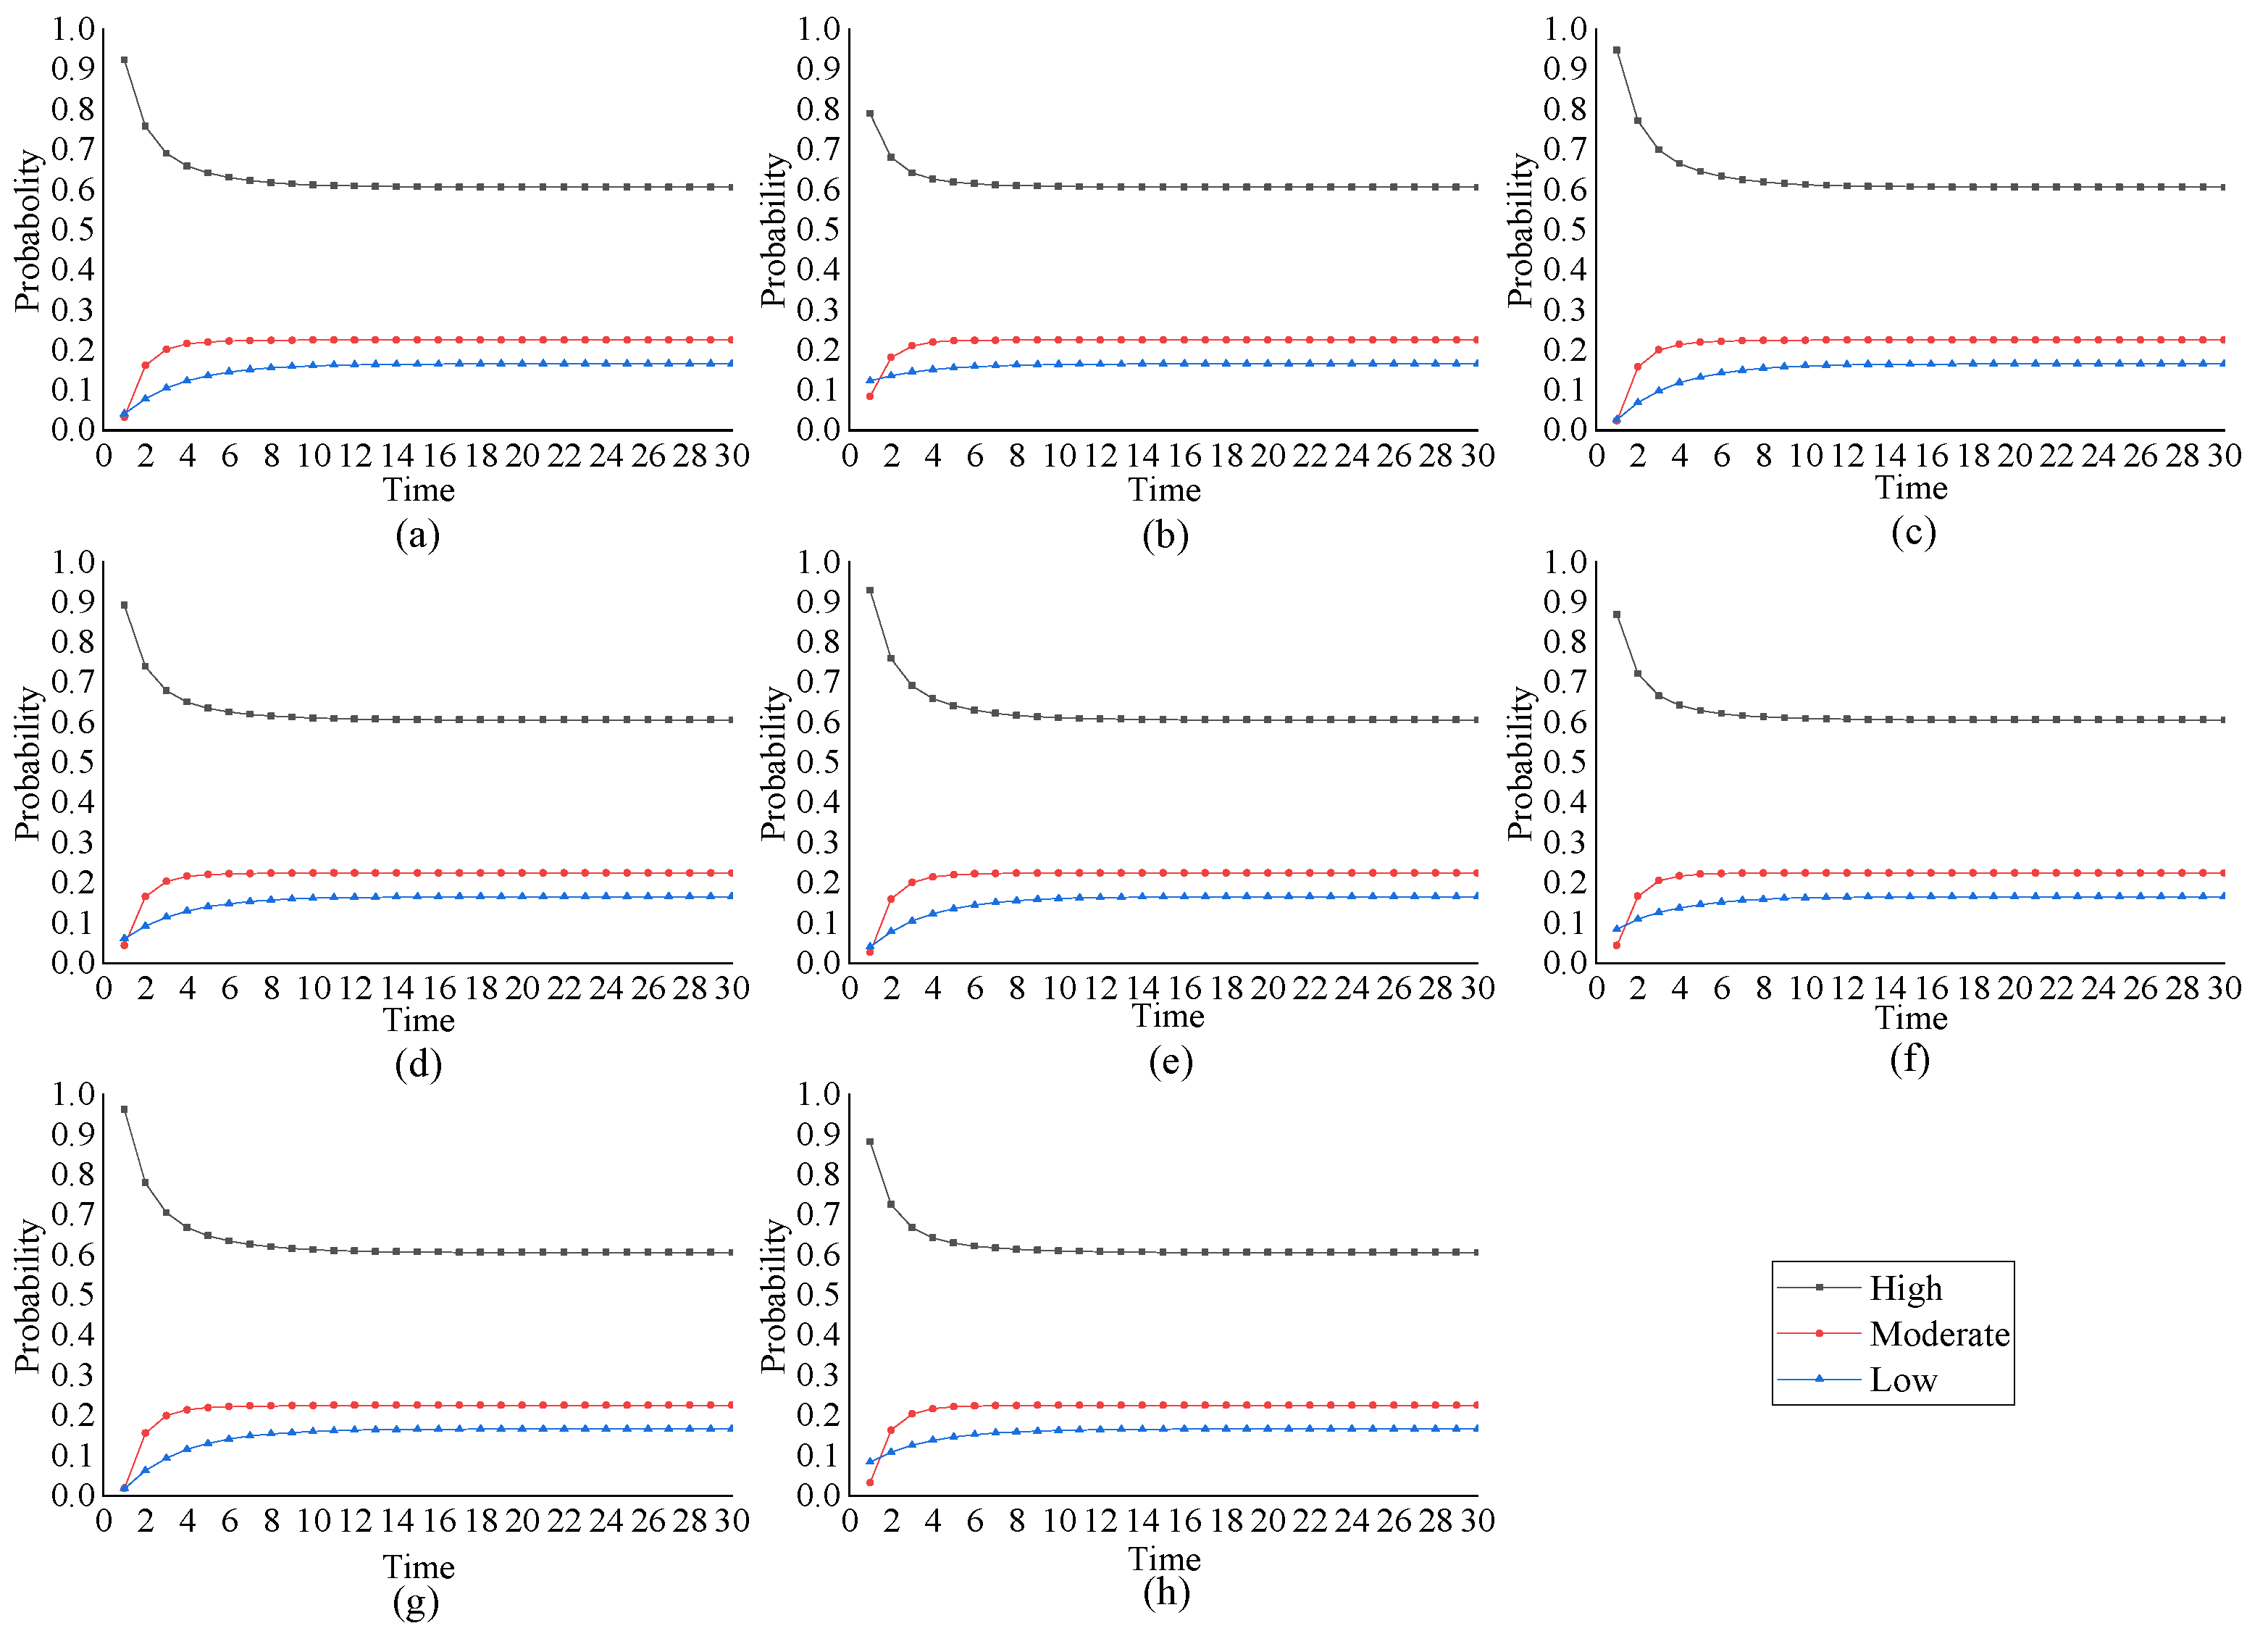
Figure 5 illustrates the probability of organizational leadership under different scenarios of predictive analysis.
As can be seen from
Figure 5, from a short-term perspective (Time = 0), when the SL5 state is set to “high”, the probability of organizational leadership being “high” is the largest. When the RL4 state is set to “high”, the probability of organizational leadership being “high” is the second largest. At the same time, it can be seen that P(OL=high∣SL5=high) > P(OL=high∣RL4=high) > P(OL=high∣PL5=high) > P(OL=high∣RL2=high) > P(OL=high∣PL1=high). From a long-term perspective (after Time = 1), the probability of organizational leadership in different states changes with time, and the maximum probability of organizational leadership is stable at a “high” state. It can be seen that when the node state of several key factors is set to “high”, the curve of the organizational leadership in the “high” state will continue to decline and then tend to be stable, whereas the curve of organizational leadership in the state of “moderate” and “low” will gradually rise and then stabilize. The primary factor is that DBN has the capabilities of memory learning and can save and aggregate the reasoning outcomes of previous moments. Thus, institutional support (SL5), cultural construction (RL4), leadership styles adjustment (PL5), team building (RL2), and stress management ability (PL1) are the most critical factors of organizational leadership.
5.3. Diagnostic Analysis
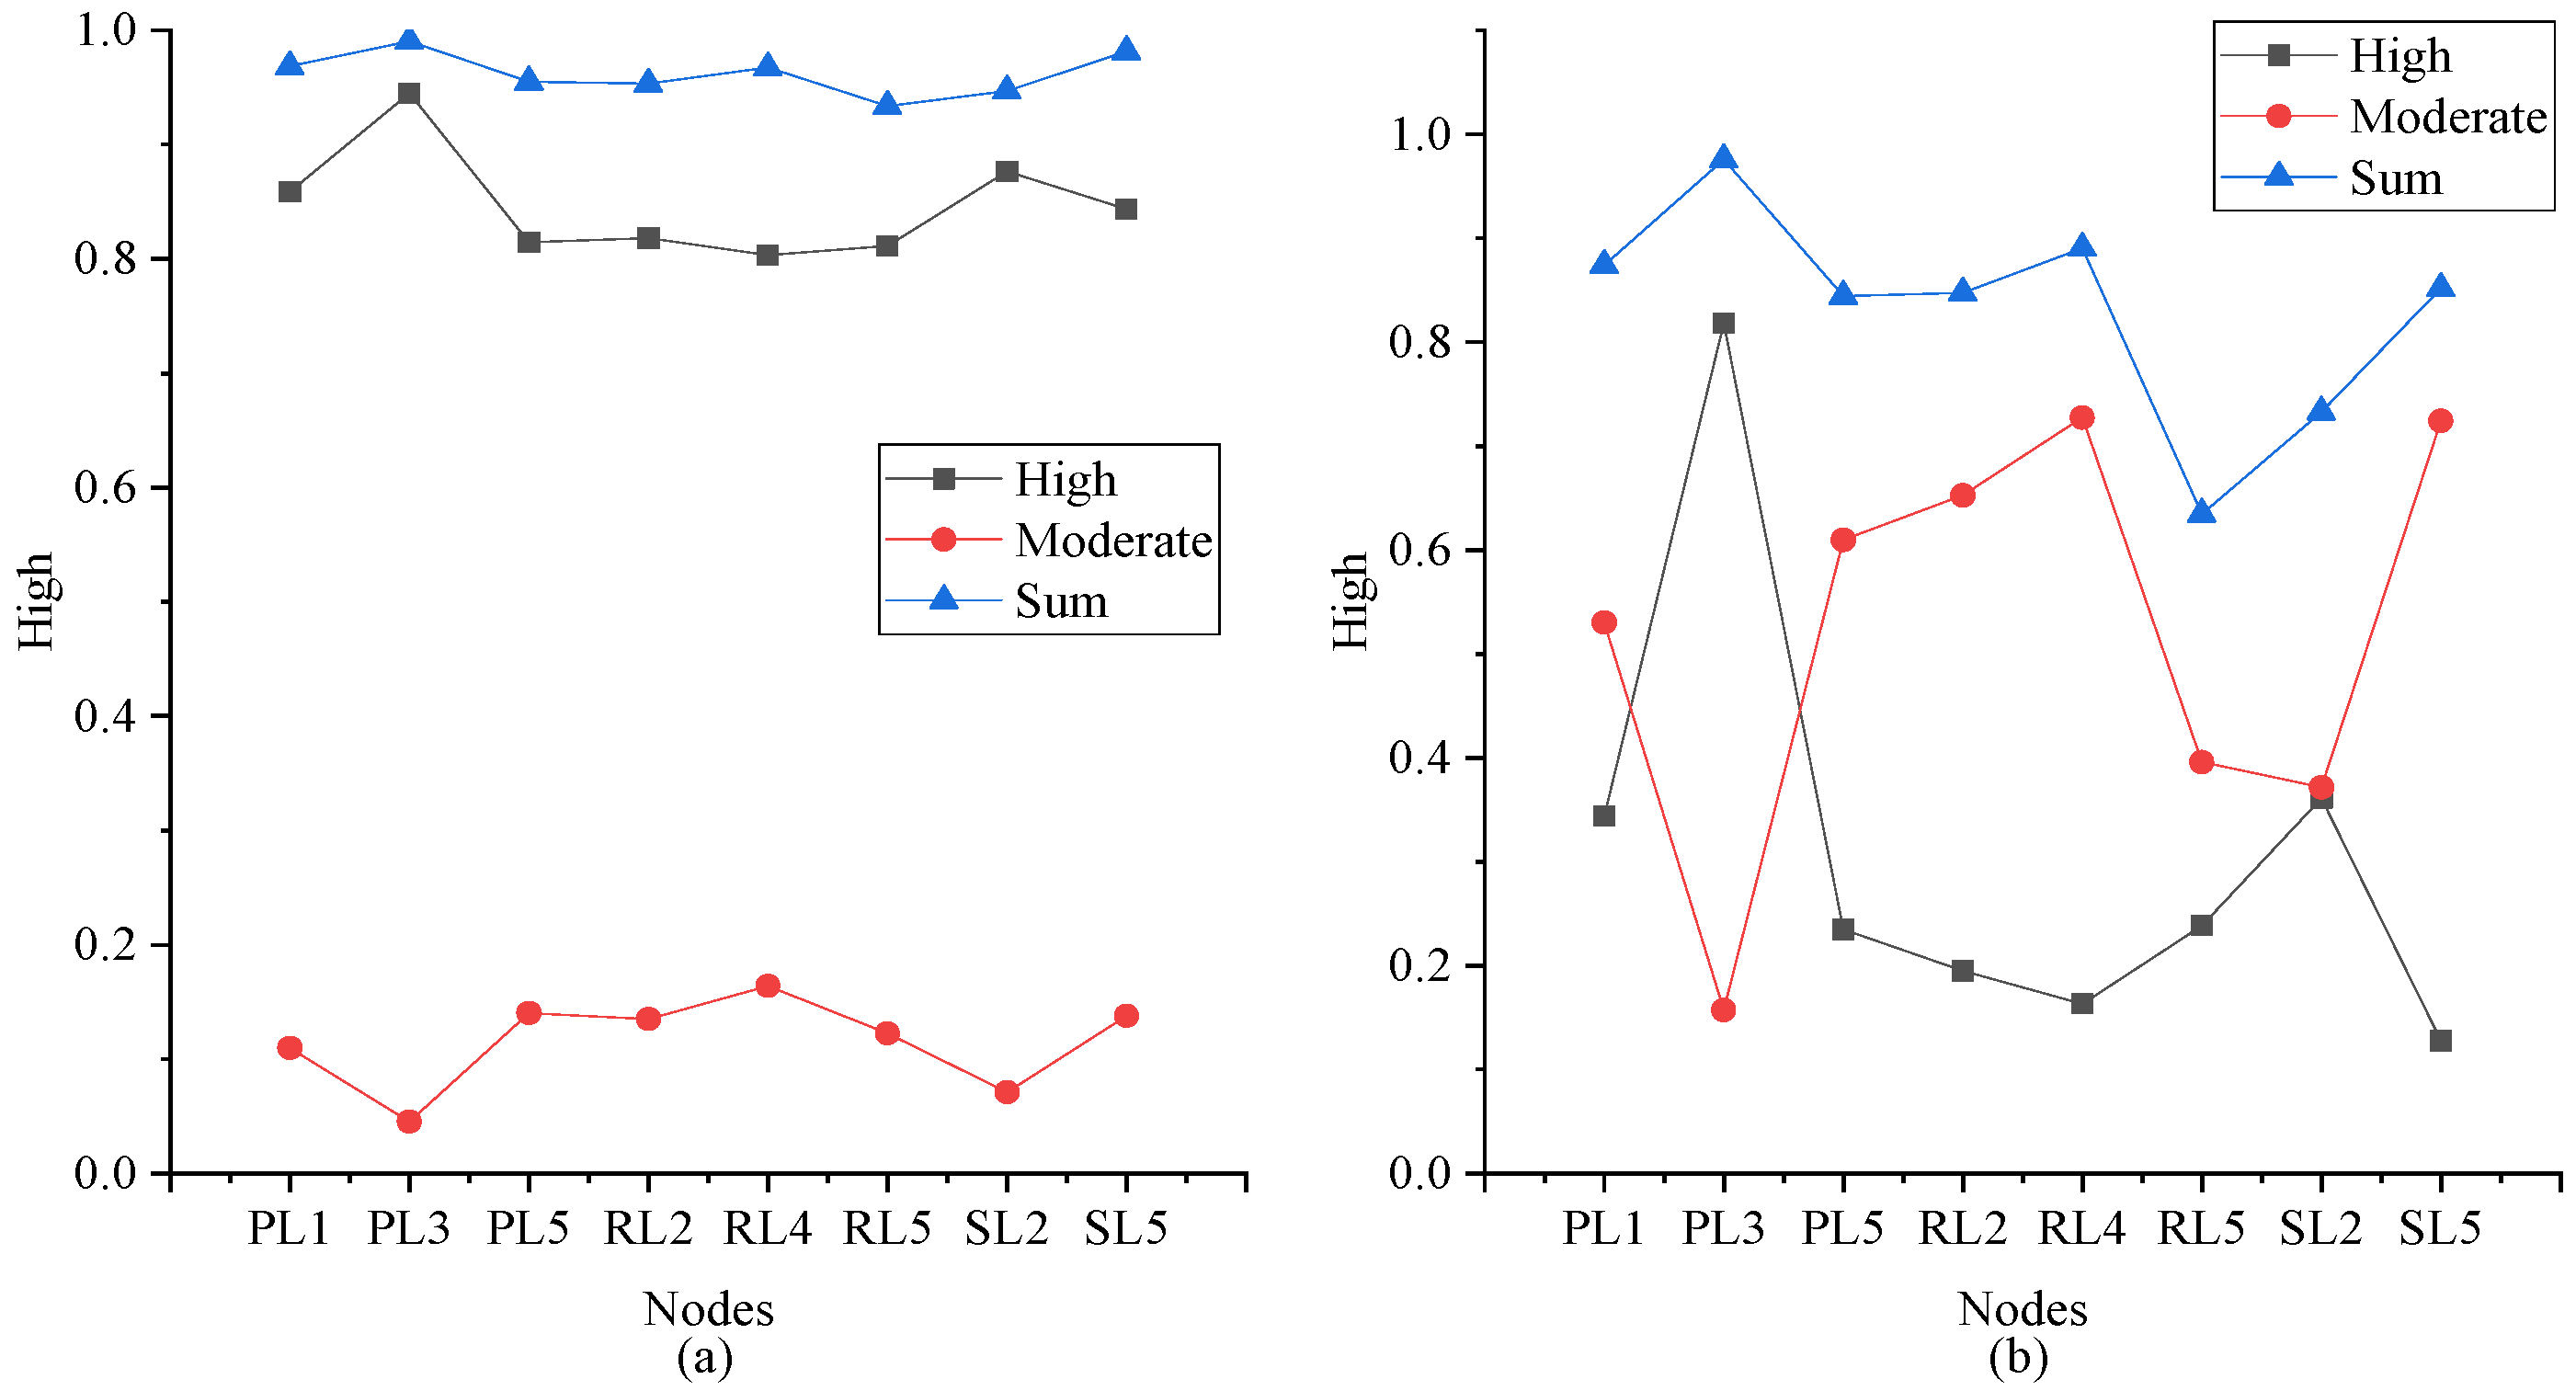
The diagnostic analysis seeks to identify the most likely direct reasons that have a greater impact on organizational leadership using reverse reasoning approaches in Bayesian reasoning. When organizational leadership declines, this approach can be used to determine the most suspicious causes and evaluate the posterior probabilities of each element. Thus, it can identify the factors that have the greatest influence on organizational leadership in the Bayesian network. The posterior probabilities of diagnostic analysis nodes under various conditions are shown in
Figure 6.
Figure 6 shows that when the node state is “high”, the posterior probability of effective communication ability (PL3), stress management ability (PL1), and talent cultivation mechanism (SL2) being “high” is high. Similarly, when the node state is “moderate”, cultural construction (RL4), team building (RL2), and leadership styles adjustment (PL5) have a higher posterior probability of “moderate”. In the total ranking, when P (OL=High) = 1, the posterior probability of nodes is PL3 > SL5 > PL1 > RL4 > PL5 > RL2 > SL2 > RL5. When P (OL=Moderate) = 1, the posterior probability of nodes is PL3 > RL4 > PL1 > SL5 > RL2 > PL5 > SL2 > RL5. Therefore, effective communication ability (PL3), cultural construction (RL4), stress management ability (PL1), and institutional support (SL5) are the most suspicious factors to improve organizational leadership.
6. Discussions and Implications
6.1. Theoretical Implications
At present, the research on the leadership of construction projects mostly focuses on project managers. From the perspective of project complexity, this study systematically analyzes project leadership from the three dimensions of personal leadership, relational leadership, and strategic leadership at the organizational level. To a certain extent, it improves the theoretical basis of the organizational leadership of complex construction projects and provides different perspectives for leadership research. The theoretical significance of this study mainly includes the following two aspects.
- (1)
The influencing factors system of organizational leadership for complex construction projects was constructed to better identify the sources of influencing factors. At present, the research on organizational leadership for complex construction projects is relatively weak in China. From the perspective of complexity, this study identifies the influencing factors of organizational leadership in complex construction projects by combining and summarizing the existing literature and related theories. The framework of the influencing factor of organizational leadership includes three dimensions: personal leadership, relational leadership, and strategic leadership. Thus, the findings have important theoretical significance for the study of organizational leadership for complex construction projects.
- (2)
It breaks through the traditional methods of studying organizational leadership from a static perspective. In this study, the DBN method is applied to the field of organizational leadership of complex construction projects, which can measure the dynamic change rules of the influencing factors of organizational leadership in the process of project construction. This opens up a fresh perspective on the dynamic traits of organizational leadership and has significant theoretical implications for handling complex construction projects.
6.2. Practical Implications
The DBN model constructed in this study can be used to measure the dynamic change in organizational leadership’s influencing factors and adjust the management dimension of each influencing factor, which is of great practical significance for projects to improve leadership.
- (1)
The relationship between influencing factors and organizational leadership can be explored using DBN’s flexible simulation capabilities, which have been amply demonstrated through model validation and analysis. Through the comparison of different analyses, it is helpful to deepen the understanding of project leaders on the interaction among the factors influencing organizational leadership and how these factors affect organizational leadership. Project managers have access to a quantitative model that can address dynamic issues that arise throughout the real project construction process thanks to the well-established DBN model of organizational leadership in complex construction projects. Thus, project leaders can control the whole leadership process at a macro level and provide important references for improving organizational leadership.
- (2)
According to the results of the model analysis, in the process of improving the leadership of the project organization, more attention should be paid to stress management ability, cultural construction, institutional support, and other factors. The results have been validated by other studies and practices. For example, stress management ability affects project performance from the individual capability dimension, while team building and institutional support affect project performance from the relationship climate dimension and organizational strategy dimension.
6.3. Empirical Analysis
The west coast media port construction project in Shanghai, China was selected for model verification and application. As a major project in the overall development of the region, the west coast media port is a typical complex construction project with the characteristics of a large scale, long period, functional complexity, high density, co-construction, and shared facilities. Combined with the influencing factors of organizational leadership in
Section 3, 17 influencing factors were evaluated as indicators of organizational leadership for the west coast media port project. Managers involved in the west coast media port project were invited to assess the organizational leadership indicators at different stages of the project. The project duration was divided into 10 stages, and the organizational leadership indicators at each stage were assessed by distributing questionnaires and obtaining data from 10 valid questionnaires. The data results of 10 questionnaires are counted in the way of average value. If the average number contained a decimal, it was rounded to the nearest integer. Thus, 10 groups of data (see
Table 5) were used as evidence to predict organizational leadership probability (see
Figure 7).
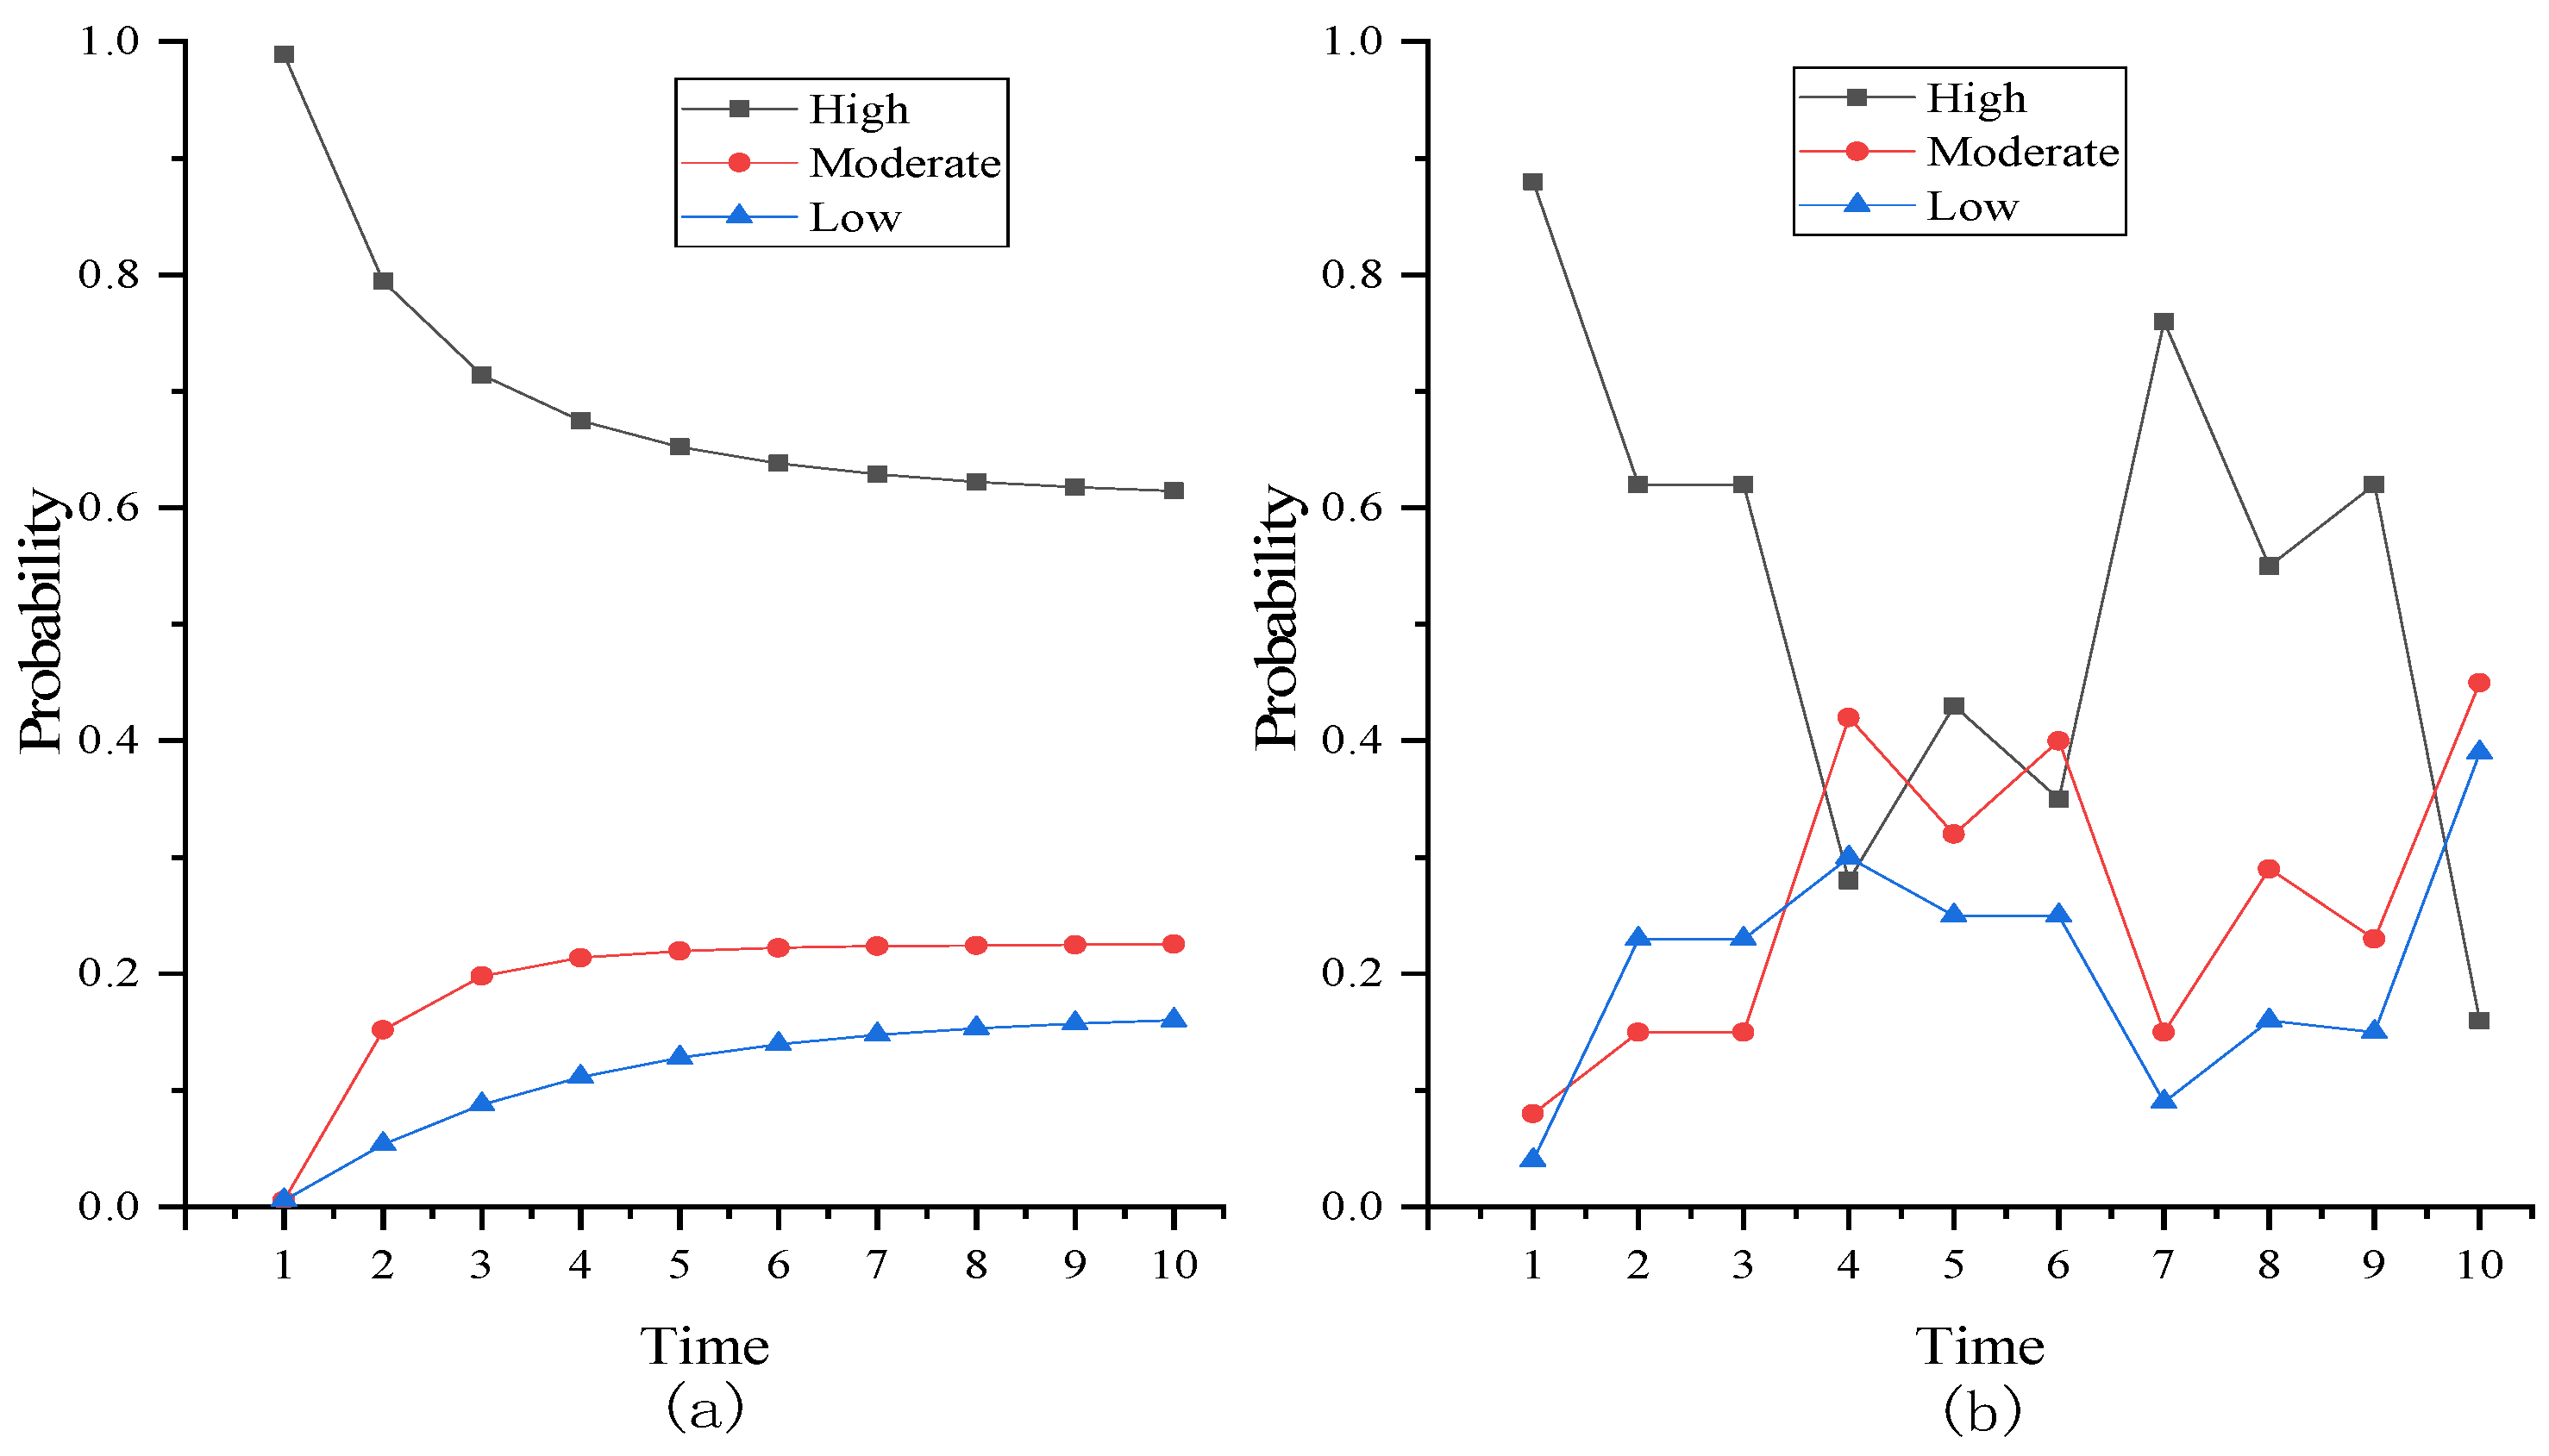
Table 6 displays the simulation findings and actual values, and the results of DBN and BBN are compared in
Figure 8.
It can be seen from
Table 5 and
Figure 8a that the organizational leadership of the west coast media port is predicted to be at a high level in all periods. As can be seen from
Table 5, when time = 1, the probability of organizational leadership at low, moderate, and high states is predicted to be 0.0055, 0.0055, and 0.9891, respectively, and the predicted result indicates that organizational leadership will be at a high level. When time = 2, 3, and 4, the predicted result is still in the high state, with probabilities of 0.7943, 0.7141, and 0.6748, respectively. The probability of a high level of organizational leadership decreases from the initial 0.9891 to 0.6748. After time = 5, the predicted results are still high, with probabilities between 0.6523 and 0.6145, and tend to be stable in this period.
By comparing the accuracy of DBN and BBN, it can be seen that the curve of DBN in
Figure 8a is smooth and shows a predictive trend, while the value of BBN in
Figure 8b is independent and only depends on the current evidence. This demonstrates that the DBN model has the capacity for information accumulation, while BBN relies on the observation information at a particular moment for inference. In contrast to DBN, BBN has nothing to do with the evidence of the previous moment. Therefore, due to the accumulation of information, the reasoning results of the DBN model are more accurate than those of the BBN model. Since it is difficult to obtain correct evaluation data in real time using the DBN model, its memory learning characteristics are of great significance for predicting organizational leadership. DBN reasoning contains a large amount of information, and even if vague information is provided as evidence, it can guarantee accurate predictive results. Therefore, the DBN model can be used to dynamically calculate and analyze the change rule of organizational leadership over time in specific construction projects.
6.4. Discussions
Firstly, the influencing factors of organizational leadership in complex projects were taken as the network nodes for constructing the Bayesian network, and the questionnaire data were rationalized. Secondly, the BBN model of organizational leadership was established through structural learning and parametric learning, and the CPTs of all the nodes were obtained. Thirdly, the model validation was carried out for the BBN model, and the results show that the model is very effective. Finally, the constructed BBN model was used as the initial network, and through the state transfer probability table, the expansion of BBN to DBN was completed, the DBN model of complex construction projects was created, and simulation analyses were carried out. The results show that (1) two influence chains appeared in the simulation analysis, and the biggest influence chain nodes were “effective communication ability (PL3) → leadership styles adjustment (PL5) → cultural construction (RL4) → Institution sup-port (SL5) → stress management ability (PL1) → team building (RL2) → talent cultivation mechanism (SL2) → vision implementation (RL5), organizational leadership (OL)”, so individual risk management ability, team building, and institutional support play an important role in the organization and leadership of complex construction projects. Organizational leadership of construction projects plays an important role. (2) Institutional support (SL5), cultural construction (RL4), leadership style adjustment (PL5), team building (RL2), and stress management ability (PL1) are the most critical factor in organizational leadership. (3) Effective communication ability (PL3), cultural construction (RL4), stress management ability (PL1), and institutional support (SL5) are the most important factors affecting organizational leadership.
Further, we carried out an empirical analysis of the constructed DBN model of project organizational leadership. Project participants were invited to assess the project organizational leadership indicators, and the data were imported into the DBN model. Finally, the inference results of the DBN model were analyzed and compared with the BBN model. The results showed that the DBN model constructed in this paper is feasible and applicable and can dynamically calculate and analyze the change rule of organizational leadership in complex construction projects over time.
7. Conclusions
In this study, a simulation method based on Bayesian reasoning was proposed to explore the evolutionary dynamics of the influencing factors of organizational leadership considering the time change in complex construction projects. The results showed that PL1 (pressure management ability), RL4 (cultural construction), and SL5 (institutional support) are the leading factors affecting organizational leadership. In the case of limited resources, leaders can take targeted measures to improve the leadership of project organizations.
This study has important contributions to current academic research. Firstly, the existing literature review indicates that previous studies have ignored the dynamic changes in organizational leadership during project construction. The proposed Bayesian-based method can describe the system of organizational leadership’s influencing factors in an unpredictable and dynamic environment, and this study is an attempt to close this gap in the literature. Compared with previous AHP, SEM, and other methods, the DBN method proposed in this study can provide real-time support for the whole life cycle of organizational leadership management. Secondly, this study used Bayesian inference machine learning to simulate the change in influencing factors of organizational leadership over time. The DBN of organizational leadership was built based on machine learning of a large amount of given data. Due to the time update function, it can carry out an evolutionary dynamic analysis.
In terms of theory, on the one hand, by combing and summarizing the existing literature and relevant theories and adopting the questionnaire survey method, we identified the influencing factors of organizational leadership in complex construction projects and constructed the framework of its influencing factor system so as to better clarify the factors affecting organizational leadership in complex construction projects, which is of great theoretical significance for the study of this topic. On the other hand, applying the dynamic Bayesian network method to the field of organizational leadership of complex construction projects breaks through the traditional mode of studying organizational leadership from a static perspective, so that the dynamic problem of the organizational leadership of complex construction projects is well solved, which provides a new way of thinking and has important theoretical significance for the study of the dynamic characteristics of organizational leadership of complex construction projects.
In terms of practice, on the one hand, the establishment of the dynamic Bayesian network model of organizational leadership in complex construction projects provides a quantifiable model for project leaders and can cope with the dynamics of the actual project so that project leaders have macro control of the whole leadership process, which provides an important reference for improving organizational leadership. On the other hand, the empirical analysis based on the constructed dynamic Bayesian network model explores the strategy of organizational leadership enhancement, which is also an important reference value for other similar projects to enhance project organizational leadership.
However, the established DBN model has some limitations. The DBN model in this study was established on the basis of collecting survey data from the whole construction project. It cannot distinguish between the phases of life cycle management, such as planning, design, construction, operation, and maintenance. However, the network structure of organizational leadership and CPT can vary significantly over time in different phases of project management. Therefore, future studies should take into account the features of various stages.
Author Contributions
Conceptualization, H.S. and L.L.; Data curation, X.N.; Formal analysis, H.S.; Investigation, H.S. and X.N.; Methodology, H.S. and L.L.; Project administration, L.L.; Resources, L.L.; Software, H.S., X.N. and C.F.; Supervision, L.L. and Y.H.; Validation, L.L., X.N. and C.F.; Visualization, C.F.; Writing–original draft, H.S. and C.F.; Writing—review & editing, H.S., Y.H. and X.N. All authors have read and agreed to the published version of the manuscript.
Funding
This research is funded by the National Natural Science Foundation of China [71901113, 72061025, 71962019] and the Jiangxi Provincial Natural Science Foundation (Nos: 20212ACB214014 and 20232BAB204076).
Data Availability Statement
The original contributions presented in the study are included in the article, further inquiries can be directed to the corresponding author.
Conflicts of Interest
The authors declare no conflicts of interest.
References
- Luo, L.; He, Q.; Xie, J.; Yang, D.; Wu, G. Investigating the Relationship between Project Complexity and Success in Complex Construction Projects. J. Manag. Eng. 2017, 33, 04016036. [Google Scholar] [CrossRef]
- Giezen, M.; Bertolini, L.; Salet, W. Adaptive Capacity within a Mega Project: A Case Study on Planning and Decision-Making in the Face of Complexity. Eur. Plan. Stud. 2015, 23, 999–1018. [Google Scholar] [CrossRef]
- Flyvbjerg, B. What You Should Know about Megaprojects and Why: An Overview. Proj. Manag. J. 2014, 45, 6–19. [Google Scholar] [CrossRef]
- Mueller, R.; Geraldi, J.; Turner, J.R. Relationships between Leadership and Success in Different Types of Project Complexities. IEEE Trans. Eng. Manag. 2012, 59, 77–90. [Google Scholar] [CrossRef]
- Muller, R.; Turner, R. Leadership competency profiles of successful project managers. Int. J. Proj. Manag. 2010, 28, 437–448. [Google Scholar] [CrossRef]
- Wu, X.; Liu, H.; Zhang, L.; Skibniewski, M.J.; Deng, Q.; Teng, J. A dynamic Bayesian network based approach to safety decision support in tunnel construction. Reliab. Eng. Syst. Saf. 2015, 134, 157–168. [Google Scholar] [CrossRef]
- Roed, W.; Mosleh, A.; Vinnem, J.E.; Aven, T. On the use of the hybrid causal logic method in offshore risk analysis. Reliab. Eng. Syst. Saf. 2009, 94, 445–455. [Google Scholar] [CrossRef]
- Meng, J.; Xue, B.; Liu, B.; Fang, N. Relationships between top managers’ leadership and infrastructure sustainability A Chinese urbanization perspective. Eng. Constr. Archit. Manag. 2015, 22, 692–714. [Google Scholar] [CrossRef]
- Newman, A.; Schwarz, G.; Cooper, B.; Sendjaya, S. How Servant Leadership Influences Organizational Citizenship Behavior: The Roles of LMX, Empowerment, and Proactive Personality. J. Bus. Ethics 2017, 145, 49–62. [Google Scholar] [CrossRef]
- Stogdill, R.M. Personal factors associated with leadership: A survey of the literature. J. Psychol. 1948, 25, 35–71. [Google Scholar] [CrossRef] [PubMed]
- Bass, B.M.; Avolio, B.J.; Jung, D.I.; Berson, Y. Predicting unit performance by assessing transformational and transactional leadership. J. Appl. Psychol. 2003, 88, 207–218. [Google Scholar] [CrossRef] [PubMed]
- Imam, H.; Zaheer, M.K. Shared leadership and project success: The roles of knowledge sharing, cohesion and trust in the team. Int. J. Proj. Manag. 2021, 39, 463–473. [Google Scholar] [CrossRef]
- Aarons, G.A.; Ehrhart, M.G.; Farahnak, L.R.; Hurlburt, M.S. Leadership and organizational change for implementation (LOCI): A randomized mixed method pilot study of a leadership and organization development intervention for evidence-based practice implementation. Implement. Sci. 2015, 10, 11. [Google Scholar] [CrossRef] [PubMed]
- Akhtar, S.A.; Choudhary, A.I.; Haymoun, A.A. Impact of Transformational and Servant Leadership on Organizational Performance: A Comparative Analysis. Actual Probl. Econ. 2012, 130, 309–315. [Google Scholar]
- Luo, L.; Zhang, L.; Zheng, X.; Wu, G. A hybrid approach for investigating impacts of leadership dynamics on project performance. Eng. Constr. Archit. Manag. 2022, 29, 1965–1990. [Google Scholar] [CrossRef]
- Chen, Y.; Zhou, X.; Klyver, K. Collective Efficacy: Linking Paternalistic Leadership to Organizational Commitment. J. Bus. Ethics 2019, 159, 587–603. [Google Scholar] [CrossRef]
- Kissi, J.; Dainty, A.; Tuuli, M. Examining the role of transformational leadership of portfolio managers in project performance. Int. J. Proj. Manag. 2013, 31, 485–497. [Google Scholar] [CrossRef]
- Wu, C.; Li, N.; Fang, D. Leadership improvement and its impact on workplace safety in construction projects: A conceptual model and action research. Int. J. Proj. Manag. 2017, 35, 1495–1511. [Google Scholar] [CrossRef]
- Kim, S.Y.; Imoto, S.; Miyano, S. Dynamic Bayesian network and nonparametric regression for nonlinear modeling of gene networks from time series gene expression data. In Computational Methods in Systems Biology, Proceedings; Priami, C., Ed.; Lecture Notes in Computer Science; Springer: Cham, Switzerland, 2003; Volume 2602, pp. 104–113. [Google Scholar]
- Xie, Y.; Xue, W.; Li, L.; Wang, A.; Chen, Y.; Zheng, Q.; Wang, Y.; Li, X. Leadership style and innovation atmosphere in enterprises: An empirical study. Technol. Forecast. Soc. Chang. 2018, 135, 257–265. [Google Scholar] [CrossRef]
- Smith, J.; Gardner, D. Factors affecting employee use of work-life balance initiatives. N. Z. J. Psychol. 2007, 36, 3–12. [Google Scholar]
- Haemmelmann, A.; van Dick, R. Building the team: Developing the individual—An evaluation of team building interventions. Gr. Und Organ. 2013, 44, 221–238. [Google Scholar] [CrossRef]
- Chen, S.; Jiang, W.; Zhang, G.; Chu, F. Spiritual Leadership on Proactive Workplace Behavior: The Role of Organizational Identification and Psychological Safety. Front. Psychol. 2019, 10, 1206. [Google Scholar] [CrossRef] [PubMed]
- Giritli, H.; Oney-Yazici, E.; Topcu-Oraz, G.; Acar, E. The interplay between leadership and organizational culture in the Turkish construction sector. Int. J. Proj. Manag. 2013, 31, 228–238. [Google Scholar] [CrossRef]
- O’Connell, D.; Hickerson, K.; Pillutla, A. Organizational Visioning: An Integrative Review. Group Organ. Manag. 2011, 36, 103–125. [Google Scholar] [CrossRef]
- Troupe, D. Developing Results-Based Leadership Attributes and Team Cohesiveness through Action Learning; Proquest, Umi Dissertation Publishing: Ann Arbor, MI, USA, 2010. [Google Scholar]
- Shoemaker, J.A. Construct Validity of Situational Judgment Tests: An Examination of the Effects of Agreeableness, Organizational Leadership Culture, and Experience on SJT Responses. Ph.D. Thesis, University of South Florida, Tampa, FL, USA, 2007. [Google Scholar]
- Smith, J.M. Organizational Structures and Resource Allocations Employed by Rural Missouri Educational Leaders to Promote College and Career Readiness. Ph.D. Thesis, William Woods University, Fulton, MO, USA, 2018. [Google Scholar]
- Jamal, J.; Abu Bakar, H. The Mediating Role of Charismatic Leadership Communication in a Crisis: A Malaysian Example. Int. J. Bus. Commun. 2017, 54, 369–393. [Google Scholar] [CrossRef]
- Zhang, L.; Zhang, Z. The Effects of Incentive Mechanism on Knowledge Management Performance in China: The Moderating Role of Knowledge Attributes. Proj. Manag. J. 2014, 45, 34–47. [Google Scholar] [CrossRef]
- Gopalan, S. The Relationship between Authentic Leadership Style, Organizational Support, and Work-Life Balance. Ph.D. Thesis, Capella University, Minneapolis, MN, USA, 2022. [Google Scholar]
- Vehtari, A.; Gelman, A.; Gabry, J. Practical Bayesian model evaluation using leave-one-out cross-validation and WAIC. Stat. Comput. 2017, 27, 1433. [Google Scholar] [CrossRef]
- Cooper, G.F.; Herskovits, E. A Bayesian Method for the Induction of Probabilistic Networks from Data. Mach. Learn. 1992, 9, 309–347. [Google Scholar] [CrossRef]
- Luo, L.; Zhang, L.; Wu, G. Bayesian Belief Network-Based Project Complexity Measurement Considering Causal Relationships. J. Civ. Eng. Manag. 2020, 26, 200–215. [Google Scholar] [CrossRef]
- Abimbola, M.; Khan, F. Dynamic Blowout Risk Analysis Using Loss Functions. Risk Anal. 2018, 38, 255–271. [Google Scholar] [CrossRef] [PubMed]
| Disclaimer/Publisher’s Note: The statements, opinions and data contained in all publications are solely those of the individual author(s) and contributor(s) and not of MDPI and/or the editor(s). MDPI and/or the editor(s) disclaim responsibility for any injury to people or property resulting from any ideas, methods, instructions or products referred to in the content. |
© 2024 by the authors. Licensee MDPI, Basel, Switzerland. This article is an open access article distributed under the terms and conditions of the Creative Commons Attribution (CC BY) license (https://creativecommons.org/licenses/by/4.0/).


