Article

Improving Tunnel Boring Machine Tunneling Performance by Investigating the Particle Size Distribution of Rock Chips and Cutter Consumption

1
Pumped-Storage Technological & Economic Research Institute of State Grid Xinyuan Co., Ltd., Beijing 100052, China
2
School of Civil Engineering, Zhengzhou University, Zhengzhou 450001, China
3
State Key Laboratory of Shield Machine and Boring Technology, Zhengzhou 450001, China
4
SGIDI Engineering Consulting (Group) Co., Ltd., Shanghai 200093, China
*
Author to whom correspondence should be addressed.
Buildings 2024, 14(4), 1124; https://doi.org/10.3390/buildings14041124
Submission received: 5 March 2024 / Revised: 12 April 2024 / Accepted: 14 April 2024 / Published: 17 April 2024
(This article belongs to the Special Issue Design, Construction and Maintenance of Underground Structures)

Abstract

:
The construction environment of deep rock tunnels is complex, and effectively enhancing tunnel boring machine (TBM) tunneling efficiency is paramount. Increasing rock-breaking efficiency and minimizing cutter consumption are essential strategies for improving TBM tunneling efficiency. Selecting suitable tunneling parameters is crucial for enhancing rock-breaking efficiency and reducing cutter consumption. Existing research on the optimization of the ratio of maximum cutter spacing to penetration (Smax/P) based on field-measured data is limited, and few studies compare and analyze the relationship between SE, CI, and the Smax/P ratio separately. Consequently, this study determined optimal tunneling parameters for various types of surrounding rock and construction environments, aiming to more accurately optimize TBM tunneling performance during construction processes based on on-site construction data. This study conducted a comparative analysis of specific energy (SE) and the coarseness index (CI). Under both working conditions, the quadratic fitting coefficients of the CI are 4.2% and 10.6% higher than those of the SE, respectively, with the CI selected to represent the particle size distribution of rock chips. Finally, taking into account both the correlations between the CI and the ratio of maximum cutter spacing to penetration (Smax/P), as well as cutter consumption and the Smax/P ratio, an optimization method for the TBM tunneling parameter was established under both dry and saturated conditions. The research findings indicate that cutter consumption exhibits an exponential increase with a higher rock Cerchar Abrasivity Index (CAI); it initially decreases as the Smax/P ratio increases and subsequently increases in both dry and saturated conditions. Instead, the CI demonstrates an initial increase and subsequent decrease as the Smax/P ratio increases. Maximizing rock-breaking efficiency and minimizing cutter consumption are crucial for improving tunneling performance. In saturated conditions, the corresponding optimal Smax/P ratio ranges are 7.055–8.319 for soft rock, 8.606–8.931 for medium–hard rock, and 13.50–14.00 for hard rock, and these optimal ranges under dry conditions are 8.495–9.457, 10.972–12.169, and 16.5–17.5 for the same rock types. This study provides optimal Smax/P ratio ranges for TBM tunneling, thereby significantly enhancing tunneling efficiency.

1. Introduction

Tunnel boring machines (TBMs) are extensively used in engineering projects, such as water conveyance tunnels, highway tunnels, and railway tunnels, owing to their exceptional rock-breaking efficiency, capacity for the provision of a secure working environment, and minimal impact on their geological surroundings. In the 21st century, China has achieved remarkable advancements in the construction of extensive and large-scale tunnel projects through the utilization of the TBM method. Notable completed projects include the West Qinling Tunnel of the Lanzhou–Chongqing Railway, the Qinling Tunnel of the Xikang Railway, the Dahuofang Water Diversion Tunnel in Liaoning, the Shaanxi Water Diversion Tunnel from the Han to Wei Rivers, and the Jilin Water Diversion Project. The TBM method stands as one of the prevailing construction techniques for the creation of lengthy tunnels, with its primary advantage rooted in its rapid construction pace [1,2,3,4]. Consequently, while prioritizing the secure execution of TBM operations, paramount strategies encompass diminishing disc cutter consumption while enhancing rock-breaking efficiency.
During the TBM construction process, the mechanism of breaking rocks using the disc cutter is highly complex. A TBM employs a disc cutter for rotation and cutting, thereby inducing tensile, compressive, and shear failures within a rock mass as an integral part of the excavation process [5]. In the process of rock-breaking using a disc cutter, the efficiency of TBM rock-breaking is primarily influenced by several factors, including the properties of the surrounding rock, the TBM cutter head, and the tunneling parameters. On one hand, the presence of joints with varying orientations, inclinations, and integrity levels in the surrounding rock introduces complexity and uncertainty to the TBM rock-breaking mechanism. On the other hand, the arrangement of the disc cutters and the tunneling parameters of the TBM, including the spacing between TBM disc cutters and penetration, also exert substantial influences on the efficiency of rock-breaking. The spacing between TBM disc cutters can significantly impact the efficiency of rock-breaking. It is essential to note that the cutter head and cutters of a TBM cannot be altered or modified during the later stages of manufacturing and installation. Therefore, it is necessary to establish spacing reasonably based on the rock-breaking mechanism before manufacturing to optimize rock-breaking. Cho et al. [6] assessed the linear cutting performance of full-scale TBM disc cutters on granite under various conditions and identified an optimal cutter spacing range that enhanced the cutting performance of the disc cutters. Penetration refers to the depth to which the TBM disc cutter is pressed into the rock under the thrust of the cutter head, and the extent of penetration significantly influences the cutting effectiveness of a TBM disc cutter. Pan et al. [7] conducted full-scale linear cutting experiments on granite and sandstone under varying confining pressures. They observed that the specific energy (SE) exhibited a trend of initially decreasing and then increasing with an increase in penetration depth. There exists an optimal penetration depth that maximizes the cutting performance of the disc cutter. Gertsch et al. [8] investigated the impact of disc cutter spacing and penetration on the rock-breaking cutting performance of disc cutters through a series of rock-breaking experiments. They observed that SE is more responsive to variations in disc cutter spacing than penetration. The characteristics of the surrounding rock, the cutter spacing, and the penetration exert a substantial influence on the size and shape of the rock chips [9,10,11], particularly their impact on the rock-breaking efficiency of the TBM. Compared to the properties of the surrounding rock, cutter spacing and penetration are controllable. Therefore, in the TBM construction process, determining the optimal ratio of cutter spacing to penetration is of great significance for improving the rock-breaking efficiency of the TBM. Given the variation in cutter spacing at different positions and the fact that the maximum cutter spacing accounts for a large proportion of the cutter head, this study adopts the maximum cutter spacing as the TBM cutter spacing value. Numerous researchers have identified the optimal ratio of cutter spacing to penetration (S/P) through indoor linear cutting experiments [10]. These experiments entailed calculating SE using construction data measured at various S/P values, followed by the creation of a graphical representation illustrating the relationship between SE and the S/P ratio. The optimal ratio is determined by identifying the S/P value corresponding to the minimum SE on the graph. However, it is important to highlight that most indoor linear cutting experiments employ relatively small rock samples, which can restrict their ability to accurately represent real construction site conditions [12]. The studies mentioned above mainly rely on indoor experiments, with minimal discussion and research devoted to assessing the effectiveness of TBM excavation based on insights gained from on-site construction data.
The tunneling performance of a TBM and the lifespan of its disc cutter are mainly influenced by factors including the characteristics of the surrounding rock, the TBM’s design, the interaction between the cutter and the surrounding rock, and the engineering geological environment [13,14]. Additionally, the presence of water in the surrounding rock significantly affects TBM tunneling performance as it can cause changes in the dry and saturated conditions of the surrounding rock. This is due to variations in the mechanical properties of rock under dry and saturated conditions [15]. Currently, there is limited research on evaluating TBM rock-breaking efficiency and optimizing tunneling parameters under varying dry and saturated conditions in surrounding rock. For example, Mammen et al. [16] studied the impact of water on the cutting performance of enhanced linear tunneling machines. They observed that disc cutter consumption in saturated argillaceous quartz sandstone is approximately 20% less than in dry argillaceous quartz sandstone. Similarly, Bakar et al. [17] concluded that water saturation can reduce the thermal fatigue of cutters based on experiments involving cutting rocks with full-scale cutters. Mosleh et al. [18] observed that disc cutter consumption initially increases and then decreases as the water content in orthoquartz sandstone rises. Bakar et al. [19] conducted full-scale cutting experiments on dry and saturated test blocks of medium-strength sandstone using a linear rock-cutting machine. They found that the SE was relatively low during the process cutting of saturated sandstone, resulting in improved rock-breaking efficiency and speed. Zhu et al. [20] discovered that the minimum SE of saturated sandstone is about 17% greater than that of corresponding dry rocks. Although some scholars have examined the influence of water on the physical and mechanical properties of surrounding rock, there has been relatively limited research conducted on the effects of varying dry and saturated tunneling conditions on the rock-breaking efficiency and disc cutter consumption of TBMs. Therefore, it is crucial to investigate the impact mechanisms of various construction and environmental conditions on TBM operations. This will aid in selecting optimal tunneling parameters, ultimately reducing project timelines and minimizing construction costs.
Most of the aforementioned studies primarily ascertained the S/P value through indoor linear cutting experiments, which may not precisely reflect the actual situation of a construction site. However, there is a scarcity of research focused on optimizing TBM tunneling efficiency using construction site data, especially regarding the impact of varying dry and saturated conditions on TBM rock-breaking efficiency and disc cutter consumption. In recent years, artificial intelligence and machine learning have introduced new approaches for predicting TBM tunneling efficiency [21] and analyzing shield tunnel settlement [22]. However, a large amount of on-site data is required for training machine learning-based models. Consequently, a straightforward method based on statistics and a fitting analysis is employed in this study. Selecting the appropriate Smax/P ratio based on on-site construction data and considering various dry and saturated conditions in the surrounding rock is crucial. This decision guides TBM construction, enhances rock-breaking efficiency, and effectively reduces cutter consumption and construction costs.
Building on this foundation, this study derives CI, SE, and Smax/P ratio values from on-site sieving tests and construction logs, and the complex correlations among these variables are studied through data fitting. Additionally, this study investigates the impact of varying dry and saturated conditions on TBM tunneling efficiency by analyzing the data correlations between CI and the Smax/P ratio, as well as cutter consumption and the Smax/P ratio. The aim is to optimize TBM tunneling parameters at the construction site and provide valuable insights and practical guidance for engineering practices.

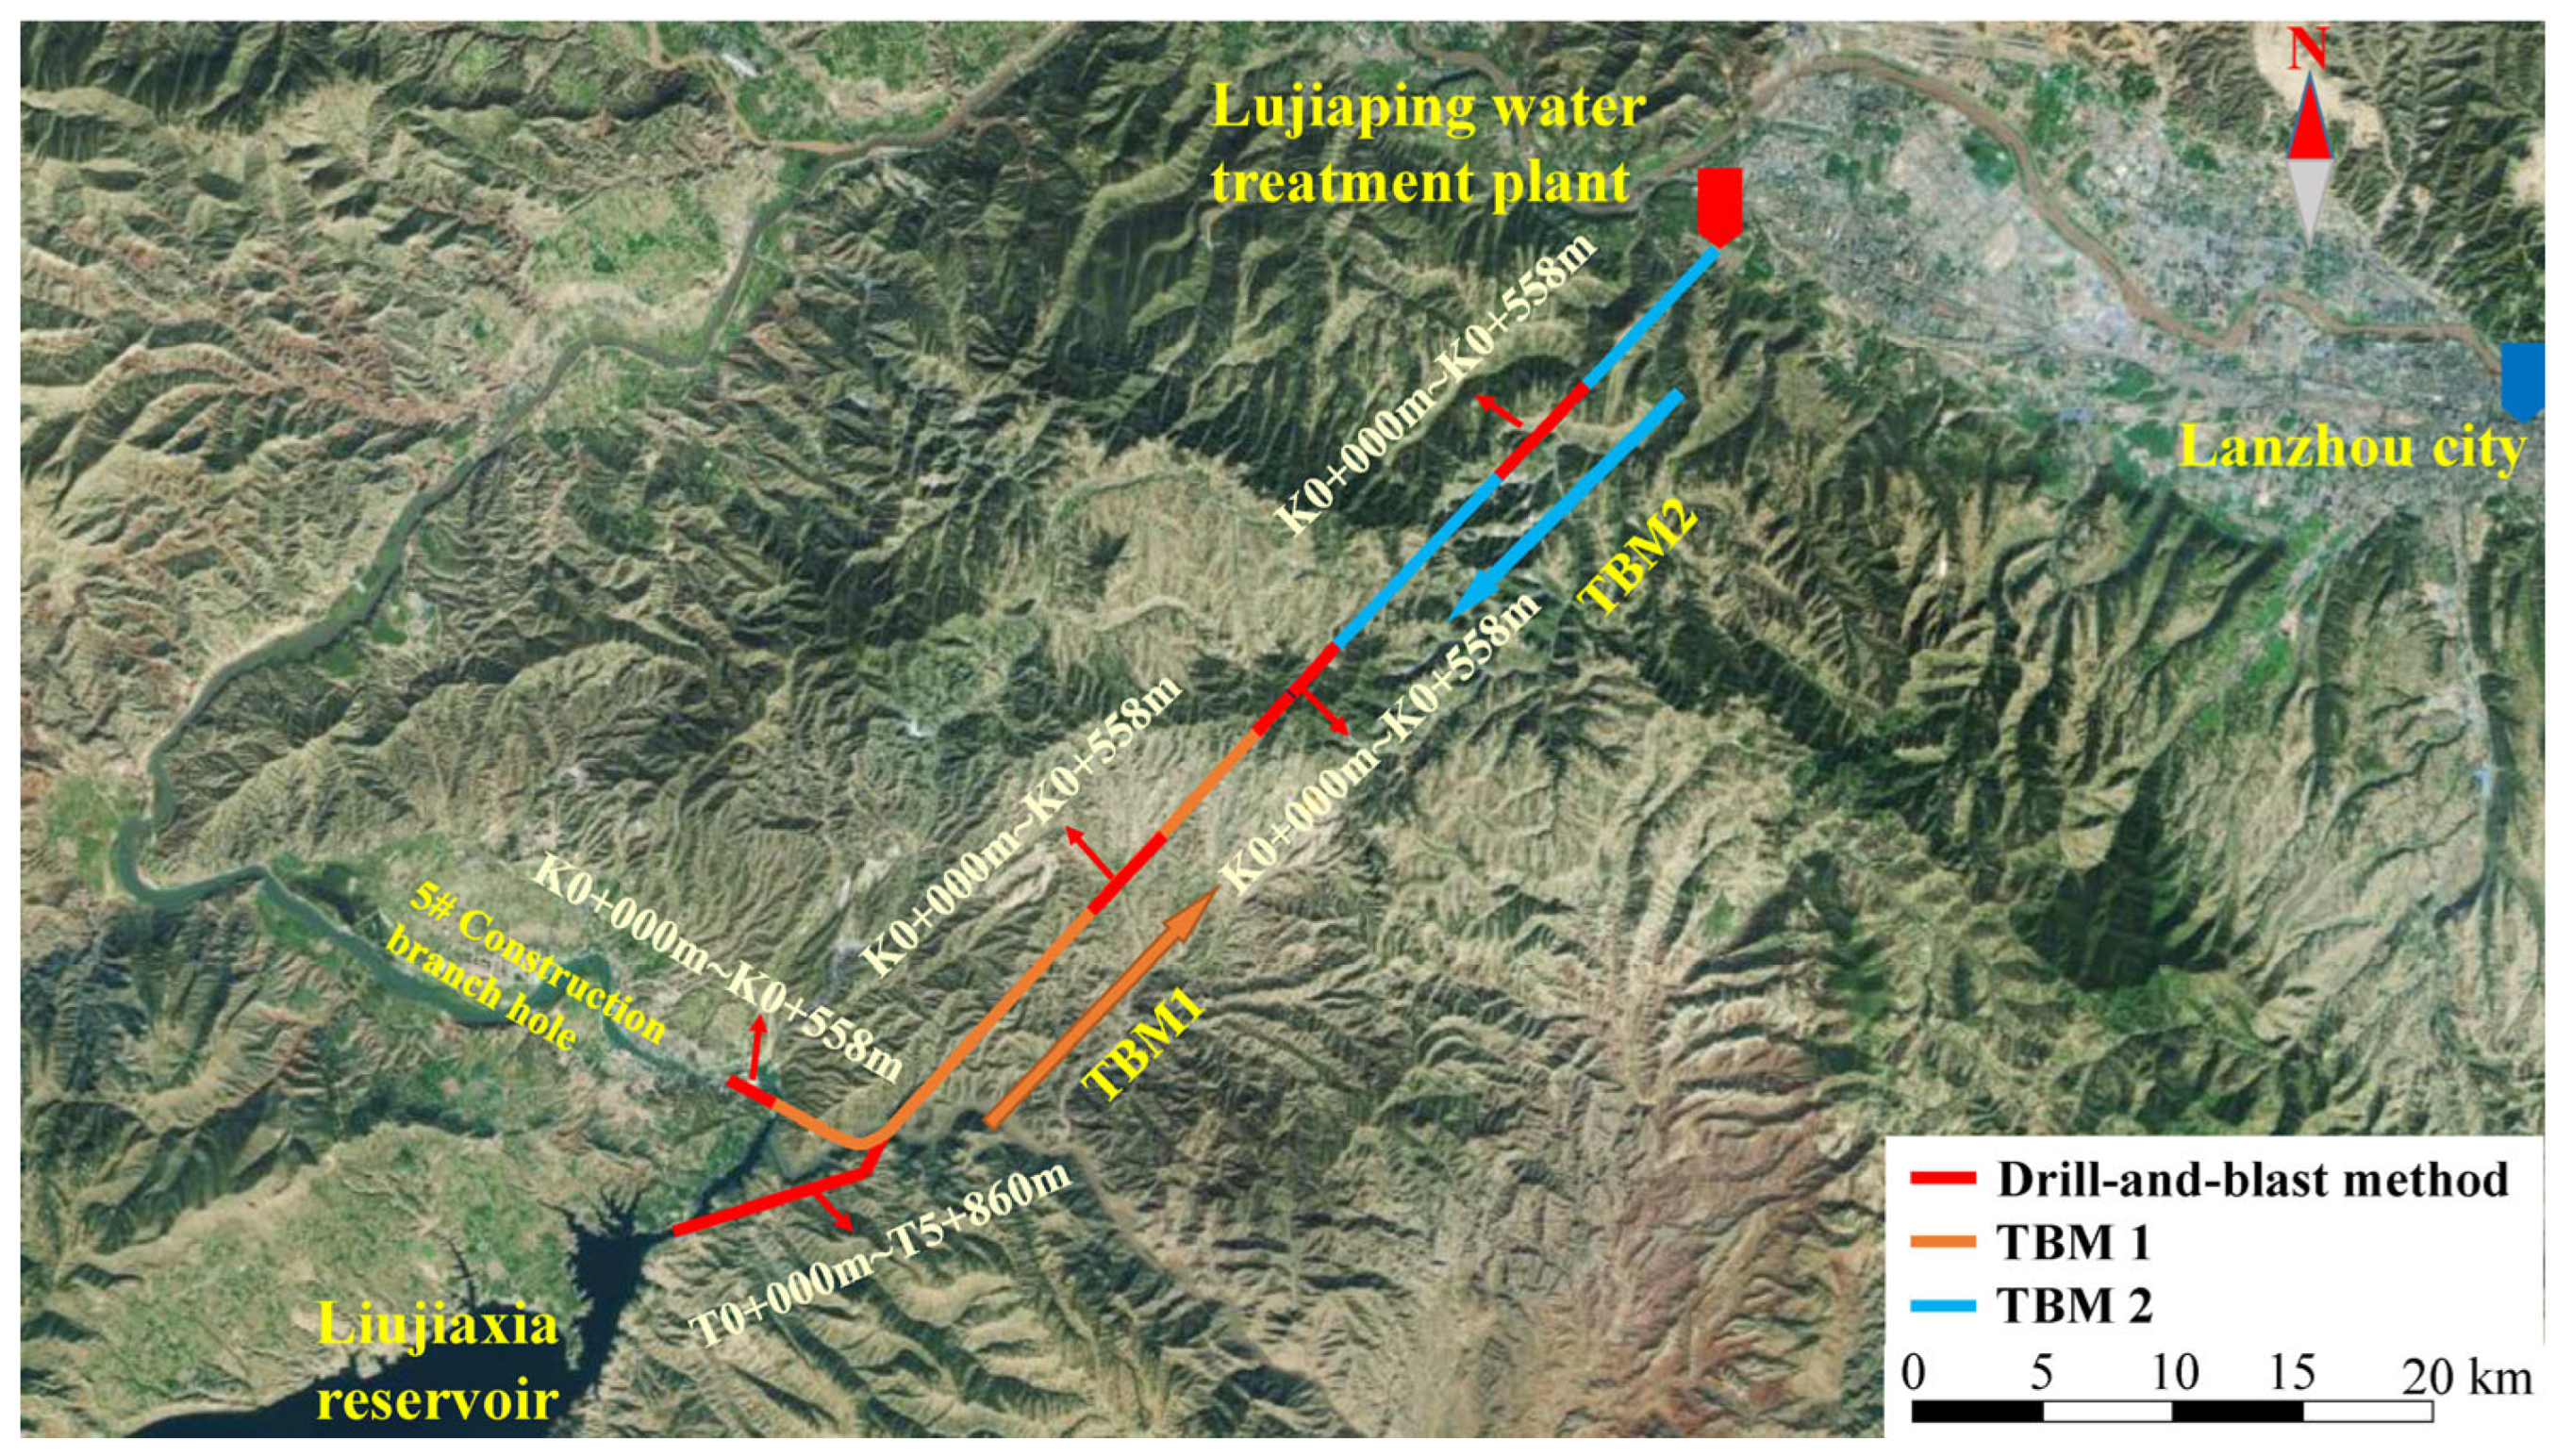
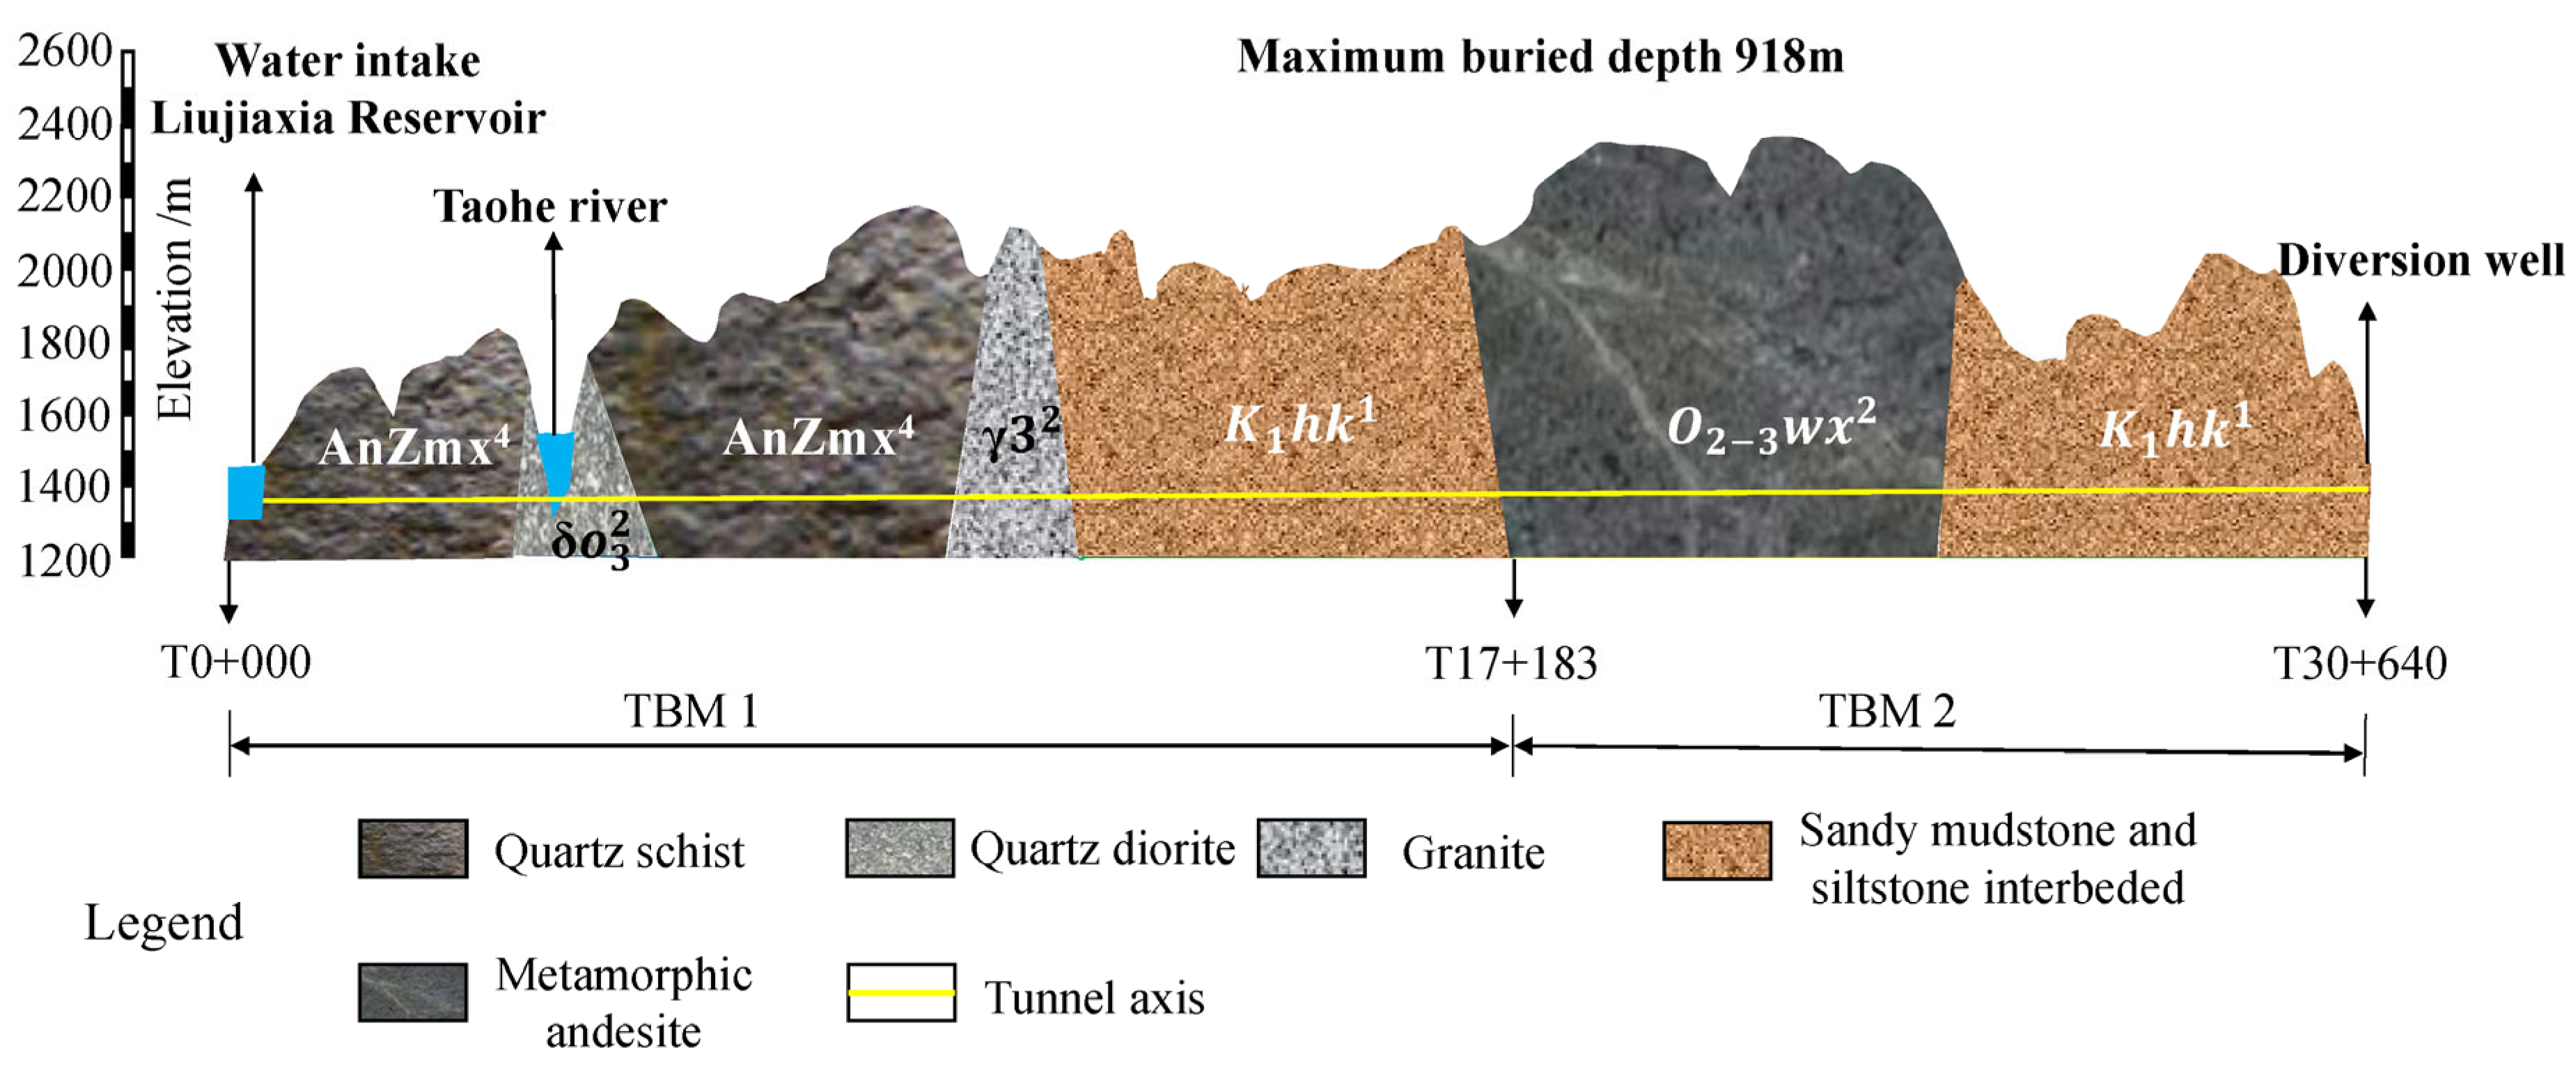
2. Project Background

The rock samples utilized in this study were collected from a water conveyance tunnel project that transports water from the Liujiaxia Reservoir to Lanzhou City in northwestern China (see Figure 1). This project encompasses water tunnels, branch lines, treatment facilities, and municipal pipelines. The primary water conveyance tunnel was constructed using two double-shield TBMs that initiated tunneling from opposite ends. TBM 1 initiated tunneling from the Liujiaxia Reservoir side, while TBM 2 began from the Lujiaping water treatment plant side. These tunnel sections were designated TBM 1 and TBM 2, with lengths of 12.227 km and 13.259 km, respectively. The longitudinal gradient of the main tunnel averages approximately 0.1%. Initially, the main tunnel was designed with a diameter of 5.46 m, but it was measured at 4.60 m after construction. The maximum burial depth of the main tunnel reaches 918 m.
The geological profile along the water conveyance tunnel is shown in Figure 2. The lithology of the strata encountered along the water conveyance tunnel includes the following: (1) Middle Caledonian quartz diorite (δο32); (2) blue-grey quartz schist of the pre-Sinian Mazhuanshan Group (AnZmx4); (3) middle Caledonian granite (γ32); (4) the Lower Cretaceous Hekou Group (K1hk1), characterized by brown-red interbedded with light gray-green sandstone and mudstone; and (5) green-gray metamorphic andesite of the Upper Middle Ordovician Wusu Mountain Group (O2–3wx2). The primary design parameters for TBM1 and TBM2 are provided in Table 1.

3. Rock Chip Sieving and Laboratory Tests

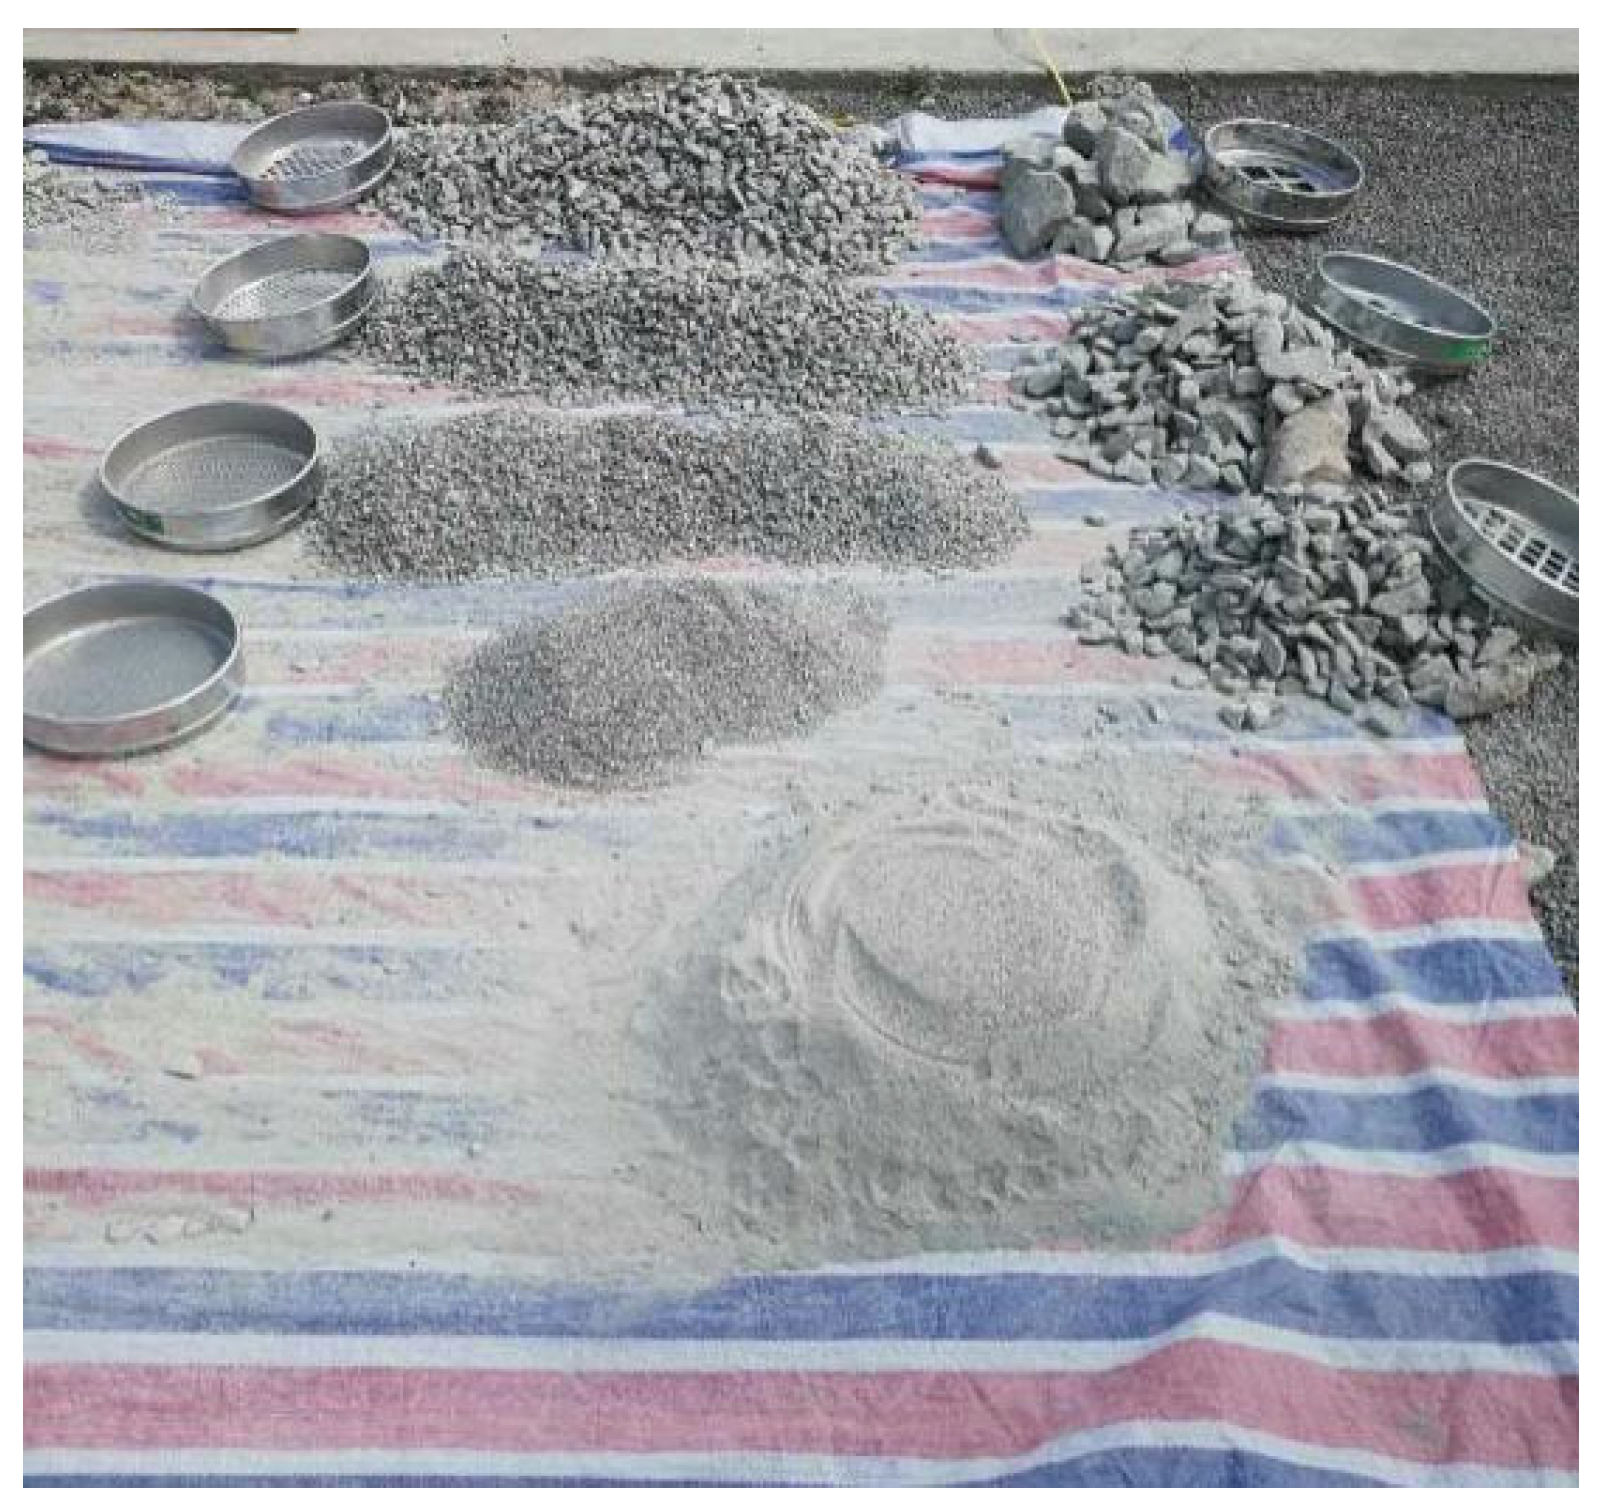
3.1. On-Site Rock Chip Sieving Test

Research has indicated that analyzing rock chip data generated during TBM tunneling is the primary method for evaluating a TBM’s rock-breaking efficiency [23,24]. Rock chip sieving tests serve as a primary means of acquiring these crucial rock chip data. According to relevant European regulations (BSEN933-1-2012) [25], the minimum required sample weight for each sieve group depends on the maximum particle size of the rock chip, with a minimum of 40 kg mandated for samples with a maximum particle size of 63 mm. Therefore, to ensure the representativeness of collected rock chip samples, it is advisable to aim for a minimum mass of at least 100 kg for each group of samples.
The rock chip sieving test utilized standard square-hole sieves with apertures of 40 mm, 31.5 mm, 25 mm, 16 mm, 10 mm, 5 mm, and 2.5 mm to randomly select mixed particle-size rock chip samples from the TBM belt conveyor outlet at the construction site (see Figure 3). Subsequently, the fundamental data acquired from the TBM rock chips were employed for the analysis and assessment of the TBM’s rock-breaking efficiency. Sampling should adhere to minimum sampling requirements such that each group of rock chips is manually or mechanically sieved, and the weights of rock chips with varying particle sizes, as obtained through sieving, are recorded. Dry rock chips can be directly sieved, while wet rock chips require natural drying before sieving.

3.2. Preparation of Rock Samples

Following testing requirements and engineering geological survey data, representative rock cores from five distinct lithologies were extracted from the core library in the Lanzhou Water Conveyance Tunnel Project. During the sampling process, elongated and intact cylindrical rock cores were obtained from various depths of the geological drilling column, corresponding to metamorphic andesite (A), sandstone (S), granite (H), quartz schist (Y), and quartz diorite (SY). For each lithology, 6–8 rock core samples, each with a length of no less than 30 cm, were collected. Subsequently, following laboratory testing standards, these rock core samples were processed through various methods to prepare them for the Cerchar abrasion test. The original rock core test sections, representing the five distinct lithologies, were made into standardized cylindrical samples with a diameter of 50 ± 1 mm and a height of 40 ± 1 mm, following three steps: drilling, cutting, and grinding. The upper and lower surfaces of these samples were maintained parallel. There were 8 samples for each group, totaling 40 samples, each classified and assigned a unique identification number.

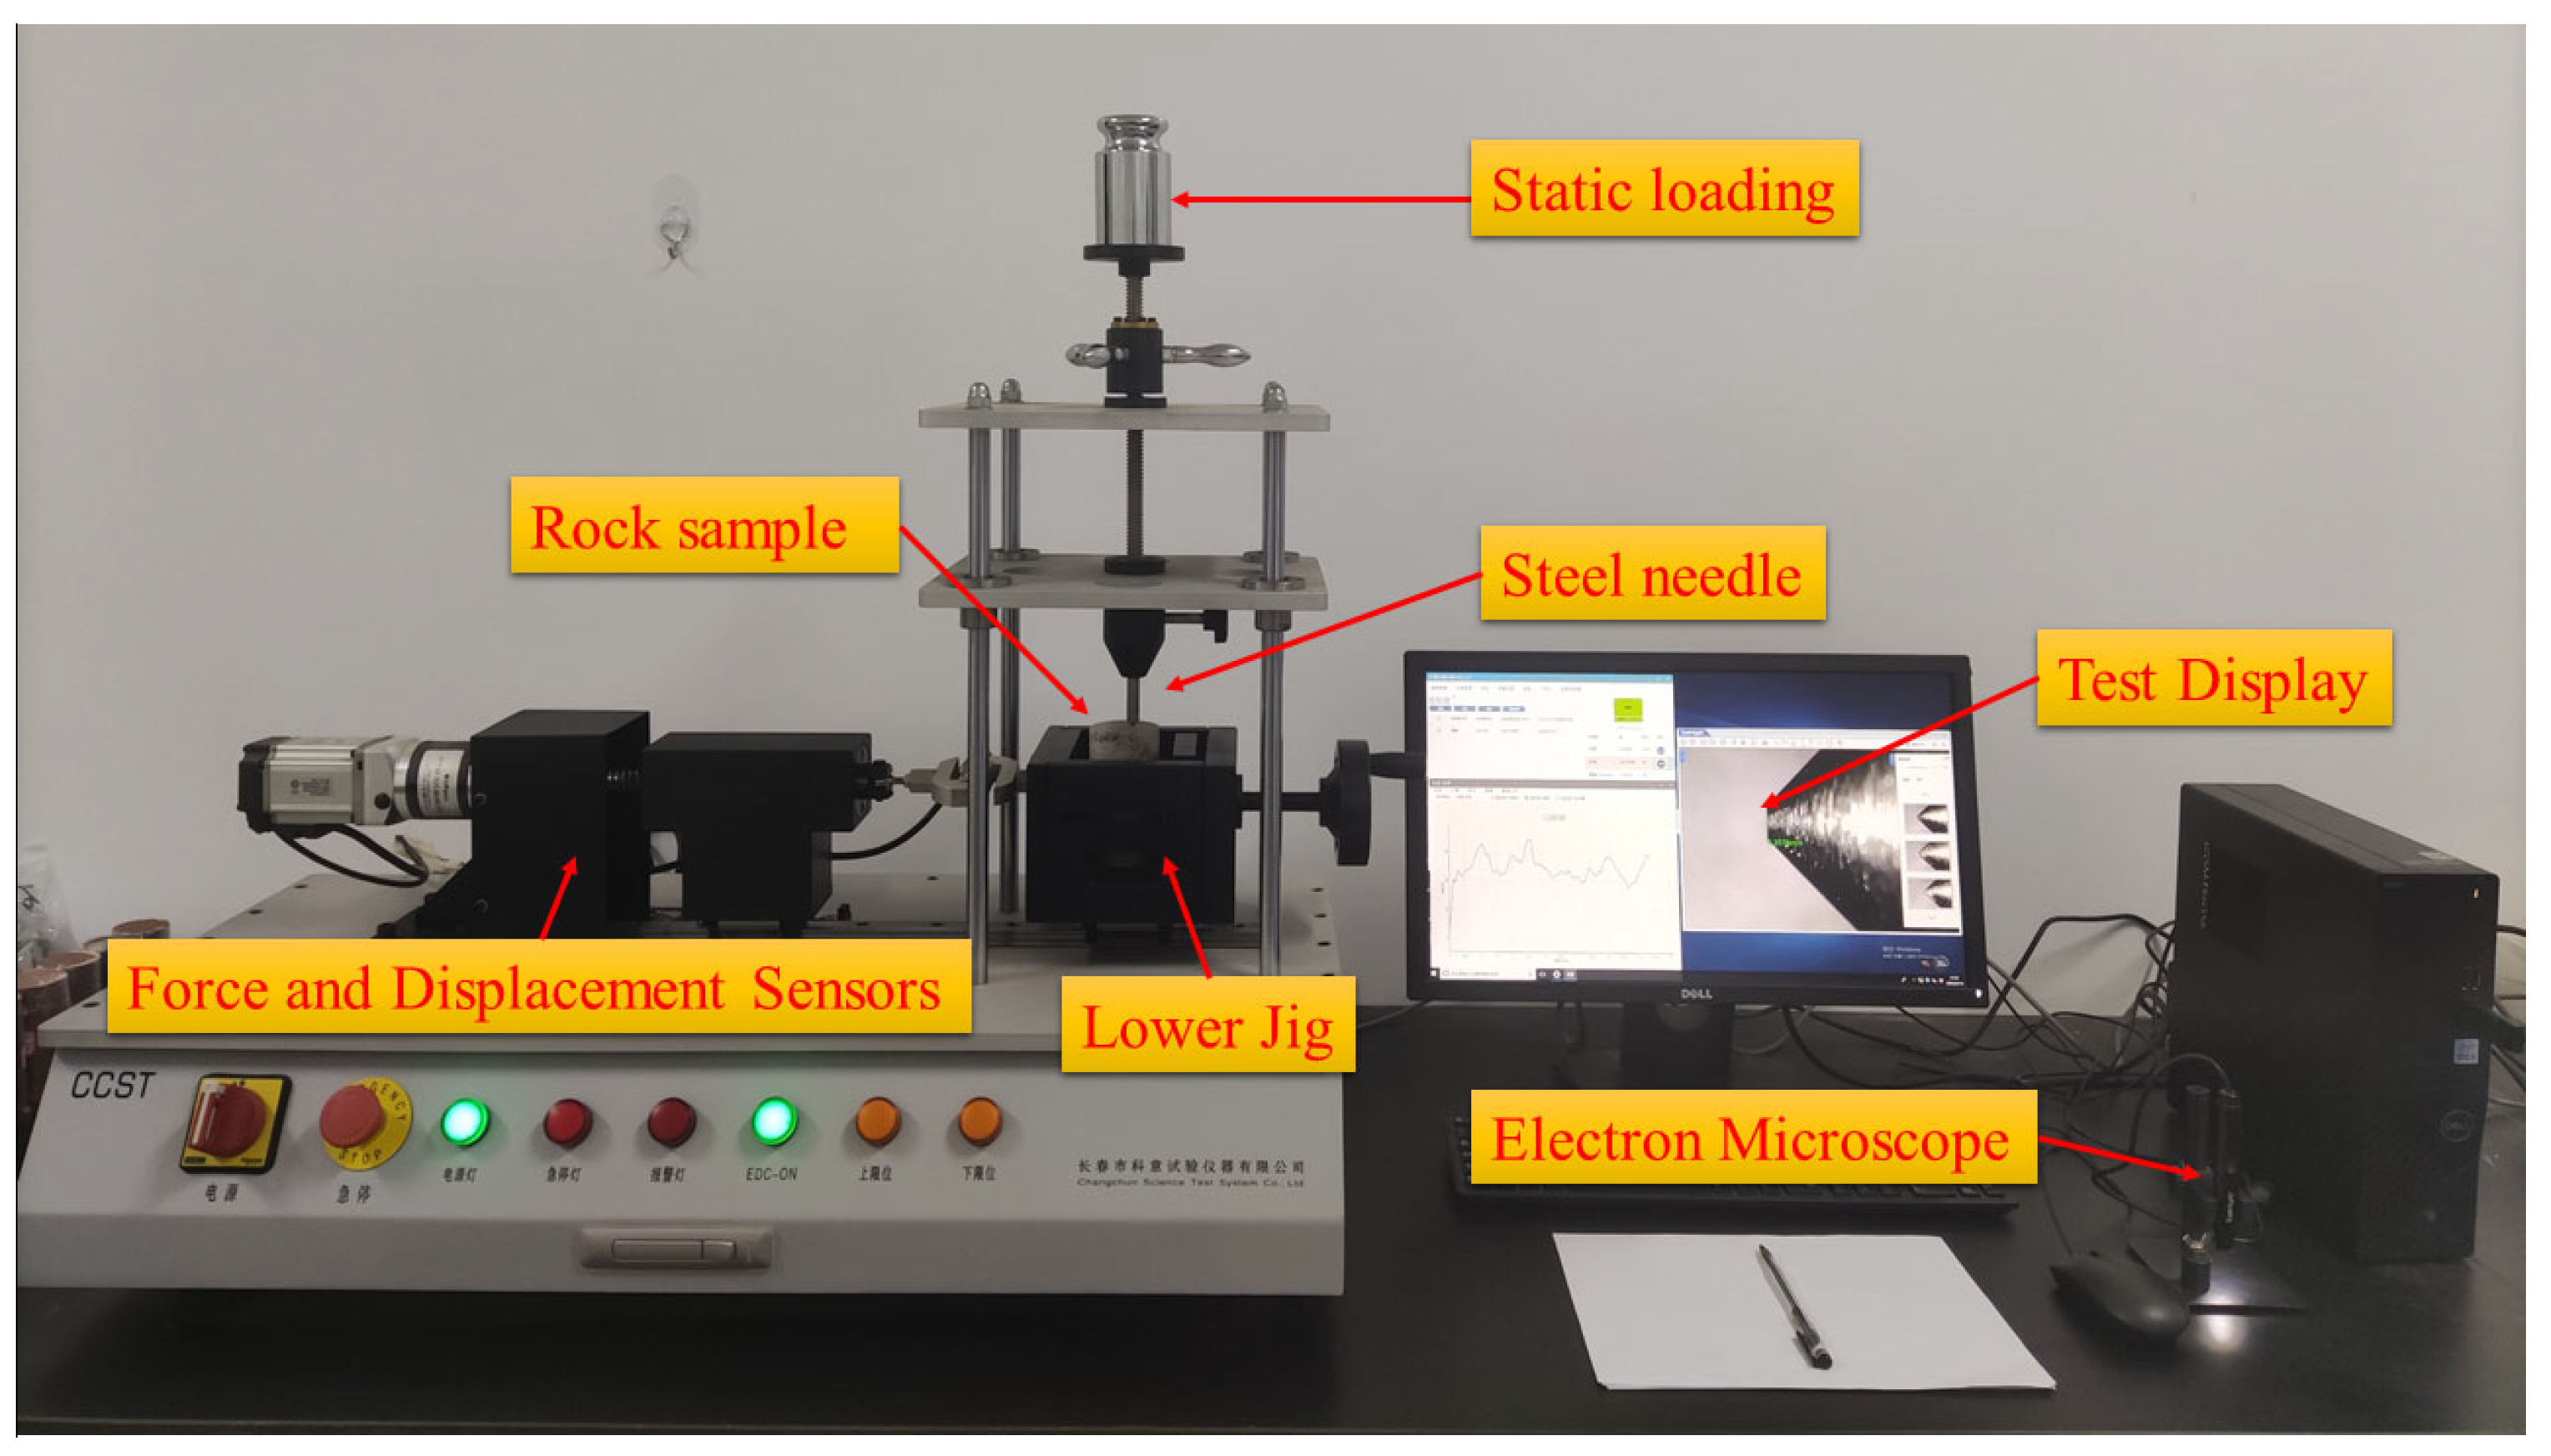
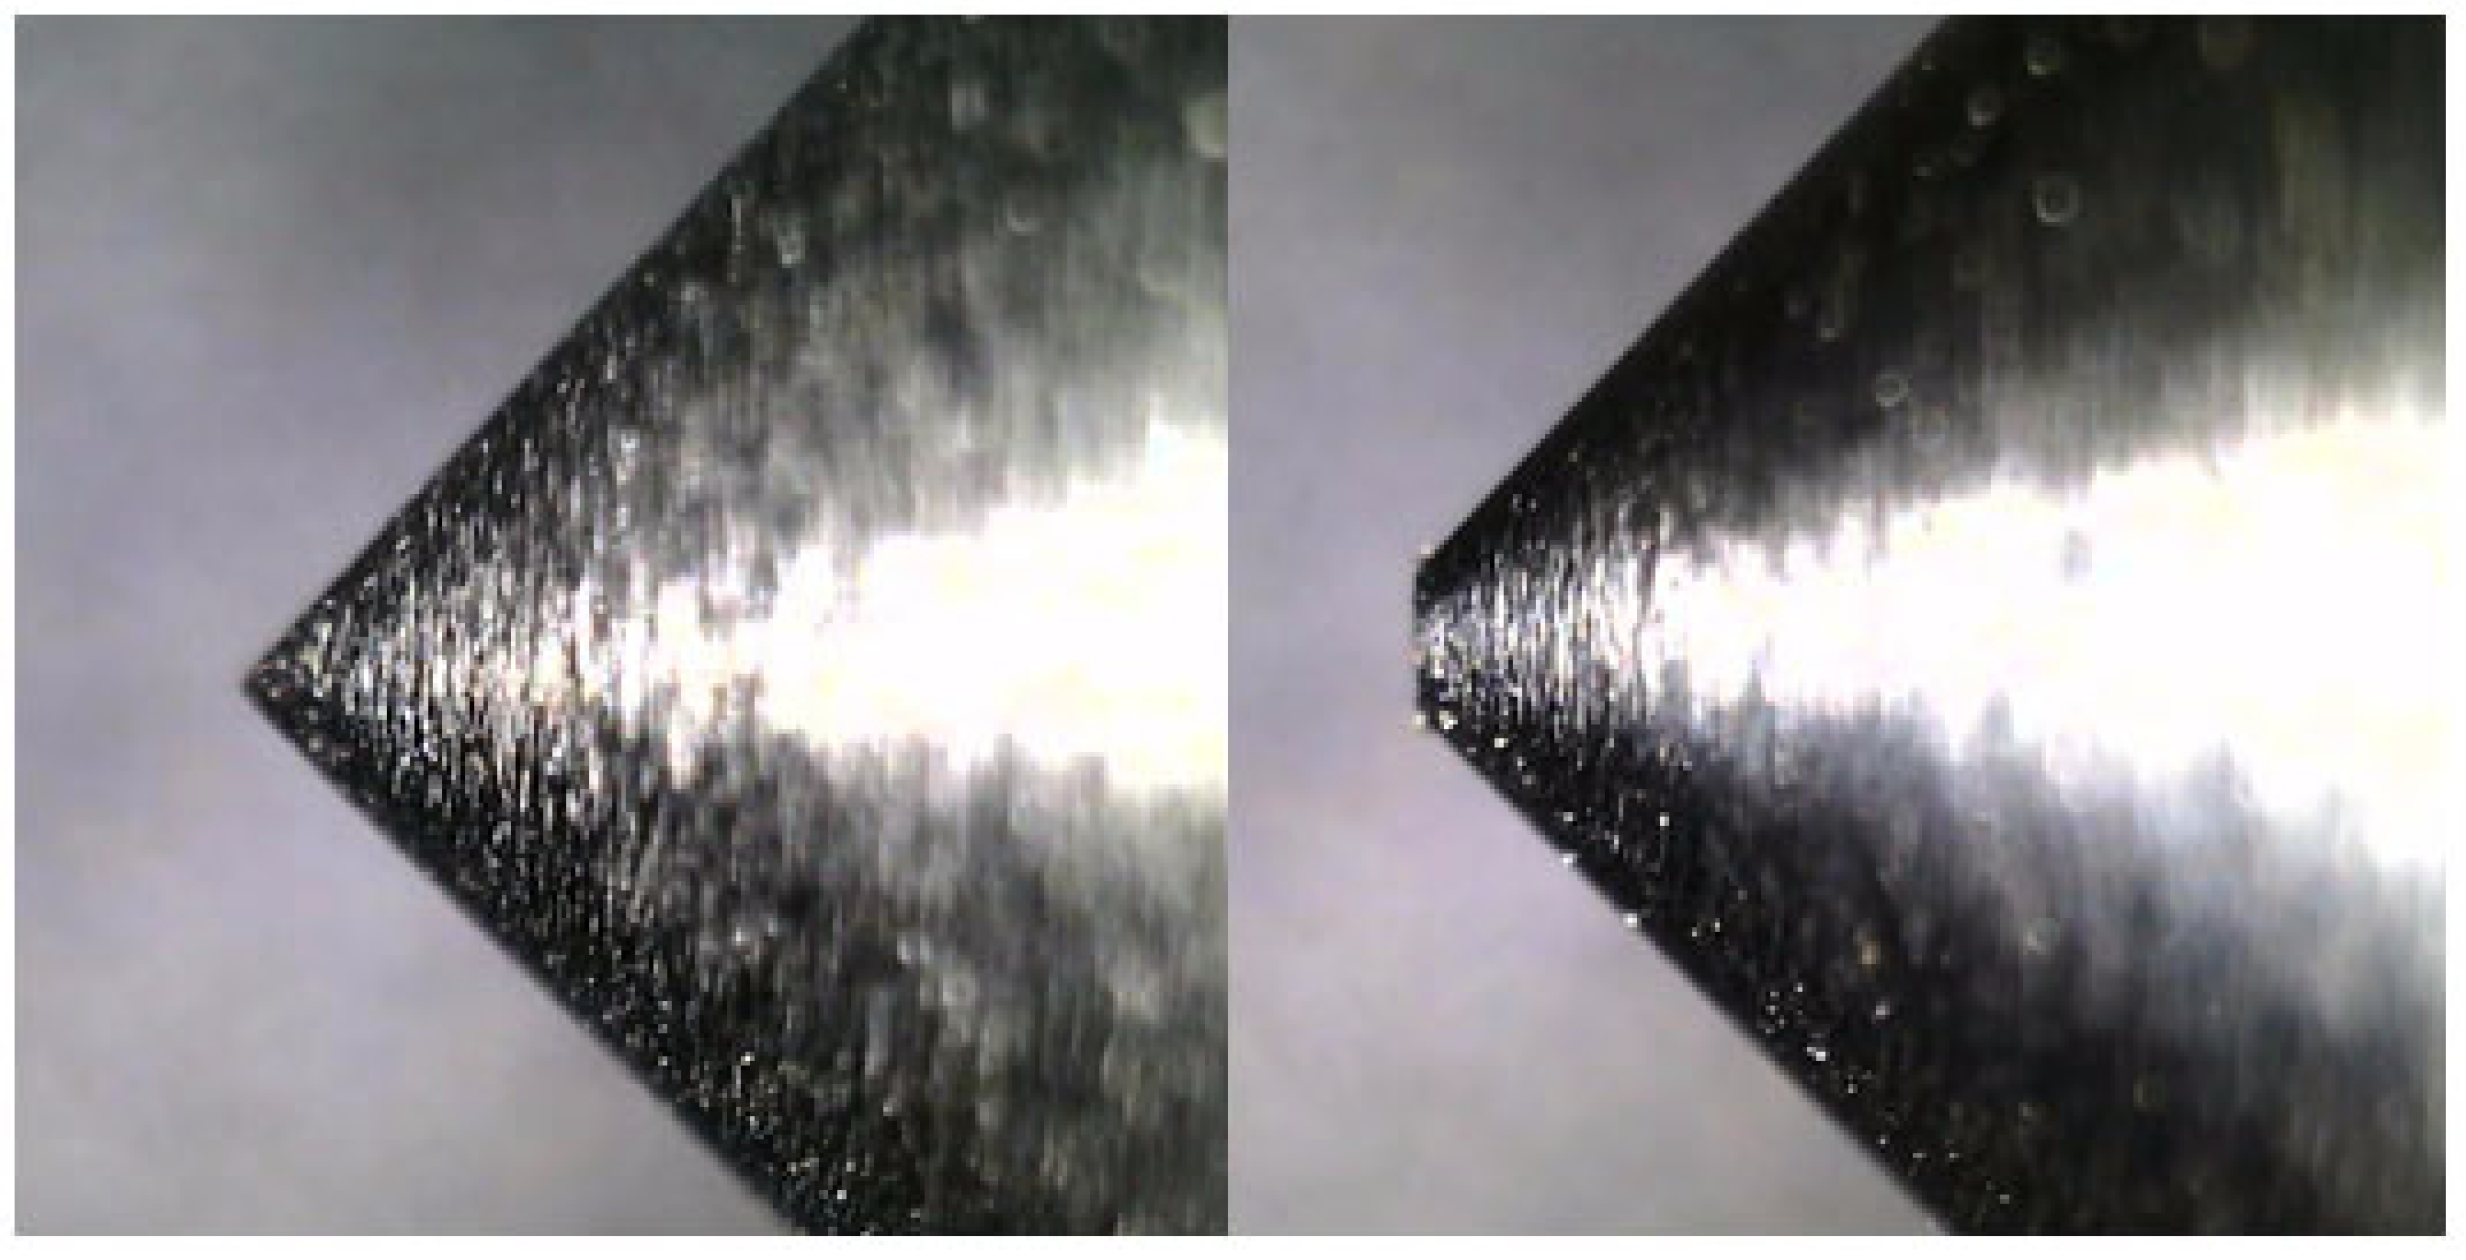
3.3. Cerchar Abrasivity Test

In this study, a rock abrasion servo tester (as depicted in Figure 4) was utilized to determine the Cerchar Abrasivity Index (CAI) values of 40 rock samples obtained from five distinct lithologies. The objective was to evaluate the wear resistance of the rocks. The instrument provides numerous advantages, including high levels of automation, compatibility with various test material shapes, user-friendly operation, and precise measurement capabilities.
To evaluate the impact of varying lithological rock CAI values on disc cutter consumption under both dry and saturated conditions, Cerchar abrasivity tests were conducted on rock samples exposed to these conditions (see Figure 5). The test procedure for this test followed the ASTM D7625-2010 [26] specification. A total of five groups of standard rock samples were prepared for the test, with each group containing eight samples. In each group, the first four rock samples (1–4) underwent Cerchar abrasion tests under dry conditions, whereas the subsequent four rock samples (5–8) underwent Cerchar abrasion tests under saturated conditions. The test results are presented in Table 2.

4. Correlations among CI, SE, and Tunneling Parameters

The arrangement of a TBM’s cutters plays a crucial role in determining its rock-breaking efficiency. Specifically, the ratio of maximum disc cutter spacing to penetration (Smax/P) significantly affects the characteristics of rock chip particle size and shape. Identifying the optimal value of the Smax/P ratio is essential for mitigating tunneling energy consumption, enhancing TBM rock-breaking efficiency, and reducing engineering costs. In engineering, the CI is widely embraced by researchers for its intuitive and convenient assessment of rock chip particle size distribution. Additionally, its simple calculation allows for an indirect evaluation of TBM rock-breaking efficiency. Therefore, employing the CI to determine the optimal Smax/P is not only straightforward and convenient but also offers more precise insight into on-site construction conditions. To provide a valuable reference for selecting tunneling parameters in similar projects, this section investigates the correlations among the CI, SE, and Smax/P ratio.

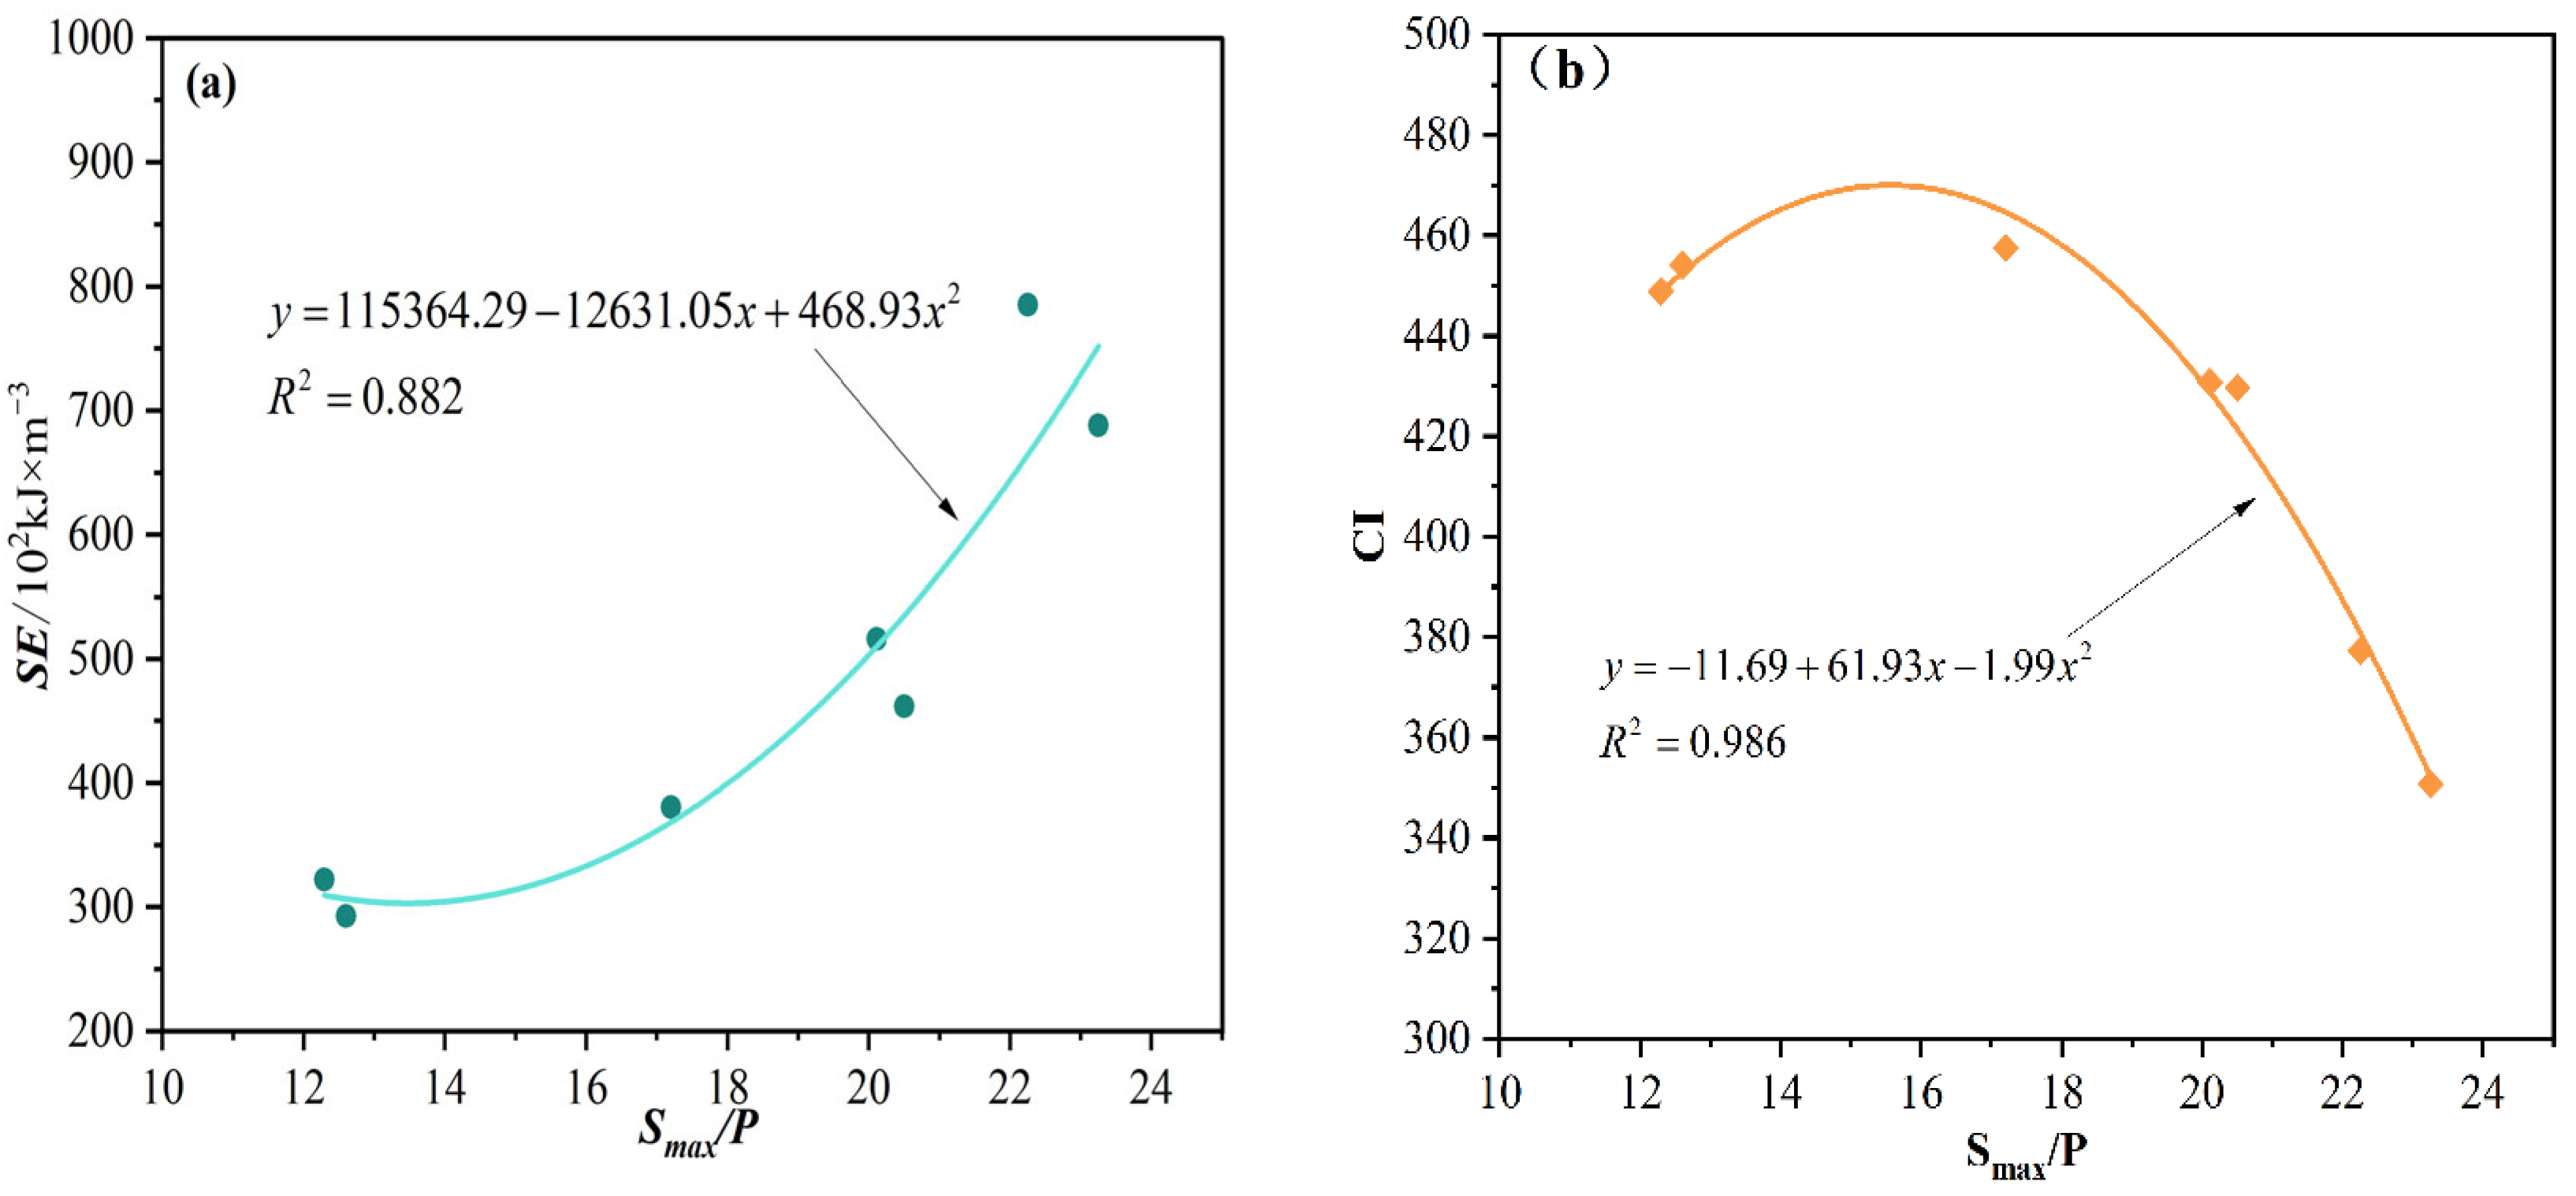
4.1. Specific Energy (SE)

SE is an indicator used to represent the amount of energy required to break a unit of rock mass. In recent years, with the widespread application of TBMs in tunnel construction, SE has become a common metric for evaluating the rock-breaking efficiency of TBMs in tunnel construction projects [27]. Usually, the smaller the SE, the less energy is required to cut a unit of rock mass, leading to a higher rock-breaking efficiency for the TBM and vice versa. The formula for calculating specific energy is as follows:
S E = F v l + M θ l π R 2
where SE is the specific energy (kJ/m3), Fv is the average tunneling thrust of the TBM (kN), l is the tunneling distance of the TBM for a certain period (m), M is the average torque of TBM tunneling (KN·m), ϴ is the rotation angle of the cutter (rad), and R is the radius of the excavated tunnel (m).
Through the extraction, analysis, and processing of data from construction logs related to various rock chips and tunneling parameters in the Lanzhou Water Conveyance Tunnel Project, SE was computed for each tunneling section, as shown in Table 3 and Table 4.

4.2. Coarseness Index (CI)

Roxborough et al. [28] proposed the concept of the CI, which can, to a certain extent, reflect both the fragmentation of rock chips [24] and the distribution of particle sizes within the rock chips [29]. Utilizing data from the rock chip sieving tests, the particle size distribution of the rock chips is analyzed to calculate the cumulative residual rate for each sieve. Subsequently, these cumulative residual rates are aggregated to calculate the CI. The specific calculation expression is as follows:
X i = W i W t × 100 %
C I = X i
where Wi is the total mass of rock chips larger than a certain particle size obtained from on-site sieving tests (kg); Wt is the total mass of TBM rock chips taken on-site (kg); Xi is the cumulative residue rate greater than a certain particle size; CI is coarseness index of rock chips.
A total of 14 on-site rock chip sieving tests were completed, involving five typical rock types. Rock hardness varies and is categorized into two types of surrounding rock: hard rock and relatively soft rock, both of which are well representative. After sieving, we obtained data from 14 groups of TBM rock chip sieving tests, and the results of the sieving tests are presented in Table 3 and Table 4. Through the analysis and processing of data obtained from on-site rock chip sieving tests, CI indicators can be derived for both soft rock and hard rock. Construction data were collected, and SE values for the two working conditions were calculated using Equation (1), as presented in Table 3 and Table 4.

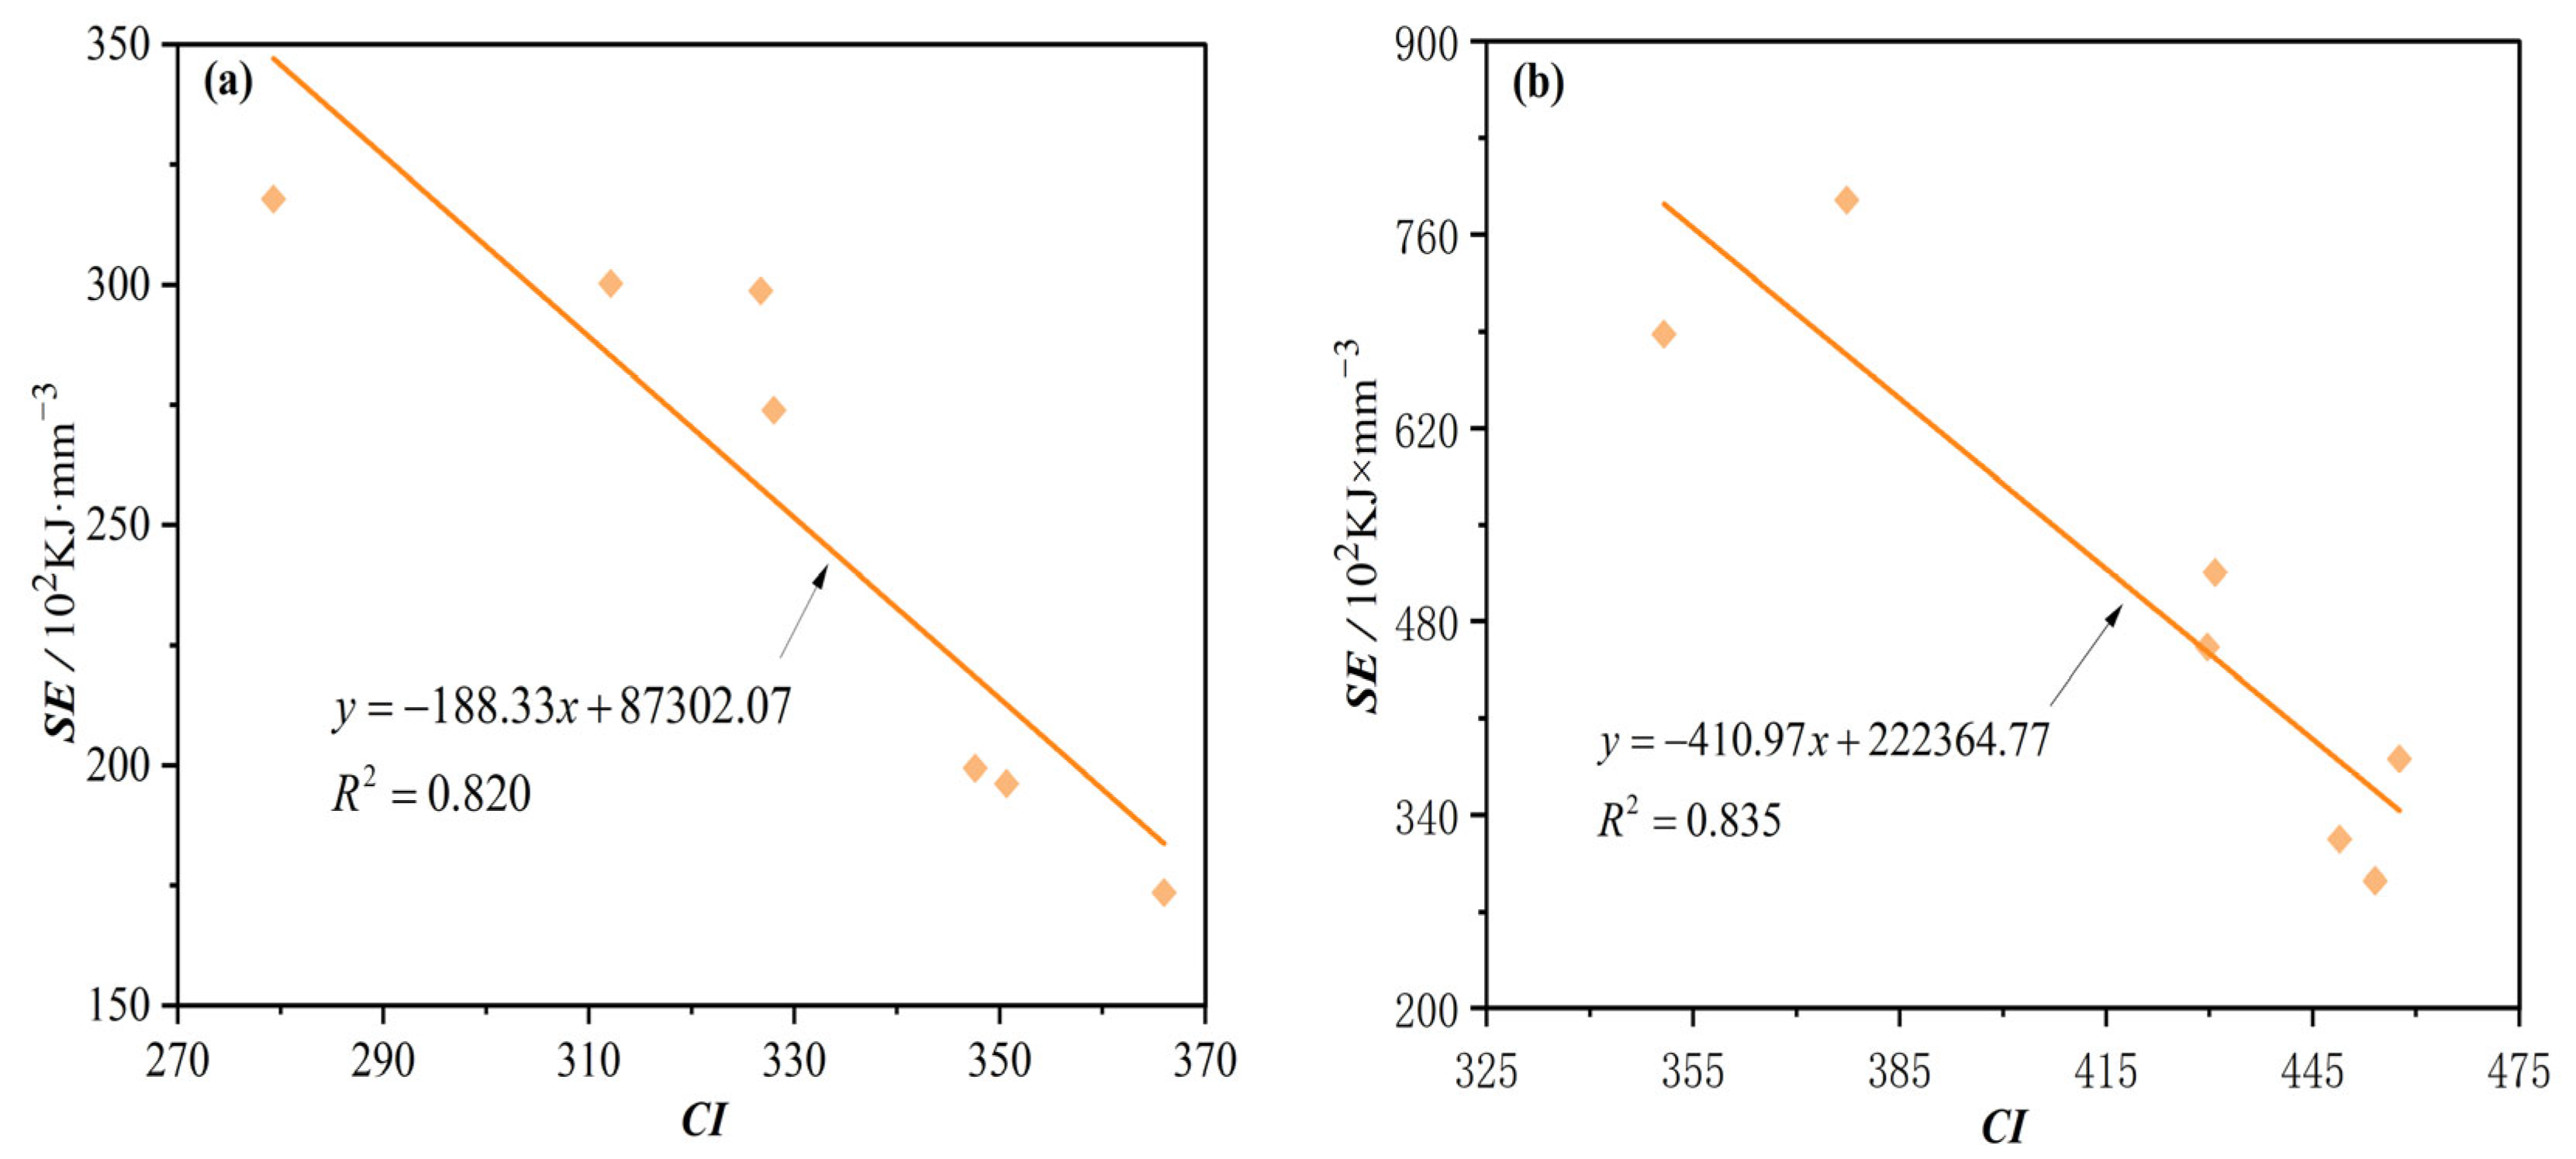
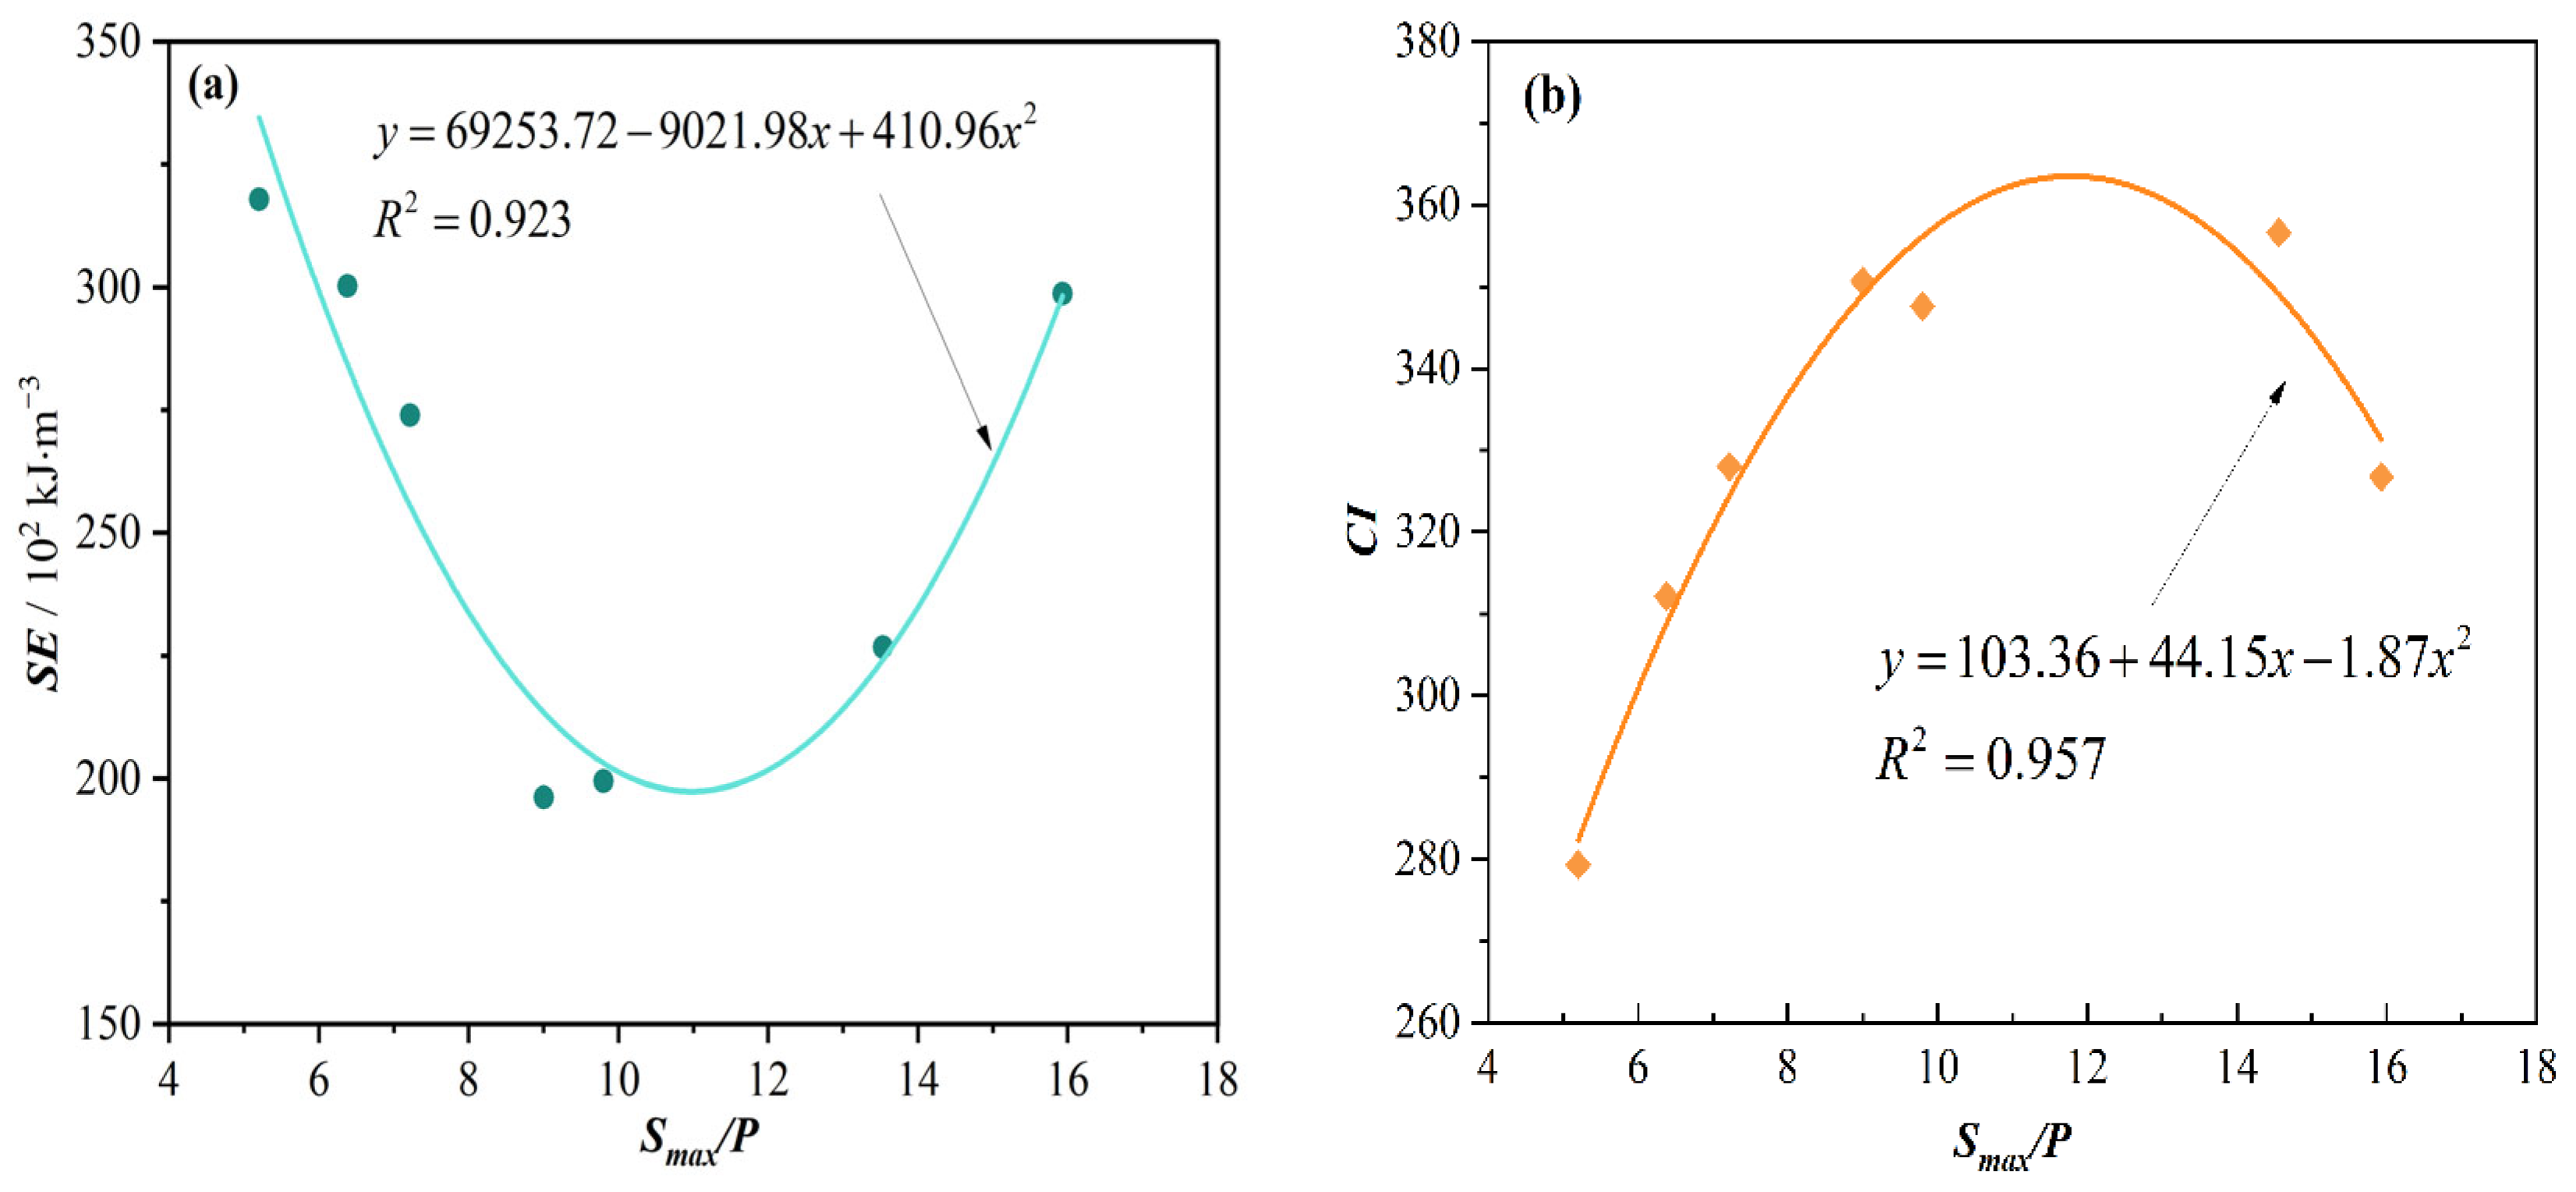
4.3. Correlation between CI and SE

The rock mass information at the construction site was divided into two working conditions: soft rock and hard rock. A correlation analysis of the CI and SE for these two working conditions is presented in Figure 6.
As shown in Figure 6, in both soft rock and hard rock conditions, SE decreases as the CI increases. The correlation between these two parameters is strong, with correlation coefficients of 0.820 and 0.835, respectively. This indicates that the CI maintains a robust linear correlation with SE, offering an accurate reflection of the TBM’s rock-breaking efficiency. From the perspective of the rock chip analysis, when the TBM exhibits high rock-breaking efficiency, the proportion of block and sheet rock chips is relatively high, whereas the content of powdered rock chips is comparatively low, resulting in a higher calculated CI. Conversely, when the TBM’s rock-breaking efficiency is low, there are lower contents of block and sheet rock chips, while the content of powdered rock chips is higher, resulting in a lower calculated CI. Thus, using the CI to reflect the rock-breaking efficiency of a TBM is reliable. Furthermore, the considerable variability in parameters like thrust, torque, and penetration at TBM construction sites often poses challenges in accurately determining the parameter values required for calculating SE. In some cases, it becomes extremely challenging to accurately calculate SE for a construction site. Obtaining corresponding CI indicators from the rock chips generated in real time during TBM tunneling can be achieved through a relatively straightforward method, offering precise feedback on on-site construction conditions. Therefore, the optimization of TBM tunneling parameters and the provision of feedback on rock-breaking efficiency based on the CI hold significant practical significance.

4.4. Correlation between Rock-Breaking Efficiency and Tunneling Parameters

Data from 14 on-site rock chip sieving tests and the calculated CI, SE, and Smax/P values from TBM construction logs (Table 3 and Table 4) were utilized to examine and analyze the correlation between Smax/P and SE, as well as between Smax/P and CI. The results are presented in Figure 7 and Figure 8.
From Figure 7 and Figure 8, it is evident that under all operating conditions, the SE initially decreases and subsequently increases with an increase in the Smax/P ratio. An optimal Smax/P value exists to minimize SE. Similarly, the CI initially increases and then decreases with the increase in the Smax/P ratio, and an optimal Smax/P value can be identified to maximize the CI. When the Smax/P ratio is small (indicating higher penetration), thrust and torque on the cutter head increase, strengthening the synergistic effect among the TBM’s cutters. This leads to excessive rock-breaking, as depicted in Figure 9a, in which predominantly block-shaped rock chips prevail. The energy provided by the TBM is greater than the energy required for rock-breaking, resulting in an increase in the ineffective rock-breaking energy and a relatively lower rock-breaking efficiency. As the Smax/P ratio increases, particularly within the optimal Smax/P range, the penetration becomes moderate, allowing cracks initiated by neighboring disc cutters to gradually extend to the penetration point, effectively breaking the rock. This is illustrated in Figure 9b, in which the predominant form of rock chips is in the shape of flakes. At this stage, energy consumption is minimized, resulting in effective rock-breaking. However, with a continued Smax/P increase, the penetration is relatively low, and the synergy between TBM cutters weakens. The cracks generated by disc cutters cannot link up to each other. The primary reason for this phenomenon is that under conditions of reduced driving force, the cutting force applied by the disc cutter fails to reach the critical load required for rock-breaking [30]. Consequently, a grinding effect occurs between the disc cutter and the rock, resulting in increased powdery rock chip content, smaller rock chip particle sizes, an elevated SE, and a reduced CI. Therefore, the rock-breaking efficiency of the TBM decreases [31], as illustrated in Figure 9c. During this period, penetration is minimal, resulting in limited rock-breaking and slower tunneling progress, which is not conducive to efficient tunneling.
Additionally, as shown in Figure 7 and Figure 8, both SE and the CI exhibit a strong quadratic correlation with Smax/P values under both operational conditions, with fitting coefficients exceeding 0.880. Specifically, Figure 7 indicates a quadratic fitting coefficient between SE and the Smax/P ratio of 0.923, with the optimal Smax/P range identified as 10–12 under soft rock conditions. Similarly, the quadratic fitting coefficient between the CI and Smax/P ratio is 0.957, with the optimal Smax/P range being 11–12. In Figure 8, the quadratic fitting coefficient between SE and the Smax/P ratio is 0.882, with an optimal Smax/P range of 13–14 under hard rock conditions. Similarly, the quadratic fitting coefficient between the CI and Smax/P ratio is 0.986, with the optimal Smax/P range determined to be 15–16. Under both working conditions, the CI exhibits superior quadratic fitting coefficients compared to the SE, with percentages of 4.2% and 10.6% higher, respectively. This suggests that the CI offers a more precise fit with respect to the Smax/P ratio. Moreover, the CI is more readily obtainable at the construction site and offers higher accuracy compared to SE indicators. Therefore, the CI possesses unparalleled advantages in the optimization of TBM tunneling parameters and in guiding on-site TBM construction.

5. Influence of Dry and Saturated Conditions on TBM Tunneling Efficiency and Optimization of Tunneling Parameters

In the majority of engineering projects employing TBM construction, the prevailing conditions for the surrounding rock typically fall into two categories: dry and saturated states. To explore the influence of the presence of water on the properties of different tunnel-surrounding rocks and TBM tunneling efficiency, the Cerchar Abrasivity Test was conducted using data from the Lanzhou Water Conveyance Tunnel Project. Tunneling data from TBM sections with varying lithologies were collected, organized, and subjected to a fitting analysis. This study explores differences in TBM rock-breaking efficiency and cutter consumption under different dry and saturated tunneling conditions. Furthermore, TBM tunneling parameters were optimized based on the principle of maximizing the CI and minimizing disc cutter consumption. By identifying the optimal tunneling parameters for various tunneling conditions, the objective of enhancing TBM rock-breaking efficiency and minimizing TBM disc cutter consumption was accomplished.

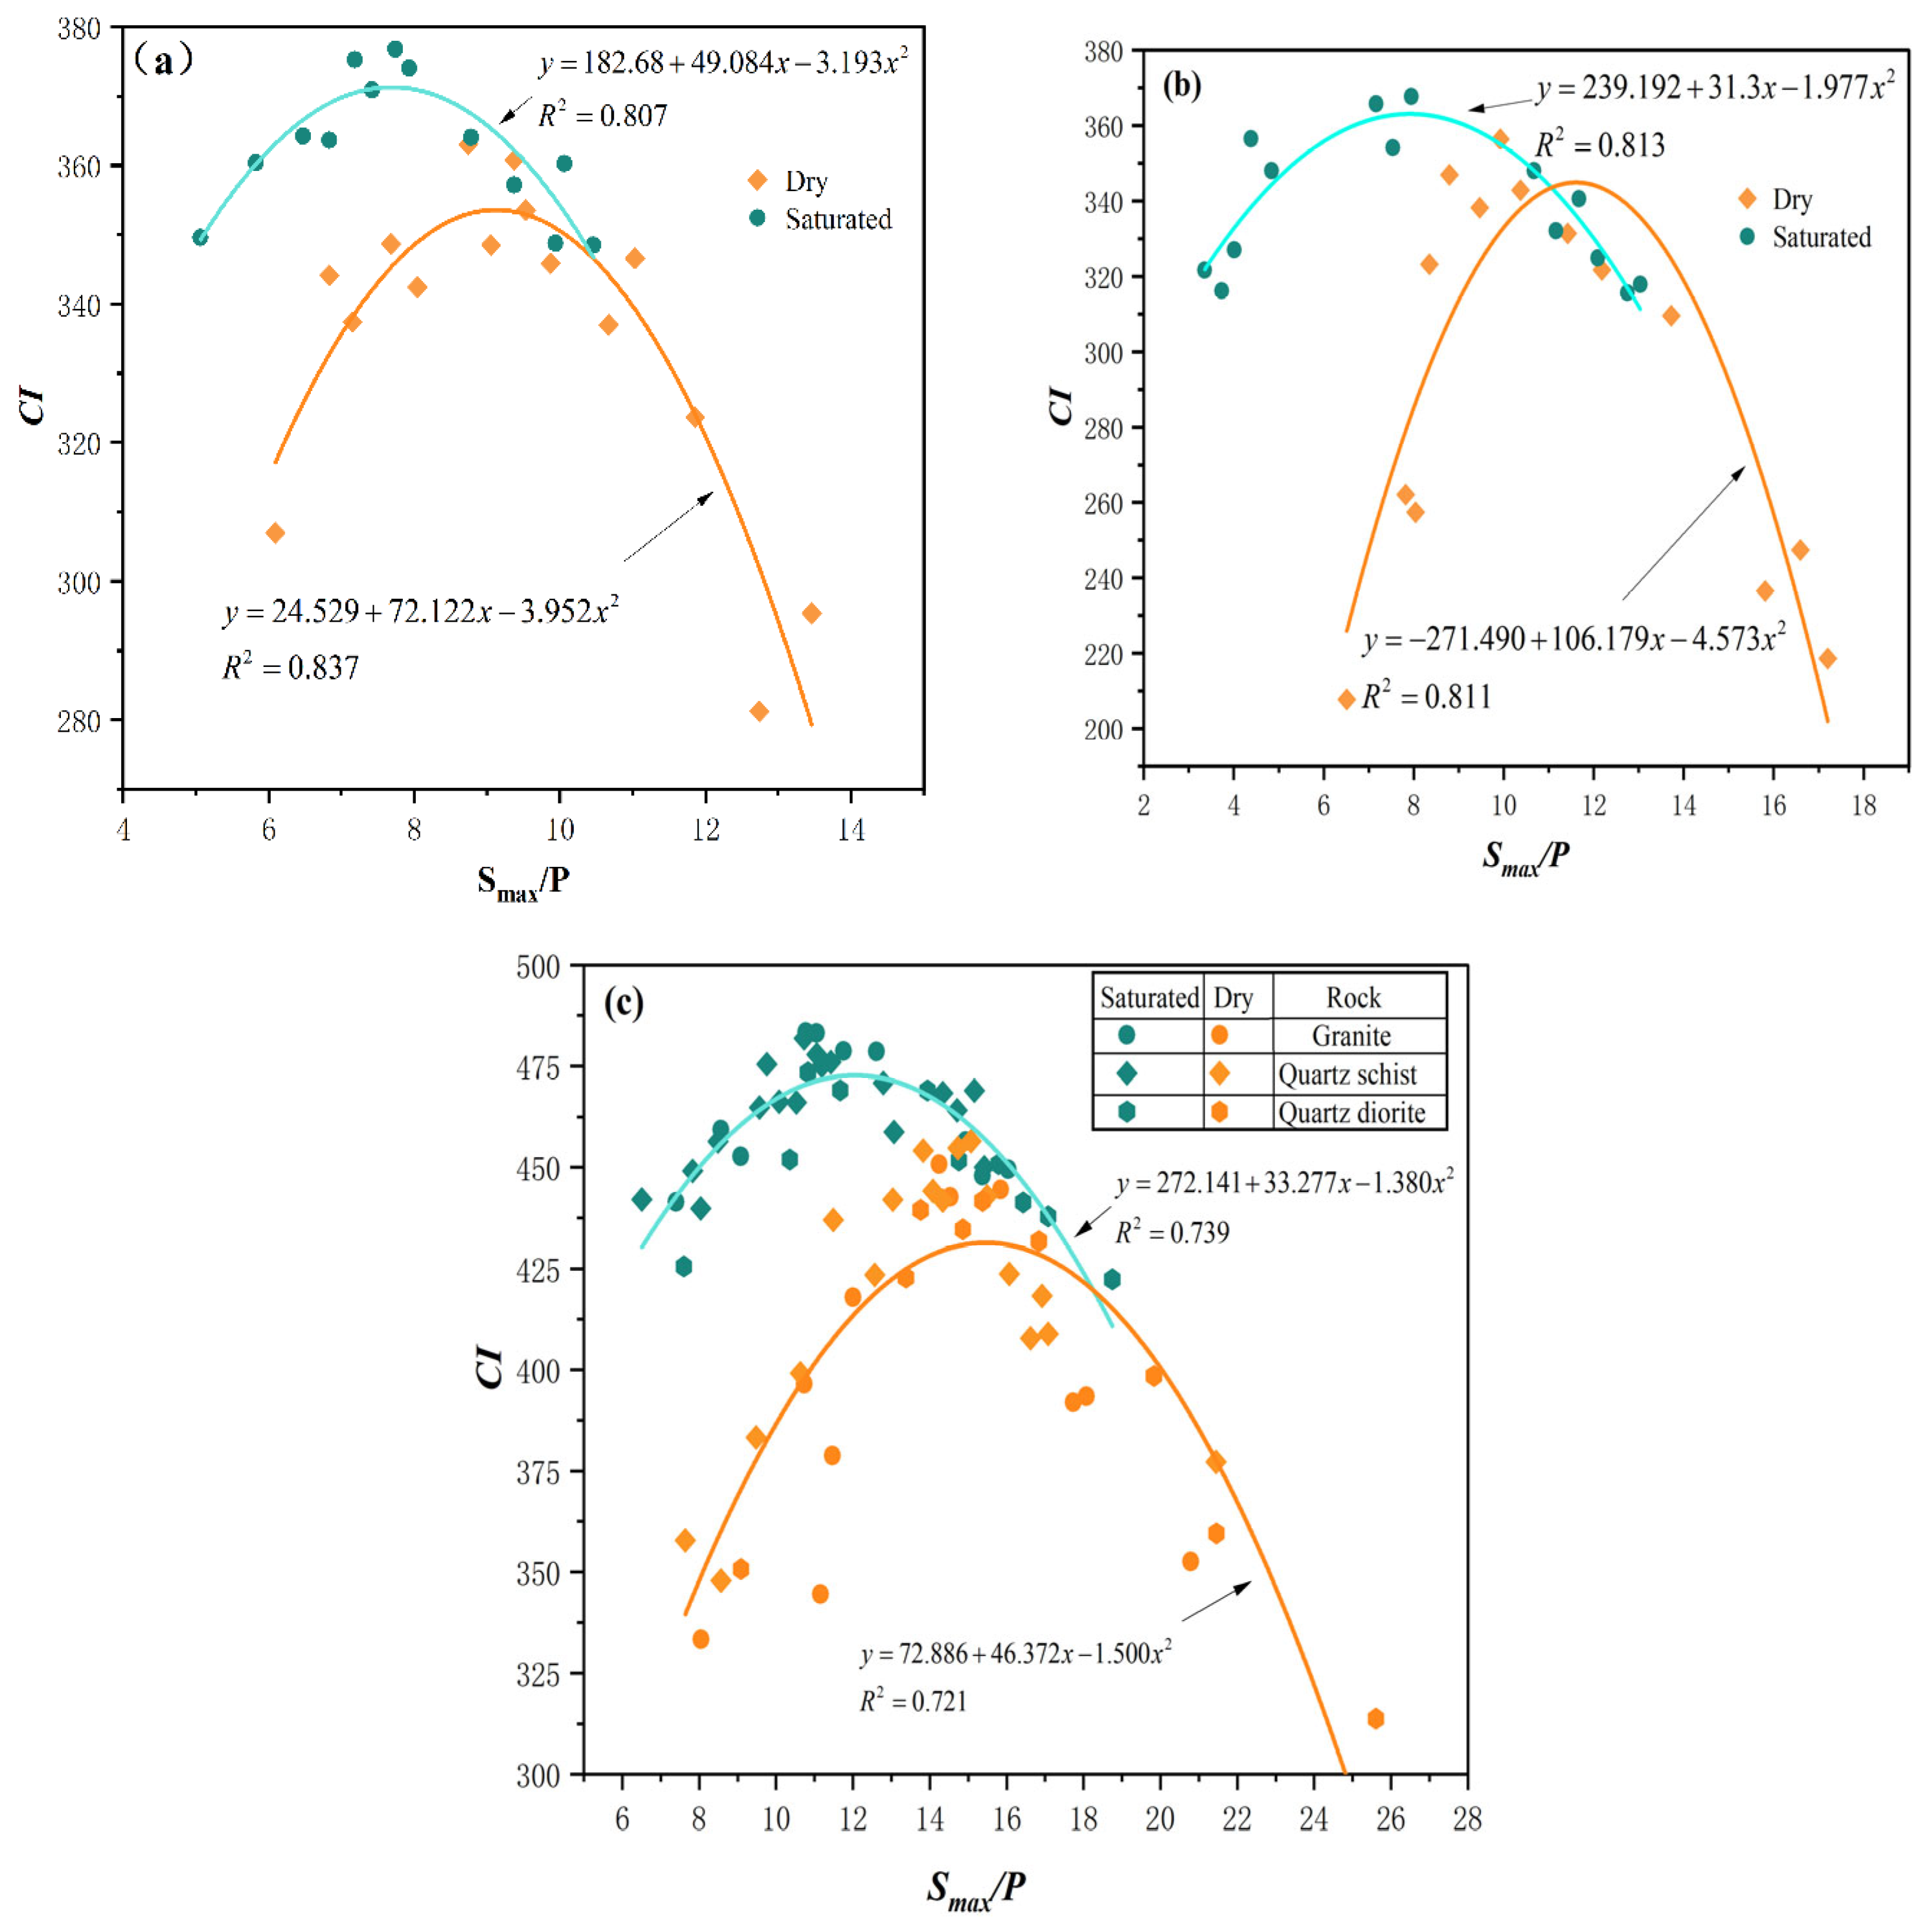
5.1. Optimization of Tunneling Parameters Based on CI

At the TBM construction site of the Lanzhou Water Conveyance Tunnel Project, tunneling sections involving relatively soft rock (sandstone), medium-hard rock (metamorphic andesite), and hard rock (granite, quartz schist, and quartz diorite) were selected for collecting, statistically analyzing, and processing TBM tunneling data. Corresponding rock chip samples were also collected for sieving tests. A robust quadratic relationship exists between the Smax/P ratio and the CI, with the CI serving as a superior indicator for assessing TBM rock-breaking efficiency and on-site construction conditions. Therefore, sieving tests were conducted on the aforementioned types of rock chips. Based on the sieving results, the CI was calculated using Equations (2) and (3). The correlation between the CI and Smax/P ratio under various tunneling conditions was subjected to a fitting analysis, and the corresponding results are presented in Figure 10.
As shown in Figure 10, the correlation between the CI and the Smax/P ratio aligns with the previously analyzed results. A comparative analysis of Figure 10a–c reveals that for dry surrounding rocks classified as medium-hard rock (metamorphic andesite), relatively soft rock (sandstone), and hard rock (granite, quartz schist, and quartz diorite), the optimal Smax/P ranges for a TBM are 10.972–12.246, 8.495–9.749, and 14.511–16.640, respectively. Similarly, for saturated surrounding rocks classified as medium-hard rock (metamorphic andesite), relatively soft rock (sandstone), and hard rock (granite, quartz schist, and quartz diorite), the optimal Smax/P intervals for TBM are 7.187~8.641, 7.055~8.319, and 10.945~13.163, respectively. As observed in Figure 10, the curve representing saturated surrounding rock appears positioned higher and to the left compared to the curve representing dry surrounding rock. This is because of the lower strength of saturated surrounding rock. On one hand, the overall P tends to be higher due to saturation, while Smax remains unchanged. Consequently, the ratio Smax/P becomes smaller, leading to the curve of saturated surrounding rock being located to the left of that of dry surrounding rock. On the other hand, the lower strength of saturated surrounding rock contributes to a more effective rock-breaking efficiency, resulting in the relationship curve being positioned above that of dry surrounding rock. When the surrounding rocks consist of medium-hard rock (metamorphic andesite), relatively soft rock (sandstone), and hard rock (granite, quartz schist, and quartz diorite), the maximum CI of the TBM in the saturated state of the surrounding rock is, respectively, 5.27%, 5.01%, and 9.59% higher than that in the dry condition. This difference is attributed to the influence of water, which significantly weakens particle-to-particle bonding, reduces their binding force, and enhances the propensity for outward particle expansion [32]. The presence of water within the pores of the rock diminishes the strength and deformation characteristics of the rock, facilitating rock-breaking. Additionally, water exerts softening, dissolution, and water-wedge effects on rocks. When water molecules infiltrate the interstices among rock particles, they reduce the cohesion among these particles, leading to a decline in rock strength and a softening effect which is manifested by reductions in both strength and deformation parameters. Water, acting as a solvent, can dissolve certain mineral components within rock, leading to uneven stress or the partial dissolution of cementitious substances within the rock, thus playing a pivotal role in rock dissolution. Simultaneously, a reduction in pore volume during rock compression can induce an elevated pore water pressure, resulting in the generation of additional stress near the crack. This can trigger crack propagation and ultimately diminish the rock’s yield and peak limit [33].

5.2. Optimization of Tunneling Parameters Based on Cutter Consumption

The data on TBM disc cutter consumption under five different rock tunneling conditions in the Lanzhou Water Conveyance Tunnel Project were collected and statistically analyzed, as presented in Table 5 and Figure 11. Figure 11 illustrates the varying impact of CAI values on TBM disc cutter consumption in rocks under different dry and saturated conditions. Regardless of whether the rock is dry or saturated, the consumption of TBM cutters increases exponentially with an increase in rock CAI. However, when the CAI is the same, the quantity of cutter consumption during TBM tunneling in saturated surrounding rock is observed to be lower than that in dry surrounding rock. Variations in TBM cutter consumption can be observed between dry and saturated conditions when tunneling surrounding rocks of differing CAI values. When the surrounding rock is sandstone with a lower CAI, the TBM cutter consumption of rocks in dry and saturated conditions is relatively low, and the difference is not significant. This is attributed to the fact that when the rock CAI is low, its hardness is relatively lower compared to the TBM disc cutter, and the influence of water within the rock’s internal pores on softening the rock and its subsequent impact on TBM disc cutter consumption can be largely disregarded. However, in the case of metamorphic andesite, which is characterized by high wear resistance, TBM cutter consumption in saturated surrounding rock is reduced by 53.12% compared to dry surrounding rock. In scenarios involving granite, quartz schist, and quartz diorite, which possess the highest wear resistance, TBM cutter consumption decreases by approximately 41.93% to 57.06% under saturated conditions relative to dry conditions. The consumption of TBM cutters under dry conditions of highly wear-resistant surrounding rock increases higher than that in the saturated condition as the CAI of the rock increases. This is attributed to the presence of water, which softens the rock, diminishes its strength, provides lubrication, and cools the rock. Additionally, it weakens the friction between the disc cutter and the rock surface, thereby reducing thermal fatigue wear induced by TBM disc cutter rock-breaking [34]. Water molecules infiltrate the internal pores of rocks, thereby diminishing the cohesion between mineral particles within the rock. Furthermore, as a solvent, water dissolves soluble mineral components, which further disrupts the internal structural cohesion of the rock, leading to a non-uniform stress distribution in terms of magnitude and direction within the rock. This is evidenced by a decrease in both the strength and deformation parameters of the rock [33]. Therefore, in the presence of rock with high wear resistance, the water within the rock’s internal pores significantly influences the consumption of TBM cutters. Hence, gaining insight into the cutter consumption patterns of TBMs under varying lithologies and in both dry and saturated conditions can facilitate informed decisions for TBM disc cutter selection and design. It allows for the proposal of optimization measures tailored to geological conditions. Additionally, it enables the anticipation of disc cutter consumption during the construction process, leading to the prediction of cutter longevity and the optimization of cutter management strategies. This holds significant implications for enhancing TBM tunneling efficiency.
The dry and saturated conditions, as well as the strength and wear resistance of the surrounding rock, significantly influence the consumption of TBM disc cutters. In practical engineering, the cost of cutters constitutes a significant portion of TBM construction projects, and the consumption of TBM disc cutters is notably influenced by tunneling parameters. There should be a connection between the Smax/P ratio and cutter consumption. Hence, it is imperative to investigate and analyze the correlation between TBM cutter consumption and the Smax/P ratio. By collecting, statistically analyzing, processing, and analyzing cutter consumption data during TBM construction, the corresponding tunneling data were selected to establish a correlation curve between TBM cutter consumption and the Smax/P ratio under varying dry and saturated conditions, as shown in Figure 11. As shown in Figure 11, regardless of whether the surrounding rock is classified as hard or soft rock and under both dry and saturated conditions, TBM cutter consumption initially decreases and subsequently increases with a rise in the Smax/P ratio. The optimal Smax/P ratio minimizes TBM cutter consumption by increasing the contact area between the disc cutter and the rock, thereby enhancing the synergistic effect among the TBM’s disc cutters. The rock between the disc cutters exerts a counterforce on them, leading to friction between the disc cutter and the rock. When the Smax/P ratio is small, penetration is greater (with the cutter spacing remaining constant during tunneling), leading to increased friction between the cutter and the rock, thus resulting in greater TBM cutter wear. Within the optimal range of the Smax/P ratio, moderate penetration allows for the gradual extension of cracks generated by neighbor cutter heads, effectively facilitating rock-breaking. At this time, TBM tunneling efficiency is elevated, accompanied by a relatively modest consumption of TBM cutters. As the Smax/P ratio continues to rise, penetration decreases, leading to a diminished synergistic effect among TBM cutters. However, the total duration of contact friction between the cutters and the rock increases, leading to a relatively higher wear rate of TBM cutters. Therefore, the consumption of TBM cutters is higher, leading to decreased TBM tunneling efficiency during this period.
Comparing and analyzing Figure 12, optimal Smax/P ranges for TBMs are found to vary under different dry and saturated conditions with surrounding rock types. In the case of dry surrounding rocks, including medium-hard rock (metamorphic andesite), relatively soft rock (sandstone), and hard rock (granite, quartz schist, and quartz diorite), the optimal Smax/P ranges are 10.414~12.169, 7.976~9.457, and 17.465~19.369, respectively. Meanwhile, for saturated surrounding rocks of the same types, the optimal Smax/P ranges are 8.606~11.656, 6.502~8.769, and 14.514~16.193. The optimal Smax/P ratio for saturated surrounding rock is smaller than in dry conditions. The presence of water in the surrounding rock diminishes rock wear resistance and weakens the thermal fatigue wear of the disc cutter. Under identical penetration conditions, the wear resistance of saturated surrounding rock decreases, resulting in a relative reduction in TBM cutter consumption. Therefore, accurate predictions for cutter consumption under various dry and saturated conditions during tunneling can be made. Simultaneously, determining the optimal tunneling parameters under specific conditions also aids in reducing cutter consumption.

5.3. Optimal Tunneling Parameters Considering CI and Cutter Consumption

In TBM construction projects, the balance between rock-breaking efficiency and cutter consumption is frequently inadequate, potentially leading to project delays and increased costs. The construction period and cost are paramount concerns for enterprises involved in engineering projects. Therefore, it is imperative to comprehensively assess the rock-breaking efficiency and cutter consumption of a TBM, aiming to identify the optimal tunneling parameter range for maximizing its tunneling efficiency.
By comprehensively examining the correlations between the CI and the Smax/P ratio, as well as cutter consumption and the Smax/P ratio under varying dry and saturated conditions of the surrounding rock, this study analyzes TBM tunneling efficiency to optimize TBM tunneling parameters. Based on Figure 10 and Figure 12, it is evident that for relatively soft surrounding rock, considering the CI and cutter consumption, the optimal Smax/P ranges for a TBM in dry and saturated conditions are 8.495~9.457 and 7.055~8.319, respectively. For medium-hard surrounding rock, considering the CI and cutter consumption, the optimal Smax/P ranges for TBMs in dry and saturated conditions are 10.972~12.169, and 8.606~8.931, respectively. At this time, TBMs exhibit enhanced rock-breaking efficiency with reduced cutter consumption. Considering the wide ranges of rock types analyzed in this study and the numerous factors influencing the properties of surrounding rocks, the optimal Smax/P range, based on the CI and cutter consumption, does not overlap for either dry or saturated conditions for hard rock. Recommended ranges were selected based on a data analysis and construction experience. The optimal Smax/P ranges for dry and saturated conditions are as follows: 16.5~17.5 and 13.50~14.00. The recommended optimal Smax/P ratio range is shown in Table 6. Figure 10 and Figure 12 illustrate that within the optimal Smax/P range for TBM, rock-breaking efficiency is higher, while cutter consumption is minimized. Moreover, when the Smax/P value falls within the optimal range, the rock-breaking efficiency and cutter consumption of a TBM in saturated rock conditions are more favorable for project advancement compared to dry conditions. The presence of water facilitates rock-breaking, reduces its wear resistance, and enhances the thermal fatigue wear of disc cutters. This study assessed the influence of varying dry and saturated conditions in the surrounding rock on TBM tunneling efficiency by employing data fitting while considering the CI and cutter consumption. The proposed optimal tunneling parameter range, considering both the CI and cutter consumption, can serve as a valuable reference for projects in similar geological conditions seeking to maximize TBM tunneling performance. This research holds significant implications for the optimization of TBM tunneling parameters, ultimately resulting in reduced project durations and construction costs.

6. Conclusions

A TBM parameter optimization method based on the CI and cutter consumption was proposed in this study based on the construction project of the water conveyance tunnel in the Lanzhou Water Conveyance Tunnel Project. This method effectively improves the rock-breaking efficiency of a TBM and reduces its cutting tool consumption. It employed a statistical analysis and data fitting to realize optimization. These findings provide valuable insights for the selection of tunneling parameters in similar engineering projects. The main research conclusions are as follows:
  • Both SE and the CI exhibit strong quadratic relationships with the Smax/P ratio. The fitting coefficients for the CI under both soft and hard rock conditions are 4.2% and 10.4% higher than those of the SE, respectively.
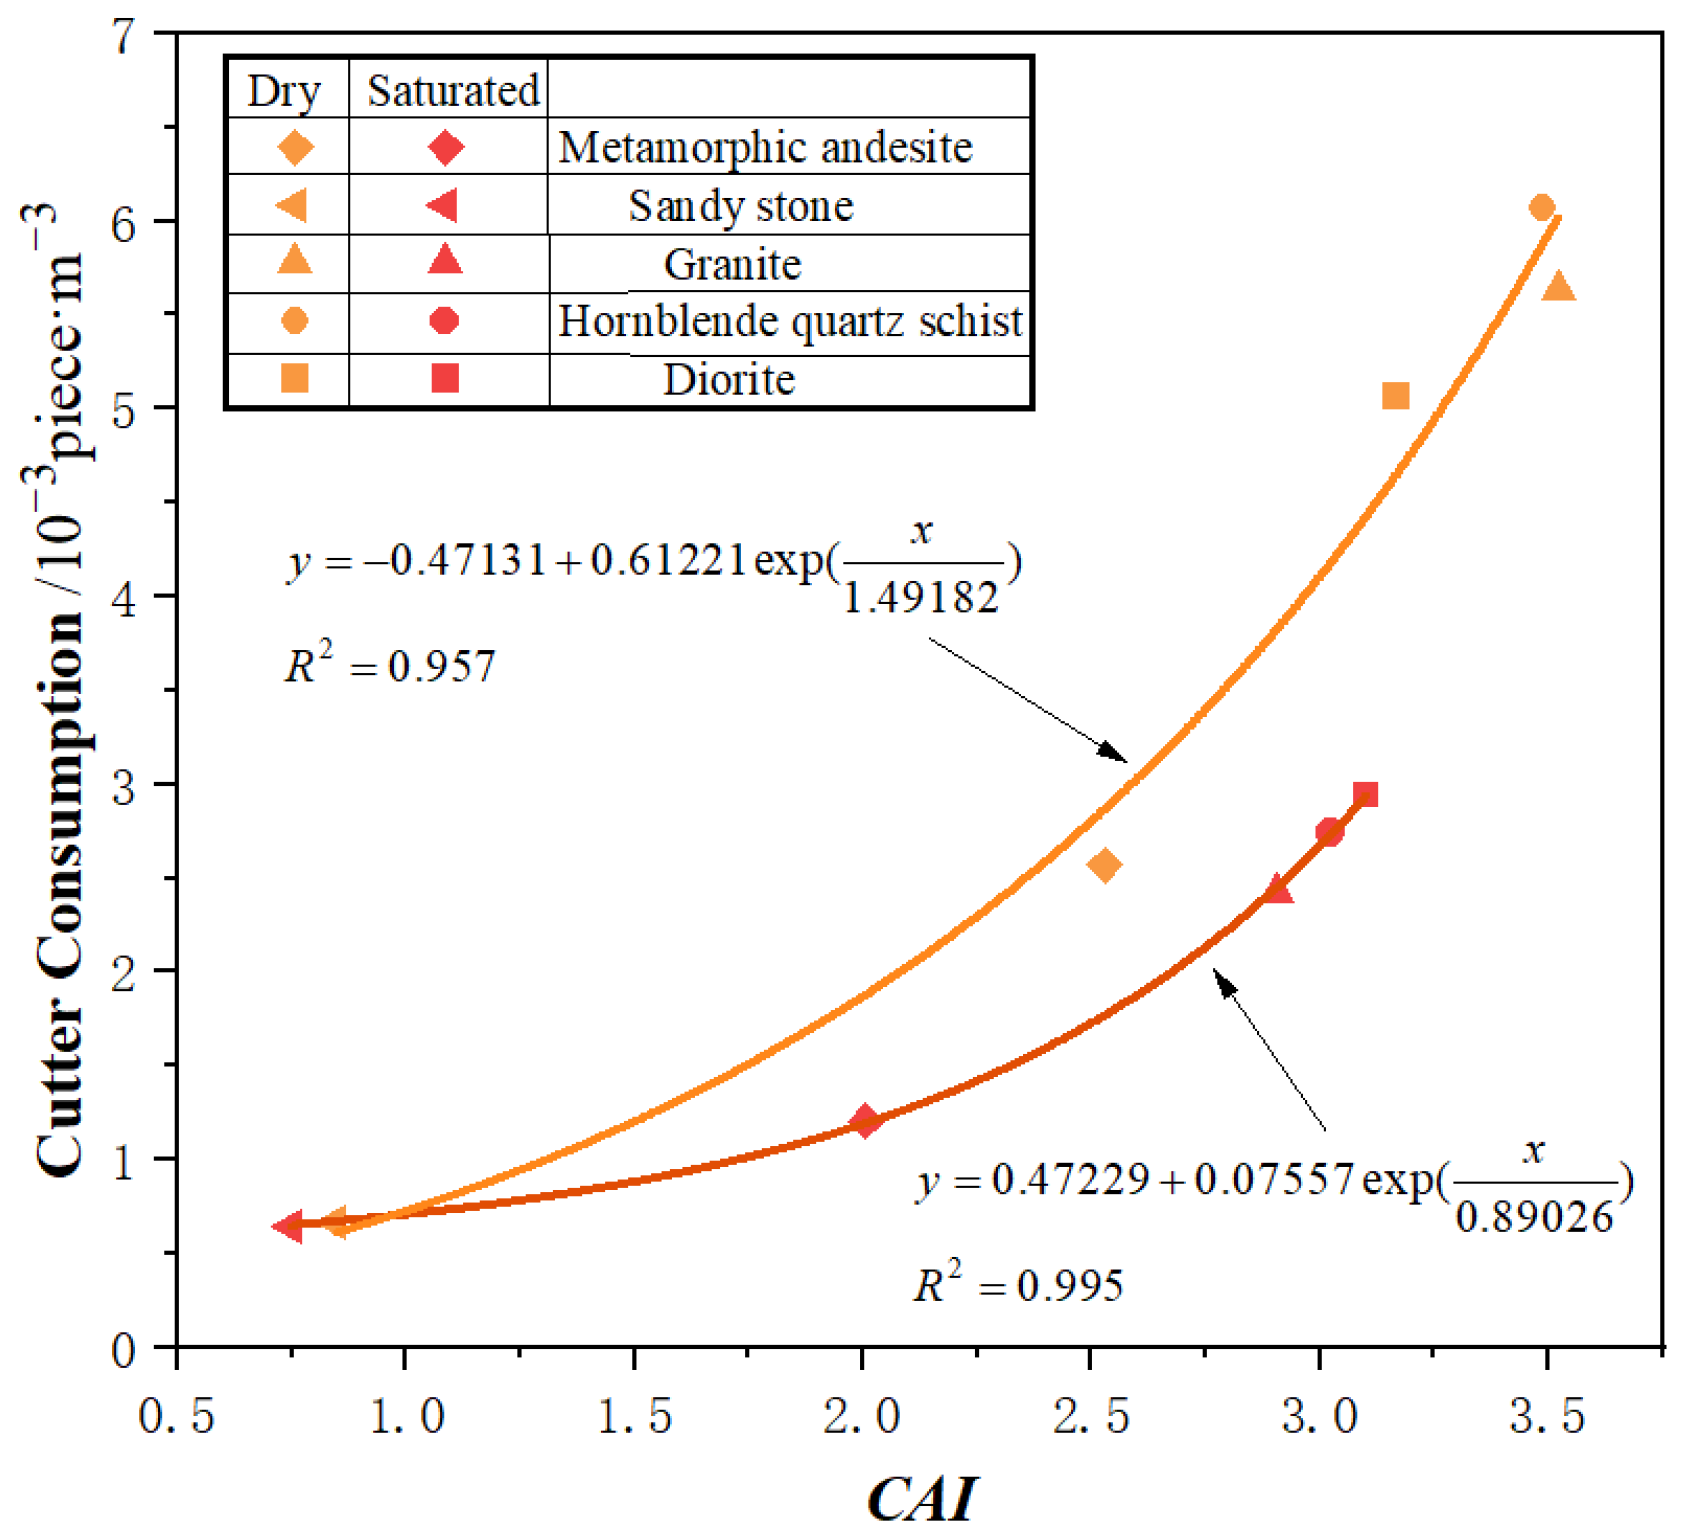
  • Regardless of if conditions are dry or saturated, TBM cutter consumption increases exponentially with the CAI. In different lithologies under saturated conditions, cutter consumption is 15.07% to 57.06% lower compared to dry conditions.
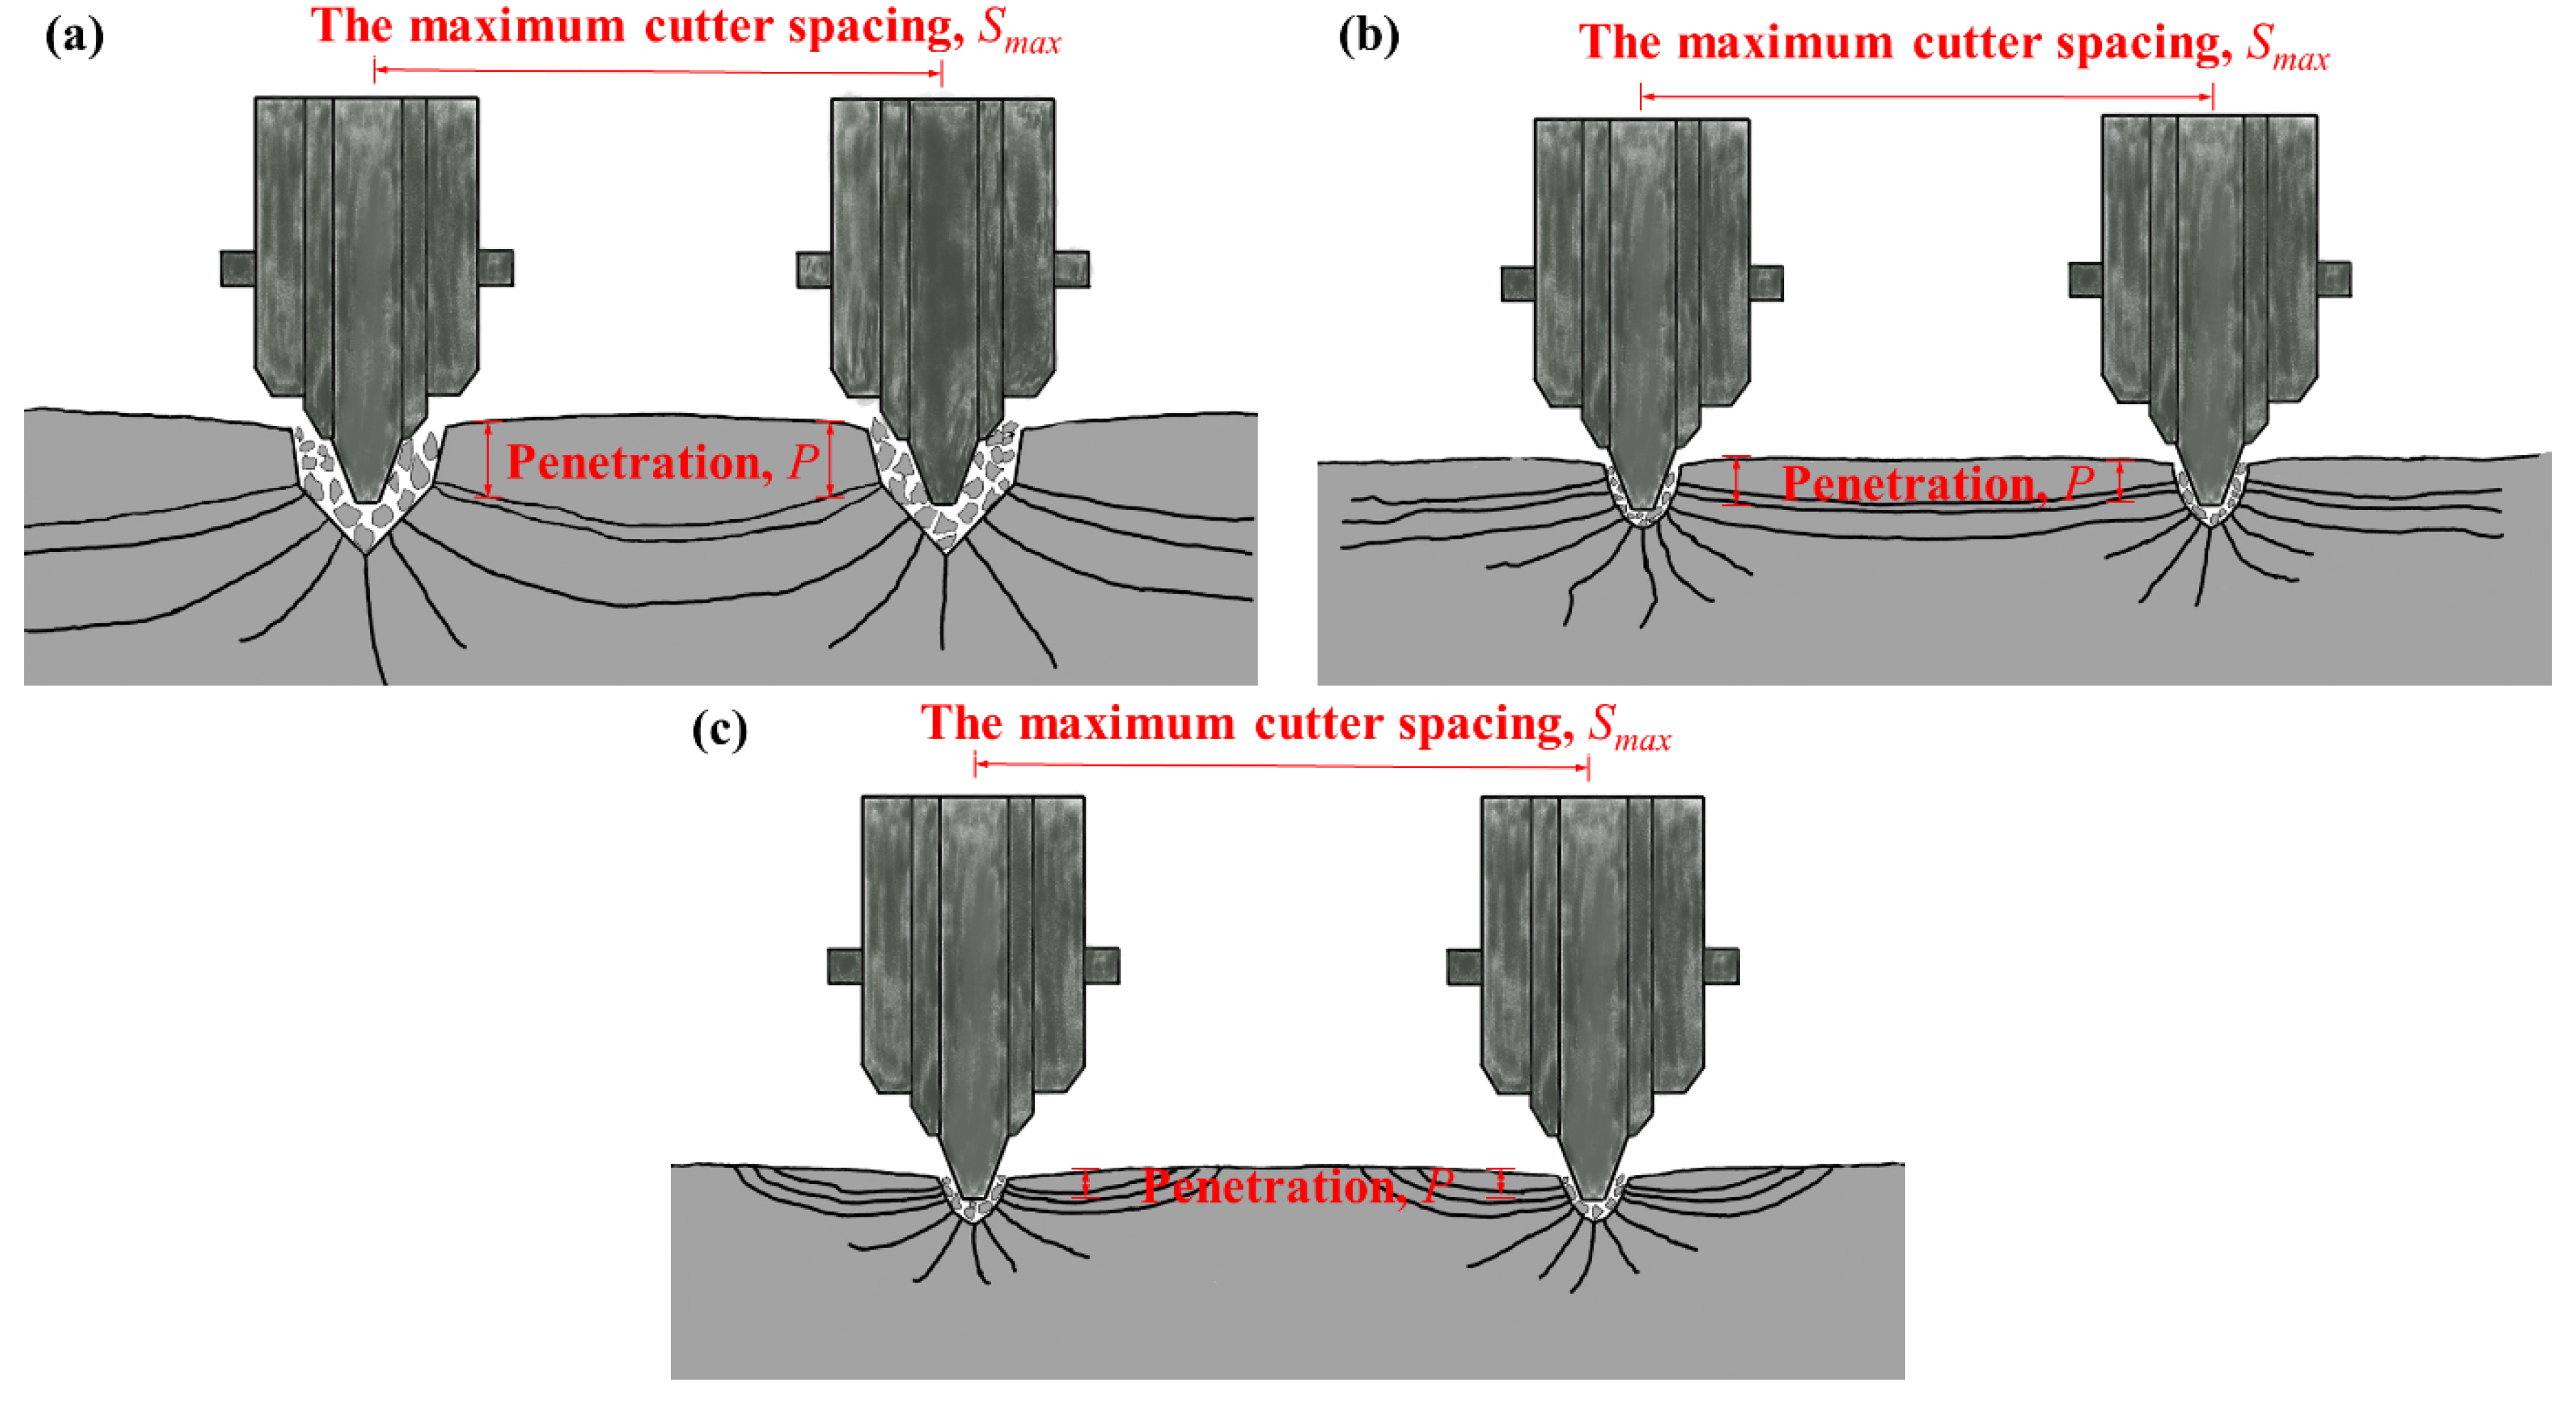
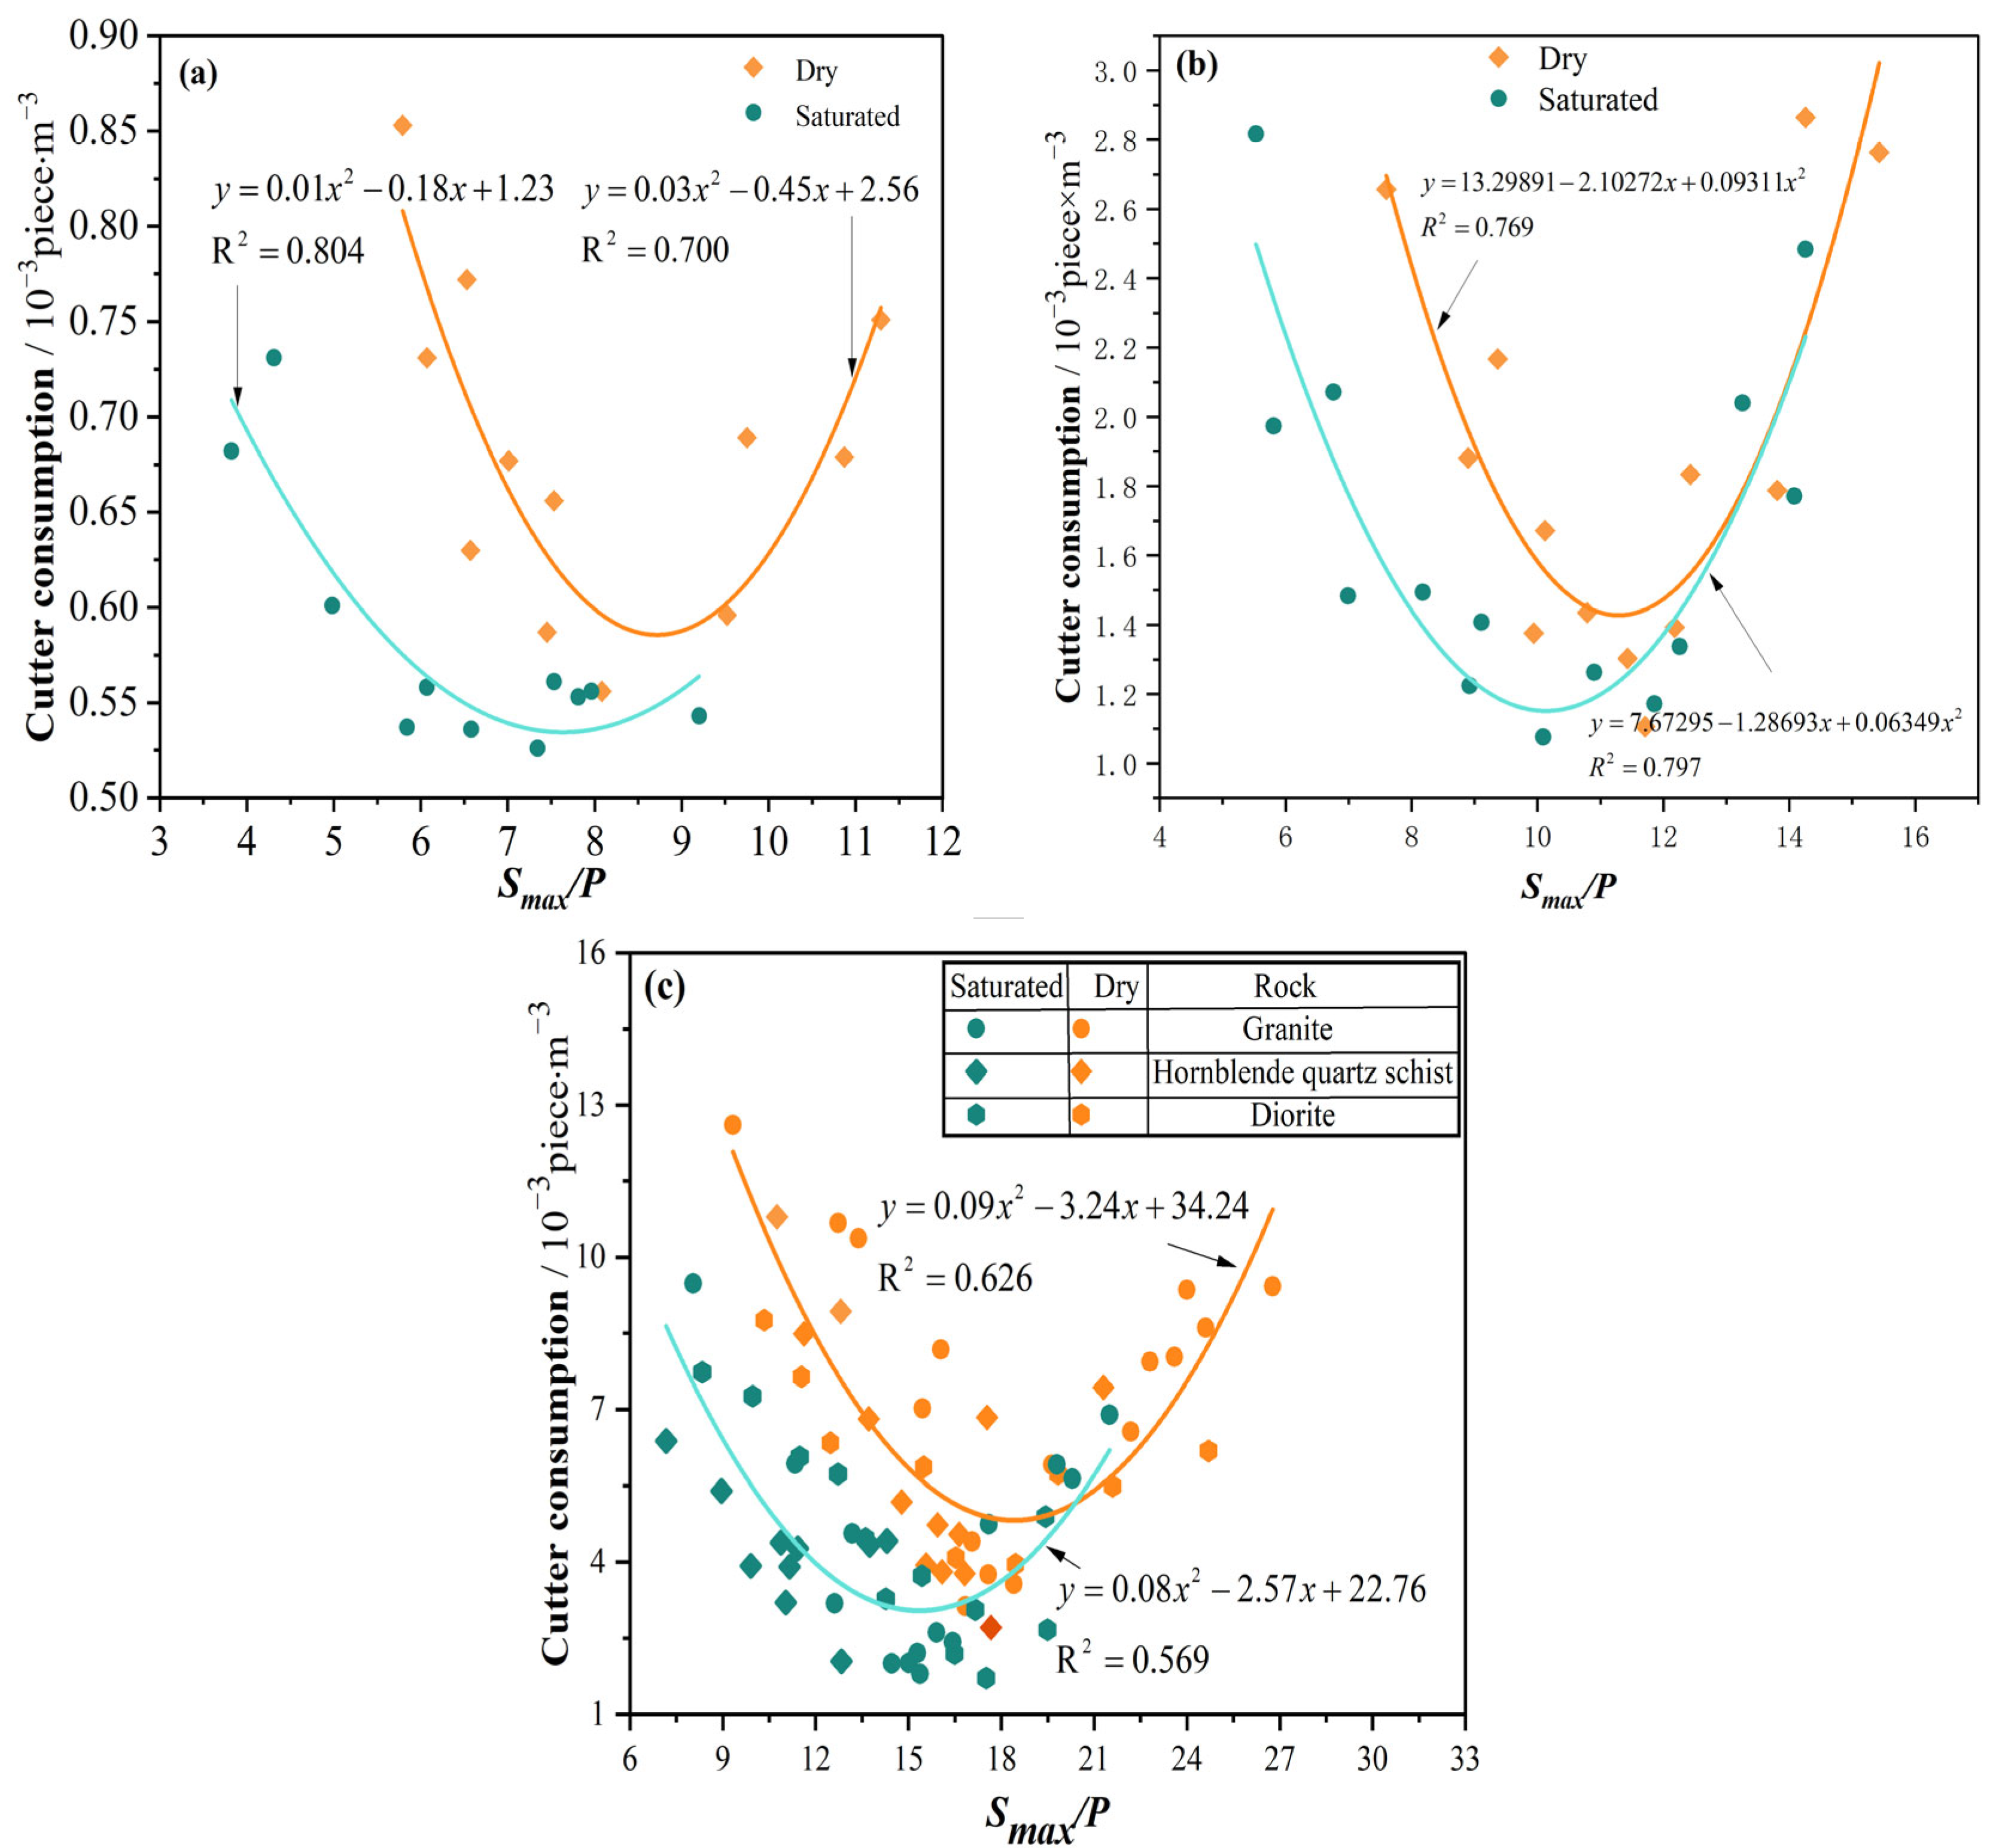
  • In both dry and saturated conditions, the CI initially increases and then decreases with an increase in the Smax/P ratio, while TBM cutter consumption decreases initially and then increases with a rise in the Smax/P ratio. There exists an optimal Smax/P value that maximizes TBM rock-breaking efficiency and minimizes TBM cutter consumption.
  • Considering both TBM rock-breaking efficiency and cutter consumption, the optimal Smax/P ranges for dry conditions are 10.972–12.169, 8.495–9.457, and 16.5–17.5 for medium-hard, soft, and hard rocks, respectively. In saturated conditions, the optimal Smax/P ranges are 8.606–8.931, 7.055–8.319, and 13.50–14.00 for the same rock types. To enhance TBM construction guidance, optimal tunneling parameter ranges are suggested for various dry and saturated surrounding rock tunneling conditions.
In conclusion, this optimization method can optimize the TBM parameters of similar geological formations by calculating the CI and cutter consumption. The efficiency optimization method proposed in this study is applicable to continuous strata, but its effectiveness for broken formations requires further investigation. However, the research methodology of this study is applicable to most strata and engineering projects. Subsequent research should collect more data for analysis and study a wider range of strata types. Further mechanical studies are warranted to facilitate TBM optimization design across diverse geological and environmental contexts.

Author Contributions

Conceptualization, W.W.; Project administration, W.W.; Supervision, W.W.; methodology, C.Y.; validation, W.Y. and T.R.; formal analysis, G.L. and J.G.; investigation, C.Y. and H.Z.; Resources, W.W. and T.R.; data curation, G.L. and H.Z.; writing—original draft preparation, J.G.; writing—review and editing, C.Y. and W.Y. All authors have read and agreed to the published version of the manuscript.

Funding

This work was supported by the National Natural Science Foundation of China (41972270), the Opening Foundation of the State Key Laboratory of Shield Machine and Boring Technology (SKLST-2019-K06), the Research Fund of the Key Laboratory of Water Management and Water Security for Yellow River Basin, Ministry of Water Resources (under construction) (2022-SYSJJ-06), the Science and Technology Program of China Railway 14th Bureau Group Co., Ltd. (9137000016305598912021C03), and the Technology Project of State Grid Xinyuan Group (Holdings) Co., Ltd. (SGXYKJ-2022-050).

Data Availability Statement

The original contributions presented in this study are included in the article material; further inquiries can be directed to the corresponding author.

Conflicts of Interest

Wei Wang and Taozhe Ren were employed by the company State Grid Xinyuan Group (Holdings) Co., Ltd.; Gaoliu Li was employed by the company SGIDI Engineering Consulting (Group) Co., Ltd. The remaining authors declare that the research was conducted in the absence of any commercial or financial relationships that could be construed as a potential conflict of interest. The authors declare that this study received funding from the Science and Technology Program of China Railway 14th Bureau Group Co., Ltd. and the Technology Project of State Grid Xinyuan Group (Holdings) Co., Ltd. The funders had the following involvement with the study: Conceptualization, Wei Wang; validation, Wei Wang; formal analysis, Taozhe Ren; data curation, Taozhe Ren.

References

  1. Liu, Q.S.; Huang, X.; Gong, Q.M.; Du, L.J.; Pan, Y.C.; Liu, J.P. Application and Development of Hard Rock TBM and Its Prospect in China. Tunn. Undergr. Space Technol. 2016, 57, 33–46. [Google Scholar] [CrossRef]
  2. Huang, X.; Liu, Q.S.; Shi, K.; Pan, Y.C.; Liu, J.P. Application and Prospect of Hard Rock TBM for Deep Roadway Construction in Coal Mines. Tunn. Undergr. Space Technol. 2018, 73, 105–126. [Google Scholar] [CrossRef]
  3. Armetti, G.; Migliazza, M.R.; Ferrari, F.; Berti, A.; Padovese, P. Geological and Mechanical Rock Mass Conditions for TBM Performance Prediction. The Case of “La Maddalena” Exploratory Tunnel, Chiomonte (Italy). Tunn. Undergr. Space Technol. 2018, 77, 115–126. [Google Scholar] [CrossRef]
  4. Feng, S.X.; Chen, Z.Y.; Luo, H.; Wang, S.Y.; Zhao, Y.F.; Liu, L.P.; Ling, D.S.; Jing, L.J. Tunnel Boring Machines (TBM) Performance Prediction: A Case Study Using Big Data and Deep Learning. Tunn. Undergr. Space Technol. 2021, 110, 103636. [Google Scholar] [CrossRef]
  5. Mao, H.M.; Chen, K.; Feng, H.H. Rock-breaking mechanism of TBM with different types of cutter tools and estimation of thrust force. Chin. J. Geotech. Eng. 2013, 35, 1627–1633. (In Chinese) [Google Scholar]
  6. Cho, J.W.; Jeon, S.; Jeong, H.Y.; Chang, S.H. Evaluation of Cutting Efficiency during TBM Disc Cutter Excavation within a Korean Granitic Rock Using Linear-Cutting-Machine Testing and Photogrammetric Measurement. Tunn. Undergr. Space Technol. 2013, 35, 37–54. [Google Scholar] [CrossRef]
  7. Pan, Y.C.; Liu, Q.S.; Liu, J.P.; Liu, Q.; Kong, X.X. Full-Scale Linear Cutting Tests in Chongqing Sandstone to Study the Influence of Confining Stress on Rock Cutting Efficiency by TBM Disc Cutter. Tunn. Undergr. Space Technol. 2018, 80, 197–210. [Google Scholar] [CrossRef]
  8. Gertsch, R.; Gertsch, L.; Rostami, J. Disc Cutting Tests in Colorado Red Granite: Implications for TBM Performance Prediction. Int. J. Rock Mech. Min. Sci. 2007, 44, 238–246. [Google Scholar] [CrossRef]
  9. Farrokh, E.; Rostami, J. Correlation of Tunnel Convergence with TBM Operational Parameters and Chip Size in the Ghomroud Tunnel, Iran. Tunn. Undergr. Space Technol. 2008, 23, 700–710. [Google Scholar] [CrossRef]
  10. Han, D.Y.; Cao, P.; Liu, J.; Zhu, J.B. An Experimental Study of Dependence of Optimum TBM Cutter Spacing on Pre-Set Penetration Depth in Sandstone Fragmentation. Rock Mech. Rock Eng. 2017, 50, 3209–3221. [Google Scholar] [CrossRef]
  11. Moon, T.; Oh, J. A Study of Optimal Rock-Cutting Conditions for Hard Rock TBM Using the Discrete Element Method. Rock Mech. Rock Eng. 2012, 45, 837–849. [Google Scholar] [CrossRef]
  12. Gong, Q.M.; Zhou, X.X.; Yin, L.J.; He, G.W.; Miao, C.T. Study of Rock Breaking Efficiency of TBM Disc Cutter Basedon Chips Analysis of Linear Cutting Test. Tunn. Constr. 2017, 37, 363–368. (In Chinese) [Google Scholar]
  13. Rostami, J.; Özdemir, L. A new model for performance prediction of hard rock TBMs. In Proceedings of the Rapid Excavation and Tunneling Conference, Boston, MA, USA, 13–17 June 1993; pp. 793–809. [Google Scholar]
  14. Hamzaban, M.T.; Memarian, H.; Rostami, J.; Ghasemi-Monfared, H. Study of Rock–Pin Interaction in Cerchar Abrasivity Test. Int. J. Rock Mech. Min. Sci. 2014, 72, 100–108. [Google Scholar] [CrossRef]
  15. Man, K.; Liu, X.L.; Song, Z.F.; Liu, Z.X.; Liu, R.L.; Wu, L.W.; Cao, Z.X. Dynamic Compression Characteristics and Failure Mechanism of Water-Saturated Granite. Water 2022, 14, 216. [Google Scholar] [CrossRef]
  16. Mammen, J.; Saydam, S.; Hagan, P. A Study on the Effect of Moisture Content on Rock Cutting Performance. In Proceedings of the 2009 Coal Operators’ Conference, University of Wollongong & the Australasian Institute of Mining and Metallurgy, Wollongong, Australia, 12–13 February 2009; pp. 340–347. [Google Scholar]
  17. Bakar, M.Z.A.; Gertsch, L.S. Evaluation of Saturation Effects on Drag Pick Cutting of a Brittle Sandstone from Full Scale Linear Cutting Tests. Tunn. Undergr. Space Technol. 2013, 34, 124–134. [Google Scholar] [CrossRef]
  18. Mosleh, M.; Gharahbagh, E.A.; Rostami, J. Effects of Relative Hardness and Moisture on Tool Wear in Soil Excavation Operations. Wear 2013, 302, 1555–1559. [Google Scholar] [CrossRef]
  19. Bakar, M.Z.A.; Gertsch, L.S.; Rostami, J. Evaluation of Fragments from Disc Cutting of Dry and Saturated Sandstone. Rock Mech. Rock Eng. 2014, 47, 1891–1903. [Google Scholar] [CrossRef]
  20. Zhu, G.X.; He, L.K.; Tan, Q.; Yao, Z.W.; Zhang, Y.C. Experimental study on the rock breaking characteristics of TBM disc cutter under saturated condition. J. Railw. Sci. Eng. 2019, 16, 3126–3133. (In Chinese) [Google Scholar] [CrossRef]
  21. Yan, C.B.; Gao, Z.A.; Yao, X.T.; Wang, H.J.; Yang, F.W.; Yang, J.H.; Lu, G.M. Weighted random forest prediction model for TBM advance rate considering uncertainty. Chin. J. Geotech. Eng. 2023, 45, 2575–2583. (In Chinese) [Google Scholar] [CrossRef]
  22. Shen, Y.M.; Zhang, D.M.; Wang, R.L.; Li, J.P.; Huang, Z.K. SBD-K-medoids-based long-term settlement anlysis of shield tunnel. Transp. Geotech. 2023, 42, 101053. [Google Scholar] [CrossRef]
  23. Rispoli, A.; Ferrero, A.M.; Cardu, M.; Farinetti, A. Determining the Particle Size of Debris from a Tunnel Boring Machine Through Photographic Analysis and Comparison Between Excavation Performance and Rock Mass Properties. Rock Mech. Rock Eng. 2017, 50, 2805–2816. [Google Scholar] [CrossRef]
  24. Tuncdemir, H.; Bilgin, N.; Copur, H.; Balci, C. Control of Rock Cutting Efficiency by Muck Size. Int. J. Rock Mech. Min. Sci. 2008, 45, 278–288. [Google Scholar] [CrossRef]
  25. BS EN 933-1-2012; Tests for Geometrical Properties of Aggregates. Determination of Particle Size Distribution. Sieving Method. BSI Standards Limited: London, UK, 2012. [CrossRef]
  26. ASTM D7625; Standard Test Method for Laboratory Determination of Abrasiveness of Rock Using the CERCHAR Method. ASTM International: West Conshohocken, PA, USA, 2010. [CrossRef]
  27. Jing, L.J.; Zhang, N.; Yang, C.; Ju, X.Y. A Design Method Research on TBM Face Cutter Spacing Layout Based on Mnimum Specific Energy. J. China Railw. Soc. 2018, 40, 123–129. (In Chinese) [Google Scholar] [CrossRef]
  28. Roxborough, F.F.; Rispin, A. The mechanical cutting characteristics of the lower chalk. Tunn. Tunn. 1973, 5, 45–67. [Google Scholar]
  29. Yan, C.B.; Jiang, X.D.; Liu, Z.H.; Yang, J.H.; Miao, D. Rock-breaking efficiency of TBM based on particle-size distribution of rock detritus. Chin. J. Geotech. Eng. 2019, 41, 466–474. (In Chinese) [Google Scholar] [CrossRef]
  30. Gong, Q.M.; Zhao, J.; Jiang, Y.S. In Situ TBM Penetration Tests and Rock Mass Boreability Analysis in Hard Rock Tunnels. Tunn. Undergr. Space Technol. 2007, 22, 303–316. [Google Scholar] [CrossRef]
  31. Yan, C.B.; Li, G.L.; Chen, J.; Li, Y.; Yang, Y.D.; Yang, F.W.; Yang, J.H. A novel evaluation index of TBM rock-breaking efficiency based on newly added surfaces theory. Rock Soil Mech. 2023, 44, 1153–1164. (In Chinese) [Google Scholar] [CrossRef]
  32. Yao, Q.L.; Zhu, L.; Huang, Q.X.; Yang, P.; Xu, Z. Experimental study on the effect of moisture content on creep characteristics of fine-grained feldspar lithic sandstone. J. Min. Saf. Eng. 2019, 36, 10347–1042+1051. (In Chinese) [Google Scholar] [CrossRef]
  33. Li, T.B.; Chen, Z.Q.; Chen, G.Q.; Ma, C.C.; Tang, O.L.; Wang, M.J. An experimental study of energy mechanism of sandstone with different moisture contents. Rock Soil Mech. 2015, 36, 229–236. (In Chinese) [Google Scholar] [CrossRef]
  34. Bakar, M.Z.A.; Majeed, Y.; Rostami, J. Effects of Rock Water Content on CERCHAR Abrasivity Index. Wear 2016, 368–369, 132–145. [Google Scholar] [CrossRef]
Figure 1. Construction layout of the water conveyance tunnel.
Buildings 14 01124 g001
Figure 2. Geological profile of the water conveyance tunnel.
Buildings 14 01124 g002
Figure 3. The sieving test of TBM rock chips.
Buildings 14 01124 g003
Figure 4. Rock abrasion servo tester.
Buildings 14 01124 g004
Figure 5. Steel needle evaluation before and after the Cerchar abrasion test.
Buildings 14 01124 g005
Figure 6. Correlation between CI and SE. (a) Soft rocks; (b) hard rocks.
Buildings 14 01124 g006
Figure 7. Correlations between SE and Smax/P ratio and CI and Smax/P ratio for soft rock. (a) Correlation between Smax/P ratio and SE; (b) correlation between Smax/P ratio and CI.
Buildings 14 01124 g007
Figure 8. Correlations between SE and Smax/P ratio as well as CI and Smax/P ratio for hard rock. (a) Correlation between Smax/P ratio and SE; (b) correlation between Smax/P ratio and CI.
Buildings 14 01124 g008
Figure 9. Disc cutter rock-breaking methods at different Smax/P values. (a) Smaller Smax/P value, (b) optimal Smax/P value, and (c) greater Smax/P value.
Buildings 14 01124 g009
Figure 10. CI and Smax/P ratio relationship curves in dry and saturated conditions. (a) Relatively soft rock, (b) medium-hard rock, and (c) hard rock.
Buildings 14 01124 g010
Figure 11. Cutter consumption variation with CAI in dry and saturated conditions.
Buildings 14 01124 g011
Figure 12. Cutter consumption variation with Smax/P ratio in dry and saturated conditions. (a) Relatively soft rock, (b) medium-hard rock, and (c) hard rock.
Buildings 14 01124 g012
Table 1. TBM main design parameters.
TBM Design ParametersWater Conveyance Tunnel
TBM1TBM2
TBM typedouble shield
Tunneling diameter5460 mm5460 mm
Number of disc cutters3730
Center disc cutter/diameter6/432 mm4/432 mm
Inner cutter/diameter21/483 mm17/483 mm
Gauge cuter/diameter10/483 mm9/483 mm
Maximum cutter spacing86 mm83 mm
Cutter head speed0~10.3 r·min−10~8.7 r·min−1
Cutter head power1800 kW2100 kW
Maximum cutter head thrust22,160 kN11,900 kN
Rating torque3458 kN·m4210 kN·m
Breakaway torque5878 kN·m6940 kN·m
Maximum tunneling speed120 mm·min−1120 mm·min−1
Table 2. CAI values for rocks of different lithologies in dry and saturated conditions.
Rock
Lithology
Code NameSample NumberCAIdryAverage CAIdryCode NameCAIsatAverage CAIsat
Metamorphic andesiteAA12.4352.530A51.8462.006
A22.358A61.553
A32.746A72.439
A42.581A82.184
SandstoneSS10.7510.846SH50.5640.747
S20.978SH60.939
S30.835SH70.741
S40.821SH80.743
GraniteHH12.9333.523H52.5812.905
H23.751H62.943
H33.323H73.261
H44.085H82.834
Quartz schistYY14.1693.488SP53.0413.024
Y23.323SP62.822
Y33.647SP73.254
Y42.813SP82.978
Quartz dioriteSYSY13.5393.167SY53.2193.102
SY22.959SY63.411
SY32.953SY73.042
SY43.215SY82.734
Table 3. Sieving test data for rock chips cut by TBM for soft rocks and hard rocks.
Group NumberSurrounding Rock GradeSieve Quality (kg)Smax/PSE (kJ/m3)CI
1IV178.816.3830,024.92312.13
2IV108.205.231,784.36279.29
3III215.179.819,939.43347.60
4III164.305.429,866.75326.74
5III119.809.517,356.68366.00
6III104.617.2227,396.53328.00
7III194.37919,616.44350.66
Table 4. The sieving test data of rock chips cut by TBM for hard rocks.
Group NumberSurrounding Rock GradeSieve Quality (kg)Smax/PSE (kJ/m3)CI
1II180.5022.2578,505.88377.28
2II171.1523.2568,820.04350.74
3II263.1720.1151,575.24430.81
4II212.7412.2932,221.89448.88
5II175.0712.629,259.62454.06
6II239.2517.238,060.04457.58
7II214.1420.546,150.56429.67
Table 5. CAI values and cutter consumption for dry and saturated rock.
Rock LithologyDrySaturated
CAIdryCutter Consumption
10−3 Piece m−3
CAIsatCutter Consumption
(10−3 Piece∙m−3)
Metamorphic andesite2.5302.5682.0061.204
Sandy stone0.8460.6690.7470.642
Granite3.5235.6402.9052.422
Quartz schist3.4886.0703.0242.741
Quartz diorite3.1675.0663.1022.942
Table 6. Optimal Smax/P ranges determined based on disc cutter consumption and CI data.
Rock LithologySoft RockMedium-Hard RockHard Rock
The optimal Smax/P range determined based on CIDry7.976~9.45710.414~12.16917.465~19.369
Sat6.502~8.7698.606~11.65614.514~16.193
The optimal Smax/P range determined based on cutter consumptionDry8.495–9.74910.972–12.24614.511–16.640
Sat7.055~8.3197.187~8.64110.945~13.163
The optimal Smax/P range recommendationDry8.495~9.45710.972~12.16916.5~17.5
Sat7.055~8.3198.606~8.93113.50~14.00
Disclaimer/Publisher’s Note: The statements, opinions and data contained in all publications are solely those of the individual author(s) and contributor(s) and not of MDPI and/or the editor(s). MDPI and/or the editor(s) disclaim responsibility for any injury to people or property resulting from any ideas, methods, instructions or products referred to in the content.

