Article

Digital Twin Research on Masonry–Timber Architectural Heritage Pathology Cracks Using 3D Laser Scanning and Deep Learning Model

1
School of Civil Engineering, Architecture and Environment, Hubei University of Technology, Wuhan 430068, China
2
Key Laboratory of Health Intelligent Perception and Ecological Restoration of River and Lake, Ministry of Education, Hubei University of Technology, Wuhan 430068, China
*
Author to whom correspondence should be addressed.
Buildings 2024, 14(4), 1129; https://doi.org/10.3390/buildings14041129
Submission received: 21 February 2024 / Revised: 28 March 2024 / Accepted: 9 April 2024 / Published: 17 April 2024

Abstract

:
Due to various factors such as aging, natural environment erosion, and man-made destruction, architectural heritage has formed various diseases and cracks, especially in pathology cracks, which are the most typical masonry–timber architectural heritages, directly affecting the structural stability of masonry–timber buildings. This paper uses artificial intelligence and architecture and other multi-disciplinary research methods, taking James Jackson Gymnasium, a famous masonry–timber architectural heritage in Wuhan, as an example, using 3D laser scanning technology to obtain disease details and crack data of architectural heritage, using a Mask R-CNN model to detect crack area, using an FCN model to identify and calculate single cracks, and finally summarizing the type, location, and characteristics of cracks, analyzing the causes of cracks, and then putting forward corresponding hierarchical restoration strategies. The research results build a set of detection and repair systems of masonry–timber architectural heritage pathology cracks, which provide a set of accurate and objective pathology cracks data for architectural heritage protection and repair, and provide a reference for architectural heritage repair.

1. Introduction

Due to the passage of time and the effects of natural forces [1], architectural heritage is confronted with significant challenges stemming from various diseases and forms of damage, ultimately resulting in the emergence of pathology cracks [2,3]. Left unchecked and untreated, these pathology cracks in architectural heritage can escalate to cause surface damage and structural failure. In the case of architectural heritage created from masonry and timber structures, the unique properties of these materials render them susceptible to the development of corrosive architectural diseases through the propagation of disease cracks, culminating in brittle and ductile damage to the architectural heritage and even potential building collapse [4].
The conventional methods used in pathology crack research rely excessively on manual observation and empirical judgments, rendering them subjective and unreliable. This approach is associated with several issues, including lengthy research cycles, potential oversight, low precision, and limited research sample sizes. Hence, the key to preserving architectural heritage lies in promptly and accurately identifying these pathology cracks and devising targeted restoration strategies. In recent years, efforts by Chen, Y., Wang, N., and Wang, Z. [5,6,7], among other scholars, have resulted in the development of a single-crack recognition model based on convolutional neural networks for building surfaces, marking the application of deep learning in architectural research. However, the model’s limited range of recognition capabilities restricts it to identifying concrete structures and single cracks on building surfaces, with image acquisition relying solely on manual observation and camera capture. A pioneering study by Yin, Y. [8] blends 3D laser scanning with a deep learning model, enabling the construction of a building cracks depth identification model that can extract crack features from building surfaces but falls short in identifying crack regions and single cracks. Similarly, the deep learning model devised by Wang and Z [7] facilitates the calculation of individual cracks on building surfaces, albeit with results obtained by adding reference lines to the cracks, limiting the geometric information garnered and lacking accuracy and relevance.
Therefore, this paper presents a novel solution to address the aforementioned challenges: by integrating 3D laser scanning technology with a deep learning model, a building 3D laser scanning area detection model and an architectural heritage monomer recognition and calculation model are established using high-precision and large-scale geometric information images obtained through pathology cracks technology [9]. This allows for the detection of architectural heritage areas within pathology cracks, the individual identification of cracks, and the calculation of length, width, and area within these areas. This approach lays the foundation for a sustainable strategy for the detection, division, recognition, and calculation of architectural heritage areas within pathology cracks. By leveraging advanced technical tools in the information age, the identification and scientific restoration of architectural heritage pathology cracks will be enhanced.
Moreover, 3D laser scanning technology offers high-precision and non-invasive characteristics, enabling the acquisition of precise building geometric information [8,9,10]. This technology can generate millions of images and point cloud models that aid in calibration [11], thus providing a rich and highly precise database for further in-depth research. Furthermore, deep learning models have demonstrated significant accomplishments in image recognition and classification [12,13], and have been widely utilized in various computer vision tasks such as human posture estimation, medical image analysis, and autonomous driving [14,15,16,17]. However, deep learning models are rarely applied in the field of architectural heritage diseases, and their development in this area remains limited [8]. These models possess adaptive learning capabilities and high-accuracy image segmentation abilities, making them ideal for detecting, recognizing, and calculating pathology cracks in architectural heritage. Therefore, the integration of these two technologies not only enables precise pathology crack detection but also furnishes detailed three-dimensional information for subsequent restoration efforts and establishes a comprehensive and accurate database essential for the protection of architectural heritage.
Specifically speaking, the purpose of this study is to integrate 3D laser scanning technology with a deep learning model to develop a system for detecting and restoring architectural heritage pathology cracks. Initially, a detection model for architectural pathology crack areas based on the Mask R-CNN deep learning model [18] is established. Subsequently, a model for identifying and calculating architectural pathology cracks based on FCN [19] is developed. This enables the detection of pathology crack areas in architectural heritage, the identification of cracks within those areas, and the calculation of their length, width, and area, resulting in accurate information on each pathology crack in the building. The research strategy involves utilizing the high-precision and extensive geometric information of architectural heritage images obtained through 3D laser scanning to detect, categorize, identify, and calculate pathology crack areas in architectural heritage. James Jackson Gymnasium, located in the Tanhualin Historic District [20] of Wuchang District, Wuhan City, China, is chosen as the study subject to validate the proposed methods for regional detection, categorization, identification, and calculation of architectural heritage 3D laser scanning based on pathology cracks technology and a deep learning model, as well as the resulting architectural heritage detection and restoration system. The outcomes of this research will not only offer robust technical support for the conservation and restoration of architectural heritage but also hold significance for the advancement of scientific knowledge in the field of architectural preservation and restoration. Additionally, the study will provide a novel reference and inspiration for the fusion of information technologies such as architecture and artificial intelligence.
The innovations in this article are as follows:
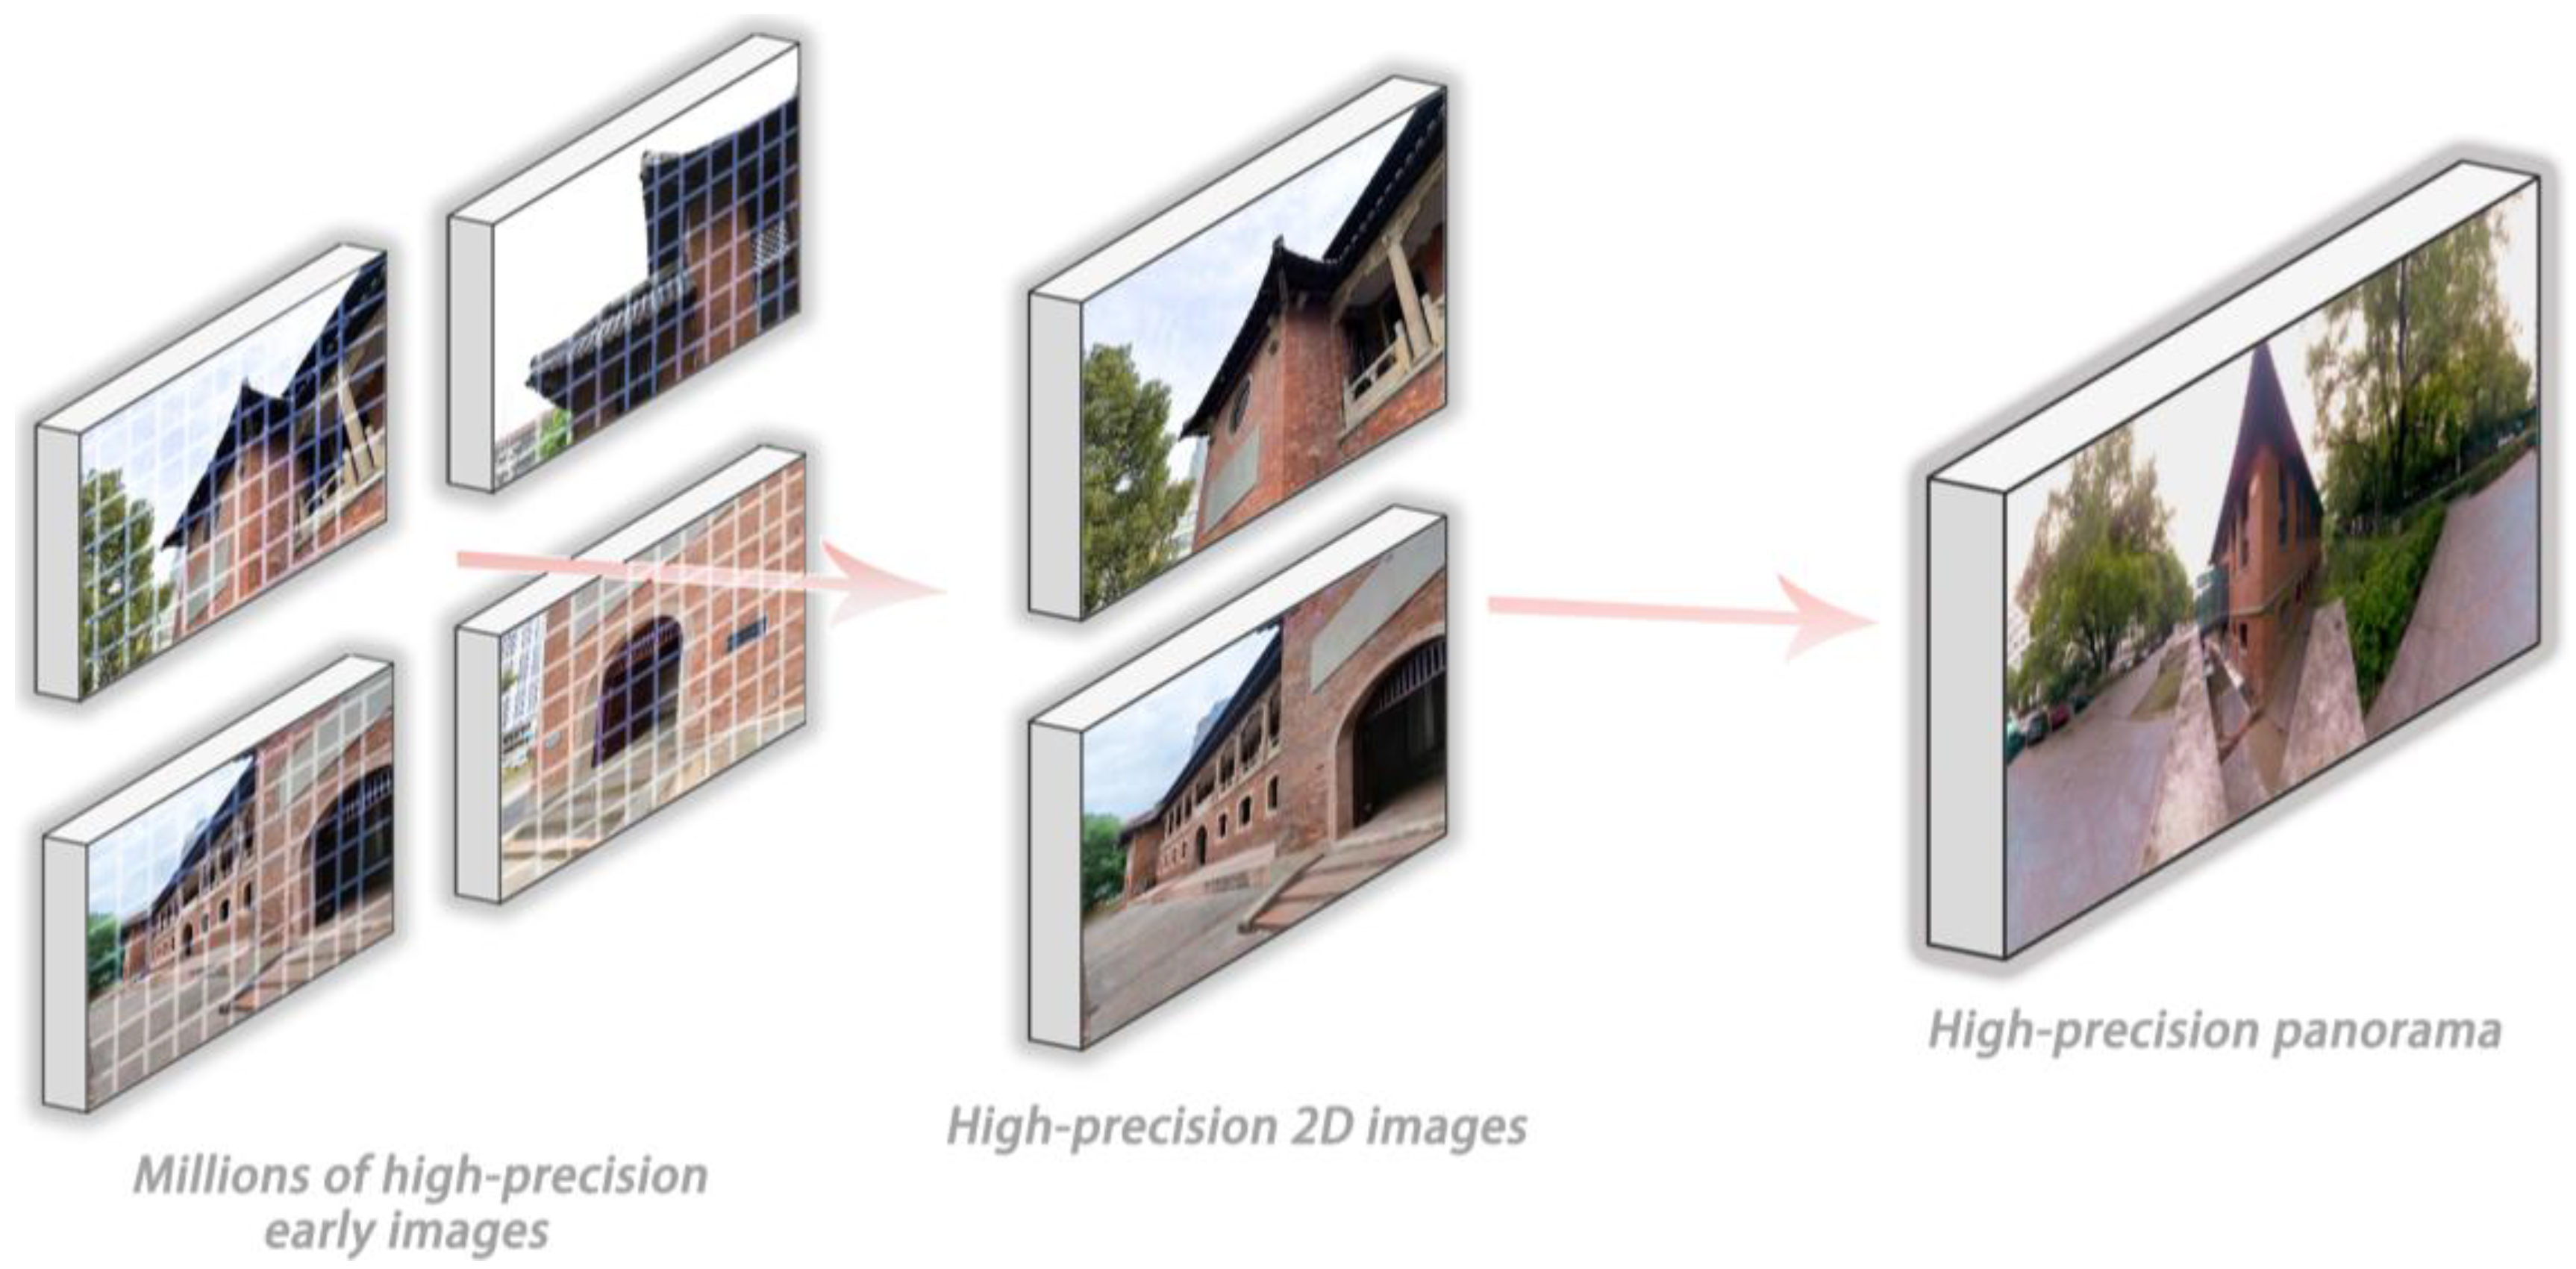
  • The research method is novel as it combines 3D laser scanning with a deep learning model, providing millions of high-definition images for computer adaptive recognition and achieving an organic combination of architecture and artificial intelligence.
  • A single identification and calculation model for regional detection and pathology cracks of architectural heritage diseases is developed, applicable to all masonry and timber structure architectural heritage sites, significantly enhancing monitoring and protection levels.
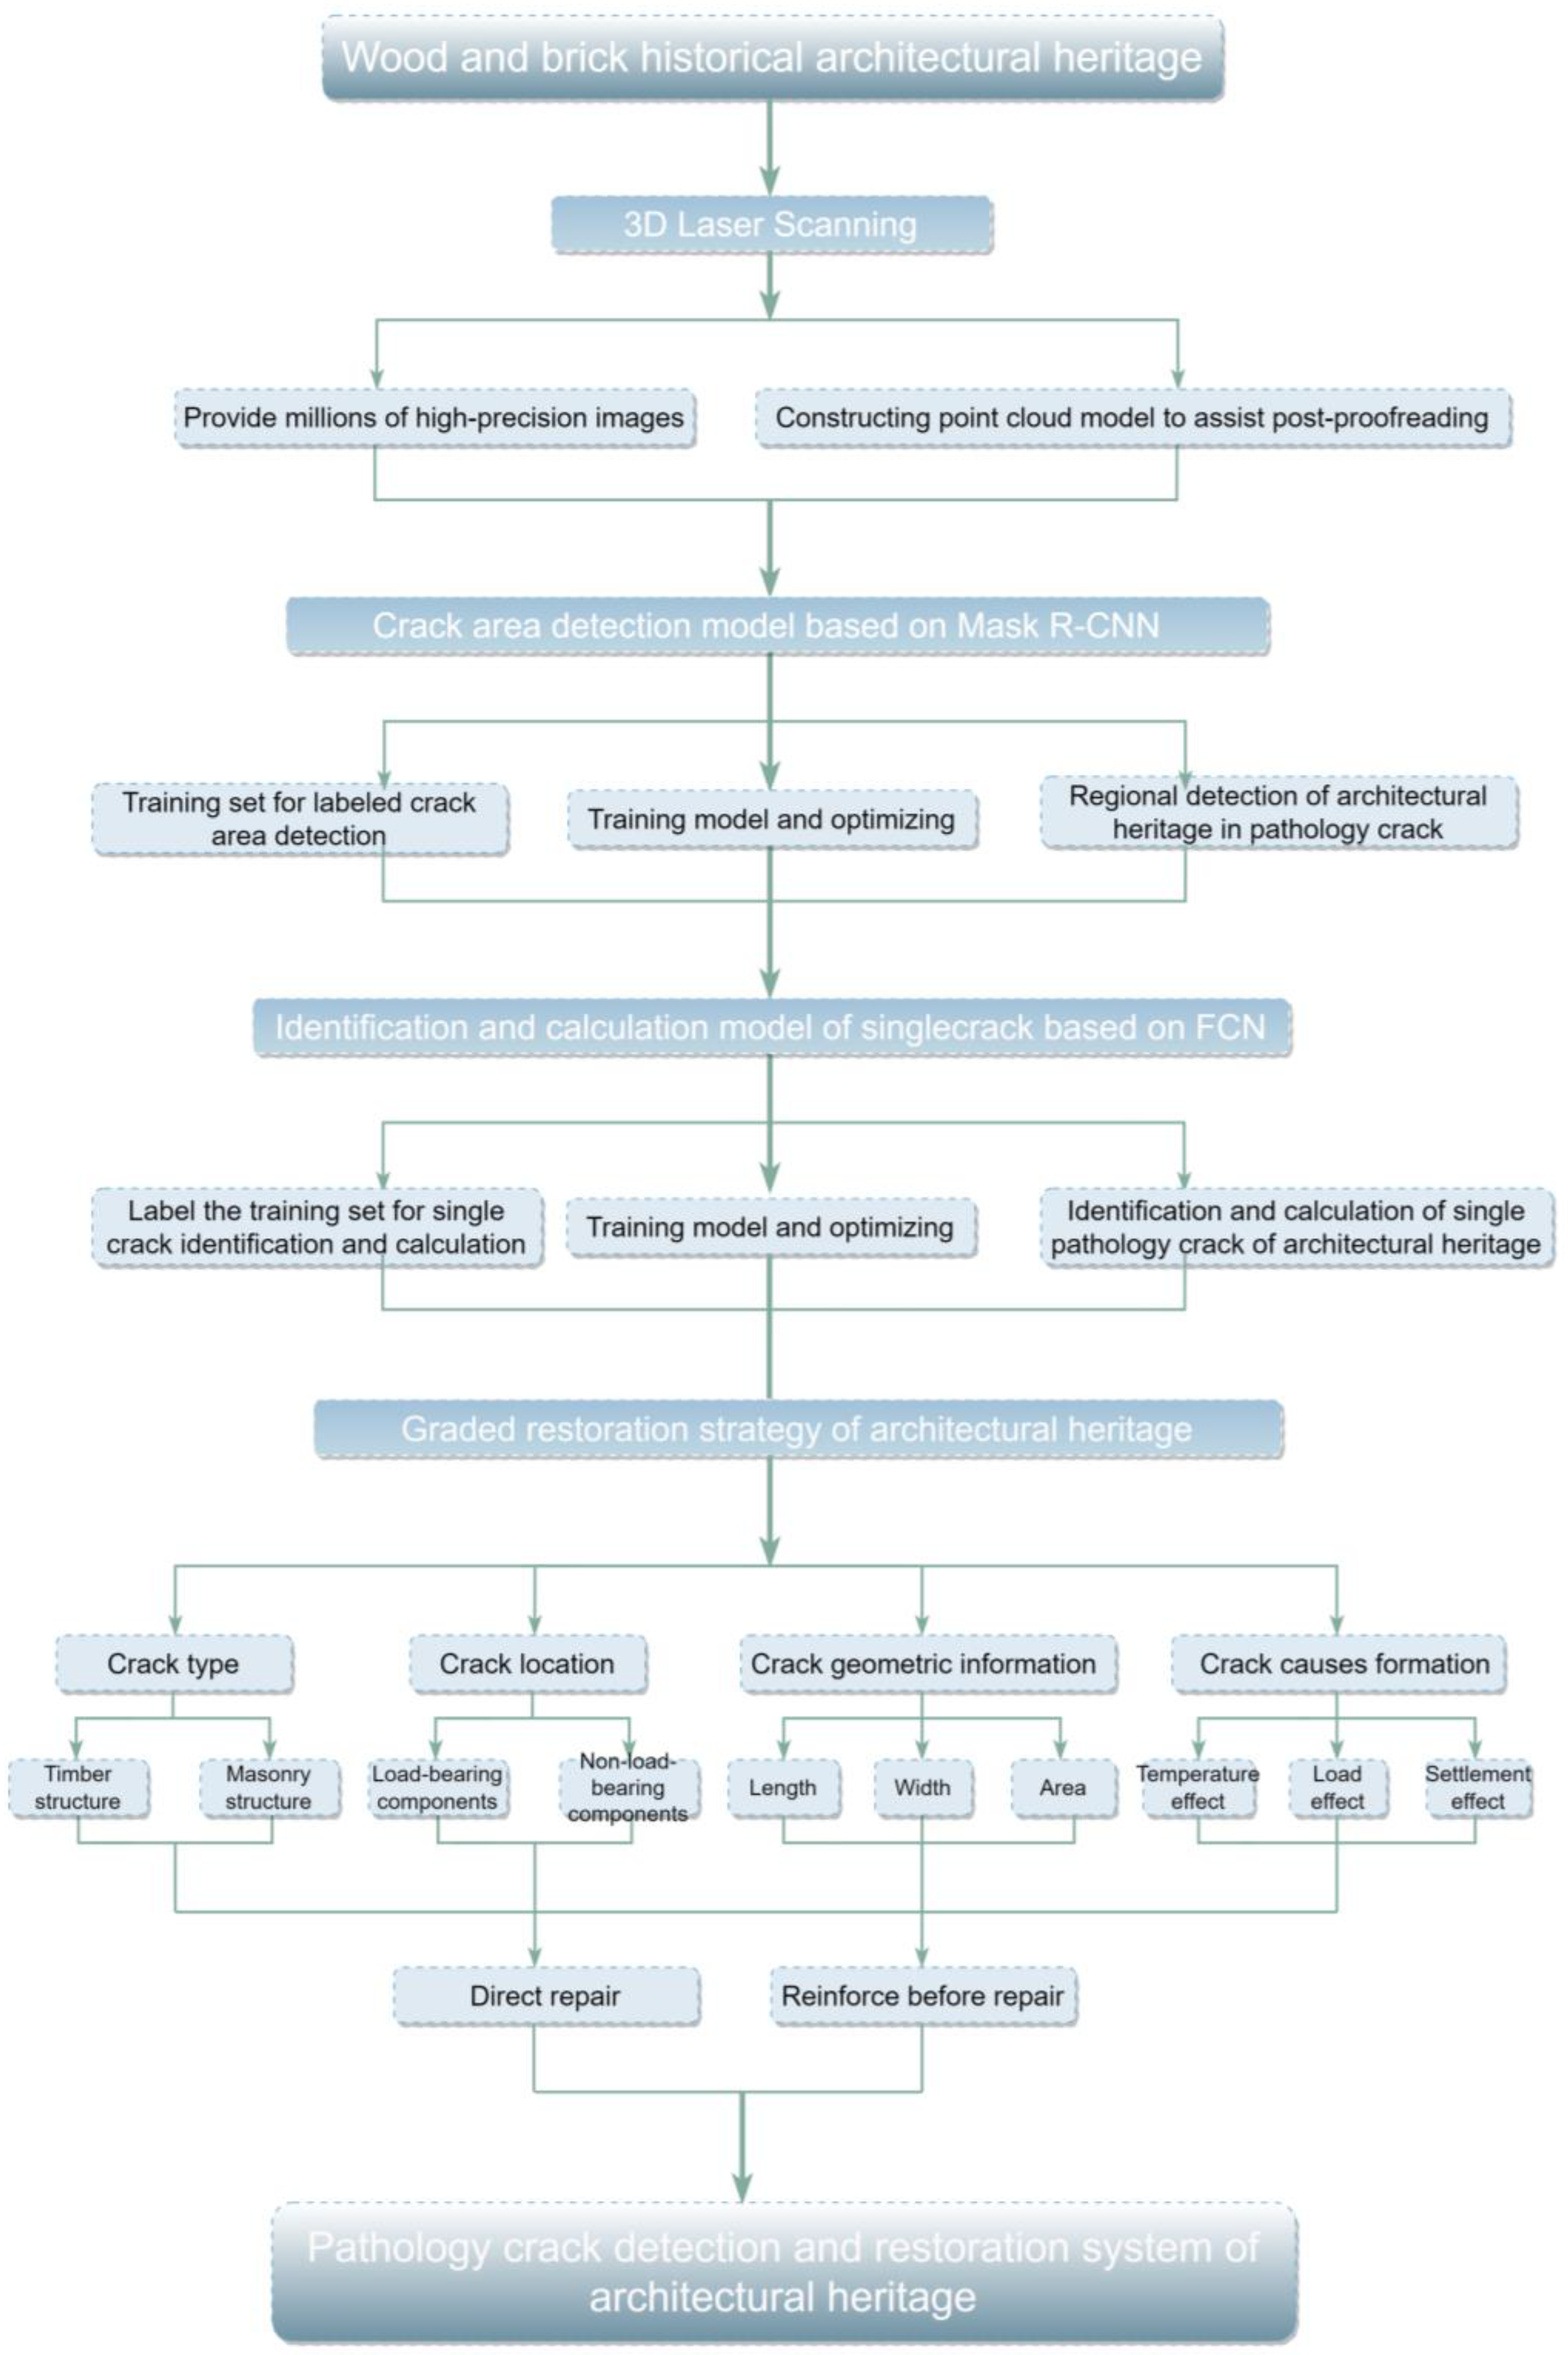
  • Research strategies focusing on disease details, cracks data, regional detection, and single-crack identification calculation of architectural heritage are derived through 3D laser scanning and deep learning model techniques. Additionally, targeted restoration strategies are proposed based on identification and calculation outcomes, leading to the development of a detection and repair system for masonry and timber architectural heritage pathology cracks, offering valuable insights for architectural heritage repair practices.

2. Materials and Methods
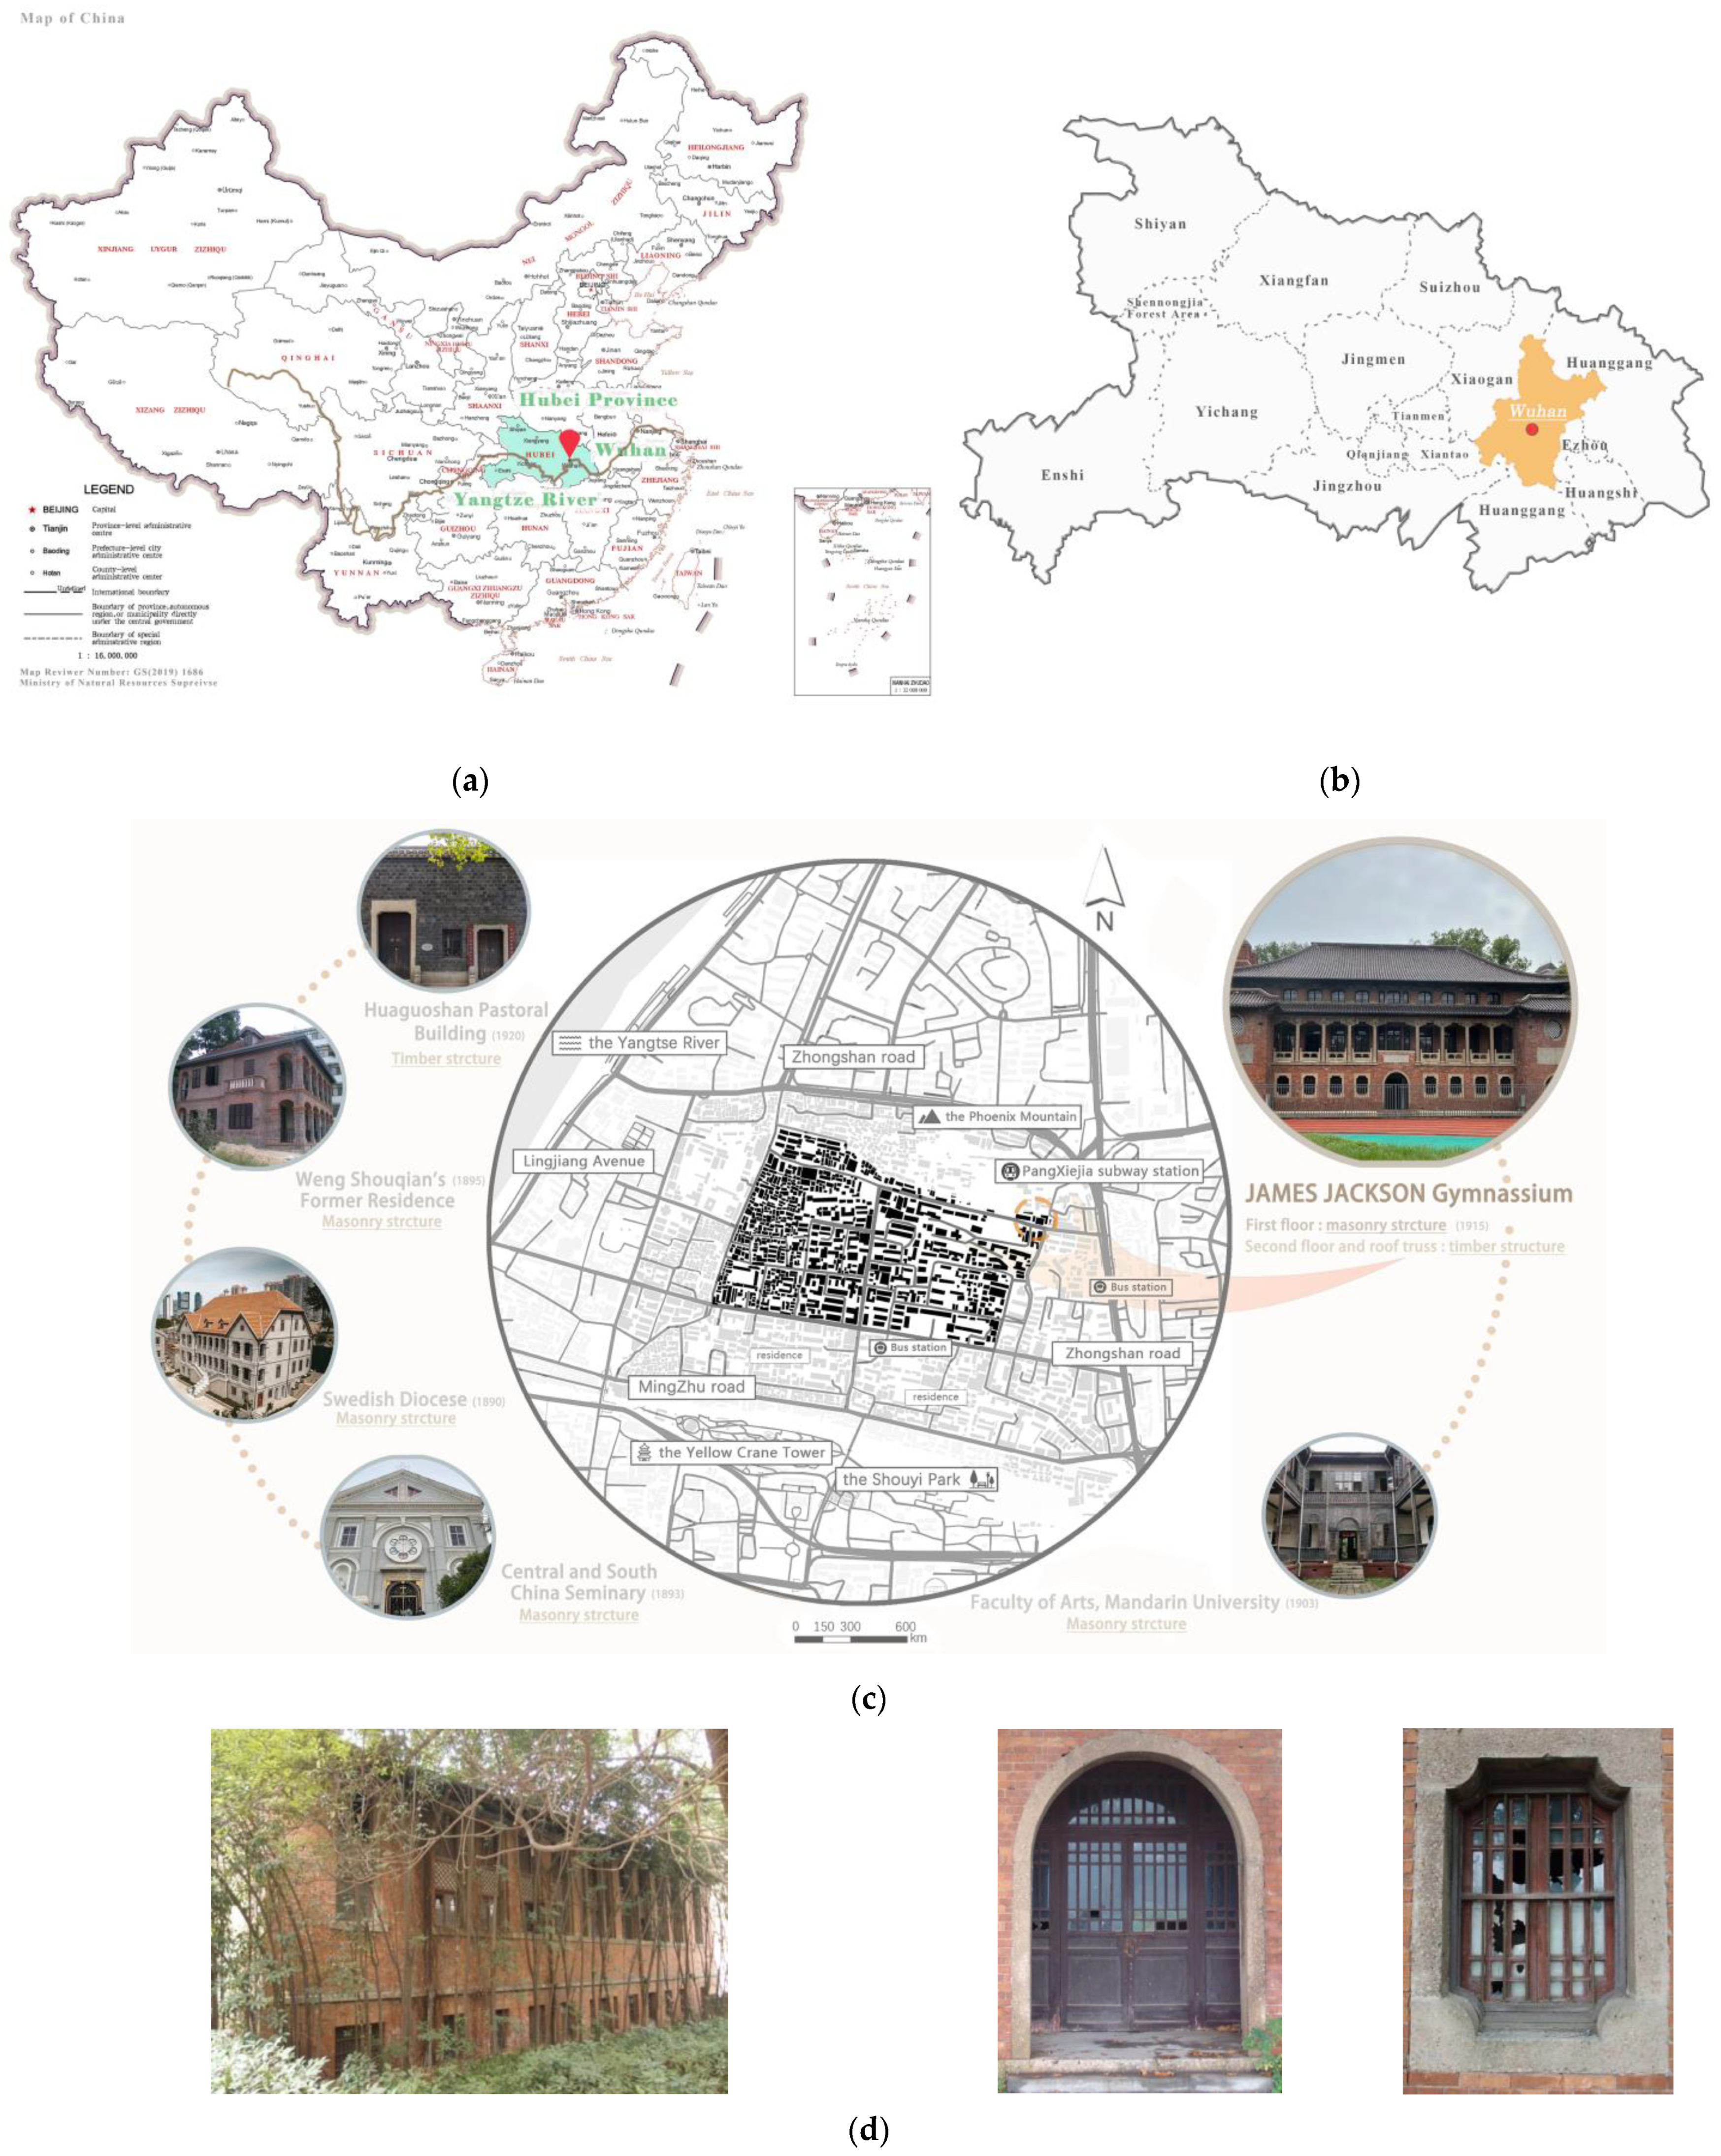
2.1. Materials

Study Area

Wuhan, situated centrally within Hubei Province in China, is located in close proximity to the Yangtze River and is easily accessible through a well-developed transportation network (Figure 1a,b). Since the establishment of Hankou in 1861, Wuhan emerged as a significant hub for missionary activities, attracting numerous churches and scholars who established schools in the region. Additionally, the Western Church introduced innovative educational approaches and architectural styles to Wuhan. Notably, Tanhualin Historic Street (Figure 1c) stands out as an ancient neighborhood with the richest history and cultural heritage in Wuhan [20,21]. This area is recognized as the birthplace of China’s first library and served as a pivotal hub for modern education in the country.
In addition, James Jackson Gymnasium, located in the Tanhualin Historic District, was constructed in November 1921. It stands as one of the oldest university buildings in Wuhan and served as the earliest indoor fitness center in China. This gymnasium holds significance as a representative educational architectural heritage within the Tanhualin Historic District [21,22]. James Jackson Gymnasium features a modern style, combining Western-style masonry–timber mixed structure walls with a Chinese-style double-eaved roof. This unique blend of architectural influences makes it a valuable subject for historical research as a prime example of Chinese–Western combination building.

2.2. Methods

2.2.1. Research Methods

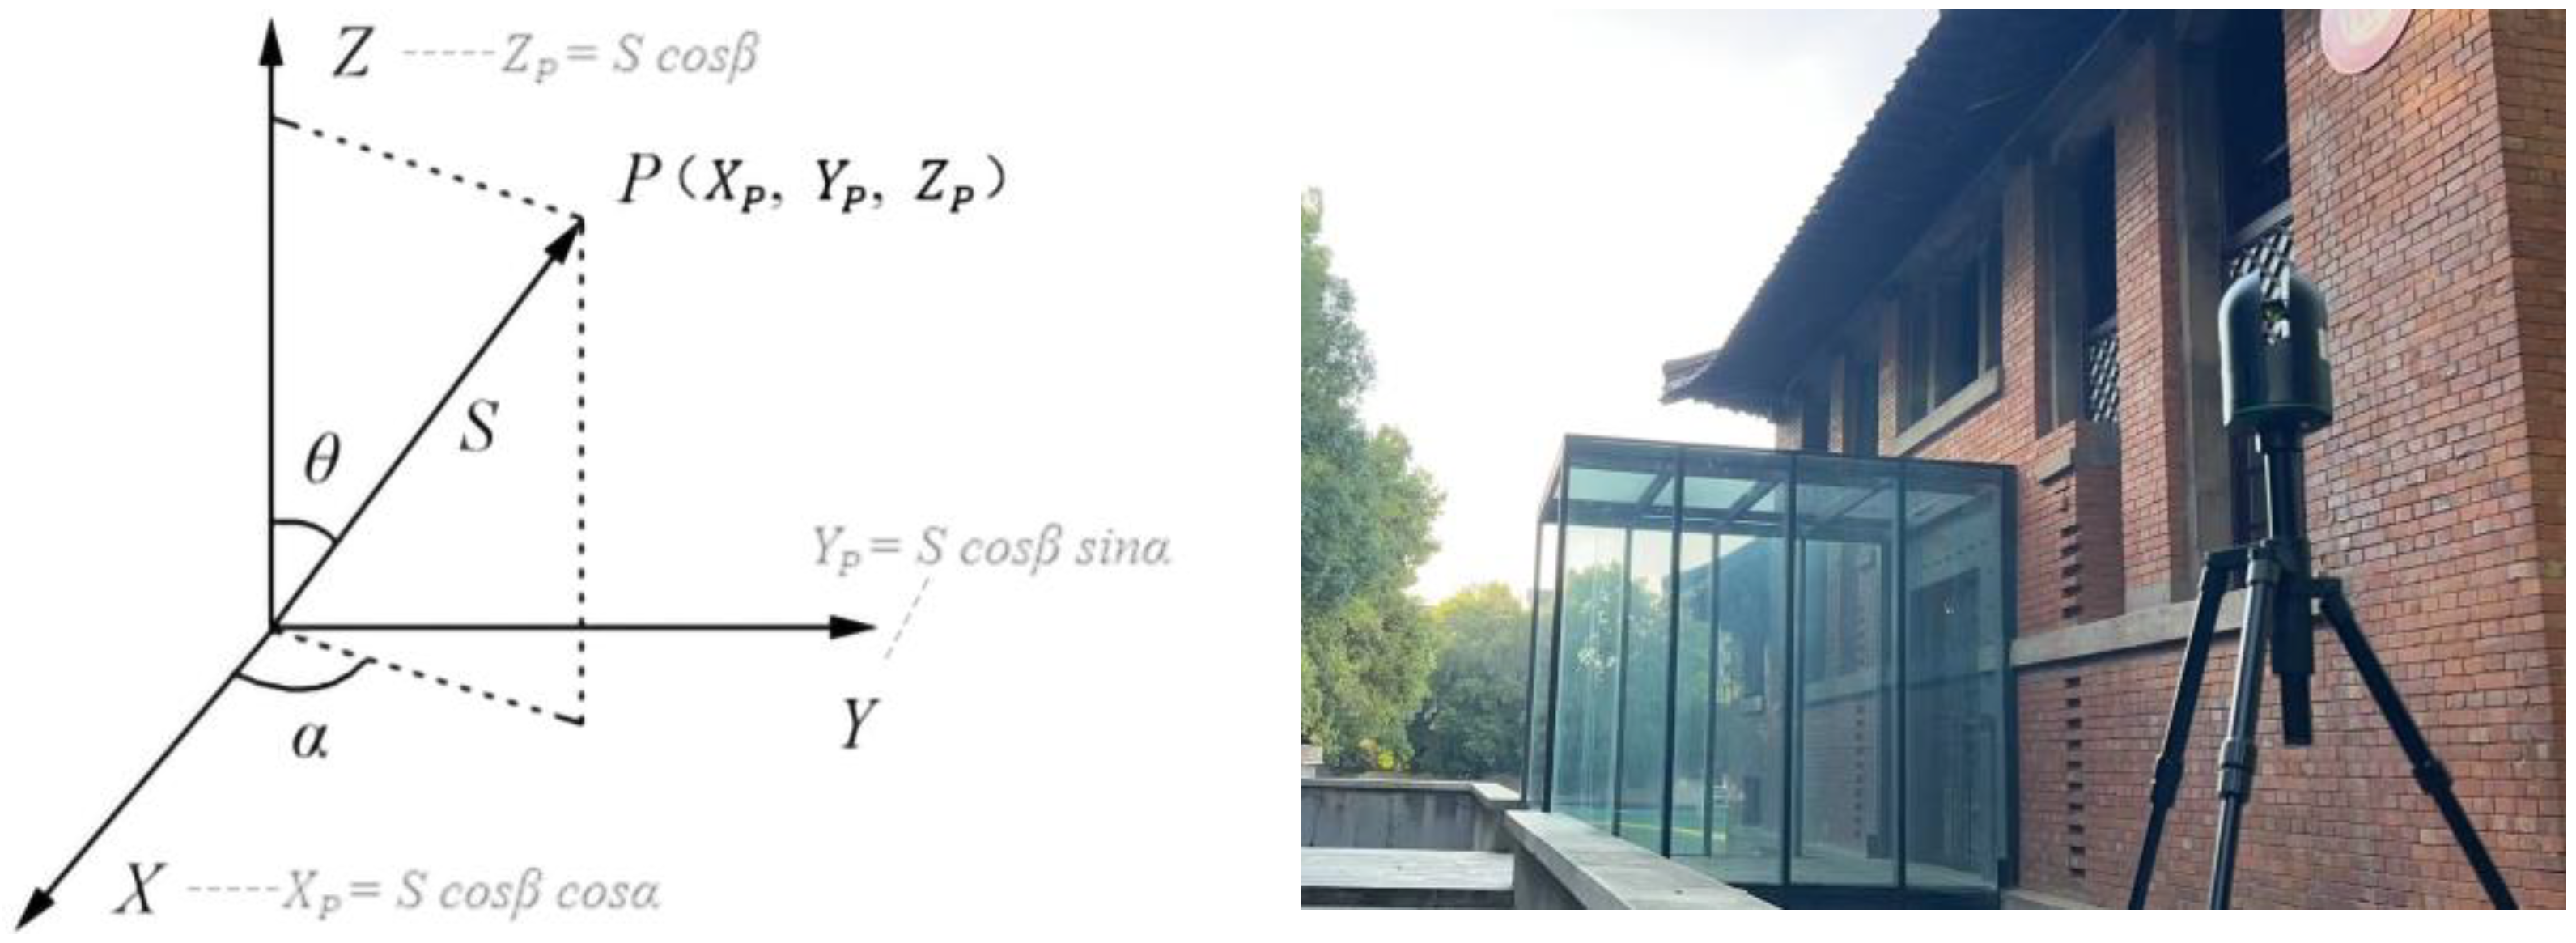
  • Three-dimensional Laser Scanning
Three-dimensional laser scanning is an automated, non-contact, high-precision stereo scanning technology (Figure 2). It serves as an extremely efficient method for acquiring initial data in architectural heritage studies, with three-dimensional scanning stations strategically positioned for field data collection. These stations conduct an omni-directional scan along the X–Y–Z axes of the target building, resulting in the capture of millions of image data points [23]. Subsequently, computer processing involves using overlaps in images as references to generate panoramic images and aid in the verification of the point cloud data model in later stages [24].
This study uses the Leica BLK 360 G1 3D laser scanner, laser wavelength 830 nm; scanning range 0.6–60 m; ranging accuracy 4 mm @ 10 m/7 mm @ 20 m; point cloud accuracy 6 mm @ 10 m/8 mm @ 20 m. Using WFD waveform digitization technology and HDR image technology, three-dimensional space point cloud information and 360° panoramic images can be quickly obtained within 3 min.
The operational principle of a three-dimensional laser scanner is such that a laser pulse signal is emitted from the transmitter, striking the object surface for diffuse reflection before eventually returning to the receiver along a nearly identical path. This process allows for the calculation of the distance S between the target point P and the scanner. Concurrently, an encoder monitors and synchronously measures the transverse scanning angle observation value α and the longitudinal scanning angle observation value β for each laser pulse. The measurement system of 3D laser scanning utilizes a specialized coordinate system, with the X-axis situated in the transverse scanning plane, the Y-axis perpendicular to the X-axis in said plane, and the Z-axis perpendicular to the transverse scanning plane. Following the scanning procedure, target points P ( X P , Y P , Z P ) (Figure 2) are computed according to Formula (1), resulting in the final scanning data through the collective contribution of numerous target points [25,26]. This dataset not only encompasses the three-dimensional coordinates along the X, Y, and Z axes of each point but also includes color information denoted by R, G, and B values alongside the reflectivity of each point. These comprehensive and high-precision datasets serve as a factual foundation and robust research support for identifying structural issues like pathology-induced cracks’ architectural heritage.
In the scanning process, a total of 282 high-precision two-dimensional images were captured of James Jackson Gymnasium. However, only 270 of these images were deemed effective for further analysis due to weather conditions, angles, and equipment-related factors.
X P =   S   cos   β cos   α ,   Y P =   S   cos   β sin   α ,   Z P   =   S   cos   β
2.
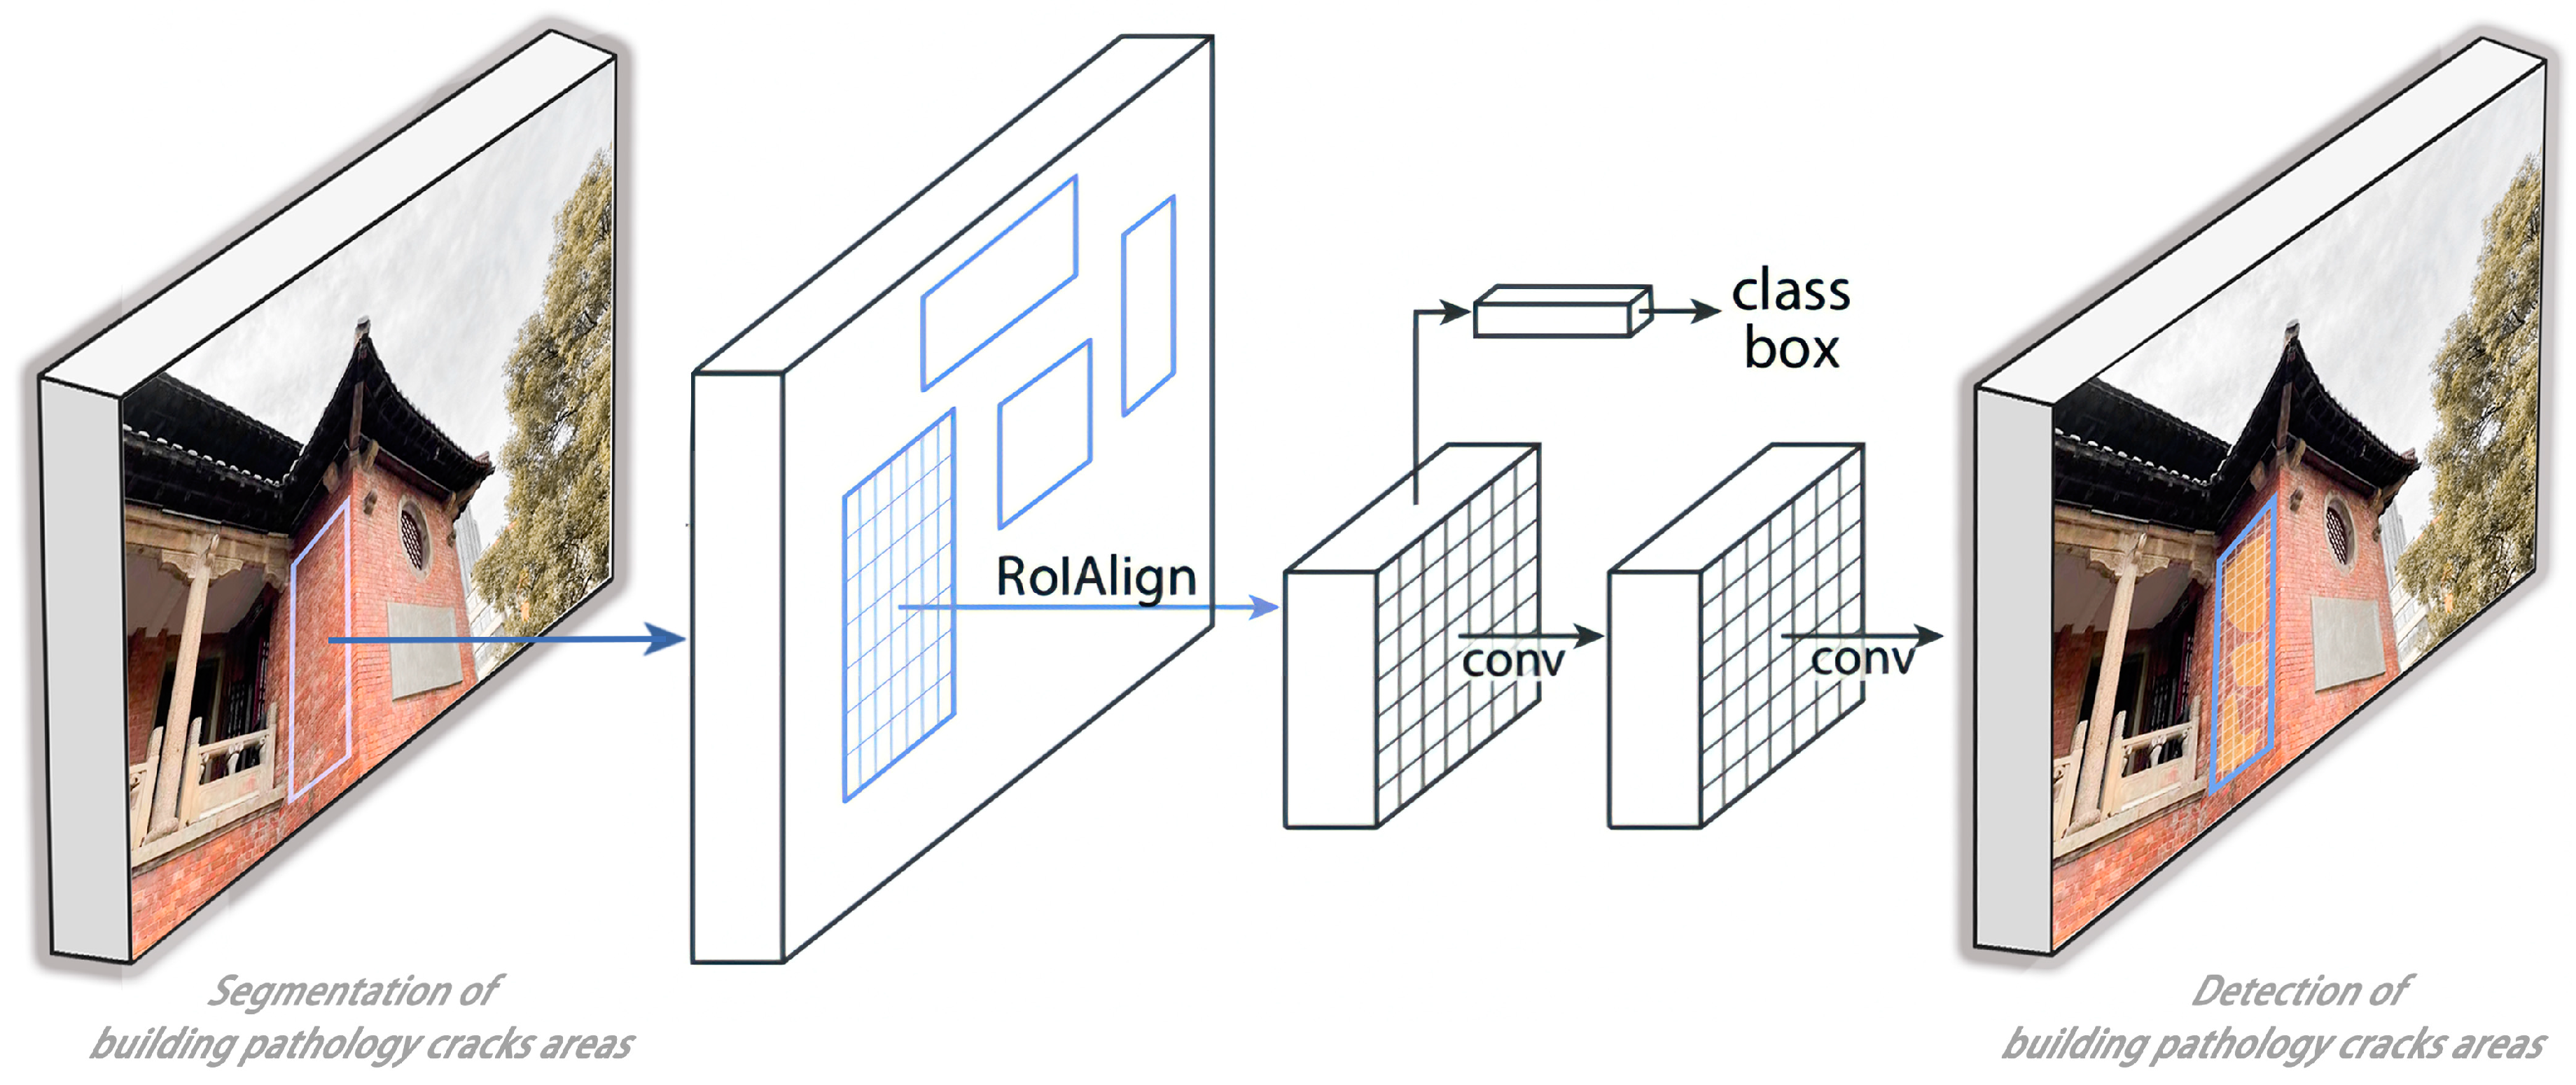
Pathology crack area detection model based on Mask R-CNN
Mask R-CNN is a deep learning model based on a regional convolutional neural network (RCNN) [27,28]. It works by generating candidate regions from the image, extracting features, classifying the features, and refining the location of candidate regions. The Mask R-CNN network consists of four main components: (1) basic convolution layer; (2) Region Proposal Network (RPN); (3) RoI Align; (4) detection layer [29]. The Mask R-CNN model follows a two-stage framework. In the first stage, candidate regions are generated by scanning the image. In the second stage, classification results and bounding boxes are obtained based on the candidate regions. Additionally, a segmentation branch is incorporated into the original Faster RCNN model to produce mask results, thus decoupling the relationship between mask and category prediction (Figure 3).
Mask R-CNN demonstrates high performance in object detection tasks [30]. In our study, we trained this model to accurately locate, segment, and classify wall surfaces, capturing spatial features in images and providing precise pixel-level information about the target. Therefore, the pathology crack detection model based on the Mask R-CNN deep learning model can segment areas suspected of pathology cracks in two-dimensional images and conduct crack detection in these segmented areas, effectively completing tasks related to the accurate detection of building surfaces and structures in crack-prone areas. Ultimately, a total of 408 crack areas were identified during the detection of James Jackson Gymnasium pathology crack areas, including 253 instances of repeated crack areas, with 155 effective pathology crack detection areas ultimately identified.
3.
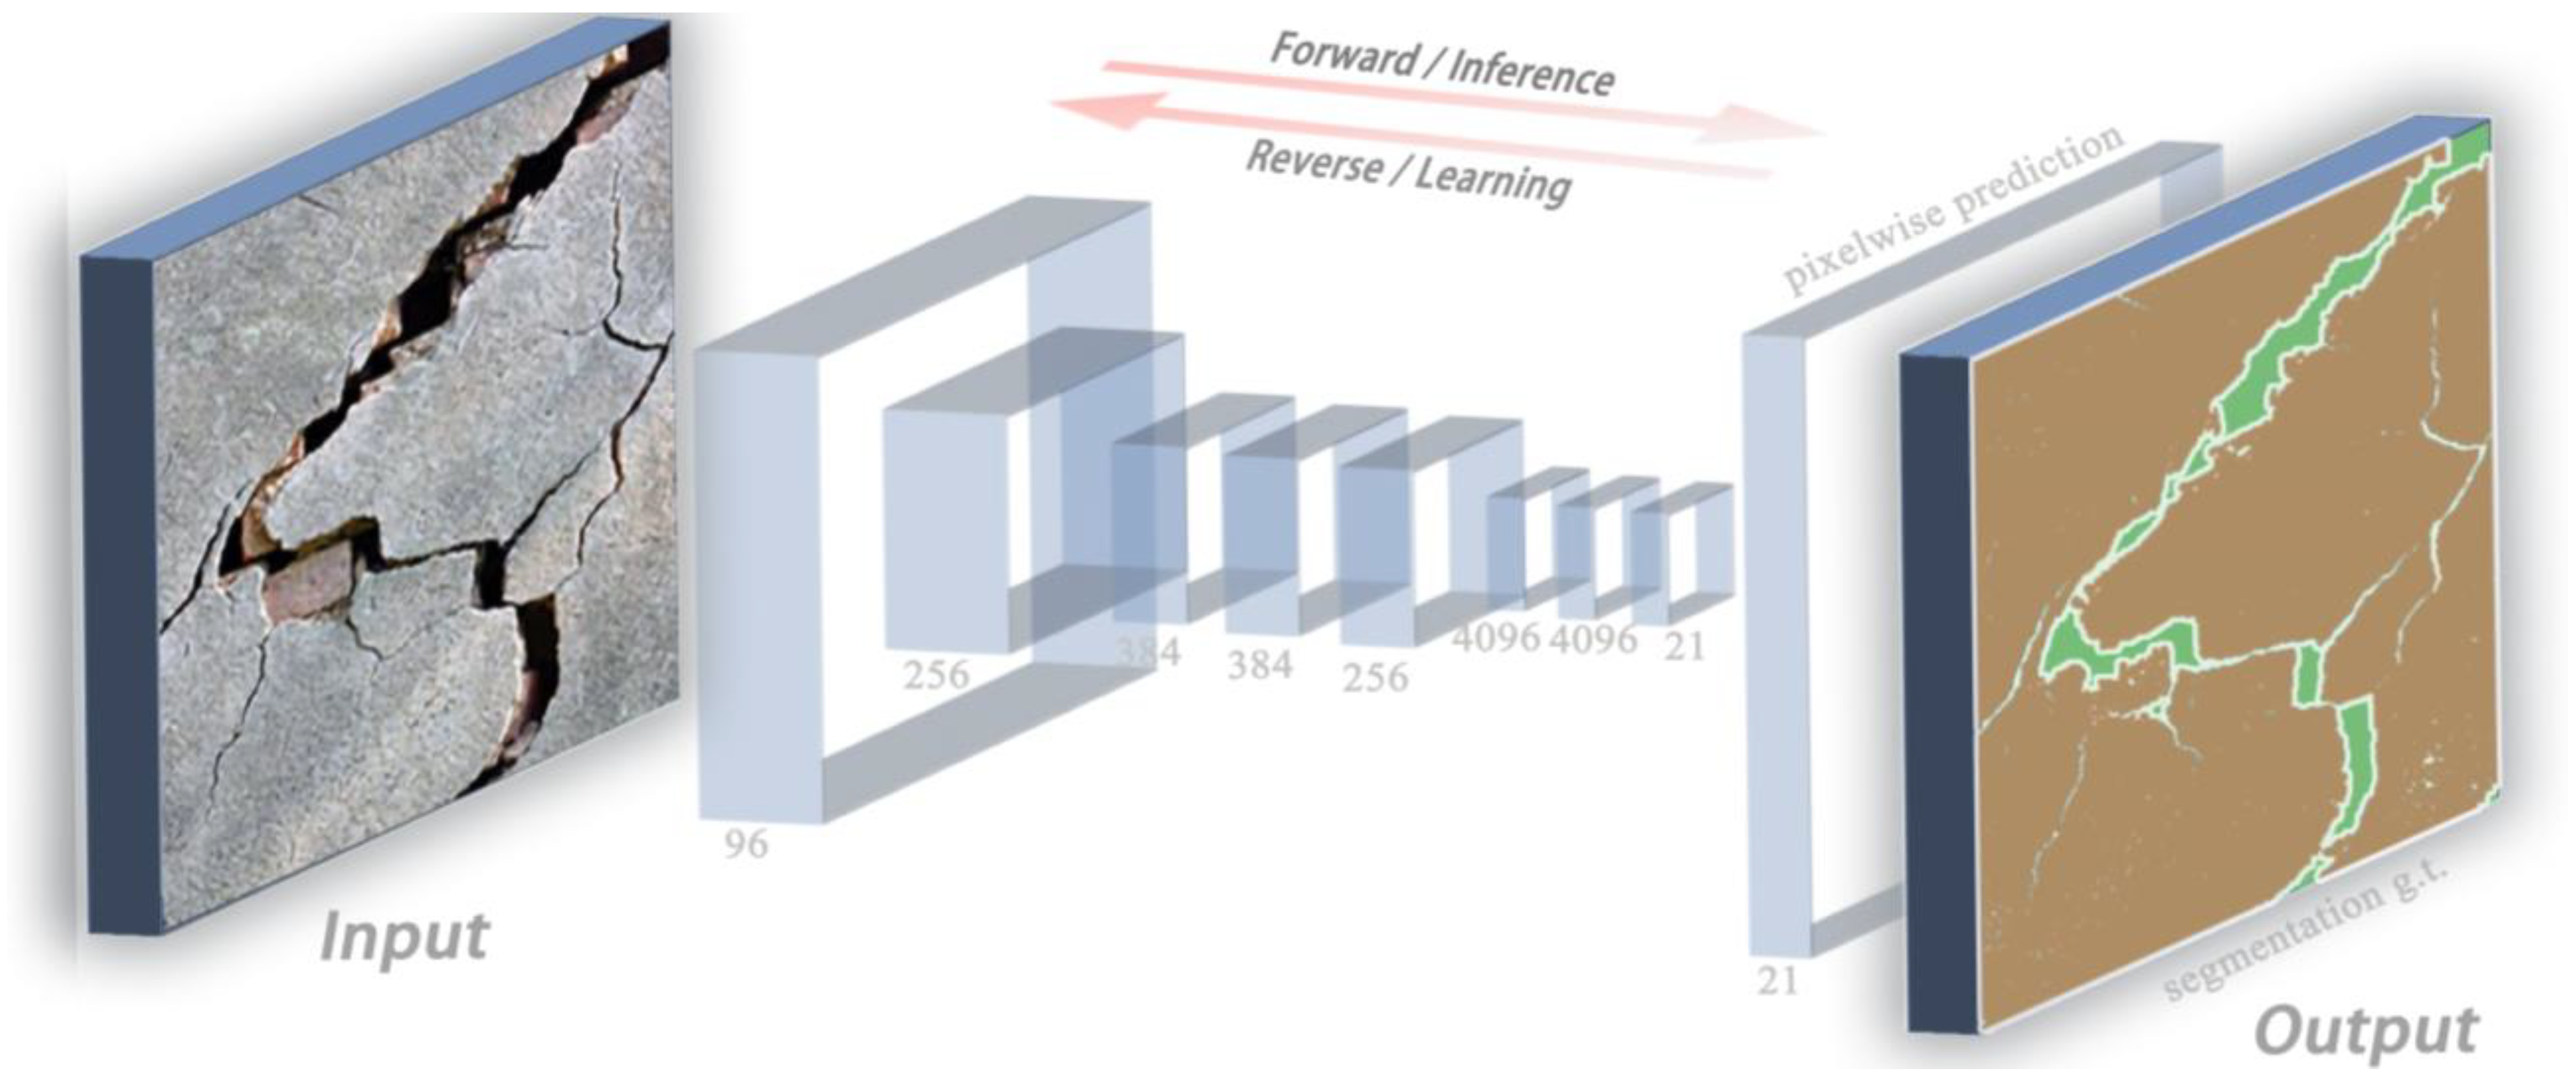
Identification and calculation model of single pathology cracks based on FCN
FCN (Fully Convolutional Neural Network) is an enhanced form of convolutional neural network (CNN) that transforms the fully connected layer found in traditional CNNs into a convolutional layer. This modification allows the network to process input images of various sizes and generate classification maps that match the original input size [31,32]. The FCN network architecture consists of convolutional layers, pooling layers, and upsampling layers. Convolutional and pooling layers are responsible for extracting features, while the upsampling layer restores the feature map to the original input image resolution for precise pixel-level classification. This capability makes the FCN model ideal for tasks involving pixel-level image interpretation [33], such as image segmentation, target detection, and scene parsing [34] (Figure 4).
In this study, the model was trained to identify crack areas detected by the Mask R-CNN model, categorize the types of cracks present in each building pathology, and calculate their length, width, and area. This approach enables comprehensive monitoring of building pathology cracks, from detection and identification to dimension calculation, and provides data to support tailored repair strategies. With artificial intelligence assistance, traditional manual surveys’ long cycle, low precision, low efficiency, and limited scope of research errors can be effectively avoided.

2.2.2. Research Framework

Based on 3D laser scanning and deep learning models, this paper proposes a research system for pathology crack analysis of architectural heritage structures made of timber and brick. The system includes data acquisition, regional detection, single-crack identification and calculation, as well as a targeted hierarchical restoration strategy. The regional crack detection model and the single-crack identification and calculation model for masonry and timber structures have been successfully developed in this study. The results of these models have been optimized and retrained. Additionally, a pathology crack hierarchical restoration strategy table has been created, and a detection and restoration system for masonry–timber architectural heritage has been established.
Finally, using James Jackson Gymnasium in Wuhan as a case study, the architectural geometry information was captured using 3D laser scanning. This enabled the detection of pathology crack areas, as well as the identification and calculation of individual cracks. Subsequently, a targeted hierarchical restoration strategy was developed based on the identification results. The methodology presented in this study is illustrated in Figure 5.

3. Results and Discussion

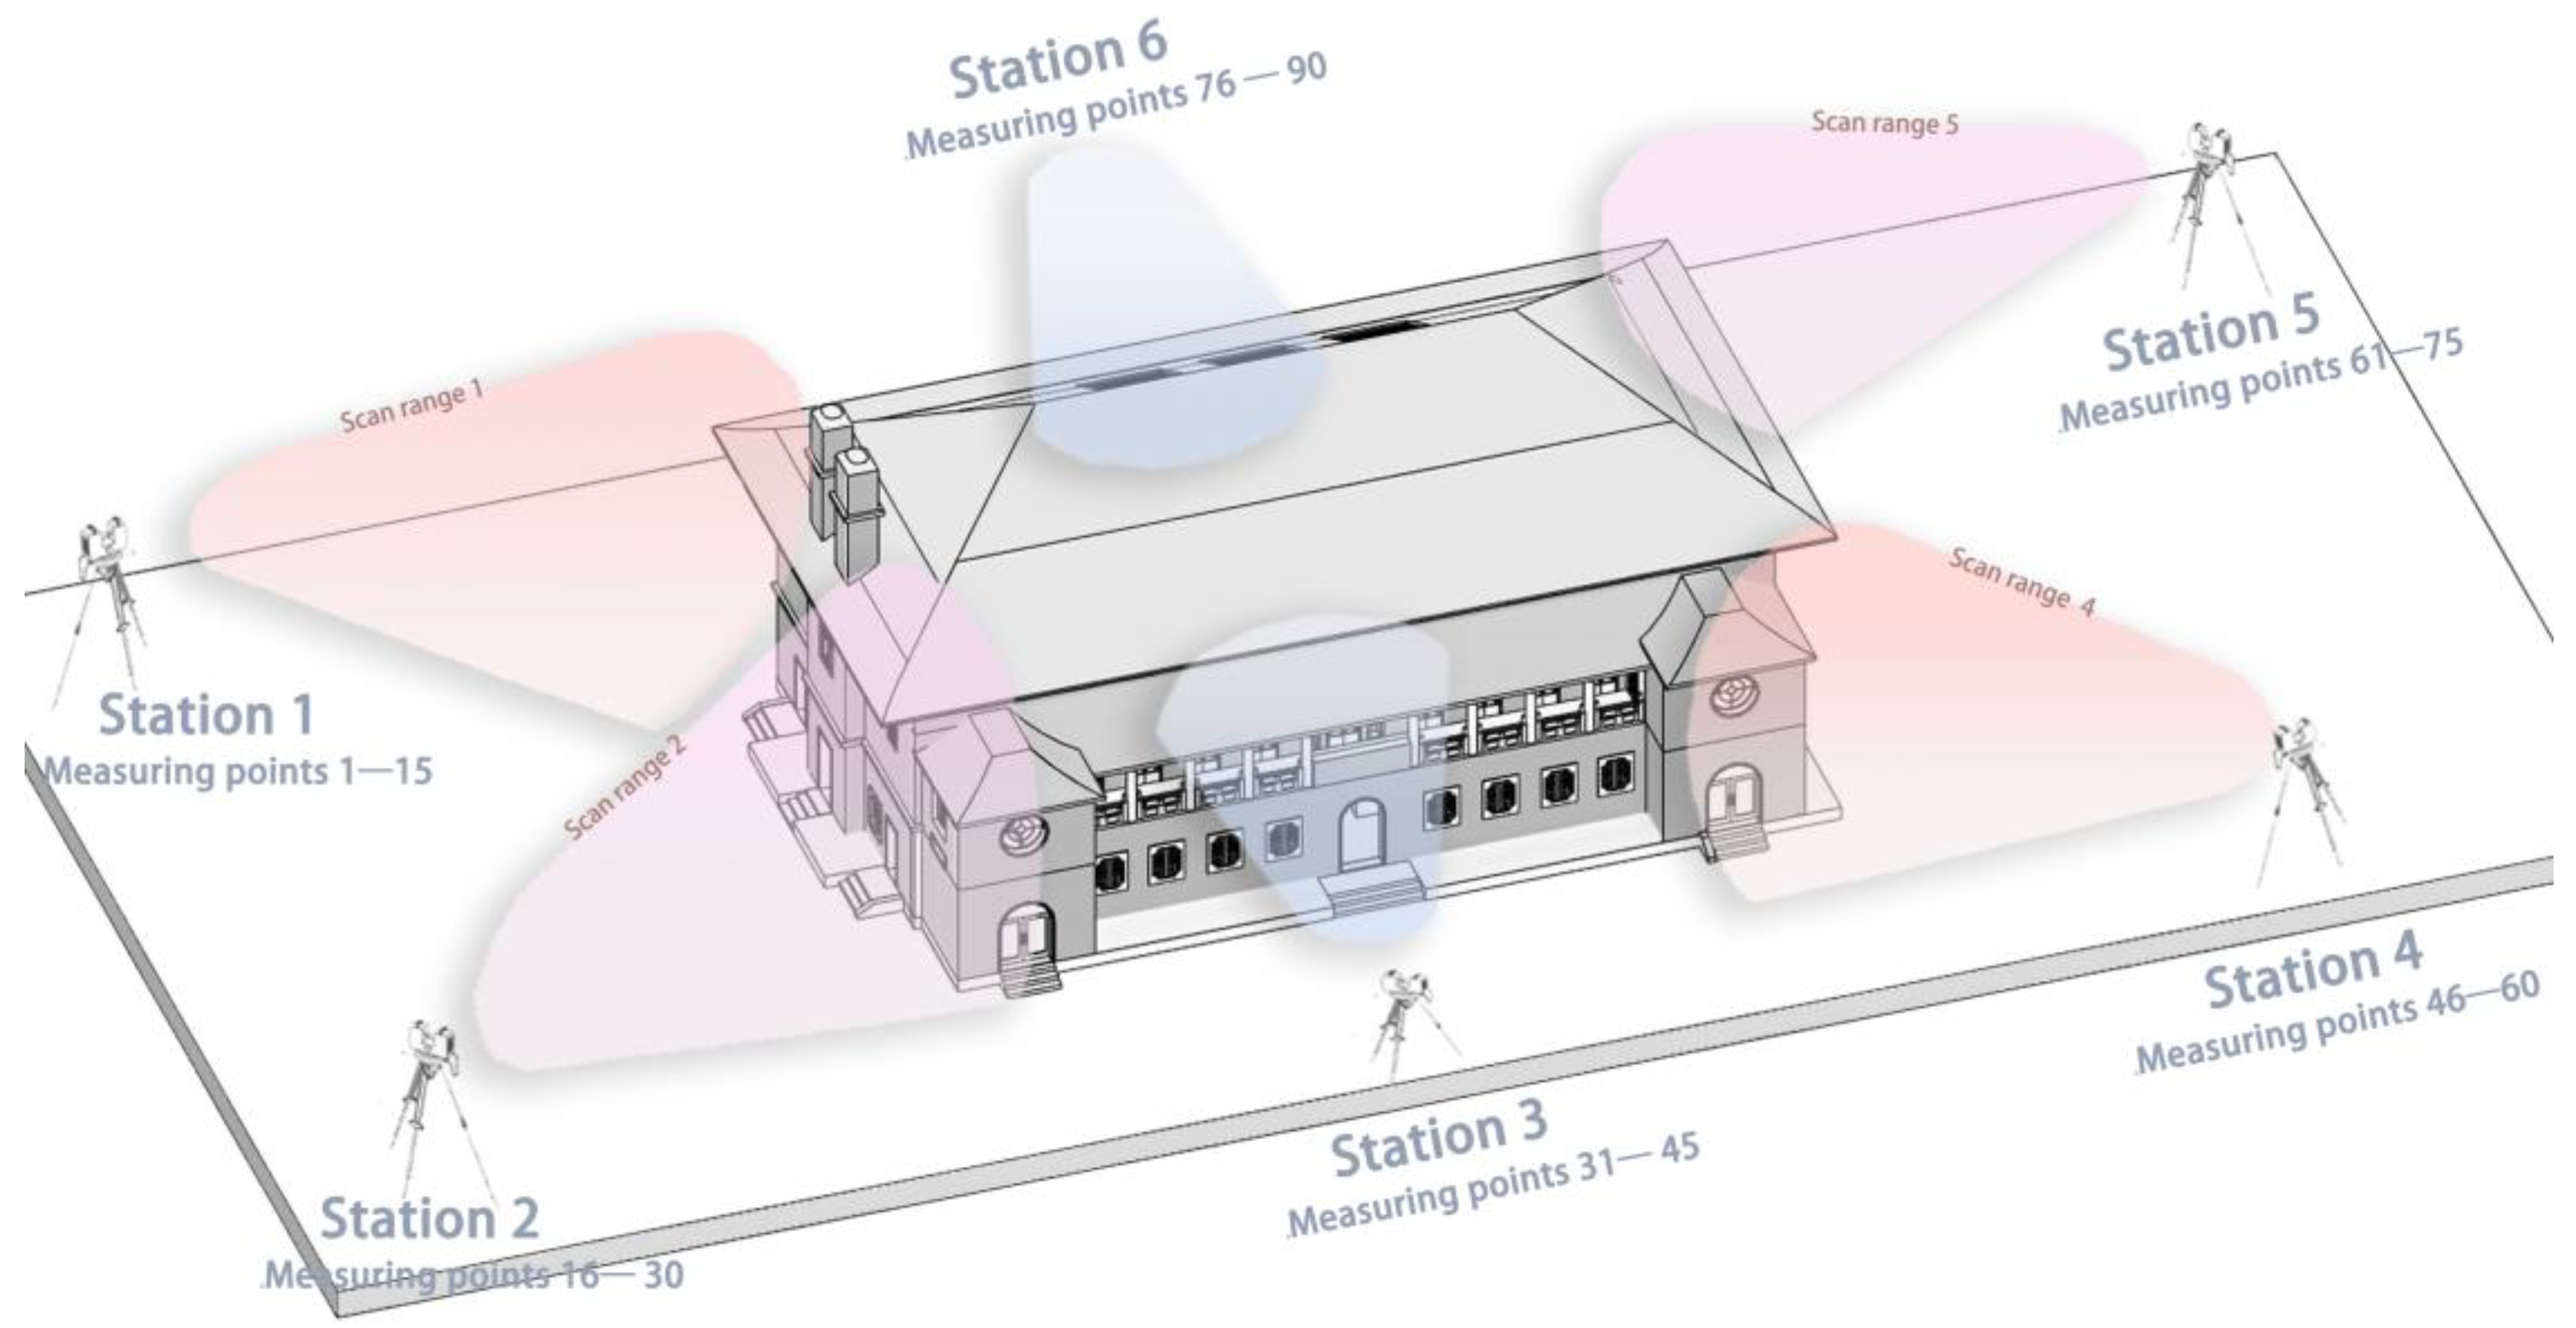
3.1. Using 3D Laser Scanning to Obtain High-Precision Images of James Jackson Gymnasium

3.1.1. Setting of Measuring Points and Layout of Measuring Stations

The study uses the Leica BLK 360 G1 3D laser scanner, laser wavelength 830 nm; scanning range 0.6–60 m; ranging accuracy 4 mm @ 10 m/7 mm @ 20 m; point cloud accuracy 6 mm @ 10 m/8 mm @ 20 m. On 19 September 2023, we conducted 3D laser scanning in James Jackson Gymnasium to obtain laser point cloud data. Supplementary mapping was also carried out on 11, 12, and 15 October.
According to measurements, the architectural heritage James Jackson Gymnasium has dimensions of 30,854 m in the north–south direction, 17,452 m in the east–west direction, a height of 13,950 m, and a circumference of 96,612 m. The perimeter of the gymnasium is divided into six equidistant stations, spaced 16 m apart, with each station containing 15 measuring points [35], resulting in a total of 90 measuring points (Figure 6). This division allows for high-precision 3D laser scanning to be conducted on the entirety of James Jackson Gymnasium [35,36].

3.1.2. Field Scanning to Obtain High-Precision Images of Millions of Orders of Magnitude

During the scanning process, there are a limited number of feature objects in two adjacent stations. To enhance the accuracy of images and the mosaic accuracy of point cloud data models, it is essential to artificially place targets as feature objects [36]. These targets serve as boundary points and matching points for scanning in different areas [37]. The placement of these added targets must adhere to the following criteria: (1) uniform and equidistant placement within the scanning range of the 3D laser scanner; (2) in cases where the distinguishing features of different measuring points in the same station are not prominent, each measuring point should have no fewer than four targets, with at least three common targets between two adjacent measuring points; (3) prominent feature points of ground objects can be utilized as targets for different measuring points.
Through high-precision and omni-directional 3D laser field scanning, millions of image data points of James Jackson Gymnasium were captured, resulting in the creation of highly accurate real 2D images through integration of the 3D laser scanner [38,39,40]. Further, the real panorama of James Jackson Gymnasium (Figure 7) was produced by computer-aided splicing of features such as targets as reference points. A total of 282 high-precision two-dimensional images of James Jackson Gymnasium were generated during scanning, with 270 effective two-dimensional images obtained, accounting for factors such as weather, angle, and equipment limitations. These detailed and high-precision real image data of James Jackson Gymnasium serve as valuable support for future identification and study of structural issues.

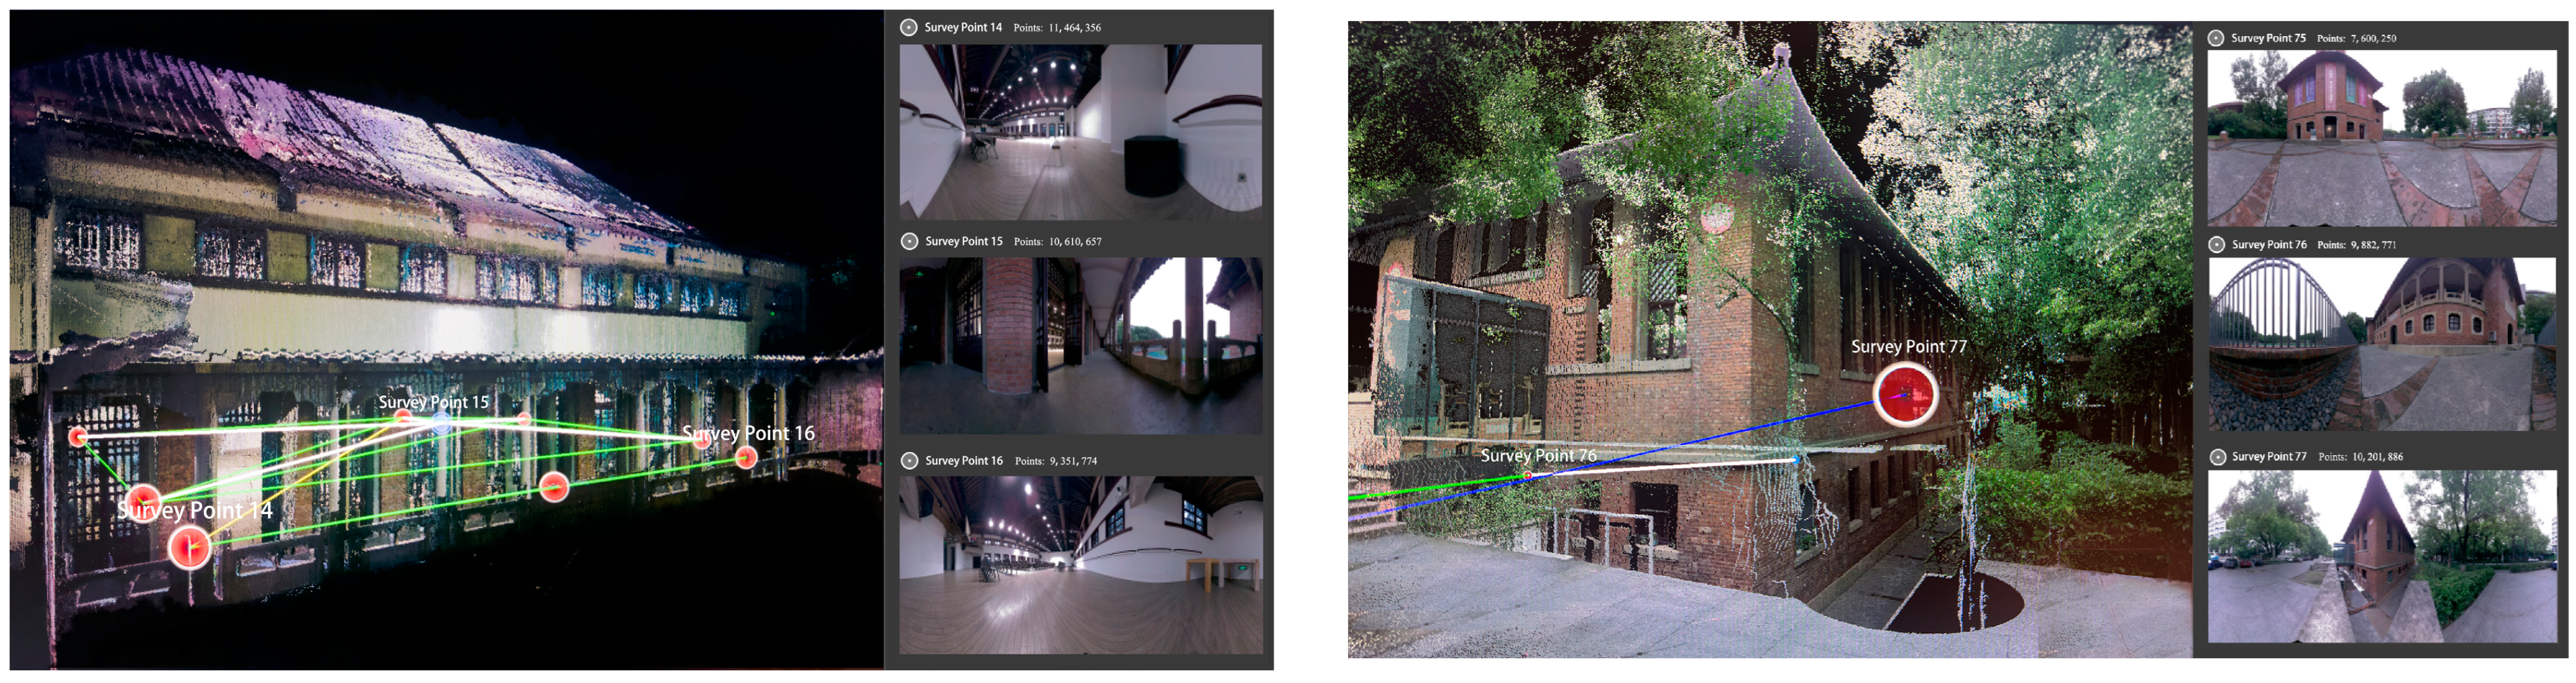
3.1.3. Build Point Cloud Model to Assist Post-Calibration

During the James Jackson Gymnasium 3D laser scanning, six stations were set up, each consisting of 15 measuring points, totaling 90 measuring points. The measuring points accumulated a total of 986,258,832 point cloud data points, with an average of 10,600,000 point cloud data points per measuring point (Figure 8). Furthermore, the scanned scattered point cloud data from the 90 measuring points were integrated with the same characteristics as the target using a computer, resulting in a complete cluster of 90 point cloud data. Subsequently, the adjacent point cloud data clusters were stitched together [41] to form a comprehensive point cloud data model [42,43], aiding in the calibration of pathology cracks in the later stages. Additionally, based on the assembled point cloud data model, the external and internal building components of James Jackson Gymnasium were inventoried.
Lastly, given that doors and windows are the most vulnerable areas to pathology cracks in masonry–timber architectural heritage [43], we created the James Jackson Gymnasium Doors and Windows Details Database (Table 1 and Table 2) to ensure no overlooks in subsequent crack detection, identification, calculation, and repair strategies. This initiative aims to enhance the completeness and relevance of repair strategies.

3.2. Construction of Pathology Crack Area Detection Model of Architectural Heritage Based on Mask R-CNN

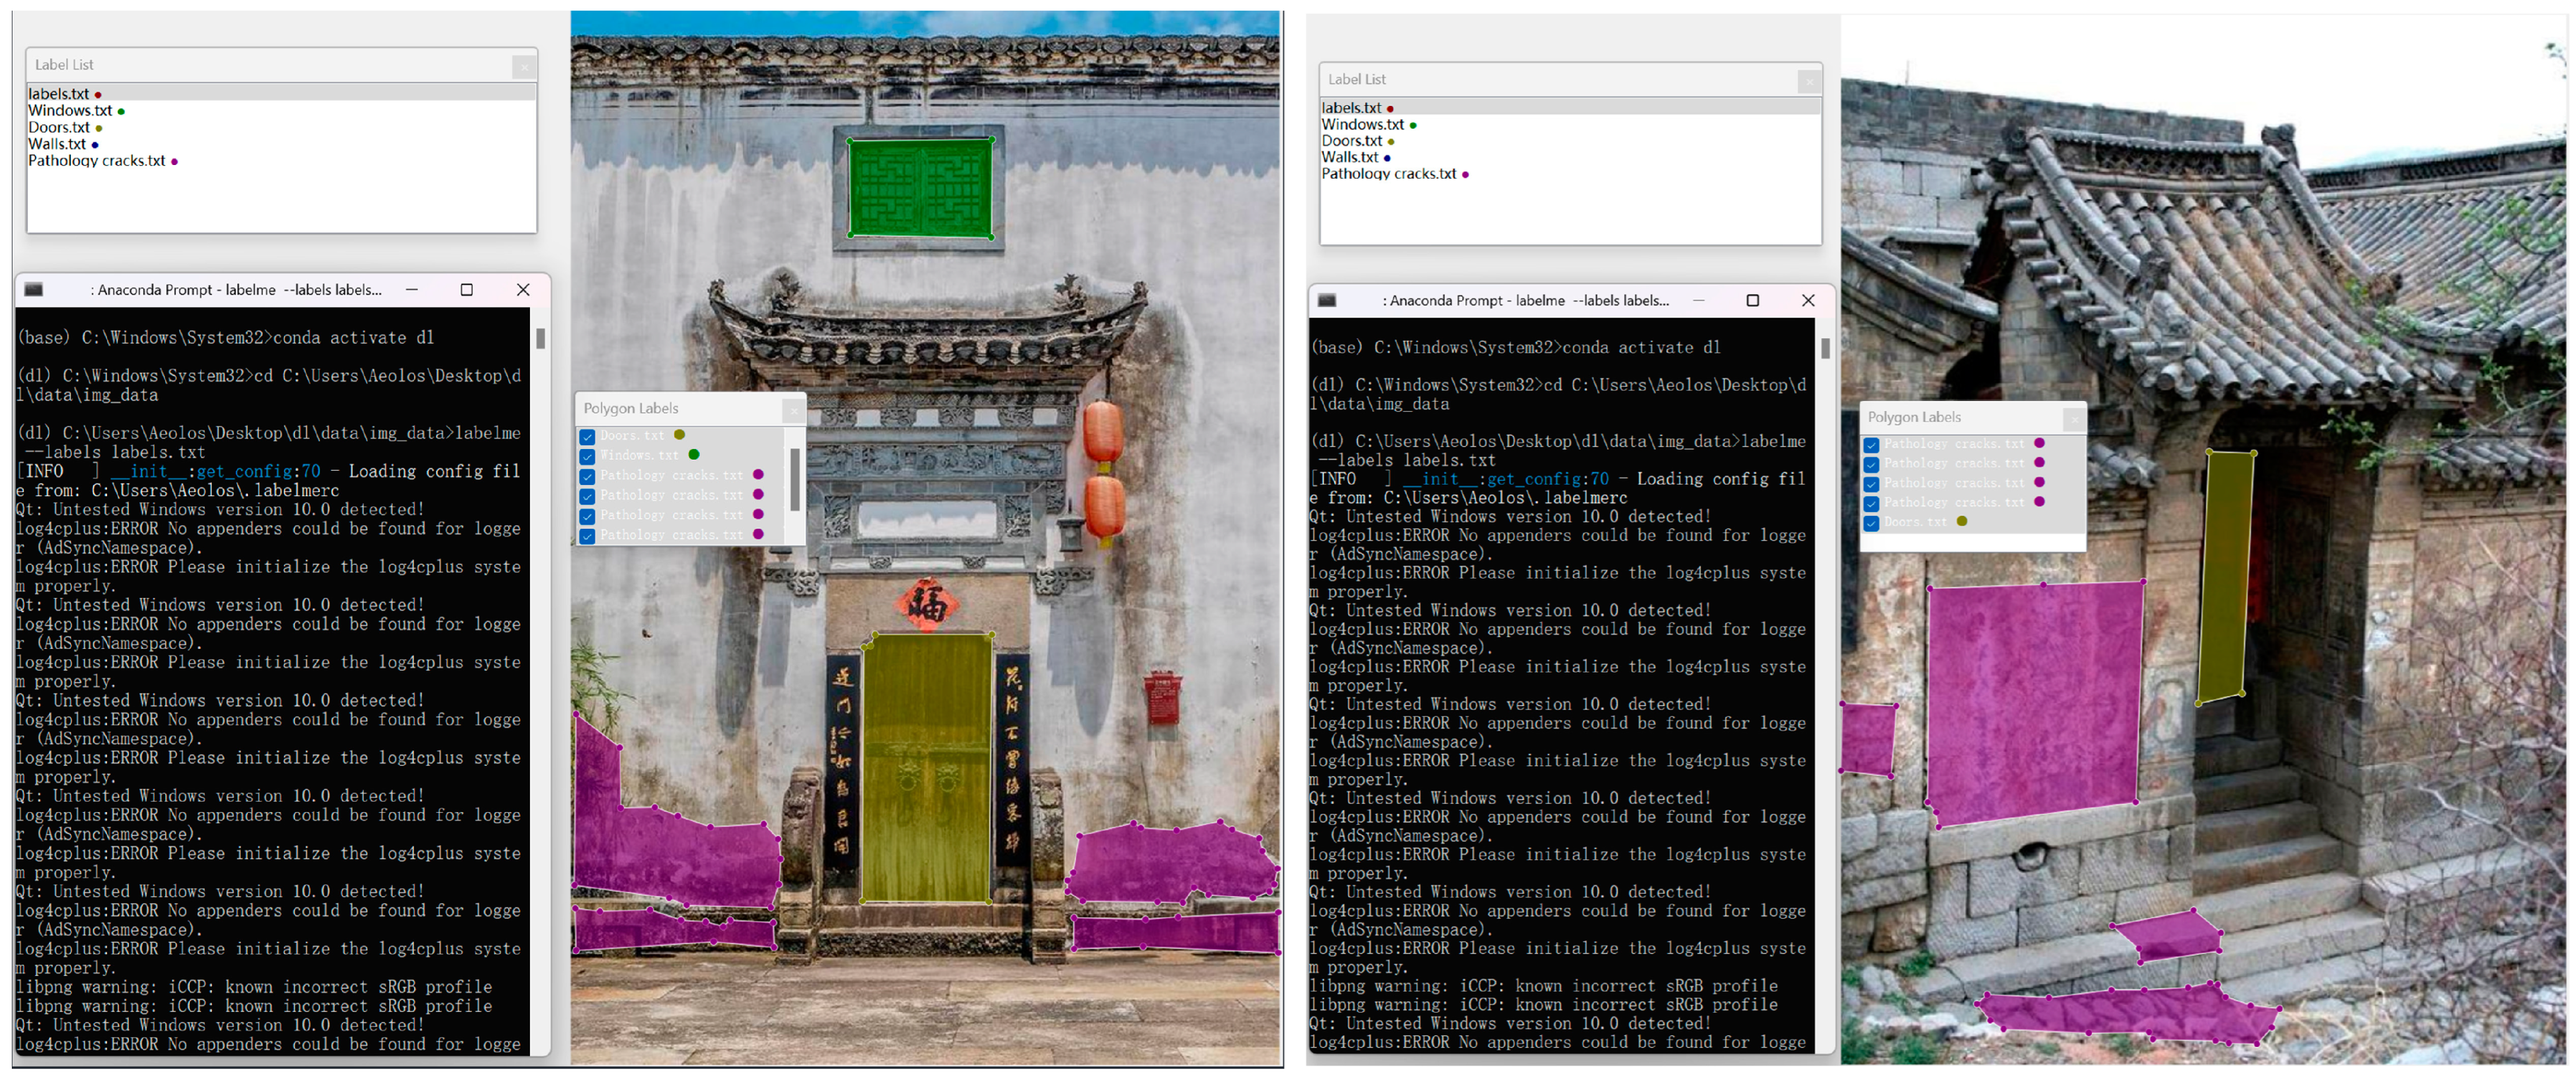
3.2.1. Pathology Cracks Training Set for Labeling Architectural Heritage

The first aspect is to create a conda virtual environment, to create an environment named labelme_env, python version 3.8; for example, conda create -n labelme_env python = 3.8. After the creation is completed, enter the new environment: conda activate labelme_env. Second, install labelme, directly using pip to install: pip install labelme pip install pycocotools-windows.
Finally, after the installation is completed, enter “labelme”at the terminal to start labelme. The labeled image (Figure 9) will serve as input data for the neural network, providing guidance for deep learning algorithms to classify various components such as cracks, doors, windows, and other architectural elements in heritage structures. In the initial image screening process, selection of masonry–timber structure architectural heritages from different countries and regions occurred to enhance the relevance of the subsequent training model for recognizing cracks in such structures. Subsequently, a total of 500 valid images were labeled as the training dataset for detecting pathology cracks in masonry–timber structures of architectural heritage [44].

3.2.2. Training Pathology Crack Area Detection Model and Optimization of Results

The prepared training set of architectural heritage pathology cracks was annotated in COCO format. Each image corresponds to a JSON file, which contains information such as image path, category, bounding box, and instance segmentation mask. Use torchvision transforms for data conversion and enhancement. At the same time, a Mask R-CNN model was created and the classifier and masking bits were modified as needed [45]. Finally, create a data loader and optimizer and perform data iteration, performing forward propagation, calculating loss, backpropagation, and optimization on each batch [46].

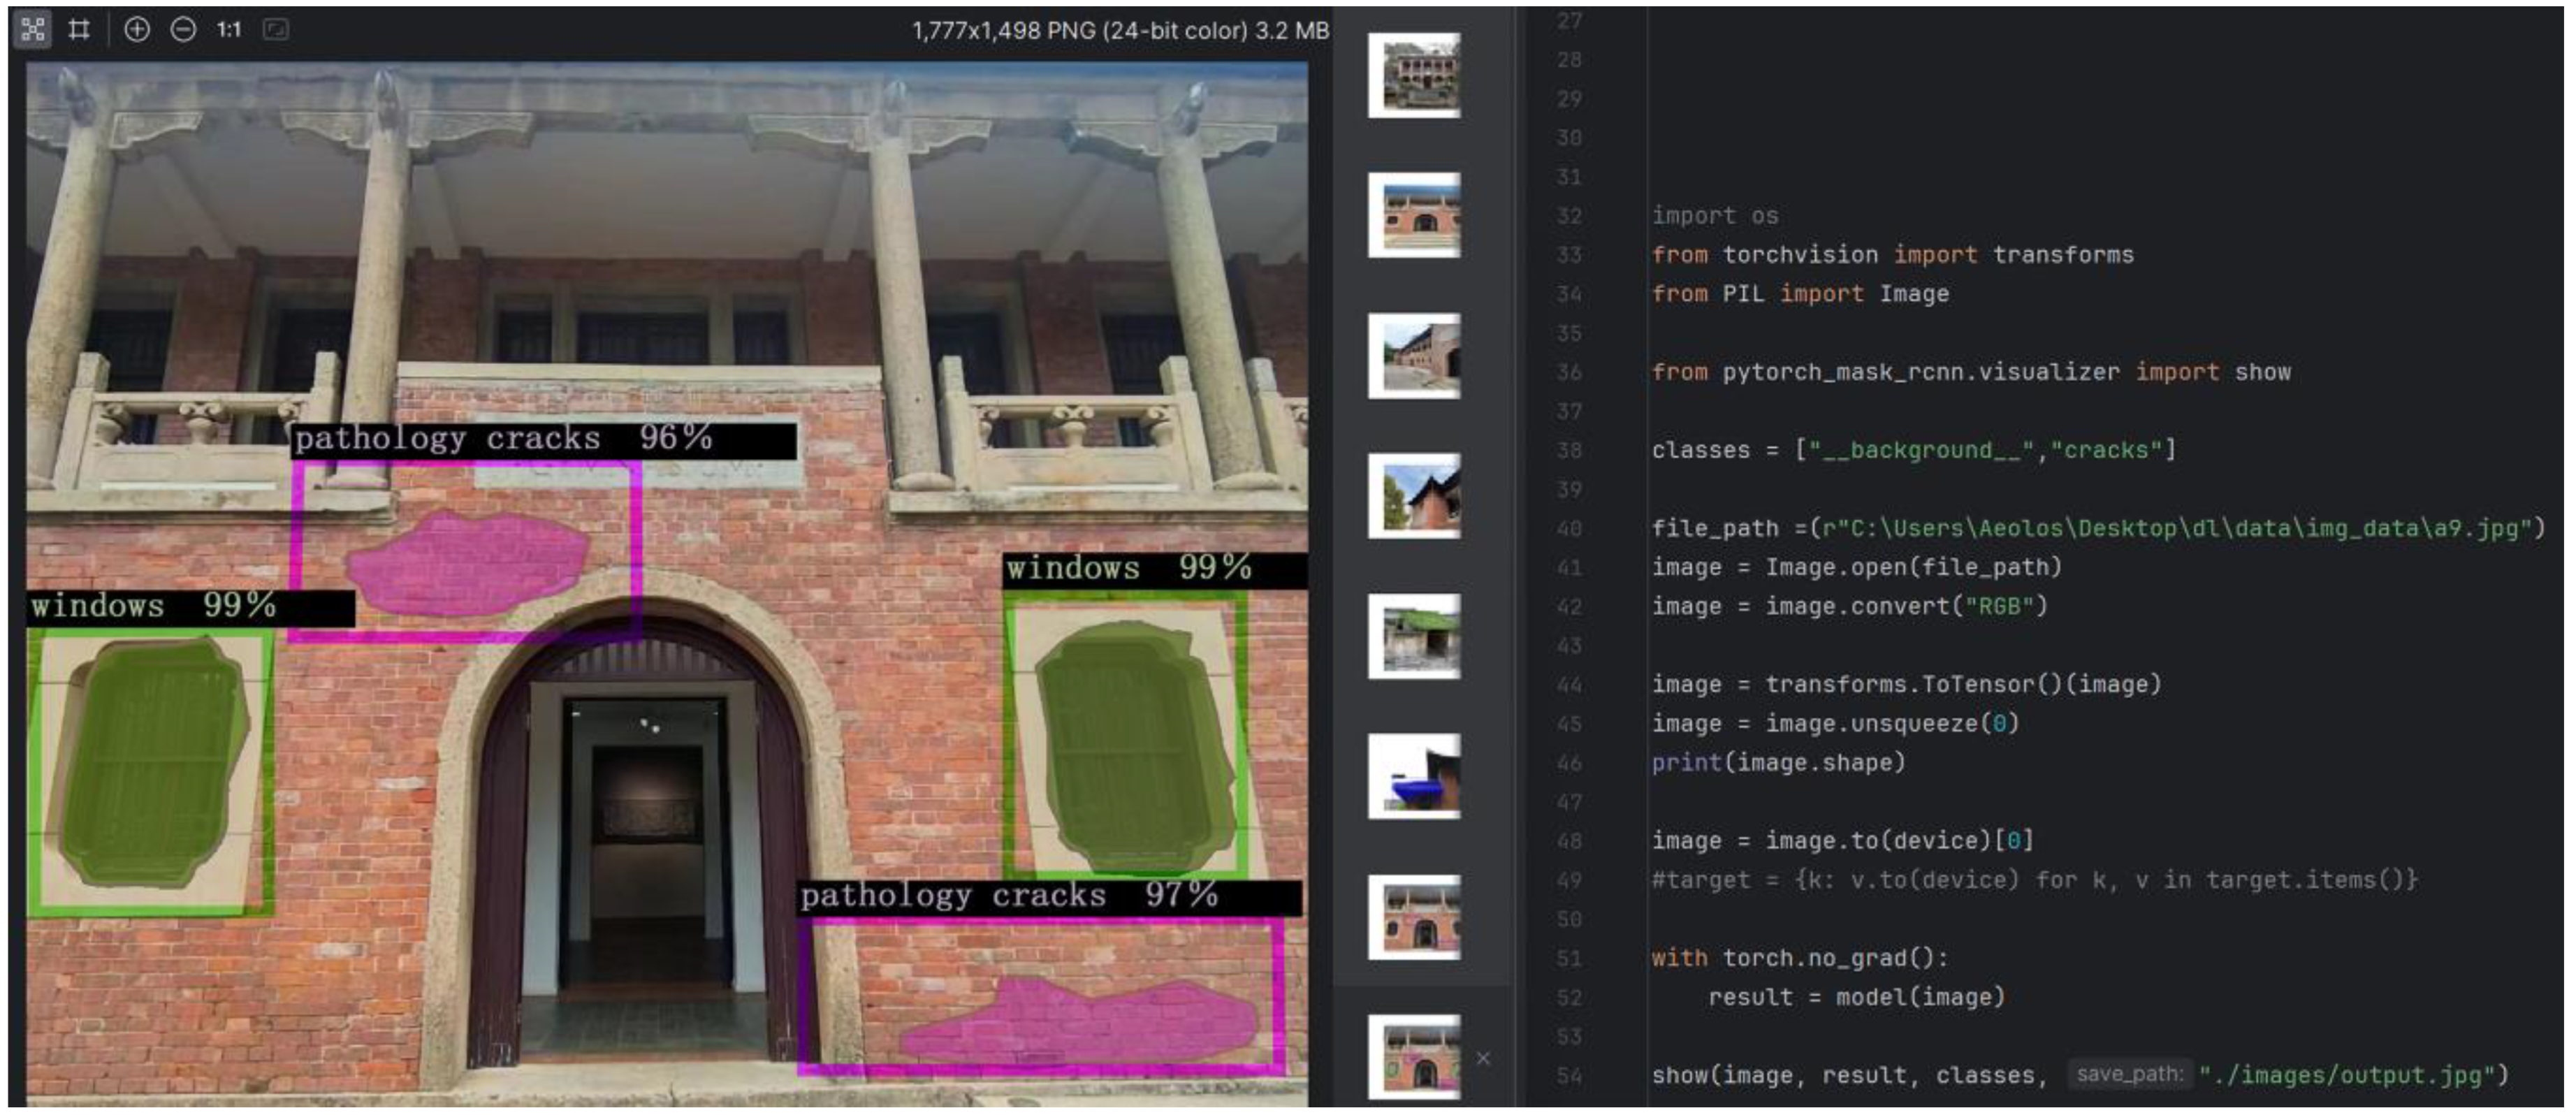
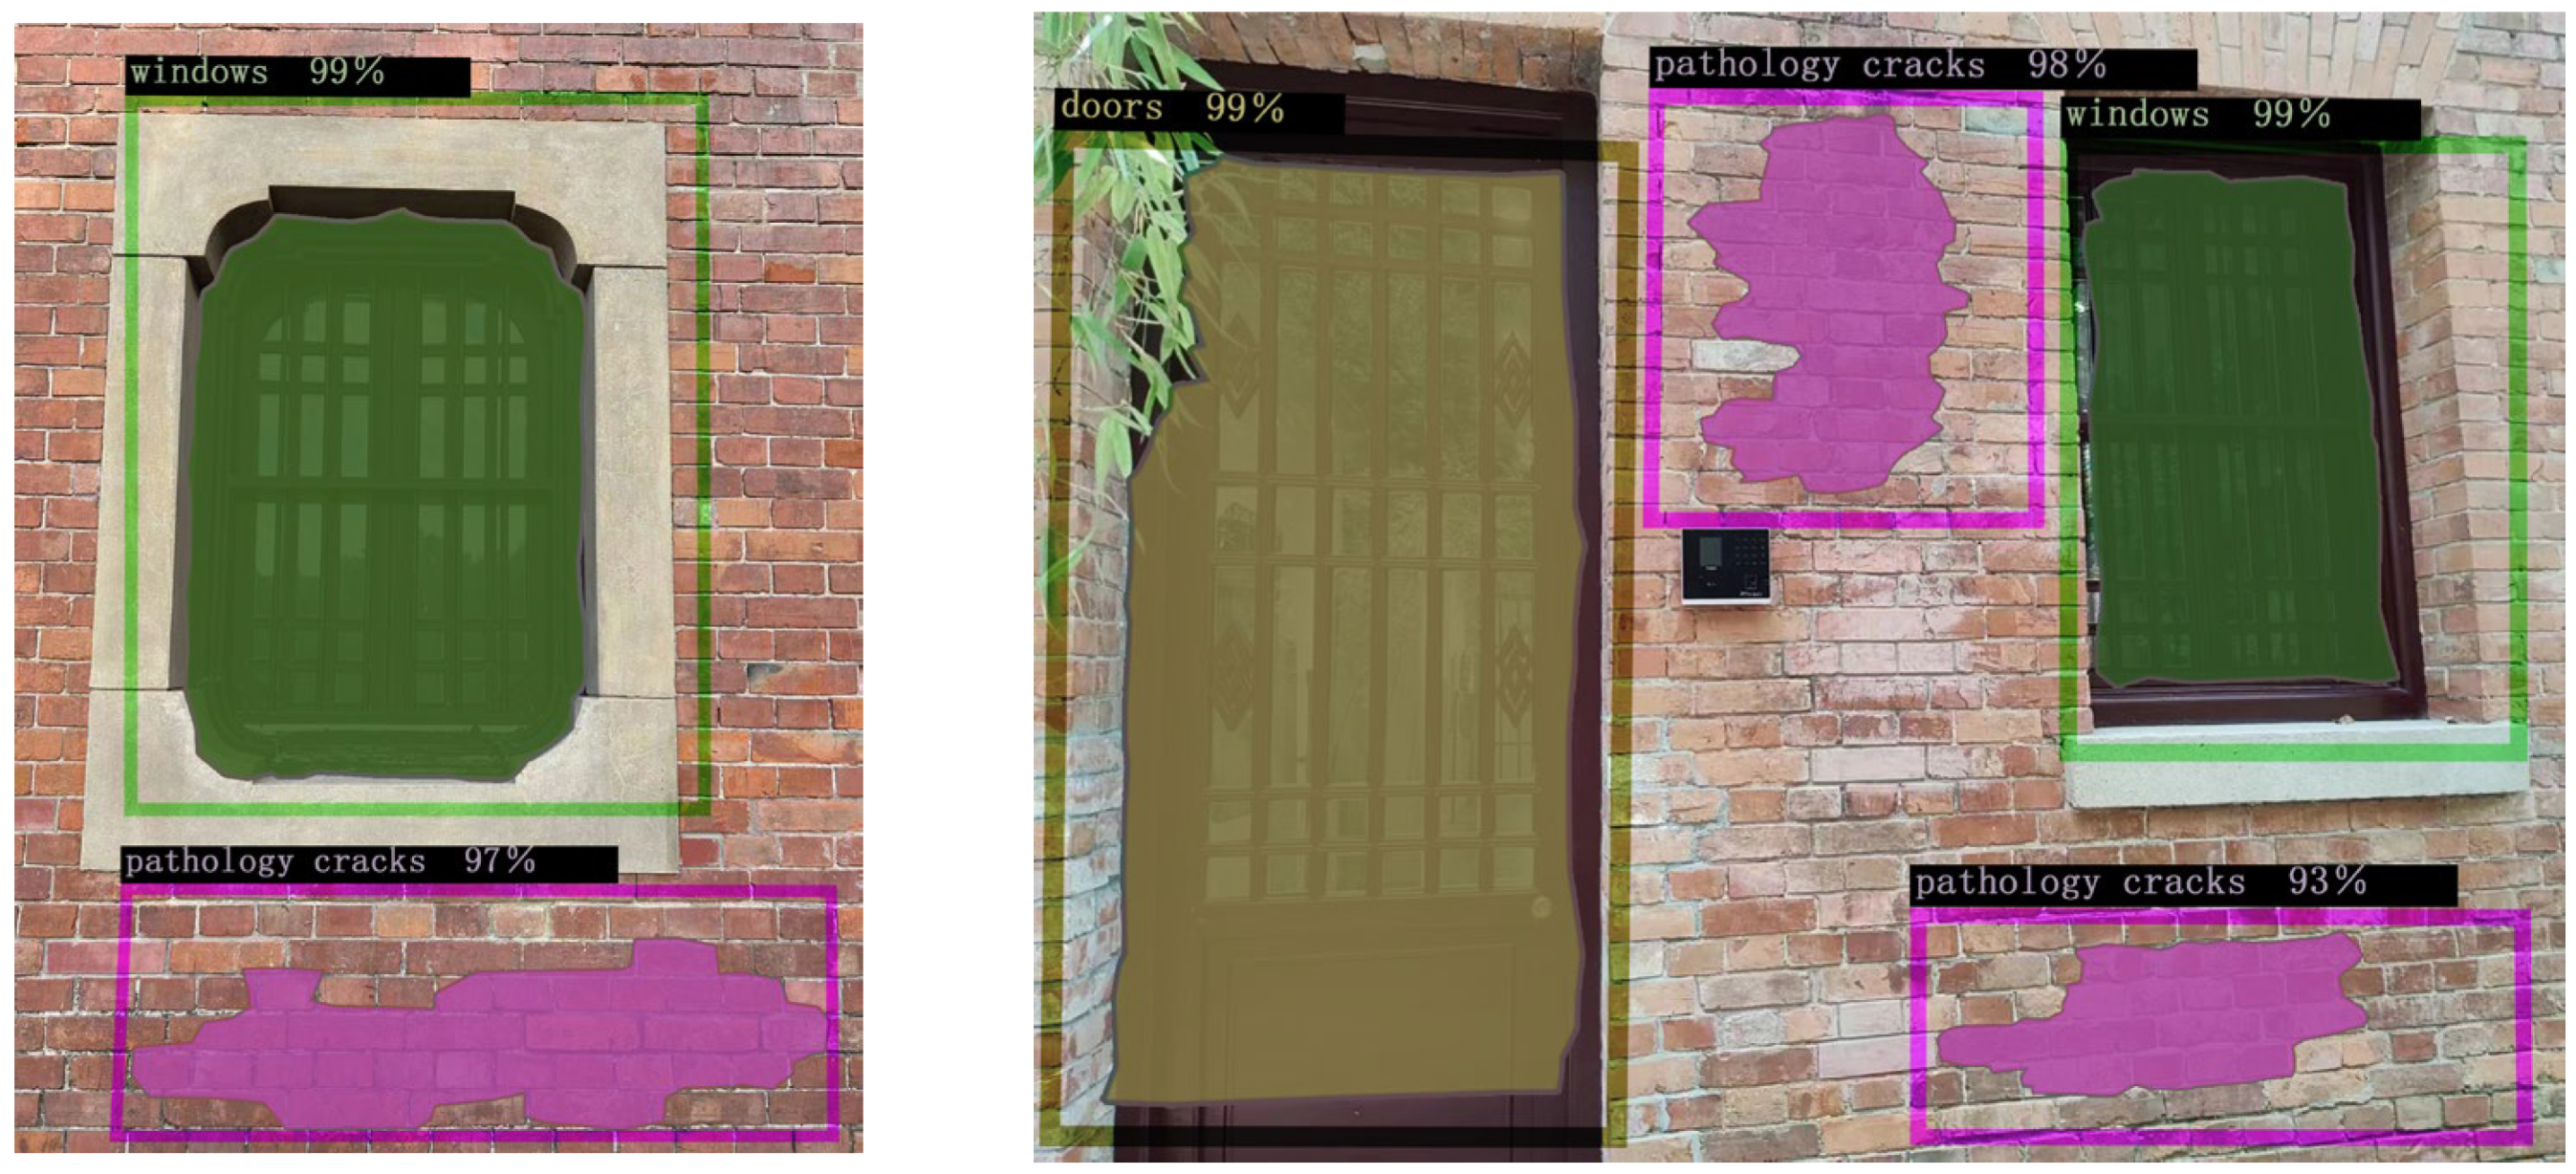
3.2.3. James Jackson Gymnasium Fracture Area Detection Based on Mask R-CNN Deep Learning Model

The process of detecting cracks in James Jackson Gymnasium using the Mask R-CNN deep learning model consists of the following steps: 1. Developing the Mask R-CNN model and making necessary adjustments to the classifier and mask tower [47]; 2. setting up data loaders and optimizers; 3. iterating through the data loader to execute forward propagation, calculate losses, perform backpropagation, and optimization on each batch.
Subsequently, 270 high-precision two-dimensional images acquired through 3D laser scanning were inputted into the crack detection model based on the Mask R-CNN deep learning model for crack detection (Figure 10). A total of 408 crack areas were identified, out of which 253 were found to be duplicate crack areas, resulting in the detection of 155 effective pathology crack areas (Figure 11).

3.3. Construction of Single Pathology Crack Identification and Calculation Model Based on FCN

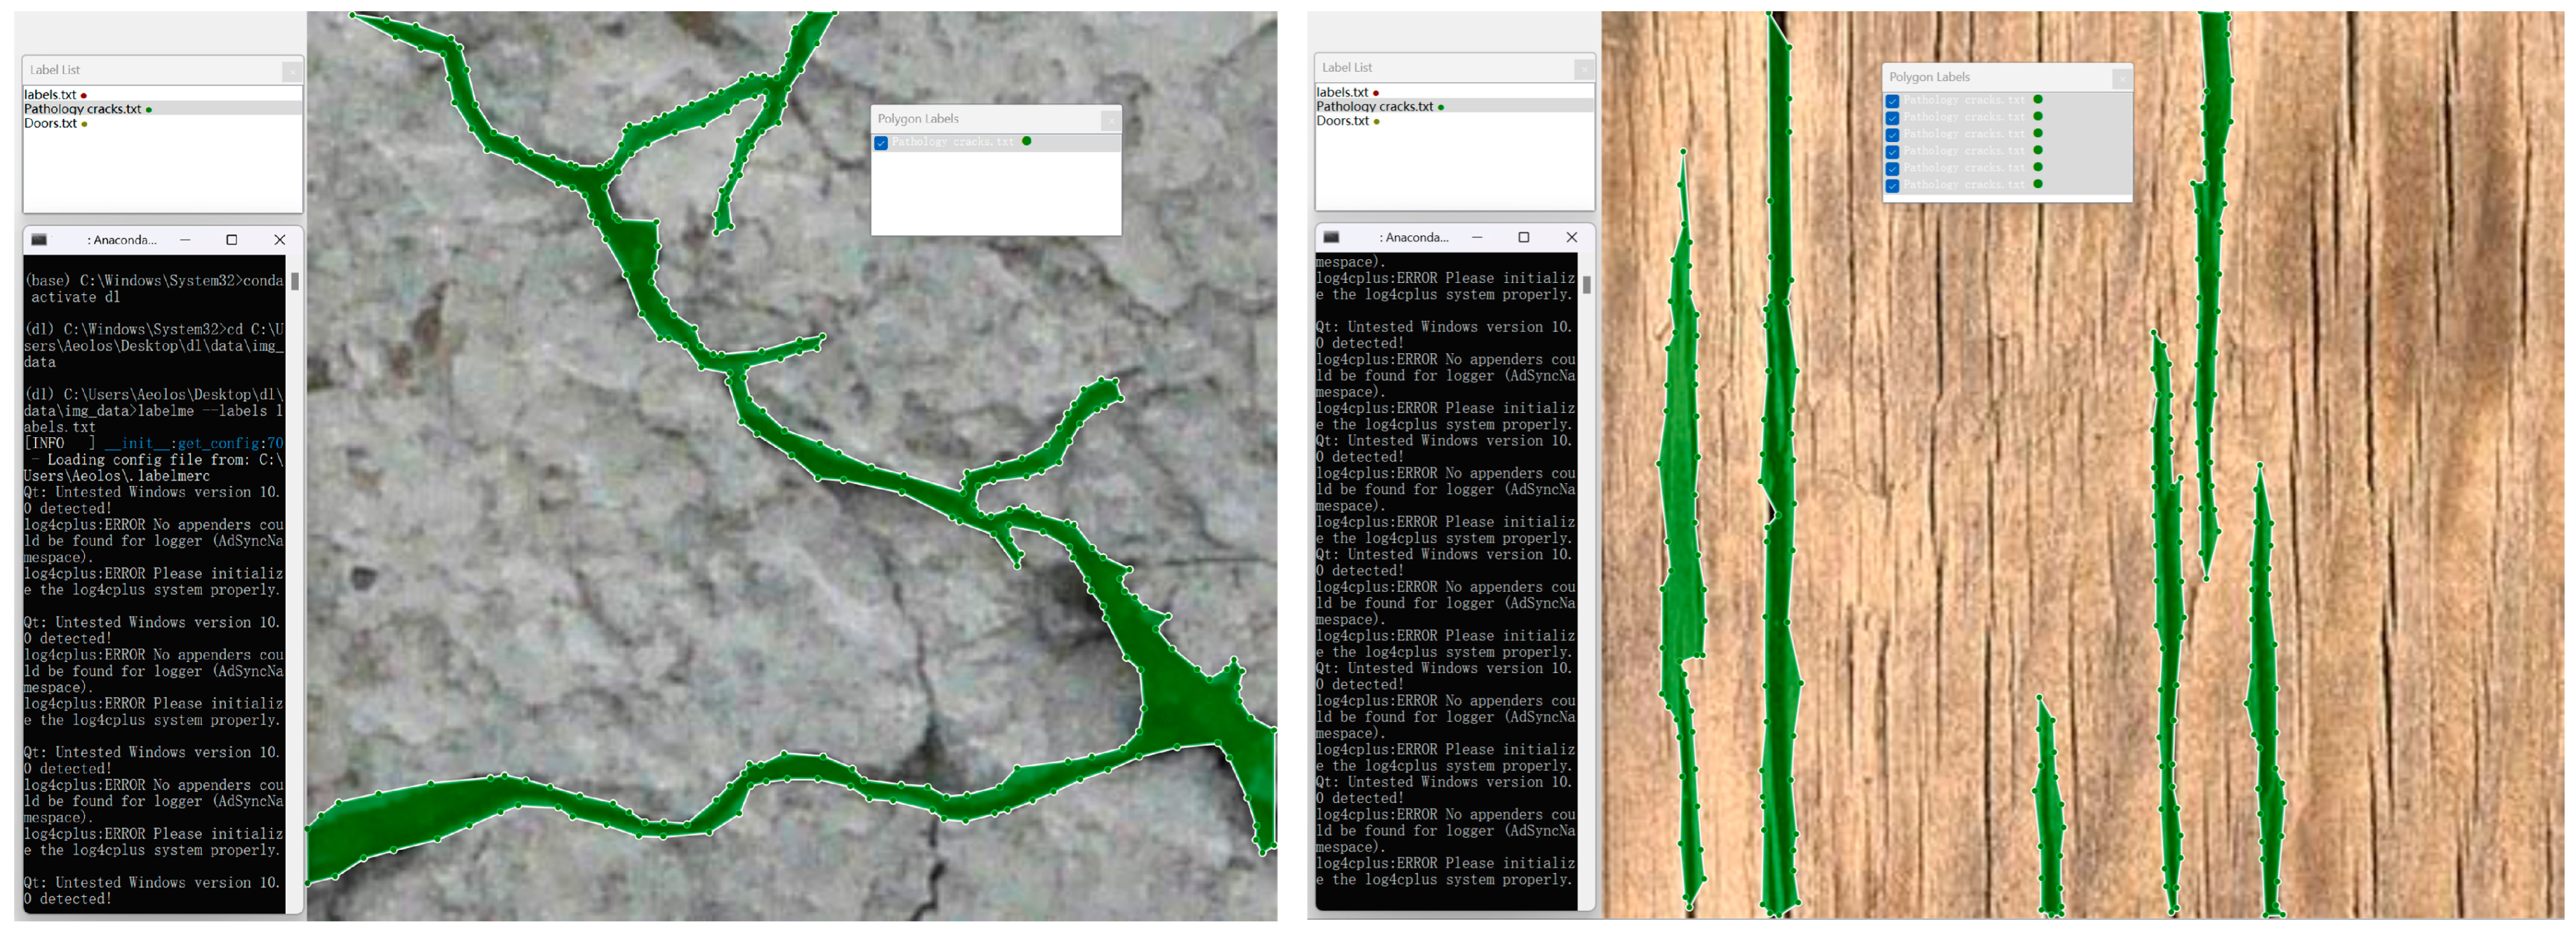
3.3.1. Pathology Cracks Training Set for Labeling Architectural Heritage

The first aspect is to create a conda virtual environment, to create an environment named labelme_env, python version 3.8; for example, conda create -n labelme_env python = 3.8. After the creation is completed, enter the new environment: conda activate labelme_env. Second, install labelme, directly using pip to install: pip install labelme pip install pycocotools-windows. Finally, after the installation is completed, enter “labelme” at the terminal to start labelme. In order to ensure the accuracy of the dataset and later crack calculation, the pixel size of all the labeled images is 300 pixels, with an error of 50 pixels [48]. Through the multi-point labeled crack image (Figure 12), the label as deep learning supervision is inputted into the neural network [49]. In order to improve the range and accuracy of model recognition, we expanded the selection of crack types in the labeling process and marked 510 pathology crack sheets of masonry structure and 490 pathology crack sheets of timber structure, totaling 1000 sheets (Figure 12).

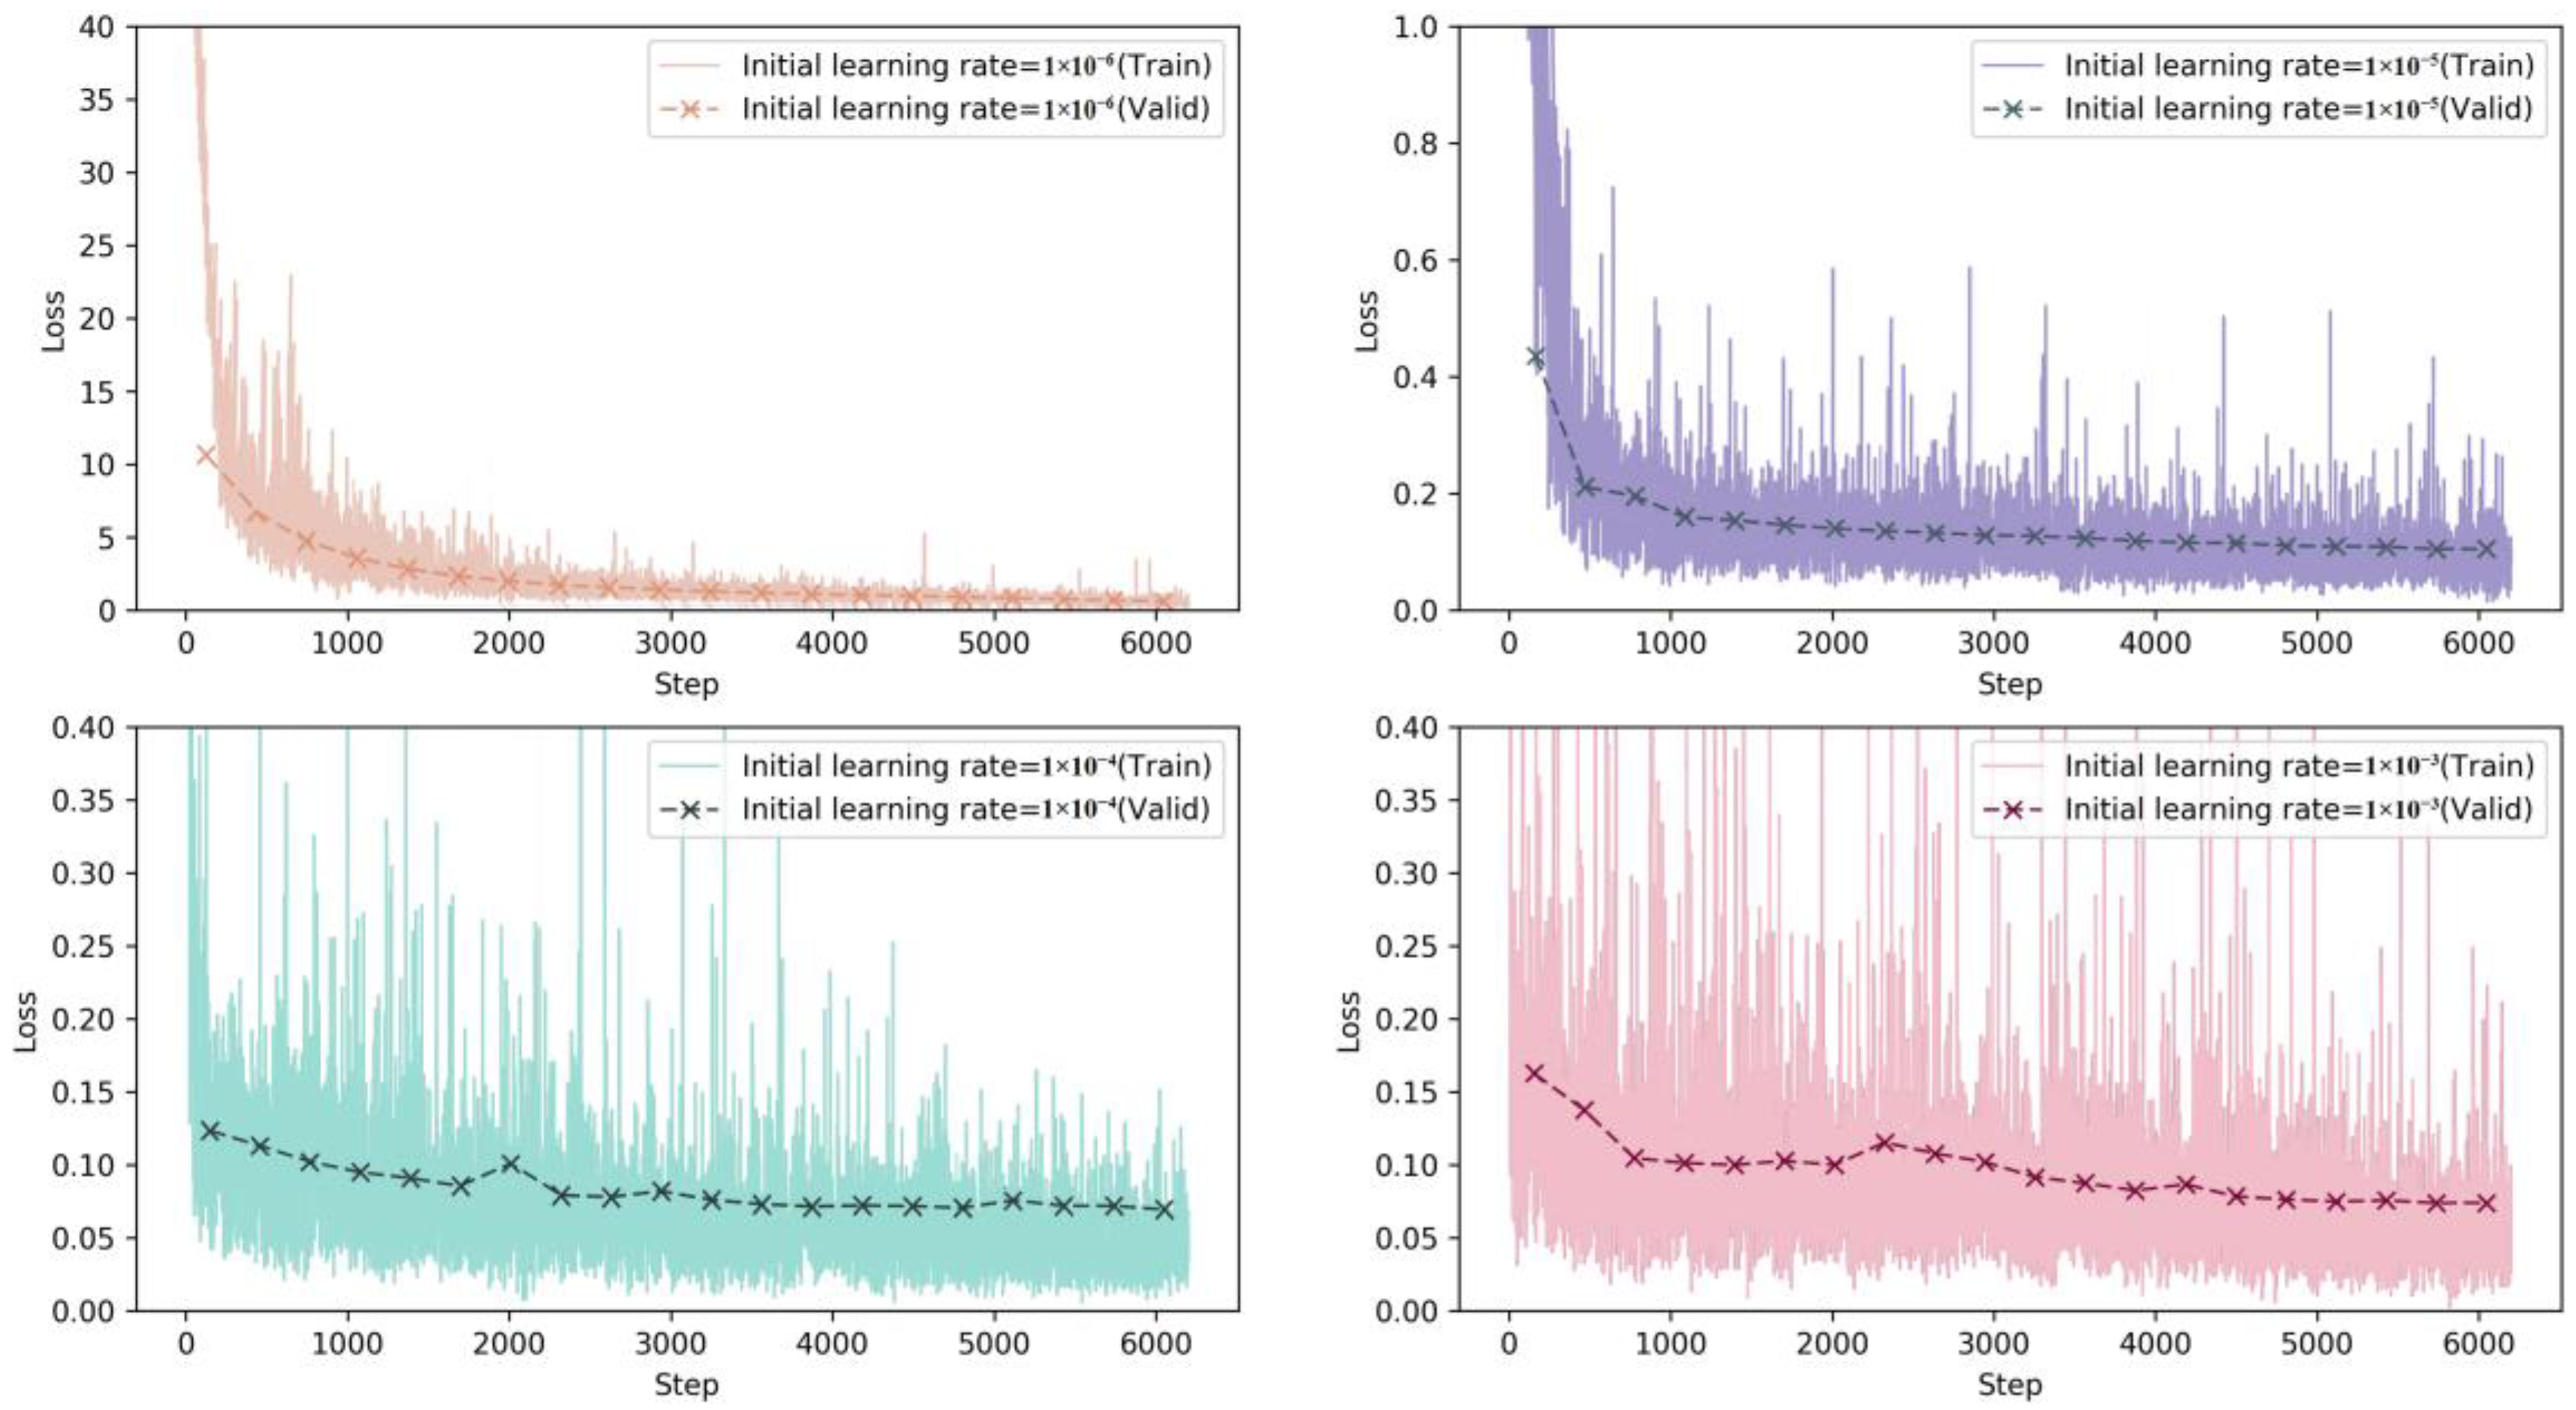
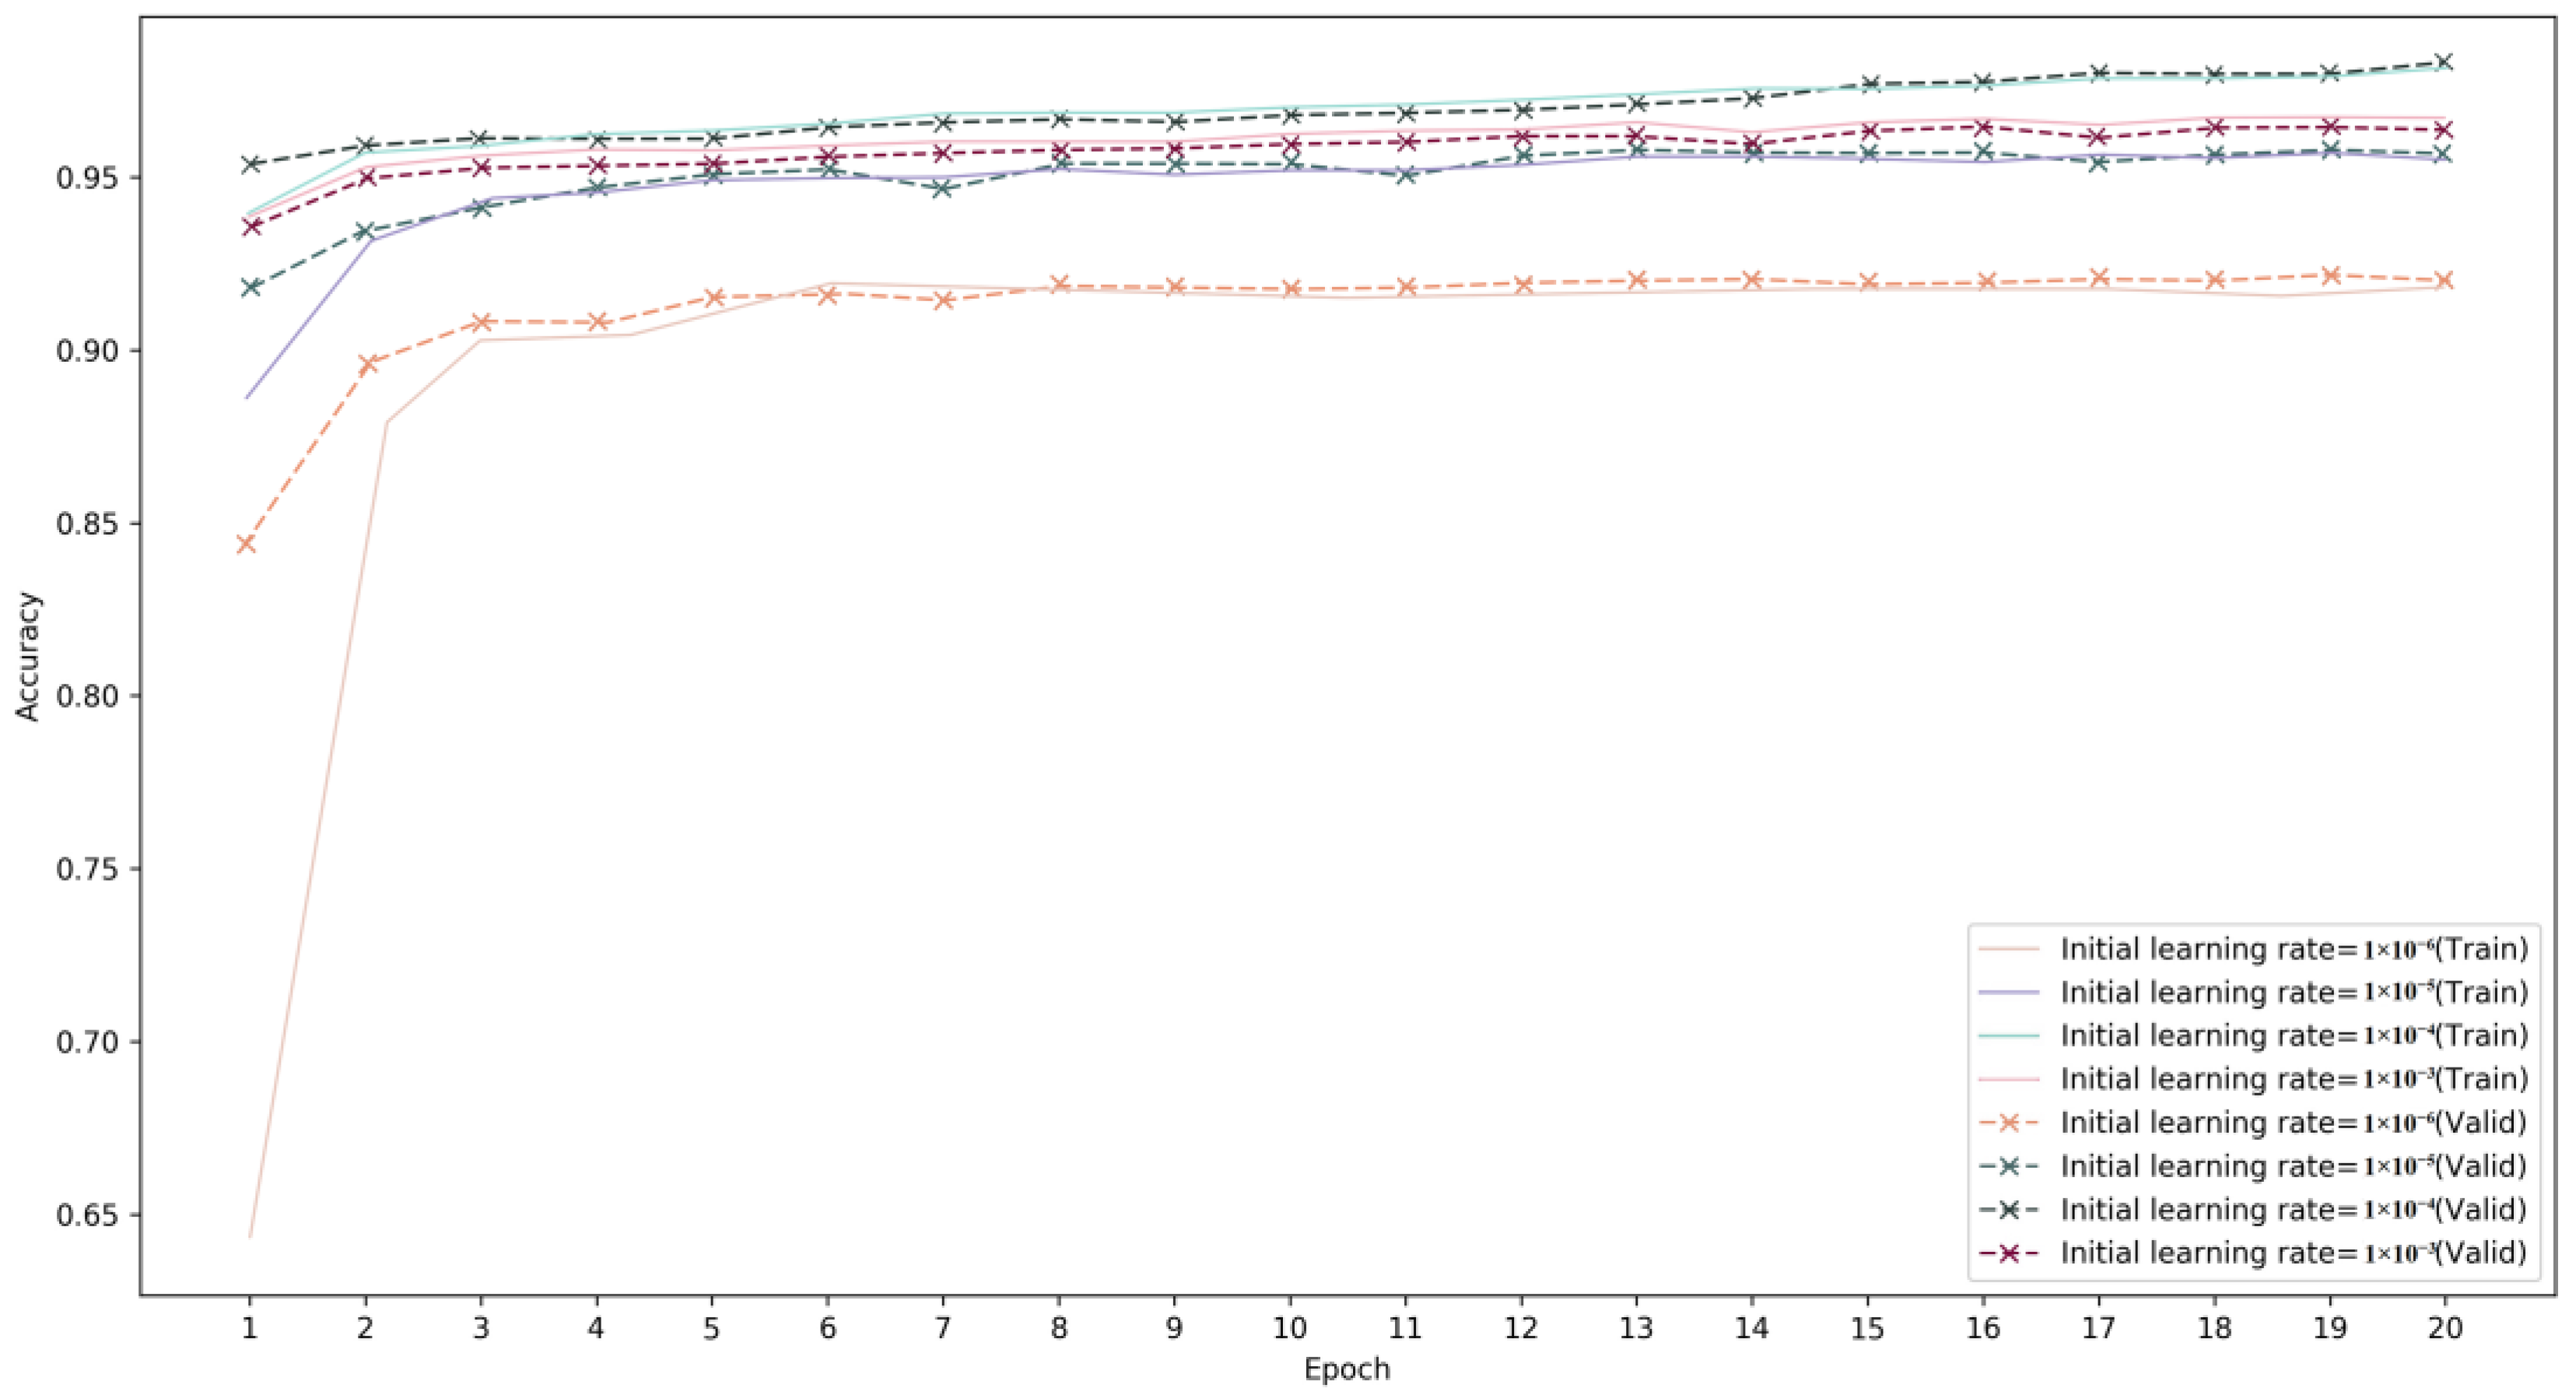
3.3.2. Training Single Pathology Crack Recognition and Calculation Model and Result Optimization

In the training process of a single pathology crack identification and calculation model for architectural heritage, we aimed to enhance the accuracy of the model and minimize losses by setting four initial learning rates (Figure 13). Through comparison, we observed that, when the initial learning rate is 1 × 10⁻⁶, the model’s convergence speed is excessively slow. Conversely, with an initial learning rate of 1 × 10⁻⁵, the loss value drops rapidly and exhibits poor stability. For an initial learning rate of 1 × 10⁻⁴, the loss value decreases steadily, although the overall decline is gradual and reaches a stable point early on. This provides sufficient momentum for the model to facilitate quick learning. Finally, at an initial learning rate of 1 × 10⁻³, the loss value experiences significant fluctuation and demonstrates signs of overfitting [50]. In conclusion, we selected 1 × 10⁻⁴ as the optimal initial learning rate (Figure 14).

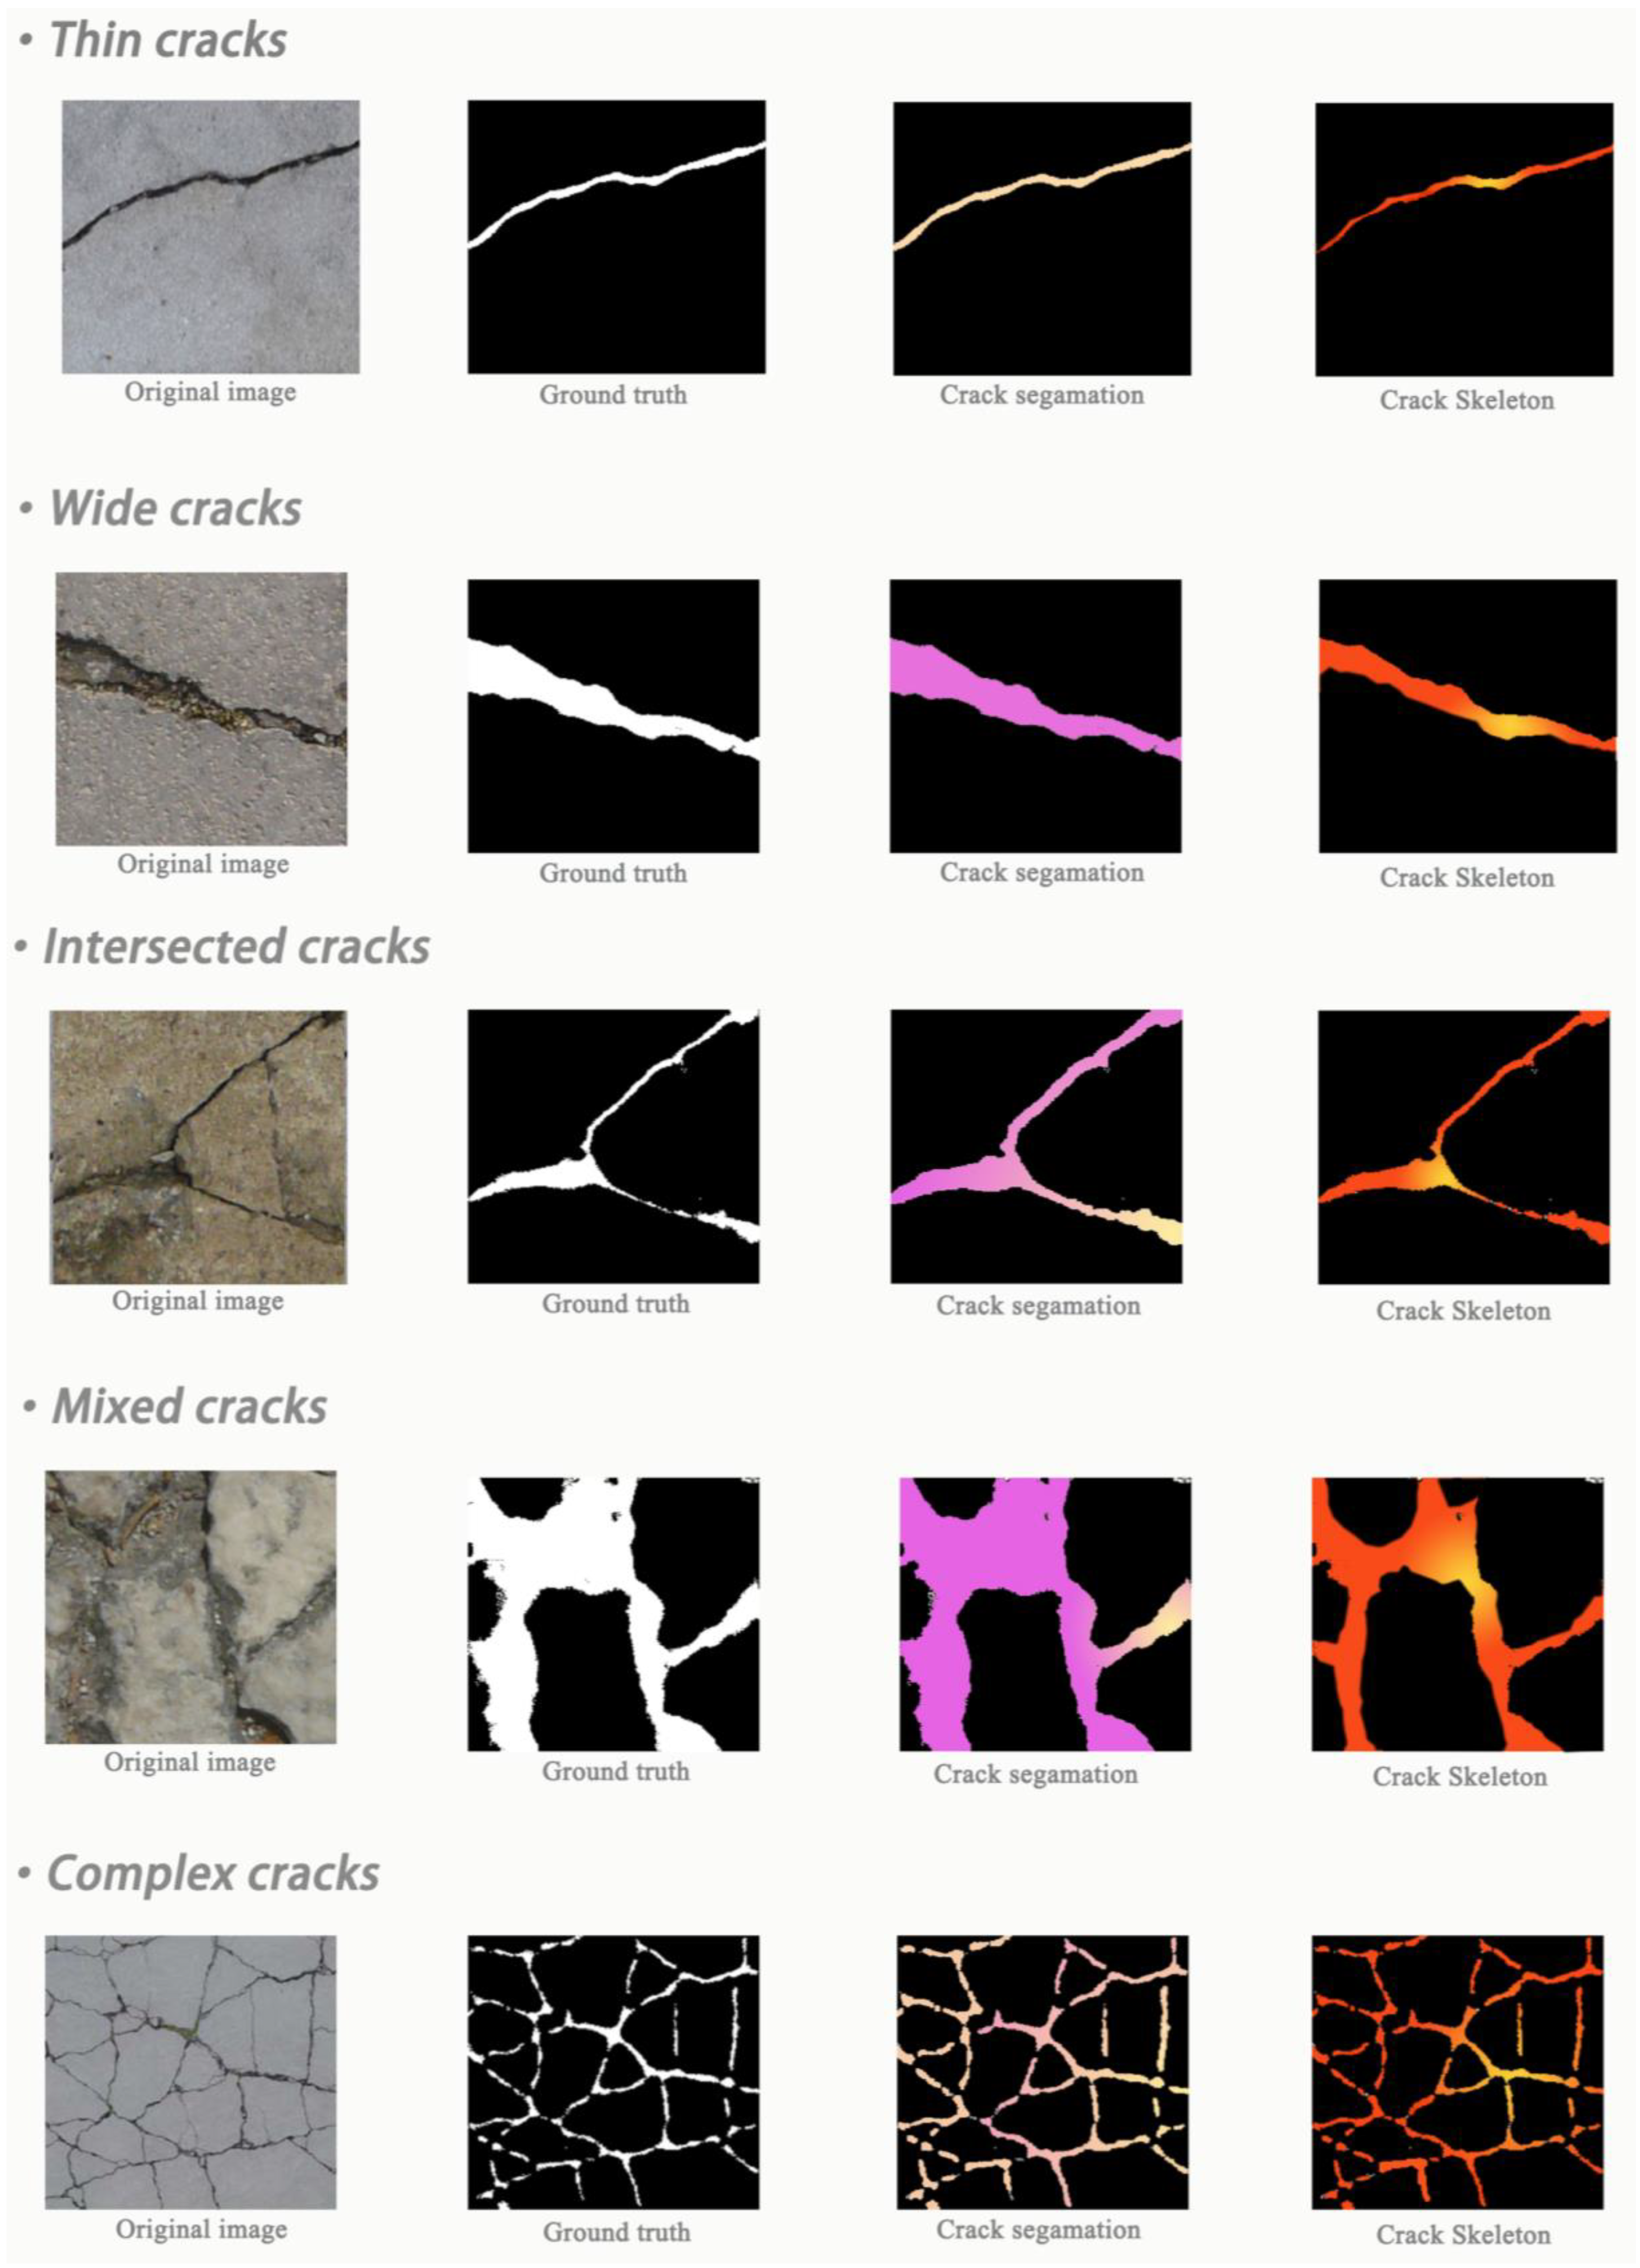
3.3.3. Establishment of Single Pathology Crack Segmentation Model of Architectural Heritage Based on FCN

In order to enhance the accuracy of the single-crack identification and calculation model based on FCN, image segmentation and crack extraction functions were incorporated prior to model identification and calculation [51]. Initially, the cracks were categorized into five types for computer recognition: (1) thin cracks; (2) wide cracks; (3) intersected cracks; (4) mixed cracks; (5) complex cracks (Figure 15). Next, the pathology crack and its surrounding area were segmented based on image gray levels. Subsequently, the pathology crack was divided by color according to its area. Finally, the center point of the pathology crack was determined and the structure of the pathology crack was extracted.

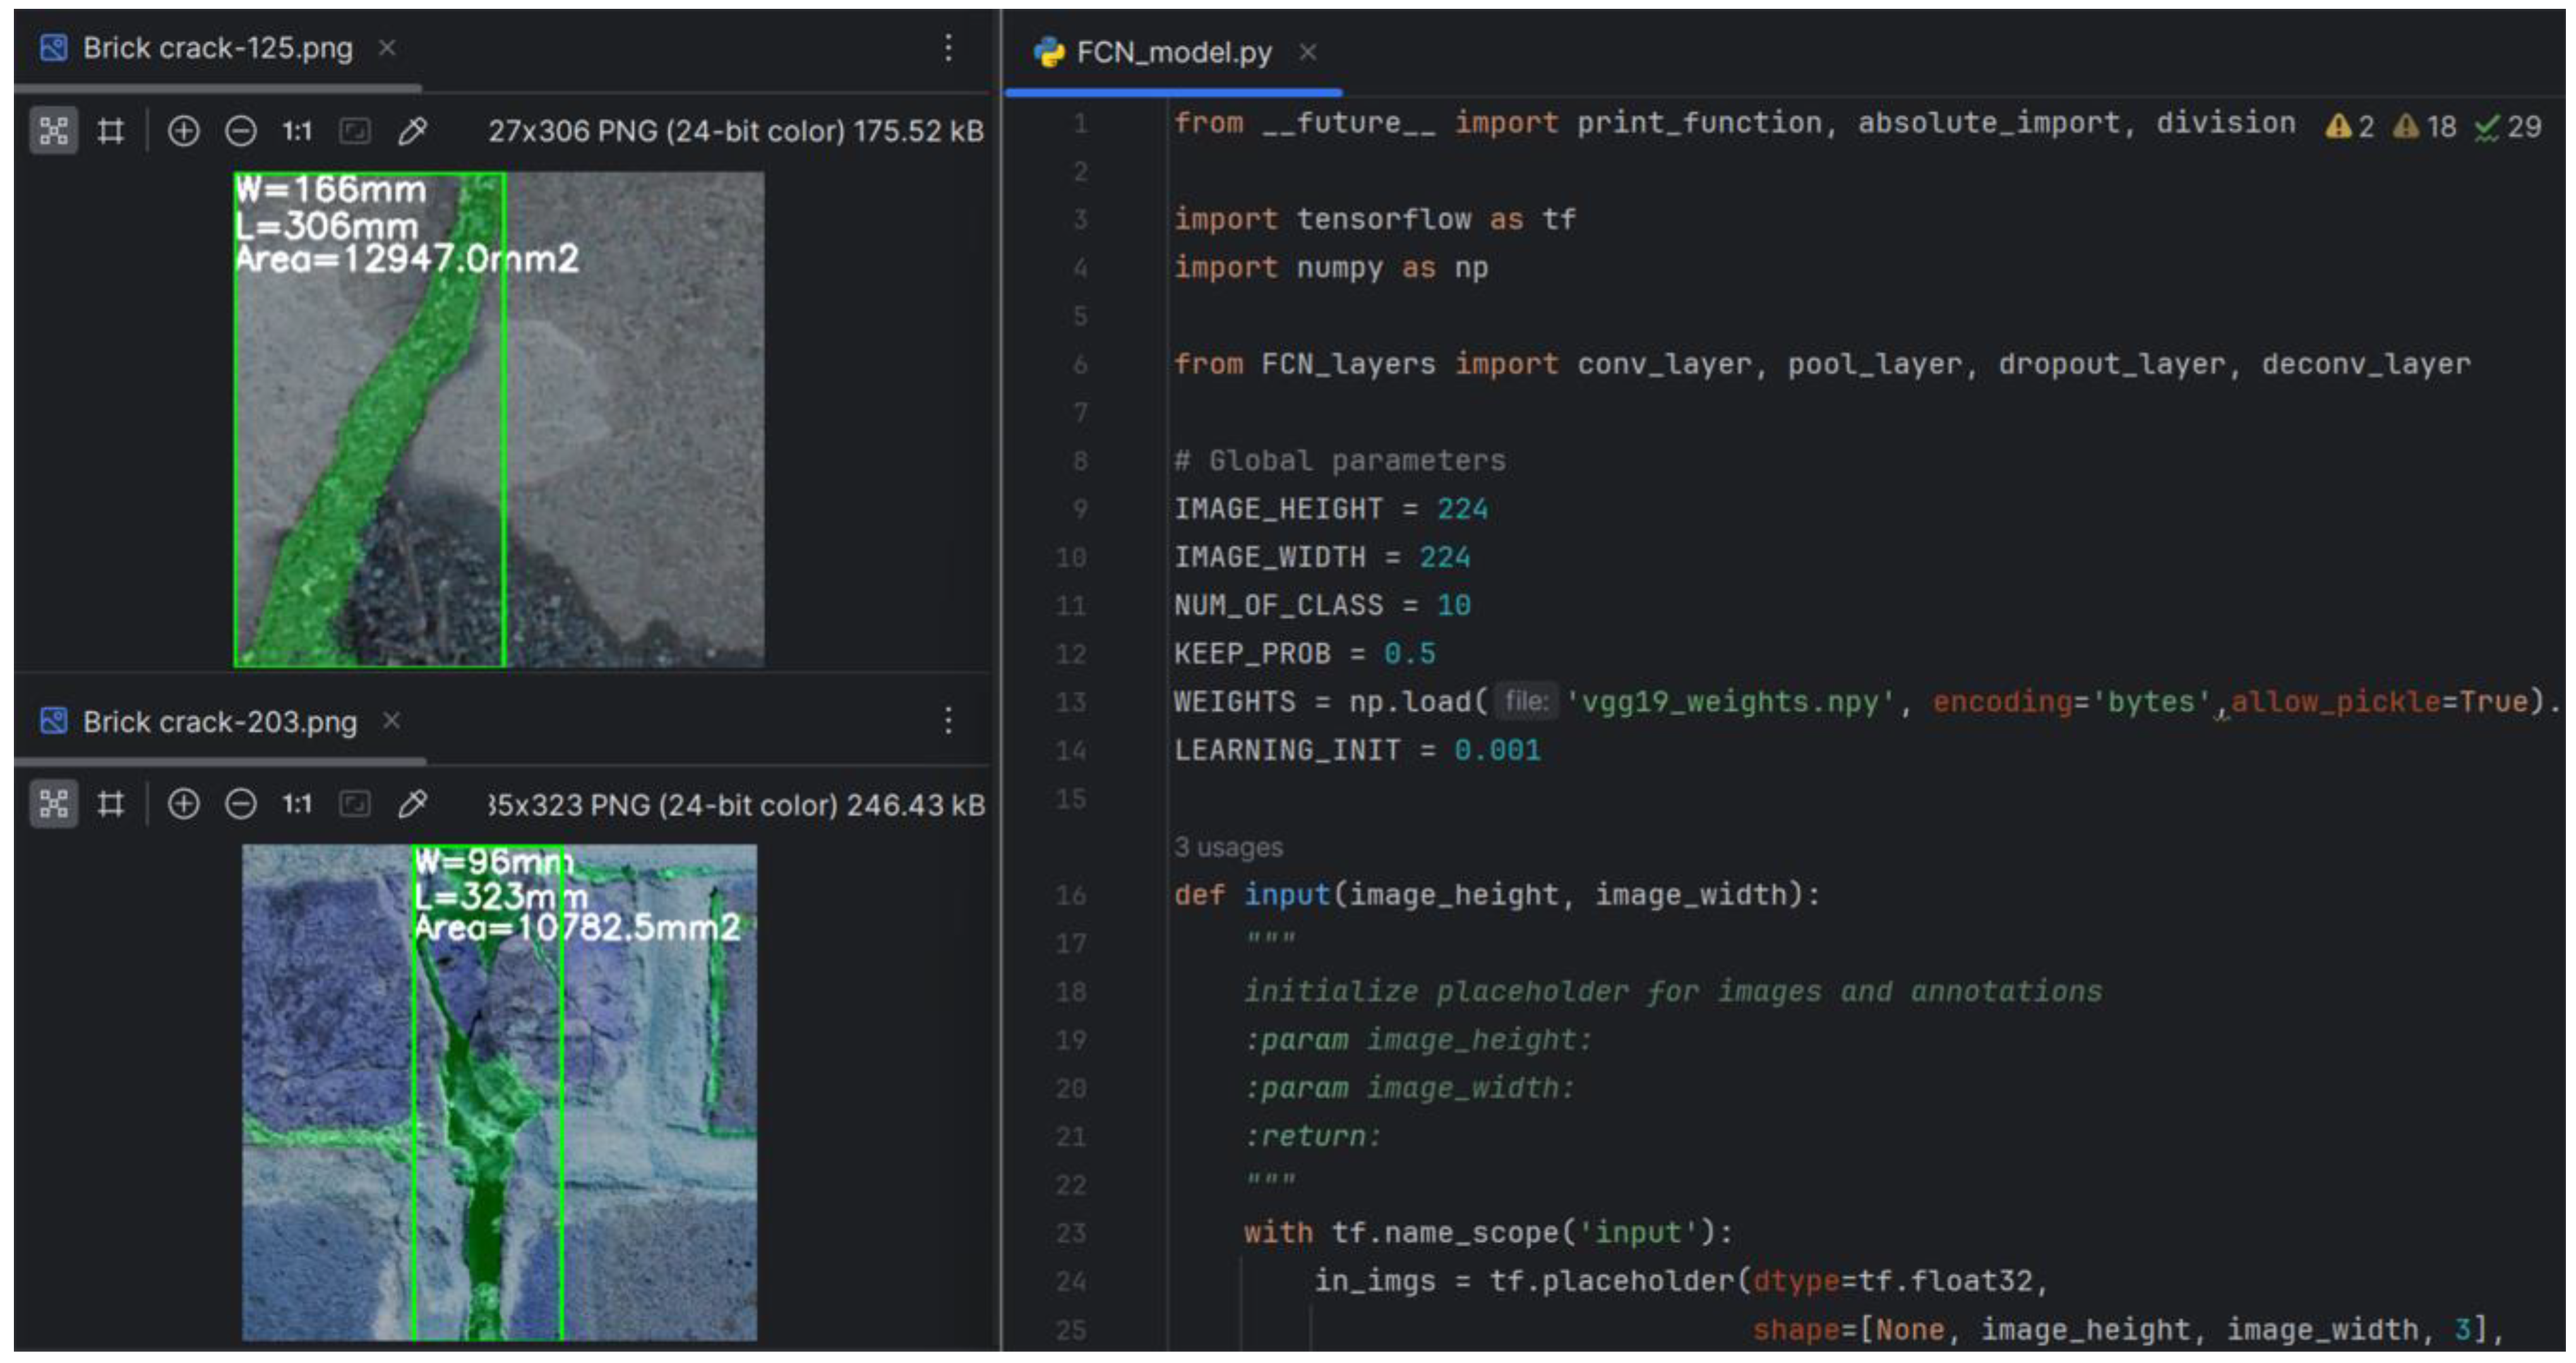
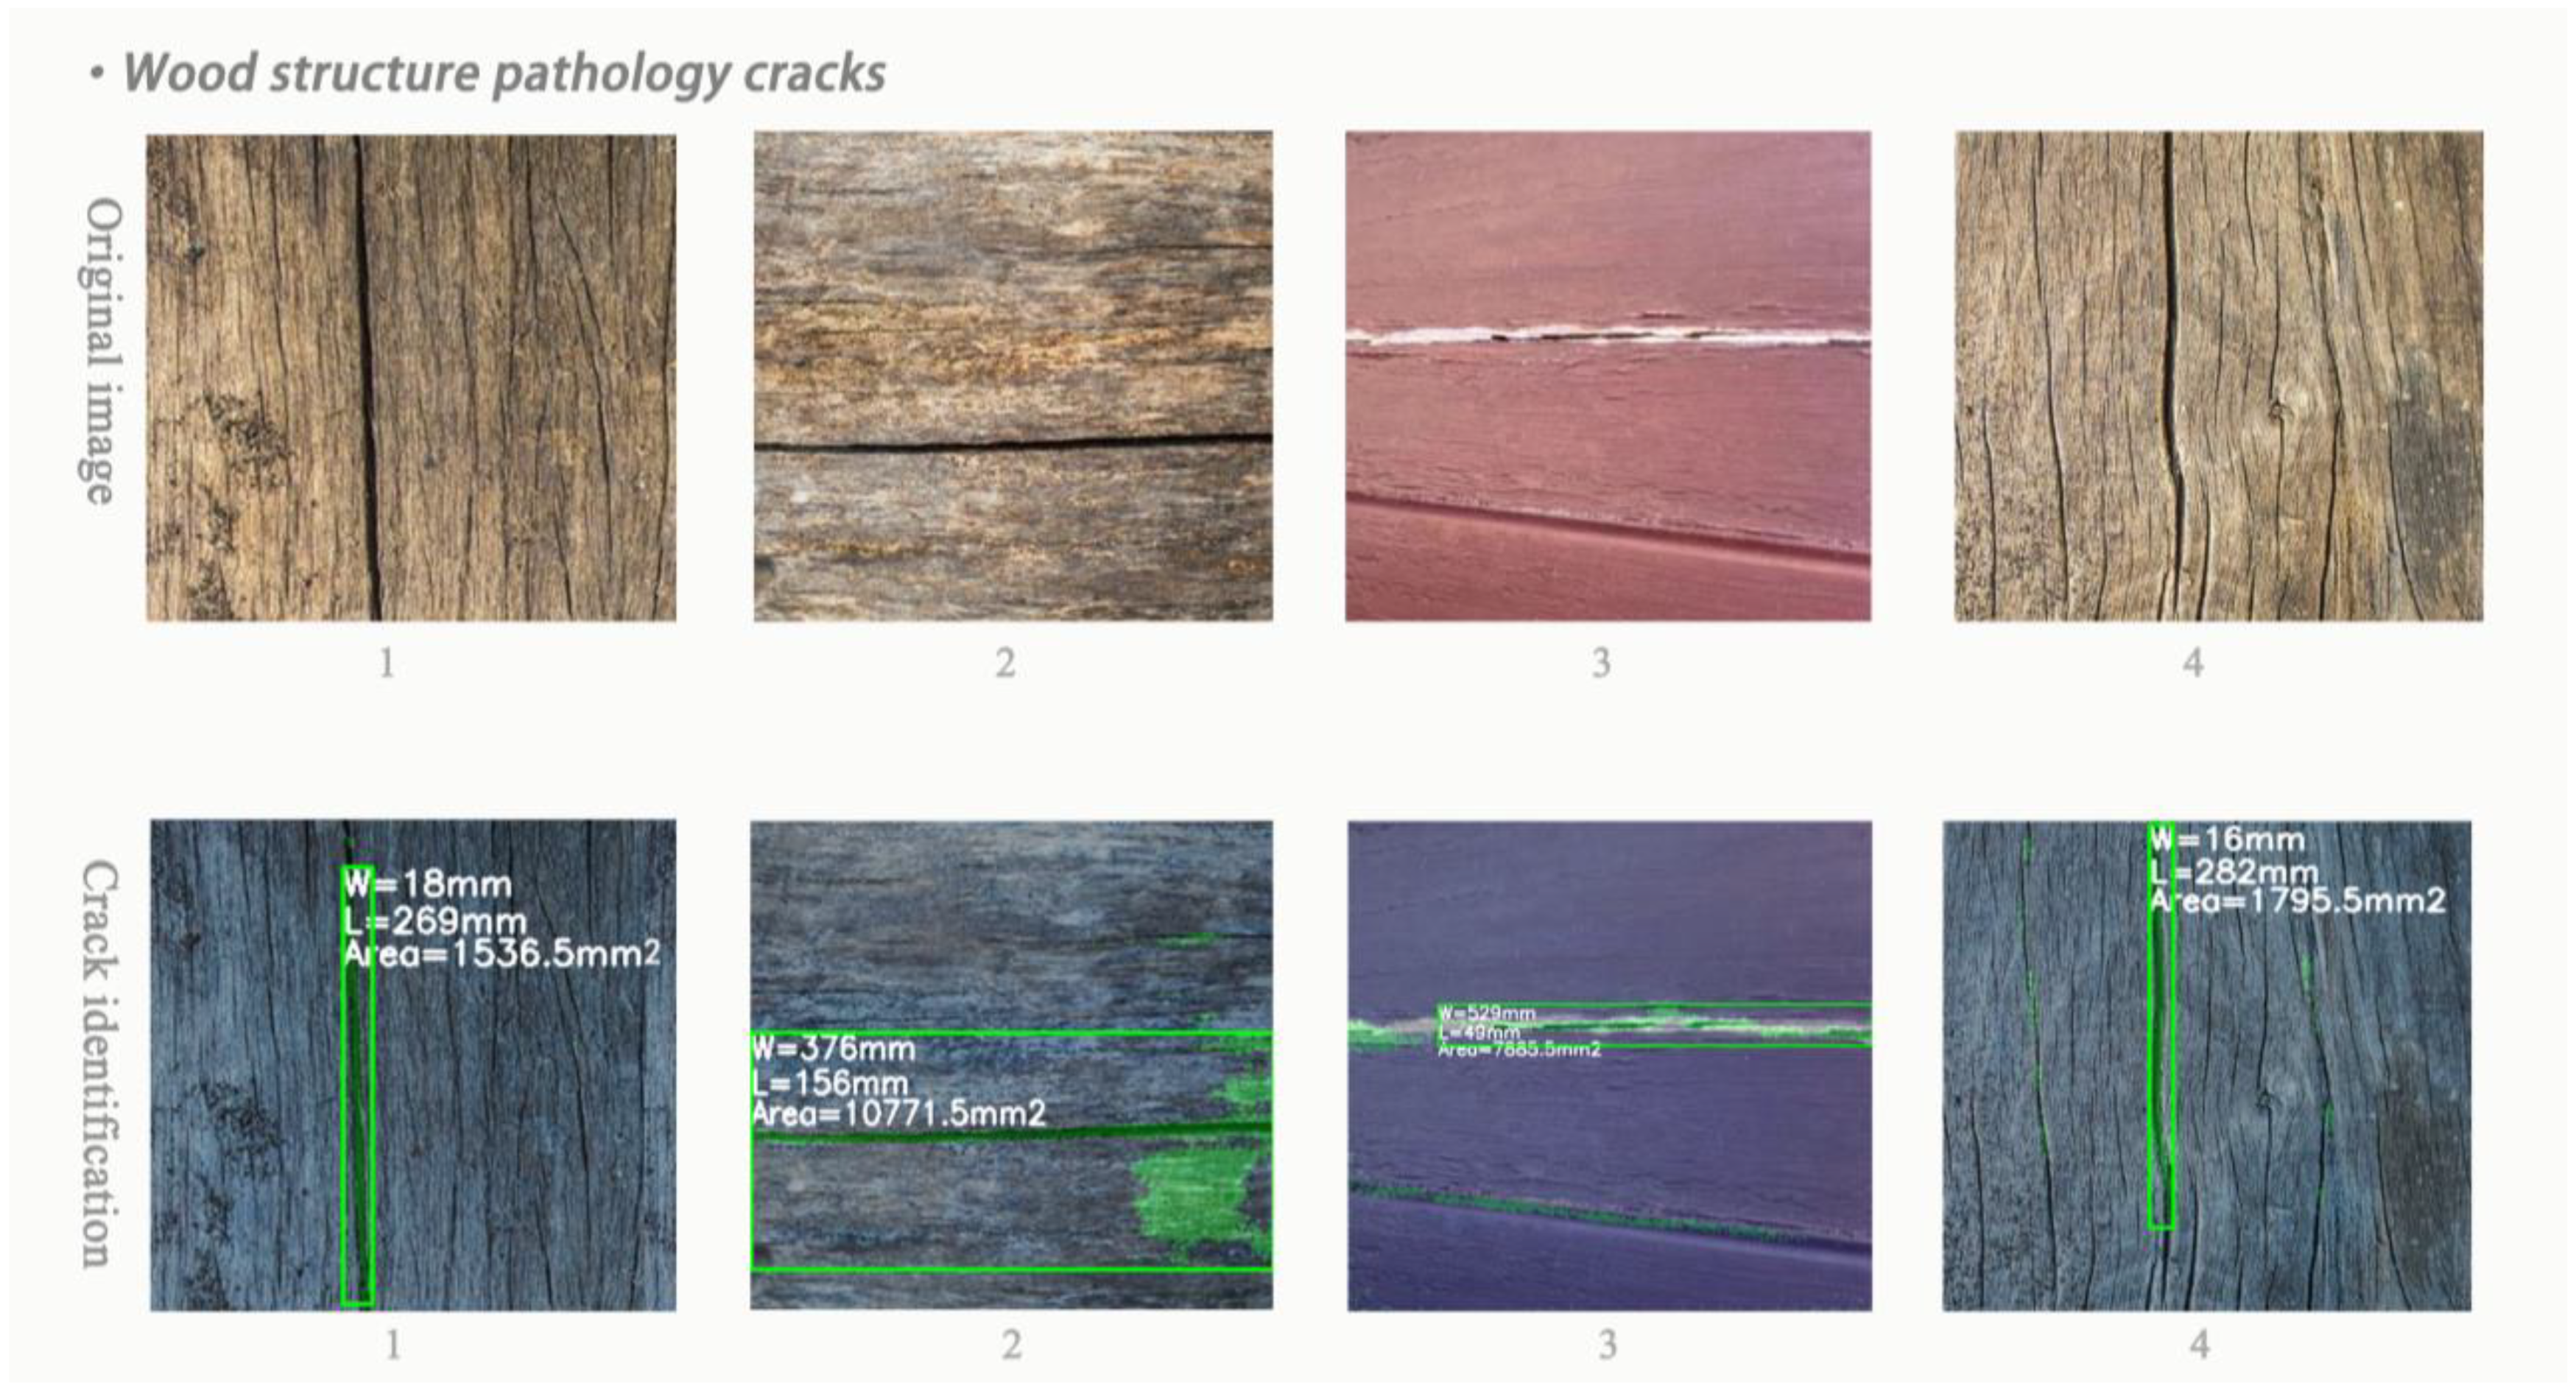
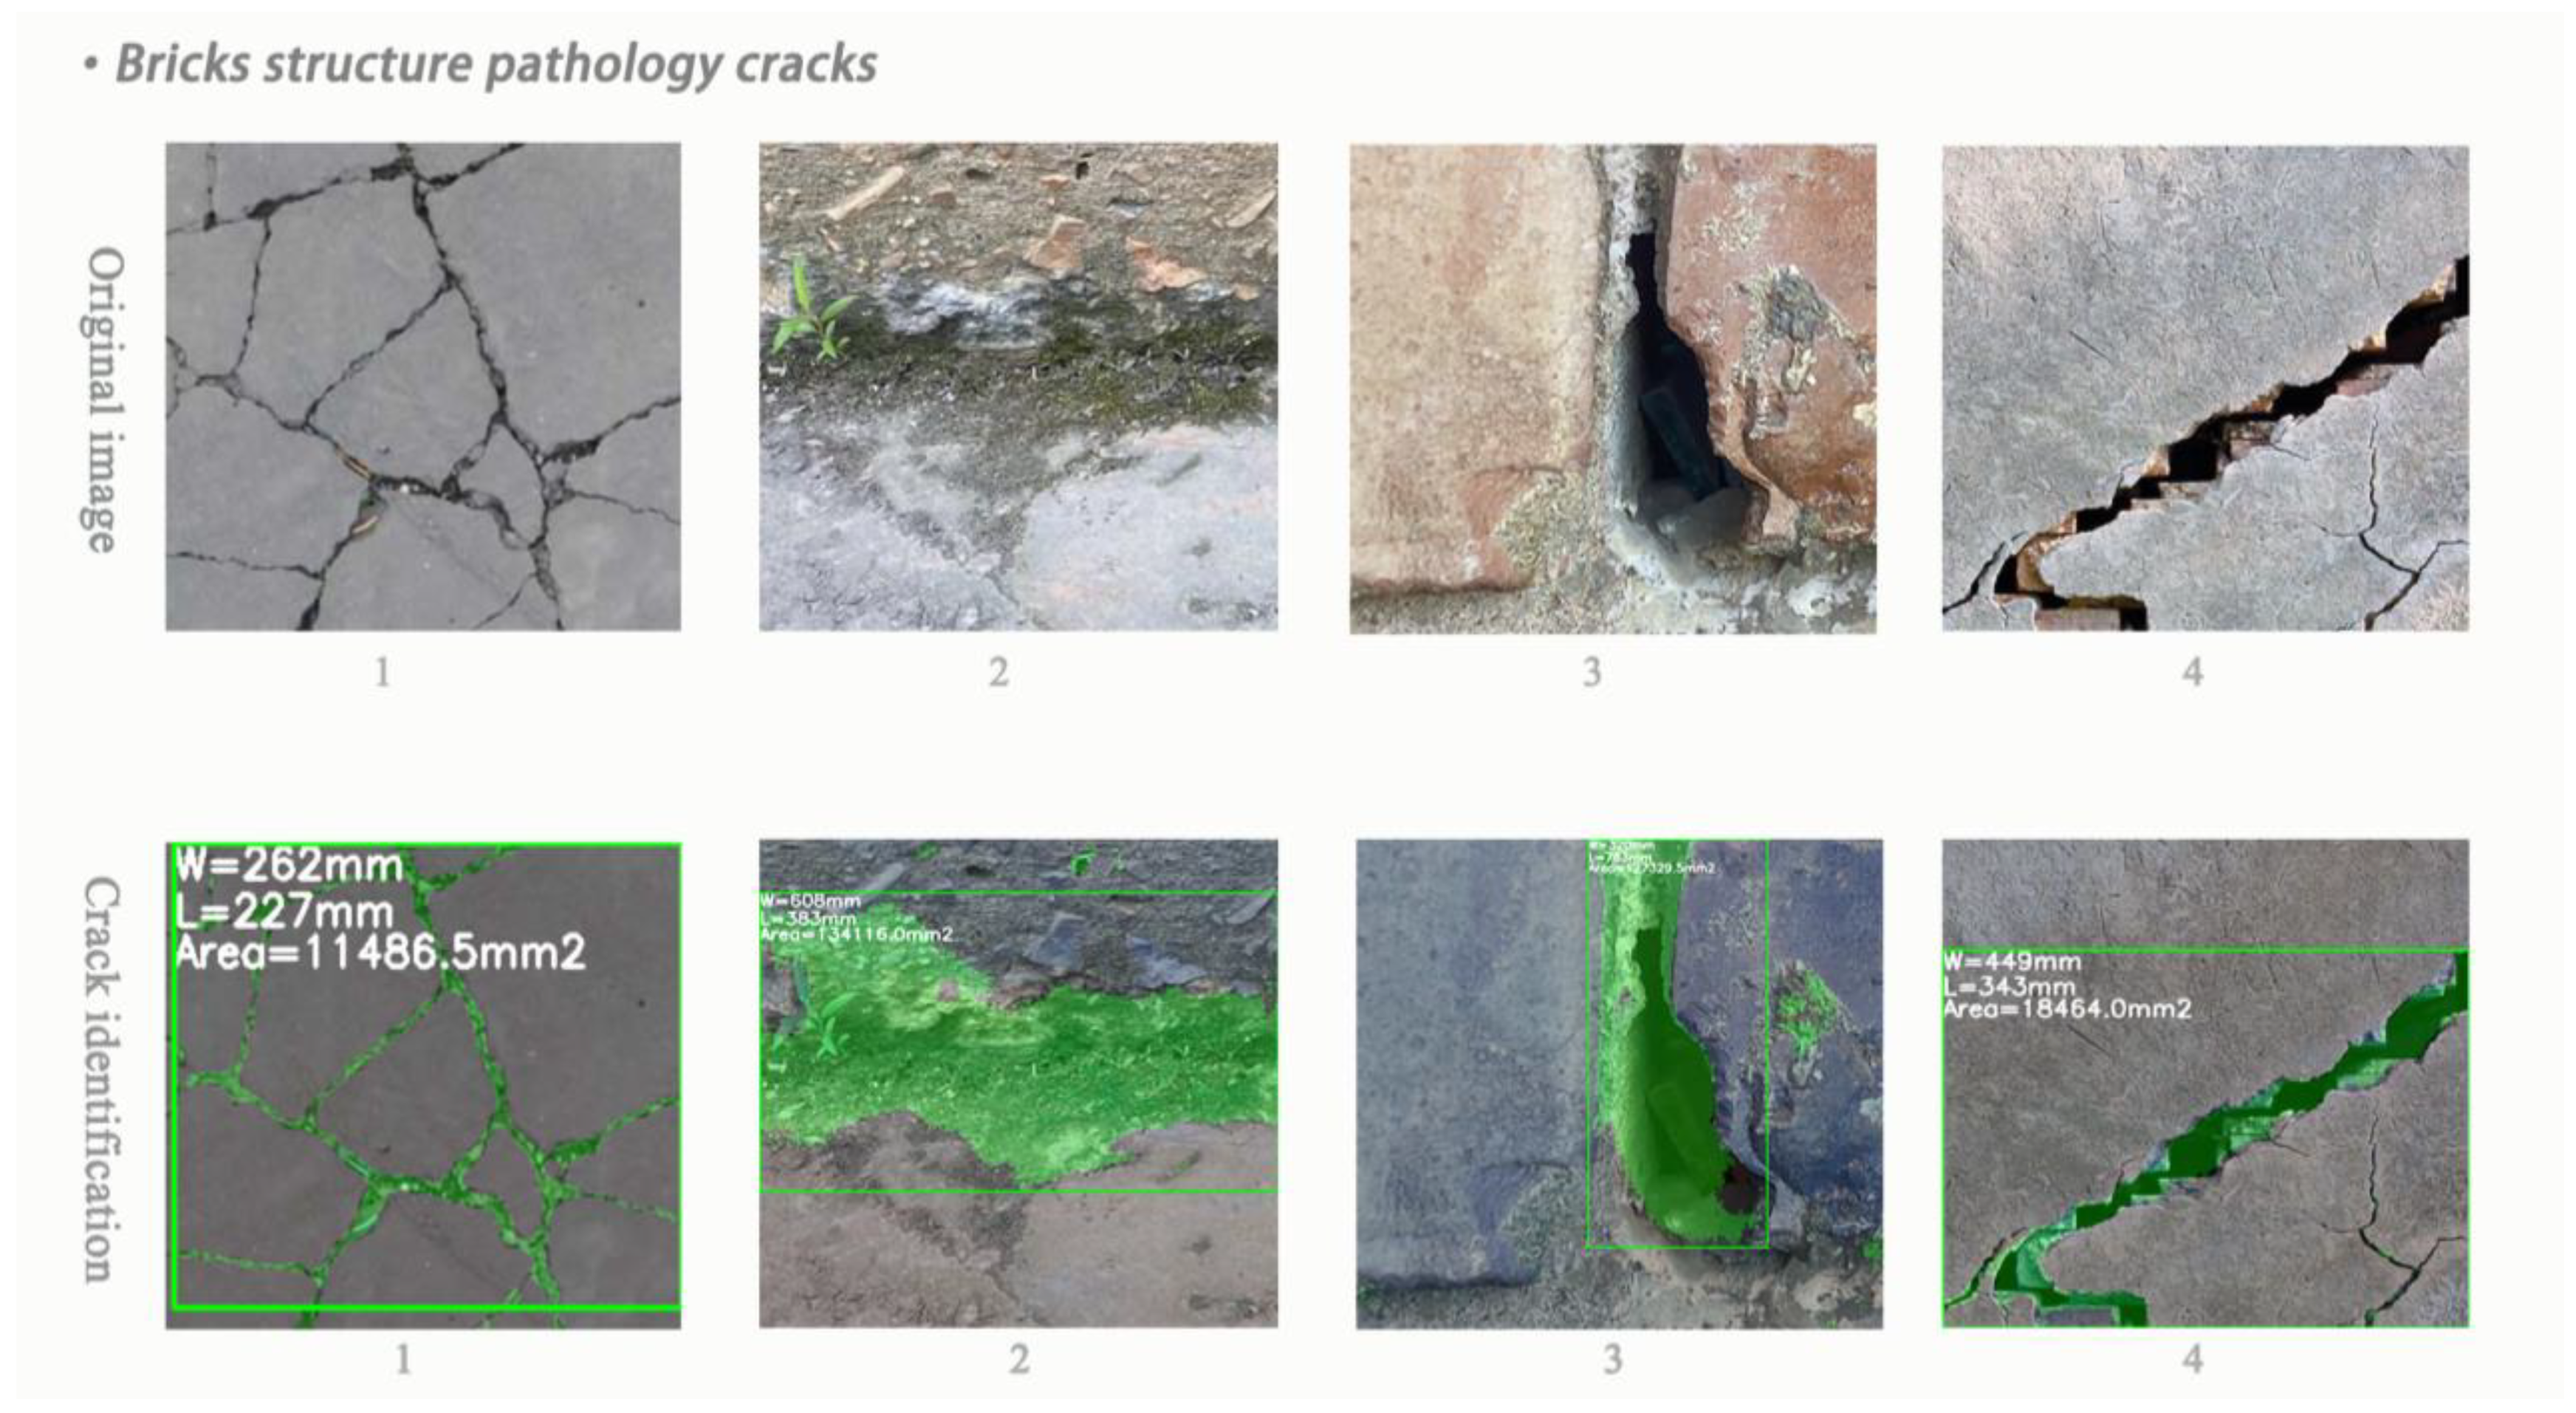
3.3.4. Identification and Calculation of Single Crack in James Jackson Gymnasium Based on FCN Deep Learning Model

According to the 155 pathology crack areas detected in James Jackson Gymnasium using the Mask R-CNN pathology crack area detection model, the fractures within these areas were further examined using the FCN-based pathology crack identification and calculation model [52]. The resulting separation of fractures was then individually identified and calculated (Figure 16). Since James Jackson Gymnasium is a masonry–timber building, cracks were classified and identified within both timber structures (Figure 17) and masonry structures (Figure 18).
To enhance recognition and calculation accuracy, the image size of the training set used for the model was set at 300 pixels, with the calculation unit defined as millimeters. High-precision 3D laser scanning technology was employed to obtain images of James Jackson Gymnasium, which were then adjusted to a multiple of 300 to align with the model’s calculation unit for fracture geometry information. A total of 375 pathology crack areas were identified and calculated within the 155 areas detected in James Jackson Gymnasium using the Mask R-CNN pathology crack area detection model. Within these, 156 cracks were found in timber structures and 219 in masonry structures.

3.4. Pathology Crack Restoration Strategy of Architectural Heritage

3.4.1. Analysis of the Causes of Pathology Crack

In order to effectively mitigate the impact of pathology cracks on masonry and timber structures in architectural heritage, we have compiled pathology crack analysis in Table 3 for timber structure architectural heritage and pathology crack analysis and in Table 4 for masonry structure architectural heritage based on the research findings and relevant literature [7,53,54,55,56,57]. This compilation aims to delve deeper into the underlying causes of these pathology cracks.

3.4.2. Pathology Cracks’ Graded Repair Strategy Table

Modern masonry–timber architectural heritage, which integrates many valuable elements such as history, art, science, and social value, is an important part of historical and cultural relics. However, in today’s era, many modern masonry–timber structures have developed cracks to varying degrees due to external factors, such as man-made destruction, wind and snow disasters, and environmental erosion. These cracks can have a detrimental impact on ancient masonry–timber structures. In addition, due to the different causes and environments of cracks in masonry structures and timber structures, we have developed a graded repair strategy table for timber structure architectural heritage pathology cracks (Table 5) and masonry structure architectural heritage pathology cracks (Table 6) based on the research findings of our team [57] and relevant specifications [58,59]. This approach aims to enhance the relevance of renovation strategies.

3.4.3. Strategies for Direct Restoration of Architectural Heritage in Pathology Cracks

According to the graded repair strategy table (Table 5), the direct restoration strategy is recommended for most cracks in non-load-bearing members and smaller cracks in load-bearing members. Additionally, a targeted direct repair strategy is formulated based on the component type of the pathology crack [60].
  • For timber structure members, the pathology crack direct repair strategy involves maintaining the original appearance and function while ensuring that the structure and stability are not compromised. Cracks are fixed and bonded tightly using timber strips and water-resistant adhesives. In cases of large damage area and developing trends, rectangular grooves with corresponding sizes are cut along the crack shape and sprinkled with water. The cracks are then filled with 1:1–1:2 cement mortar material consistent with the architectural heritage style, applied 2–3 times, and calendared for a smooth finish.
  • For masonry structural members, the pathology crack direct restoration strategy involves cleaning the crack base and filling it with stones of similar styles. In cases of large damage area and developing trends, a V-shaped groove, approximately 5 mm wide, is cut along the crack shape and filled with cement mortar, polyurethane, or synthetic rubber for sealing purposes.

3.4.4. Strategy of Strengthening and Then Restoring the Pathology Cracks of Architectural Heritage

According to the pathology crack Graded Restoration Strategy Table (Table 5), the strategy of strengthening first and repairing later is recommended for cracks in non-load-bearing members with large damage area and most cracks in load-bearing members. Additionally, a targeted strategy of strengthening first and then repairing is formulated based on the type of components where the pathology crack is located [61].
  • For timber structure members, steel anchor bolts and bolts are used to penetrate and clamp the strengthened section, improving the shear resistance. The pressure from tightening bolts helps to limit the expansion of the crack while reinforcing the section. Timber or steel plates are added to enhance the shear performance of timber members, ensuring structural stability and preventing further crack expansion. After reinforcement, appropriate repair strategies for the components are implemented.
  • For masonry structural members, outer sides or the other three sides of the structure can be covered with reinforced concrete sheaths to enhance steel bars and sections, boosting the original members’ bearing capacity. Alternatively, steel plates can be attached to the concrete surface with a structural adhesive to create a unified stress-bearing system [7]. Following reinforcement, the surface is painted with anti-corrosion paint to match the architectural heritage’s color and style, and a targeted restoration strategy for the pathology crack is executed.

4. Conclusions

Based on 3D laser scanning and two deep learning models, this paper proposes a pathology crack research system for the acquisition of pathology crack data, regional detection, single-crack identification and calculation, and a targeted hierarchical restoration strategy for masonry–timber architectural heritage. The regional crack detection model and single-crack identification and calculation model for masonry–timber architectural heritage are successfully established in this study, with the related model results being optimized and retrained. Subsequently, targeted hierarchical restoration strategies are proposed based on the pathology crack identification and calculation results, leading to the development of a detection and restoration system for masonry–timber architectural heritage. These research findings represent an innovative intersection of architecture and computer science, enabling the detection of crack areas and the identification and calculation of individual cracks in all masonry–timber architectural heritage. This study addresses the dearth of artificial intelligence research in the field of architectural heritage diseases, offering a novel research strategy for architectural heritage protection in the information age.
Considering that many architectural heritages are composed of masonry and timber structures, and that these structural types are susceptible to pathology cracks due to weather, materials, human activities, and other factors, this paper focuses on the pathology cracks of such structures. While the deep learning models presented demonstrate high identification and calculation accuracy for masonry–timber structures, other structural types have not been explored. Future research should consider expanding the model training set to include a wider variety of materials and pathology crack states in order to broaden the identification capabilities for architectural heritage of various structural types.
Furthermore, we aim to integrate deep learning with Historic Building Information Modelling (HBIM) in order to construct a three-dimensional disease model based on the two-dimensional geometric data of architectural heritage. This approach will establish a sustainable method for recording, monitoring, repairing, and managing information related to architectural heritage diseases. Ultimately, it will lead to the creation of digital twins [62] of architectural heritage, facilitating the seamless integration of artificial intelligence and architecture.

Author Contributions

Conceptualization, S.L.; methodology, S.L.; software, S.L. and H.W.; formal analysis, S.L. and H.W.; investigation, S.L. and H.W.; writing—original draft preparation, S.L. and H.W.; writing—review and editing, H.W.; visualization, S.L. and H.W.; supervision, H.W.; funding acquisition, H.W. All authors have read and agreed to the published version of the manuscript.

Funding

This research was funded by the Doctoral Fund of Hubei University of Technology: “Research on the protection of modern educational architectural heritage from the perspective of sustainable development” (grant number BSQD2019044) and the Intelligent Construction and Prefabricated Building Consulting and Research (grant number 2024107).

Data Availability Statement

The original contributions presented in the study are included in the article, further inquiries can be directed to the corresponding authors.

Conflicts of Interest

The authors declare no conflicts of interest.

References

  1. Latifi, R.; Hadzima-Nyarko, M.; Radu, D.; Rouhi, R. A brief overview on crack patterns, repair and strengthening of historical masonry structures. Materials 2023, 16, 1882. [Google Scholar] [CrossRef] [PubMed]
  2. Croci, G. The Conservation and Structural Restoration of Architectural Heritage; WIT Press: Southampton, UK, 1998; Volume 1. [Google Scholar]
  3. Alessandri, C.; Garutti, M.; Mallardo, V.; Milani, G. Crack patterns induced by foundation settlements: Integrated analysis on a renaissance masonry palace in Italy. Int. J. Archit. Herit. 2015, 9, 111–129. [Google Scholar] [CrossRef]
  4. Ávila, F.; Puertas, E.; Torrús, C.; Gallego, R. Influence of crack propagation on the seismic behavior of historic rammed earth buildings: The Tower of Muhammad in the Alhambra (Spain). Eng. Struct. 2024, 301, 117365. [Google Scholar] [CrossRef]
  5. Chen, Y.; Zhu, Z.; Lin, Z.; Zhou, Y. Building Surface Crack Detection Using Deep Learning Technology. Buildings 2023, 13, 1814. [Google Scholar] [CrossRef]
  6. Wang, N.; Zhao, X.; Zhao, P.; Zhang, Y.; Zou, Z.; Ou, J. Automatic damage detection of historic masonry buildings based on mobile deep learning. Autom. Constr. 2019, 103, 53–66. [Google Scholar] [CrossRef]
  7. Wang, Z. Architectural Heritage Protection Token Recognition and Restoration Design Driven by Deep Learning. Master’s Thesis, Qingdao University of Science and Technology, Qingdao, China, June 2023. [Google Scholar]
  8. Yin, Y.; Antonio, J. Application of 3D laser scanning technology for image data processing in the protection of ancient building sites through deep learning. Image Vis. Comput. 2020, 102, 103969. [Google Scholar] [CrossRef]
  9. Germanese, D.; Pascali, M.A.; Berton, A.; Leone, G.R.; Moroni, D.; Jalil, B.; Tampucci, M.; Benassi, A. Architectural Heritage: 3D Documentation and Structural Monitoring Using UAV. In Proceedings of the VIPERC@ IRCDL, Pisa, Italy, 30 January 2019; pp. 1–12. [Google Scholar]
  10. Wang, H.; Wu, J.; Yuan, Q.; Li, M. Crack Detection and Feature Extraction of Heritage Architecture Via Point Clouds. Measurement 2024. preprint. [Google Scholar] [CrossRef]
  11. Remondino, F. From point cloud to surface: The modeling and visualization problem. International Archives of the Photogrammetry. Remote Sens. Spat. Inf. Sci. 2003, 34. [Google Scholar]
  12. Nie, X.; Duan, M.; Ding, H.; Hu, B.; Wong, E.K. Attention mask R-CNN for ship detection and segmentation from remote sensing images. IEEE Access 2020, 8, 9325–9334. [Google Scholar] [CrossRef]
  13. Bi, X.; Hu, J.; Xiao, B.; Li, W.; Gao, X. IEMask R-CNN: Information-Enhanced Mask R-CNN. IEEE Trans. Big Data 2022, 9, 688–700. [Google Scholar] [CrossRef]
  14. Sun, X.; Wu, P.; Hoi, S.C. Face detection using deep learning: An improved faster RCNN approach. Neurocomputing 2018, 299, 42–50. [Google Scholar] [CrossRef]
  15. Huang, Z.; Zhong, Z.; Sun, L.; Huo, Q. Mask R-CNN with pyramid attention network for scene text detection. In Proceedings of the 2019 IEEE Winter Conference on Applications of Computer Vision (WACV), Waikoloa Village, HI, USA, 7 January 2019; pp. 764–772. [Google Scholar]
  16. Fernberg, P.; Chamberlain, B. Artificial Intelligence in Landscape Architecture: A Literature Review. Landsc. J. 2023, 42, 13–35. [Google Scholar] [CrossRef]
  17. Yoon, J.; Shin, H.; Kim, K.; Lee, S. CNN-and UAV-Based Automatic 3D Modeling Methods for Building Exterior Inspection. Buildings 2023, 14, 5. [Google Scholar] [CrossRef]
  18. Wu, M.; Yue, H.; Wang, J.; Huang, Y.; Liu, M.; Jiang, Y.; Ke, C.; Zeng, C. Object detection based on RGC mask R-CNN. IET Image Process. 2020, 14, 1502–1508. [Google Scholar] [CrossRef]
  19. Sun, J.; Peng, Y.; Guo, Y.; Li, D. Segmentation of the multimodal brain tumor image used the multi-pathway architecture method based on 3D FCN. Neurocomputing 2021, 423, 34–45. [Google Scholar] [CrossRef]
  20. Shang, W.; He, C.; Lv, S. Sustainable Renewal of Spontaneous Spatial Characteristics of a Historic–Cultural District: A Case Study of Tanhualin, Wuhan, China. Sustainability 2023, 15, 2038. [Google Scholar] [CrossRef]
  21. Qitong, X. Protection and utilization of the former site of JAMES JACKSON Gymnasium Fitness Center. Jianghan Archaeol. 2015, 04, 122–125+2+129. [Google Scholar]
  22. Jing, D. Research on modern educational architecture in Wuhan. Ph.D. Thesis, Huazhong University of Science and Technology, Wuhan, China, 2006. [Google Scholar]
  23. Mitka, B.; Pluta, M. Comparative analysis of the process of creating a 3d model of architecture object with using laser scanning and structure from motion technologies 1. Int. Multidiscip. Sci. GeoConf. SGEM 2016, 2, 847–854. [Google Scholar]
  24. Cheng, X.J.; Jin, W. Study on reverse engineering of historical architecture based on 3D laser scanner. J. Phys. Conf. Ser. 2006, 48, 843. [Google Scholar] [CrossRef]
  25. Hu, Q.; Wang, S.; Fu, C.; Ai, M.; Yu, D.; Wang, W. Fine surveying and 3D modeling approach for wooden ancient architecture via multiple laser scanner integration. Remote Sens. 2016, 8, 270. [Google Scholar] [CrossRef]
  26. Lerma, J.L.; Navarro, S.; Cabrelles, M.; Seguí, A.E.; Haddad, N.; Akasheh, T. Integration of laser scanning and imagery for photorealistic 3D architectural documentation. In Laser Scanning, Theory and Applications; Books on Demand: Murfreesboro, TN, USA; pp. 414–430.
  27. Bharati, P.; Pramanik, A. Deep learning techniques—R-CNN to mask R-CNN: A survey. In Computational Intelligence in Pattern Recognition: Proceedings of CIPR 2019; Springer: Berlin/Heidelberg, Germany, 2020; pp. 657–668. [Google Scholar]
  28. Lin, K.; Zhao, H.; Lv, J.; Li, C.; Liu, X.; Chen, R.; Zhao, R. Face detection and segmentation based on improved mask R-CNN. Discret. Dyn. Nat. Soc. 2020, 2020, 9242917. [Google Scholar] [CrossRef]
  29. Xu, X.; Zhao, M.; Shi, P.; Ren, R.; He, X.; Wei, X.; Yang, H. Crack detection and comparison study based on faster R-CNN and mask R-CNN. Sensors 2022, 22, 1215. [Google Scholar] [CrossRef] [PubMed]
  30. Zhang, Y.; Chu, J.; Leng, L.; Miao, J. Mask-refined R-CNN: A network for refining object details in instance segmentation. Sensors 2020, 20, 1010. [Google Scholar] [CrossRef] [PubMed]
  31. Xing, Y.; Zhong, L.; Zhong, X. An encoder-decoder network based FCN architecture for semantic segmentation. Wirel. Commun. Mob. Comput. 2020, 2020, 8861886. [Google Scholar] [CrossRef]
  32. Bhatt, D.; Patel, C.; Talsania, H.; Patel, J.; Vaghela, R.; Pandya, S.; Modi, K.; Ghayvat, H. CNN variants for computer vision: History, architecture, application, challenges and future scope. Electronics 2021, 10, 2470. [Google Scholar] [CrossRef]
  33. Hazirbas, C.; Ma, L.; Domokos, C.; Cremers, D. Fusenet: Incorporating depth into semantic segmentation via fusion-based cnn architecture. In Proceedings of the Computer Vision–ACCV 2016: 13th Asian Conference on Computer Vision, Taipei, Taiwan, 20–24 November 2016; Revised Selected Papers, Part I 13. Springer International Publishing: New York, NY, USA, 2017; pp. 213–228. [Google Scholar]
  34. Sun, Y.; Xue, B.; Zhang, M.; Yen, G.G.; Lv, J. Automatically designing CNN architectures using the genetic algorithm for image classification. IEEE Trans. Cybern. 2020, 50, 3840–3854. [Google Scholar] [CrossRef] [PubMed]
  35. Barton, J. 3D laser scanning and the conservation of earthen architecture: A case study at the UNESCO World Heritage Site Merv, Turkmenistan. World Archaeol. 2009, 41, 489–504. [Google Scholar] [CrossRef]
  36. Dawson, P.C.; Levy, R.M.; Oetelaar, G.; Arnold, C.; Lacroix, D.; Mackay, G. Documenting Mackenzie Inuit architecture using 3D laser scanning. Alsk. J. Anthropol. 2009, 7, 29–44. [Google Scholar]
  37. Wu, C.; Yuan, Y.; Tang, Y.; Tian, B. Application of terrestrial laser scanning (TLS) in the architecture, engineering and construction (AEC) industry. Sensors 2021, 22, 265. [Google Scholar] [CrossRef]
  38. Huber, D.; Akinci, B.; Tang, P.; Adan, A.; Okorn, B.; Xiong, X. Using laser scanners for modeling and analysis in architecture, engineering, and construction. In Proceedings of the 2010 44th Annual Conference on Information Sciences and Systems (CISS), Princeton, NJ, USA, 17–19 March 2010; pp. 1–6. [Google Scholar]
  39. Monti, C.; Fregonese, L.; Achille, C. Laser scanner application on complex shapes of architecture. Profiles extraction processing and 3d modeling. Int. Arch. Photogramm. Remote Sens. Spat. Inf. Sci. 2003, 34, 5. [Google Scholar]
  40. Pires, M.; Borg, C. 3D Laser Scanning of Architectural Sites. In Handbook on the Use of Lasers in Conservation and Conservation Science; 2015; Available online: http://www.science4heritage.org/COSTG7/booklet/chapters/3D.htm (accessed on 20 February 2024).
  41. Pawłowicz, J.A. Importance of laser scanning resolution in the process of recreating the architectural details of historical buildings. IOP Conf. Ser. Mater. Sci. Eng. 2017, 245, 052038. [Google Scholar] [CrossRef]
  42. Smits, J. Application of 3D terrestrial laser scanning to map building surfaces. J. Archit. Conserv. 2011, 17, 81–94. [Google Scholar] [CrossRef]
  43. Dinis, F.M.; Sanhudo, L.; Martins, J.P.; Ramos, N.M. Improving project communication in the architecture, engineering and construction industry: Coupling virtual reality and laser scanning. J. Build. Eng. 2020, 30, 101287. [Google Scholar] [CrossRef]
  44. Frei, M.; Kruis, F.E. FibeR-CNN: Expanding Mask R-CNN to improve image-based fiber analysis. Powder Technol. 2021, 377, 974–991. [Google Scholar] [CrossRef]
  45. Sewak, M.; Sahay, S.K.; Rathore, H. An overview of deep learning architecture of deep neural networks and autoencoders. J. Comput. Theor. Nanosci. 2020, 17, 182–188. [Google Scholar] [CrossRef]
  46. Zhang, M.; Cui, Z.; Neumann, M.; Chen, Y. An end-to-end deep learning architecture for graph classification. In Proceedings of the AAAI Conference on Artificial Intelligence, New Orleans, LA, USA, 2–7 February 2018; Volume 32. [Google Scholar]
  47. Somu, N.; MR, G.R.; Ramamritham, K. A deep learning framework for building energy consumption forecast. Renewable and Sustain. Energy Rev. 2021, 137, 110591. [Google Scholar] [CrossRef]
  48. Yu, Y.; Wang, C.; Gu, X.; Li, J. A novel deep learning-based method for damage identification of smart building structures. Struct. Health Monit. 2019, 18, 143–163. [Google Scholar] [CrossRef]
  49. Zhong, B.; Xing, X.; Love, P.; Wang, X.; Luo, H. Convolutional neural network: Deep learning-based classification of building quality problems. Adv. Eng. Inform. 2019, 40, 46–57. [Google Scholar] [CrossRef]
  50. Olu-Ajayi, R.; Alaka, H.; Sulaimon, I.; Sunmola, F.; Ajayi, S. Building energy consumption prediction for residential buildings using deep learning and other machine learning techniques. J. Build. Eng. 2022, 45, 103406. [Google Scholar] [CrossRef]
  51. Perez, H.; Tah, J.H.; Mosavi, A. Deep learning for detecting building defects using convolutional neural networks. Sensors 2019, 19, 3556. [Google Scholar] [CrossRef]
  52. Hou, X.; Zeng, Y.; Xue, J. Detecting structural components of building engineering based on deep-learning method. J. Constr. Eng. Manag. 2020, 146, 04019097. [Google Scholar] [CrossRef]
  53. Torok, M.M.; Golparvar-Fard, M.; Kochersberger, K.B. Image-based automated 3D crack detection for post-disaster building assessment. J. Comput. Civ. Eng. 2014, 28, A4014004. [Google Scholar] [CrossRef]
  54. Sadat-Shojai, M.; Ershad-Langroudi, A. Polymeric coatings for protection of historic monuments: Opportunities and challenges. J. Appl. Polym. Sci. 2009, 112, 2535–2551. [Google Scholar] [CrossRef]
  55. Marcus, B.; Ziegert, C.; Paganoni, S.; Mahdy, H.; Muhammad, S. Conservation and structural stabilization of al Hayla tower in the Liwa Oasis, Abu Dhabi. J. Archit. Conserv. 2019, 25, 104–116. [Google Scholar] [CrossRef]
  56. Fodde, E.; Cooke, L. Structural consolidation of mud brick masonry. J. Archit. Conserv. 2013, 19, 265–281. [Google Scholar] [CrossRef]
  57. Wang, H.; Hu, Z.; Huang, Y.; Chen, M.; Hu, L.; Zhou, Q. Construction Technologies and Conservation Strategies for the Bell Tower of Former Nanking University (Nanjing, China)—A Case Study of a Typical Architectural Heritage of the American Church School in the Late 19th Century. Buildings 2022, 12, 2251. [Google Scholar] [CrossRef]
  58. GB50292-2015; National Standard of the People’s Republic of China-Reliability Appraisal Standard of Civil Buildings. Ministry of Housing and Urban-Rural Development: Beijing, China, 2015. Available online: https://www.mohurd.gov.cn/gongkai/zhengce/zhengcefilelib/201601/20160126_226450.html (accessed on 19 March 2024).
  59. DB11/T637-2009; Beijing Local Standard-Building Structure Safety Appraisal Standard. Beijing Municipial Commision of Housing and Urban and Rural Development: Beijing, China. Available online: https://zjw.beijing.gov.cn (accessed on 19 March 2024).
  60. Kumar, V.; Singh, R.; Ahuja IP, S.; Hashmi, M.J. On technological solutions for repair and rehabilitation of heritage sites: A review. Adv. Mater. Process. Technol. 2020, 6, 146–166. [Google Scholar] [CrossRef]
  61. Gangane, A.S.; Khandve, P.V.; Dhawade, S.M. Special Repair Techniques for Masonry and Heritage Structures. Int. J. Res. Eng. Sci. Technol. 2015, 1, 129–135. [Google Scholar]
  62. Vuoto, A.; Funari, M.F.; Lourenço, P.B. Shaping digital twin concept for built cultural heritage conservation: A systematic literature review. Int. J. Archit. Herit. 2023, 1–34. [Google Scholar] [CrossRef]
Figure 1. (a) Location of Hubei Province in China; (b) location of Wuhan City in Hubei Province; (c) location of James Jackson Gymnasium in the Tanhualin historic district and the overview of the architectural heritage in the Tanhualin historic district. (d) Exterior picture of James Jackson Gymnasium before restoration. (a,b) Source: produced by the standard map service website: https://www.resdc.cn; (c,d) Source: self-drawn by the authors.
Buildings 14 01129 g001
Figure 2. Calculation principle of 3D laser scanner target point imaging (left); James Jackson Gymnasium was surveyed using a 3D laser scanner on site (right).
Buildings 14 01129 g002
Figure 3. The principle of Mask R-CNN pathology crack detection model to achieve target detection in two-dimensional images.
Buildings 14 01129 g003
Figure 4. FCN pathology crack identification and computational model generation principle. The numbers below each convolutional layer represent the number of images stacked in each layer. For example, 256 means that the layer is composed of 256 × 256 × 256 images stacked.
Buildings 14 01129 g004
Figure 5. Research framework.
Buildings 14 01129 g005
Figure 6. Schematic diagram of James Jackson Gymnasium station and point layout in 3D laser scanning.
Buildings 14 01129 g006
Figure 7. Principle of obtaining millions of high-precision image data of 3D laser scanner by using James Jackson Gymnasium.
Buildings 14 01129 g007
Figure 8. James Jackson Gymnasium point cloud data model at spliced measuring station 1 (measuring points 1–15) and the scanning panorama corresponding to each measuring point, and the right text part is the total number of point cloud data points contained in the measuring point (left); the scanning panorama corresponding to each measuring point of James Jackson Gymnasium point cloud data model at spliced measuring station 6 (measuring points 76–90), and the right text part is the total number of point cloud data points contained in the measuring point (right).
Buildings 14 01129 g008
Figure 9. Architectural heritage pathology cracks training dataset. In order to enhance recognition accuracy, annotated images are predefined and displayed within a white box. Green signifies the window category, yellow signifies another category, purple signifies architectural heritage pathology cracks, and the portion within the black box represents the running code.
Buildings 14 01129 g009
Figure 10. Operation interface and result display of a pathology crack area detection model based on the Mask R-CNN deep learning algorithm. Green marks indicate windows, while purple marks indicate building pathology cracks (left). The black box on the right side represents the running code (right).
Buildings 14 01129 g010
Figure 11. Based on Mask R-CNN crack area detection model, the James Jackson Gymnasium area detection results of pathology cracks are displayed. Green is marked as window class, yellow is marked as category, and purple is marked as architectural heritage pathology cracks.
Buildings 14 01129 g011
Figure 12. Training set for identifying and quantifying pathology cracks in architectural heritage. The image on the left displays pathology cracks in masonry structure (left), while the image on the right shows annotated pathology cracks in timber structure (right). To enhance recognition accuracy, the annotation image is predefined and displayed within a white box, with the black box containing the running code.
Buildings 14 01129 g012
Figure 13. The influence of different initial learning rates in the training process of pathology crack recognition and calculation model of architectural heritage. The horizontal axis in the figure represents the training iteration (step), while the vertical axis represents the loss value. In each subgraph, the solid line represents the training loss, and the dotted line marked with ‘x’ represents the loss verification.
Buildings 14 01129 g013
Figure 14. In the training process of pathology crack recognition and calculation model of architectural heritage, the training accuracy and verification accuracy change with the training period (epoch) under different initial learning rates. The horizontal axis in the figure represents the training period, while the vertical axis represents the training accuracy and verification accuracy of the model.
Buildings 14 01129 g014
Figure 15. Process demonstration of a pathology crack segmentation model based on the FCN deep learning algorithm. The division of cracks is indicated by a gradient from purple to light yellow based on area size. The extraction of fracture structure assigns the yellow part as the center point of the fracture, the orange part as the edge of the fracture, and the remaining parts decrease in intensity relative to their distance from the center point.
Buildings 14 01129 g015
Figure 16. Operation interface and result display of pathology crack area detection model based on FCN deep learning algorithm. The selected area in the green box on the left side is the pathology crack part recognized by the model, and the white text part is the calculation result of pathology crack geometric information after recognition (W: width, L: length Area: path crack area); The black box on the right side is the running code.
Buildings 14 01129 g016
Figure 17. James Jackson Gymnasium recognition and calculation results display of pathology crack timber structure based on FCN deep learning model. The selected area in the green box is the pathology crack part recognized by the model, and the white text part is the calculation result of pathology crack geometric information (W: width, L: length Area: path crack area) after recognition.
Buildings 14 01129 g017
Figure 18. James Jackson Gymnasium recognition and calculation results display of pathology crack masonry structure based on FCN deep learning model. Among them, the green box selected area is the pathology crack part recognized by the model, and the white character part is the calculation result of pathology crack geometric information after recognition.
Buildings 14 01129 g018
Table 1. Schedule of James Jackson Gymnasium doors details database.
Door TypeFloor LevelWidth
(mm)
Height
(mm)
Bottom Height
(mm)
Total
(Piece)
Main entrance double-sided veneer wooden doorFirst floor1800210002
Interior single-panel wooden doorFirst floor700290002
Interior double-leaf hinged wooden doorFirst floor1100290009
Interior door opening-1First floor90024001502
Interior door opening-2First floor1060210002
Interior door opening-3First floor1300240006
Interior door opening-4First floor150024001501
Interior single-recessed panel wooden doorSecond floor900240001
Interior single-recessed panel glass doorSecond floor700210002
Corridor single-recessed panel glass doorSecond floor9002100201
Corridor double-sided recessed panel wooden doorSecond floor12002100202
Table 2. Schedule of James Jackson Gymnasium windows details database.
Window TypeFloor LevelWidth
(mm)
Height
(mm)
Bottom Height
(mm)
Total
(Piece)
East elevation single-leaf casement window-1First floor70015009002
East elevation single-leaf casement window-2First floor70020006002
East elevation single-leaf casement window-3First floor70020009005
East elevation double-leaf casement window-1First floor90015009001
East elevation double-leaf casement window-2First floor106015009001
North elevation single-leaf casement window-1First floor13009005301
North elevation single-leaf casement window-2First floor1500150090010
North elevation single-leaf casement window-3First floor900150017309
South elevation single-leaf casement window-1First floor70090053010
South elevation single-leaf casement window-2First floor1200150010002
Window openingSecond floor134040002
Round fixed windowSecond floor120012009002
South elevation single-leaf casement window-1Second floor900150017306
South elevation single-leaf casement window-2Second floor980150017301
South elevation double-leaf casement window-1Second floor1200150017302
South elevation double-leaf casement window-1Second floor1500180017301
Table 3. Pathology crack analysis table of timber structure architectural heritage.
Crack PropertiesCauses of CracksOccurring LocationsCrack Forms
Shrinkage crackOwn defectsDoor and window openingsHorizontal crack
Fungal corrosionRoof trussesVertical crack
Natural weatheringSunny side is shallowerOblique crack
biological invasionShady side is deeperIntersected crack
Load crackLocal compressionColumn under concentrated loadVertical cracks on the side with higher pressure; Horizontal crack on the other side
Eccentric compressionColumn subjected to eccentric loadVertical crack
Shear failureBeam under horizontal loadHorizontal crack
Stepped crack
Metal parts corroded and loose
take off
Door window opening
Roof truss
Horizontal crack
Vertical crack
Table 4. Pathology crack analysis table of masonry architectural heritage.
Crack PropertiesCauses of CracksOccurring LocationsCrack Forms
Shrinkage crackCooling and shrinkingDoor and window opening
Sunny surface is deeper
than shallow shade
Oblique crack
Horizontal crack
Vertical crack
Intersected crack
Solar thermal expansion
Material shrinkage
Load crackPressure damageMiddle part of the load-bearing wall and its windowVertical crack
local compressionWalls or columns subject to concentrated loadsVertical crack on the side with higher pressure; Horizontal crack on the other side
Eccentric compressionWalls or columns subject to eccentric loadsVertical crack
Shear failureWalls subject to horizontal loadsHorizontal crack
Stepped crack
Settlement crackUneven settlement due to damp weather or change of foundation soilWall between windowsHorizontal crack
Junction of vertical and horizontal walls, bottom windowsillVertical crack
Window corners with large vertical deformation of longitudinal and transverse wallsOrthogonal oblique crack
Window corners with large deflection of longitudinal and transverse wallsInverted splayed oblique crack
Table 5. Graded repair strategy table for cracks in timber structure architectural heritage (unit mm). Note: l 0 in the table is the calculated span of components; h 0 is the calculated height of components; l c is the length of the unsupported part of the column; ρ is the inclination rate of the member: ρ = y/x (x is the length of the member on the selected horizontal plane, and y is the height of the member perpendicular to the horizontal plane); Sc is the corrosion area on the section; S is the total section area. Lateral bending in the table is mainly caused by wood growth, drying, and improper construction. Original data sources: National Standard of the People’s Republic of China-Reliability Appraisal Standard of Civil Buildings (GB50292-2015) [58]; Beijing Local Standard-Building Structure Safety Appraisal Standard (DB11/T637-2009) [59].
Items for InspectionGrade AGrade BGrade CGrade D
Maximum deflectionTruss or bracket< l 0 / 250 l 0 / 250
< l 0 / 200
l 0 / 200
< l 0 / 120
l 0 / 120
Main beam< l 0 / 250 l 0 / 250
< l 0 / 200
l 0 / 200
< l 0 / 150
l 0 2 /3000   h 0
or ≥ / 150
Joist or purline< l 0 / 250 l 0 / 250
< l 0 / 150
l 0 / 150
< l 0 / 120
l 0 2 /2400   h 0
or ≥ / 120
Rafter < l 0 / 150 l 0 / 250
< l 0 / 120
l 0 / 120
< l 0 / 100
l 0 / 100
Vertical height of lateral bendingColumns or other compressive members< l c / 250 l c / 250
< l c / 200
l c / 200
< l c / 150
l c / 150
Rectangular section timber beam< l 0 / 250 l 0 / 250
< l 0 / 200
l 0 / 200
< l 0 / 150
l 0 / 150
Texture or crackTension memberNone ρ < 3%3% ≤ ρ < 7%ρ ≥ 7%
Bending memberNoneρ < 5%5% ≤ ρ < 10%ρ ≥ 10%
Eccentric compression
member
Noneρ < 7%7% ≤ ρ < 15%ρ ≥ 15%
Axial compression memberNoneρ < 10%10% ≤ ρ < 20%ρ ≥ 20%
Surface corrosionLoad-bearing structural members at the topNoneSc ≤ 3%S3%S < Sc ≤
5%S
Sc > 5%S
ColumnNoneSc ≤ 5%S5%S < Sc ≤
10%S
Sc > 10%S
Internal corrosionAll membersNoneSc ≤ 3%SSc ≤ 5%SSc > 10%S
Graded renovation strategyAll membersDirect
repair
Direct
repair
Reinforce
before repair
Reinforce
before repair
Table 6. Graded repair strategy table for cracks in masonry structure architectural heritage (unit mm). Note: W in the table represents the crack width of components. Original data sources: National Standard of the People’s Republic of China-Reliability Appraisal Standard of Civil Buildings (GB50292-2015) [58]; Beijing Local Standard-Building Structure Safety Appraisal Standard (DB11/T637-2009) [59].
Items for
Inspection
Member
Category
Crack TypeGrade AGrade BGrade CGrade D
Bearing crackWallInsufficient local
pressure
NoneW < 1.01.0 ≤ W < 3.0W ≥ 3.0
Insufficient bearing capacityNoneW < 1.01.0 ≤ W < 2.0W ≥ 2.0
ColumnInsufficient bearing capacityNoneW < 0.50.5 ≤ W < 1.0W ≥ 1.0
Non-bearing crackWallTemperature
difference,
shrinkage, foundation settlement
NoneW < 5.05.0 ≤ W < 10W ≥ 10
ColumnNoneW < 1.01.0 ≤ W < 2.0W ≥ 2.0
Graded renovation strategyAll membersDirect
repair
Direct
repair
Reinforce before repairReinforce before repair
Disclaimer/Publisher’s Note: The statements, opinions and data contained in all publications are solely those of the individual author(s) and contributor(s) and not of MDPI and/or the editor(s). MDPI and/or the editor(s) disclaim responsibility for any injury to people or property resulting from any ideas, methods, instructions or products referred to in the content.

