1. Introduction
The use of domestic timber is attracting attention as an initiative to achieve carbon neutrality by 2050 and to realize a sustainable society. In addition to being a material that consumes little energy during production, wood is expected to be a climate change countermeasure because trees store the carbon they absorb. Japan has a high forest coverage of 67% of its land area, of which 60% is natural forests and 40% planted forests. Plantation forests are mainly composed of coniferous trees such as cedar and cypress; since approximately 50% of the planted forests are more than 50 years old and in the process of being cut down and harvested, measures to expand the use of domestic coniferous trees are being strongly promoted. The development and utilization of wood-based structural materials has been promoted by new laws to convert medium- and large-sized buildings to wood and wood materials, and compressed cedar boards have been developed for use in furniture, among other measures.
On the other hand, the self-sufficiency rate of domestic hardwoods is as low as 10%, and most of its use is for chips. However, in recent years, due to factors such as the wood shock and the price hike of foreign timber caused by the situation in Russia and Ukraine, the furniture industry experimented with the use of domestic hardwoods.
This study will determine the impact of the use of domestic hardwood lumber in wooden furniture on the GHG emissions of the product. As a case study on GHG emissions from wooden furniture, an evaluation of eight pieces of wooden furniture produced by three different furniture manufacturers in Finland [
1] revealed that raw materials have the largest impact on total GHG emissions. An evaluation of locally produced and consumed school desks in Italy indicated that GHG emissions from the use of adhesives and metal products could be a hot spot for reduction by optimizing the transportation process [
2]. An assessment of wooden furniture in Germany pointed out that the choice of wood products for raw materials and the use of metal parts have a significant impact on GHG emissions [
3]. In addition, many other research papers have been reported worldwide in recent years as using the LCA and CFP of furniture products as keywords [
4,
5,
6,
7,
8,
9]. In Japan, the SuMPO environmental labeling program, a type III environmental labeling program conducted by the Sustainable Management Promotion Organization, Japan, evaluated stools from a wooden furniture company and found that emissions from the production stage were the largest [
10]. As described above, while examples of LCA for wooden furniture have been accumulated in Japan and around the world, there are few examples that focus on the origin and transportation process of wood. Furthermore, there are few reports that focus on the impact on GHG emissions from the life cycle of the supply chain of local production for local consumption. In promoting the use of domestic hardwoods for furniture in Japan, it is necessary to accurately understand the GHG emissions reduction effect of shifting the timber origin from overseas to domestic sources.
In this study, GHG emissions were calculated by life cycle assessment for wooden chairs manufactured by two wooden furniture manufacturers in the Hida-Takayama region of Gifu Prefecture, which is famous for its wooden furniture production. In addition, carbon storage derived from the wood used was calculated. Next, GHG emissions were calculated and compared when the wood used in the product was switched from local production (in the Tohoku region) to regional production (in Gifu Prefecture), thereby verifying the effect of promoting local production for local consumption in reducing GHG emissions.
2. Subjects and Methods
2.1. Valuation Target
GHG emissions were calculated for two wooden furniture manufacturers (Companies A and B) in the Hida Takayama region of Gifu Prefecture, one of Japan’s leading wooden furniture production centers, using chairs made of North American hardwoods produced by each company as Products A and B, respectively. A summary of the target products is shown in
Table 1.
2.2. Calculation of GHG Emissions through Life Cycle Assessment
To calculate the GHG emissions of the subject products, this study used the Life Cycle Assessment (hereafter referred to as LCA) methodology.
2.2.1. Functional Units and System Boundaries
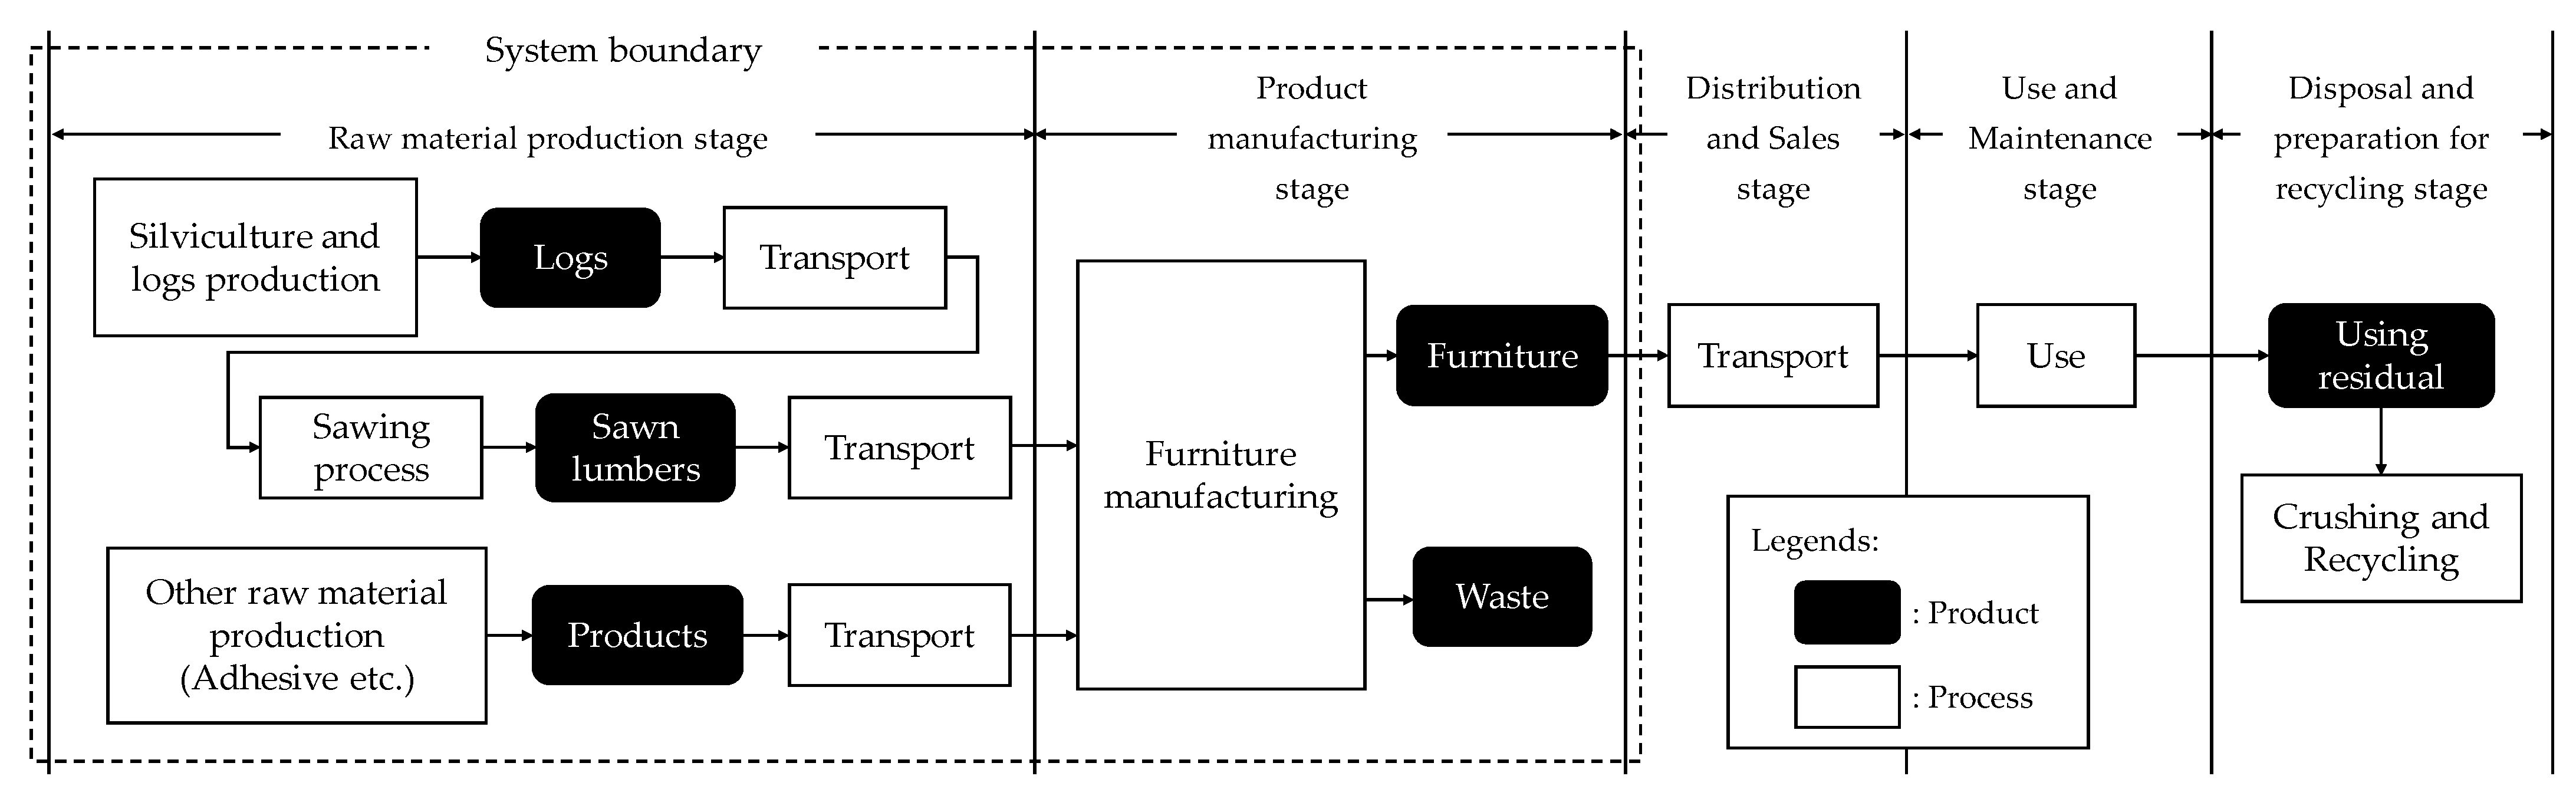
The functional unit to be evaluated was a single chair. The life cycle flow diagram and system boundaries are shown in
Figure 1. The system boundaries were defined as the “raw material procurement stage” and “product manufacturing stage”. GHG emissions from the stages after distribution and sales were considered to be independent of the origin of the hardwoods and were therefore considered to be outside the system boundary.
2.2.2. Data Collection Methods
Regarding the data collection method for each stage within the system boundary, foreground data on resources and energy consumed during the period under study were collected from each of the two companies for the furniture manufacturing process during the product manufacturing stage. The data were collected from January 2021 to December 2021 for Company A and from October 2021 to September 2022 for Company B.
For the process of silviculture and material production at the raw material procurement stage, data were taken from the literature on the production process of North American softwood logs [
11], since data from the literature on the production of hardwood logs in North America were not available. Although there are differences in the silviculture method and period for hardwoods and softwoods, we decided to use the values for softwoods in this study because the silviculture and material production process accounts for only about 2% of silviculture and thus has little effect on the results [
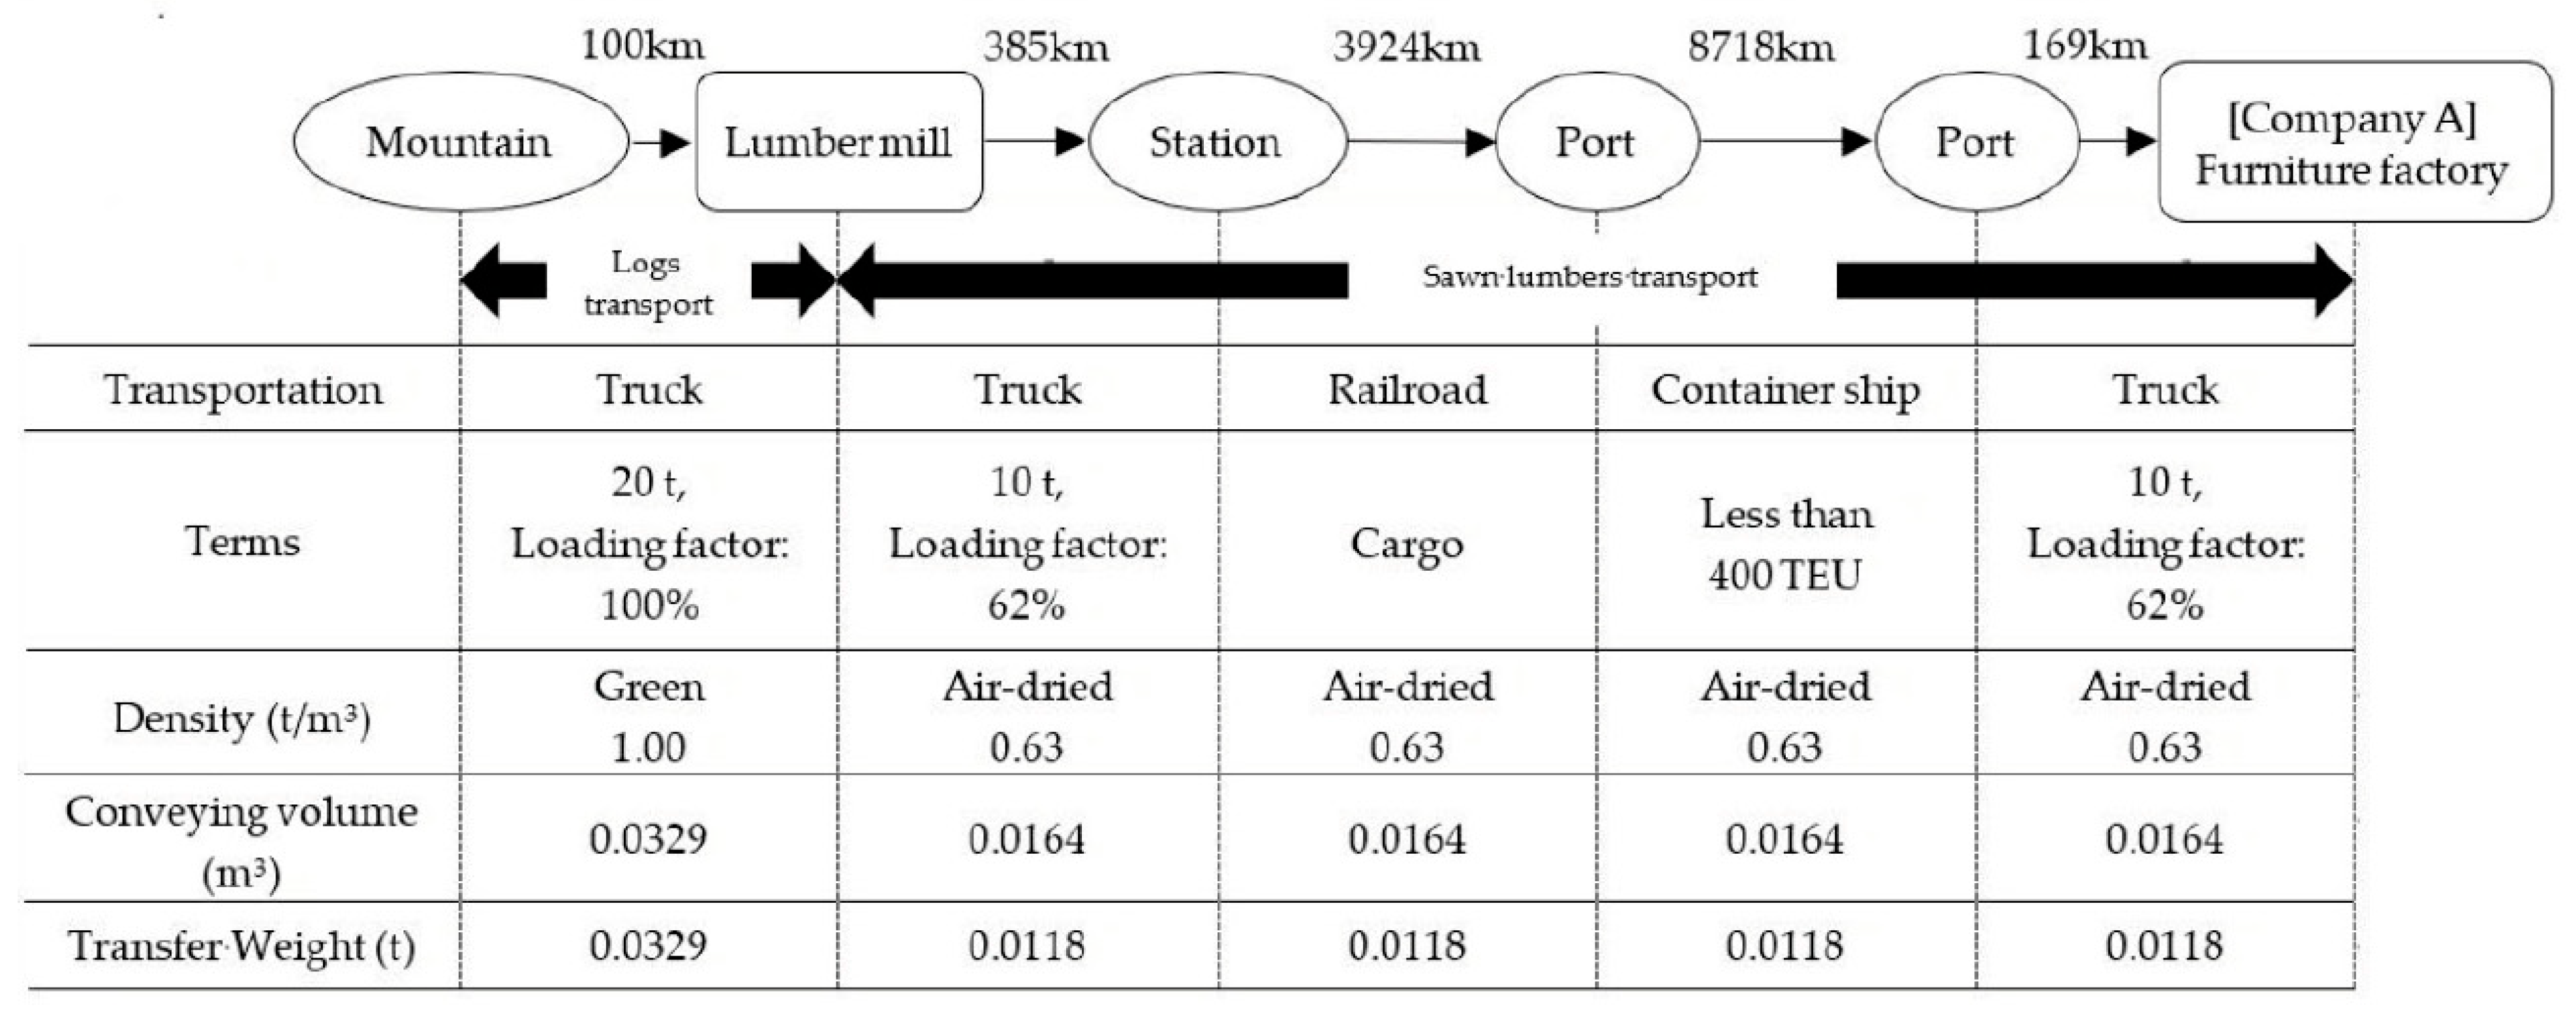
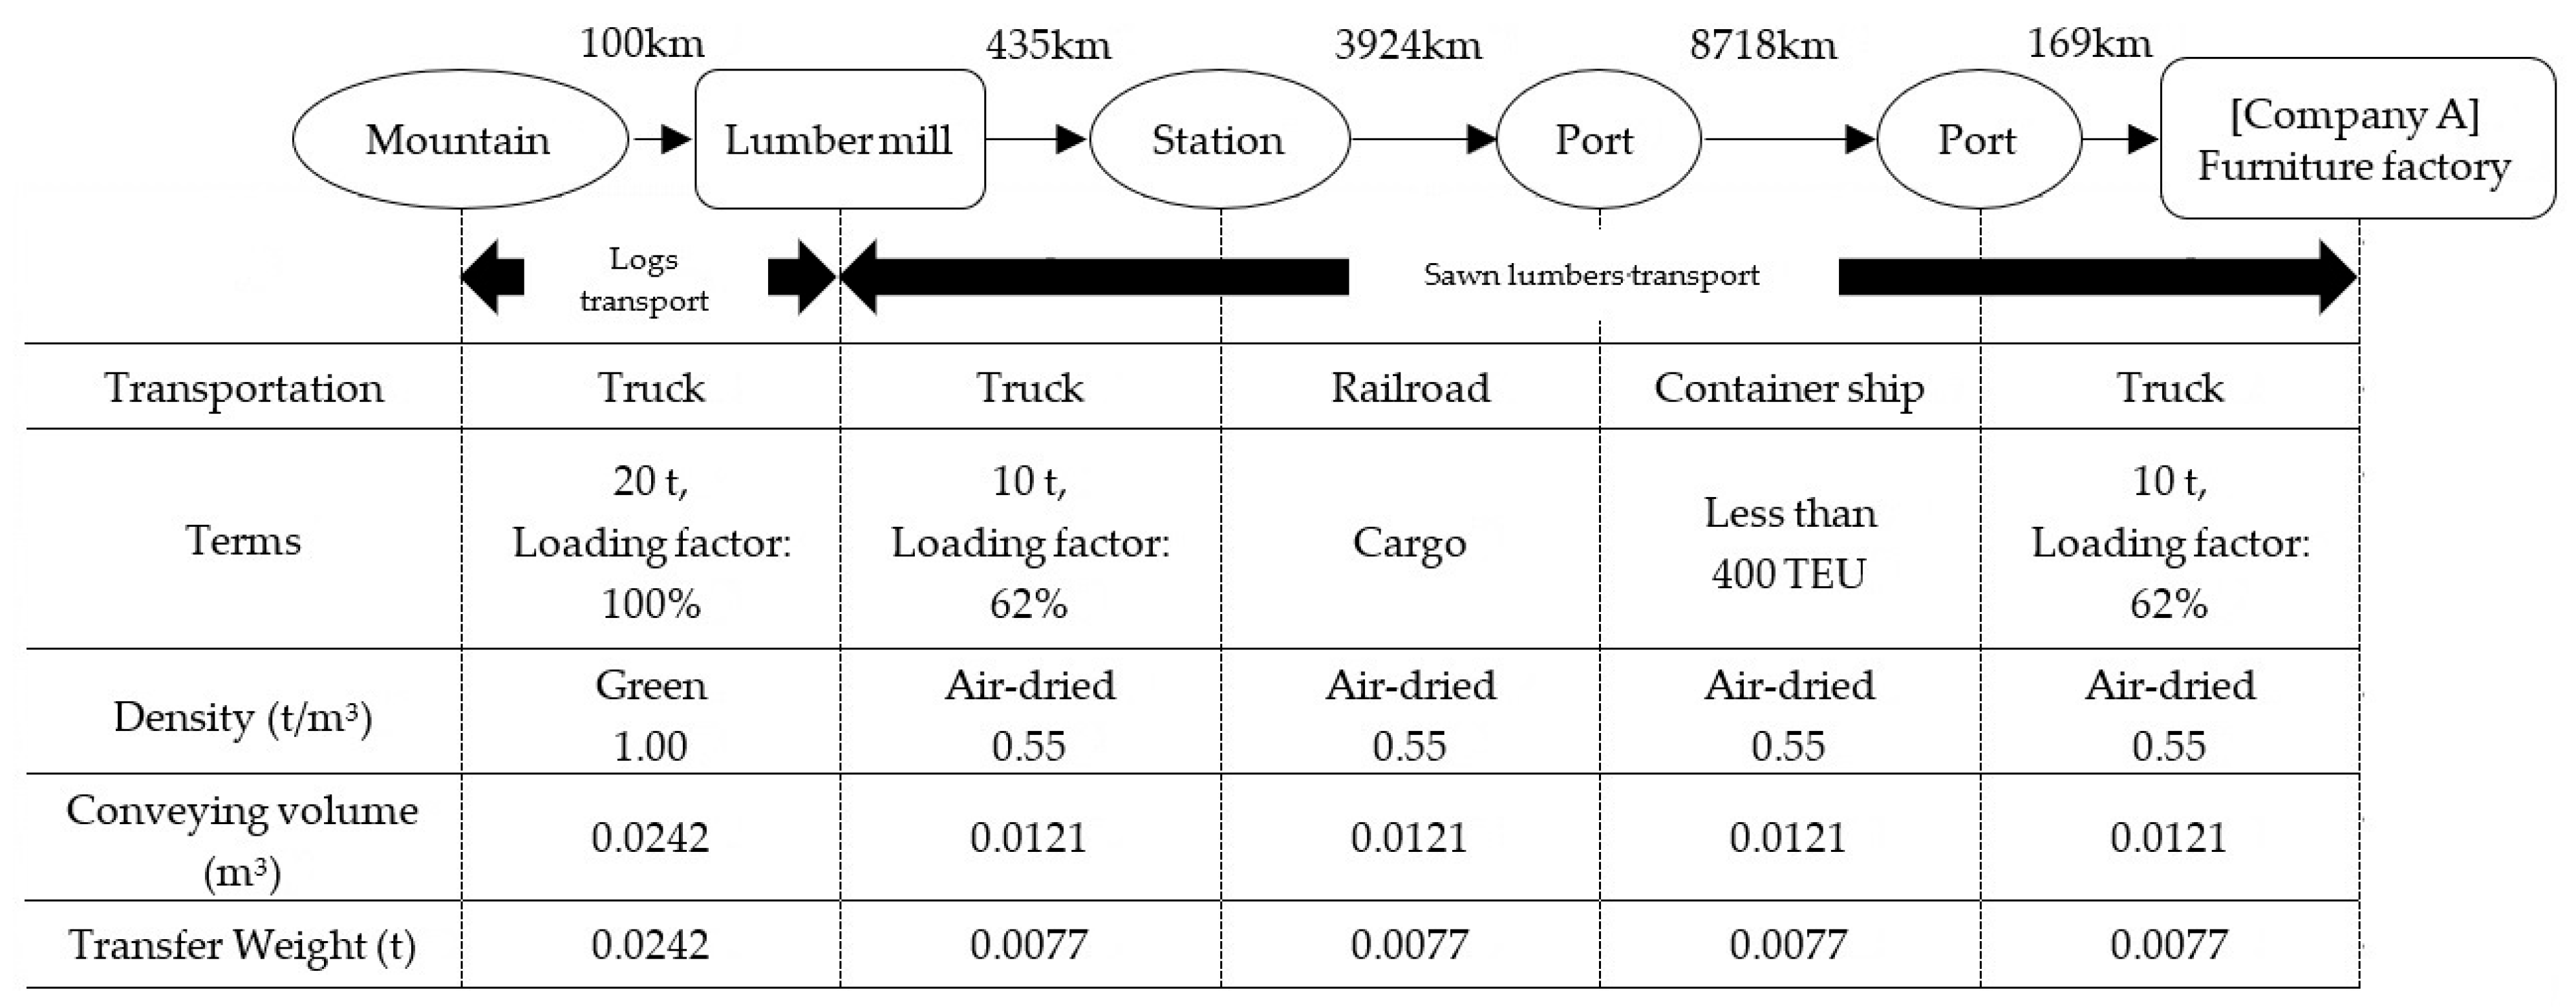
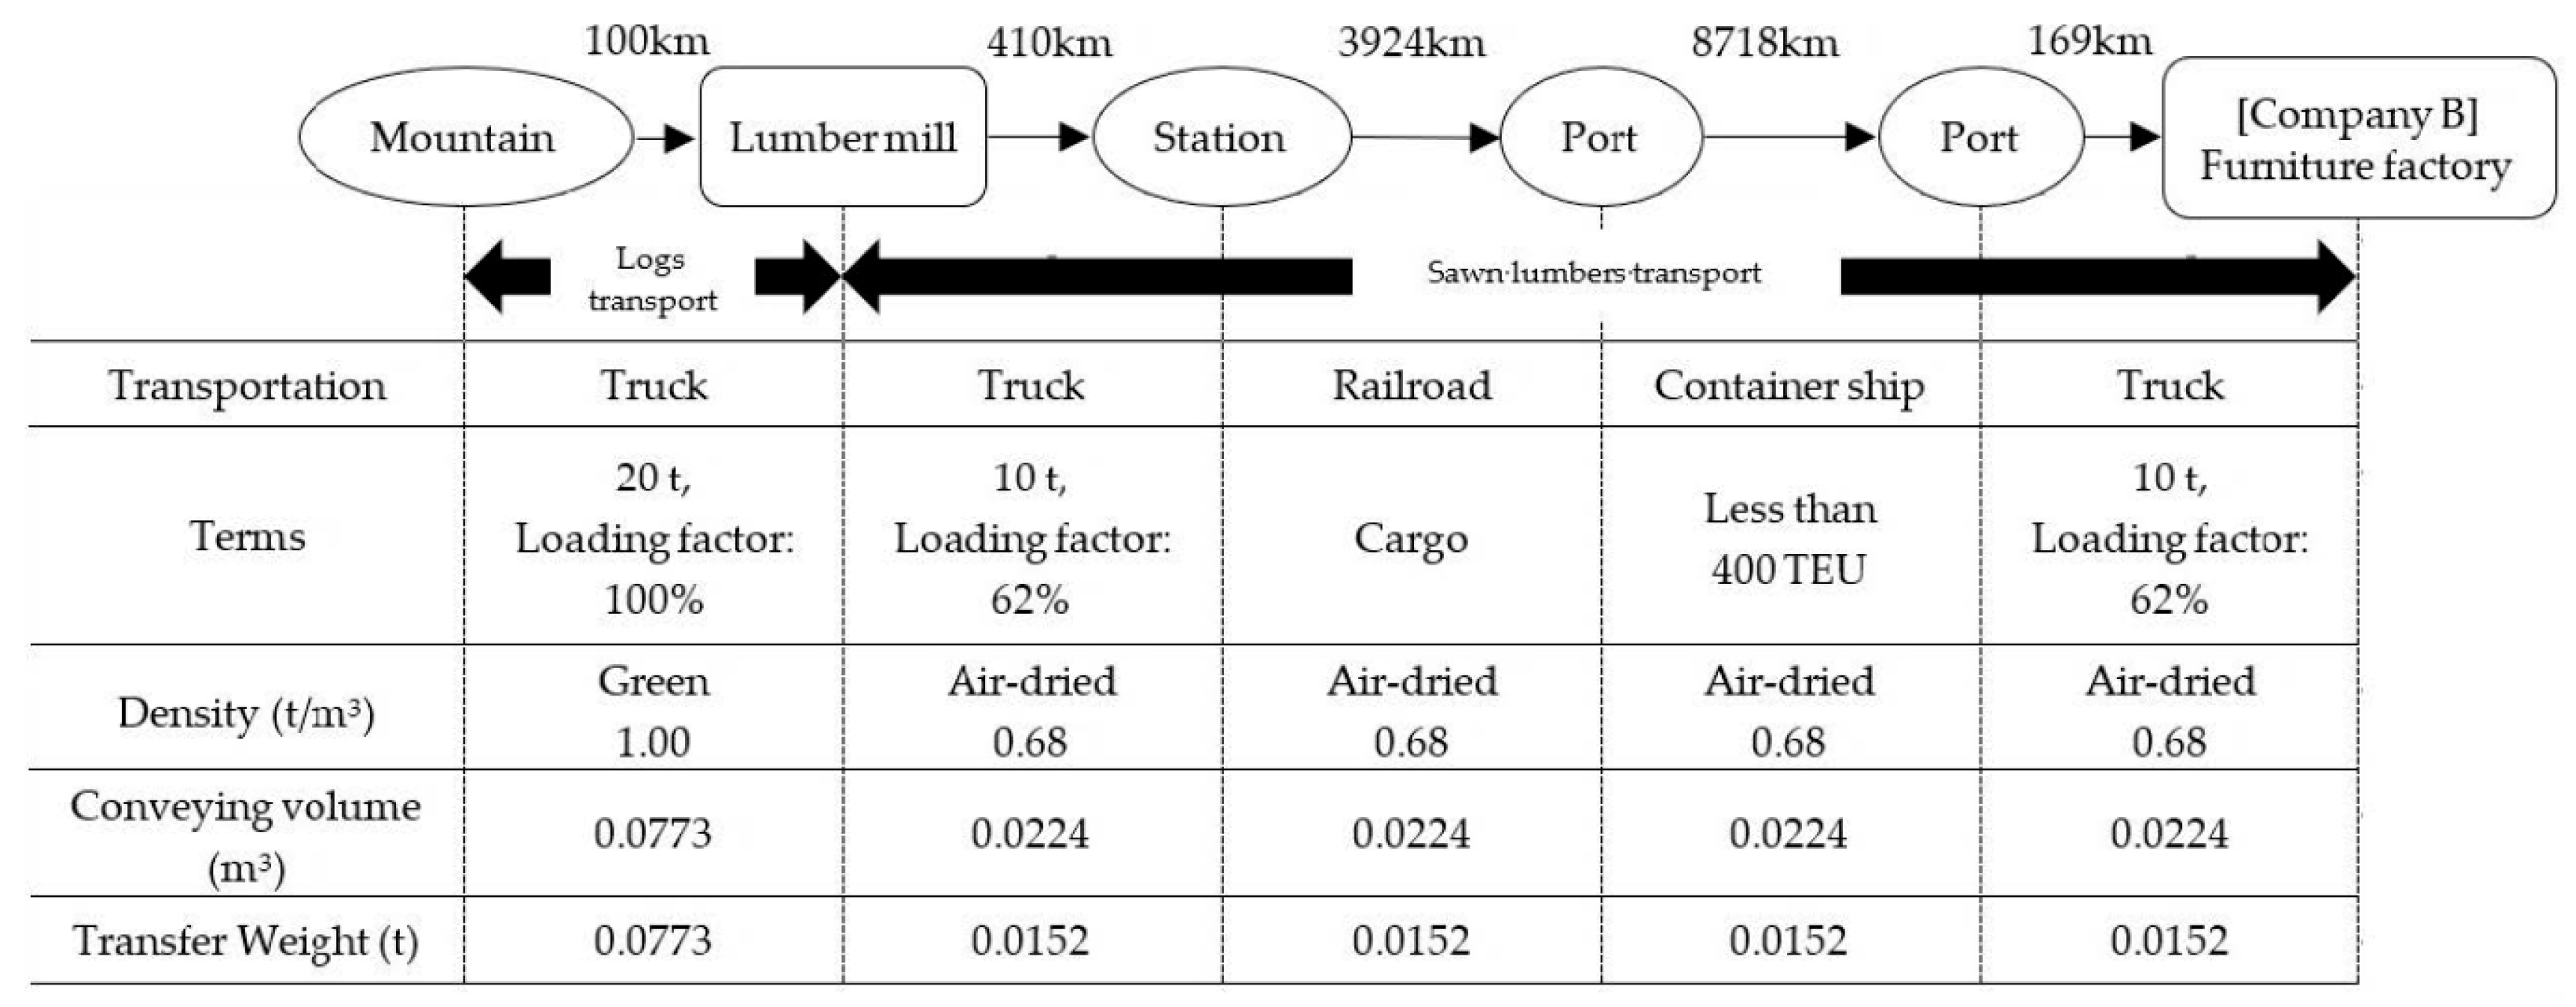
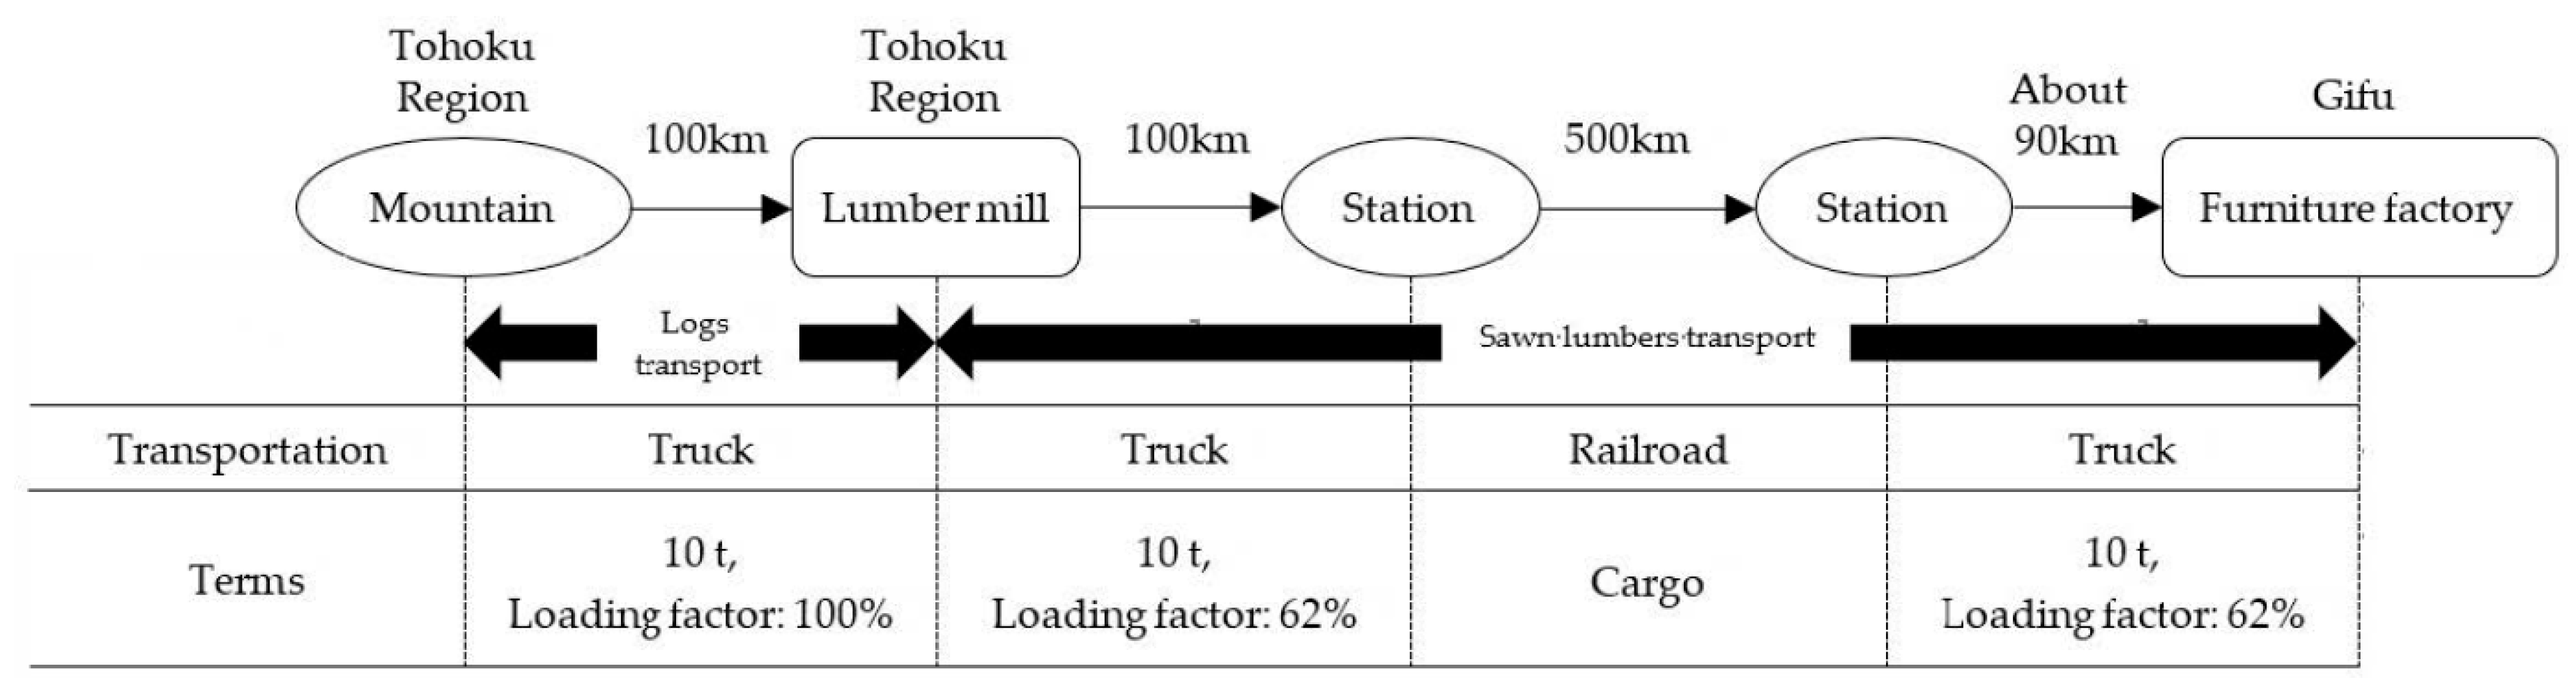
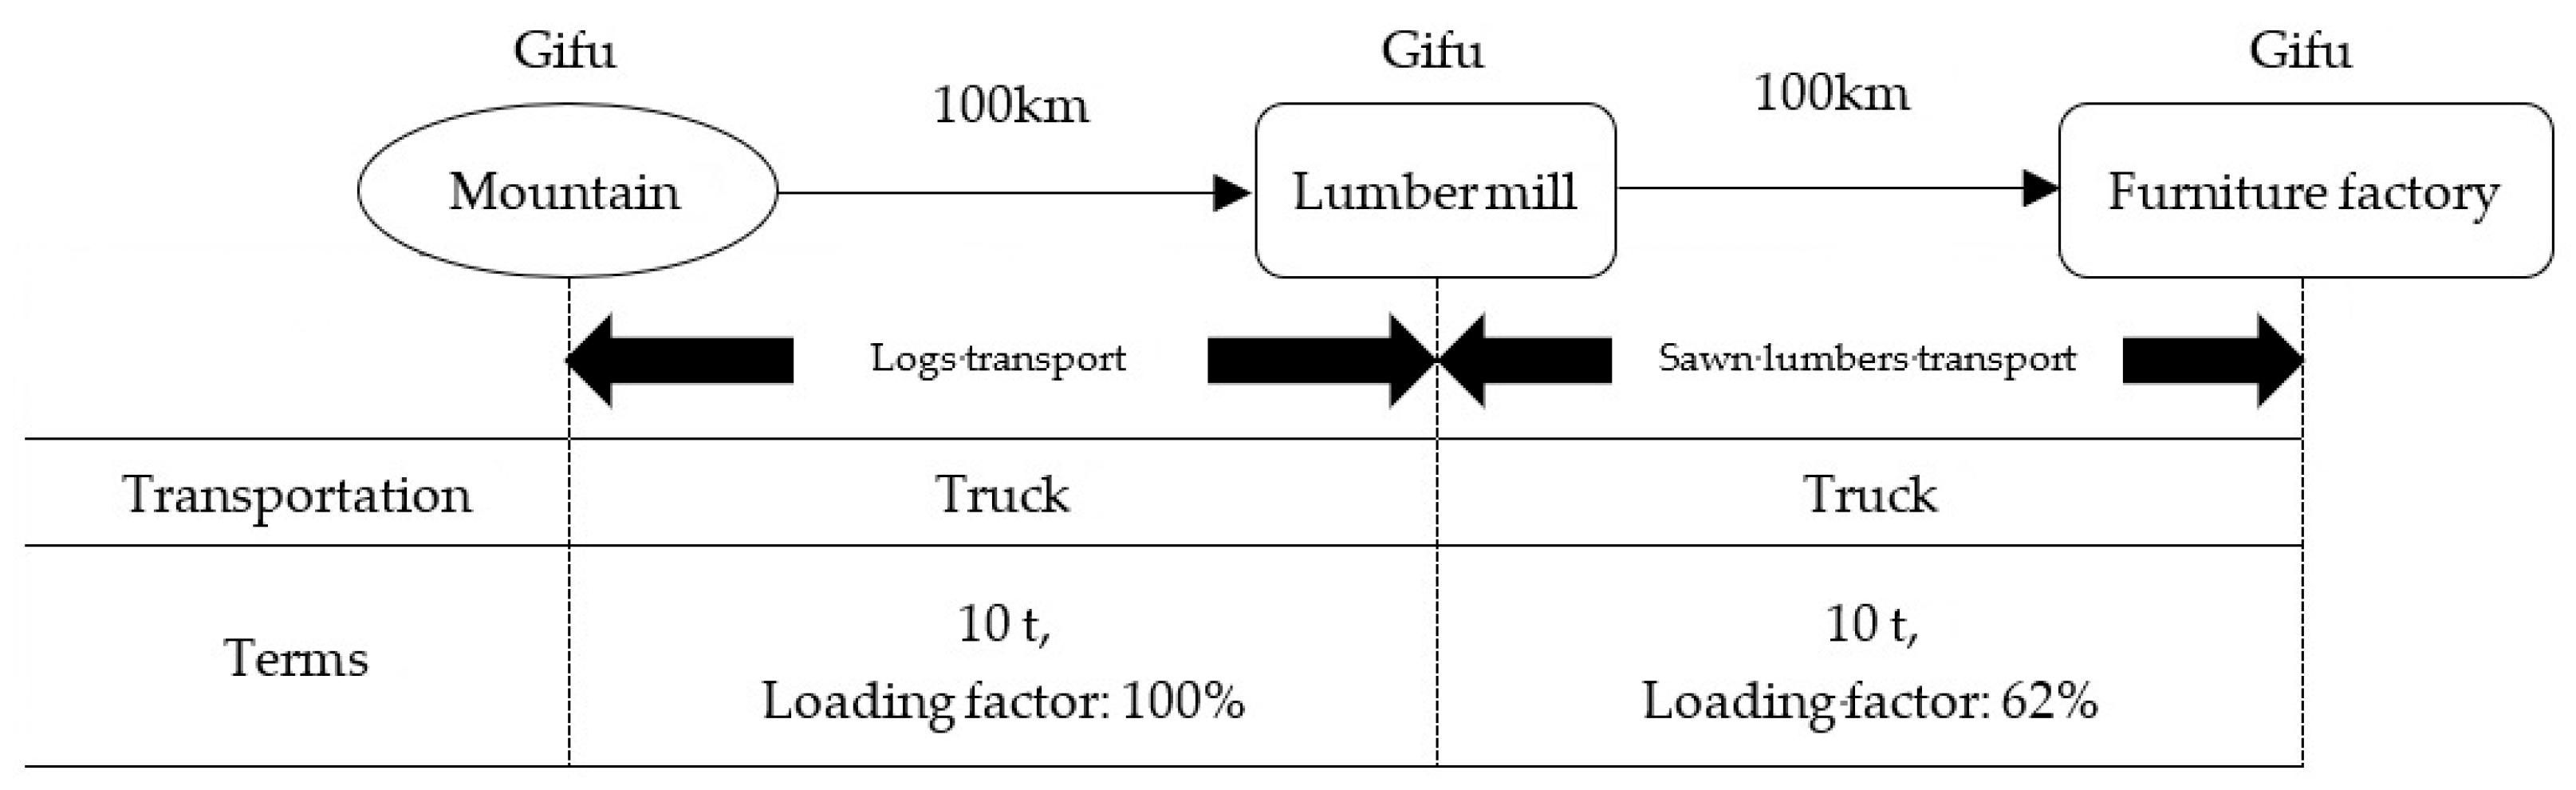
12]. For each transportation process, a reasonable transportation route was established based on foreground data obtained from interviews with each company. The transportation conditions for products A and B are shown in
Figure 2,
Figure 3 and
Figure 4. For the transportation process by truck, the shortest distance between two points was used as the transportation distance, as retrieved by Google Maps. Truck standards and loading rates were based on the literature [
13], with the “100% 20-ton truck loading rate” used for log transportation and the “10-ton truck loading rate_average” used for log and board transportation. The fuel used for trucks was diesel oil. For log transportation, the return trip was included in the scope of evaluation, with a loading rate of 0%. Background data on transportation processes by rail and container ship were taken from the literature [
14,
15].
2.2.3. Distribution Method
Since each plant of Companies A and B manufactures many co-products in addition to the subject product, it was necessary to allocate the value of these co-products and the subject product. The allocation methods considered were lumber volume (m3), number of pieces (pcs), and economic value (JPY). The allocation by lumber volume (m3) is difficult for furniture with complex shapes, and the allocation by number of pieces (pcs) is inappropriate for a furniture factory that manufactures a variety of products, such as chairs and tables of various sizes, so the economic value (JPY) was used for the allocation in this study. Economic value (in JPY) refers to the total amount of money earned for each product sold during the period covered.
2.2.4. Life Cycle Inventory Analysis
An inventory analysis was performed based on the data collected. GHG emissions were calculated by multiplying the amount of resources and energy input into the process at each stage by the GHG emissions intensity and using the pile-up method. The emission factor for electricity was taken from “Emission Factors by Electricity Utility (for Calculating GHG Emissions of Specific Emitters)—FY 2021 Results” [
16], published by the Ministry of the Environment of Japan. For factors other than electricity, values were taken from the emission unit database “IDEA ver.3” [
17]. In this study, GHGs other than carbon dioxide were also included by converting them to carbon dioxide using the Global Warming Potential (GWP).
2.3. Calculation of Carbon Storage
The carbon storage volume was calculated using the following Formula (1) in accordance with the Forestry Agency’s “Guidelines for the Indication of Carbon Storage in Wood Product Used for Building Construction” [
18]. The carbon storage capacity was calculated by converting the amount of carbon dioxide. The carbon storage was calculated based on the amount of wood used in the product. Wood scraps from manufacturing products are recycled into other products or used for heat as biomass boilers.
where
Cs: carbon storage derived from the amount of wood used (CO2 equivalent) (kg-CO2);
W: amount of wood used in the wood product (m3);
D: wood product density (kg/m3) (ratio of total dry mass to air-dried mass);
Cf: carbon content of wood product (the carbon content in the mass of the wood in its total dry state).
2.4. Conversion of Tree Species Used from Foreign to Domestic Hardwoods
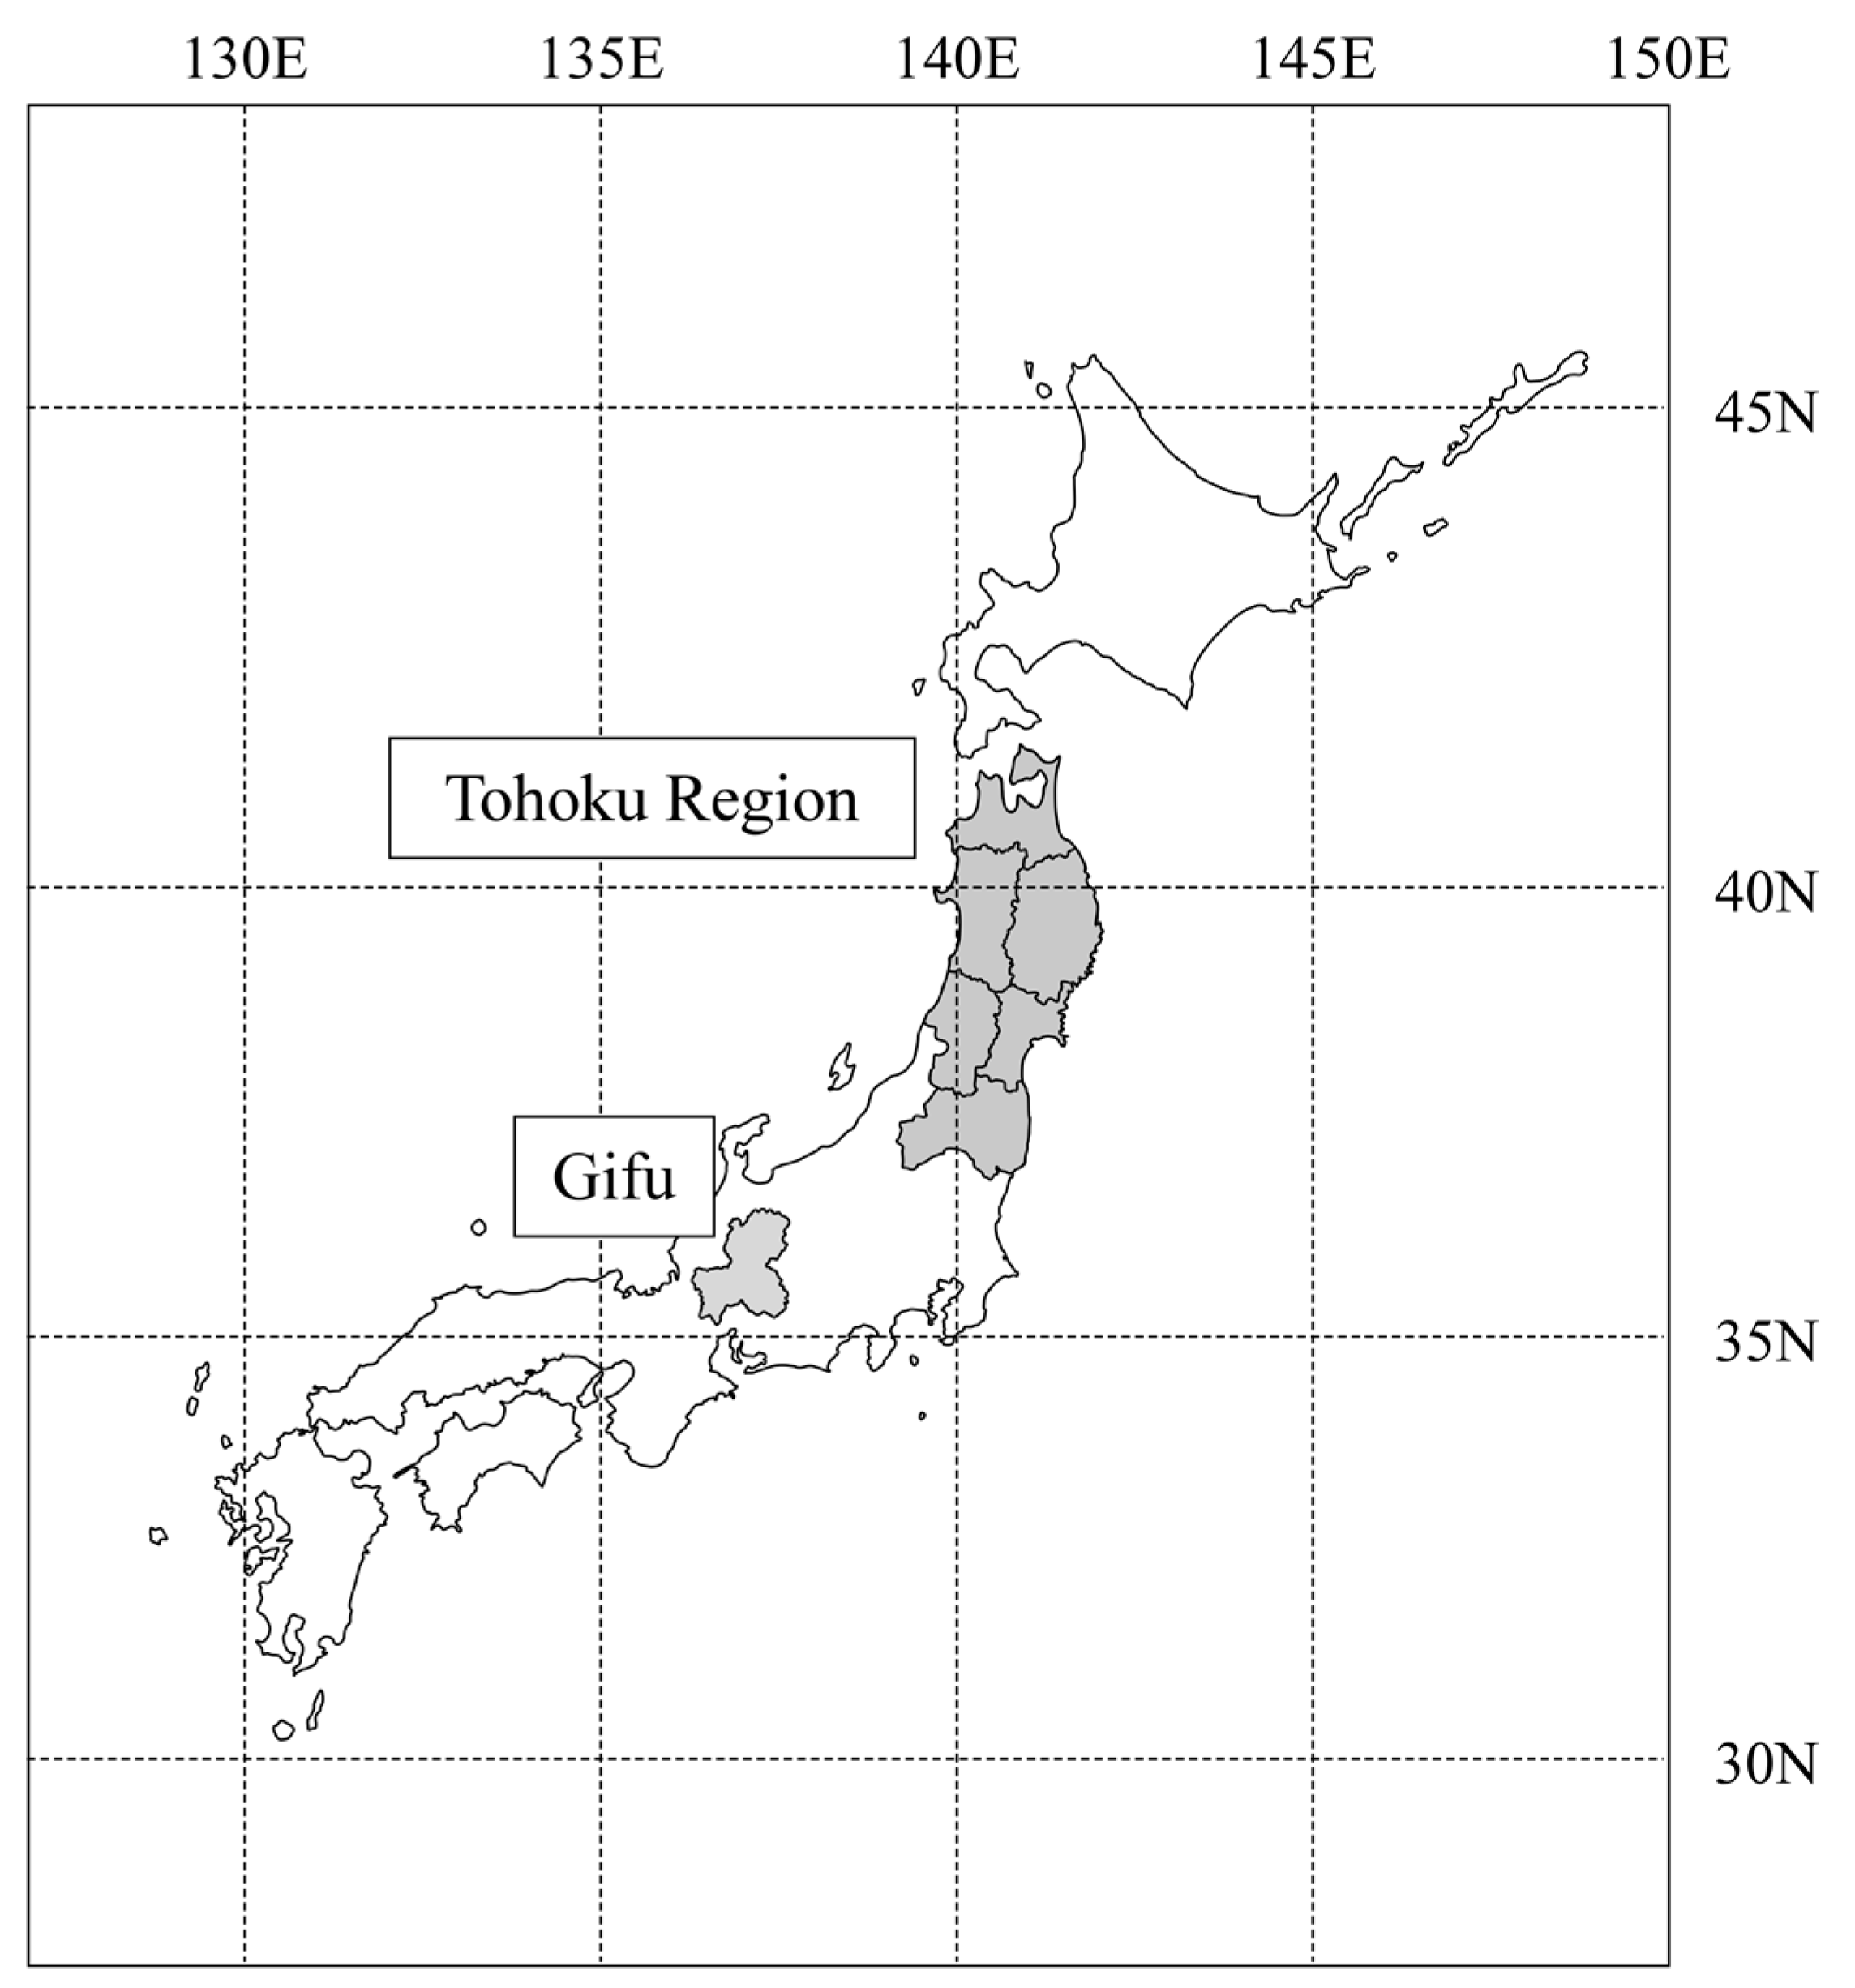
GHG emissions were calculated, and GHG emissions were compared when the wood used as raw material was converted to local (Tohoku region) and regional (Gifu prefecture) production.
Figure 5 shows the location of the Tohoku region and Gifu Prefecture. The definitions of the scope of procurement of local and regional hardwoods are shown in
Figure 6 and
Figure 7, respectively. Based on interviews, it was assumed that local hardwoods were procured from the Tohoku region and regional hardwoods were procured from within Gifu Prefecture. Since the same species as those used in the evaluation target were not available in Japan, it was assumed that domestic hardwoods of the same density would be used as substitutes. For each condition of the transportation process, based on the product-specific calculation rules [
19] in the environmental labeling program, the range of raw material procurement was set to be within 100 km of the sawmill, and the shortest distance from the sawmill to each company’s furniture factory was used as the distance searched using Google.
3. Results and Discussion
3.1. Evaluation of Chairs Made of Foreign Hardwoods
3.1.1. GHG Emissions
The results of the inventory analysis for Products A and B are shown in
Table 2 and
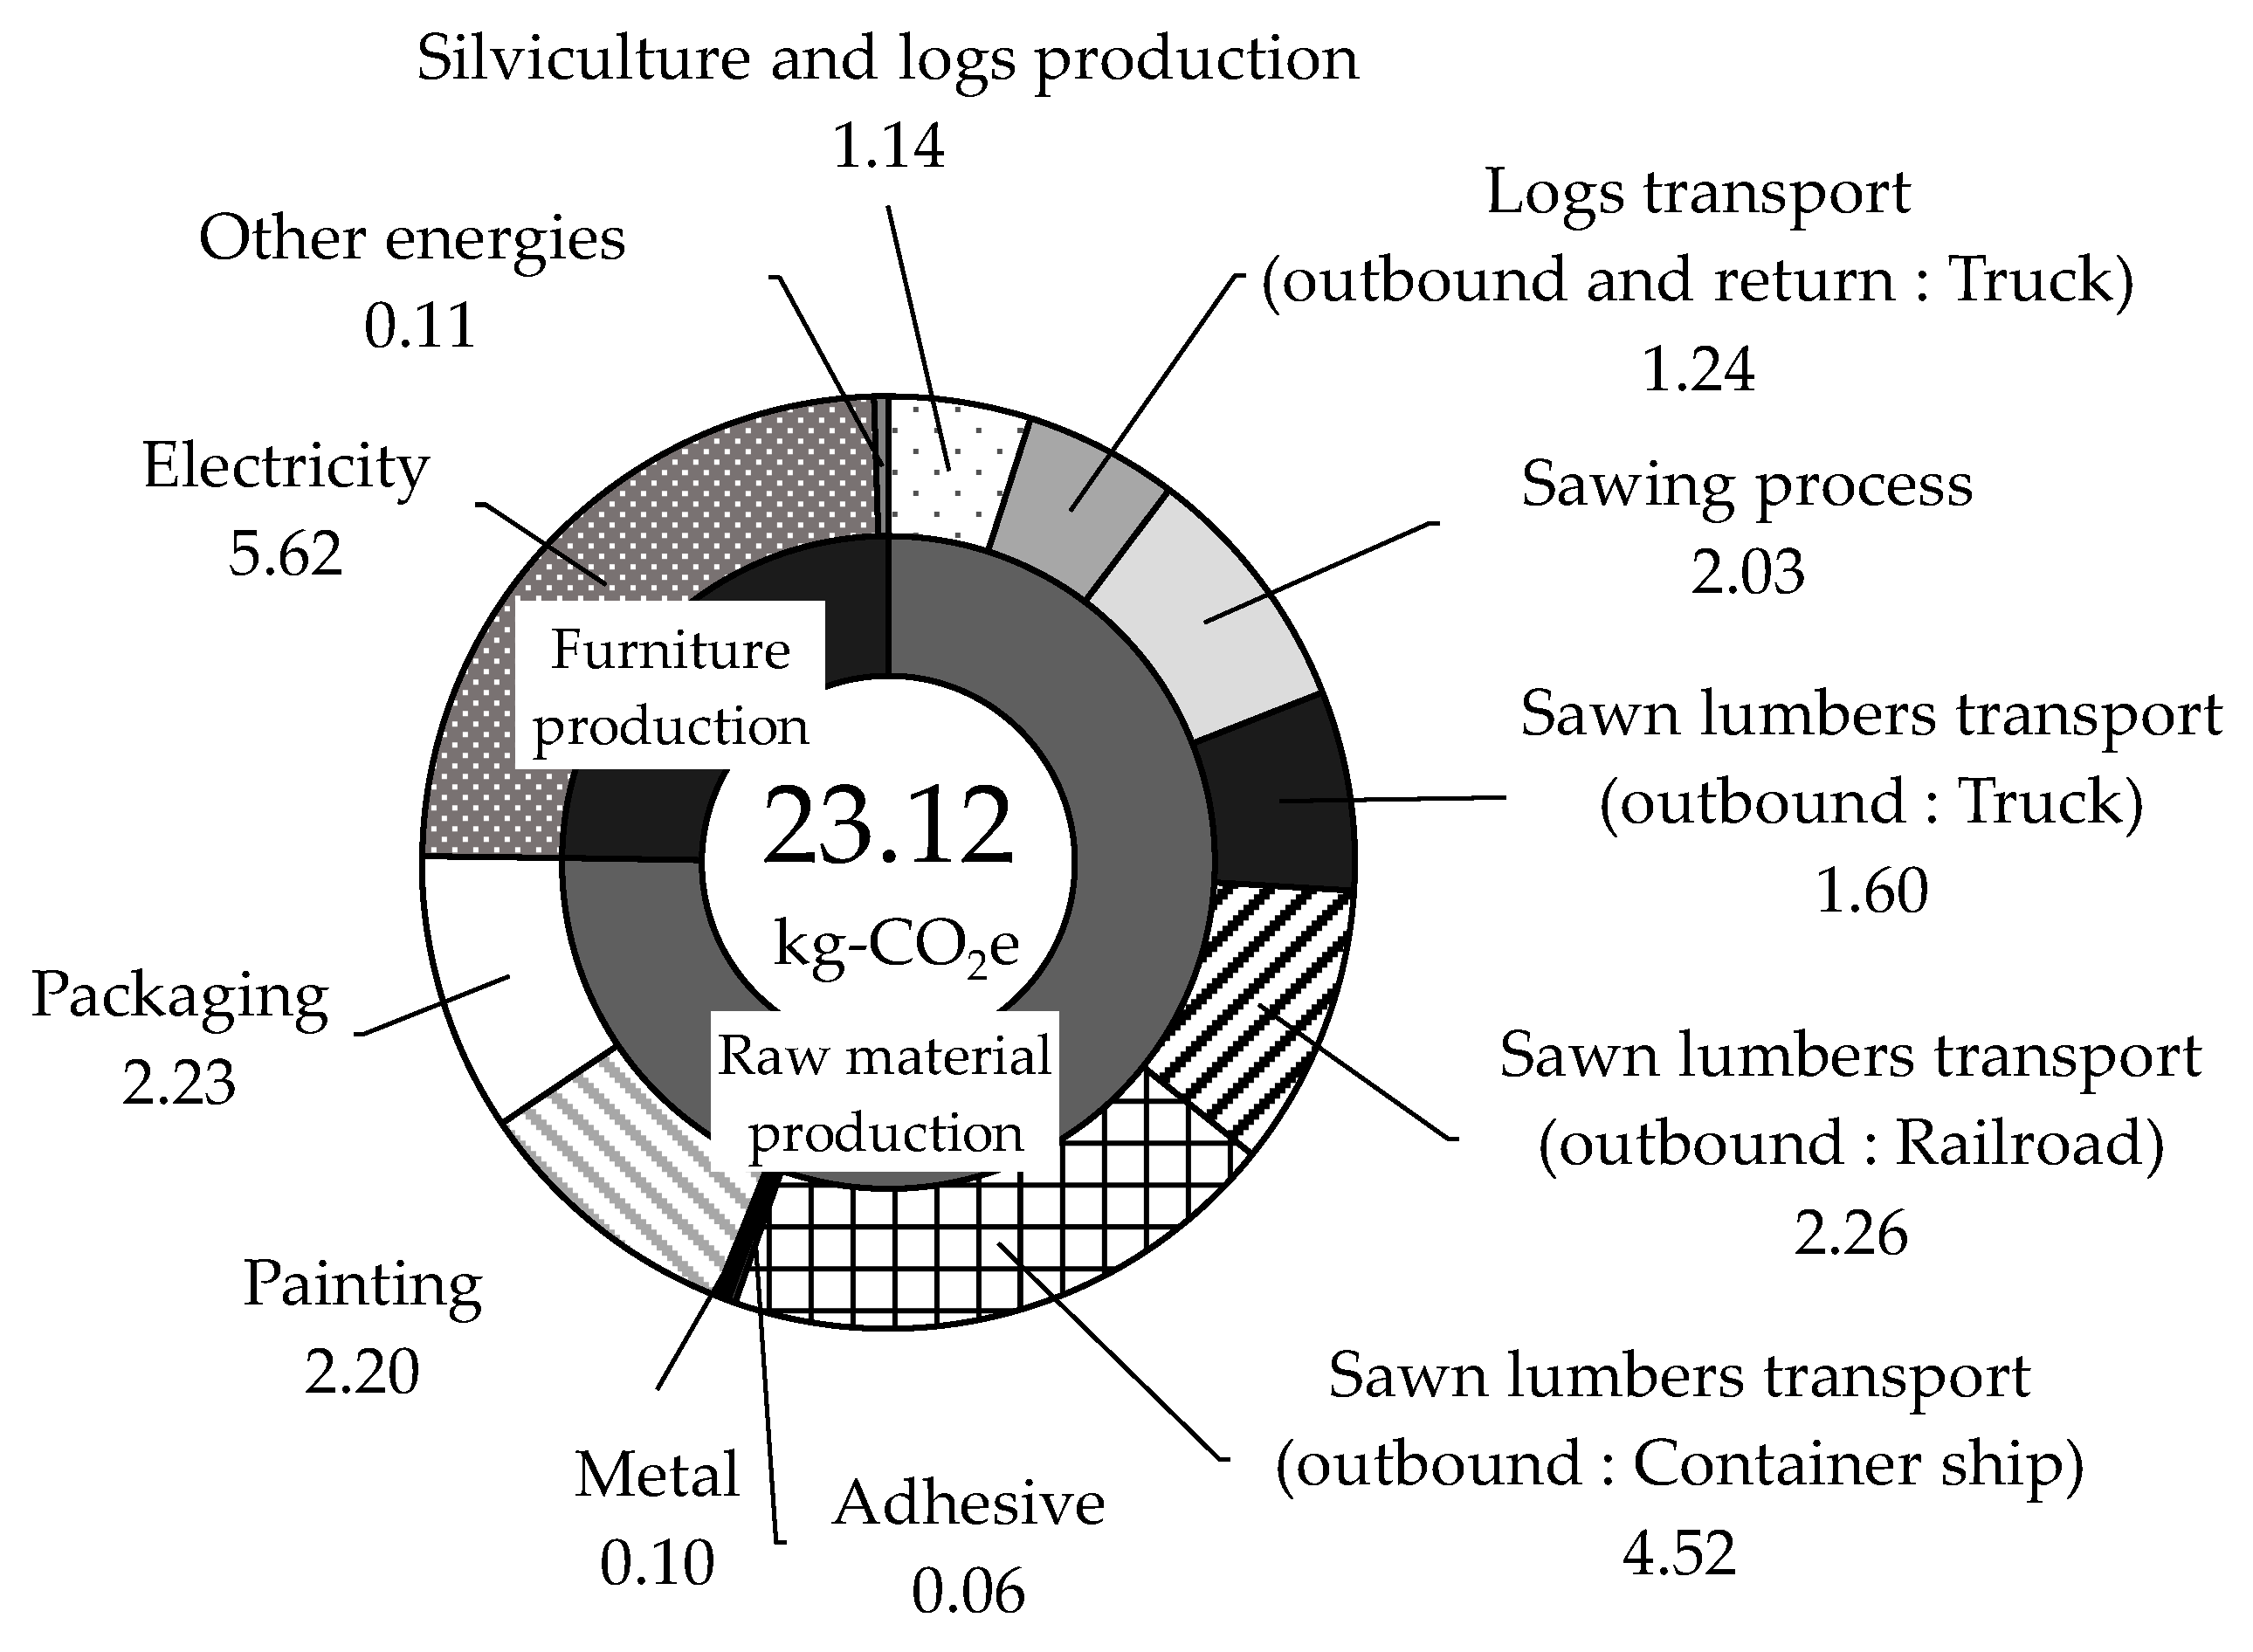
Table 3. The GHG emissions of each product are also shown in
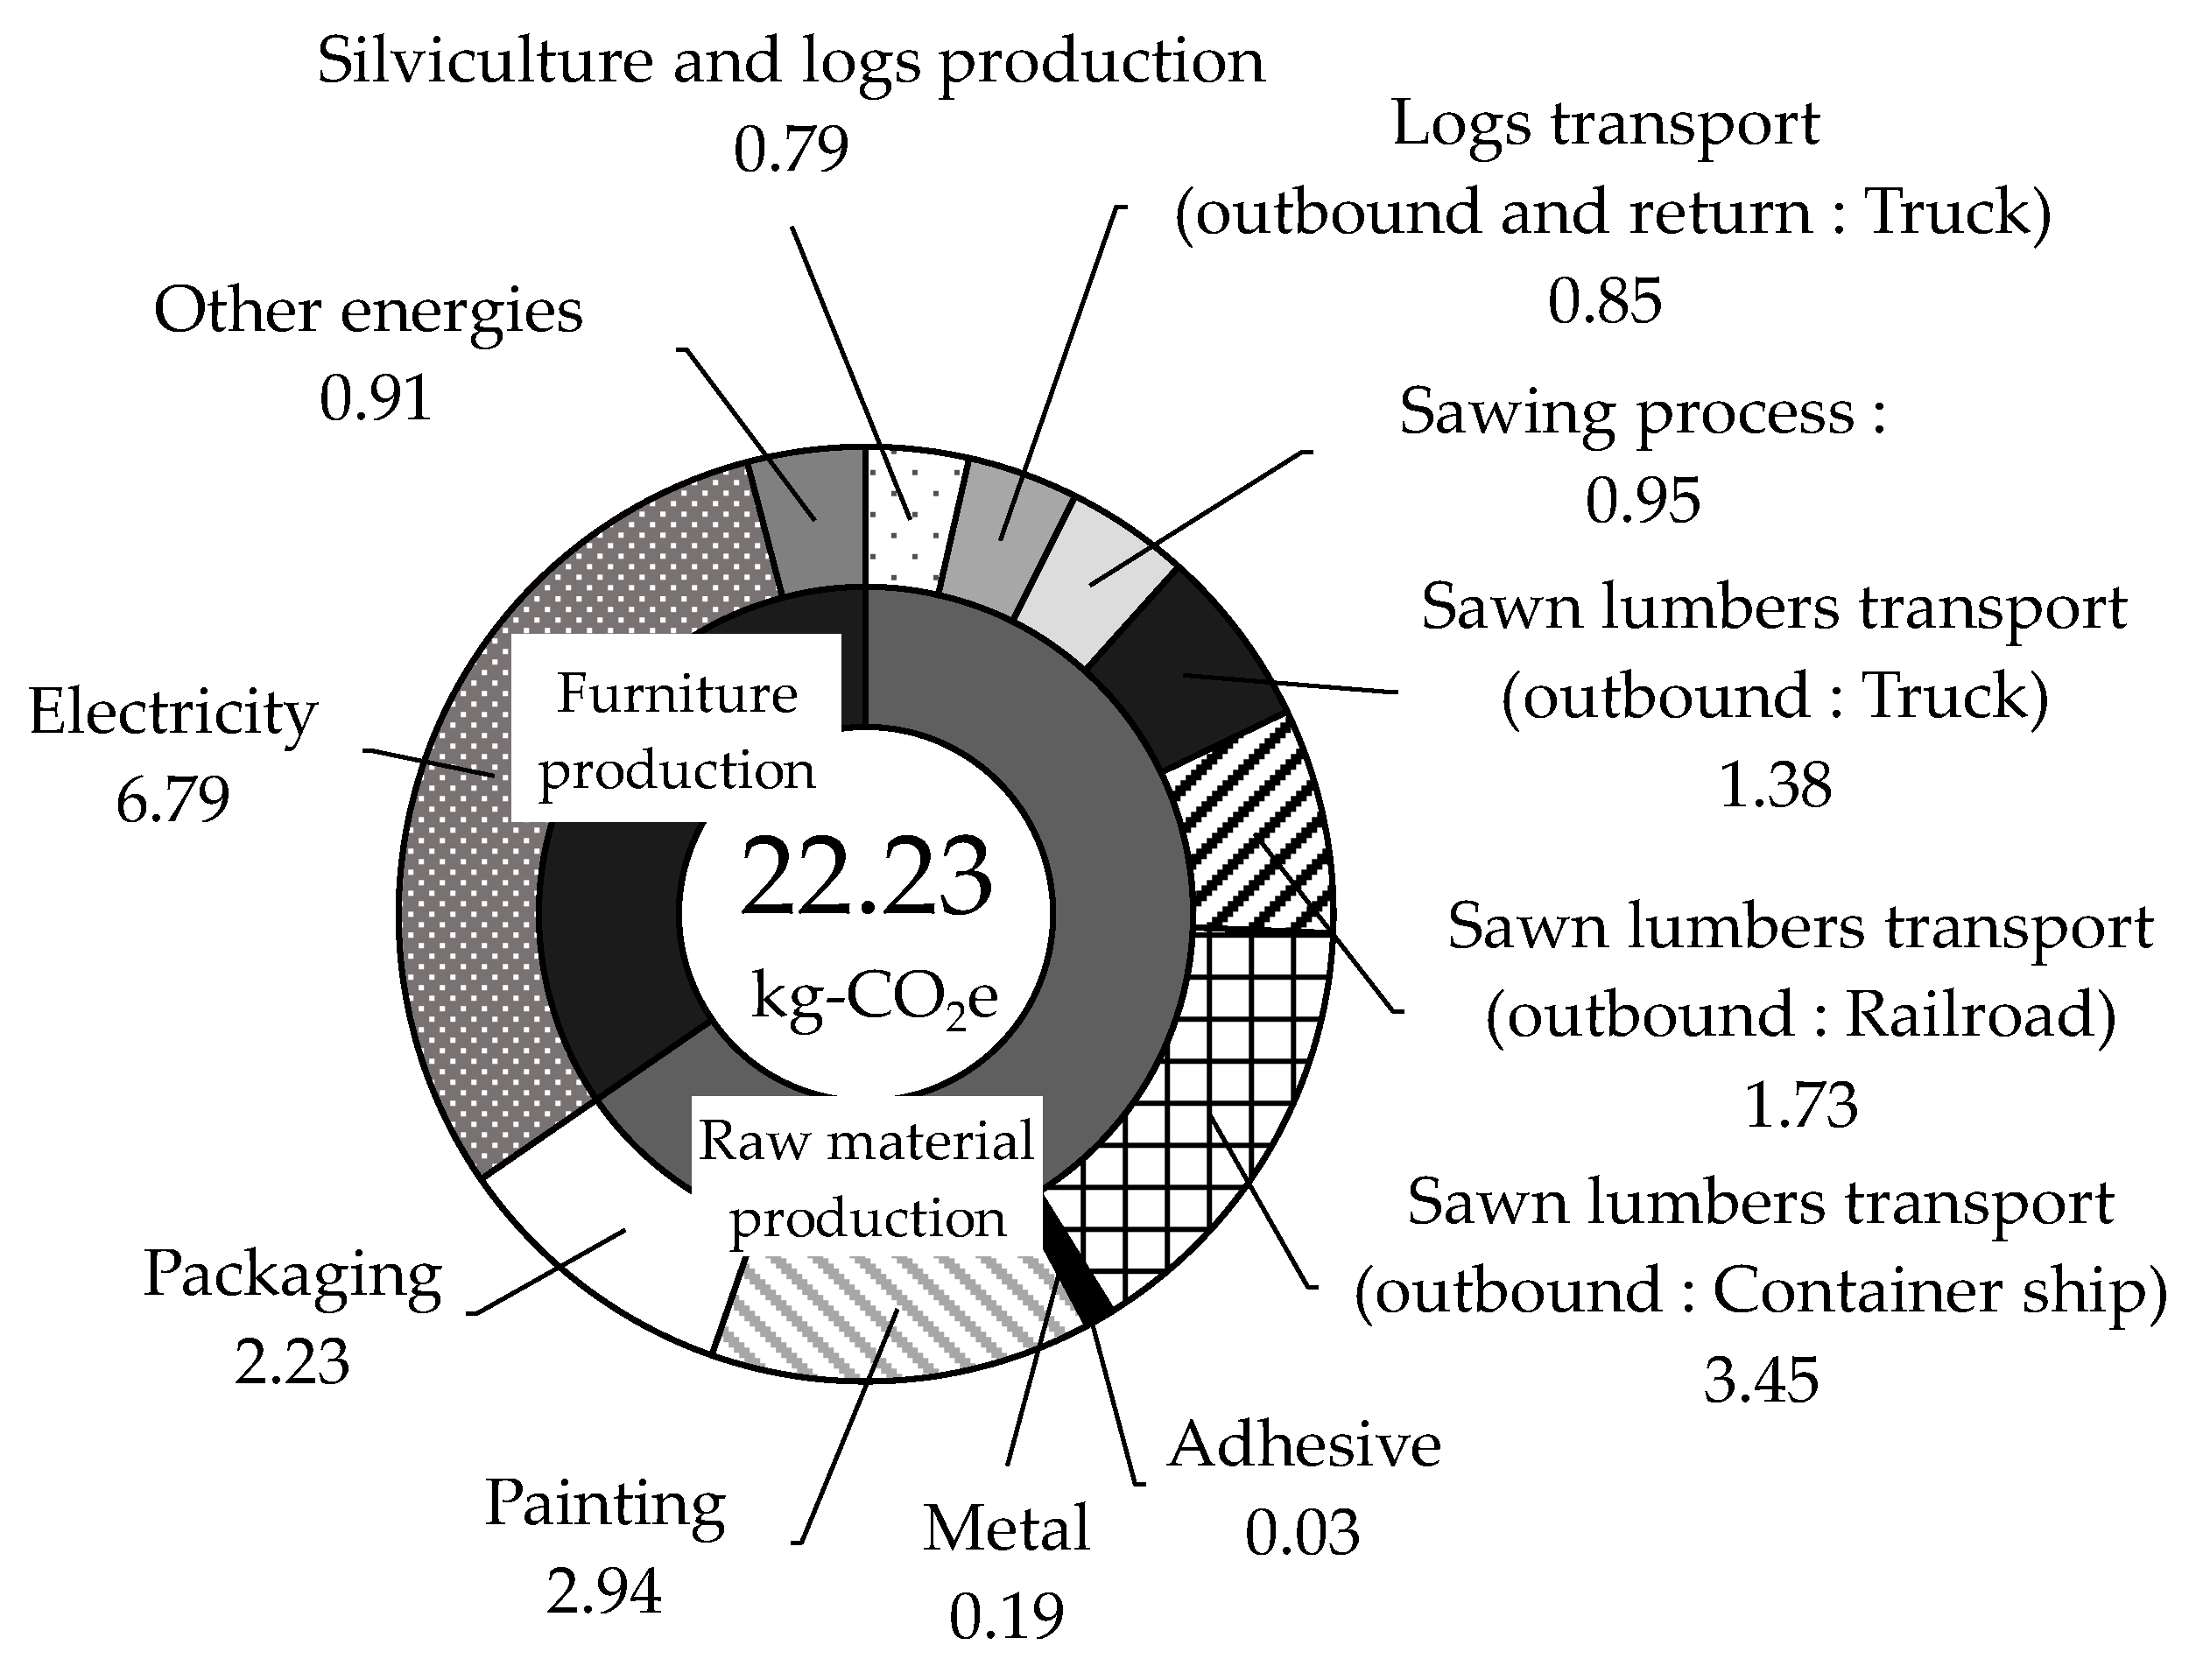
Figure 8 and
Figure 9. The GHG emissions of the chairs from each company were 23.12 kg-CO
2e for Product A and 22.23 kg-CO
2e for Product B. Even though the product material volume (m
3) was about 1.3 times greater for Product B than for Product A, Product B resulted in lower GHG emissions. The reason for this was that Product A had a lower yield from raw material to finished product than Product B.
Table 4 shows the amount of raw boards and logs required to manufacture Product A and Product B. In order to manufacture Product A, three times as much lumber is required, and 3.3 times as many logs are needed to manufacture the base board. In other words, the product yield from logs is about 10%. In contrast, the number of logs required to manufacture Product B is about two-thirds of that of Product A. Therefore, GHG emissions from the material production process, the log production process, and the transportation of logs are reduced in proportion to the required amount. The reason for the higher product yield of Product B is that it requires less processing than Product A. In addition, the company actively recycles scrap wood generated in the furniture factory as small parts.
Looking at the breakdown of GHG emissions by stage, the raw material procurement stage accounted for more than 60% of the total emissions for both products. In addition, the transportation process of raw boards, which is included in the raw material procurement stage, accounted for the highest percentage of total emissions. In the log transportation process, logs are transported approximately 13,200 km from lumber mills in North America to the furniture factories of each company by truck, rail, and container ship (
Figure 2,
Figure 3 and
Figure 4). The distance covered by trucks was about 600 km, about one-sixth of the distance covered by rail, which is the next longest distance. Yet, when converted to GHG emissions, there was not much difference between truck and rail emissions. This is because the GHG emissions intensity of trucks is larger than that of other modes of transportation. Even for the same land transportation, there was a five-fold difference in GHG emissions intensity between truck transportation (10-ton truck) and rail transportation. Among the input raw materials, GHG emissions from the process derived from wood materials were the highest, accounting for about 75% of total emissions in Product A and about 65% in Product B. This shows a similar trend to the results shown in a previous study [
3]. Among the raw materials other than wood materials, GHG emissions derived from paint and packaging materials each accounted for about 10% of the total emissions, indicating that reviewing paint and simplifying packaging are highly effective points for reducing GHG emissions. On the other hand, GHG emissions from metal products, which were pointed out in a previous study [
3], were not an issue because metal parts were rarely used in the products in this study, except for joining hardware. In the product manufacturing stage, the majority of emissions for both products was derived from electricity. The GHG emissions intensity of the power company in question in FY2021 was 0.388 [kg-CO
2e/kWh], and the ratio of fossil fuel-based power generation methods such as coal-fired and LNG-fired power generation accounted for more than 60% of the total. As a plan to reduce GHG emissions in the future, the introduction of renewable energy sources, such as installing solar panels on the roofs of factories and becoming self-sufficient in electricity, will have a significant effect. In addition, a 2016 amendment to the law in Japan fully liberalized entry into the electricity retail industry, allowing for the free choice of electricity from a full range of services and plans. Selecting from among these providers those that sell electricity with a low GHG emissions intensity due to a power supply mix centered on renewable energy sources will also have a significant effect in reducing GHG emissions.
3.1.2. Carbon Storage
The carbon storage volume was 11.20 kg-CO2 for Product A and 16.90 kg-CO2 for Product B. The carbon storage volume of Product A was 11.20 kg-CO2, while that of Product B was 16.90 kg-CO2. In addition to the difference in material use, the difference in carbon storage between Product A and Product B was caused by the higher density (t/m3) of white oak, the species used in Product B, than the red oak and walnut used in Product A.
3.2. GHG Emissions Reductions from Conversion to Domestic Hardwoods
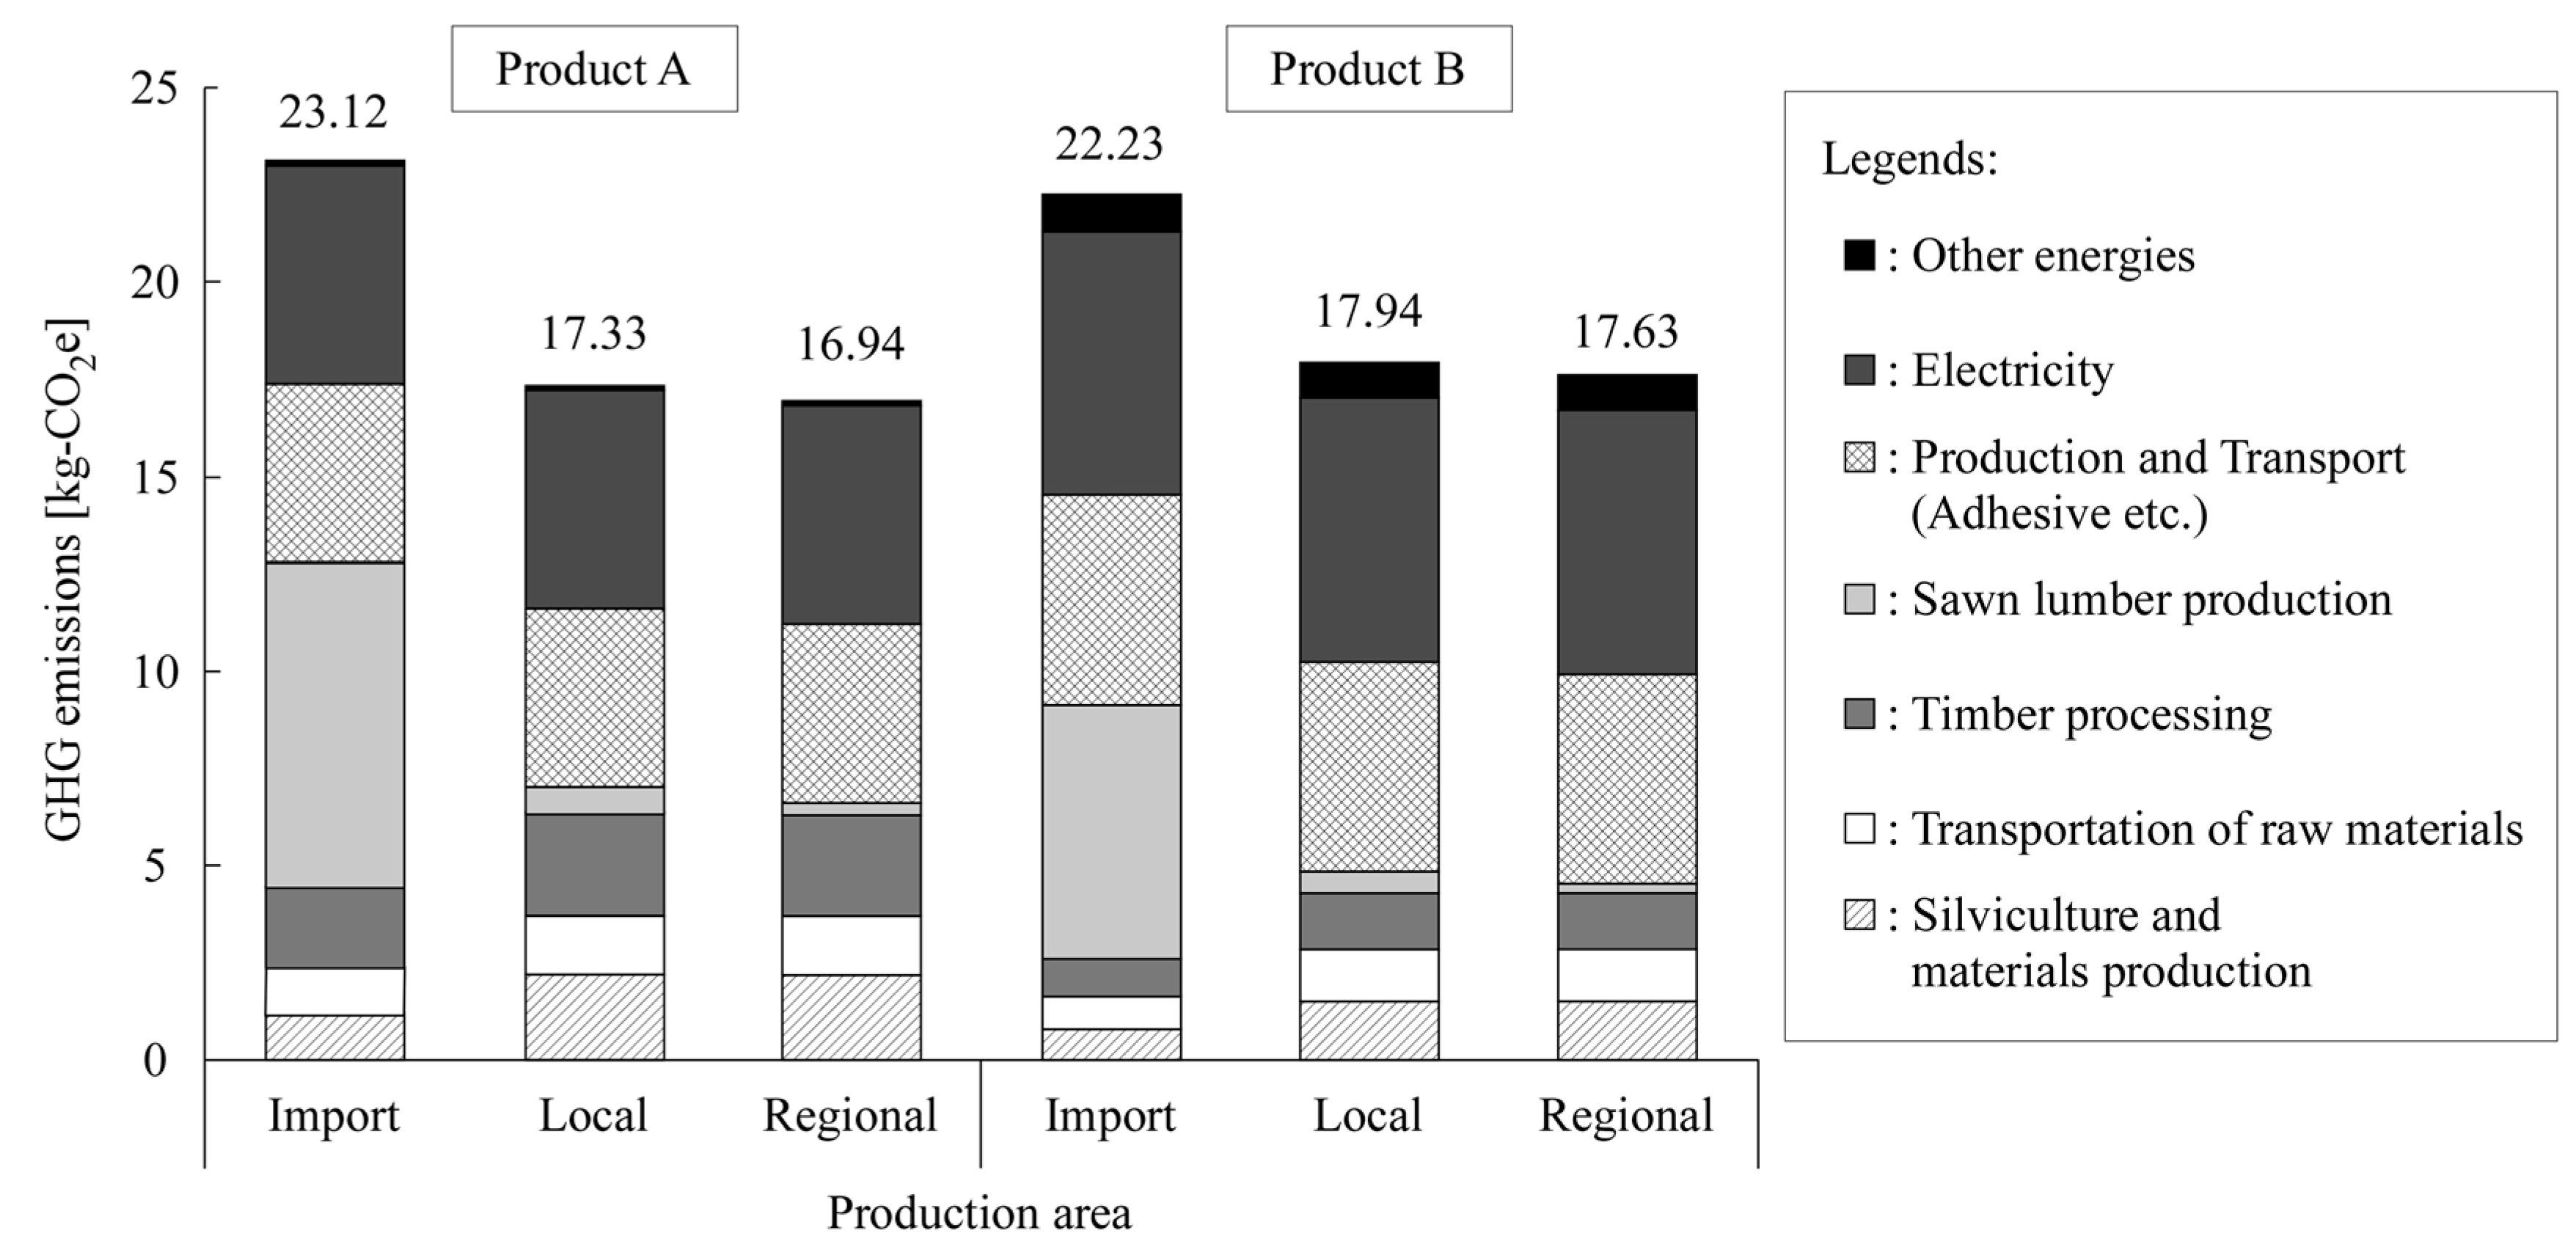
Figure 10 shows the GHG emissions of both products when the foreign hardwoods used in Product A and Product B are converted to local and regional products. For both products, the conversion to local and regional production resulted in GHG emissions reductions. Conversion to regional production was found to reduce GHG emissions by about 27% for Product A and about 25% for Product B. Product A, which originally had higher GHG emissions, showed higher reductions. As pointed out in
Section 3.1.1, the GHG emissions from the transportation process of both Product A and Product B accounted for a large proportion of the total GHG emissions.
On the other hand, GHG emissions originating from the process of production of forest-grown materials and log transportation processes increased for both local and regional sourcing compared to the pre-conversion levels. This was attributed to differences in the intensity units used. For the foreign hardwood production process, the values for softwood log production in North America [
5] were quoted, while for the same process for local and regional production, the values for “other logs (logs), planted forest, with reforestation” from IDEAv3 [
10] were quoted. The latter value was about 1.9 times larger than the former; thus, the local and regional forest-grown material production process resulted in higher GHG emission levels.
When comparing local and regional products, there was almost no difference in GHG emissions despite the difference in total transportation distance of approximately 600 km. This was due to the use of rail transportation, which has low GHG emission intensity, to transport the domestic hardwood logs from the sawmill to the furniture factory. While it was shown that procuring wood from local communities is the most effective measure for promoting the use of domestic hardwoods for the purpose of contributing to carbon neutrality, a modal shift from trucks to less GHG-emitting modes of transportation, such as rail or ship, is an effective means of significantly expanding the scope of wood procurement while reducing GHG emissions.
4. Conclusions
In this study, the GHG emissions and carbon storage of hardwood chairs (Product A and Product B), which were manufactured by two furniture manufacturers in the Hida-Takayama region of Gifu Prefecture, Japan, respectively, by processing imported hardwood sawn lumber from North America, were calculated using LCA methods for the process from raw material procurement to product manufacturing. In addition, GHG emission reductions were calculated if foreign hardwoods were converted to local and regional products. As a result, the following conclusions were reached. The GHG emissions of the foreign hardwood chairs were 23.12 kg-CO2e for Product A and 22.23 kg-CO2e for Product B. The value for Product A, with its smaller lumber volume, was larger. This factor was related to the low yield of Product A.
The GHG emissions of hardwood chairs processed and manufactured in Japan from sawn lumbers imported from North America were 23.12 kg-CO2e for Product A and 22.23 kg-CO2e for Product B.
Regarding the breakdown of GHG emissions from foreign hardwood chairs, the highest percentage of emissions for both products came from the raw board transportation process, which is part of the raw material procurement stage. Even though the distance transported by truck was only about 3% of the total transportation distance, the breakdown of GHG emissions from the transportation process by transportation mode showed that truck transportation accounted for 15% of the GHG emissions for Product A and 13% of the GHG emissions for Product B.
Among the raw materials other than wood materials, GHG emissions from paint and packaging materials each accounted for about 10% of total emissions, indicating that reviewing paint and simplifying packaging are highly effective in reducing GHG emissions.
The carbon storage capacity was 11.20 kg-CO2 for Product A and 16.90 kg-CO2 for Product B.
Conversion of foreign hardwoods to local and regional products resulted in GHG emission reductions of approximately 25% and 27% for Product A and 20% and 21% for Product B, respectively. By procuring raw materials from domestic sources, the transportation distance in the raw board transportation process was significantly reduced.
The results of GHG emissions from local and regional sources indicate that sourcing wood from the region is the most effective GHG emission reduction measure, while a modal shift can expand the scope of wood sourcing while limiting the increase in GHG emissions.
This study shows that the conversion of materials to local and regional products contributes to the reduction of GHG emissions from the life cycle. Currently, in Japan, initiatives to utilize domestic hardwoods have begun in places such as Hida City in Gifu Prefecture. By shifting the supply chain to local production for local consumption, we can minimize GHG emissions. With regard to the use of woody biomass, ensuring traceability and guaranteeing the sustainability of forests have become important in recent years, as due diligence to prevent deforestation has been strongly demanded. Since the Hida region is working on sustainable wood production for local broadleaf forests, it is necessary to support these efforts.
While this study used data from North American softwood logs to determine emissions from silviculture and material production processes, data from hardwoods should be obtained. Emissions from silviculture and material production processes represent only about 5% of total emissions and are not expected to significantly affect the results. However, for more accurate results, differences in the method and period of forest production between hardwoods and softwoods should be considered. Also, no information was available on the transportation process beyond the fact that the trucks were fueled by diesel fuel in this study. In the future, however, consideration should be given to the possibility of changing conditions affecting the emissions results.
Author Contributions
Conceptualization, T.N.; methodology, Y.F.; formal analysis and writing-original draft preparation, I.O.; writing-review and editing, I.O., Y.F. and T.N. All authors have read and agreed to the published version of the manuscript.
Funding
This research received no external funding.
Data Availability Statement
The data supporting this study’s findings were based on surveys conducted as part of the research. The raw data collected from these surveys have not been made publicly available due to privacy and ethical considerations, as they contain information that could compromise the respondents’ confidentiality. However, the authors created aggregated data that do not reveal any personal or sensitive information and are available only upon reasonable request. Interested researchers can contact the corresponding author for details on the data’s accessibility, subject to compliance with ethical standards and any applicable privacy regulations. The survey instrument and methodology used for data collection in this study were rigorously designed to ensure comprehensive and accurate insights into the research objectives.
Acknowledgments
We would like to thank the two wooden furniture manufacturers in the Takayama region of Gifu Prefecture for their cooperation in this study.
Conflicts of Interest
The authors declare no conflicts of interest.
References
- Linkosalmi, L. Main factors influencing greenhouse gas emissions of wood-based furniture industry in Finland. J. Clean. Prod. 2016, 113, 596–605. [Google Scholar] [CrossRef]
- Nadia, M.; Valentina, C.; Serenella, S. LCA for assessing environmental benefit of eco-design strategies and forest wood short supply chain. a furniture case study. Int. J. Life Cycle Assess. 2014, 19, 1536–1550. [Google Scholar]
- Jan, L.W.; Richter, K.; Ruter, S. A Methodical Approach for Systematic Life Cycle Assessment of Wood-Based Furniture. J. Ind. Ecol. 2017, 22, 671–685. [Google Scholar]
- Jennifer, D.R.; Huff, K.; Haviarova, E. Evaluating the cascading-use of wood furniture: How value-retention processes can contribute to material efficiency and circularity. J. Ind. Ecol. 2022, 27, 856–867. [Google Scholar]
- Lao, W.-L.; Li, W.-G. Comparative carbon footprint estimation of three types of wooden door: A case study from China. J. Clean. Prod. 2023, 433, 139745. [Google Scholar] [CrossRef]
- De Souza Pinho, G.C.; Calmon, J.L.; Medeiros, D.L.; Vieira, D.; Bravo, A. Wood Waste Management from the Furniture Industry: The Environmental Performances of Recycling, Energy Recovery, and Landfill Treatments. Sustainability 2023, 15, 14944. [Google Scholar] [CrossRef]
- Lao, W.-L. Assessing environmental burdens of China’s wooden flooring production based on life-cycle assessment. J. Clean. Prod. 2024, 446, 141341. [Google Scholar] [CrossRef]
- Yang, D.; Vezzoli, C. Designing Environmentally Sustainable Furniture Products: Furniture-Specific Life Cycle Design Guidelines and a Toolkit to Promote Environmental Performance. Sustainability 2024, 16, 2628. [Google Scholar] [CrossRef]
- Sakib, M.N.; Kabir, G.; Ali, S.M. A life cycle analysis approach to evaluate sustainable strategies in the furniture manufacturing industry. Sci. Total Environ. 2024, 907, 167611. [Google Scholar] [CrossRef] [PubMed]
- Sustainable Management Promotion Organization: Japan EPD Program by SuMPO Carbon Footprint of Products (CFP) Registration number: JR-AM-21002C. Available online: https://ecoleaf-label.jp/ (accessed on 1 September 2023). (In Japanese)
- American Wood Council: Environmenal Product Declaration North American Softwood Lumber. Evironmental Product Declaration of North American Softwood Lumber. Available online: https://cwc.ca (accessed on 1 September 2023).
- Hitoe, K.; Hasegawa, T.; Hasegawa, K.; Terazawa, K.; Yamanaka, K.; Hattori, N. Case Study of Life Cycle Assessment of Domestic Logs. J. Wood Sci. 2013, 59, 269–277. (In Japanese) [Google Scholar]
- Komata, H.; Kato, Y.; Ishikawa, Y.; Tsujimoto, H.; Hattori, N. GHG Emissions in Production and Transportation Process of Domestic and Imported Wooden Building Materials. J. Life Cycle Assess. Jpn. 2011, 7, 175–185. (In Japanese) [Google Scholar] [CrossRef][Green Version]
- Rail Passengers Association: Amtrak Fact Sheet. California Zephyr Service (202) 408-8362. Available online: https://www.railpassengers.org/site/assets/files/3440/27.pdf (accessed on 1 September 2023).
- MITSUI-SOKO HOLDINGS: Sustainable Link MS CO2 Navigator. Available online: https://www.mitsui-soko.com/sustainalink/emissions_calculator/ (accessed on 1 January 2023). (In Japanese).
- Japanese Ministry of the Environment. Emission Factors by Electric Utility (for Calculating GHG Emissions of Specific Emitters)—FY2021 Results; Japanese Ministry of the Environment and Japanese Ministry of Economy: Tokyo, Japan. Available online: https://www.env.go.jp/content/000142333.pdf (accessed on 24 January 2023). (In Japanese)
- The Research Institute of Science for Safety and Sustainability, AIST, Research Laboratory for IDEA: LCI Database IDEA Version 3.2.0. Available online: https://riss.aist.go.jp/en-idealab/ (accessed on 15 April 2022). (In Japanese).
- Japanese Ministry of Agriculture, Forestry and Fisheries. Guideline for the Labeling of Carbon Stored in Wood Used for Buildings; Japanese Ministry of Agriculture, Forestry and Fisheries: Tokyo, Japan. Available online: https://www.rinya.maff.go.jp/j/mokusan/mieruka.html (accessed on 1 March 2023). (In Japanese)
- Sustainable Management Promotion Organization in Japan: Product Category Rule (PCR) Product Category Rule for “Wood Products”. Available online: https://ecoleaf-label.jp/ (accessed on 1 September 2023). (In Japanese).
| Disclaimer/Publisher’s Note: The statements, opinions and data contained in all publications are solely those of the individual author(s) and contributor(s) and not of MDPI and/or the editor(s). MDPI and/or the editor(s) disclaim responsibility for any injury to people or property resulting from any ideas, methods, instructions or products referred to in the content. |
© 2024 by the authors. Licensee MDPI, Basel, Switzerland. This article is an open access article distributed under the terms and conditions of the Creative Commons Attribution (CC BY) license (https://creativecommons.org/licenses/by/4.0/).


