Article

Evaluation of Aggregate Distribution Heterogeneity in 3D Printed Concrete by Means of X-ray CT

1
Division of Field Engineering for the Environment, Graduate School of Engineering, Hokkaido University, Sapporo 060-8628, Japan
2
Division of Civil Engineering, Faculty of Engineering, Hokkaido University, Sapporo 060-8628, Japan
3
Technical Center of Engineering, Graduate School of Engineering, Hokkaido University, Sapporo 060-8628, Japan
*
Author to whom correspondence should be addressed.
Buildings 2024, 14(4), 1132; https://doi.org/10.3390/buildings14041132
Submission received: 29 February 2024 / Revised: 28 March 2024 / Accepted: 13 April 2024 / Published: 17 April 2024

Abstract

:
The mechanical performance of a printed object in 3D concrete printing is influenced by the interfacial bonding strength between the deposited filaments. Hence, the physical properties of the layer interface and the influential factors have been studied. This study aims to clarify the mechanism of aggregate distribution heterogeneity as well as the influence of printing material extrusion speed on the heterogeneity inside the filament. A laboratory-scale material extruder is developed and used in this study. The aggregate distribution is evaluated in a quantitative manner with the cross-sectional image obtained by X-ray computed tomography. The images were taken in the deposited filament and the material extrusion nozzle for printing. Results show that large aggregate moves from the outside of the printing nozzle toward the center with increasing extrusion speed from 1.8 to 7.1 mm/s. As extrusion speed increases, it is inferred that a lubrication layer forms on the inner surface of the nozzle, causing the transition of material extrusion behavior from laminate flow to plug flow. Thus, the aggregate distribution appears differently inside the filament. This finding indicates that the magnitude of friction against the nozzle wall alters the die swell during discharge as well as the aggregate distribution before and after extrusion.

1. Introduction

3D concrete printing (3DCP) technology is rapidly developing, and it is promisingly expected to achieve free modeling [1,2,3] without the need for formworks. The realization of free modeling enables structures with cavity and truss structures to be included internally [3,4,5]. The cavity has been reported to enhance the thermal insulation of buildings [3,4]. An example showed that a curved wall, which is designed to damp acoustic waves, improved soundproofing properties [3]. Also, the new construction technology improves productivity [6] and economic efficiency [7] through the automated system. The extrusion-based method, which is currently the major method of 3DCP using cementitious materials, causes the oriented formation of the layer interface between the deposited filaments. It triggers two main challenges for printed objects. One of the challenges is weak interfacial adhesion strength between layers [8,9,10,11]. The other is the anisotropic mechanical property of the 3D-printed object [8,9,12].
In previous studies, it has been reported that interfacial adhesion strength affects the anisotropy of printed objects [8,13]. The 3D-printed objects show higher strength in the extrusion direction than in the perpendicular direction [12,14]. This means that the printing path affects the strength and anisotropy of the printed object. Additionally, the existence of fragile areas near the interface is identified by micro-indentation tests on the layer interface, which is the boundary layer formed between adjacent filaments [9]. The interfacial adhesion strength is affected by gap time (the time interval between the printing of each filament and the adjacent filament) [9,15]. Its main factor is the decreasing water content on the filament surface due to the increasing gap time. The decreasing water content induces a lack of hydration reactions at the interlayer [11,16,17,18]. Furthermore, the increase in porosity between layers is measured by image analysis using the X-ray CT method [19,20].
As for the conventional casting of concrete, it has been pointed out that local material segregation affects the mechanical properties of the concrete [21,22,23,24]. For example, it is difficult for coarse aggregate to be placed near formwork, which is known as the wall effect [23,24]. Some studies employed X-ray computed tomography to obtain aggregate distribution [24,25]. A study shows that the boundary layer of concrete at the formwork surface is cement paste with a thickness of 0.1 mm, and the interior layer is composed of mortar with a thickness of 5 mm [26]. The aggregate content increases with increasing distance from the boundary. The local segregation affects the mechanical properties of the concrete. It is analytically revealed that the load capacity of concrete decreases with increasing aggregate content [27]. Therefore, it is predicted that aggregate distribution heterogeneity also affects the strength and anisotropy of 3D-printed objects.
When cementitious material is discharged with its required flowability, the mortar used as the 3D printing material is flowed out under pressure to be extracted from the nozzle. The flow behavior of cementitious 3D printing material is similar to that in a pipe during conventional pumping of concrete. When concrete flows in a pipe, plug flow (flow with a uniform velocity distribution in the pipe cross section) occurs [28,29,30,31,32,33]. This is because a lubricating layer is generated near the inner surface of the pipe wall. The mechanism is the segregation of water and cement paste due to flow-induced particle migration [31,32,33]. Inside the pipe, shear stress from fresh concrete concentrates at the pipe wall [30,32]. Consequently, the aggregate moves away from the pipe wall in accordance with the velocity distribution and the shear force distribution. It is reported that the formation of the lubricating layer is caused by increasing pressure inside the pipe [28,29]. Additionally, it is suggested that before the lubricating layer is completely formed, the flow velocity is laminar flow, not plug flow [29,32,34]. Similarly, in 3DCP, the flow velocity distribution of mortar inside the nozzle is transformed depending on the extrusion speed. It is considered essential to investigate the variation of aggregate distribution in the cross-sectional direction with material extrusion speed.
As above-mentioned, the weak interlayer adhesion strength affects the anisotropy of 3D-printed concrete objects. The formation mechanisms and properties of the boundary layer have been investigated. However, there are few studies on aggregate distribution inside the filament or interfacial zone. Nevertheless, the occurrence of aggregate distribution heterogeneity and its effect on the mechanical properties of printed objects remain unclear. Therefore, it is important to evaluate the heterogeneity of aggregate distribution inside the filament as a fundamental study.
The objective of this study is (1) to evaluate aggregate distribution inside 3D printed filament; (2) to reveal the mechanism of the aggregate distribution heterogeneity inside the filament; and (3) to investigate the effect of material extrusion speed on the heterogeneity. A cartridge-type 3D printer was simplified and built for the experimental tests in the laboratory. Filaments were extruded by the printer at different material extrusion speeds. X-ray CT was employed to obtain consecutive cross-sectional images of the hardened filament and nozzle filled with the material after extrusion. To quantitatively evaluate the aggregate distribution heterogeneity, an image three-dimensional analysis method was applied.

2. Materials and Methods

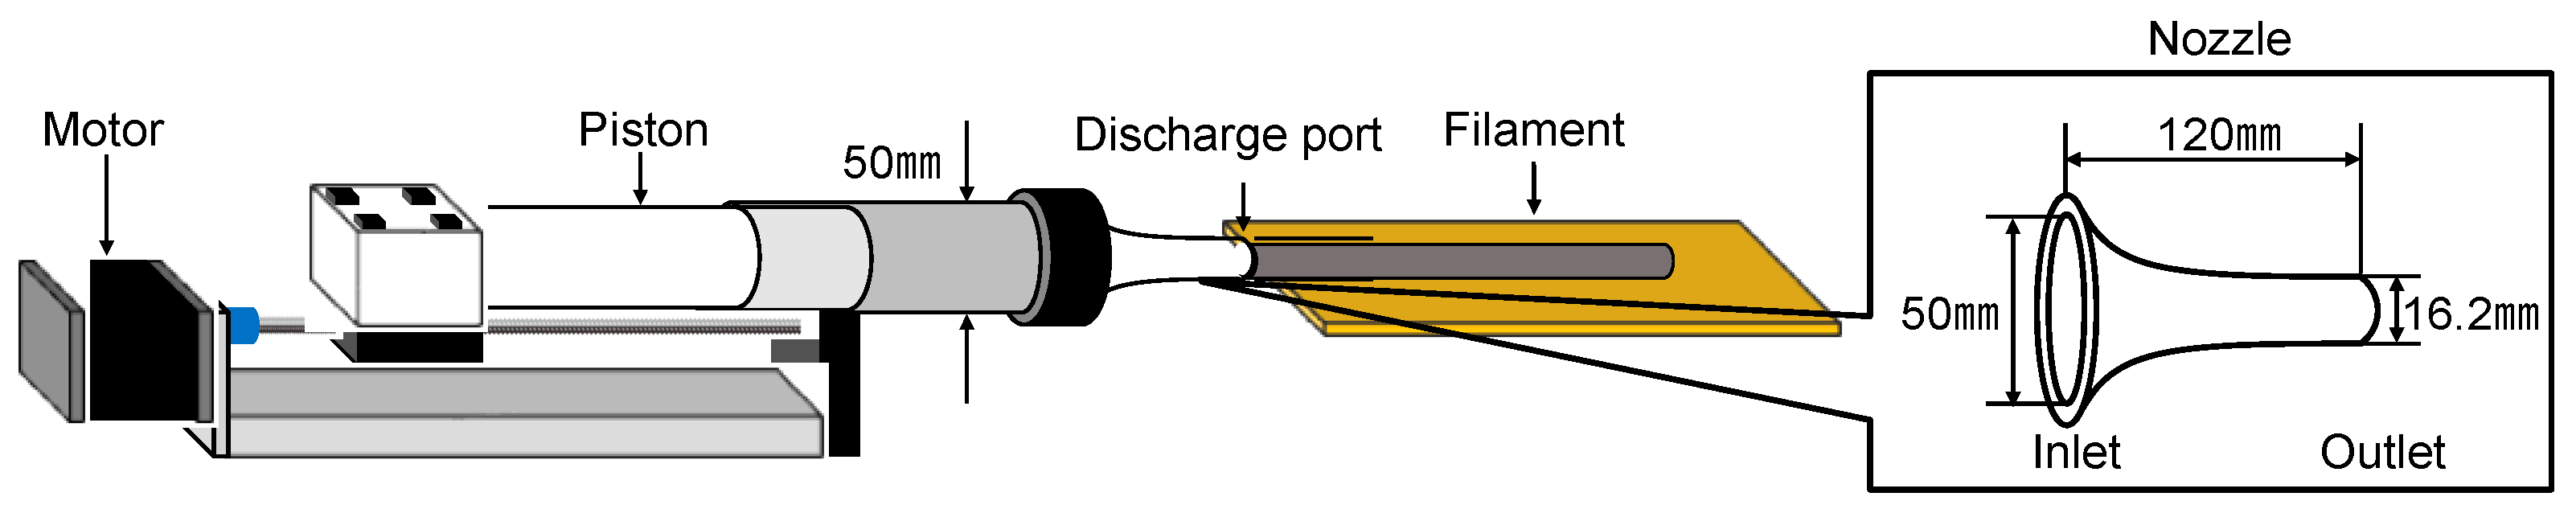
2.1. Outline of the 3D Printer
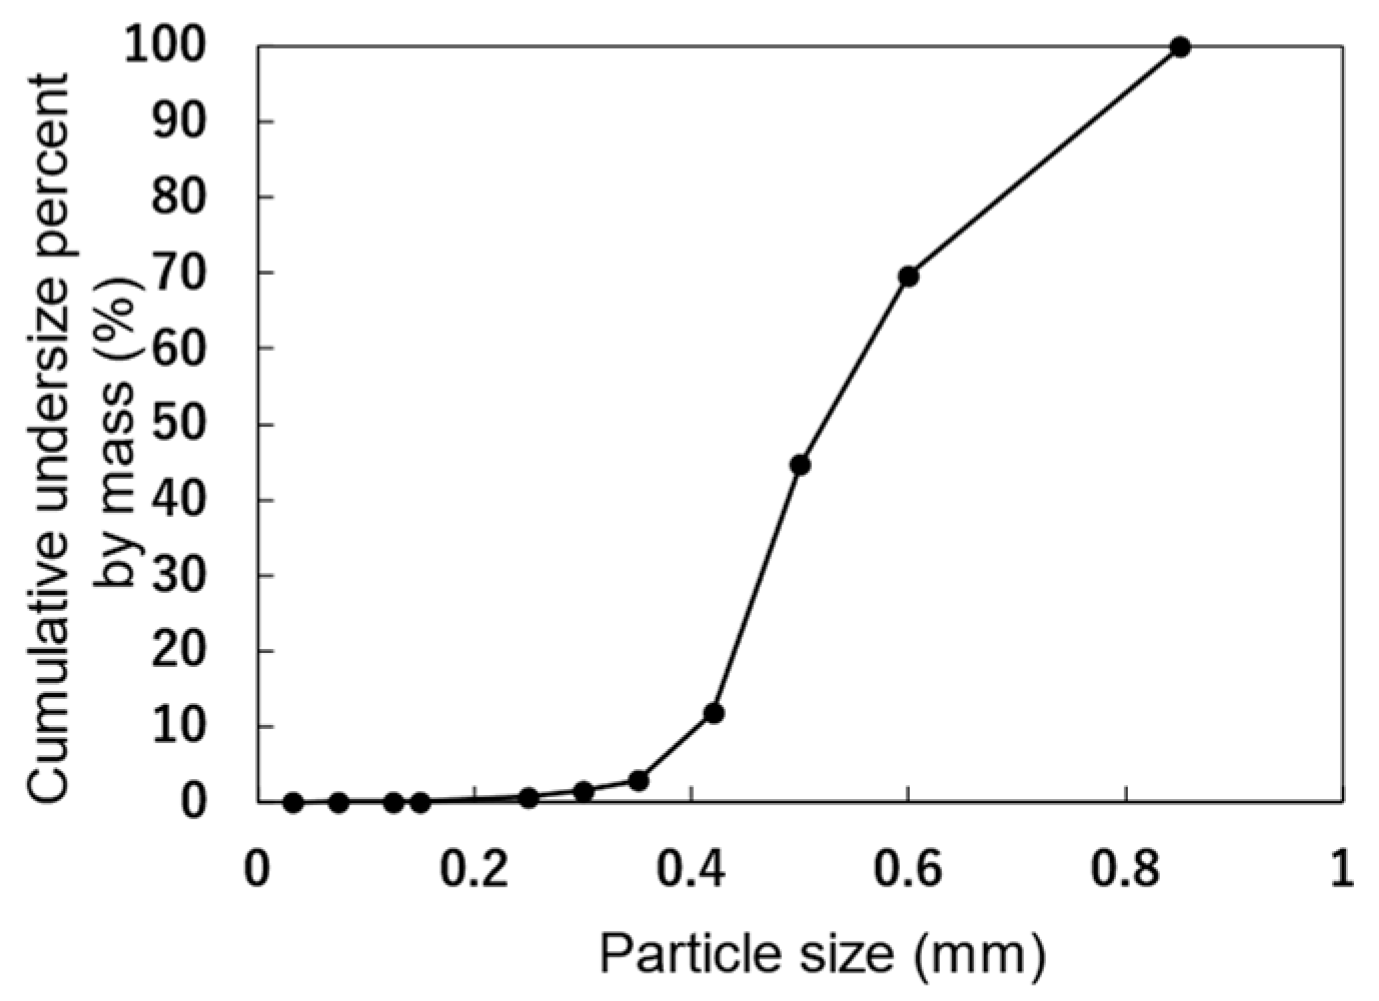
An extruder for a cartridge-type 3D printer was developed. Figure 1 shows the material extrusion mechanics using a piston and the nozzle shape. The cartridge-type 3D printer includes a piston to stably extrude highly viscous material at high pressure. The extrusion speed is controlled by controlling the speed of the piston. The inner diameter of the piston is 50 mm. The system mechanically controls the moving speed of the piston and that of the platform, where the material is printed. Hereinafter, the moving speed of the platform is referred to as “nozzle speed” because it is the moving speed of the nozzle from the viewpoint of the platform. The nozzle is designed to be easily replaced to remove the hardened material inside the nozzle after extrusion. The inner diameter of the nozzle where the mortar flows in (inlet) is 50 mm, and that of the nozzle where the mortar is discharged (outlet) is 16.2 mm. While the inner diameter of the nozzle is small for real-scale construction, it facilitates high-resolution printing [35,36]. Consequently, printers equipped with small nozzles have the potential to produce highly detailed or smooth-surfaced structures. However, in this study, the small nozzle is utilized as experimental equipment to clarify the mechanism underlying the occurrence of heterogeneous aggregate distribution in 3D printed material.

2.2. Material

Mortar was used as the 3DCP filament material. Ordinary portland cement, silica sand, and a polycarboxylic acid-based superplasticizer were used. The water–cement ratio and sand–cement ratio of the mortar were 0.22 and 0.50, respectively. 3.0% of superplasticizer was added to the cement mixture. The use of silica sand was for better segmentation of aggregate on the CT image. The particle size distribution of the silica sand is shown in Figure 2. The superplasticizer was used as an admixture to improve both buildability and flowability while minimizing the change in flowability with the elapsed time after mixing. The cement and aggregate were mixed using a mixer at a rotating velocity of 140 revolutions per minute (rpm) and a revolution velocity of 62 rpm for 2 min. Water and superplasticizer were added to the materials and mixed at the same speed for 2 min. Then, the materials were mixed at a rotating speed of 285 rpm and a revolution speed of 125 rpm for 4 min. The mortar flow immediately after mixing was measured in accordance with JIS R5201. The mortar flow was 109.3 mm with no drop and 176.2 mm with 15 drops. Three cylindrical samples, each 50 mm in diameter and 100 mm in height, were prepared for the compression test. The average compressive strength of them was 47.3 N/mm2 in 28 days of curing in air at 20 °C and 60% R.H.

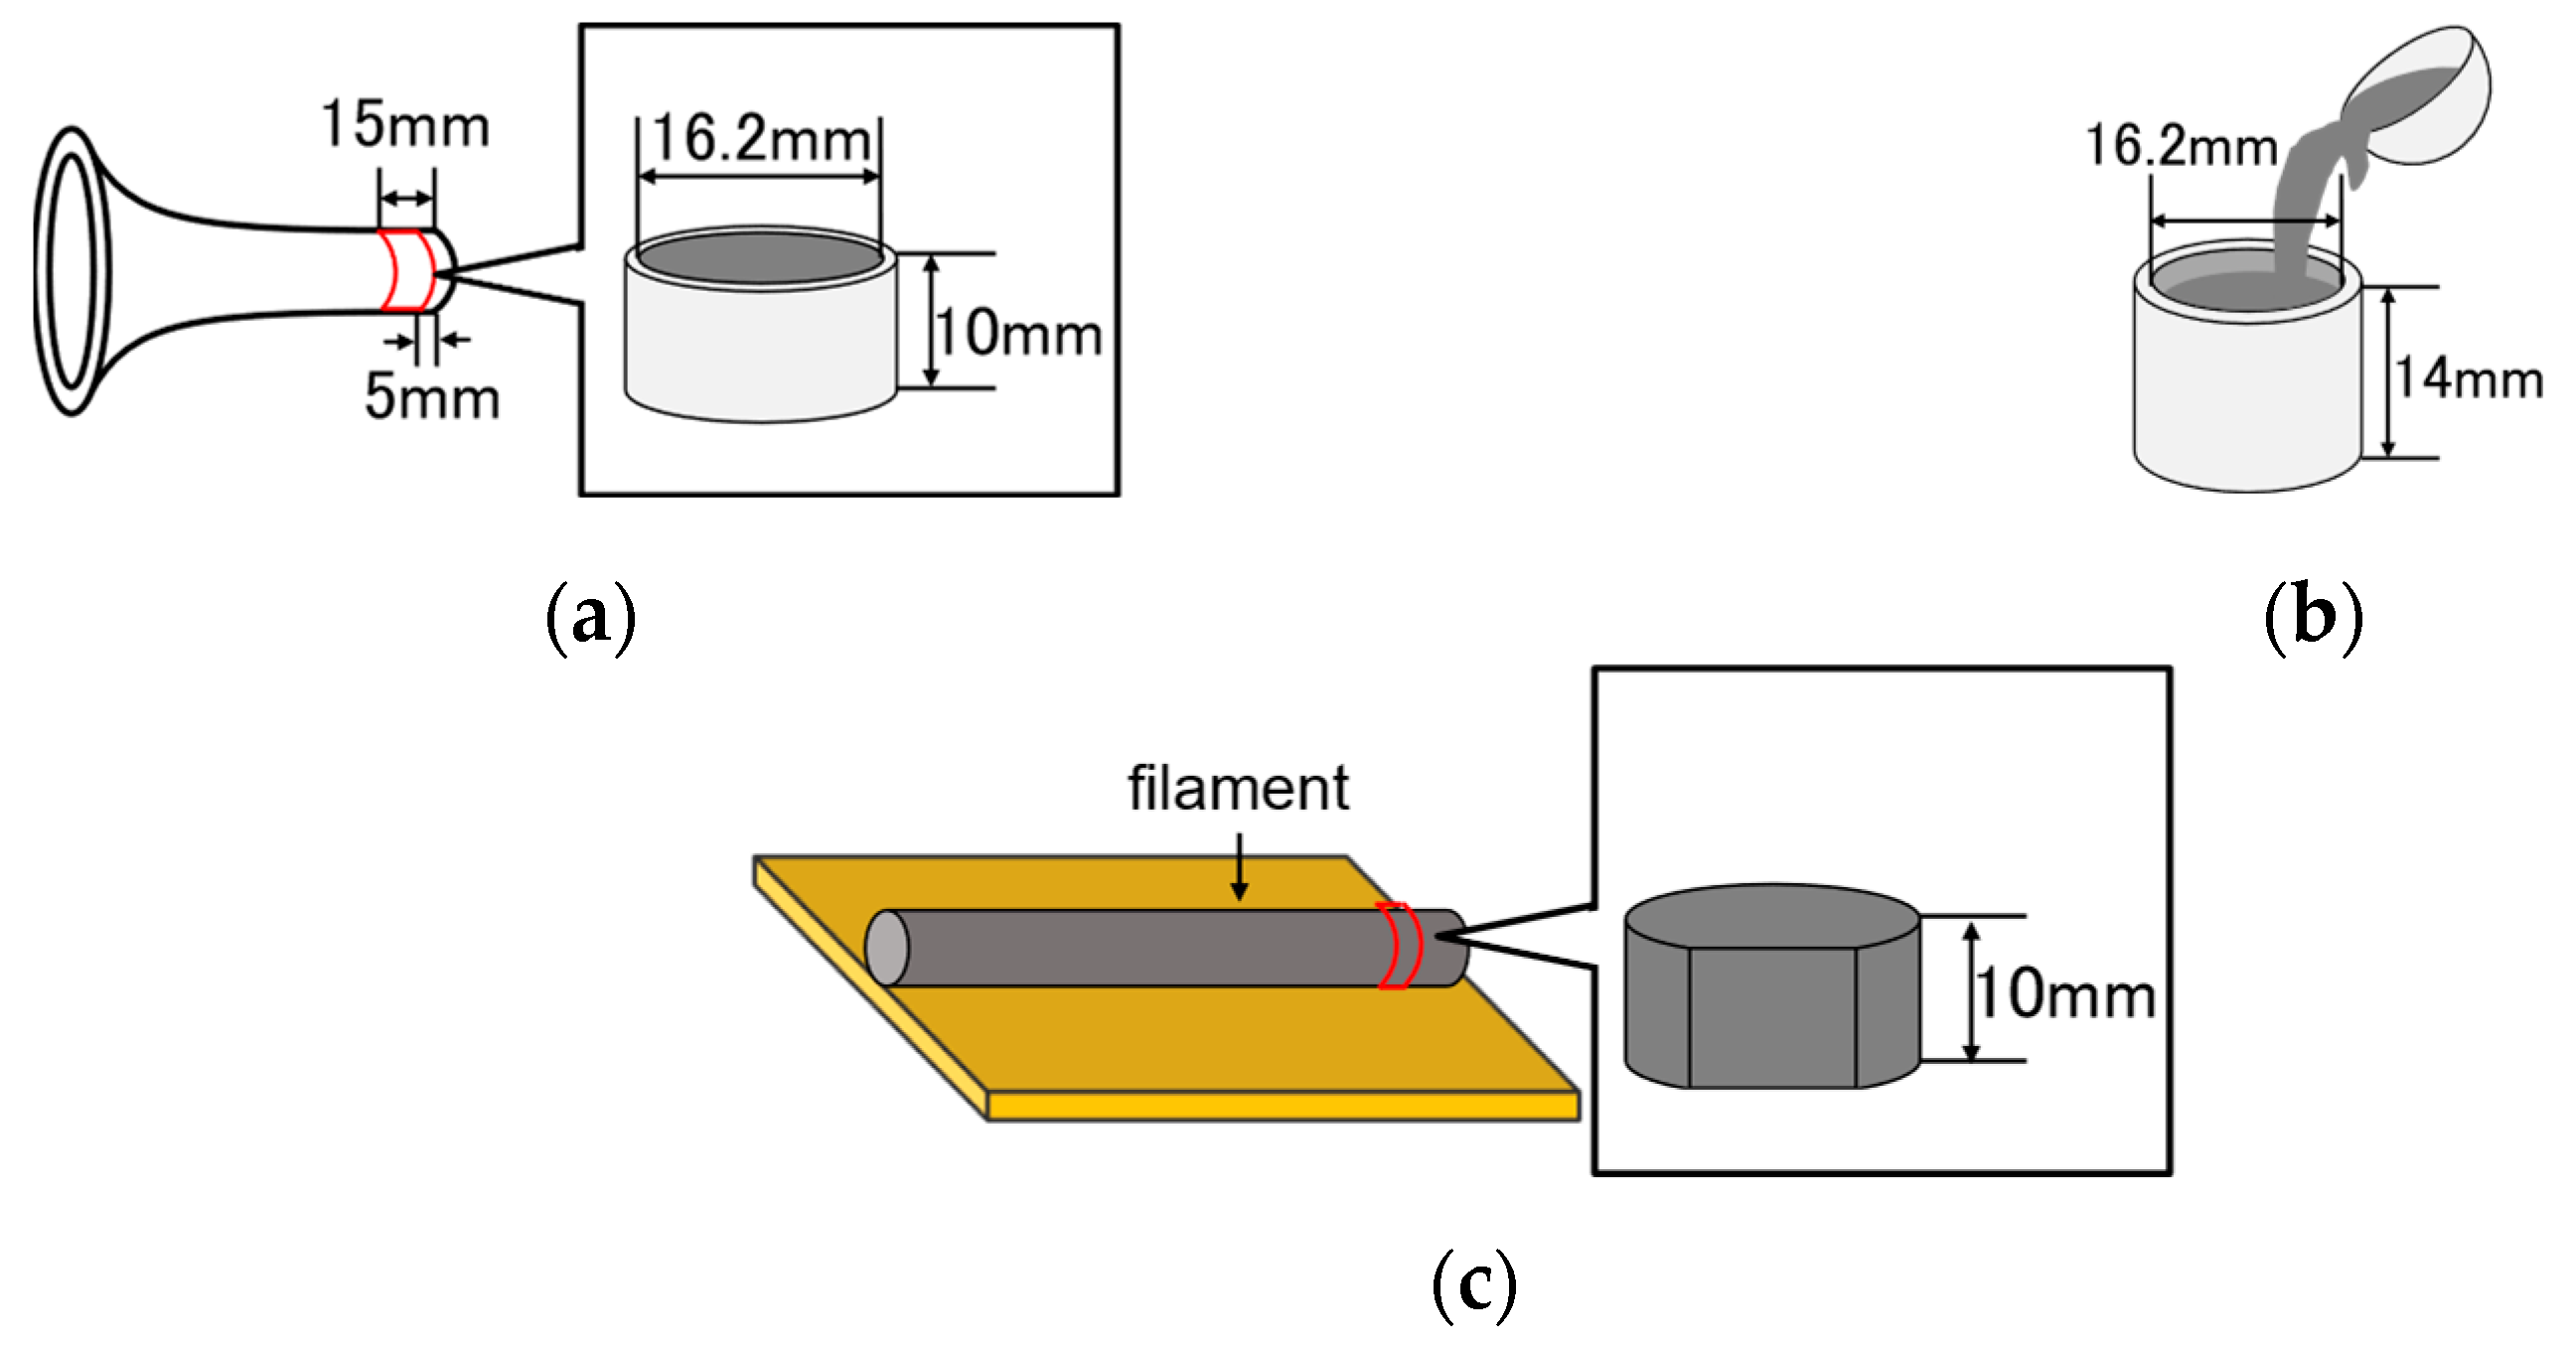
2.3. Sample Preparation

Table 1 shows the preparation conditions of each sample to quantify its aggregate distribution. Mortar was extruded from the outlet while the piston speed was controlled at 0.2 mm/s, 0.4 mm/s, or 0.8 mm/s, respectively. The nozzle speed was also controlled depending on the piston speed. A schematic view of the samples is shown in Figure 3. After the material was adequately hardened, the nozzles between 5 mm and 15 mm from the outlet were cut out and used as a 10 mm-thick sample (hereinafter referred to as M02n, M04n, or M08n, depending on the piston speed). A cylindrical sample with a diameter of 16.2 mm and a height of 10 mm (hereinafter referred to as “Mc”) was prepared as the reference specimen by the conventional casting method. The cylindrical sample (Mc) was intended to reproduce aggregate distribution inside the nozzle due to self-filling and without the influence of flow velocity during extrusion. 10 mm of filaments were cut at an arbitrary location and used as samples (hereinafter referred to as M02f, M04f, or M08f, depending on the piston speed).

3. Analysis Method

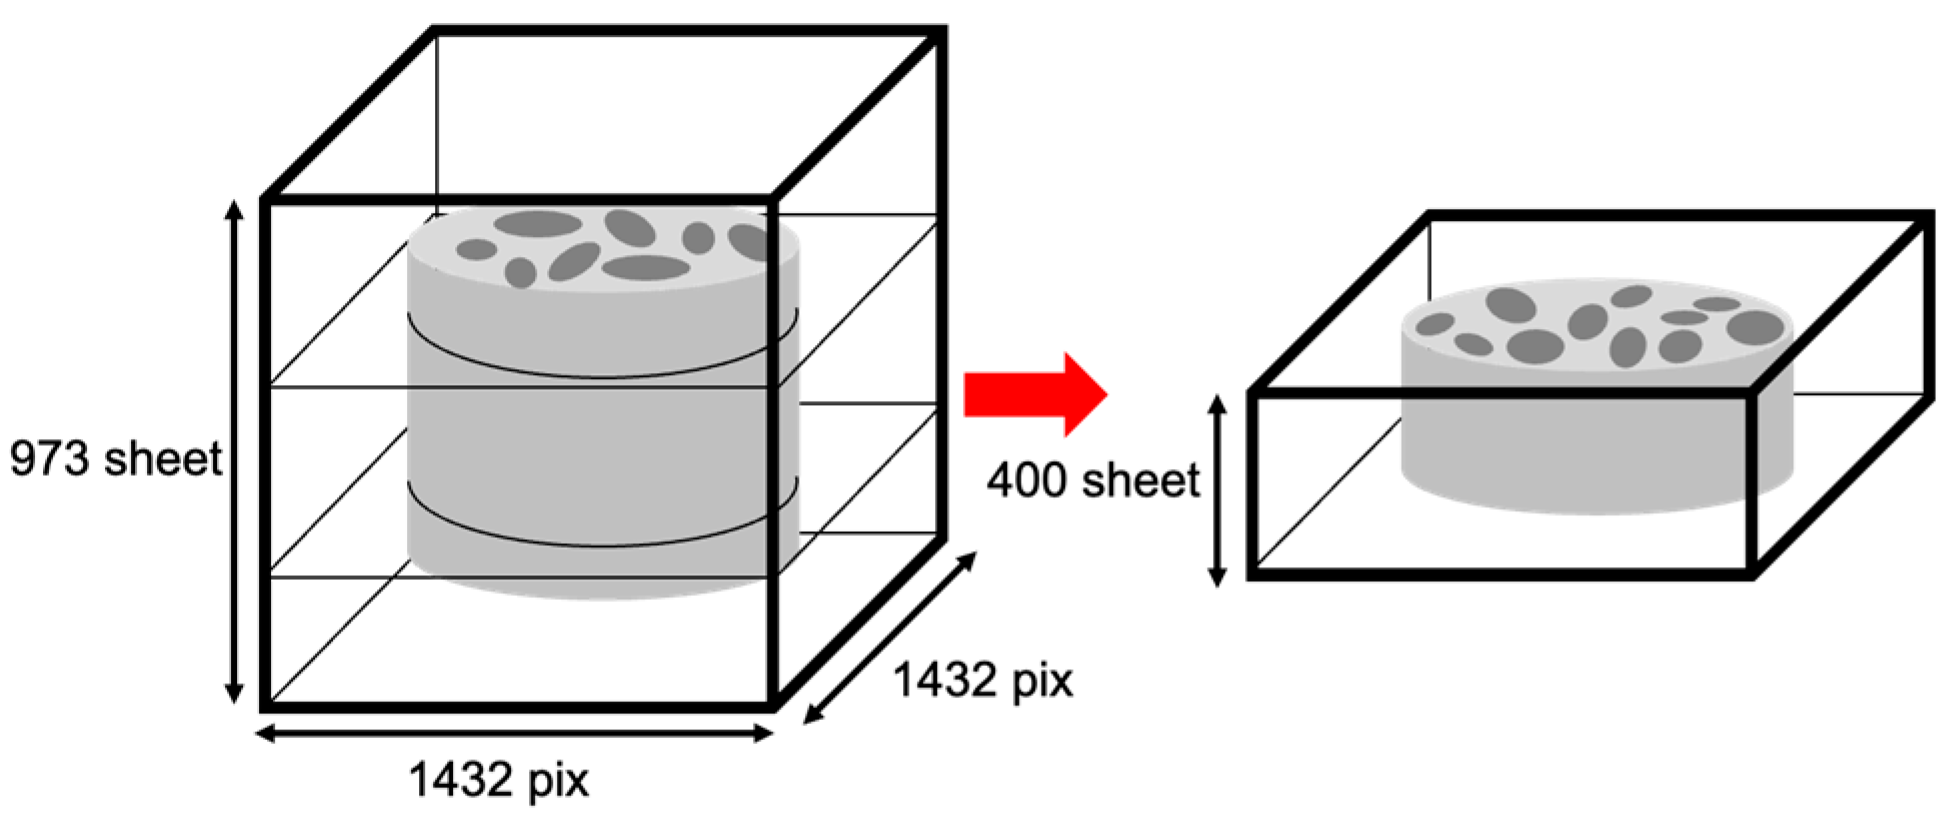
3.1. X-ray Computed Tomography

A micro-CT scanner was used to obtain grayscale, consecutive cross-sectional images of the samples. The imaging conditions were as follows: voltage across the X-ray tube 100 kV, X-ray tube current 200 µA, resolution 8.97 µm/pixel, image size 2864 pixel × 2864 pixel, number of images for each sample 1946, and imaging exposure time 4080 s.

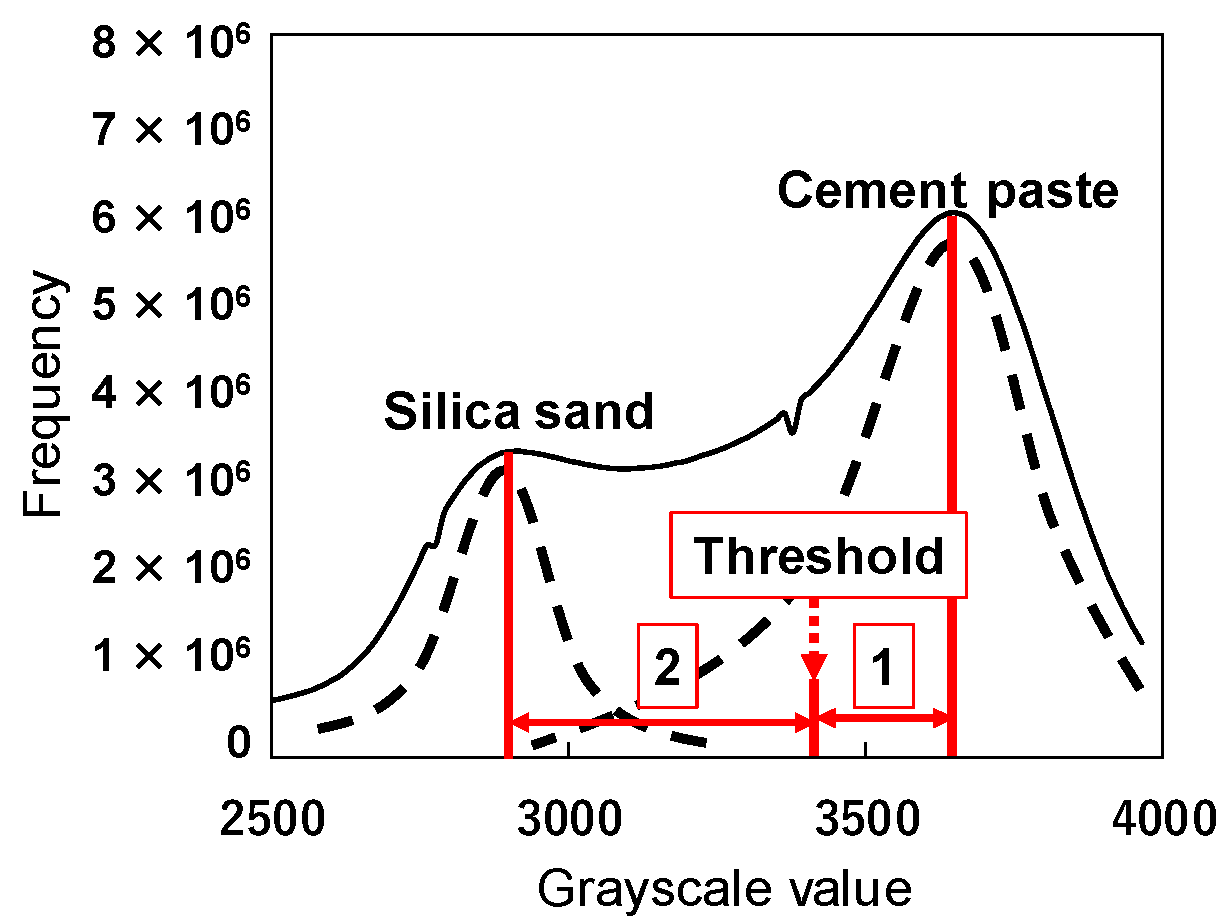
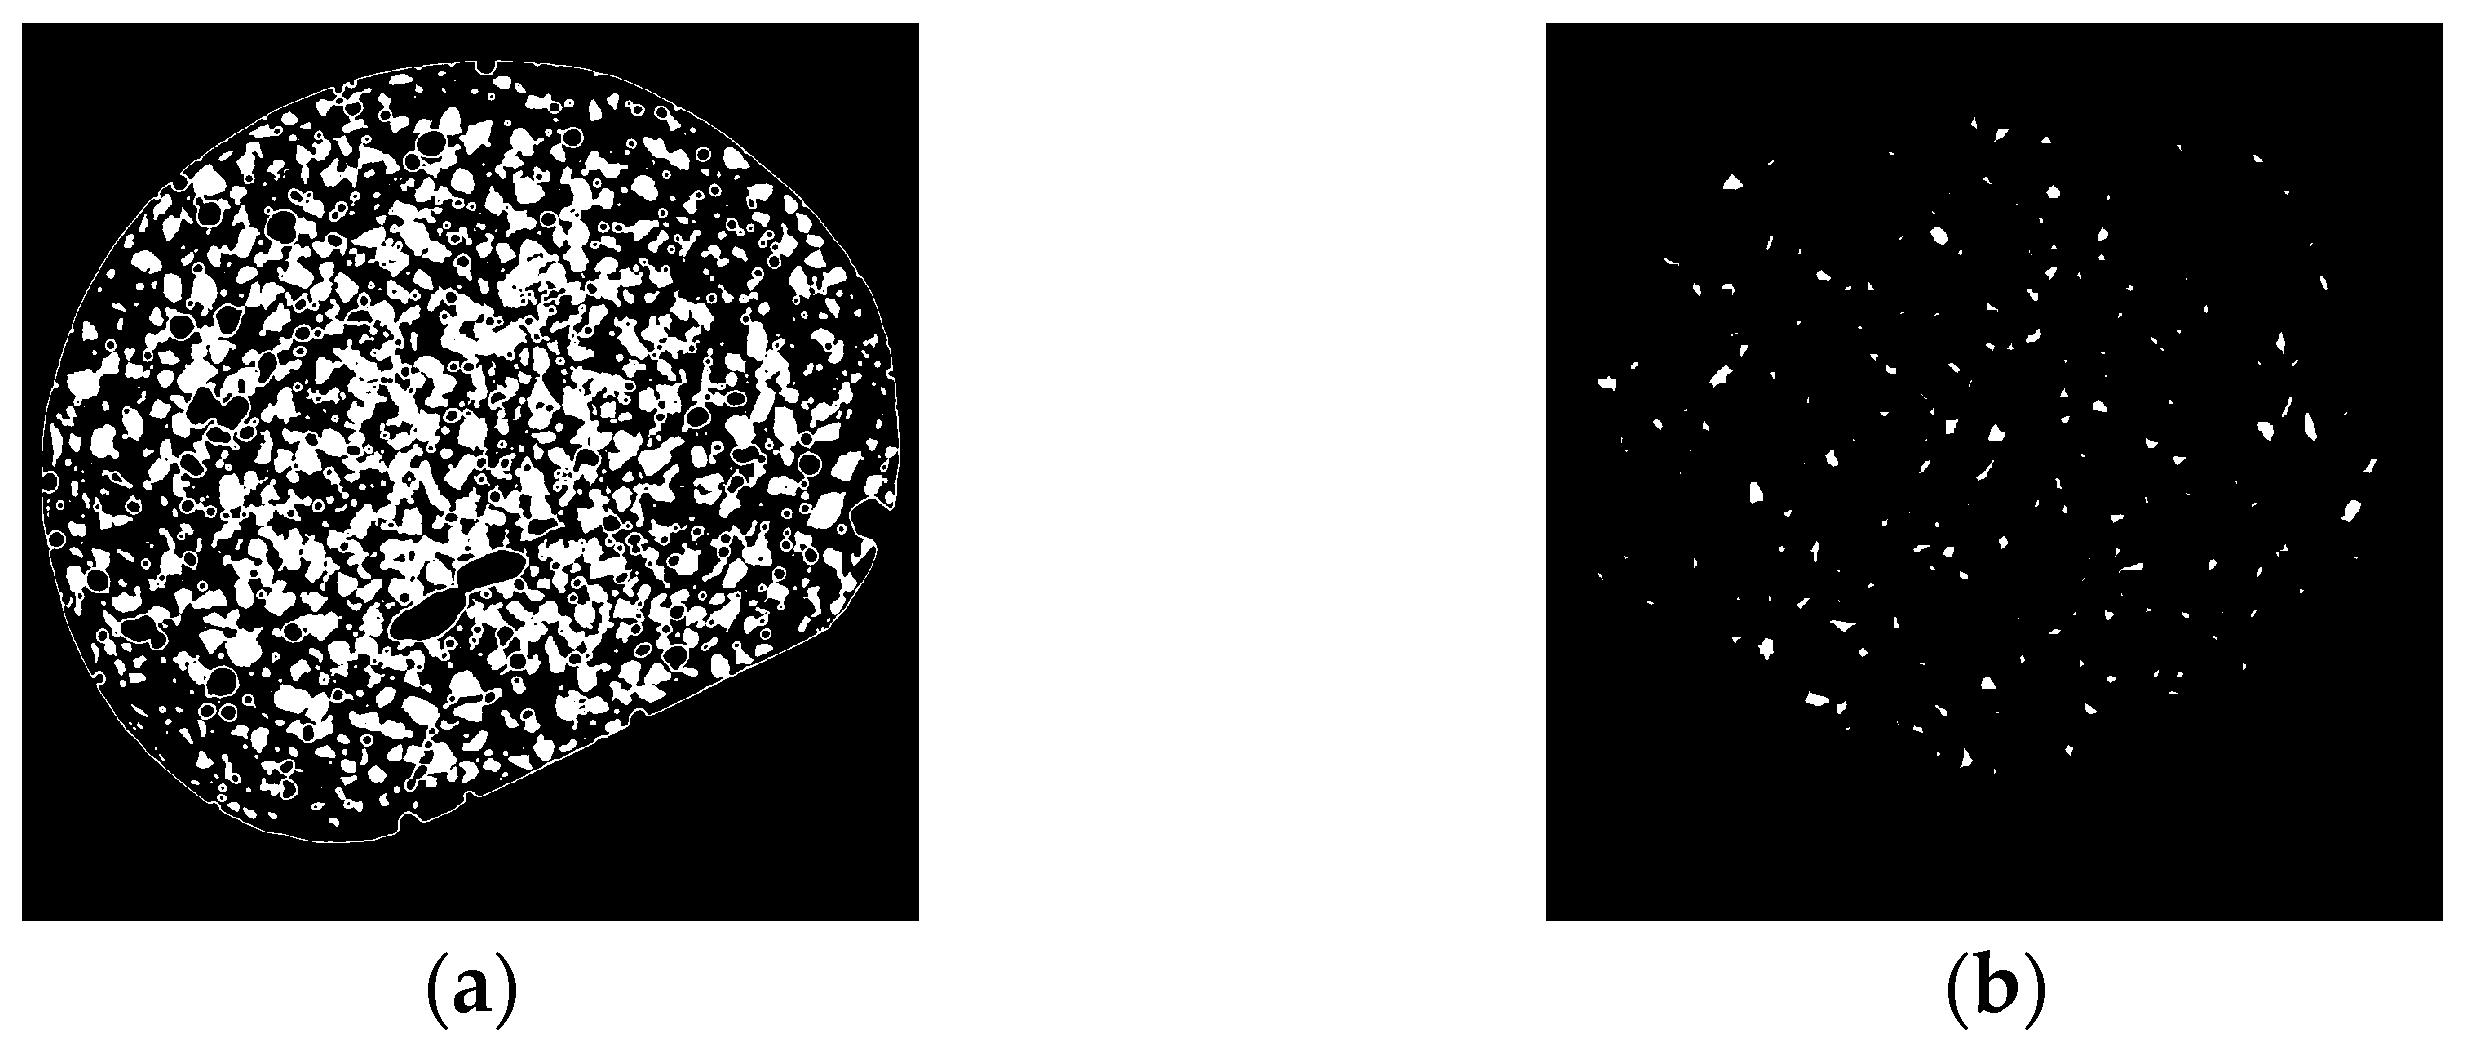
3.2. Binarization Processing

To save computation time, the resolution of the consecutive cross-sectional X-ray CT images was reduced from 8.97 µm/pixel to 17.94 µm/pixel. The image size of each image after the resolution reduction is 973 images of 1432 pixel × 1432 pixel. Therefore, some of the 973 consecutive cross-sectional images for each sample do not capture the 10 mm-thick sample. A total of 400 consecutive images were selected as the region of interest so that all 400 images captured the sample, as shown in Figure 4. For noise reduction by smoothing, a Gaussian filter was applied to each cross-sectional image with a kernel size of 2 pixels.
Figure 5 shows an overview of the grayscale value (GSV) histogram for the mortar and the thresholding method to binarize the grayscale images. Due to the difference in density, the most frequent GSV of the aggregate in the GSV histogram is smaller than that of the cement paste. The difference between the GSVs is small. To binarize the images into aggregate and cement paste in the image analysis of this study, the threshold was set to the GSV that divides the most frequent GSV of the aggregate and that of the cement paste into 2 and 1.
The thresholding method assumes that the aggregate GSV distribution is symmetrical around the peak. Therefore, the GSV distribution below the peak was used to estimate that above the peak. Applying the above thresholding method, approximately 90% of the estimated aggregate GSV distribution was counted as aggregate.

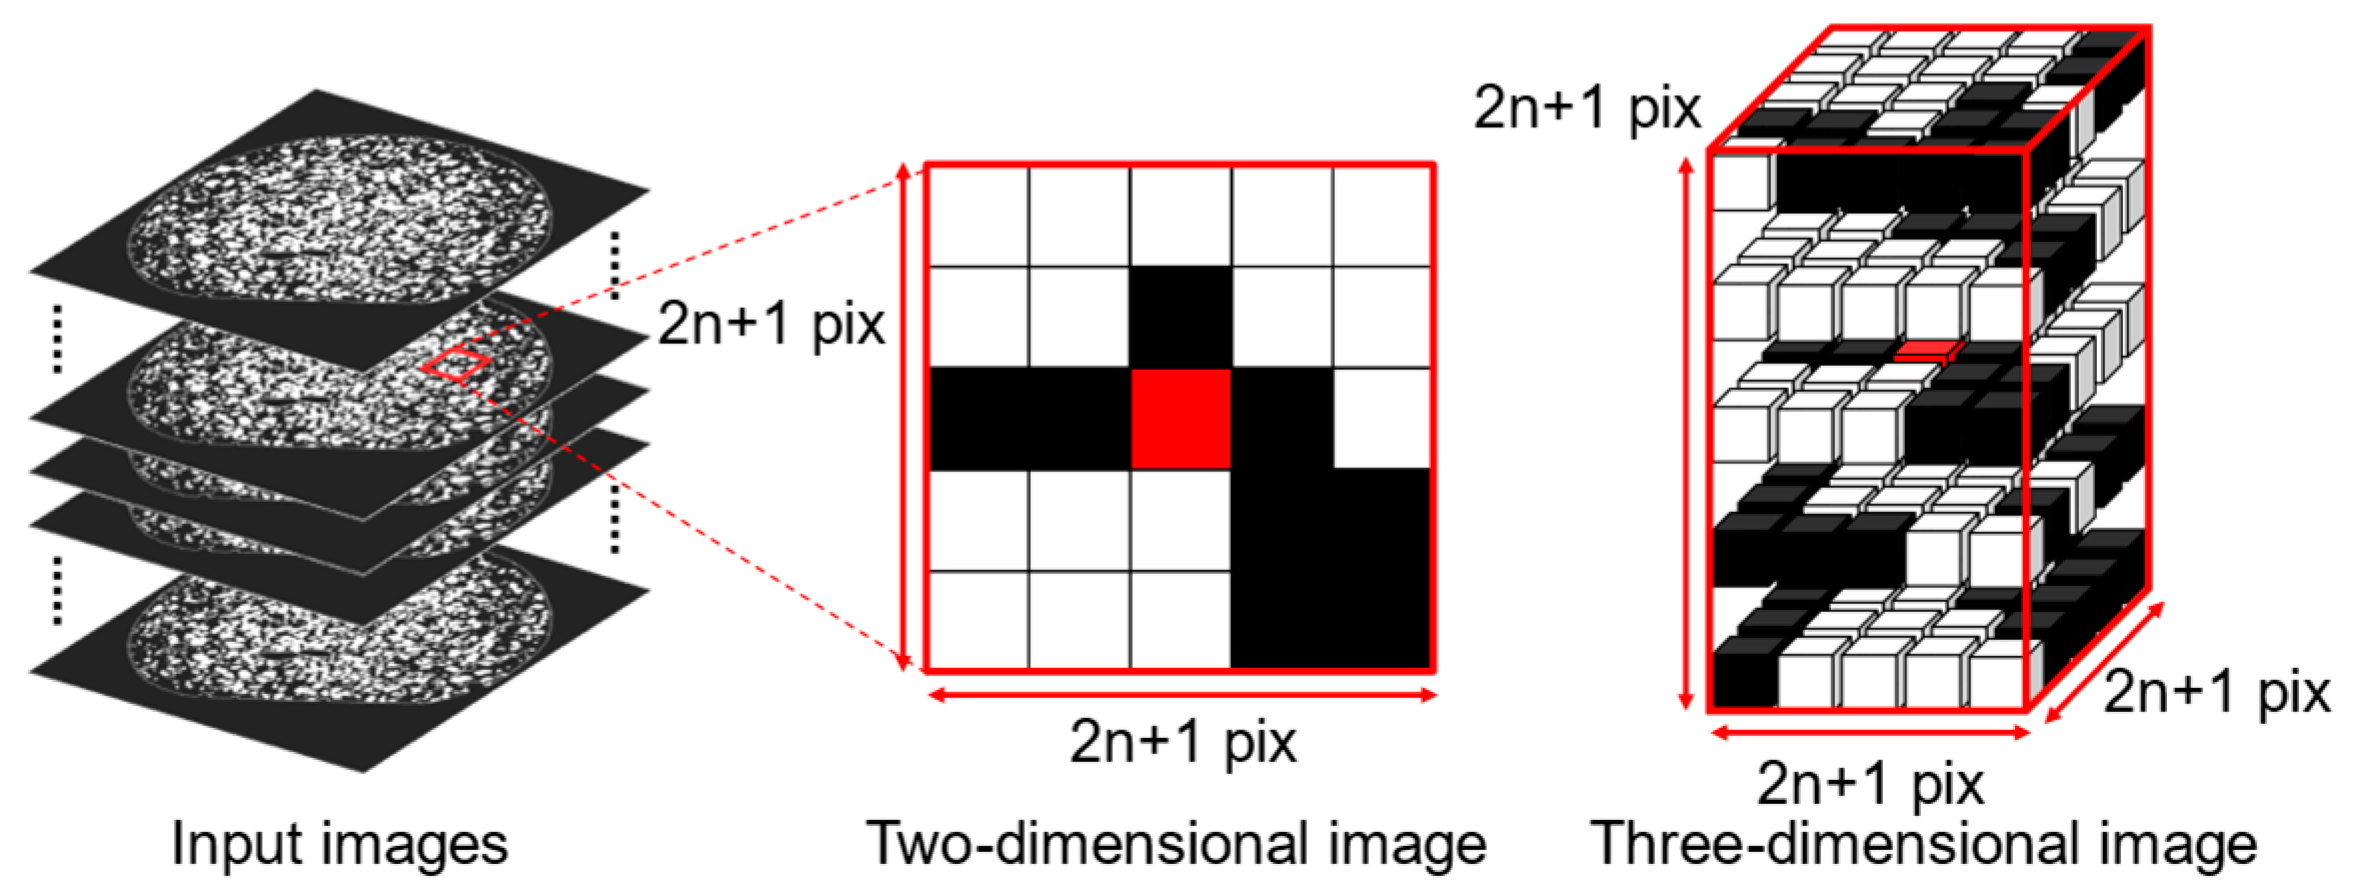
3.3. Application of ADI and Obtainment of Centroid Coordinates

Figure 6a shows a cross-sectional image after binarization. Because the GSV of the aggregate and that of cement paste are close, the aggregates are extracted as they are combined with each other in the binarized images. Therefore, the volume and coordinates of each aggregate cannot be accurately obtained. An image analysis using ADI (Aggregate Distribution Index) was applied to the binarized images to separate the combined aggregate. Figure 7 shows a conceptual diagram of the ADI calculation. Equation (1) shows the calculation formula for the ADI.
ADI = N ( 2 n + 1 ) 3 × 100   [ % ]
The ADI is calculated for every pixel. It is the number of pixels representing aggregate in the cube-shaped region of interest with 2n + 1 sides centered on the featured pixel (N). Divided by the total number of pixels in the region of interest ((2n + 1)3), it is expressed as a percentage value. The ADI of pixels that are not aggregated before the calculation is set to 0. It has been verified that all pixels that can be represented as aggregates are successfully extracted as aggregates after binarization. Images after the ADI calculation are also binarized with a given threshold value. Cement paste between aggregates is counted as cement paste in the processed image. Hence, aggregate cores are separated from each other. Figure 6b shows an image after ADI processing. Figure 6 indicates that the aggregate cores after the processing (Figure 6b) are smaller than the aggregate component before the processing (Figure 6a), but aggregate cores are extracted separately.
In this study, the size of the region of interest was set to n = 5, and pixels with ADI = 100 were treated as aggregate cores. As mentioned above, the image element size after the resolution reduction is 17.94 µm/pixel. Therefore, all pixels in the cubic-shaped region of interest have 197.34 µm sides centered on the featured pixel, and the featured pixel is extracted as an aggregate core component. The presence of extremely small aggregates that were not extracted as aggregate cores can be ignored. This is because the volume of the silica sand with a particle size less than 200 µm was less than 1% of the total volume, as shown in Figure 2. Open-source image processing software, ImageJ version 1.54c [37], was used to obtain the volume and centroid coordinates of each aggregate core. The particle size was defined as the length corresponding to the diameter of the aggregate core, since it is assumed that the aggregate core is spherical.

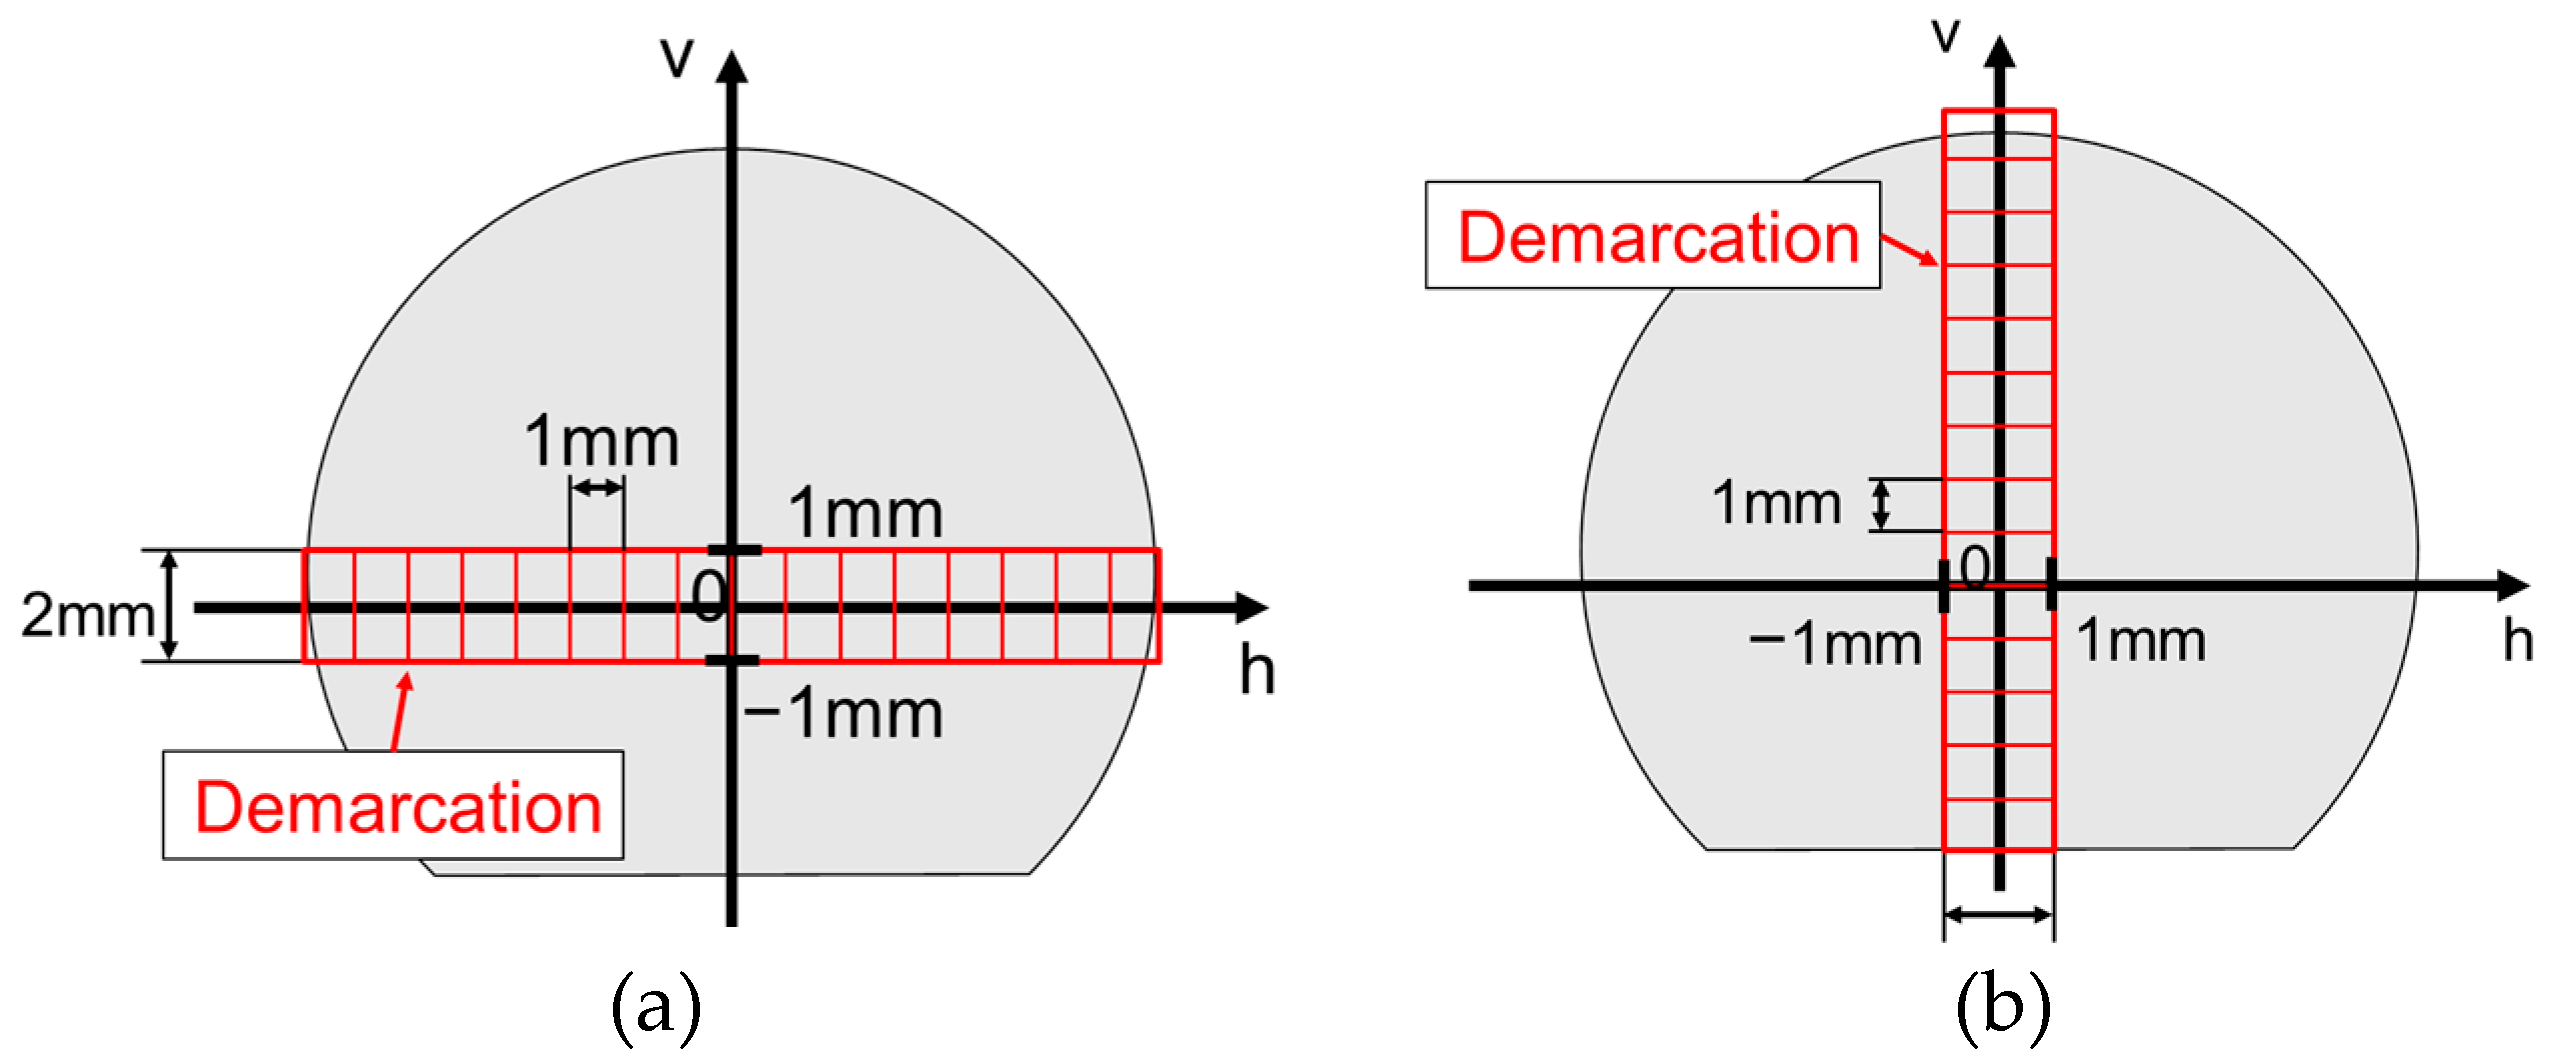
4. Evaluation Method for the Extrusion Speed Effect

The obtained particle size and centroid coordinates of each aggregate core are used to evaluate the aggregate distribution inside the nozzle (before discharge) and inside the filament (after discharge).

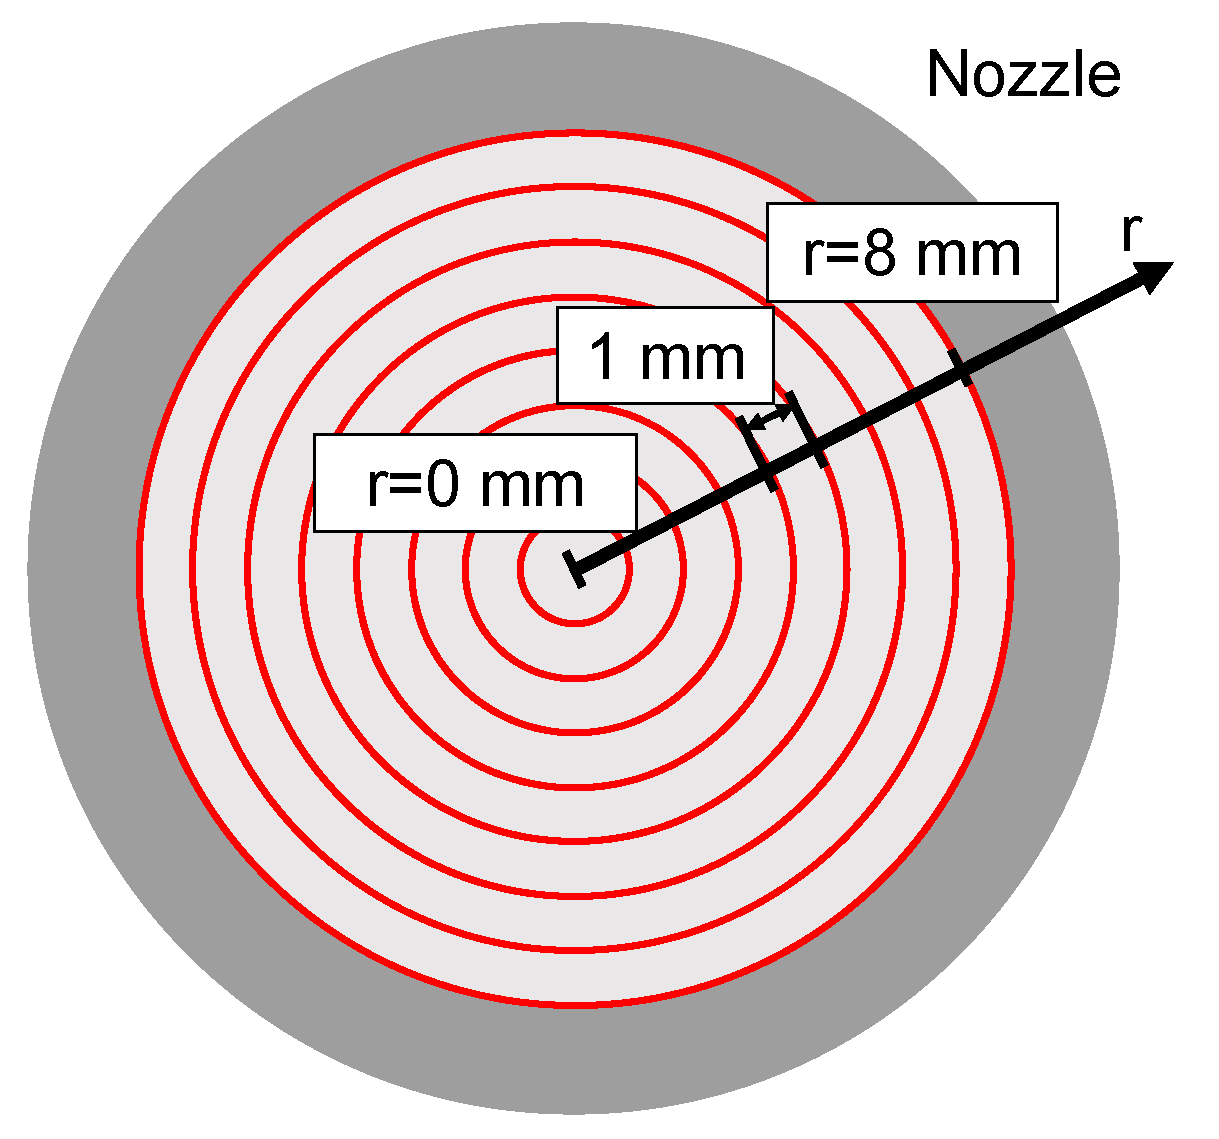
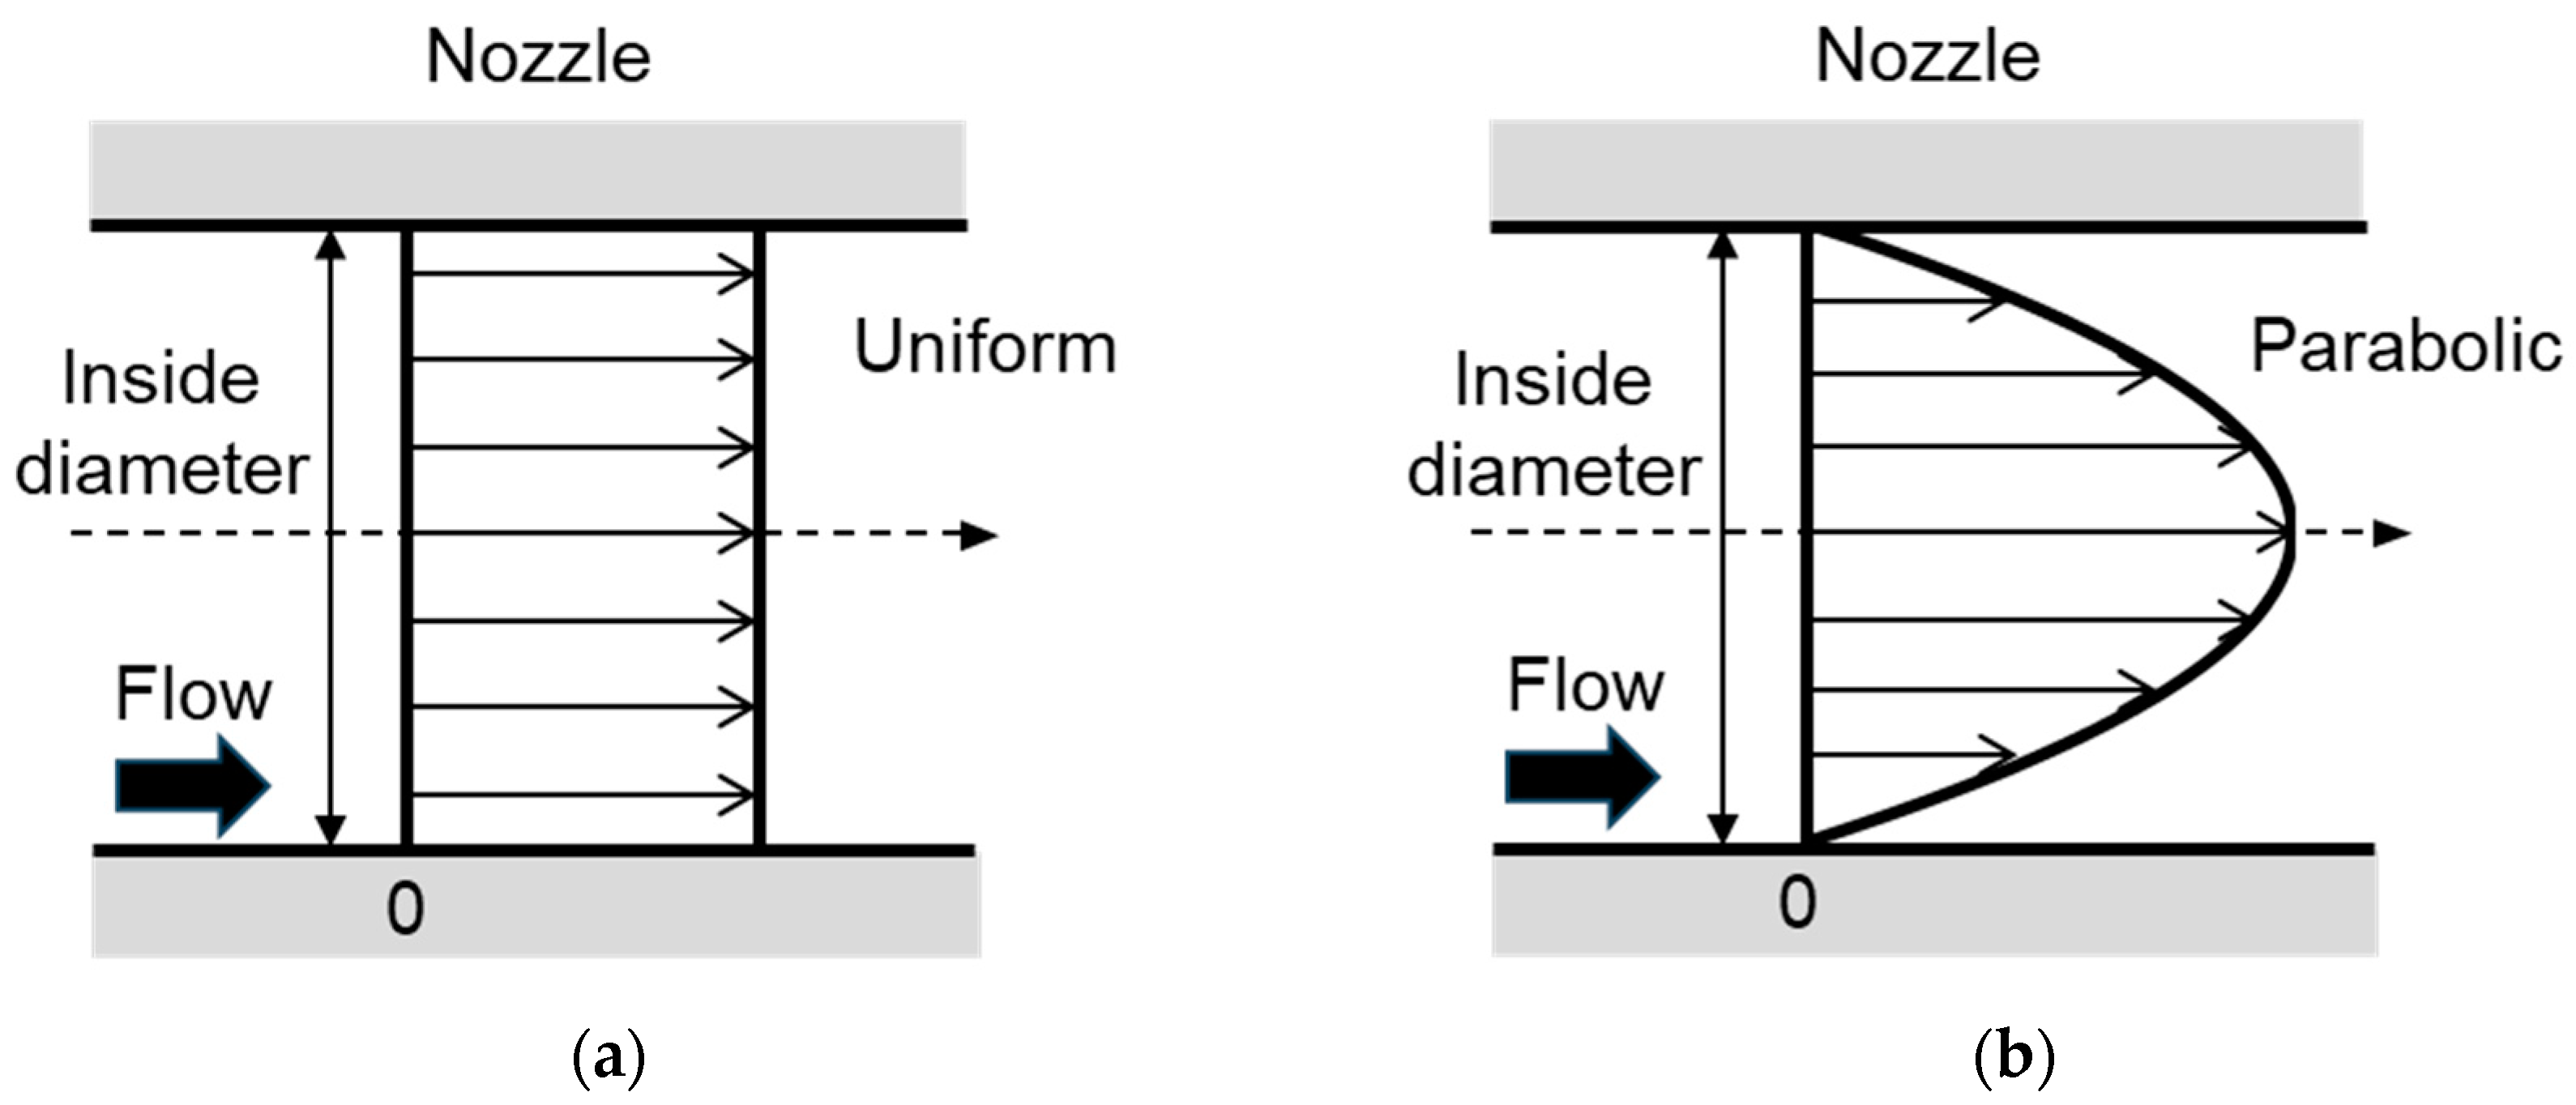
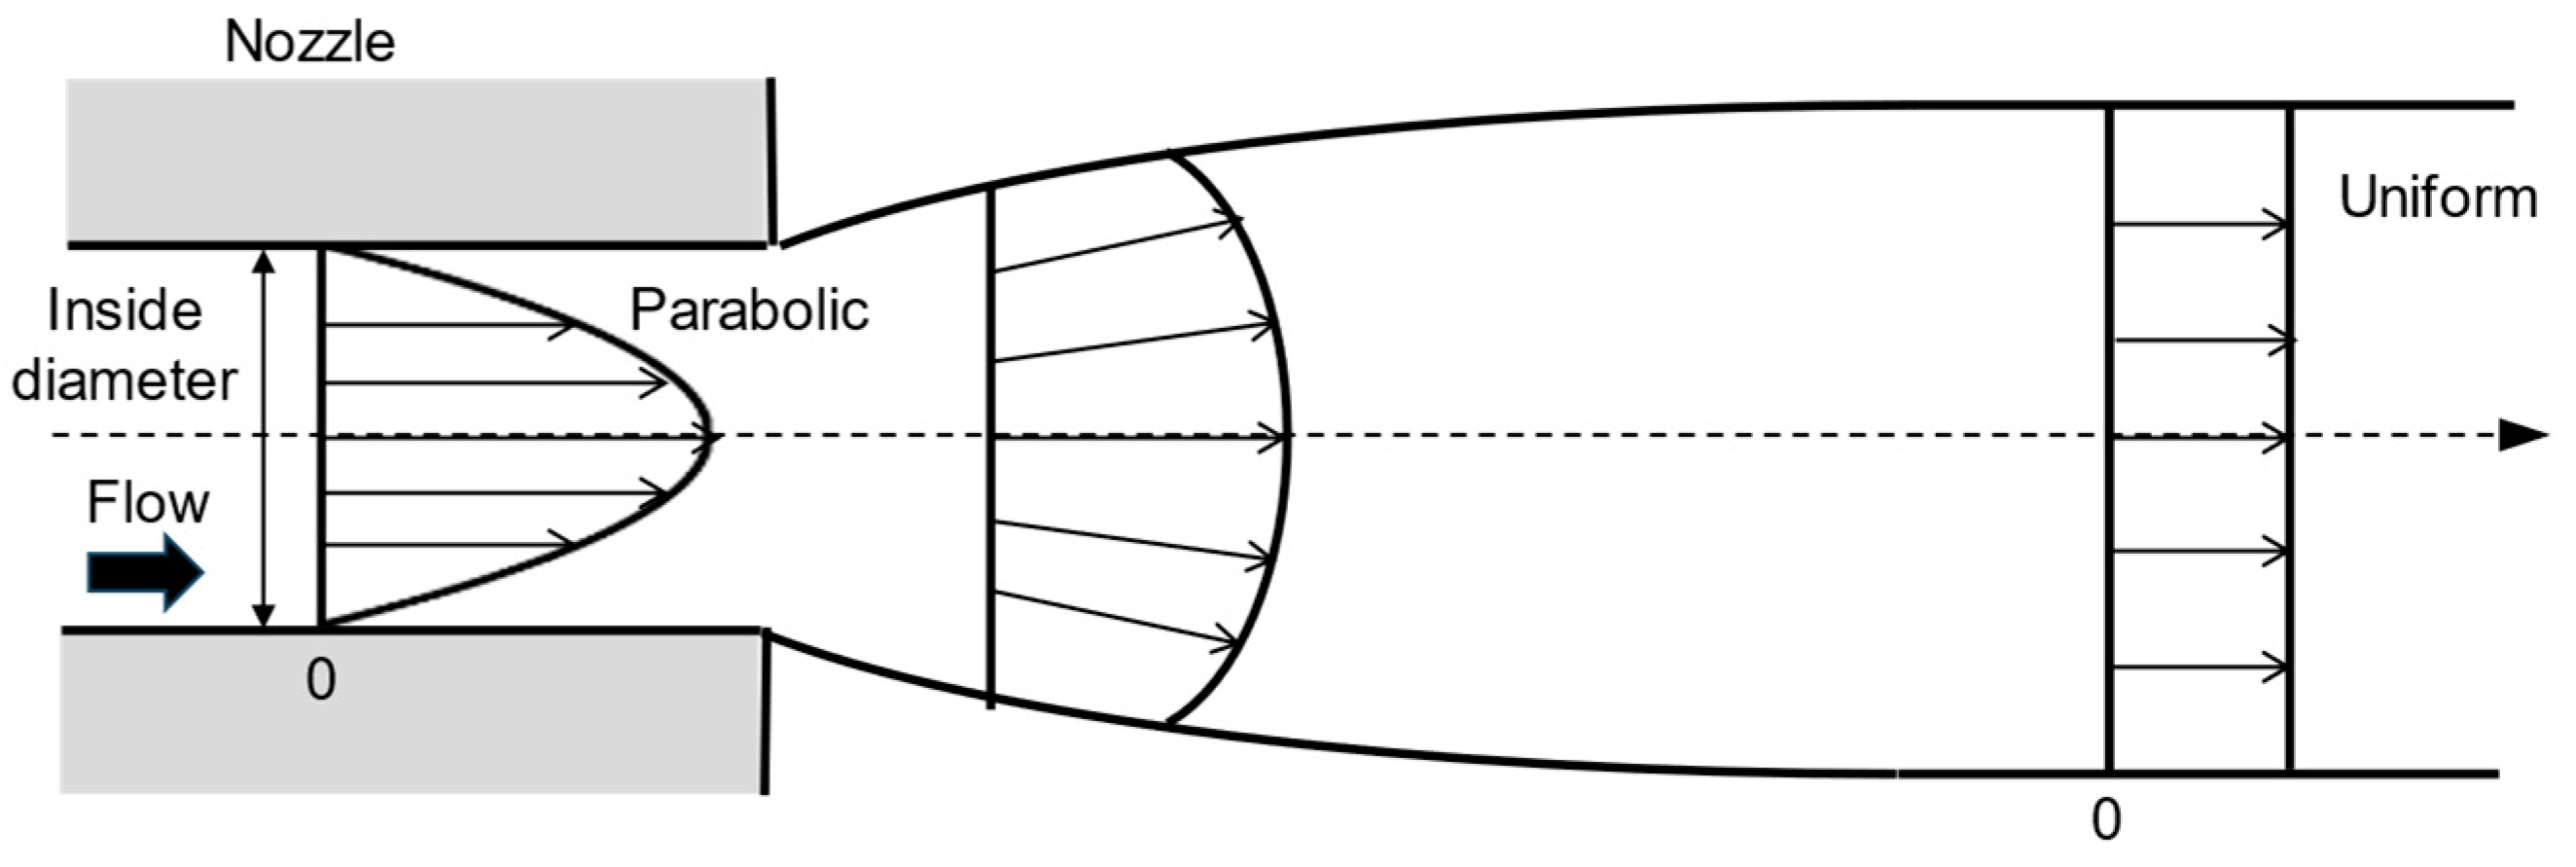
4.1. Aggregate Distribution Inside the Nozzle

As shown in Figure 8, the nozzle cross section is divided into eight regions. Since the nozzle has a regular circle cross section, eight circular regions were defined at distances of 0–1, 1–2, 2–3, 3–4, 4–5, 5–6, 6–7, and 7–8 mm from the center of the cross section (the distance from the center is hereinafter referred to as r). The particle-size distribution in each region was compared. 10% particle size (D10), 50% particle size (D50), and 90% particle size (D90) of each particle size distribution were used as evaluation indices for comparison between regions and between samples. D10, D50, and D90 change as particle size distribution changes, as shown in Figure 9. D10 represents the percentage of small aggregate particles in each particle size distribution. D50 represents the overall particle size of each particle size distribution. D90 represents the percentage of large particles in each particle size distribution.

4.2. Aggregate Distribution Inside the Filament

Figure 10 shows the target area and its demarcation to evaluate the aggregate distribution inside the filament. The filament, after discharge, is on the platform, and its shape is deformed due to self-weight with gravity. Therefore, the horizontal and vertical axes on the cross section plane can be determined from the cross-sectional shape of the sample image. As shown in Figure 10a, to evaluate the aggregate distribution heterogeneity along the h-axis, evaluation regions were defined for each 1 mm change in h between −1 and 1 mm in v. Similarly, as shown in Figure 10b, to evaluate the heterogeneity of the aggregate distribution along the v-axis, regions were divided for each 1 mm change in v between −1 and 1 mm in h. The particle size distribution for aggregate cores with centroids in each region was compared. D10, D50, and D90 were used as evaluation indices.

5. Results and Discussion

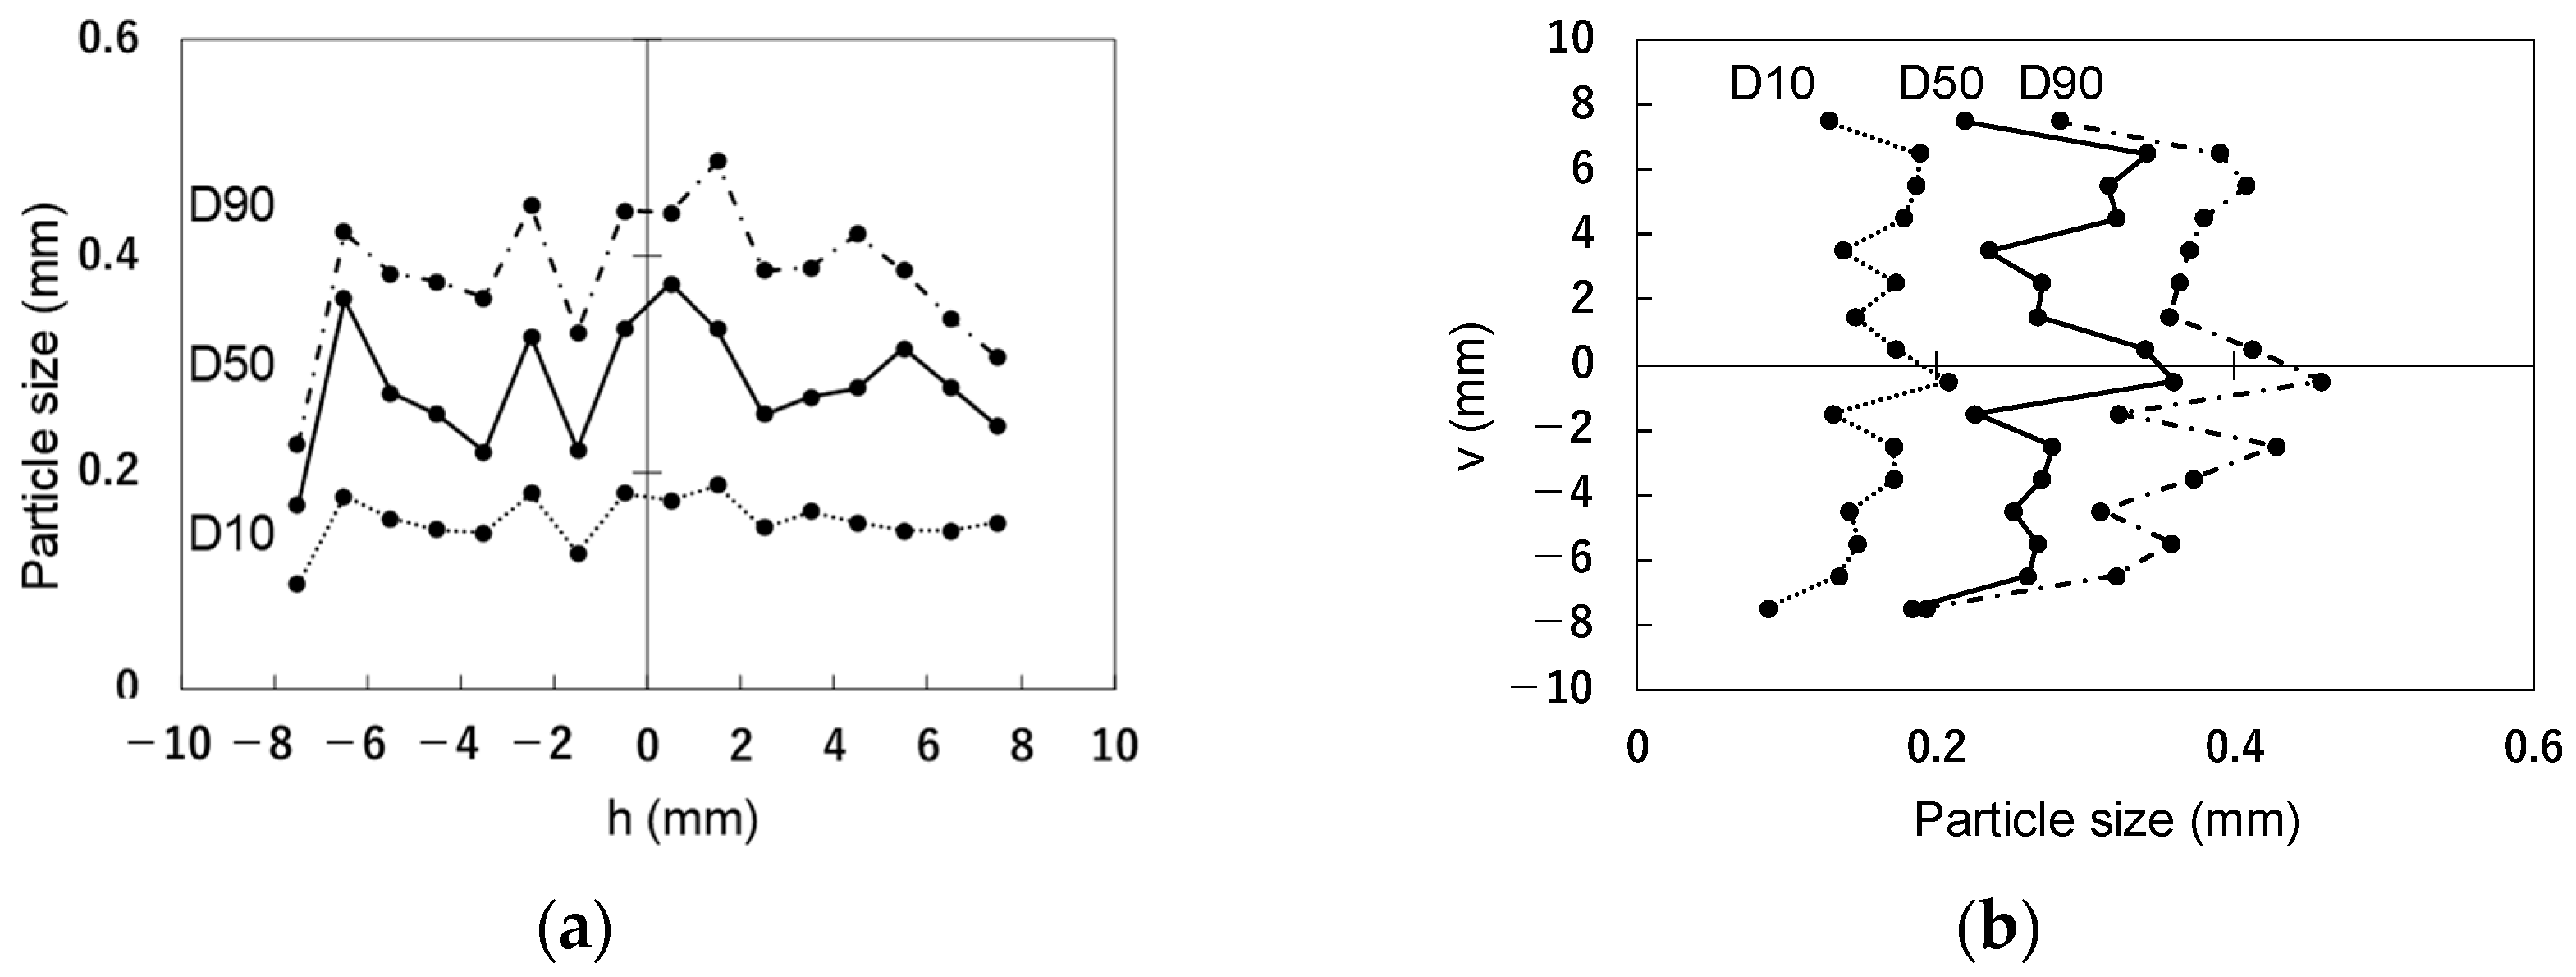
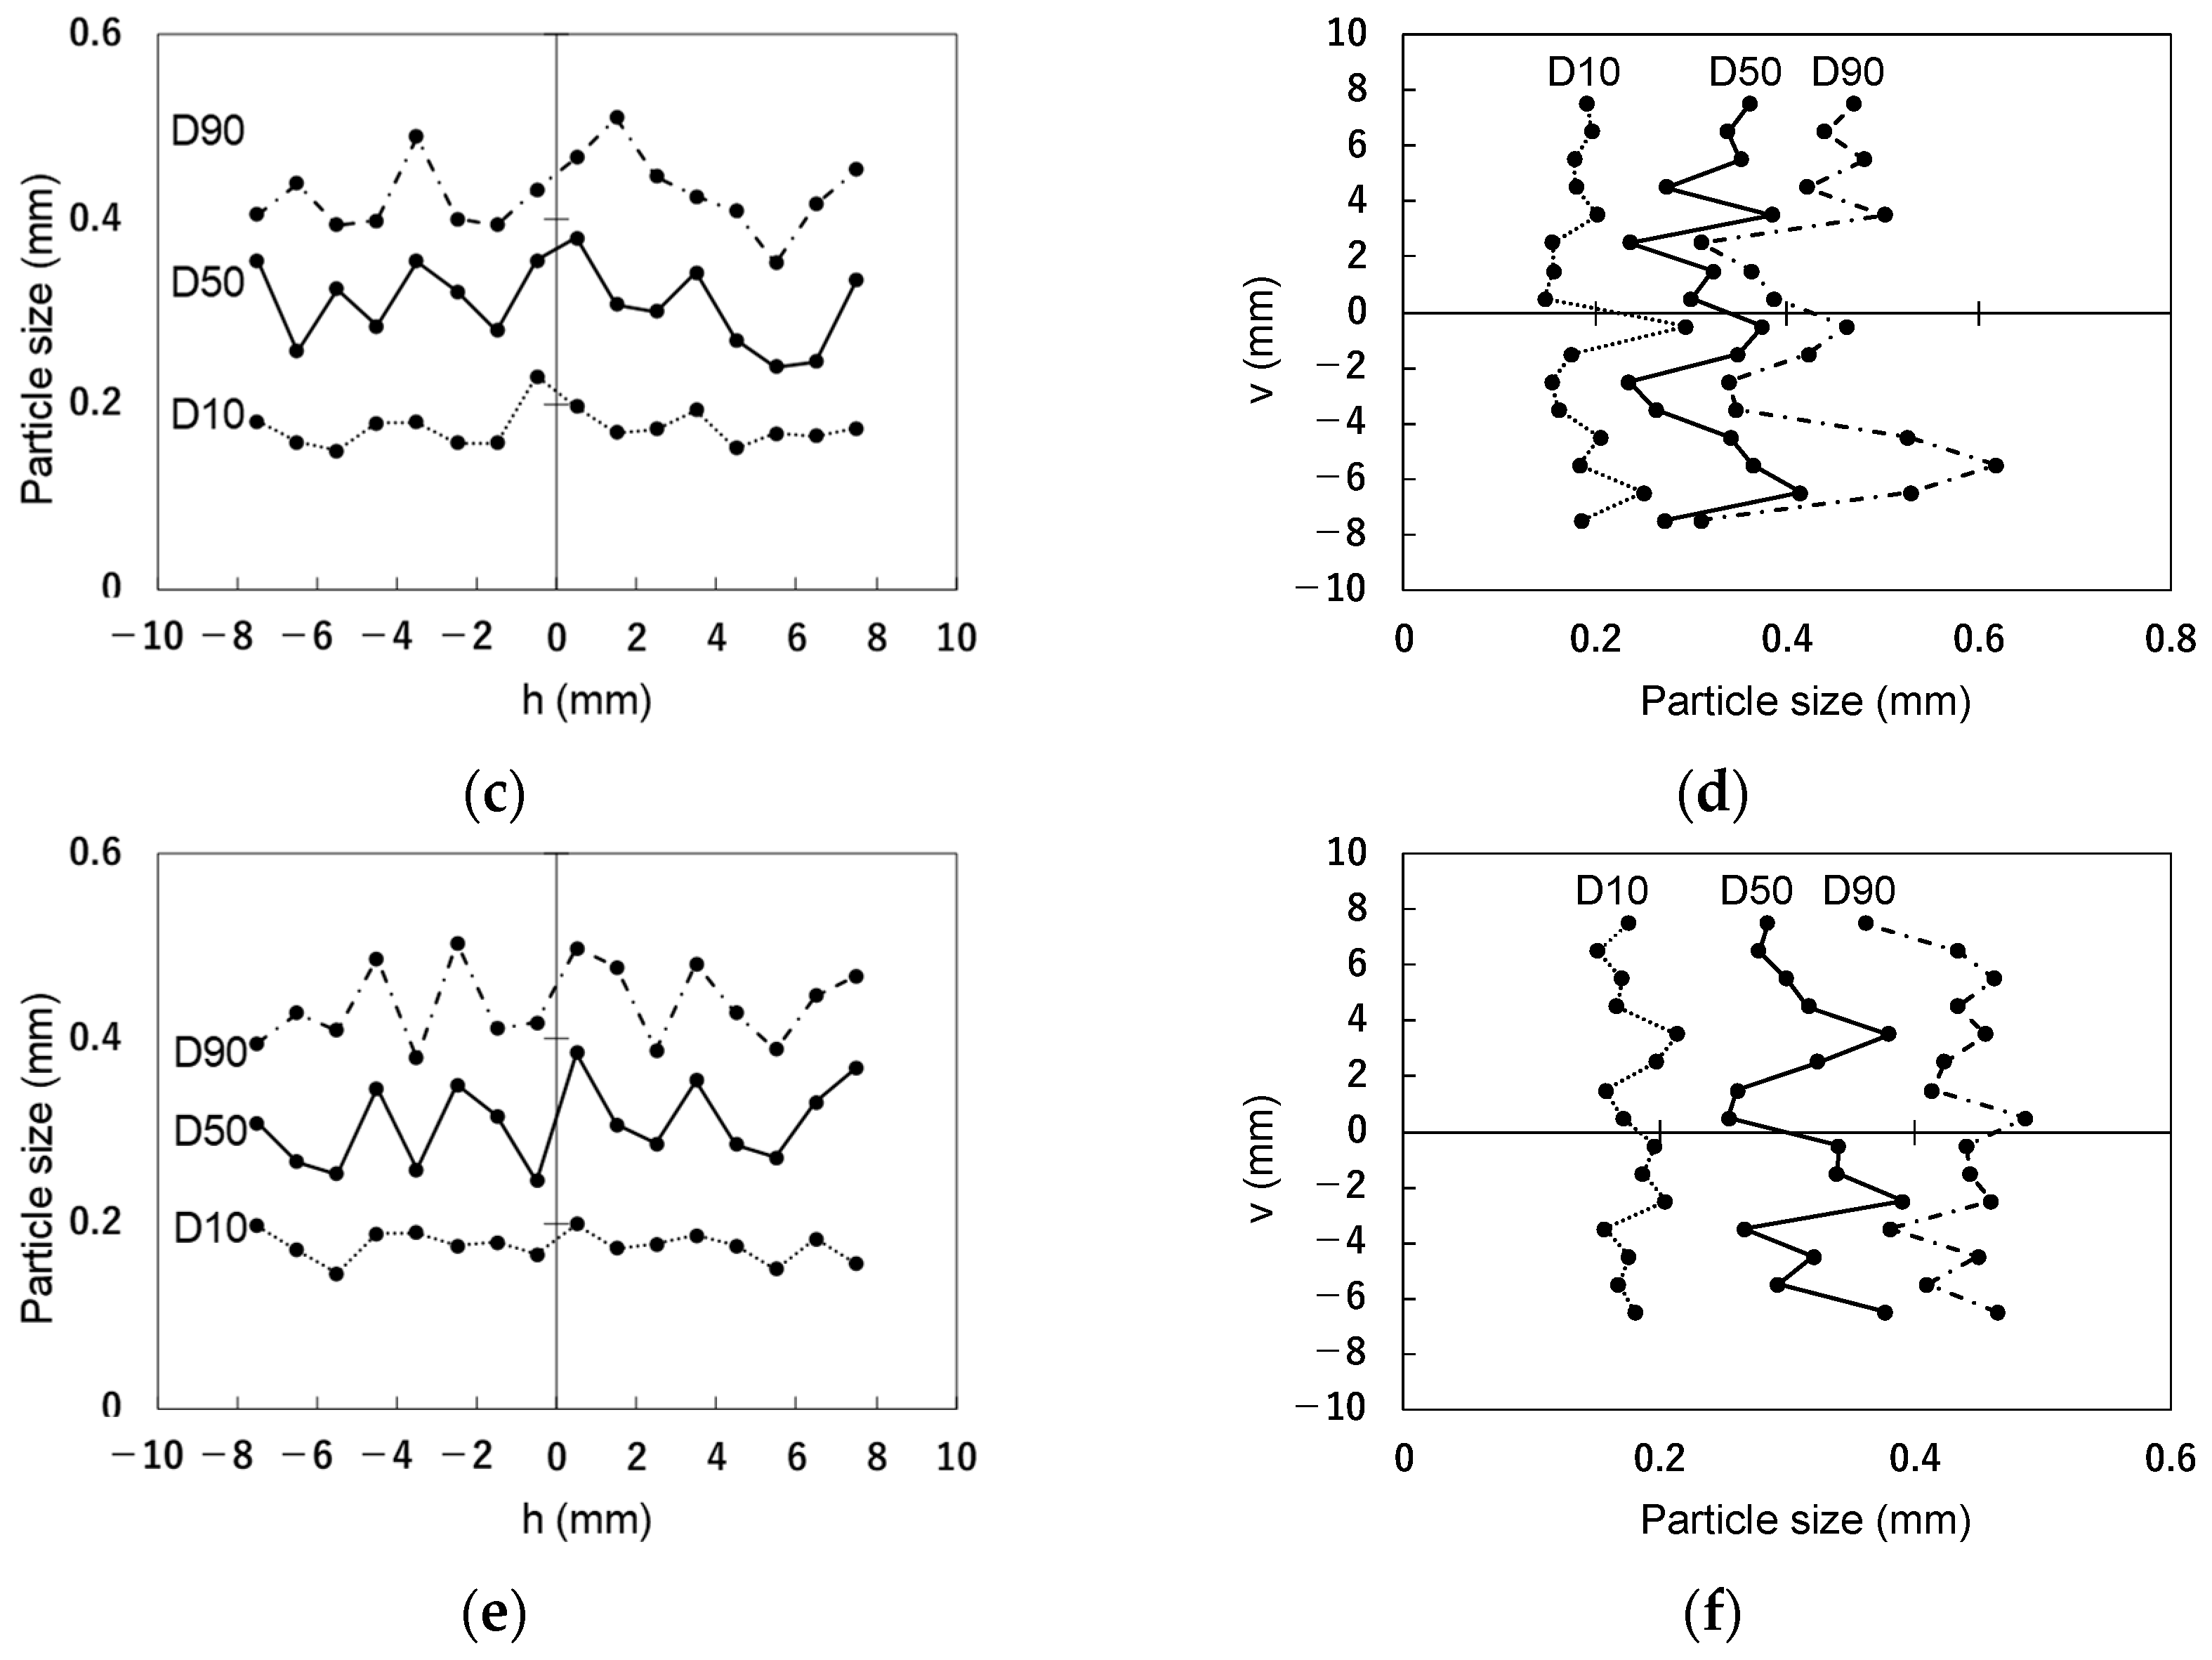
5.1. Aggregate Distribution Inside the Nozzle

As mentioned in the introduction, when pumped concrete flows in a pipe, plug flow (flow with uniform velocity distribution in the pipe cross section) occurs, and a lubricating layer is generated near the inner surface of the pipe wall [28,29,30,31,32,33]. The formation of a lubricating layer is prone to occur with an increase in the pressure inside the pipe [28,29]. The velocity distribution inside the pipe alters from laminar flow to plug flow, with lubricating layer formation [29,32,34]. Therefore, a lubricating layer is predicted to be similarly formed regarding the nozzle of 3DCP. Additionally, it is also expected that the extrusion speed affects the velocity distribution of mortar flow inside the nozzle and causes aggregate movement.
Figure 11a shows the relationship between r and D10, D50, or D90 for Mc. Similarly, Figure 11b–d show the relationship between r and D10, D50, or D90 for M02n, M04n, and M08n respectively. In Mc, which is a cylindrical reference sample prepared using the conventional casting method, D50 and D90 decrease in the region where r is 6 to 8 mm (on the nozzle wall side). For example, in the region where r is 7 to 8 mm, D90 is 22% lower compared to D90 in the region where r is 5 to 6 mm. Also, in the region where r is 7 to 8 mm, D50 is 32% lower compared to D50 in the region where r is 5 to 6 mm. It can be argued that few large aggregates are located near the inner surface of the nozzle wall due to the wall effect. In M02n with lower extrusion speed, D10, D50, and D90 are smaller in the region where r is 0 to 1 mm (near the center of the cross section). In particular, D90 is 0.27 mm in the region where r is 0 to 1 mm, whereas in other regions, it exceeds 0.4 mm. In other words, the proportion of large aggregate is smaller around the center of the cross section. In M04n with a higher extrusion speed, D10, D50, and D90 are approximately constant overall, which is independent of r. In M08n with an even higher extrusion speed, D10 tends to decrease with an increase in r. D90 in the region where r is 7 to 8 mm is 19% lower compared to D90 in the region where r is 0 to 1 mm. Also, when compared to the region where r is 6 to 7 mm, D90 in the region where r is 7 to 8 mm decreases by 13%. In other words, D90 tends to decrease with an increase in r, where the proportion of large aggregate is small on the nozzle wall side. It is the same as in the case of Mc. The above results indicate that, while mortar is being extruded through the nozzle under pressure, large aggregates move toward the outside, which is affected by the velocity distribution when the extrusion speed is low. It is also suggested that aggregate moves little because the influence of the velocity distribution is smaller when the extrusion speed is high. Thus, the aggregate distribution is comparably similar to that in the case of self-filling by casting (Mc).
Figure 12 shows the flow velocity distribution profile inside the nozzle. It was inferred that a flow velocity distribution is similar to a plug flow, as shown in Figure 12a when the extrusion speed is high. In particular, an increase in the pressure on the nozzle wall causes the formation of the lubricating layer near the nozzle wall. Therefore, it can also be inferred that aggregate is hardly moved inside the nozzle while the mortar is extruded under pressure. In contrast, increasing frictional force with the nozzle wall influences the flow velocity distribution, as shown in Figure 12b when the extrusion speed is low. In other words, flow velocity varies with the distance from the center, and large aggregates move toward the outside while the mortar is extruded.

5.2. Aggregate Distribution Inside the Filament

In the field of the polymer manufacturing process, it is known that the die swell phenomenon occurs during material extrusion [38]. Figure 13 briefly shows the diagram of the die-swell effect. The diameter of the fluid after discharge is larger than the inner diameter of the nozzle. The change in flow velocity distribution before and after discharge is one of the main causes of the phenomenon [38]. Especially before discharge, the flow velocity is zero on the nozzle wall due to the friction with the nozzle wall, while the velocity is maximum at the center. At the discharge phase, the influence of the nozzle wall suddenly disappears. It causes the flow velocity to increase outside and the velocity to decrease inside. Additionally, as for glass extrusion, when slip occurs at the nozzle wall, the flow velocity distribution before discharge is almost uniform [39]. The change in flow velocity distribution before and after discharge becomes smaller, resulting in a smaller die swell. Similarly, in 3DCP, the change in flow velocity distribution before and after discharge is considered to affect the aggregate distribution after discharge. Also, the behavior of material discharge is considerably affected by the frictional force on the nozzle wall.
Figure 14a shows the relationship between D10, D50, or D90 and h for M02f. Figure 14b shows the relationship between D10, D50, or D90 and v for M02f. Similarly, Figure 14c,d show the relationships between D10, D50, or D90 and h or v, respectively, for M04f. Figure 14e,f show the relationships between D10, D50, or D90 and h or v, respectively, for M08f.
In the case of M02f, the particle size is larger around the center with low extrusion speed, as shown in Figure 14a,b. This indicates that, after discharge, the aggregate moves toward the center again. As explained above, the aggregate moves outward at the material extrusion speed before discharging the material. At the discharge phase, the die swell phenomenon occurs, resulting in an increase in flow velocity near the inner surface of the nozzle wall and a decrease near the center. Hence, the aggregate moves toward the center of the nozzle. Meanwhile, in the case of M04f with a higher extrusion speed, D10, D50, and D90 have no relationship with h, as shown in Figure 14c. D50 and D90 are larger in the vertical downward region, as shown in Figure 14d. Similarly, in the case of M08f with an even higher extrusion speed, D10, D50, and D90 show no relationship with h, as shown in Figure 14e. D50 and D90 are larger in the vertical downward region, as shown in Figure 14f. This infers that changes in diameter and flow velocity distribution before and after discharge are small when the extrusion speed is high. This is because a lubricating layer forms inside the nozzle, resulting in reduced die swell and a flow velocity distribution similar to plug flow. It was observed that the filament undergoes horizontal deformation due to its own weight after extrusion. It is inferred that the flowability immediately after extrusion increased with the increase in the extrusion speed. Consequently, the mortar, initially positioned near the center of the circular cross section, moves relatively downward due to the aforementioned deformation.

6. Conclusions

This study has unveiled the mechanism behind aggregate distribution heterogeneity inside the filament while demonstrating the influence of material extrusion speed on its heterogeneity. We quantified the aggregate distribution inside the filament and nozzle using the extruder of a cartridge-type 3D printer. The results proved the heterogeneous aggregate distribution in the filament and nozzle. Also, it revealed the effects of extrusion speed on the aggregate distribution properties. Specifically, the following key insights were obtained:
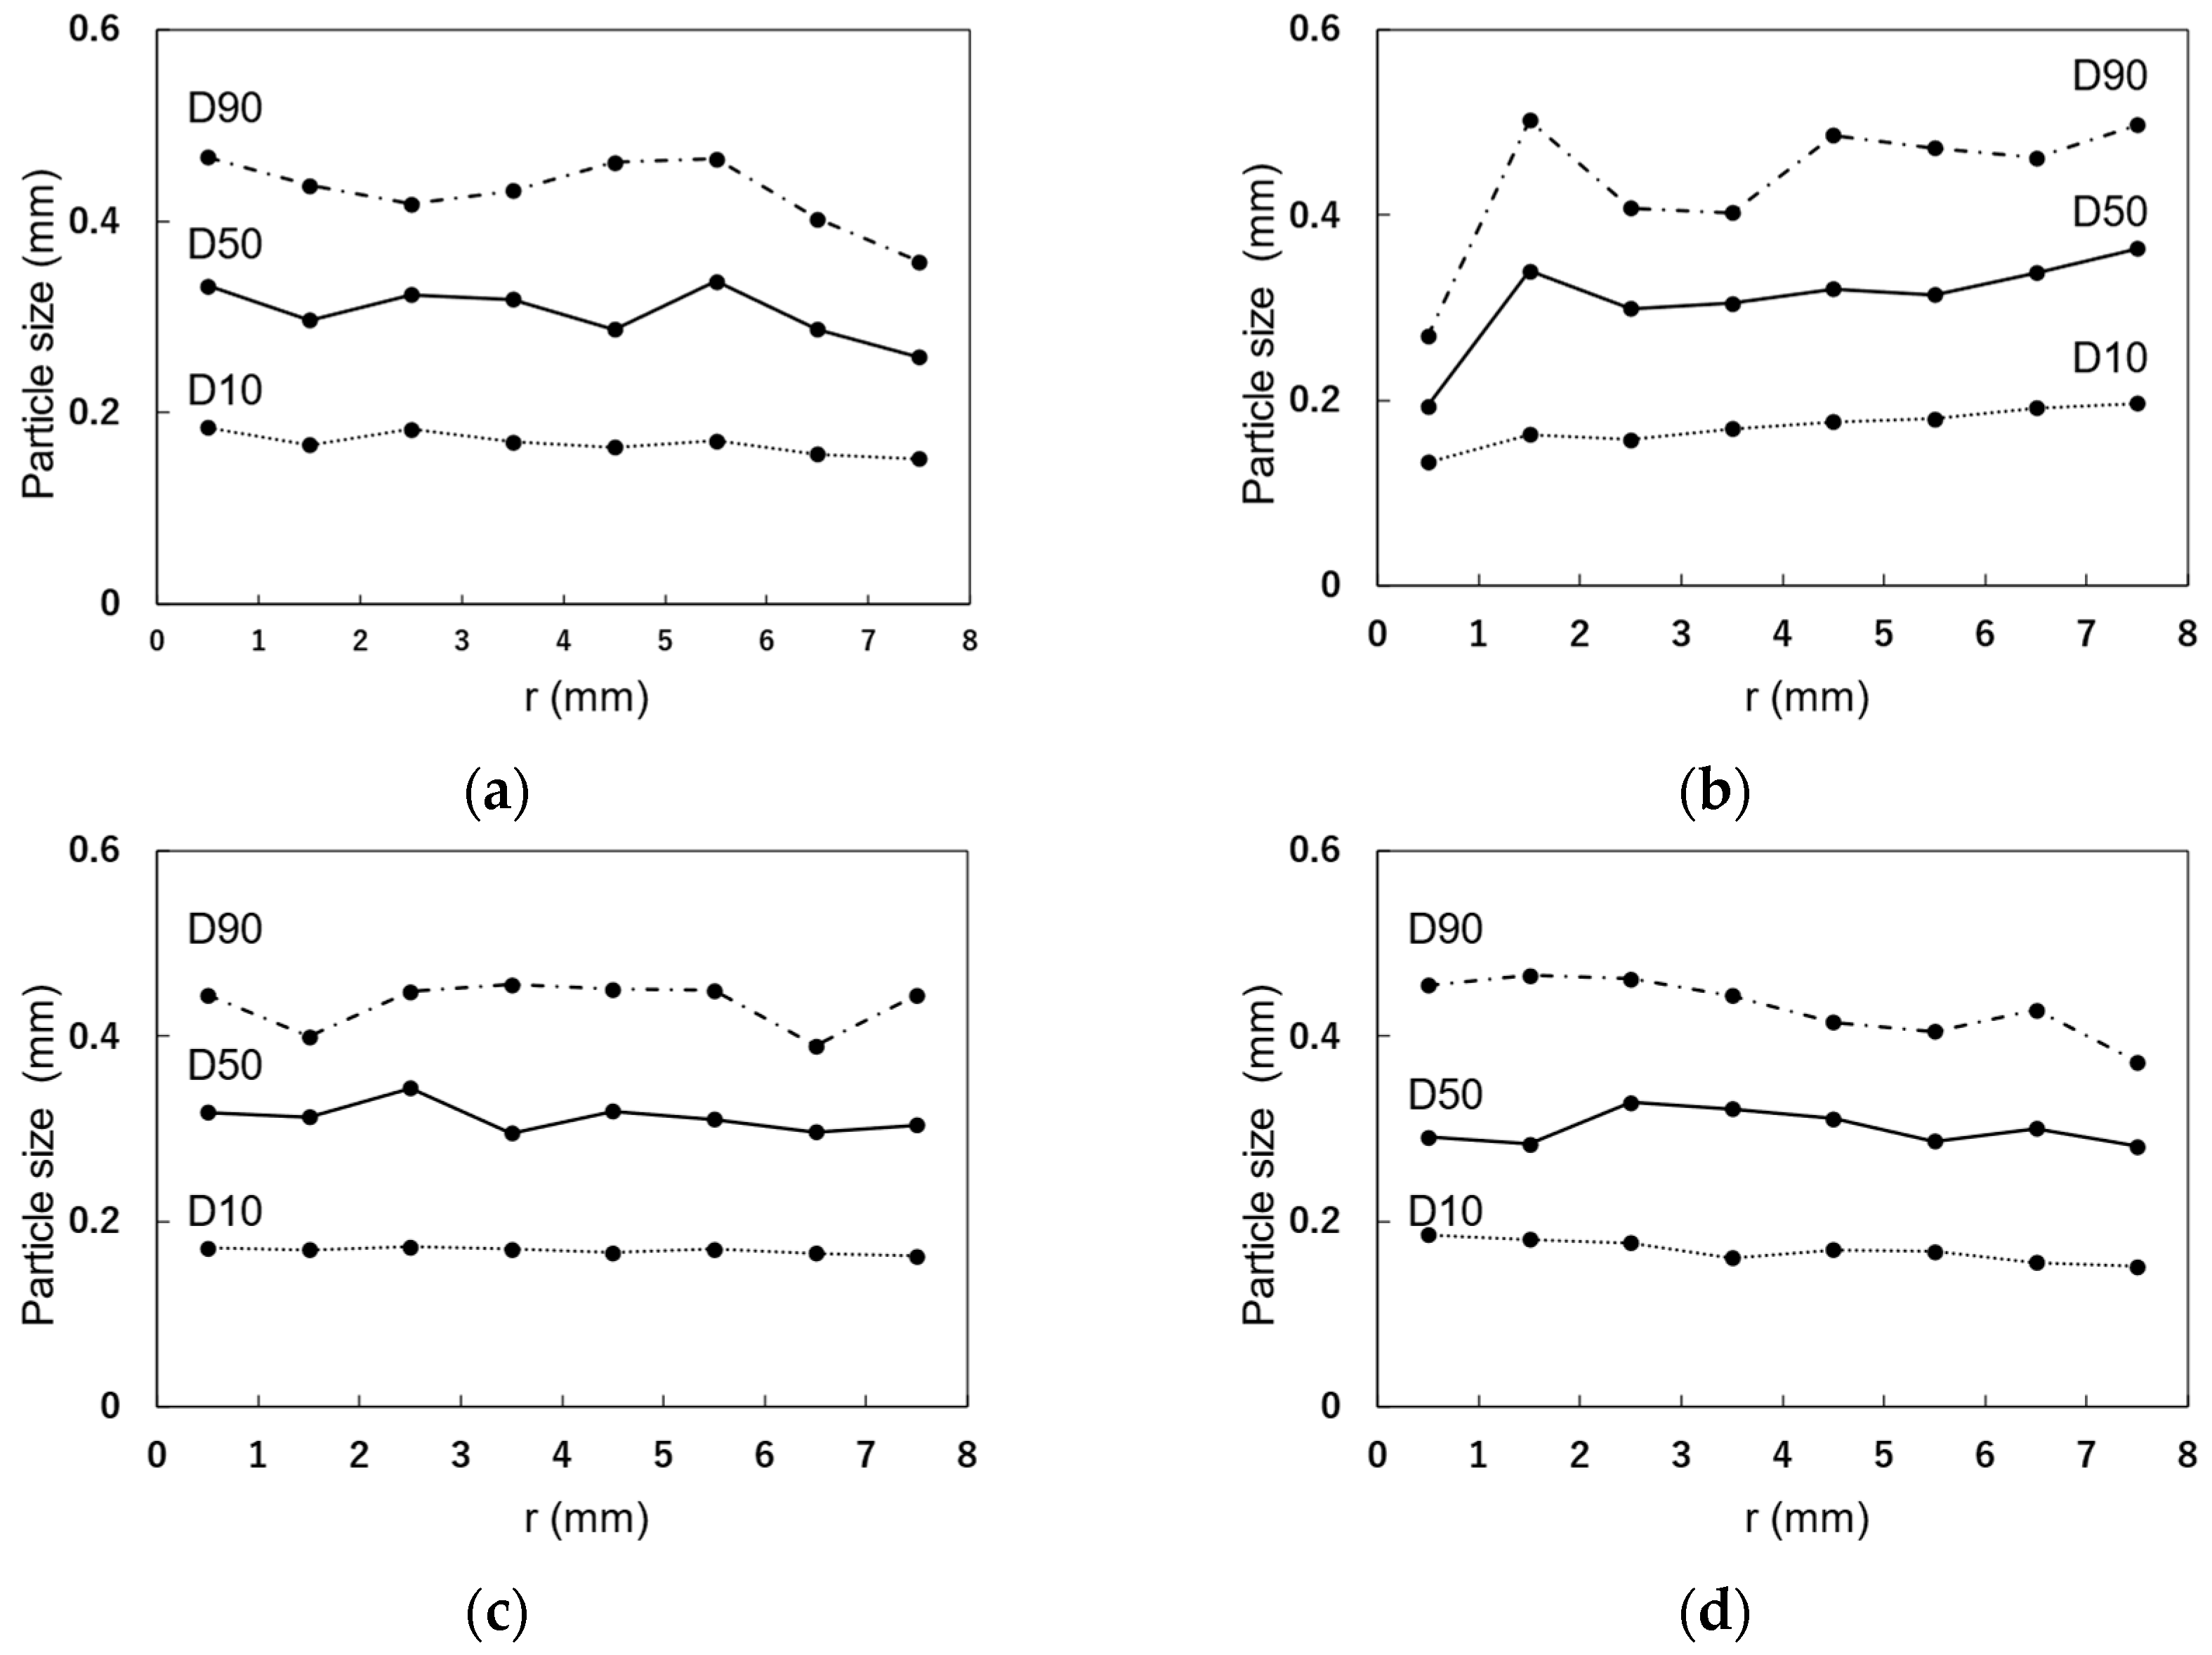
  • At lower material extrusion speeds, many large aggregates are located near the inner surface of the nozzle. After discharge, many large aggregates are located near the center of the cross section inside the filament;
  • At higher material extrusion speeds, many large aggregates are located near the center of the cross section inside the nozzle. After discharge, many large aggregates are located vertically downward inside the filament.
These findings suggest that a lubrication layer forms near the inner surface of the nozzle with an increase in extrusion speed. This phenomenon alters the flow velocity distribution within the nozzle, transitioning from laminar flow to plug flow. This also indicates that a reduction in die swell occurs due to the mitigation of friction between the mortar and the nozzle inner surface. Future work is needed to expand the study in regard to the mix proportion, print speed, and nozzle shape, in the context of real-scale 3D-printed structures using cementitious materials.

Author Contributions

Conceptualization, R.Y. and K.H.; methodology, R.Y. and K.N.; software, R.Y.; validation, K.H.; formal analysis, R.Y.; investigation, R.Y.; resources, R.Y.; writing—original draft preparation, R.Y.; writing—review and editing, K.N., K.H., T.S. and Y.H.; visualization, R.Y.; supervision, K.H.; project administration, R.Y.; funding acquisition, K.H. All authors have read and agreed to the published version of the manuscript.

Funding

This research received no external funding.

Data Availability Statement

Dataset available on request from the authors. The data are not publicly available due to privacy.

Conflicts of Interest

The funders had no role in the design of the study; in the collection, analyses, or interpretation of data; in the writing of the manuscript; or in the decision to publish the results.

References

  1. Delgado Camacho, D.; Clayton, P.; O’Brien, W.J.; Seepersad, C.; Juenger, M.; Ferron, R.; Salamone, S. Applications of Additive Manufacturing in the Construction Industry—A Forward-Looking Review. Autom. Constr. 2018, 89, 110–119. [Google Scholar] [CrossRef]
  2. Nguyen-Van, V.; Li, S.; Liu, J.; Nguyen, K.; Tran, P. Modelling of 3D Concrete Printing Process: A Perspective on Material and Structural Simulations. Addit. Manuf. 2023, 61, 103333. [Google Scholar] [CrossRef]
  3. Gosselin, C.; Duballet, R.; Roux, P.; Gaudillière, N.; Dirrenberger, J.; Morel, P. Large-Scale 3D Printing of Ultra-High Performance Concrete—A New Processing Route for Architects and Builders. Mater. Des. 2016, 100, 102–109. [Google Scholar] [CrossRef]
  4. Prasittisopin, L.; Jiramarootapong, P.; Pongpaisanseree, K.; Snguanyat, C. Lean Manufacturing and Thermal Enhancement of Single-Layered Wall of Additive Manufacturing (AM) Structure. ZKG Int. 2019, 72, 64–74. [Google Scholar]
  5. Daungwilailuk, T.; Pheinsusom, P.; Pansuk, W. Uniaxial Load Testing of Large-Scale 3D-Printed Concrete Wall and Finite-Element Model Analysis. Constr. Build. Mater. 2021, 275, 122039. [Google Scholar] [CrossRef]
  6. Weng, Y.; Li, M.; Ruan, S.; Wong, T.N.; Tan, M.J.; Ow Yeong, K.L.; Qian, S. Comparative Economic, Environmental and Productivity Assessment of a Concrete Bathroom Unit Fabricated through 3D Printing and a Precast Approach. J. Clean. Prod. 2020, 261, 121245. [Google Scholar] [CrossRef]
  7. De Schutter, G.; Lesage, K.; Mechtcherine, V.; Nerella, V.N.; Habert, G.; Agusti-Juan, I. Vision of 3D Printing with Concrete—Technical, Economic and Environmental Potentials. Cem. Concr. Res. 2018, 112, 25–36. [Google Scholar] [CrossRef]
  8. Lan, T.; Yang, S.; Wang, M.; Xu, M.; Cheng, S.; Chen, Z. Prediction of Interfacial Tensile Bond Strength in 3D Printed Concrete Based on a Closed-Form Fracture Model. J. Build. Eng. 2023, 70, 106411. [Google Scholar] [CrossRef]
  9. Taleb, M.; Bulteel, D.; Betrancourt, D.; Roudet, F.; Rémond, S.; Montagne, A.; Chicot, D. Multi-Scale Mechanical Characterization of the Interface in 3D Printed Concrete. Mater. Struct. 2023, 56, 24. [Google Scholar] [CrossRef]
  10. Lee, H.; Kim, J.H.J.; Moon, J.H.; Kim, W.W.; Seo, E.A. Correlation between Pore Characteristics and Tensile Bond Strength of Additive Manufactured Mortar Using X-Ray Computed Tomography. Constr. Build. Mater. 2019, 226, 712–720. [Google Scholar] [CrossRef]
  11. Marchment, T.; Sanjayan, J.; Xia, M. Method of Enhancing Interlayer Bond Strength in Construction Scale 3D Printing with Mortar by Effective Bond Area Amplification. Mater. Des. 2019, 169, 107684. [Google Scholar] [CrossRef]
  12. Shahzad, Q.; Li, F. yuan The Influence of Print Path on Early-Age Plastic Bearing Capacity and Mechanical Behavior of 3D Printed Concrete: A Novel Approach for Practical Applications. Constr. Build. Mater. 2023, 389, 131794. [Google Scholar] [CrossRef]
  13. Nerella, V.N.; Hempel, S.; Mechtcherine, V. Effects of Layer-Interface Properties on Mechanical Performance of Concrete Elements Produced by Extrusion-Based 3D-Printing. Constr. Build. Mater. 2019, 205, 586–601. [Google Scholar] [CrossRef]
  14. Heras Murcia, D.; Genedy, M.; Reda Taha, M.M. Examining the Significance of Infill Printing Pattern on the Anisotropy of 3D Printed Concrete. Constr. Build. Mater. 2020, 262, 120559. [Google Scholar] [CrossRef]
  15. Pan, T.; Jiang, Y.; He, H.; Wang, Y.; Yin, K. Effect of Structural Build-up on Interlayer Bond Strength of 3d Printed Cement Mortars. Materials 2021, 14, 236. [Google Scholar] [CrossRef]
  16. Keita, E.; Bessaies-Bey, H.; Zuo, W.; Belin, P.; Roussel, N. Weak Bond Strength between Successive Layers in Extrusion-Based Additive Manufacturing: Measurement and Physical Origin. Cem. Concr. Res. 2019, 123, 105787. [Google Scholar] [CrossRef]
  17. Moelich, G.M.; Kruger, J.; Combrinck, R. Modelling the Interlayer Bond Strength of 3D Printed Concrete with Surface Moisture. Cem. Concr. Res. 2021, 150, 106559. [Google Scholar] [CrossRef]
  18. Sanjayan, J.G.; Nematollahi, B.; Xia, M.; Marchment, T. Effect of Surface Moisture on Inter-Layer Strength of 3D Printed Concrete. Constr. Build. Mater. 2018, 172, 468–475. [Google Scholar] [CrossRef]
  19. Chen, Y.; Çopuroğlu, O.; Romero Rodriguez, C.; de Mendonca Filho, F.F.; Schlangen, E. Characterization of Air-Void Systems in 3D Printed Cementitious Materials Using Optical Image Scanning and X-ray Computed Tomography. Mater. Charact. 2021, 173, 110948. [Google Scholar] [CrossRef]
  20. Kloft, H.; Krauss, H.W.; Hack, N.; Herrmann, E.; Neudecker, S.; Varady, P.A.; Lowke, D. Influence of Process Parameters on the Interlayer Bond Strength of Concrete Elements Additive Manufactured by Shotcrete 3D Printing (SC3DP). Cem. Concr. Res. 2020, 134, 106078. [Google Scholar] [CrossRef]
  21. Naderi, S.; Tu, W.; Zhang, M. Meso-Scale Modelling of Compressive Fracture in Concrete with Irregularly Shaped Aggregates. Cem. Concr. Res. 2021, 140, 106317. [Google Scholar] [CrossRef]
  22. Cui, W.; Miao, R.C.; Yan, W.S.; Song, H.F.; Jiang, Z. Static Segregation of Fresh High Workable Concrete Based on an Image Processing Method. Constr. Build. Mater. 2022, 361, 129708. [Google Scholar] [CrossRef]
  23. Salem, H.M.; Maekawa, K. Pre- and Postyield Finite Element Method Simulation of Bond of Ribbed Reinforcing Bars. J. Struct. Eng. 2004, 130, 671–680. [Google Scholar] [CrossRef]
  24. Huang, Q.H.; Li, C.Z.; Song, X. bin Spatial Distribution Characteristics of Ellipsoidal Coarse Aggregates in Concrete Considering Wall Effect. Constr. Build. Mater. 2022, 327, 126922. [Google Scholar] [CrossRef]
  25. Tian, Y.; Chen, C.; Jin, N.; Jin, X.; Tian, Z.; Yan, D.; Yu, W. An Investigation on the Three-Dimensional Transport of Chloride Ions in Concrete Based on X-Ray Computed Tomography Technology. Constr. Build. Mater. 2019, 221, 443–455. [Google Scholar] [CrossRef]
  26. Kreijger, P.C. The Skin of Concrete Composition and Properties. Matériaux Constr. 1984, 17, 275–283. [Google Scholar] [CrossRef]
  27. Wang, X.; Zhang, M.; Jivkov, A.P. Computational Technology for Analysis of 3D Meso-Structure Effects on Damage and Failure of Concrete. Int. J. Solids Struct. 2016, 80, 310–333. [Google Scholar] [CrossRef]
  28. Xu, Z.; Li, Z.; Jiang, F. Numerical Approach to Pipe Flow of Fresh Concrete Based on MPS Method. Cem. Concr. Res. 2022, 152, 106679. [Google Scholar] [CrossRef]
  29. Secrieru, E.; Khodor, J.; Schröfl, C.; Mechtcherine, V. Formation of Lubricating Layer and Flow Type during Pumping of Cement-Based Materials. Constr. Build. Mater. 2018, 178, 507–517. [Google Scholar] [CrossRef]
  30. Choi, M.; Roussel, N.; Kim, Y.; Kim, J. Lubrication Layer Properties during Concrete Pumping. Cem. Concr. Res. 2013, 45, 69–78. [Google Scholar] [CrossRef]
  31. Phillips, R.J.; Armstrong, R.C.; Brown, R.A.; Graham, A.L.; Abbott, J.R. A Constitutive Equation for Concentrated Suspensions That Accounts for Shear-Induced Particle Migration. Phys. Fluids A 1992, 4, 30–40. [Google Scholar] [CrossRef]
  32. Fataei, S.; Secrieru, E.; Mechtcherine, V. Experimental Insights into Concrete Flow-Regimes Subject to Shear-Induced Particle Migration (SIPM) during Pumping. Materials 2020, 13, 1233. [Google Scholar] [CrossRef] [PubMed]
  33. Choi, M.S.; Kim, Y.J.; Kwon, S.H. Prediction on Pipe Flow of Pumped Concrete Based on Shear-Induced Particle Migration. Cem. Concr. Res. 2013, 52, 216–224. [Google Scholar] [CrossRef]
  34. Secrieru, E.; Mohamed, W.; Fataei, S.; Mechtcherine, V. Assessment and Prediction of Concrete Flow and Pumping Pressure in Pipeline. Cem. Concr. Compos. 2020, 107, 103495. [Google Scholar] [CrossRef]
  35. Prasittisopin, L.; Sakdanaraseth, T.; Horayangkura, V. Design and Construction Method of a 3D Concrete Printing Self-Supporting Curvilinear Pavilion. J. Archit. Eng. 2021, 27, 05021006. [Google Scholar] [CrossRef]
  36. Shakor, P.; Nejadi, S.; Paul, G.; Sanjayan, J.; Nazari, A. Mechanical Properties of Cement-Based Materials and Effect of Elevated Temperature on Three-Dimensional (3-D) Printed Mortar Specimens in Inkjet 3-D Printing. ACI Mater. J. 2019, 116, 55–67. [Google Scholar] [CrossRef]
  37. Schneider, C.A.; Rasband, W.S.; Eliceiri, K.W. NIH Image to ImageJ: 25 Years of Image Analysis. Nat Methods 2012, 9, 671–675. [Google Scholar] [CrossRef] [PubMed]
  38. Agassant, J.-F.; Arda, D.; Combeaud, C.; Merten, A.; Münstedt, H.; Mackley, M.R.; Robert, L.; Vergnes, B. Polymer Processing Extrusion Instabilities and Methods for Their Elimination or Minimization. Int. Polym. Process 2006, 21, 239–255. [Google Scholar] [CrossRef]
  39. Trabelssi, M.; Ebendorff-Heidepriem, H.; Richardson, K.C.; Monro, T.M.; Joseph, P.F. Computational Modeling of Die Swell of Extruded Glass Preforms at High Viscosity. J. Am. Ceram. Soc. 2014, 97, 1572–1581. [Google Scholar] [CrossRef]
Figure 1. Material extrusion mechanics using the piston and the nozzle shape of the extruder.
Buildings 14 01132 g001
Figure 2. Particle-size distribution of the aggregate.
Buildings 14 01132 g002
Figure 3. Schematic view of samples: (a) nozzles (M02n, M04n, and M08n); (b) cast cylinder (Mc); and (c) filaments (M02f, M04f, and M08f).
Buildings 14 01132 g003
Figure 4. Extraction of images to be used for analysis.
Buildings 14 01132 g004
Figure 5. Overview of the grayscale value histogram and thresholding method.
Buildings 14 01132 g005
Figure 6. Cross-sectional image: (a) before ADI processing; (b) after ADI processing.
Buildings 14 01132 g006
Figure 7. Conceptual diagram of ADI calculation.
Buildings 14 01132 g007
Figure 8. Evaluation region inside the nozzle.
Buildings 14 01132 g008
Figure 9. Concept of increasing D10, D50, and D90 with increasing particle size.
Buildings 14 01132 g009
Figure 10. Targeted area and its demarcation in filament: (a) h axis; (b) v axis.
Buildings 14 01132 g010
Figure 11. Relationship between r and D10, D50, or D90: (a) Mc; (b) M02n; (c) M04n; (d) M08n.
Buildings 14 01132 g011
Figure 12. Flow velocity distribution profile inside nozzle: (a) plug flow; (b) laminar flow.
Buildings 14 01132 g012
Figure 13. Velocity distribution profile of the die swell phenomenon.
Buildings 14 01132 g013
Figure 14. Relationship between h or v and D10, D50, or D90: (a) the relationship to h for M02f; (b) the relationship to v for M02f; (c) the relationship to h for M04f; (d) the relationship to v for M04f; (e) the relationship to h for M08f; (f) the relationship to v for M08f.
Buildings 14 01132 g014aBuildings 14 01132 g014b
Table 1. Preparation condition of each sample.
SampleCut-Out PartPiston Speed
(mm/s)
Nozzle Speed
(mm/s)
McCast sample
M02nNozzle0.21.8
M04nNozzle0.43.5
M08nNozzle0.87.1
M02fFilament0.21.8
M04fFilament0.43.5
M08fFilament0.87.1
Disclaimer/Publisher’s Note: The statements, opinions and data contained in all publications are solely those of the individual author(s) and contributor(s) and not of MDPI and/or the editor(s). MDPI and/or the editor(s) disclaim responsibility for any injury to people or property resulting from any ideas, methods, instructions or products referred to in the content.

