1. Introduction
While structural safety is the primary objective of bridge design standards [
1], issues such as durability, inspectability, and maintainability should also be considered to ensure the proper management of these assets to achieve life cycle compliance. These best practices, as well as environmental sustainability and aesthetic considerations, have been incorporated into current codes [
2], so it is expected that many of the older bridges (approximately 75 years old) will not adequately meet the service cycles prescribed for current structures. Therefore, most bridge management systems (BMSs) worldwide have an inspection module to diagnose and evaluate the condition of bridges. This module integrates different levels of inspection ranging from basic routine inspections to highly specialized inspections using high-tech equipment such as radars, drones, etc. The primary task is visual inspection, which must be performed by highly skilled personnel. Visual inspection involves examining and evaluating parts using only the human senses, aided by tools such as magnifying lenses and eyeglasses. This process may include observing, listening, feeling, and tapping. It also involves a cognitive aspect that links and combines observations with knowledge of the structure, as well as descriptions and service diagrams found in damage catalogs [
3].
The management systems shown in
Table 1 have been developed to maintain existing structures where variables intervene such as design errors, deficiencies in construction processes and quality control, inappropriate selection of technical specifications, incomplete plans for maintenance, rehabilitation, or replacement work, the experience of inspecting engineers, typical recurrent and relevant damage, partial or total collapse, structural health campaigns, traffic accidents, overloaded trucks, bridge designs with hydraulic and hydrological deficiencies (scour and torrential flooding), steel bridges without the design of their elements, and fatigue connections, among others, intervene [
4].
The background information provided earlier guided the design of Module 2 of the inspection and diagnosis of the new Intelligent Bridge Management System (SIGP) in Colombia. This paper explains the methodology of this module, which quantifies the existing damage or pathology in each element of the bridge, adding these ratings to a condition indicator by a component (substructure, superstructure, or service) and finally to an indicator of the general condition of the bridge itself. The inspection must be performed by qualified and trained personnel.
The structural performance of each bridge has been considered in the design of the module. The task of evaluating the structural performance of a bridge is typically developed in several stages. These stages range from initial visual inspection and compliance with design standards to the use of specialized techniques such as non-destructive testing, numerical finite element modeling, and nonlinear analysis. It is essential to plan and record regular maintenance activities when implementing a bridge management system, as bridges are valuable assets within the road infrastructure. Currently, technical standards for maintenance focus mainly on predictive and preventive maintenance methods.
This module was also articulated with the sub-module of the SIGP system called “Maintenance, Repair, Rehabilitation and Replacement Recommendations”, which consists of a group of periodic cleaning and tuning activities, especially for non-structural and service elements to ensure adequate operability and functional conditions. This component also contributes to the main objective of the prioritization and optimization of the SIGP, as it aims to implement mitigation works at the lowest cost considering operational constraints and uncertainties [
5].
This tool is based on unique aspects among bridge management systems worldwide. It includes detailed and specific information obtained from visual inspections carried out in the field for several years prior to this system. In addition, it is innovative because it evaluates damage according to the relative importance and interaction of three areas (stability, durability, and road safety), using a dynamic damage catalog supported by a computer application linked to the fieldwork database. It also aims to identify damage related to different risks, such as scour, torrential floods, earthquakes, and landslides, which affect the hazard and vulnerability of bridges.
In addition, the design of this module has taken into account the latest advances proposed by European research institutions in the field of infrastructure [
6,
7]. These advances have been adapted to the region, considering bridges as the main assets that supporting mobility and human activities. They are designed to prevent the loss of their functionality, which aims to avoid consequences on the transportation network and its interconnections, and to prevent cascading events that lead to significant economic losses and disruptions from a social, economic, and political perspective in the affected area.
Table 1.
Details of the inspection process of selected BMS worldwide.
Table 1.
Details of the inspection process of selected BMS worldwide.
| Country | Bridge Management System | Inspection Levels |
|---|
| USA | AASHOWare BrM [1,3,4,8,9] | It is performed according to a damage rating matrix for a catalog of preset items. Damage is classified into four levels of severity. |
| European Union | COST345 [10] | Performance parameters are determined at the element level (extent and type of damage), at the bridge level (probability of failure, vulnerability to earthquakes and scour), and at the network level (importance of the bridge, impact on traffic indicators). |
| Denmark | DANBROWeb [11] | Seventeen main elements are visually inspected. They are rated from 0 to 5.
The detailed inspection includes a technical evaluation through tests and studies, as well as a financial evaluation of several measures by an interventionist who evaluates the load capacity and determines repair measures. |
| Spain | SGP [12] | Both main and special basic inspections include a special topic to be evaluated. It includes a training course for inspectors. |
| Turkey | Turkish BMS (KYS) [13] | A visual inspection of the bridge is performed. An evaluation of the level is made, and it is extended to any pathology in each element. |
| Japan | J-BMS [14] | Includes routine, major, and special inspections. |
| Victoria, Australia | VicRoads Bridge Management [15,16] | It includes a routine and detailed inspection. This inspection combines field tests with structural models to characterize damage or assess load capacity. The theoretical structural models are based entirely on structural design drawings following the guidelines of the bridge being analyzed. |
| Costa Rica | Ministry of Word [17,18] | Routine, visual, and special inspection. |
| France | LCPC [19] | Principal and in-depth inspections |
| Switzerland | KUBA-MS [20] | Development in Switzerland |
| Germany | Bundesministerium für Verkehr und digitale Infrastruktur (BMVI) | Visual and special inspection. Evaluation areas: stability and road safety |
It also considers recent natural disasters (hazards) worldwide and the vulnerability revealed by the risks associated with bridges, all related to climate change, which exposes bridges to various hazards such as floods, torrential floods, avalanches, and earthquakes, among others.
As a result, the module aims to identify the main hazards that may affect the stability and durability of bridges, causing both short- and long-term effects. These factors are crucial to ensure the proper functioning of bridges and to avoid their closure, which would have negative consequences on the operability of the network. This module, referred to as Module 2 of the SIGP, is an essential component that provides valuable information to other modules of the system as they relate to it as follows:
The vulnerability assessment in the scour and torrential flood submodules, which are part of Module 3 “Loads and Hazards”, are evaluated separately in a specialized manner and their risk is obtained.
Depending on the pathologies found, Module 5 defines the necessary interventions, such as maintenance, monitoring and instrumentation, rehabilitation, or bridge replacement.
The prioritization and decision-making module, as it is one of the performance criteria called “State of Damage”, together with “Mobility and Transportation” and “Natural and Operational Risks”. Considering these three, combinations are made using different scenarios to make decisions and obtain a prioritization list.
2. Methodology
A novel approach to a Colombian bridge management system (CBMS) requires an improvement from the basic criteria it currently contains, down to the tools of its functionality to operate and be an effective means to plan maintenance and retrofitting. New technologies and a plan to instruct the current and future field bridge inspectors is an effective way to guarantee the quality of inflow information that the CBMS needs to operate. One of the tools is visual inspection. This is an important task that detects problems indicating abnormal rates of deterioration of the elements of the bridge or serious environmental phenomena that affect its stability and durability. It allows the prediction of future behavior to plan the preservation [
7]. However, in several cases, field bridge inspectors do not have a state-of-the-art bridge damage manual (as a guide) to help them to quantify damage according to a numerical scale needed to estimate the severity of a particular condition on a particular structural part of the bridge.
Data availability is also an important factor for a bridge management system because if a certain damage is discovered one day by a field inspector, it would be desirable for the bridge safety to report the damage as soon as possible (the same day would be best). However, in some cases, the technology available to a bridge inspector may not allow the report to reach a maintenance group for several days. This situation can be catastrophic if the damage is related to bridge failures such as those with fatigue initiation, as the remaining time to act can be a matter of days. That is why available tools such as a cell phone can be an ally in improving the quality of reporting and readiness.
The present research presents in a systematic way, the different actions to improve the current CBMS, and presents a set of improved tools that will allow a bridge inspector to evaluate “in the field” with a better judgment tool when a damage can be irrelevant, strong, or extreme for the safety of a structure, in other words, when to assign a higher weighting value to a given bridge damage. In addition, new damage categories more broadly complemented the hazards that can affect a given bridge and ultimately affect its serviceability. The new system had the opportunity to test its improvements by applying it to a group of two sample bridges, which helped us to understand the capabilities and data results and the benefits that resulted.
The module is designed for the visual inspection of components of various types of bridges, including supported and continuous and slab bridges, suspension bridges, cable-stayed bridges, arched bridges, segmented bridges, truss bridges, and others. It is suitable for bridges of various types, depending on the type of structure: reinforced concrete, prestressed concrete, composite (concrete and steel), steel cable, wood, brick, and rock. This is reflected in the developed damage catalog and rubrics, as presented in
Section 2.4.
The following sections provide a detailed description of the key features of the proposed inspection modules.
2.1. Condition Index and Rating Scale
The inspection is a detailed visual evaluation that aims to provide an objective assessment of the condition of the bridge by adequately recording and qualifying the type, location and intensity of damage or deterioration present in various elements of the structure. Two levels were used to determine the condition of the structure. The first one is the deterioration index, which concerns the evaluation of the condition of each component of the bridge. The second one is the bridge condition index, which considers the evaluation of the groups and their weighting with hierarchies [
6].
The rating scale chosen for this module has the same levels as the main inspection of the first Colombian Bridge Management System, implemented in 1996 [
21], with the advice of the Danish Road Directorate (3). In this way, it has been possible to apply the experience gained in the last 20 years with the assessment records of bridges carried out by INVIAS (Colombian National Institute of Roads), especially the information from the five inventory and inspection campaigns carried out in 1996, 1998, 2001, 2008, and 2014. The qualitative scale of this module is presented in
Table 2.
2.2. Areas of Evaluation
After consulting with INVIAS and considering the progress made in the field both nationally through the Colombian Bridge Management System (SIPUCOL for its name in Spanish) and internationally, three important areas were identified for the evaluation of bridge components. These areas are durability, stability, and traffic safety.
Durability considers the degree and extent of each component’s deterioration and the damage associated with reducing the useful life of the structure. It is related to the damage that affects the condition of the various materials that are part of the bridge components, such as reinforced concrete, prestressed concrete, structural steel, rebar, cables, masonry, rock, asphalt, etc. By having specific information in this area for each of the bridge components, the SIGP can evaluate the maintenance and preservation of the bridges throughout their life cycle. Likewise, with this information, it will be possible to study the durability of bridges in different areas of the country [
22,
23,
24,
25,
26].
Stability assessment analyzes structural safety by reducing the probability of failure associated with damage to elements that affect the partial or global stability of the structure. Partial or total collapses of bridges caused by earthquakes, torrential floods, avalanches, scour, mass removal, overloads, and design/construction errors that have occurred in Colombia and worldwide in recent decades are considered [
27]. The above is related to the stability assessment analysis due to the economic and social consequences of the failure. It is an input for the SIGP prioritization module related to investment plans for the rehabilitation, reconstruction, or replacement of existing bridges of the national road network [
22,
28,
29,
30,
31].
The third component is road safety, which is related to the functionality and safe operation for bridge users (drivers, passengers, cyclists, motorcyclists, and pedestrians); on the other hand, it is one of the most innovative aspects in bridge design regulations [
2], as well as in road safety regulations [
32], especially in the specifications for guardrails or traffic barriers (vehicular and pedestrian). This situation is worrying due to the increasing number of high-performance vehicles on Colombian roads, especially trucks. The excessive rigidity of the containment elements and the lack of transition elements between them and the flexible barriers at the bridge entrances have led to serious accidents with light vehicles. The presence of sidewalks along bridges with heavy traffic and high operating speeds and in urban areas is a dangerous aspect that should also be evaluated during bridge inspections.
The concept of road safety on bridges also includes a degree of difficulty in carrying out routine inspection and maintenance work on bridges, including safe areas for the most vulnerable users within bridges, an undesirable but common situation in Colombia. In addition, there are safety issues related to the service elements of the bridge, such as the deck (in the access area and on the deck), expansion joints and platforms, which will be considered in the PGIS for their solution. The evaluation of this aspect should also include criteria such as the slope of the road, the height of the obstacle to be crossed, the type of land use in the areas adjacent to the bridge (residential, institutional, industrial, commercial, etc.), and the alignment of the bridge, among others. Similarly, road safety reviews the traffic pattern on the bridge and the condition of vertical and horizontal road signs and other traffic control devices to help reduce the likelihood of an accident occurring on the bridge and its approaches.
2.3. Definition of Bridge Groups and Components
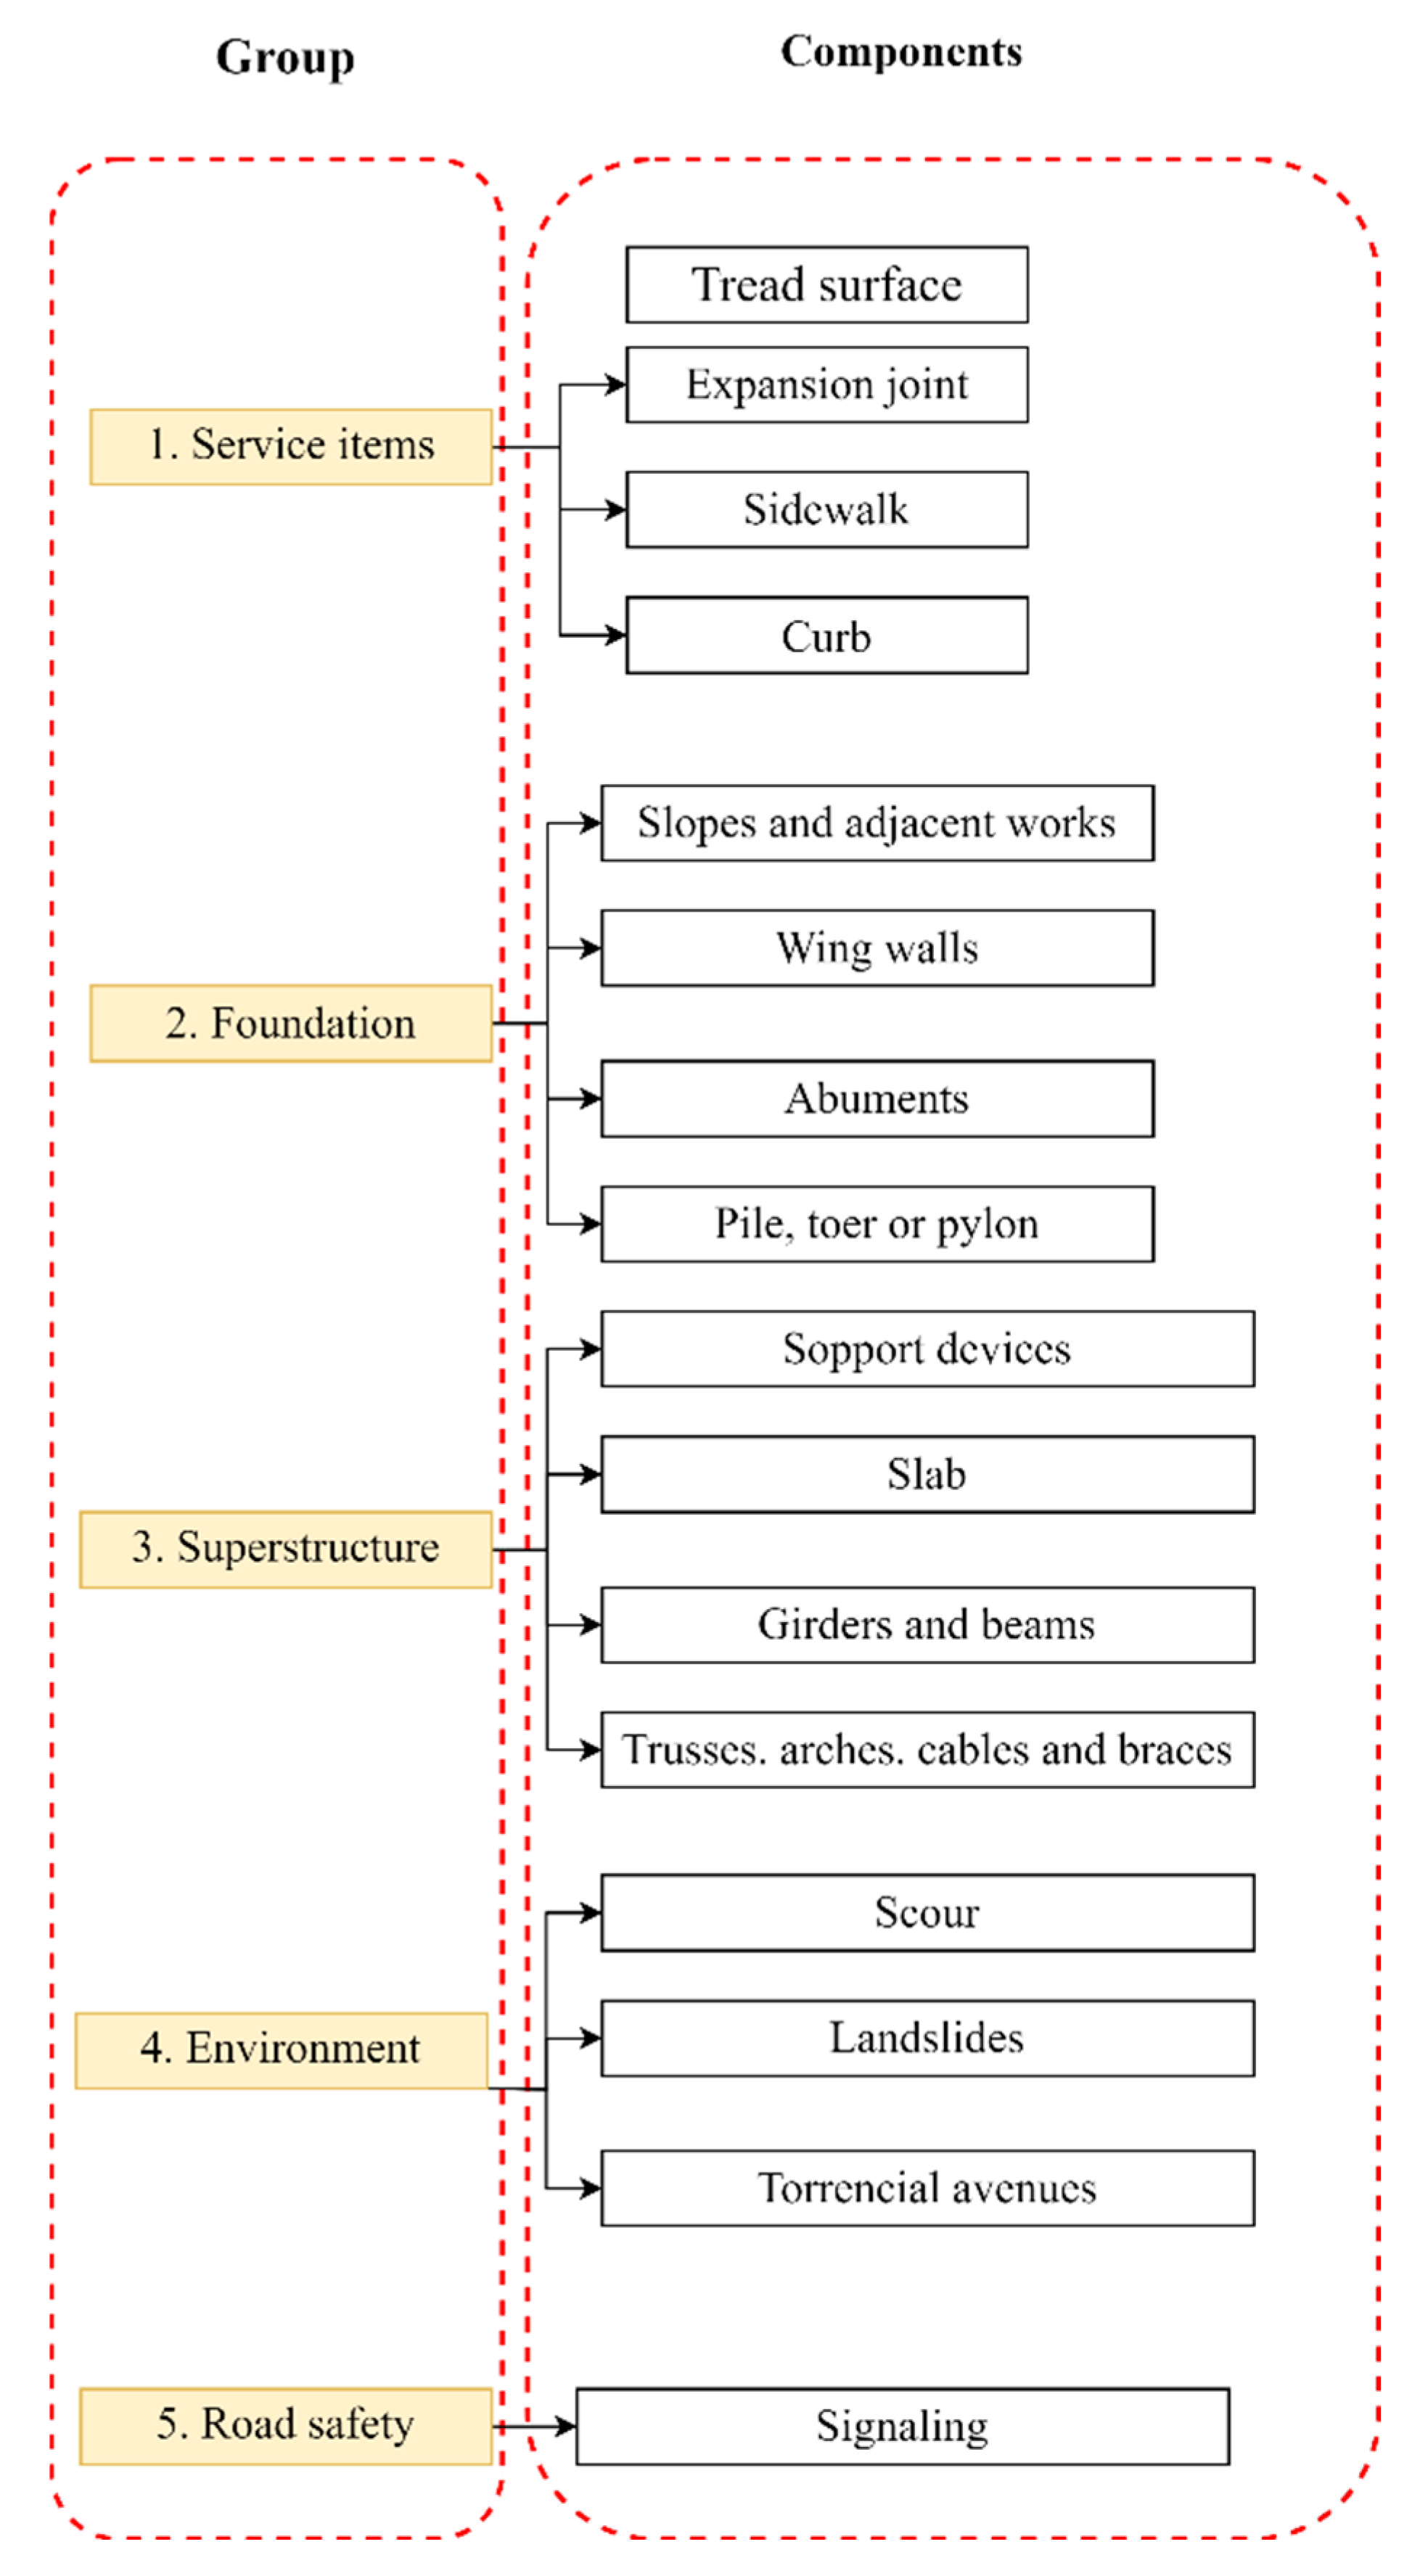
Five (5) groups have been defined for the bridges, each containing a set of components according to their typology.
Figure 1 shows their standard confirmation. These groups represent the parts that make up bridges, where the components of groups 2, 3, and 4 are related to structural stability. The components of groups 1 and 5 are related to functionality and road safety, respectively.
2.4. Damage Catalog
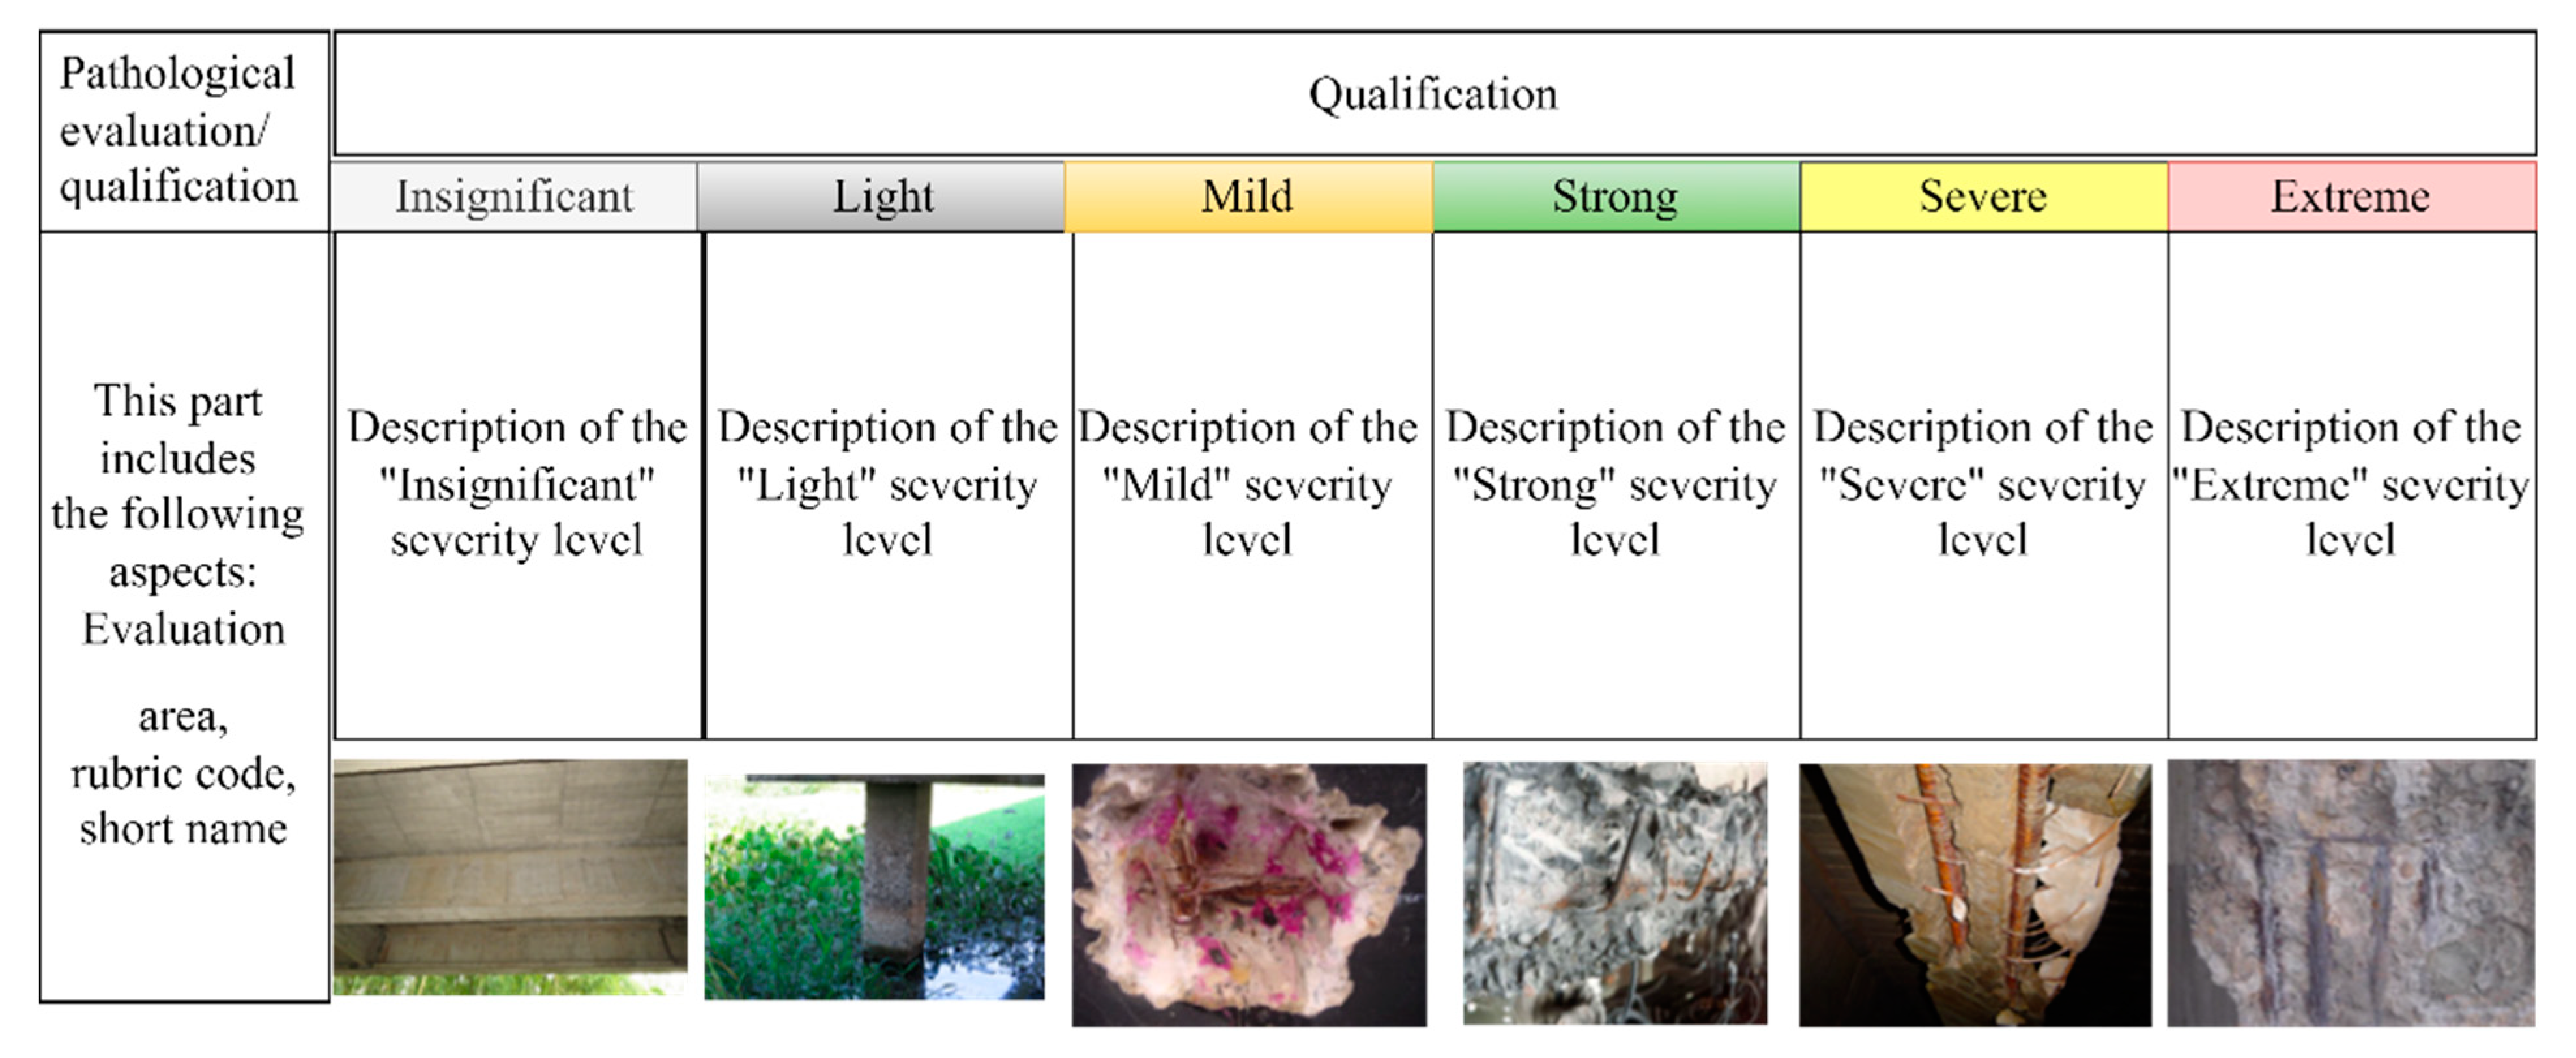
After evaluating the three areas, a damage catalog was created. It contains rubrics for different pathological conditions and their corresponding qualification or severity levels.
Figure 2 shows the format of the rubrics. The rubrics are organized into assessment areas that cover each component of the bridge groups shown in
Figure 1. As shown in
Figure 2, each rubric contains real images for different levels of damage or pathology, which serve as a reference for bridge inspectors during visual inspections in the field. These images are based on the experience gained during the implementation of the Colombian Bridge Management System (SIPUCOL in Spanish). This system has been used by the National Roads Institute since 1996.
Figure 2 shows an example of an evaluation rubric with photos of damage ranging from insignificant to extreme severity, specifically for corrosion of concrete structures. These rubrics describe the damage for each severity level, which is helpful to engineers in their field work to determine the severity level of each component during inspection. In addition to assessing the severity of the damage, engineers must take appropriate photographs as evidence of the identified damage, which are included in the inspection report and displayed on the system interface.
Figure 3 shows the structure of this damage catalog, which includes the number of headings of the three (3) assessment components stored in the inspection application used for field inspection work, as shown in
Figure 4. It serves as a dynamic damage catalog that can be expanded or refined as the system is implemented, allowing for the inclusion or adaptation of additional damage types. This ensures a comprehensive examination of the primary pathologies affecting bridge components during visual inspections in the field.
Figure 3 shows the number of rubrics for each evaluation area that are part of the damage catalog. This was determined based on the number of identified damages in each area for each component, with a higher number related to stability compared to durability or road safety.
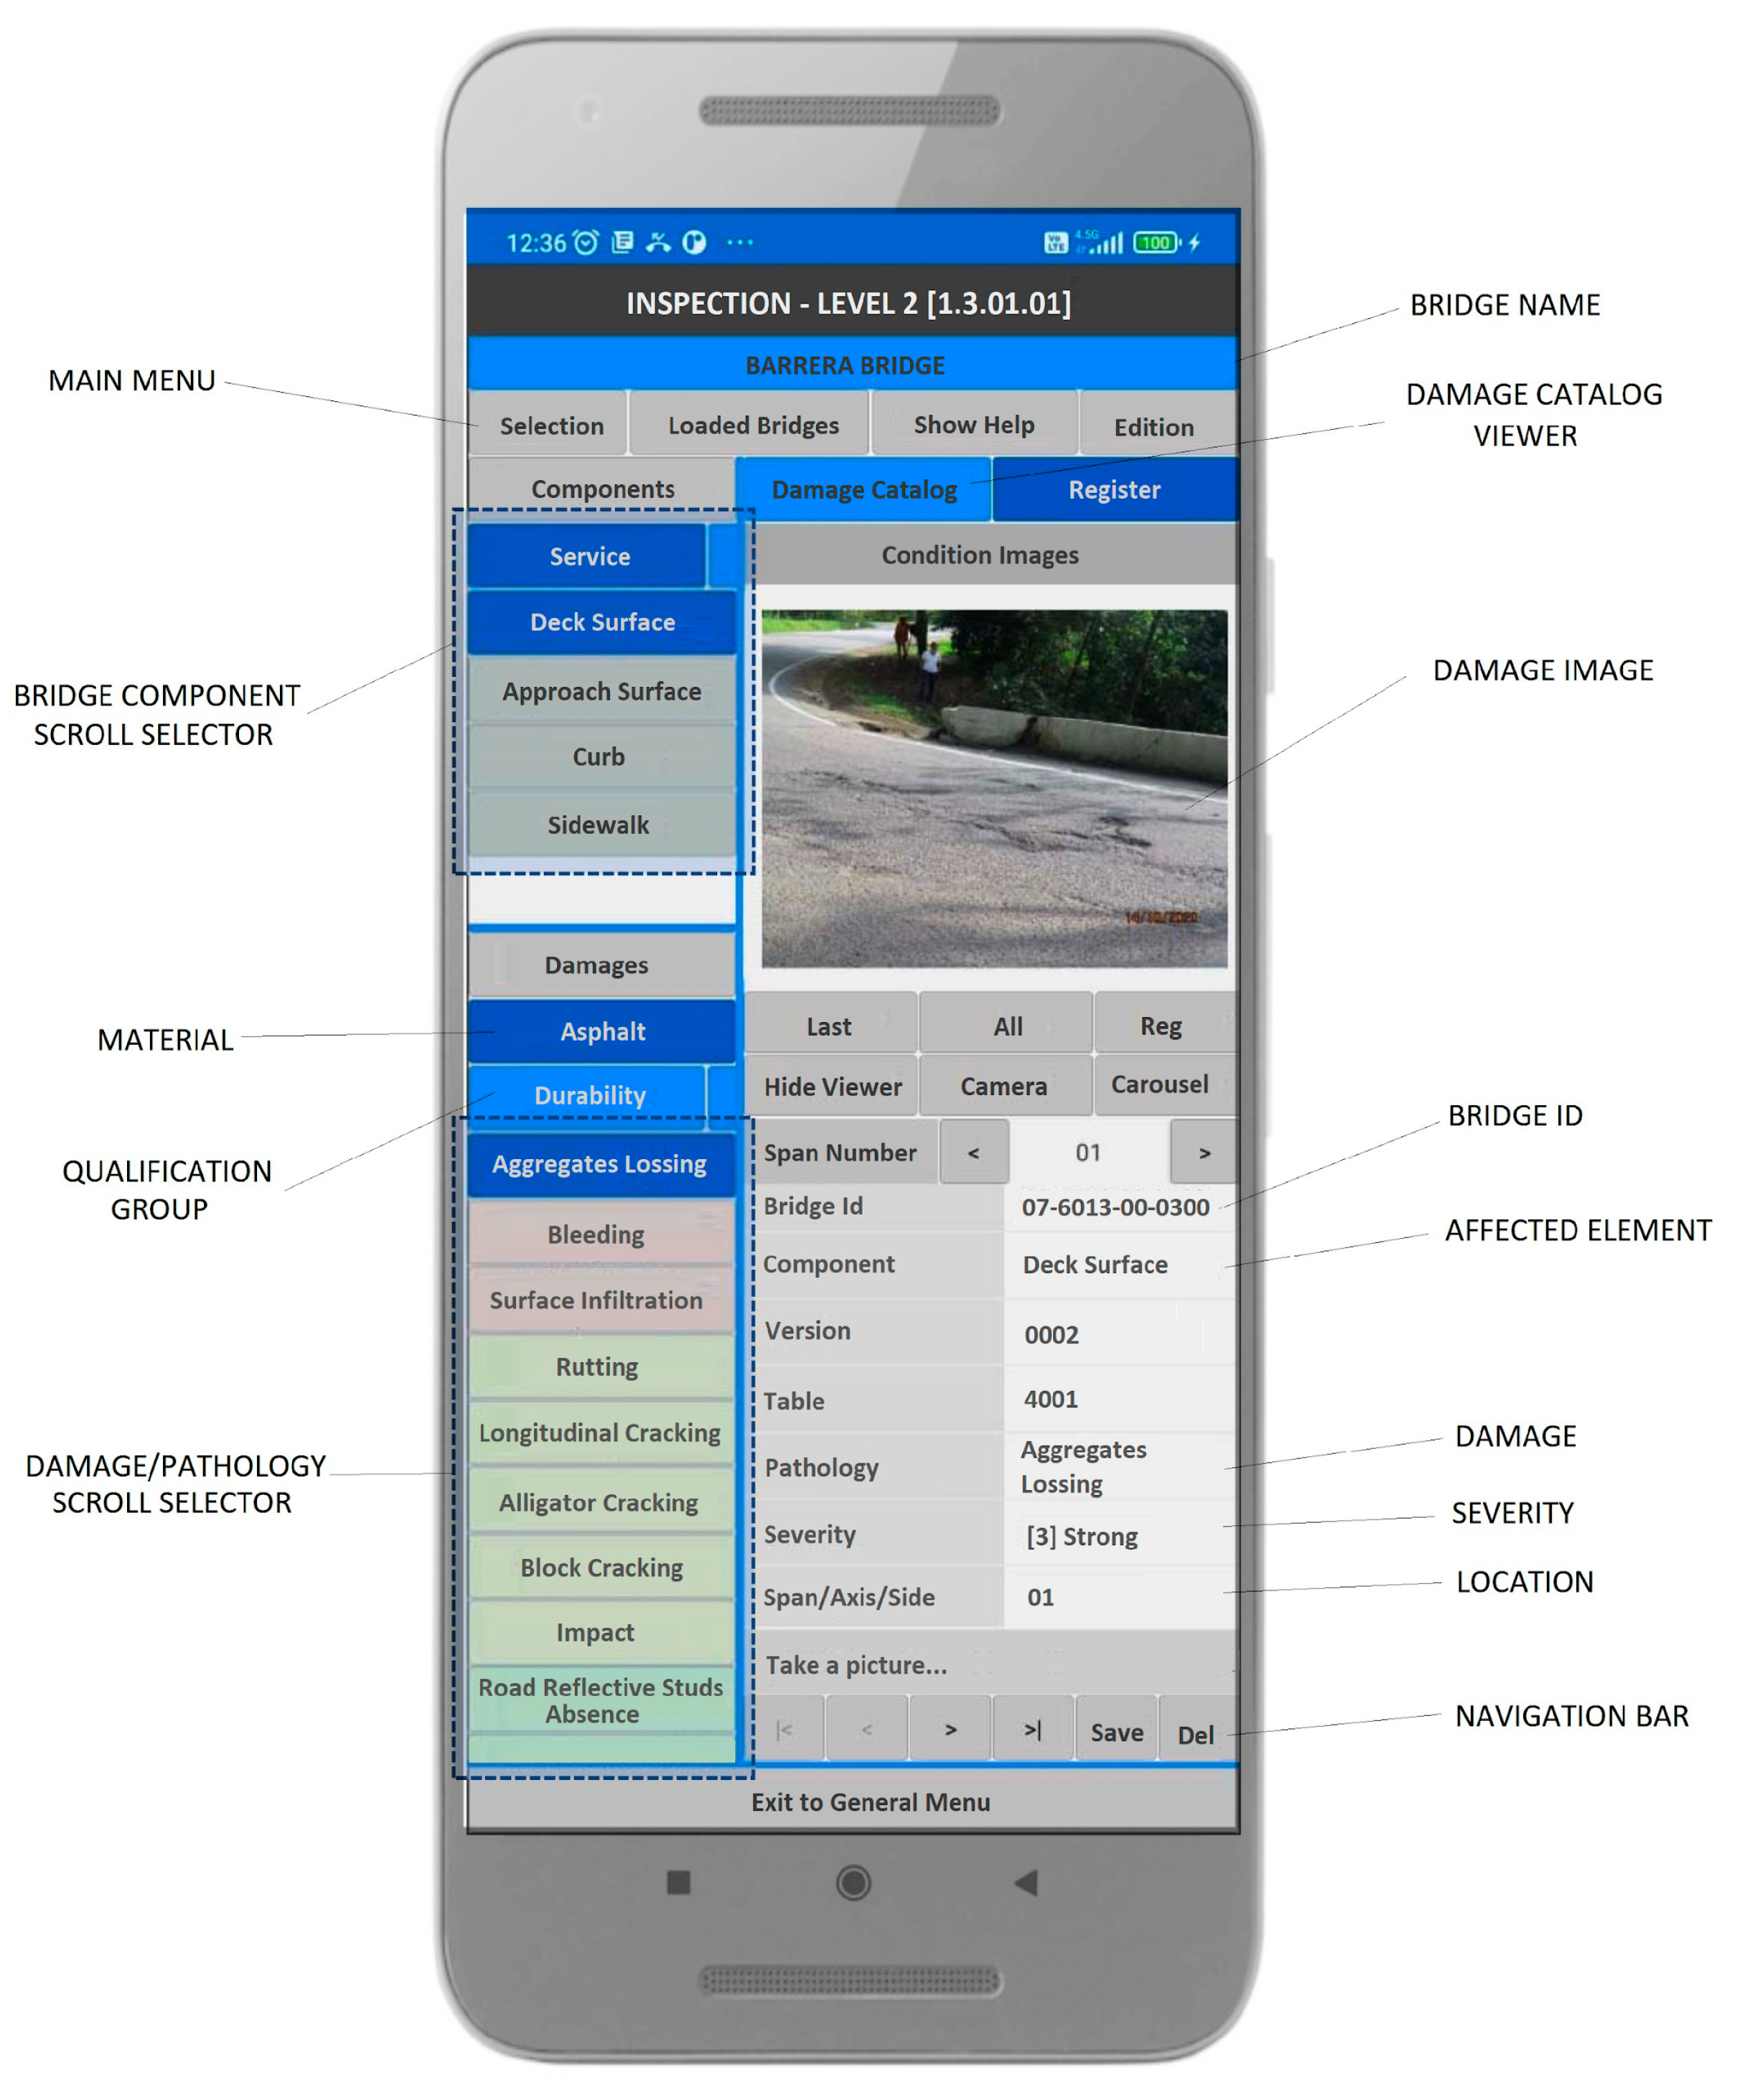
A mobile application (shown in
Figure 4) has been implemented to digitally capture data associated with visual inspection tasks. This increases the data acquisition on field. It is important to document any damage and record its extent and severity using built-in rubrics. Relevant inspection information should be imported to identify components associated with the inventory. The status of routine and preventive maintenance should also be recorded. Finally, the collected data should be exported to a central geodatabase in the cloud. This development is part of a line of research around the world where technological applications are being implemented to support visual inspection and damage detection on bridges [
30,
33,
34,
35,
36,
37,
38]. The time during which this application should be used in the field depends on the index of each bridge, as explained in
Table 3. This time varies from an immediate visit to the bridge if it has an index of “Susceptible to partial or total failure” to 5 years for an index of “Satisfactory”.
The application can be installed on tablets and mobile phones with the Android operating system, as well as tablets with the Windows 10 Core system or Windows 10 IoT with UWP (Universal Windows Platform) technology with ARM processors. Its main technical features are as follows:
The Integrated Damage Catalog is designed to dynamically display information based on the typology of each bridge, its components, materials, and evaluation area. This allows the inspector to easily select and assign pathologies to each element and view their description, different severity levels, and quantitative and qualitative criteria. In addition, the catalog provides example images of each pathology, creating a didactic guide with over 80,000 combinations available for 11 different types of bridges. The catalog includes more than 200 rubrics covering three areas of evaluation and all the components and adjacent external elements that influence the value of the condition index.
Synchronization with data stored in the geodatabase and the possibility of using it with different access rights. In the case of corporate devices, multiple user sessions can be created simultaneously for the same device.
Online authorization system that allows the user to keep track of each copy in production, the users and the project to which they are assigned, and some usage statistics.
Online and offline work modes that allow data collection in areas without Internet coverage. Data are stored in a local database and can then be sent to the geodatabase via web service.
Given the nature of field work and to facilitate the inspector’s work, the user interface is “one page”, eliminating the need to open and navigate between many different windows.
Integration with the device camera and image tagging, association, metadata storage, and sequencing.
Ability to export data from a work session to an external device, in an encrypted format, for backup and as a contingency plan in case of loss or damage.
The application was developed on Microsoft’s Xamarin platform and uses an internal Sqlite 3 database. The REST services used to send and load data were implemented using Net Core 6.0 and are hosted in a SqlServer spatial database compatible with ESRI’s ArcGis, in an SAAS cloud service provided by Azure. The images are sent to the server through an SFTP service that uses a fragmentation technology to send data from areas with very low Internet coverage since, in Colombia, there are many bridges in sparsely populated areas with no or very low cellular coverage due to its topography and extension. This application is part of Inspection Module 2, as shown in
Figure 5, which shows the system architecture. The system includes several important modules such as inventory, loads and hazards, structural health, and prioritization.
2.5. Weighting Coefficient Definition
The evaluation criteria for the bridge groups (superstructure, substructure, environment, service elements, and traffic signs) were defined as the weighted average of the worst evaluation using the criteria shown in
Table 2 for the condition of the components. The hierarchical analysis decision method was used to define the weighted average [
39].
Based on the above, a survey was developed and completed by nineteen (19) experts in the field of bridges at the national level. Some of the results of the determined weights are shown in
Figure 6 by evaluation areas and groups of bridges. As can be seen in
Figure 6a, the order of importance at the level of the evaluation areas is as follows: stability, durability, and traffic safety. Durability and road safety have one-third of the importance, and the rest corresponds to stability, which is mainly related to relevant structural damage, as well as to the problems of scour and torrential flooding on bridges.
Figure 6b shows the importance levels of the bridge groups for different conditions related to their environment, such as scours, torrential flows, and landslides.
2.6. Weighting Coefficient Definition, Qualification Procedure, and Frequency of Inspections
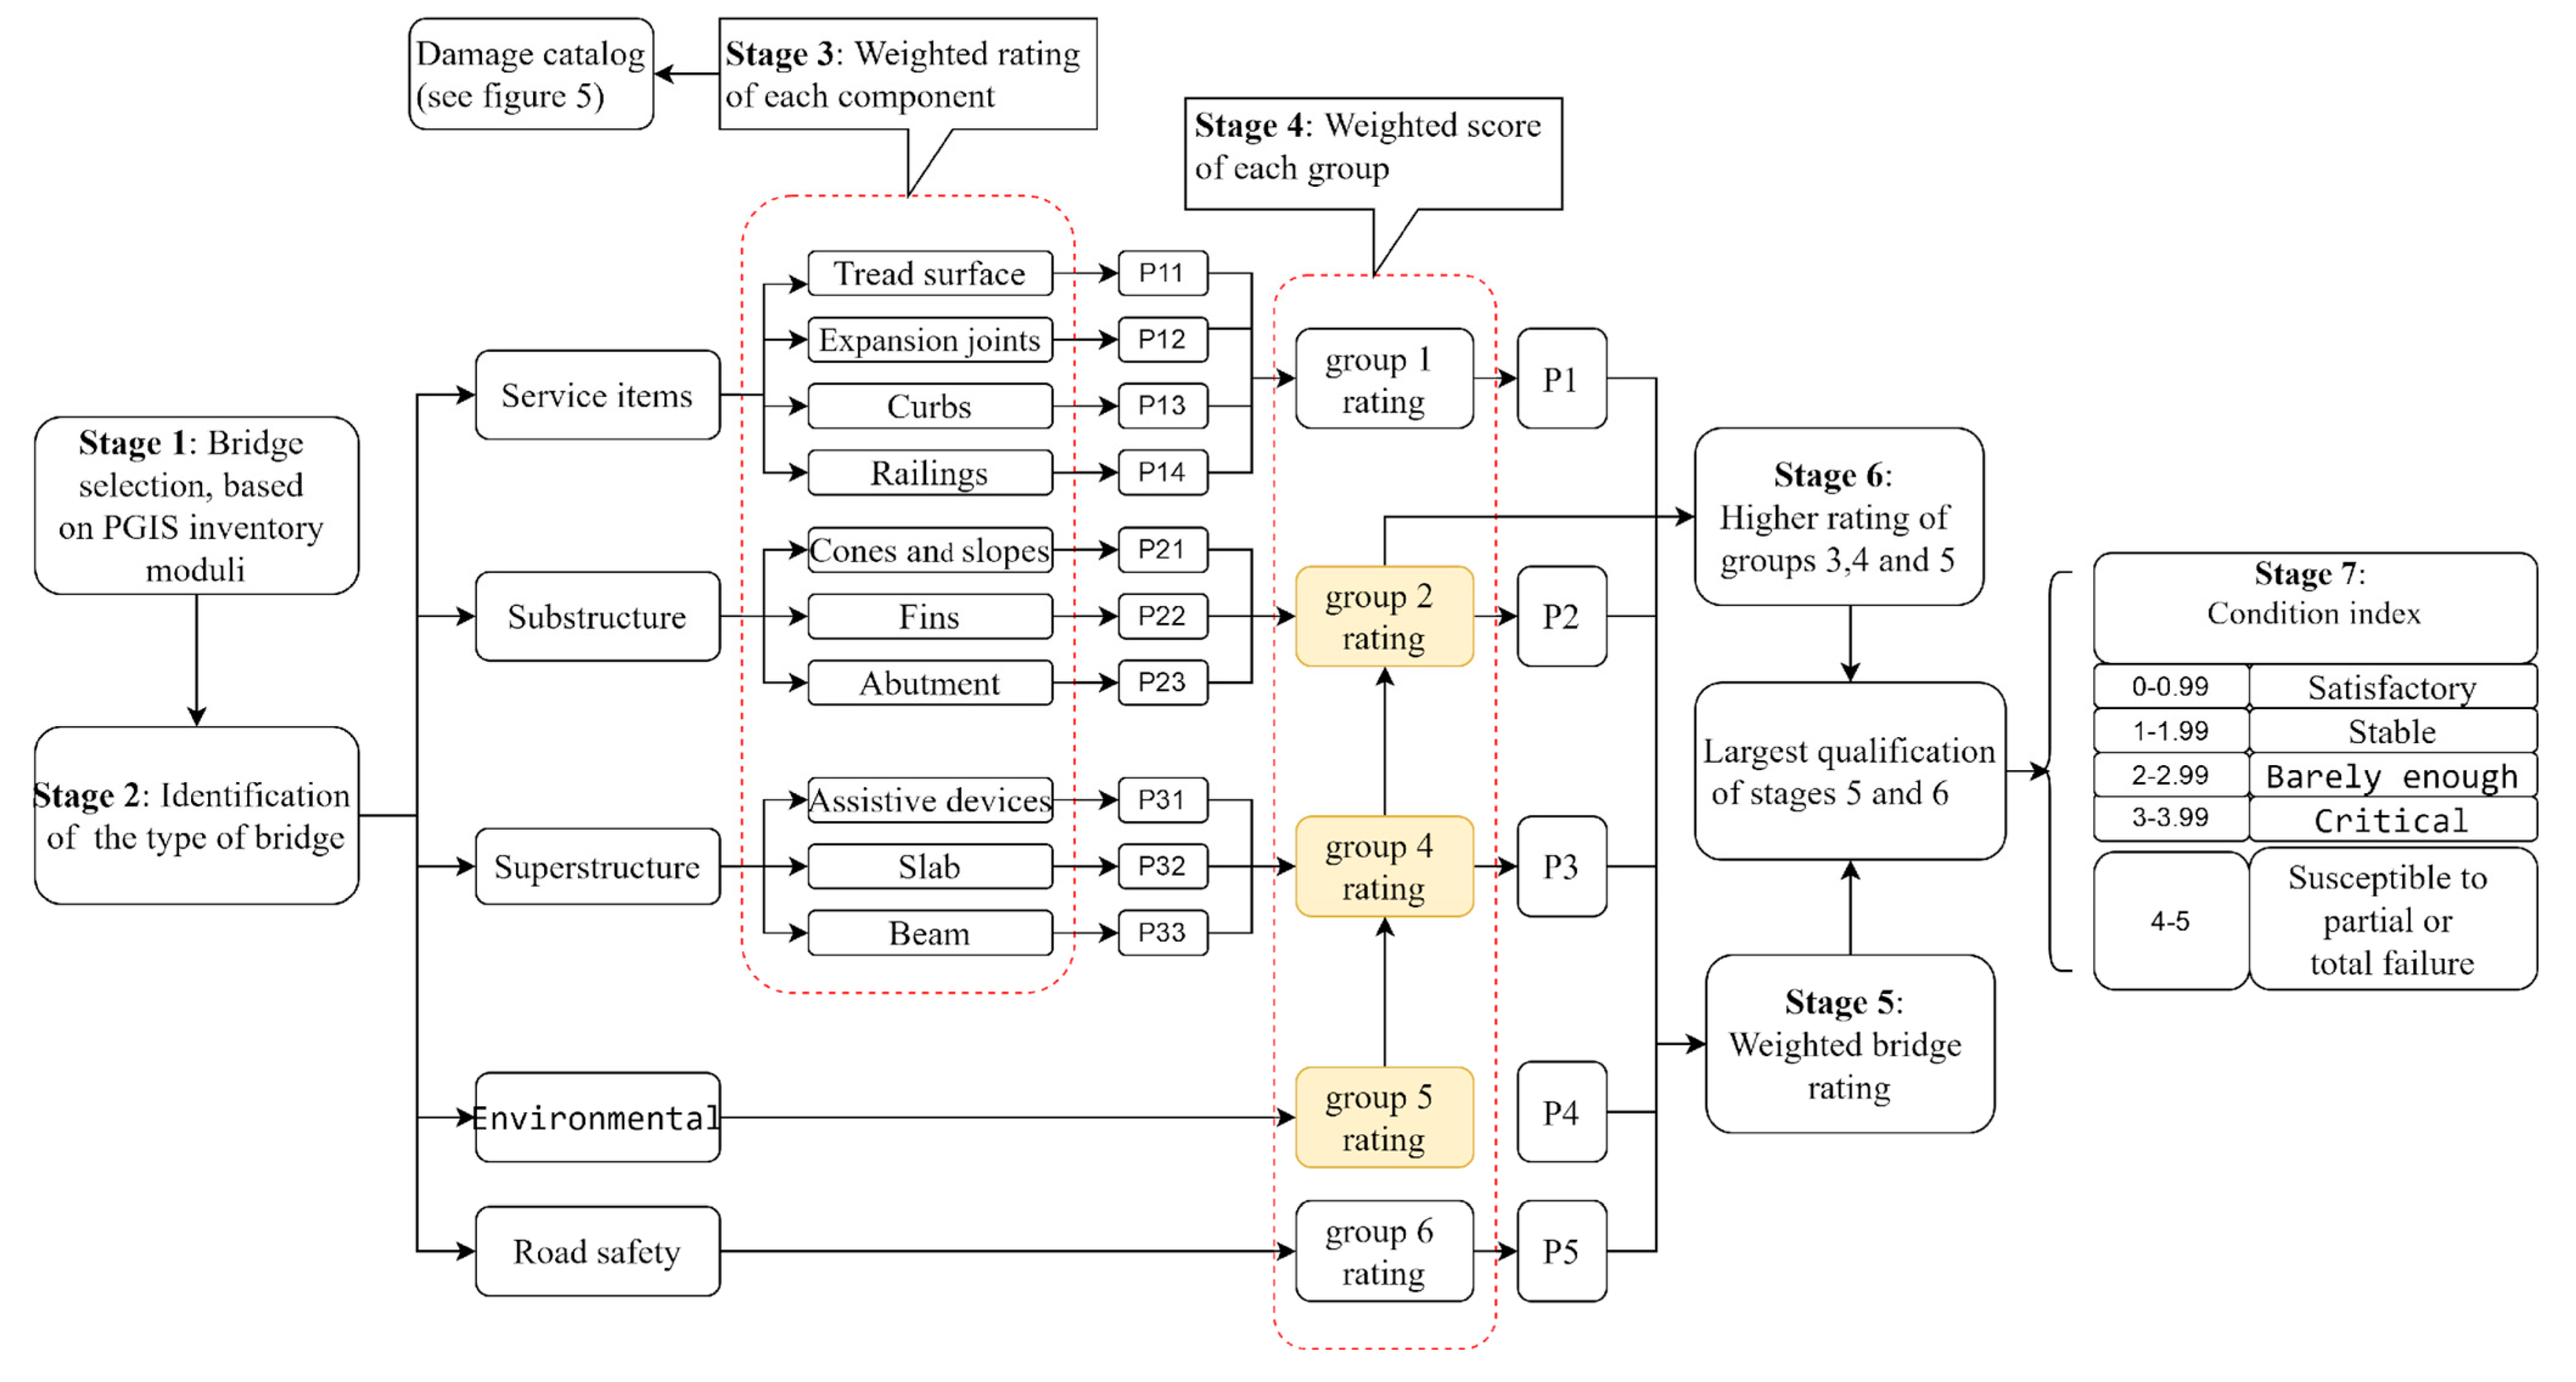
Figure 7 shows a flowchart with the different steps to determine the weighted rating of the bridge and its performance index. In step 1, the bridge is selected based on the inventory module database [
23]. In step 2, the bridge typology is determined, and in step 3, the weighted rating of each component is provided. In step 4, the weighted rating of each group is determined, and in step 5, the weighted rating of the bridge is assigned. In step 6, the highest rating of groups 2, 3, and 4 is determined. Finally, in step 7, the performance index is calculated using the highest rating from steps 5 and 6.
Table 3 shows the frequency of inspections as a function of the condition index obtained for each bridge.
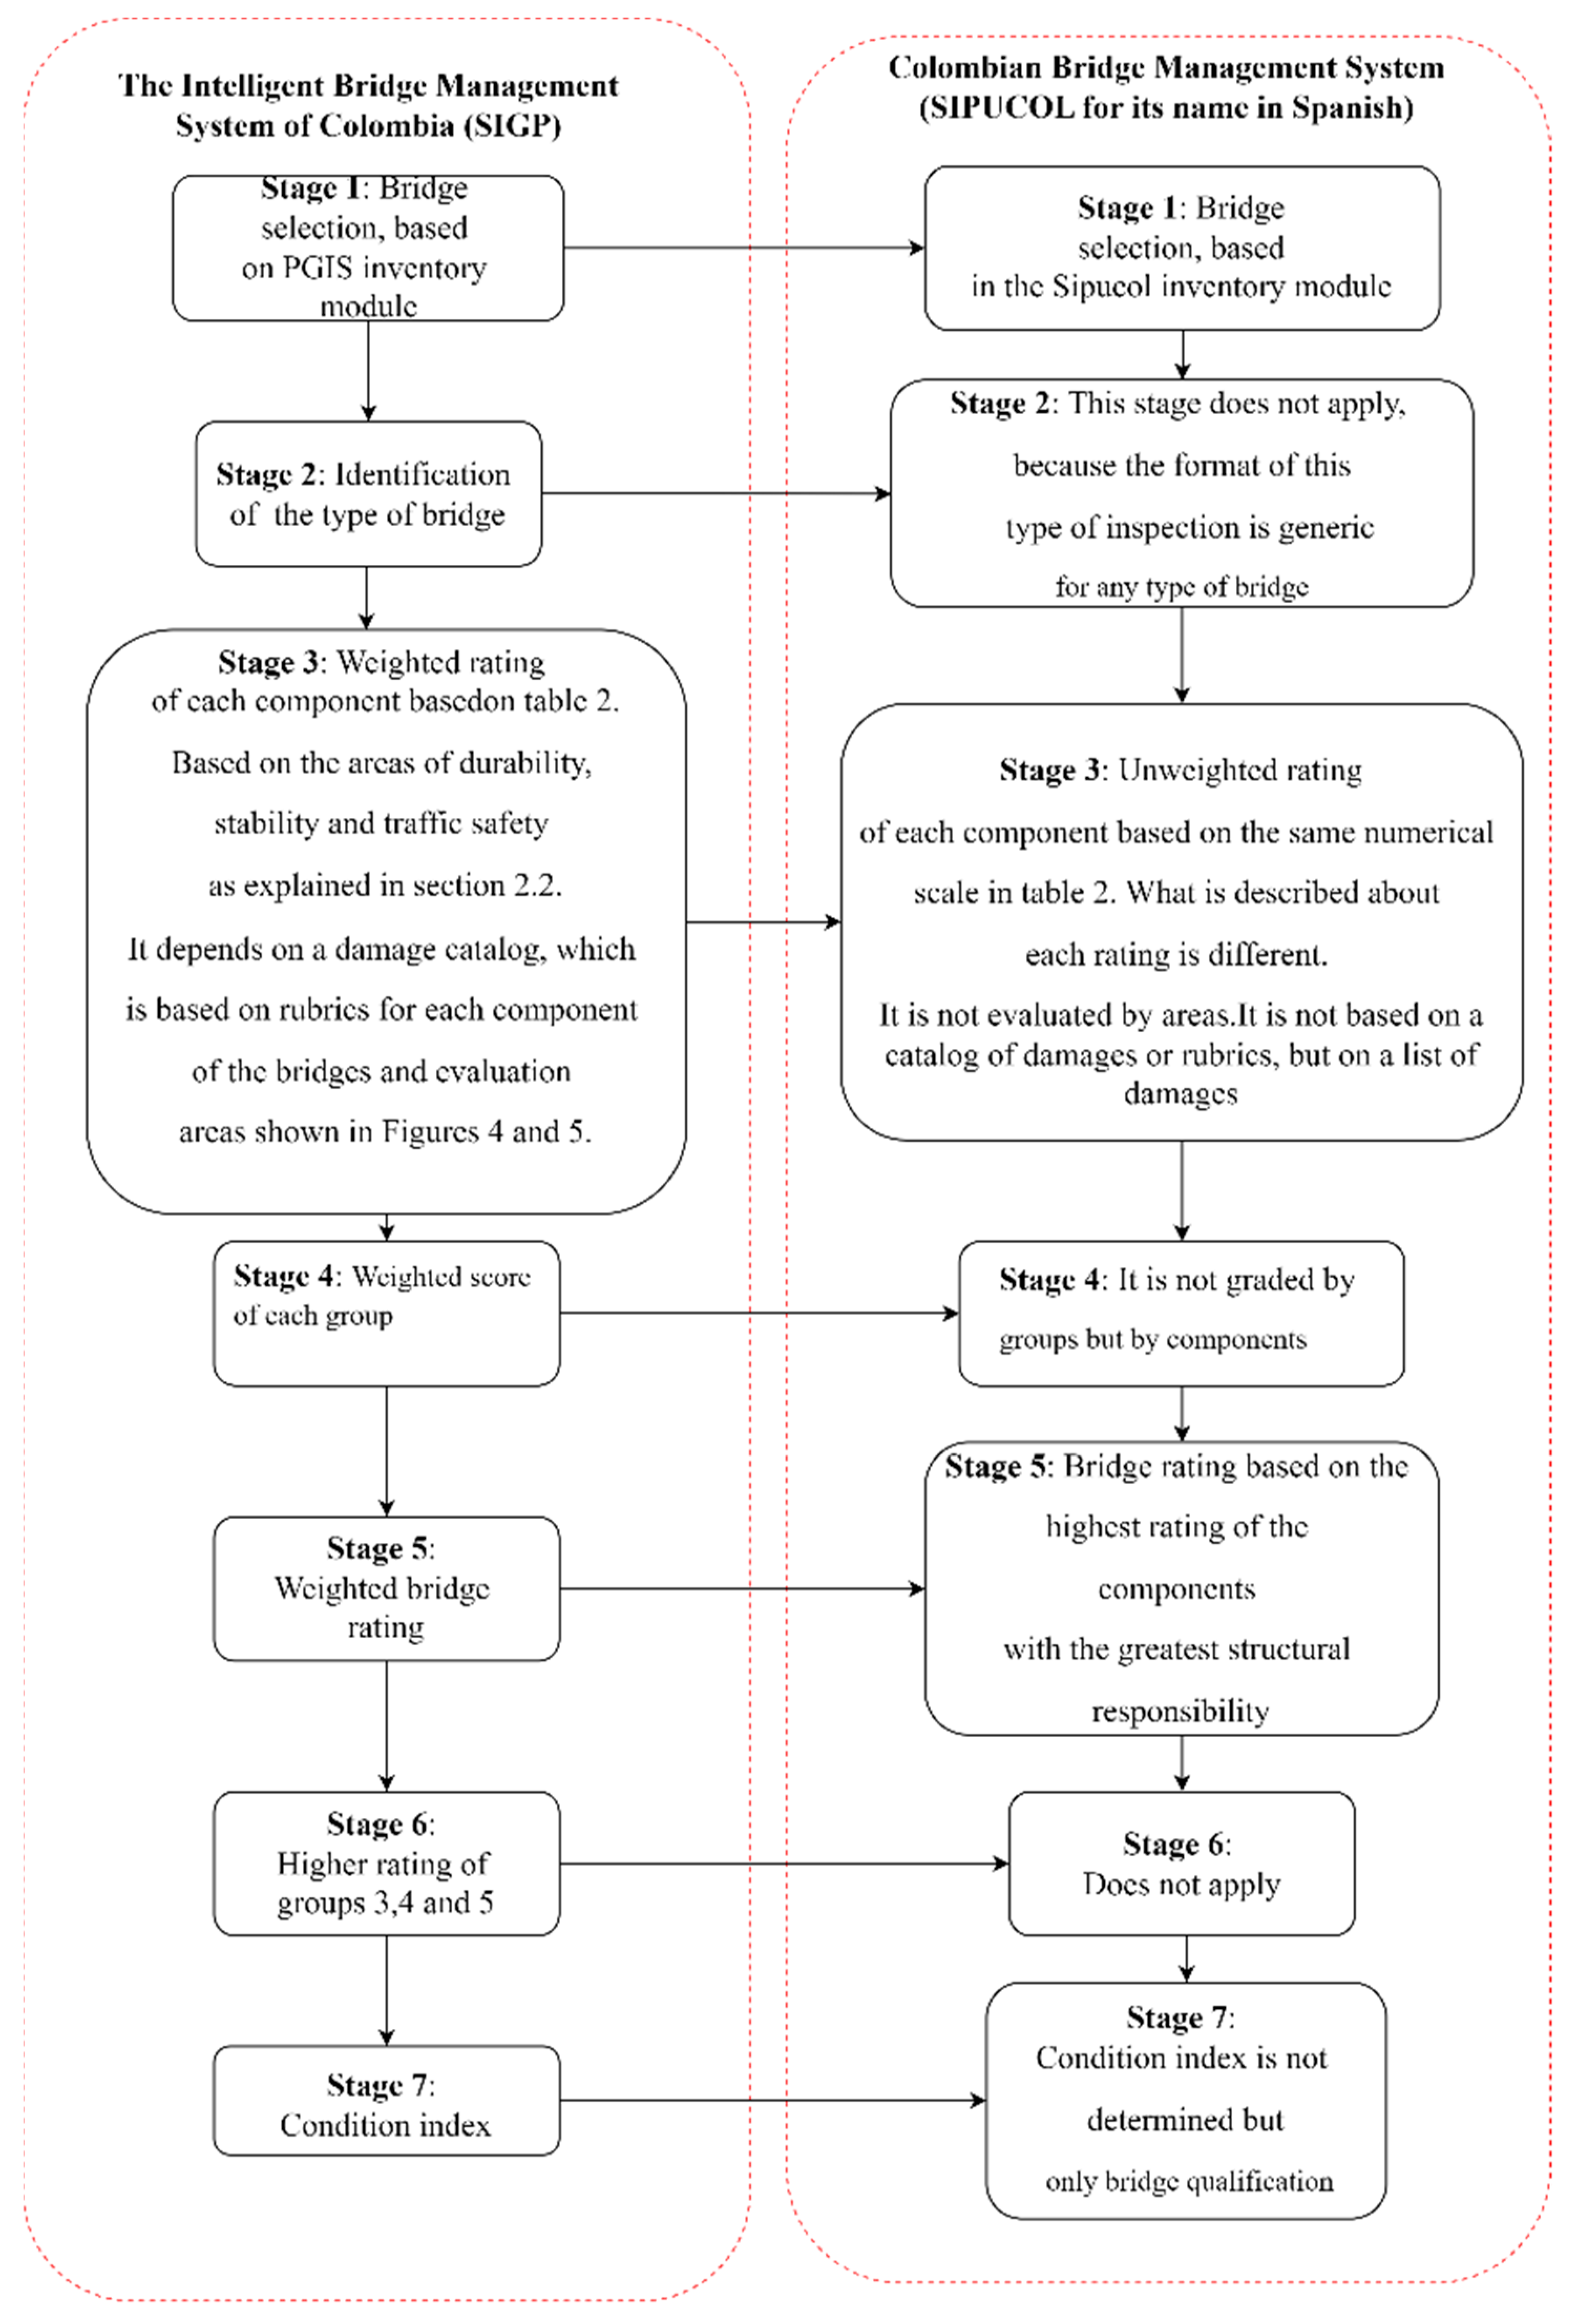
Figure 8 shows a flowchart with the stages of the new visual inspection module (SIGP) developed in this research compared to those of the current visual inspection module of the current Colombian bridge management system (SIPUCOL). Based on this comparison, the advantages of the new inspection tool are identified as follows: (i) innovation, since it includes more variables in the determination of the condition rating of the bridge, (ii) new areas, since the new visual inspection module is based on three (3) evaluation areas and a damage catalog, (iii) the new tool has a comprehensive and reliable diagnosis of the condition of the bridge, (iv) it includes the determination of a condition index that is evaluated in the bridge subgroup called environment, which includes scour, torrential rains and slope, and (v) it includes damage related to traffic safety.
In addition, the dates of the next inspection will depend on other factors such as the following:
One stability test must be performed before commissioning and another before the end of the validity period of the work’s stability policy.
After a major maintenance or rehabilitation intervention on the bridge (including emergency interventions).
3. Results
The results of the inspection of two (2) bridges are presented below, the purpose of which is to present the developed methodology, which allows to know its characteristics, usefulness, and potential. For this purpose, these bridges were selected with different materials, typology, and geometry at the inventory level. They were also selected with different types of damage and, therefore, with different levels of severity and condition indices.
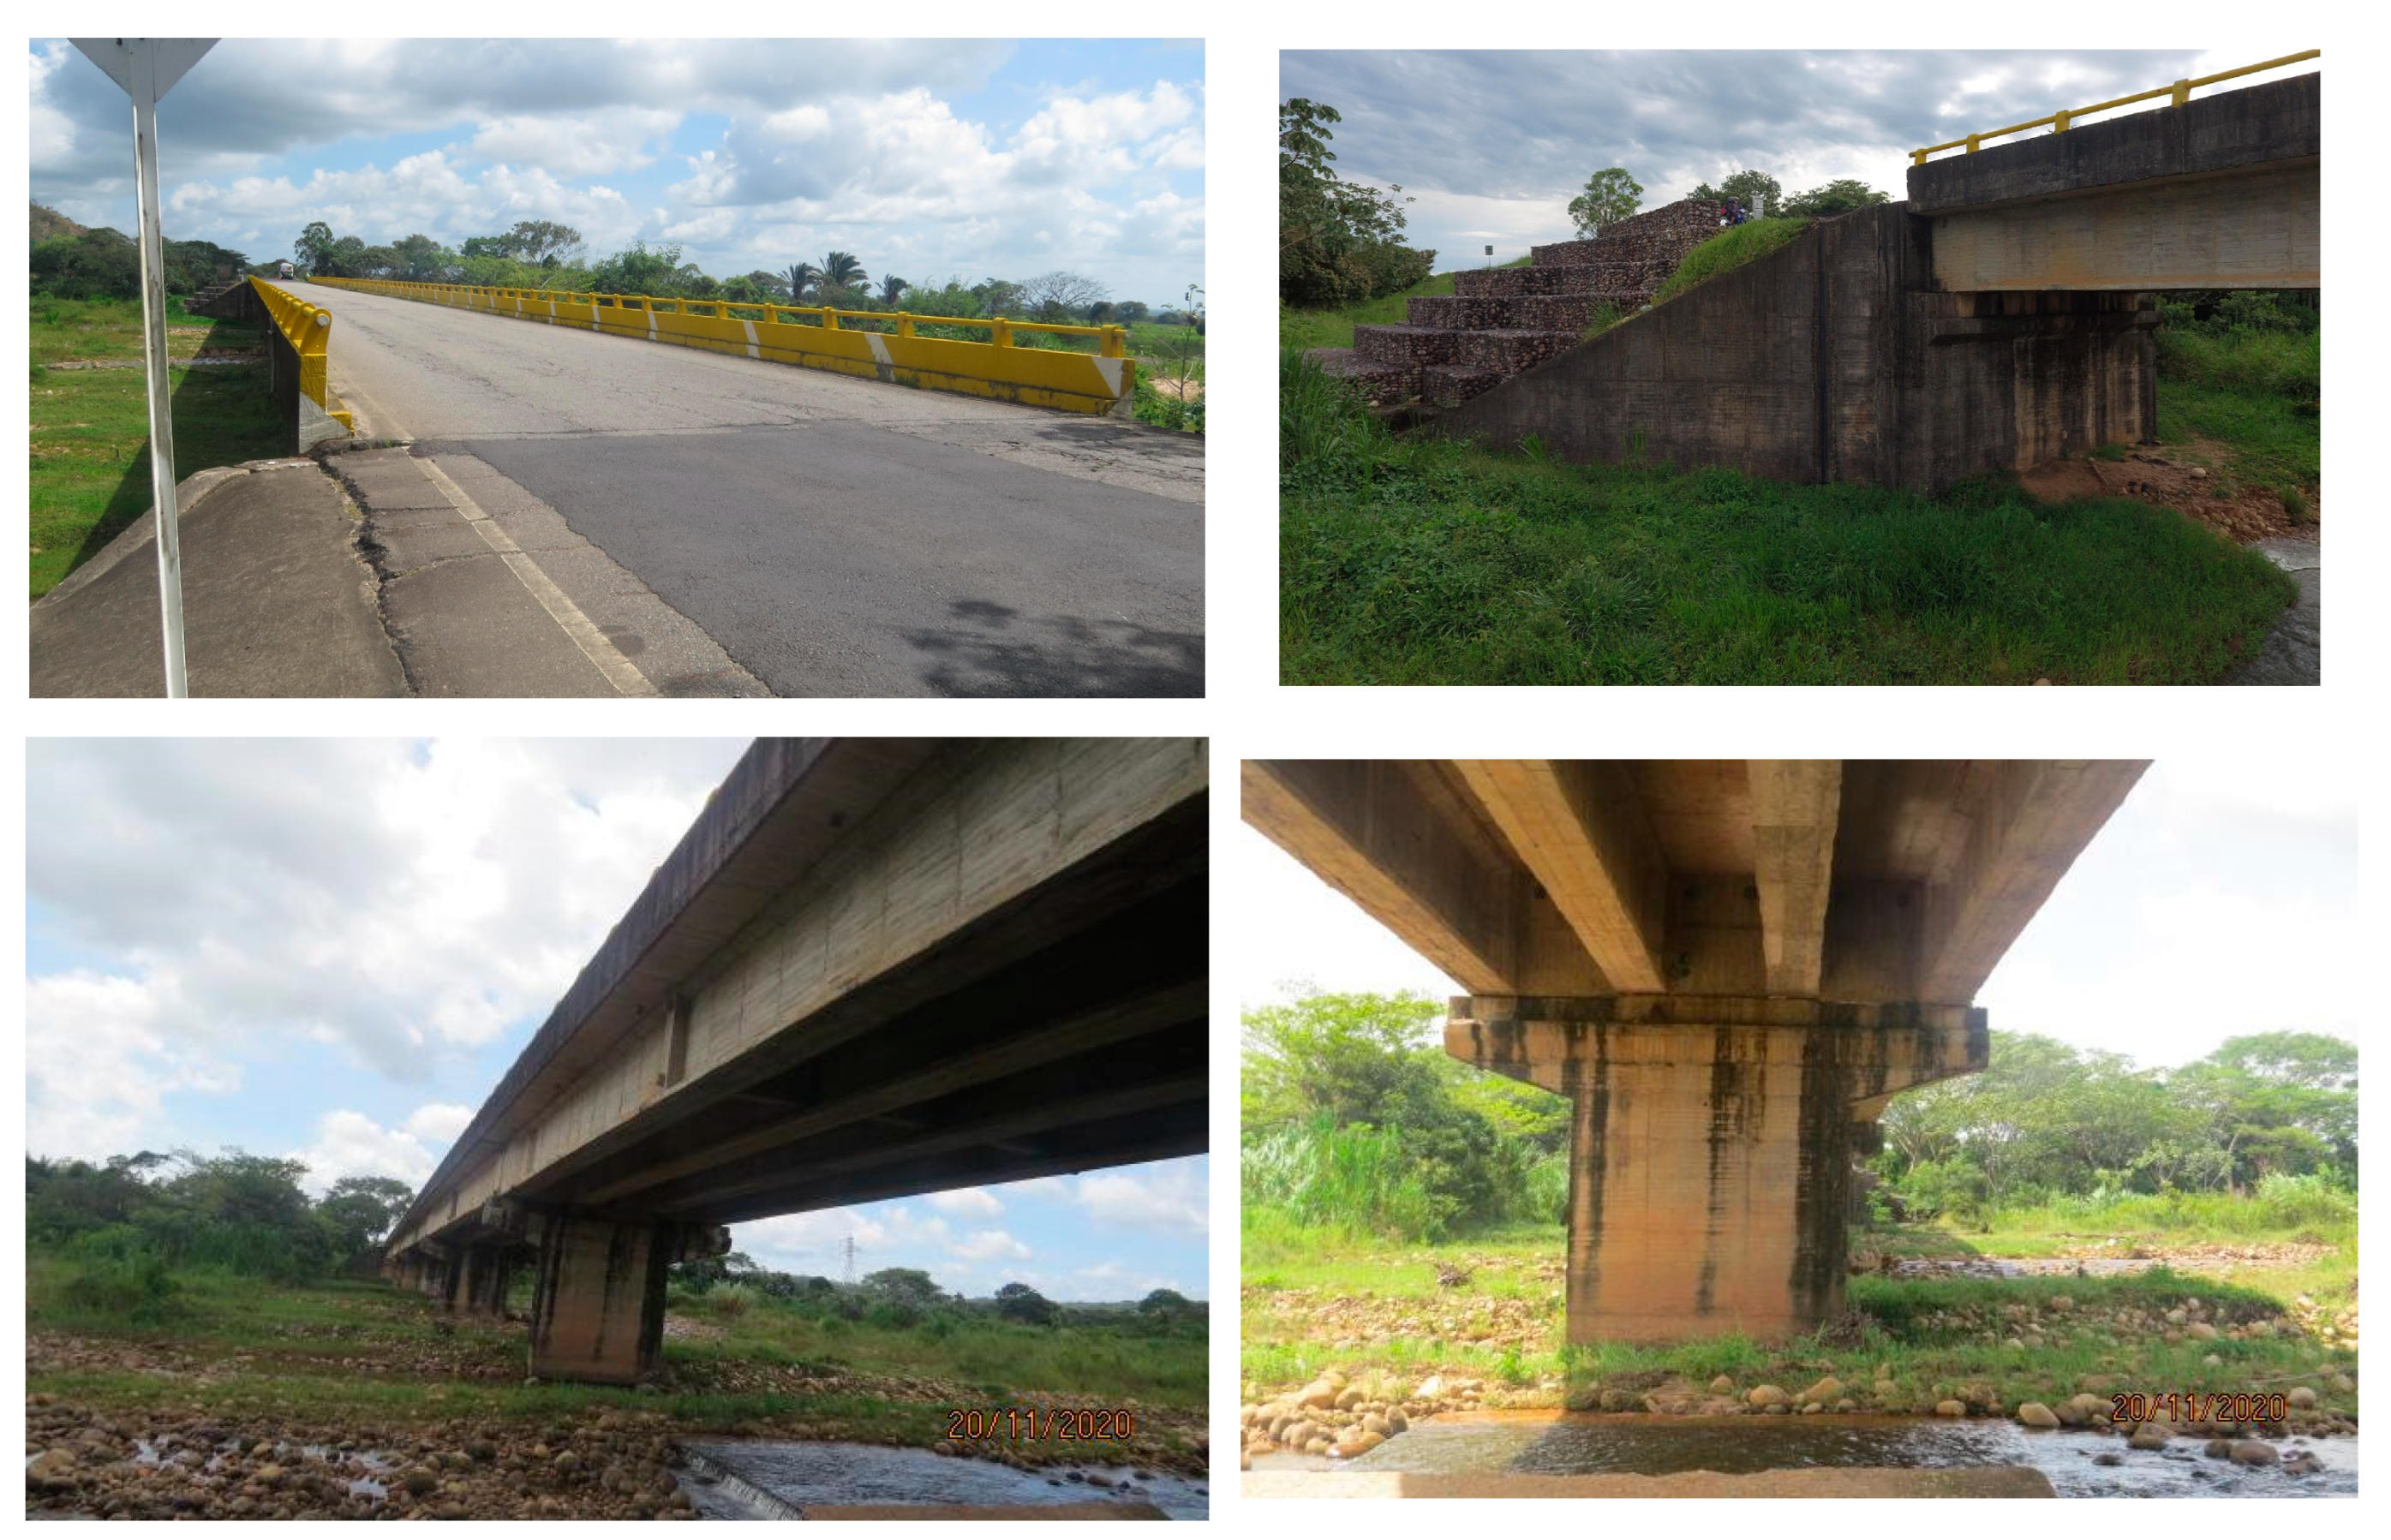
The Guacharía Bridge and the Chichaca Bridge, of which geometric and typological information was taken from the inventory module, are presented as two examples of the application of the methodology. The Guacharía Bridge is located on the Paz de Ariporo highway in Yopal, Casanare, Colombia. The bridge was built in the 1970s, and its typology includes five simply supported spans, consisting of a deck and slab in prestressed concrete. It has four reinforced concrete piers of the wall type with header beams and two abutments, also of reinforced concrete, with shallow foundations (see
Figure 9).
Visual inspection tasks were performed using the application developed for this module (stage 3), and
Figure 10 summarizes the results of the inspection. The main pathologies of each component were identified based on the damage catalog (
Figure 3). In addition, multiple unconnected cracks greater than 12 mm in width and cracks with an opening greater than 3 mm were identified on the tread surface of the flexible pavement. The extensive detachment of fine and coarse aggregate was also noted, with separations of less than 0.05 m, resulting in a very rough surface with loose aggregate. In terms of road safety, the bridge has the required retroreflective studs along its entire length. Regarding the expansion joints, 40–60% of the joint is loose or with loss of sealing; and there are relative movements between the elements that make it up between 1.5 cm and 2 cm. Also, 40–60% of the length of the joints show infiltration. As far as the sign road is concerned, the reduction in operating speed is less than 10 km/h. The curbs have crack widths of less than 0.1 mm, indicating that they are non-structural, and less than 0.25 m
2 of the concrete has concrete jams and/or exposed steel with no signs of corrosion. There are no sidewalks inside the bridge that would adequately support pedestrian and bicycle traffic (which must travel on the roadway), and there is no lighting. The handrails are mixed, and there are cracks greater than 0.6 mm wide, indicating high stresses and a problem with load bearing capacity. For the concrete parts, there are cracks between 0.2 and 0.4 mm thick, indicating high stresses and partial structural and geometric resistance to impact. For the steel parts, there is a loss of steel section due to corrosion.
Finally, the concrete is partially carbonated with no loss of any portion of the main reinforcing steel. Therefore, 80% to 90% of the surface of the element, with partial loss of section, and road safety conditions would not be met. In addition, erosion is evident at the base of the abutment access slope, with a height of between 30 and 40% of the total height of the slope, where it coincides with the bank of the riverbed. Crack widths greater than 0.5 cm were found in the fins and abutments, indicating high stresses and a problem with their bearing capacity. Between 40 and 50% of the fin area is affected. On the other hand, crack widths greater than 5 mm were detected in the slab, indicating high stresses and a problem with its bearing capacity.
As for the metallic structure, there is an inadequate connection due to the absence of 20 to 30% of the anchors and/or screws, accompanied by intermediate levels of corrosion. In the girders, the stiffeners in the bearing area were found to be buckled and affected by corrosion. In the supports, a deterioration between 60 and 100% was found, as well as between 0.3 m2 and 0.4 m2 of active moisture area, which affects their durability. Regarding torrential floods and scour, the width of the valley in the area of the bridge is reduced by more than 40%, resulting in an insufficient hydraulic area and possible collapse of the access embankment and flaps. More than 80% of the existing vertical signs are in poor condition. A summary of the results for this bridge is presented below. In addition, a qualitative description of the main results of the visual inspection of each component of this bridge is given. Regarding the slope, there is no evidence of erosion at the foot of the slope of the abutment where it coincides with the bank of the riverbed. The abutment fin has a rotation between 0 and 2° with its longitudinal or transverse axis. The bridge is located in a high seismic hazard zone, and it is a bridge with two or more spans, but the abutments and piers do not have seismic stops. The supports have 5–15% contact with the leveling bed or concrete surface on the abutment or pier. There is also a 20–40% deterioration of the neoprene support.
The slab has crack widths between 0.1 mm and 0.2 mm, indicating that they are not structural. They may be related to curing shrinkage or some other aspect of the construction. It has an area of less than 0.2 m
2 of active moisture, which affects its durability, especially in the area of the drains. In addition, the beams are in good condition, and there are no major scour problems.
Table 4 summarizes the evaluation results for this bridge.
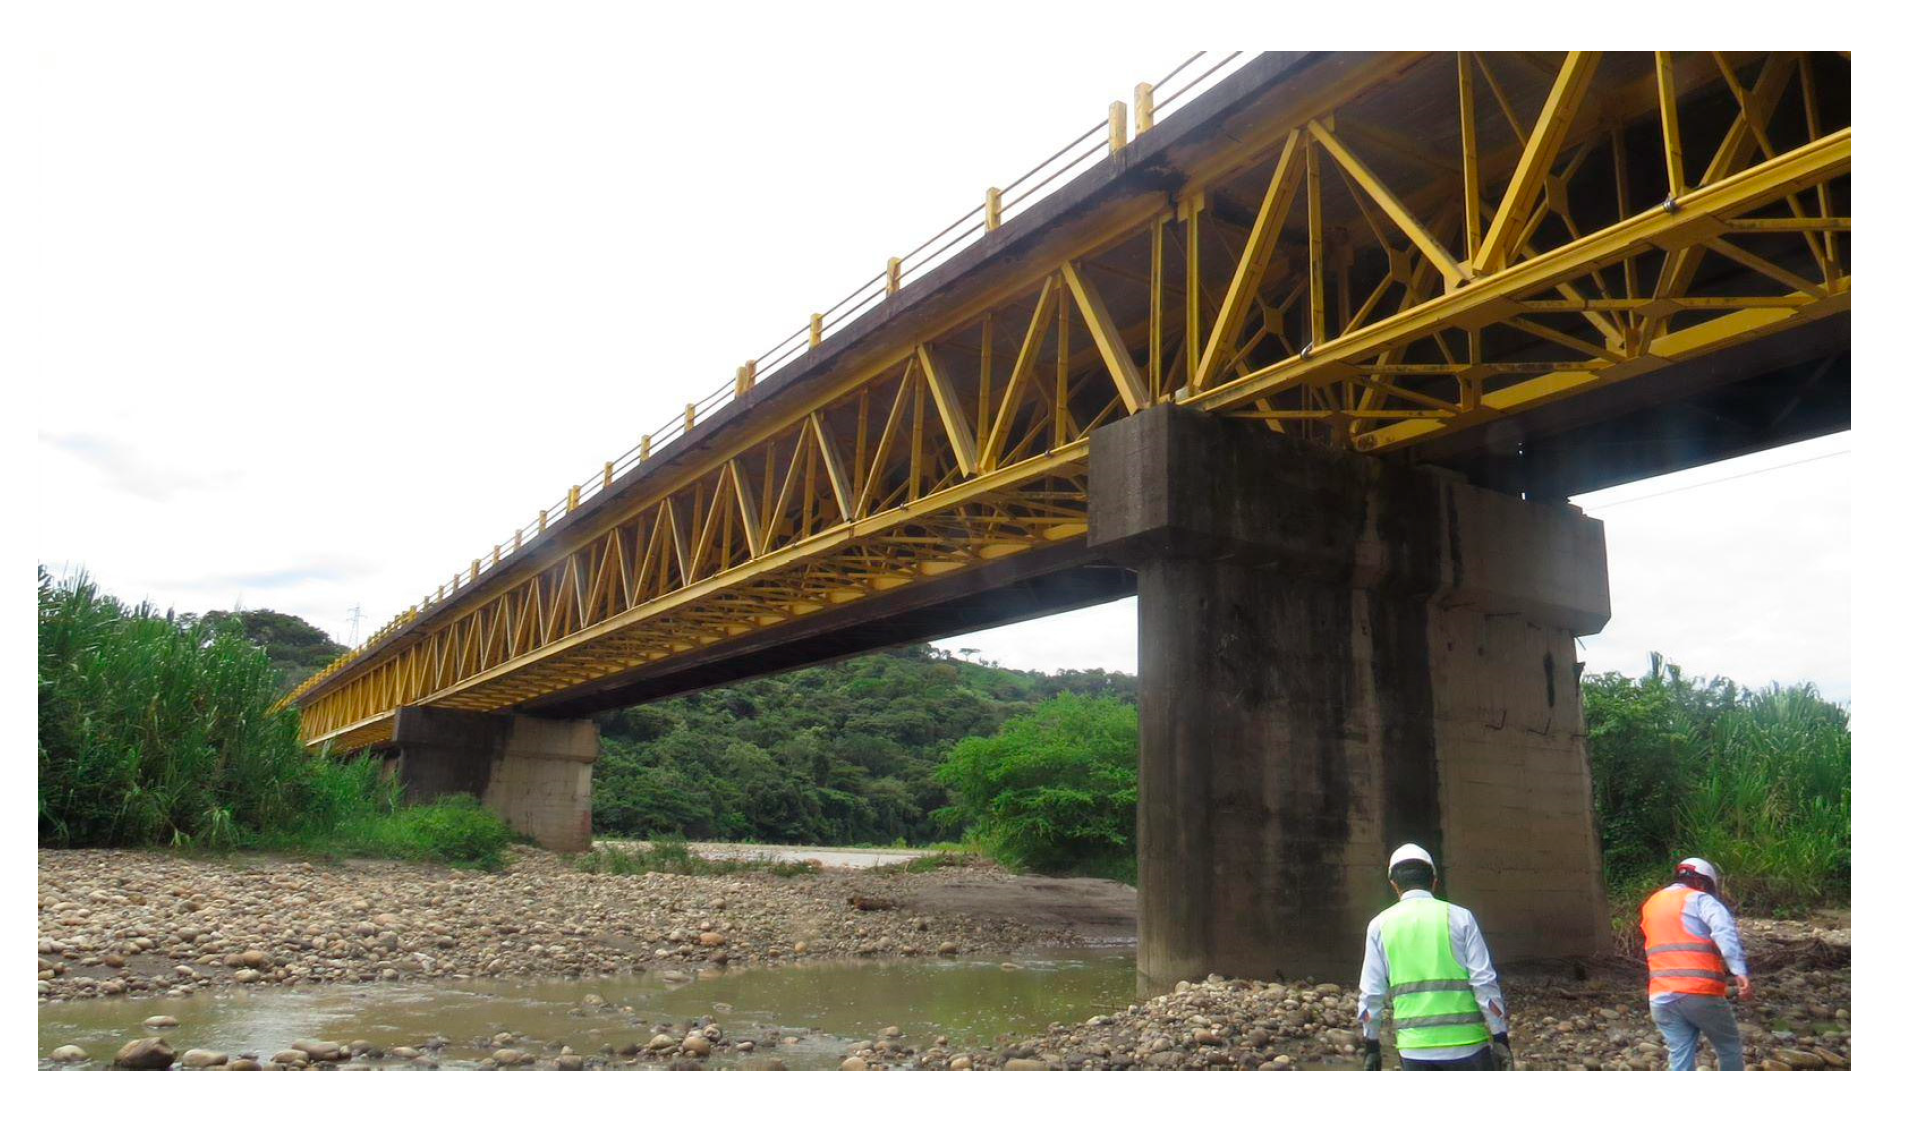
The Chichaca Bridge, which is the second bridge, also belongs to the Casanare area and is located on the Yopal-Paz de Ariporo highway in Colombia (Stage 1). The typology of the bridge consists of a simply supported span, composed of a steel beam deck and a reinforced concrete slab. It also has two reinforced concrete abutments with shallow foundations (
Figure 11).
The fieldwork was also conducted using the app developed for this module (stage 3).
Figure 12 summarizes these results (stages 4, 5, and 6). The main pathologies of each component were identified based on the damage catalog (
Figure 3).
It was found that 25% of the deck and access areas of the pavement were affected, including continuous loss. There is a high degree of aggregate detachment, with separations between 0.05 and 0.15 m. There is evidence of the poor functional condition of the pavement, with potholes of high severity. In turn, more than 60% of the length of the expansion joints is affected by the impact. Between 40 and 60% of the length of the joints show infiltration, and the curbs show crack widths greater than 0.6 mm, indicating high stresses and a problem in their load bearing capacity. In addition, the railing post anchorage was found to be compromised, which may affect its strength.
For this bridge, a qualitative description of the main results of the visual inspection of the components of this bridge is also provided. The bridge does not have sidewalks for non-motorized traffic (pedestrians and cyclists), so they are forced to travel on the roadway. There is a loss of steel section in the railings due to severe corrosion. There are no adequate expansion joints. There are generalized corrosion problems in the main steel elements such as the main side girders, secondary cross girders, connections, and supports. The buckling of some stiffeners of the main lateral girders was also observed, as well as insufficient hydraulic area of the bridge and stability problems of the retaining wall of the access embankment.
Table 5 summarizes the evaluation results for Chichaca bridge.
In the two application examples, it was found that the first bridge has a “critical” condition index and that its problem is mainly related to the non-compliance with the seismic vulnerability issue by not having seismic buffers and that this structure is located in a high seismic hazard zone. It has problems mainly in the areas of stability and road safety. The second bridge has a condition index of “susceptible to partial or total failure” related to the service life (more than 50 years) because it has problems in the three (3) evaluation areas, mainly in the area of scour and torrential flooding. In addition, there are problems with fatigue, corrosion, and lack of load capacity.
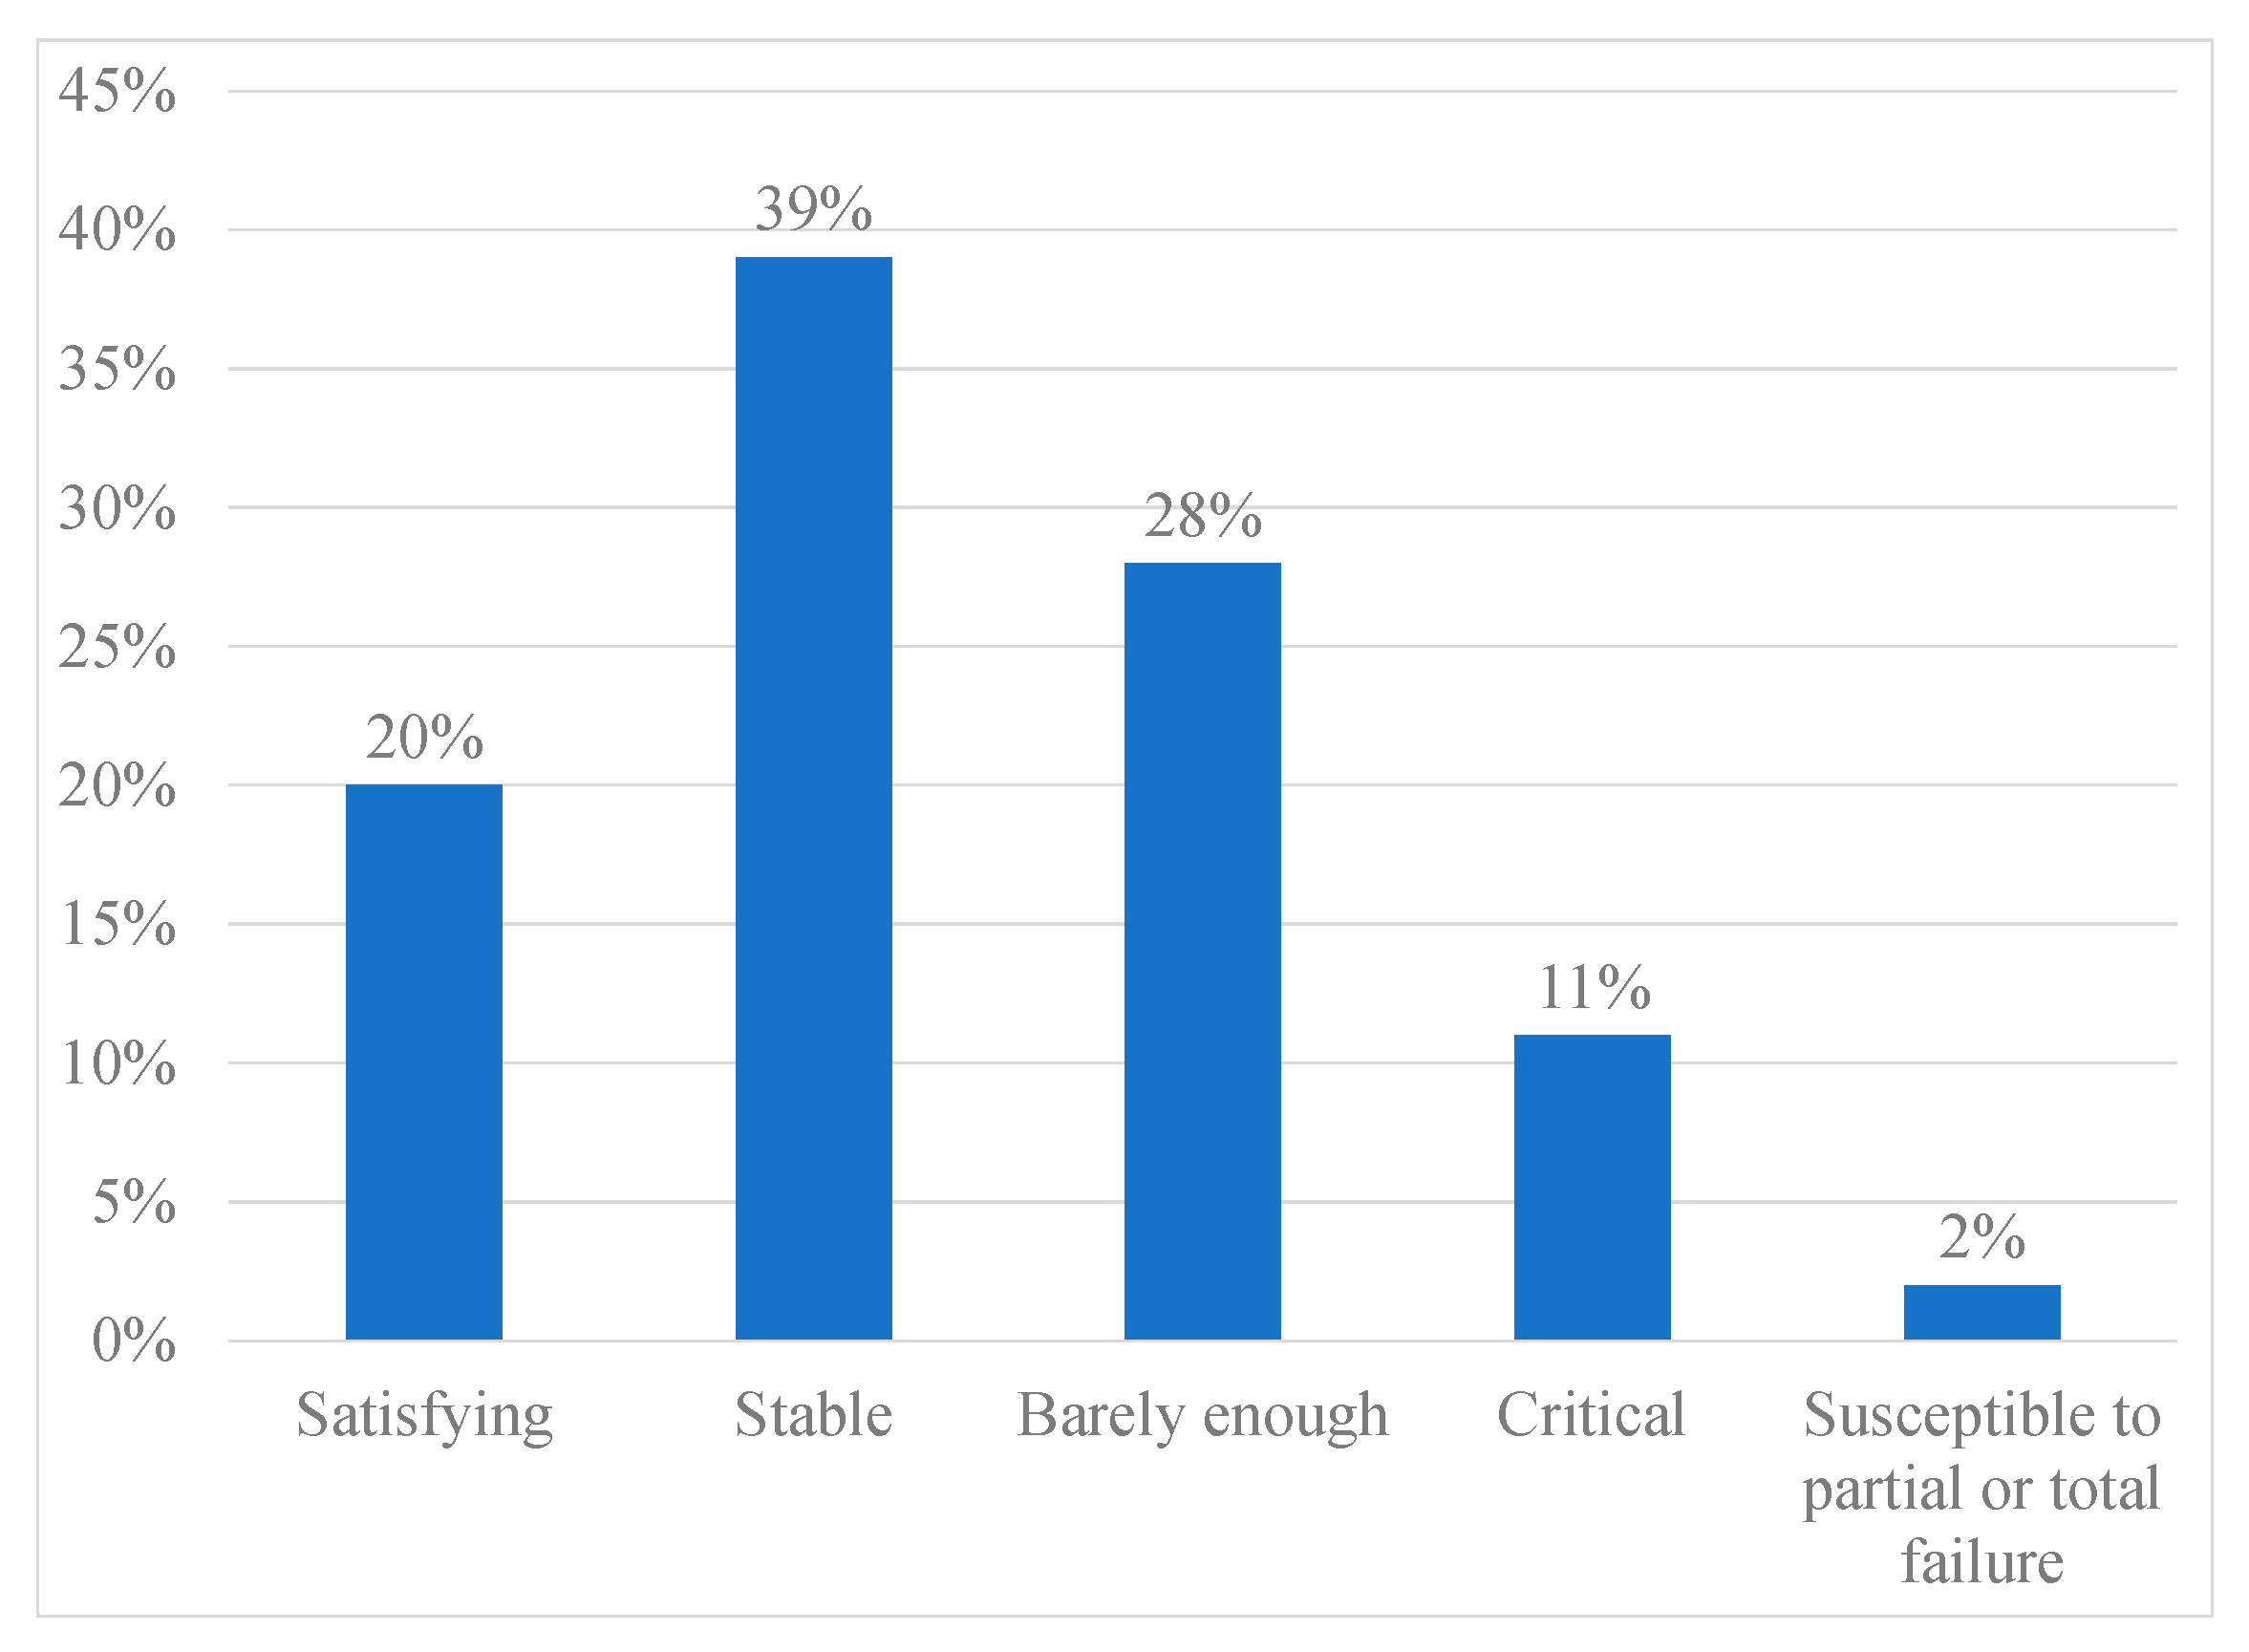
Figure 13 shows the results of the condition indexes of the 94 bridges that were part of the pilot selection, showing that only 2% are susceptible to partial or total failure and 11% are in critical condition.
Figure 14 also shows the overall weighted rating of these bridges for stability, durability, and road safety. According to these results, the ratings and, therefore, the identified damages of the bridges are higher for traffic safety than for durability and stability. And there are more relevant damages for durability than for stability.
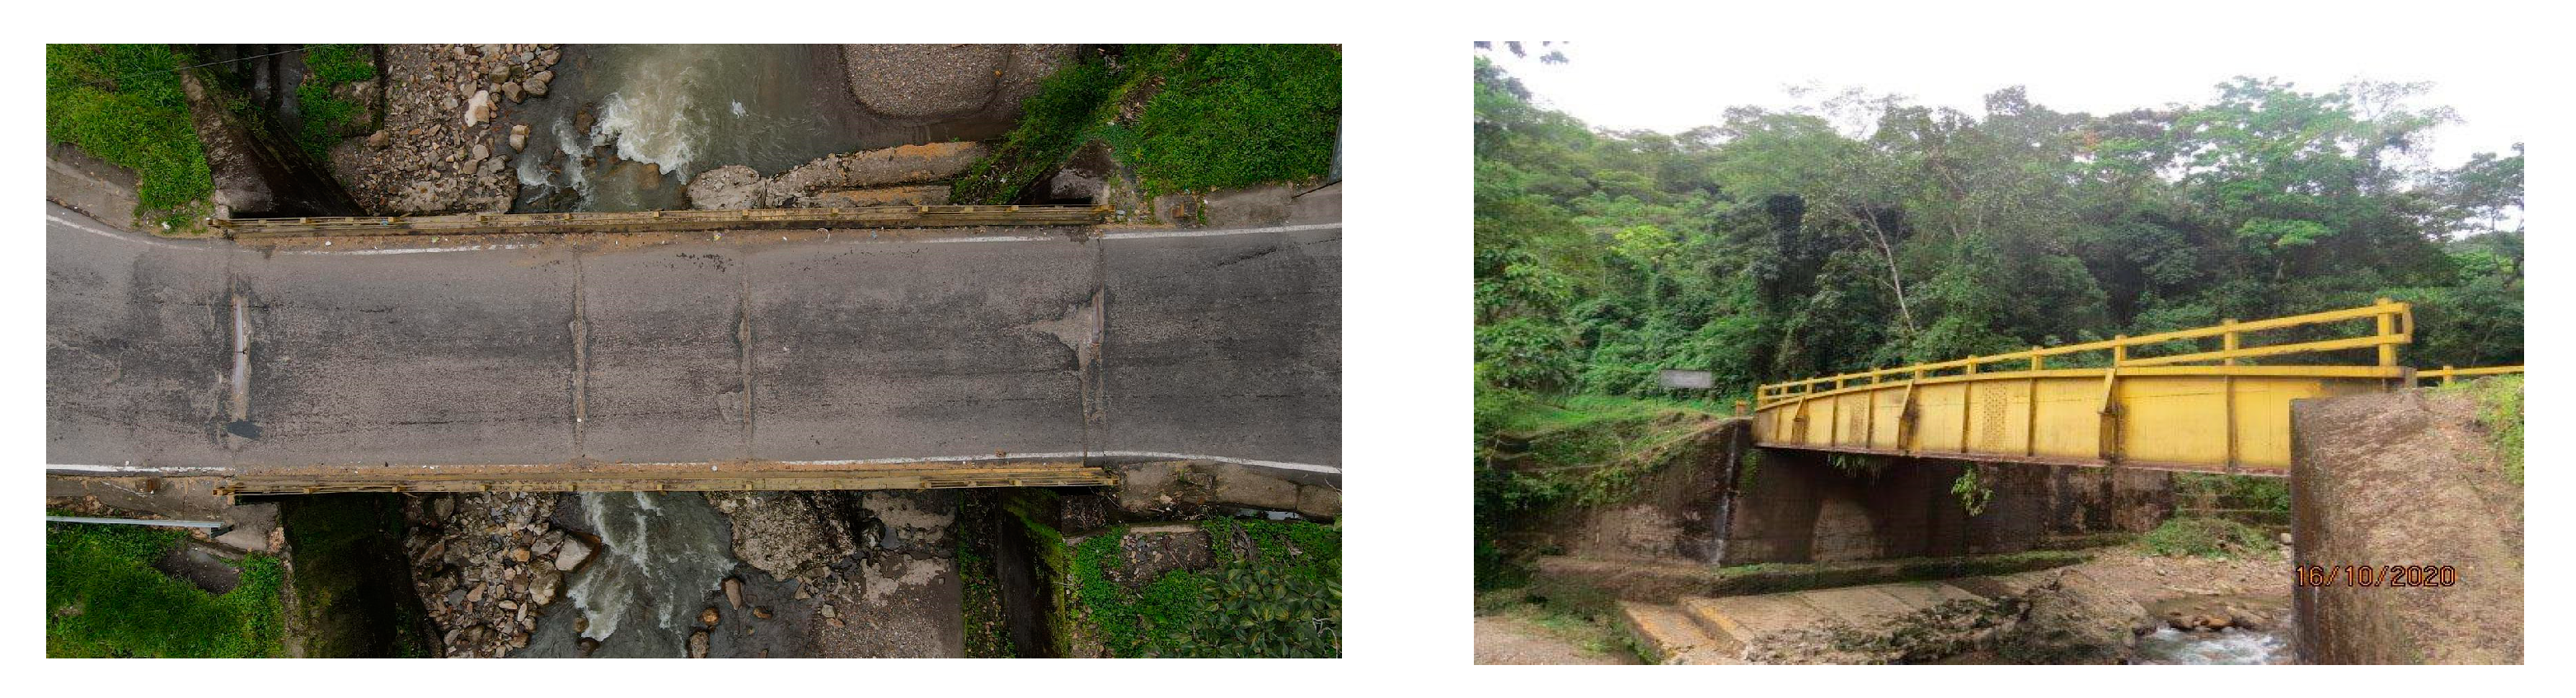
The findings led the Instituto Nacional de Vías to make the necessary temporary or permanent interventions to prevent the bridge from collapsing. As a result, traffic on the Ramón Nonato Pérez Bridge was restricted to one lane, as shown in
Figure 15, where the main finding was cracking in the welded joints of the truss bridge. This bridge has a combined typology because one lane is steel reinforced, and the other is a mixed steel–concrete section.
Figure 16,
Figure 17,
Figure 18,
Figure 19 and
Figure 20 graphically present the statistical results for the components of the five groups of the 94 bridges of the pilot section and each evaluation area. It also includes the presentation of the results using normal distribution probability curves of the ratings obtained for each of the components based on the mean and standard deviation.
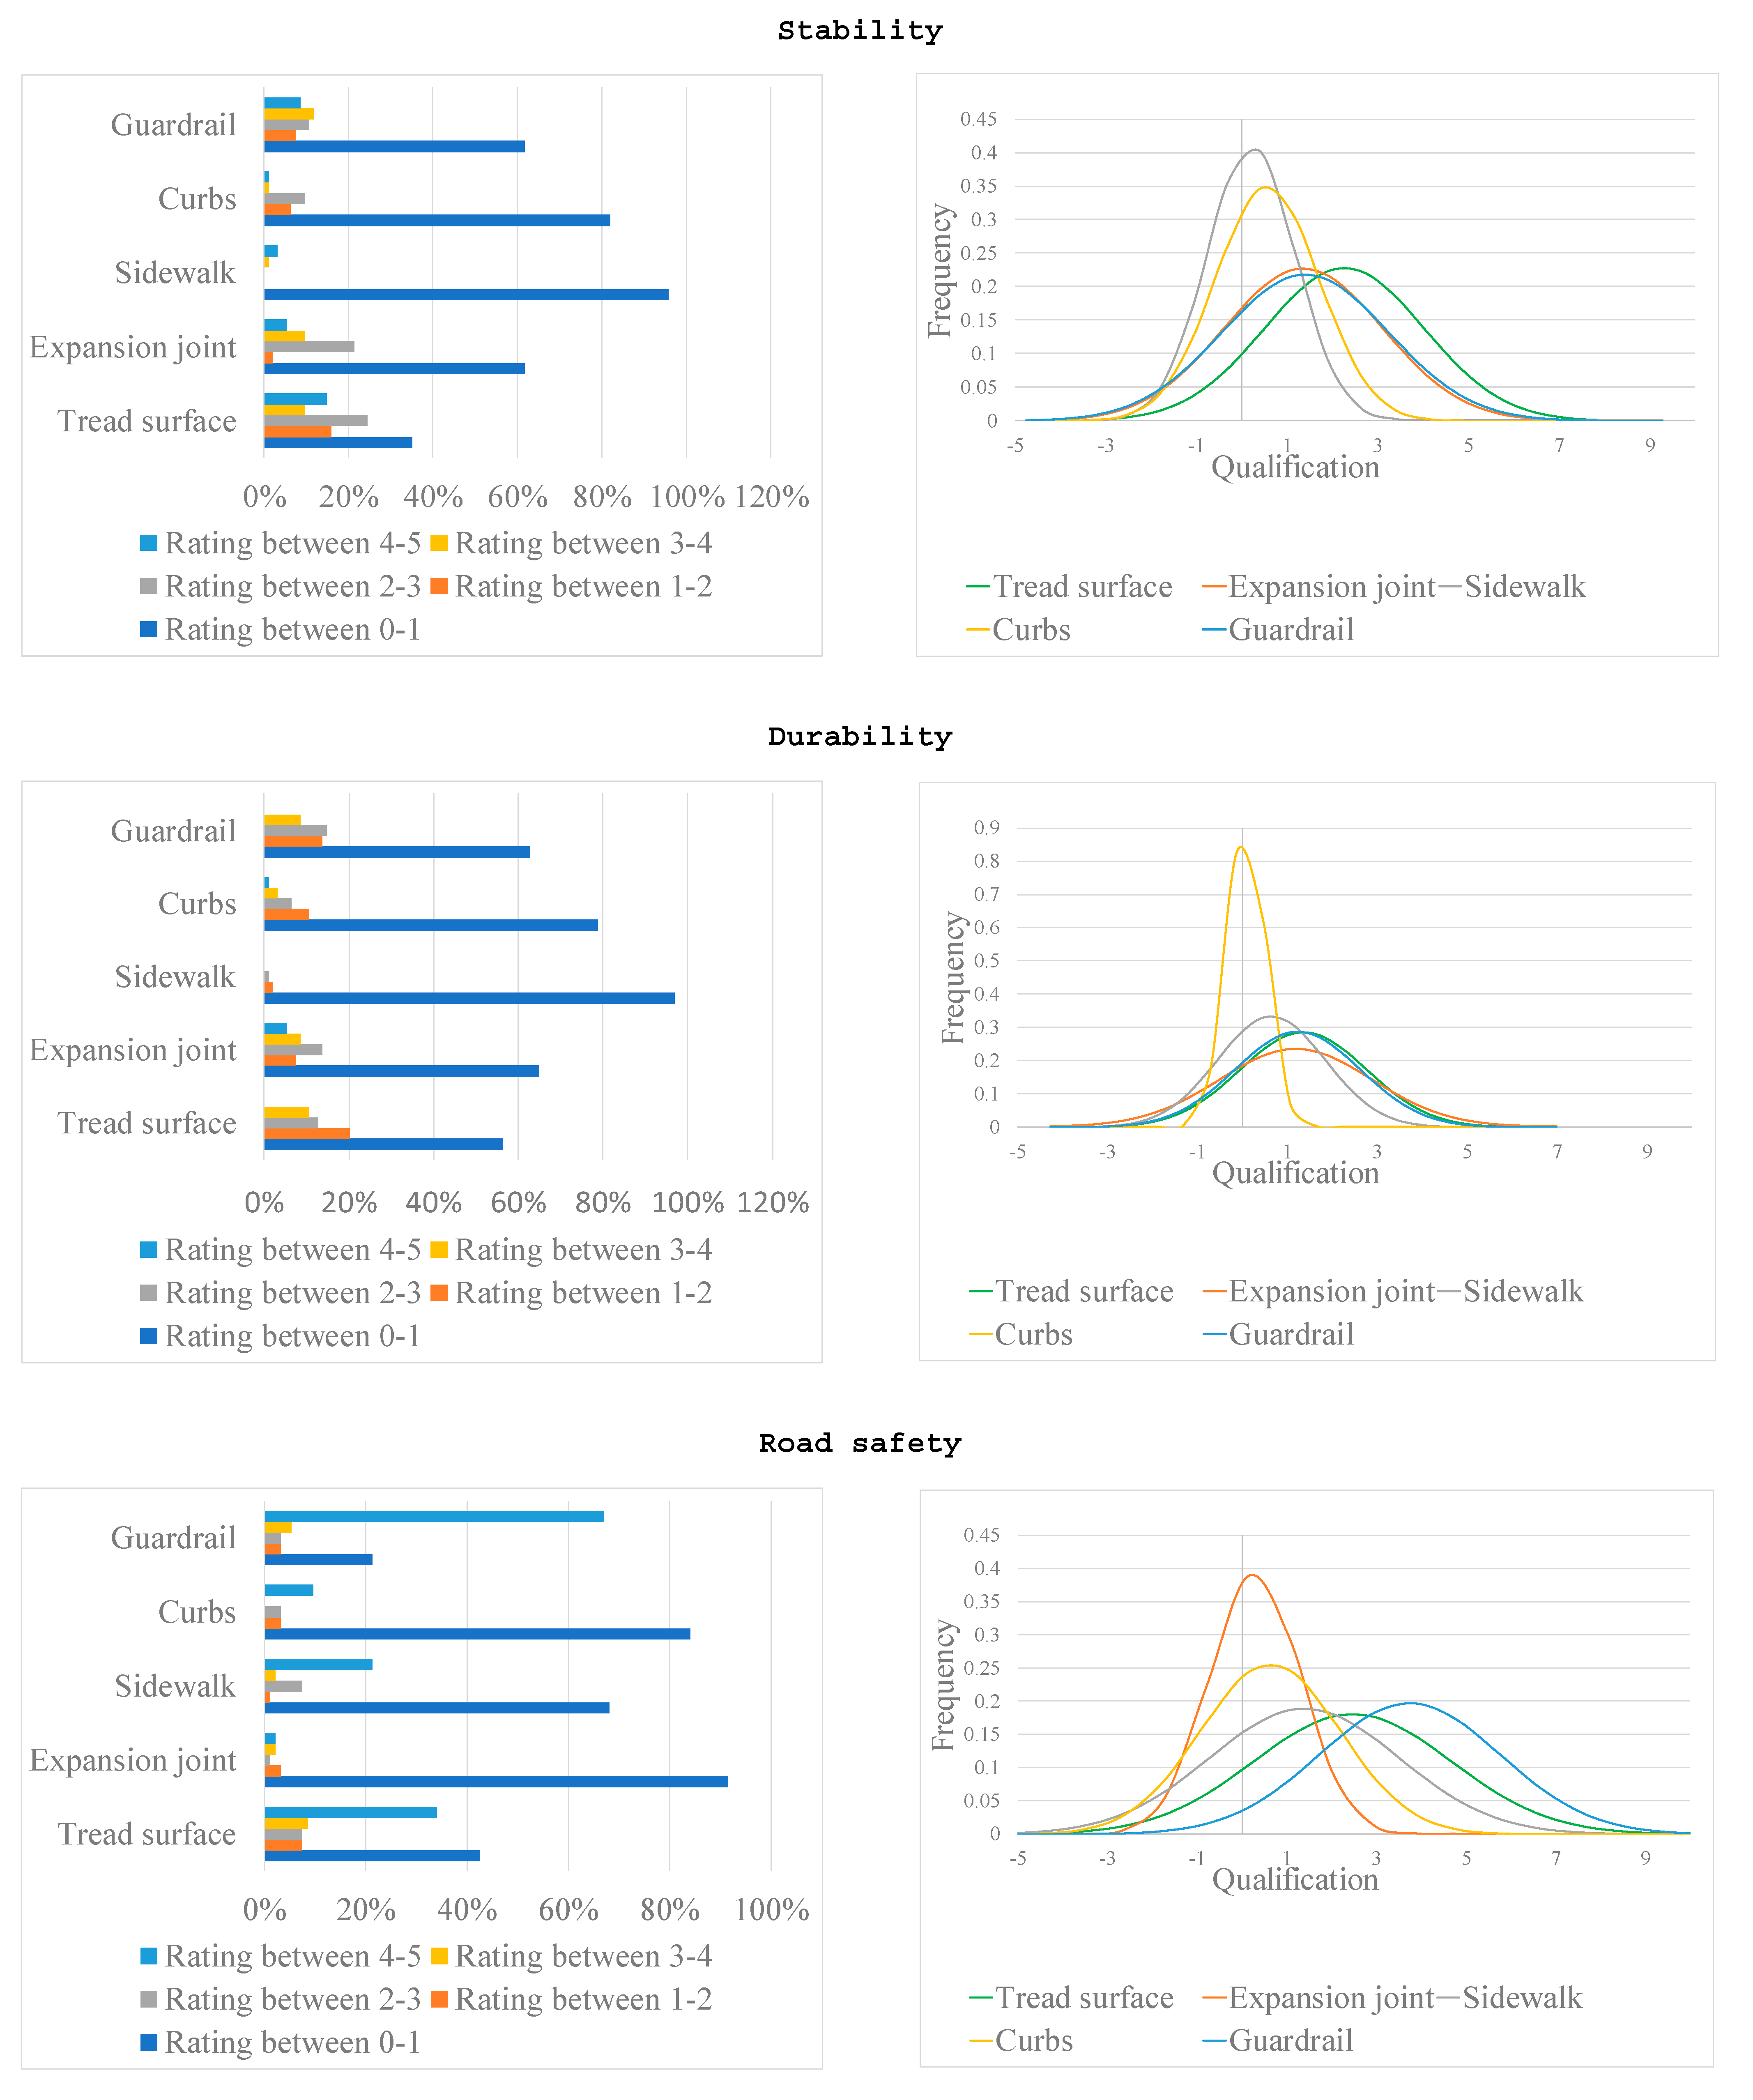
Figure 16 shows the results of the qualification of the severity levels in each evaluation area of the bridges of the pilot section, particularly the components that are part of the group of service elements. In the stability area, higher damage was observed in the guardrail and expansion joint components, with an “extreme” severity level of 9 and 5 percent, respectively. In addition, a severity level of “severe” was observed at 12 and 10 percent, respectively. From a probabilistic perspective, the average rating had the following order from highest to lowest: pavement, guardrails, expansion joints, sidewalk, and curbs. A higher standard deviation was found for guardrails and a lower one for sidewalks.
In terms of durability, the expansion joint and guardrail components were more severely damaged, with percentages of 14 percent and 9 percent, respectively, when the extreme and severe severity levels are combined. From a probabilistic perspective, the average rating followed a similar order to the stability area: pavement, guardrails, expansion joints, platforms, and curbs. A higher standard deviation was found for the pavement and a lower one for the sidewalk.
In the area of road safety, higher damage was detected in the guardrail, with a percentage of 67 percent at the “extreme” severity level, which represents a warning to make the appropriate corrections in the intervention tasks. From a probabilistic point of view, the average rating had the following order from highest to lowest in the area of road safety: guardrails, expansion joints, sidewalks, curbs, and expansion joints. A similar standard deviation was found for all components in this group.
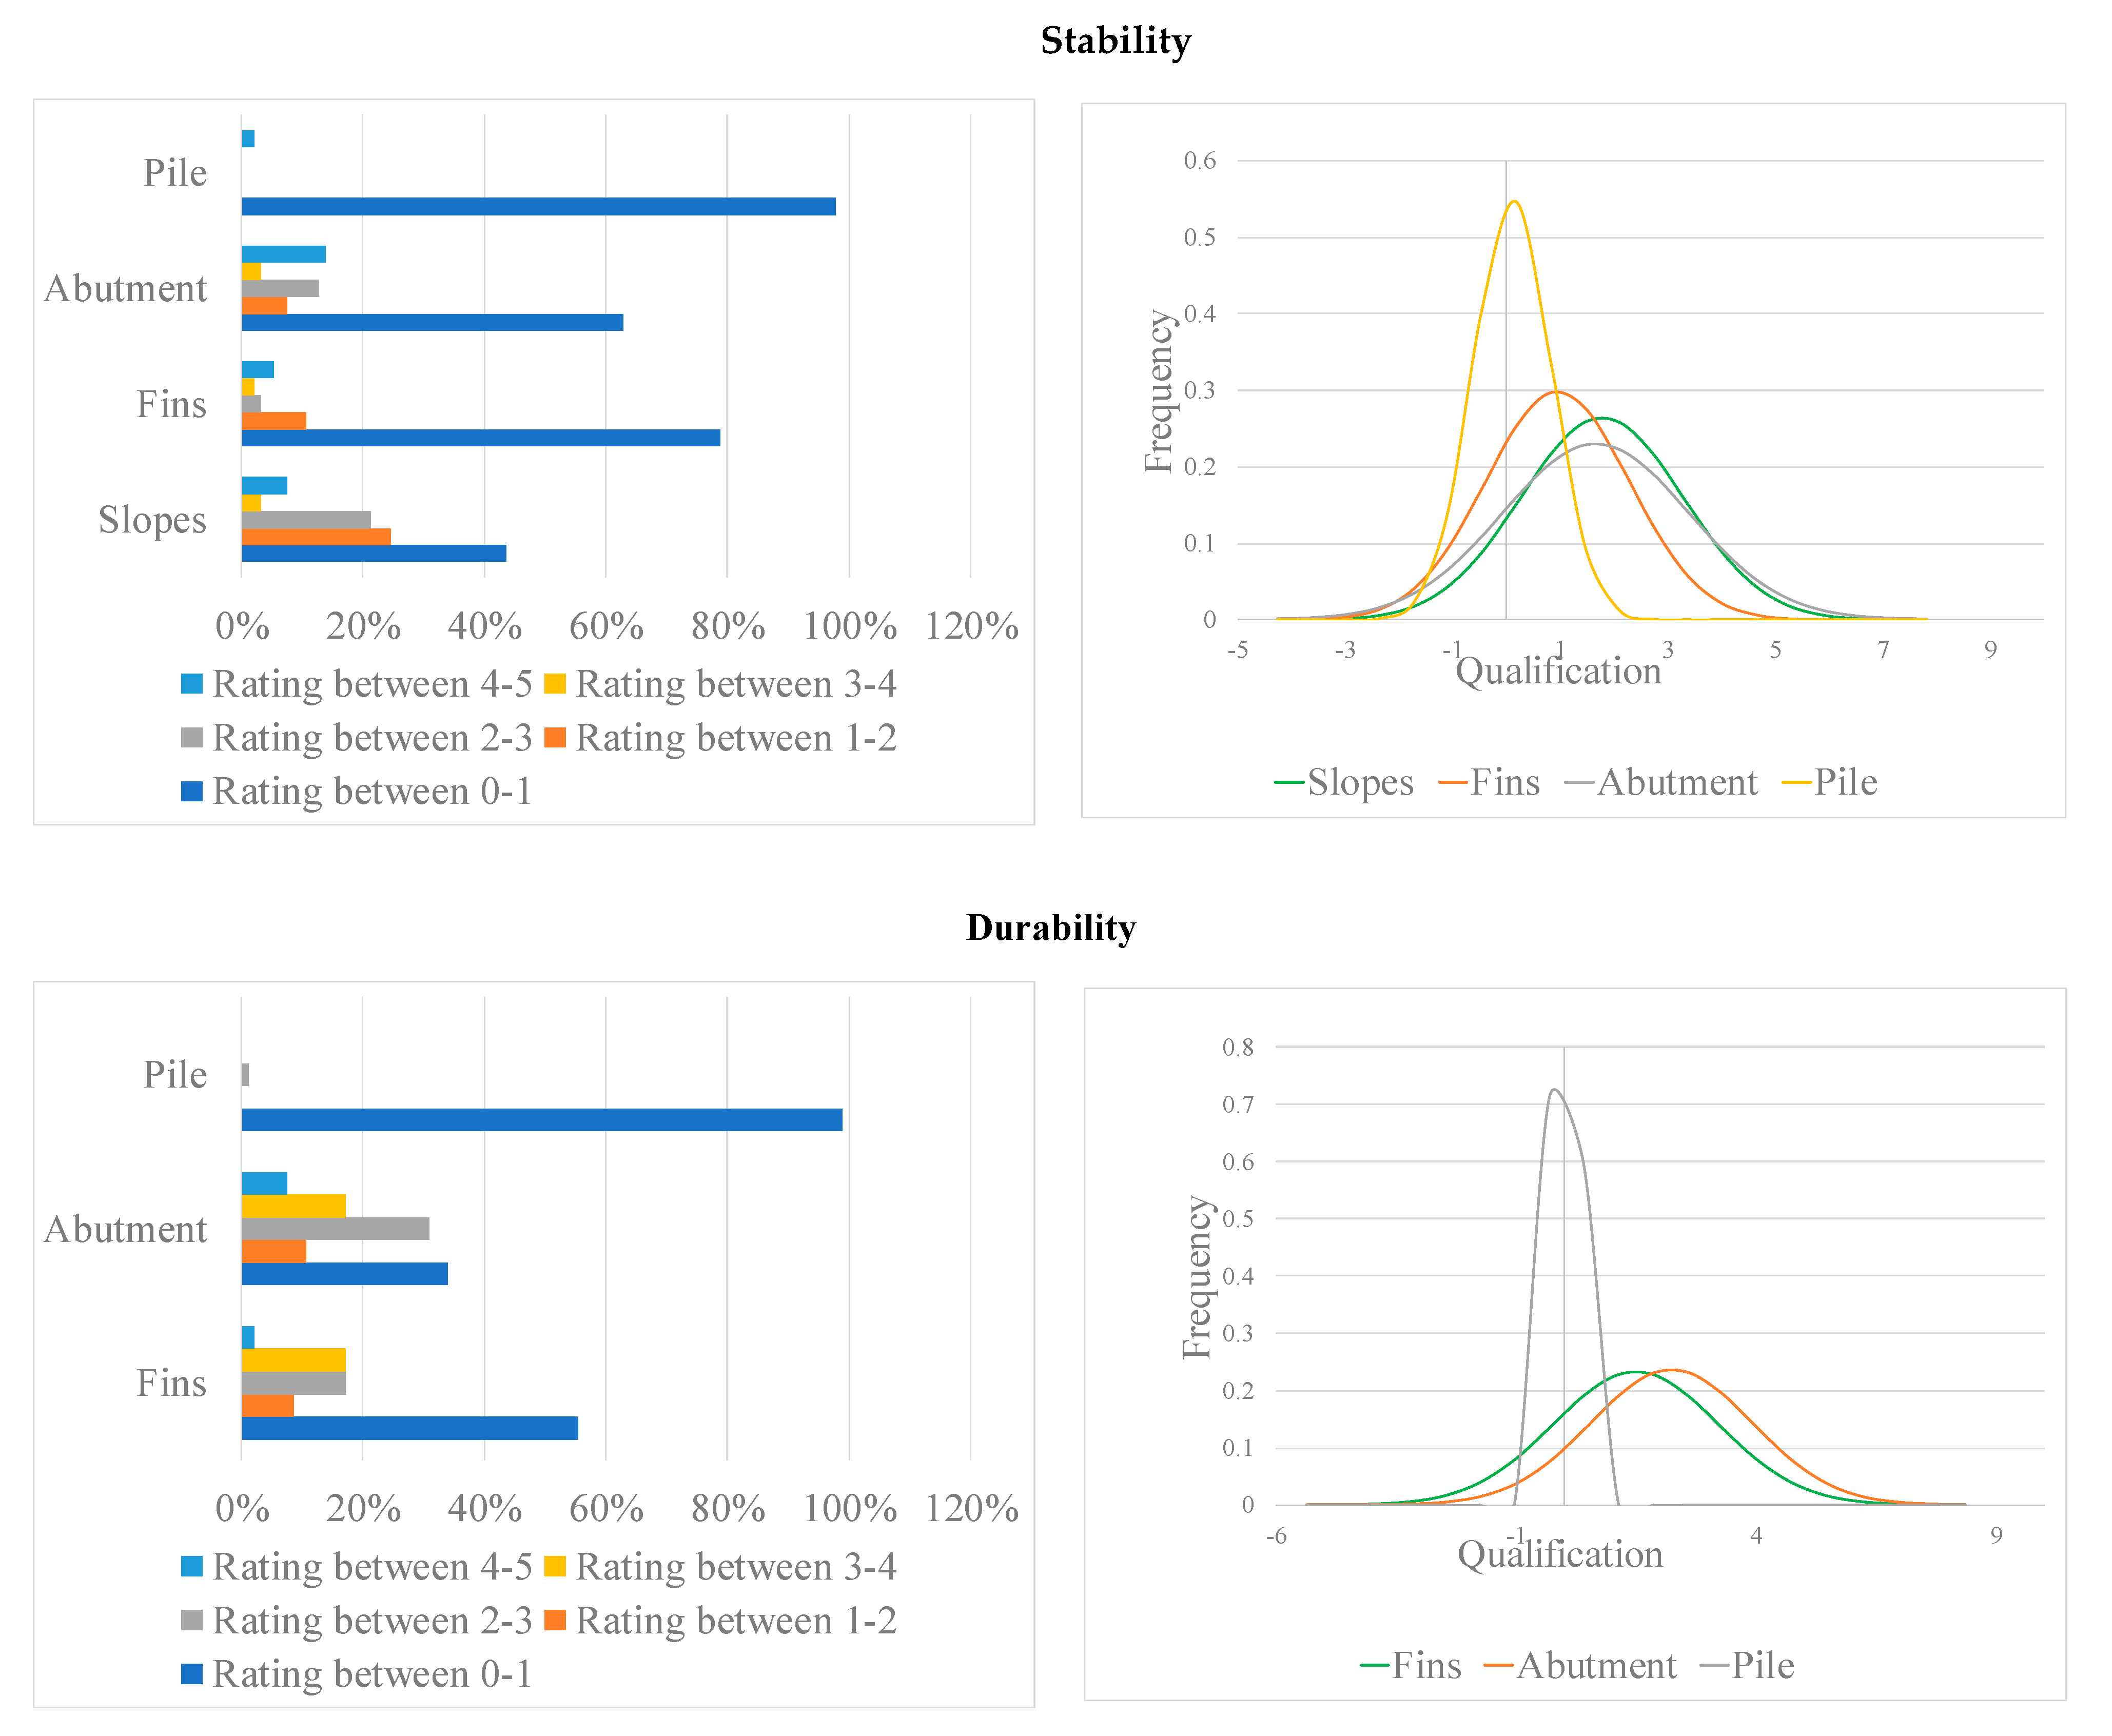
Figure 17 shows the results of the evaluation of the severity levels in each evaluation area of the components that are part of the substructure group. In the stability area, higher damage was observed in the abutments and slopes, with a percentage of 14 and 7 percent, respectively, at the “extreme” severity level. In addition, 3 percent damage was observed in these same components at the “severe” severity level. From a probabilistic perspective, the average rating had the following order from highest to lowest: slopes, abutments, fins, and piles. A higher standard deviation was found for abutments and a lower one for piles.
In terms of durability, the fins and abutments were found to have greater damage, with a percentage of 7 and 2 percent, respectively, at the “extreme” severity level. In addition, 17 percent damage was observed in the same components at the “severe” severity level. For this area, the average rating from a probabilistic perspective was as follows (from highest to lowest): abutments, fins, and piles. A higher standard deviation was found for the abutments and a lower one for the piles.
For the substructure elements, pathological damage was found in abutments, fins, and support devices related to infiltration and lack of minor maintenance. The lack of seismic buffers was also noted on most of the bridges in this pilot section.
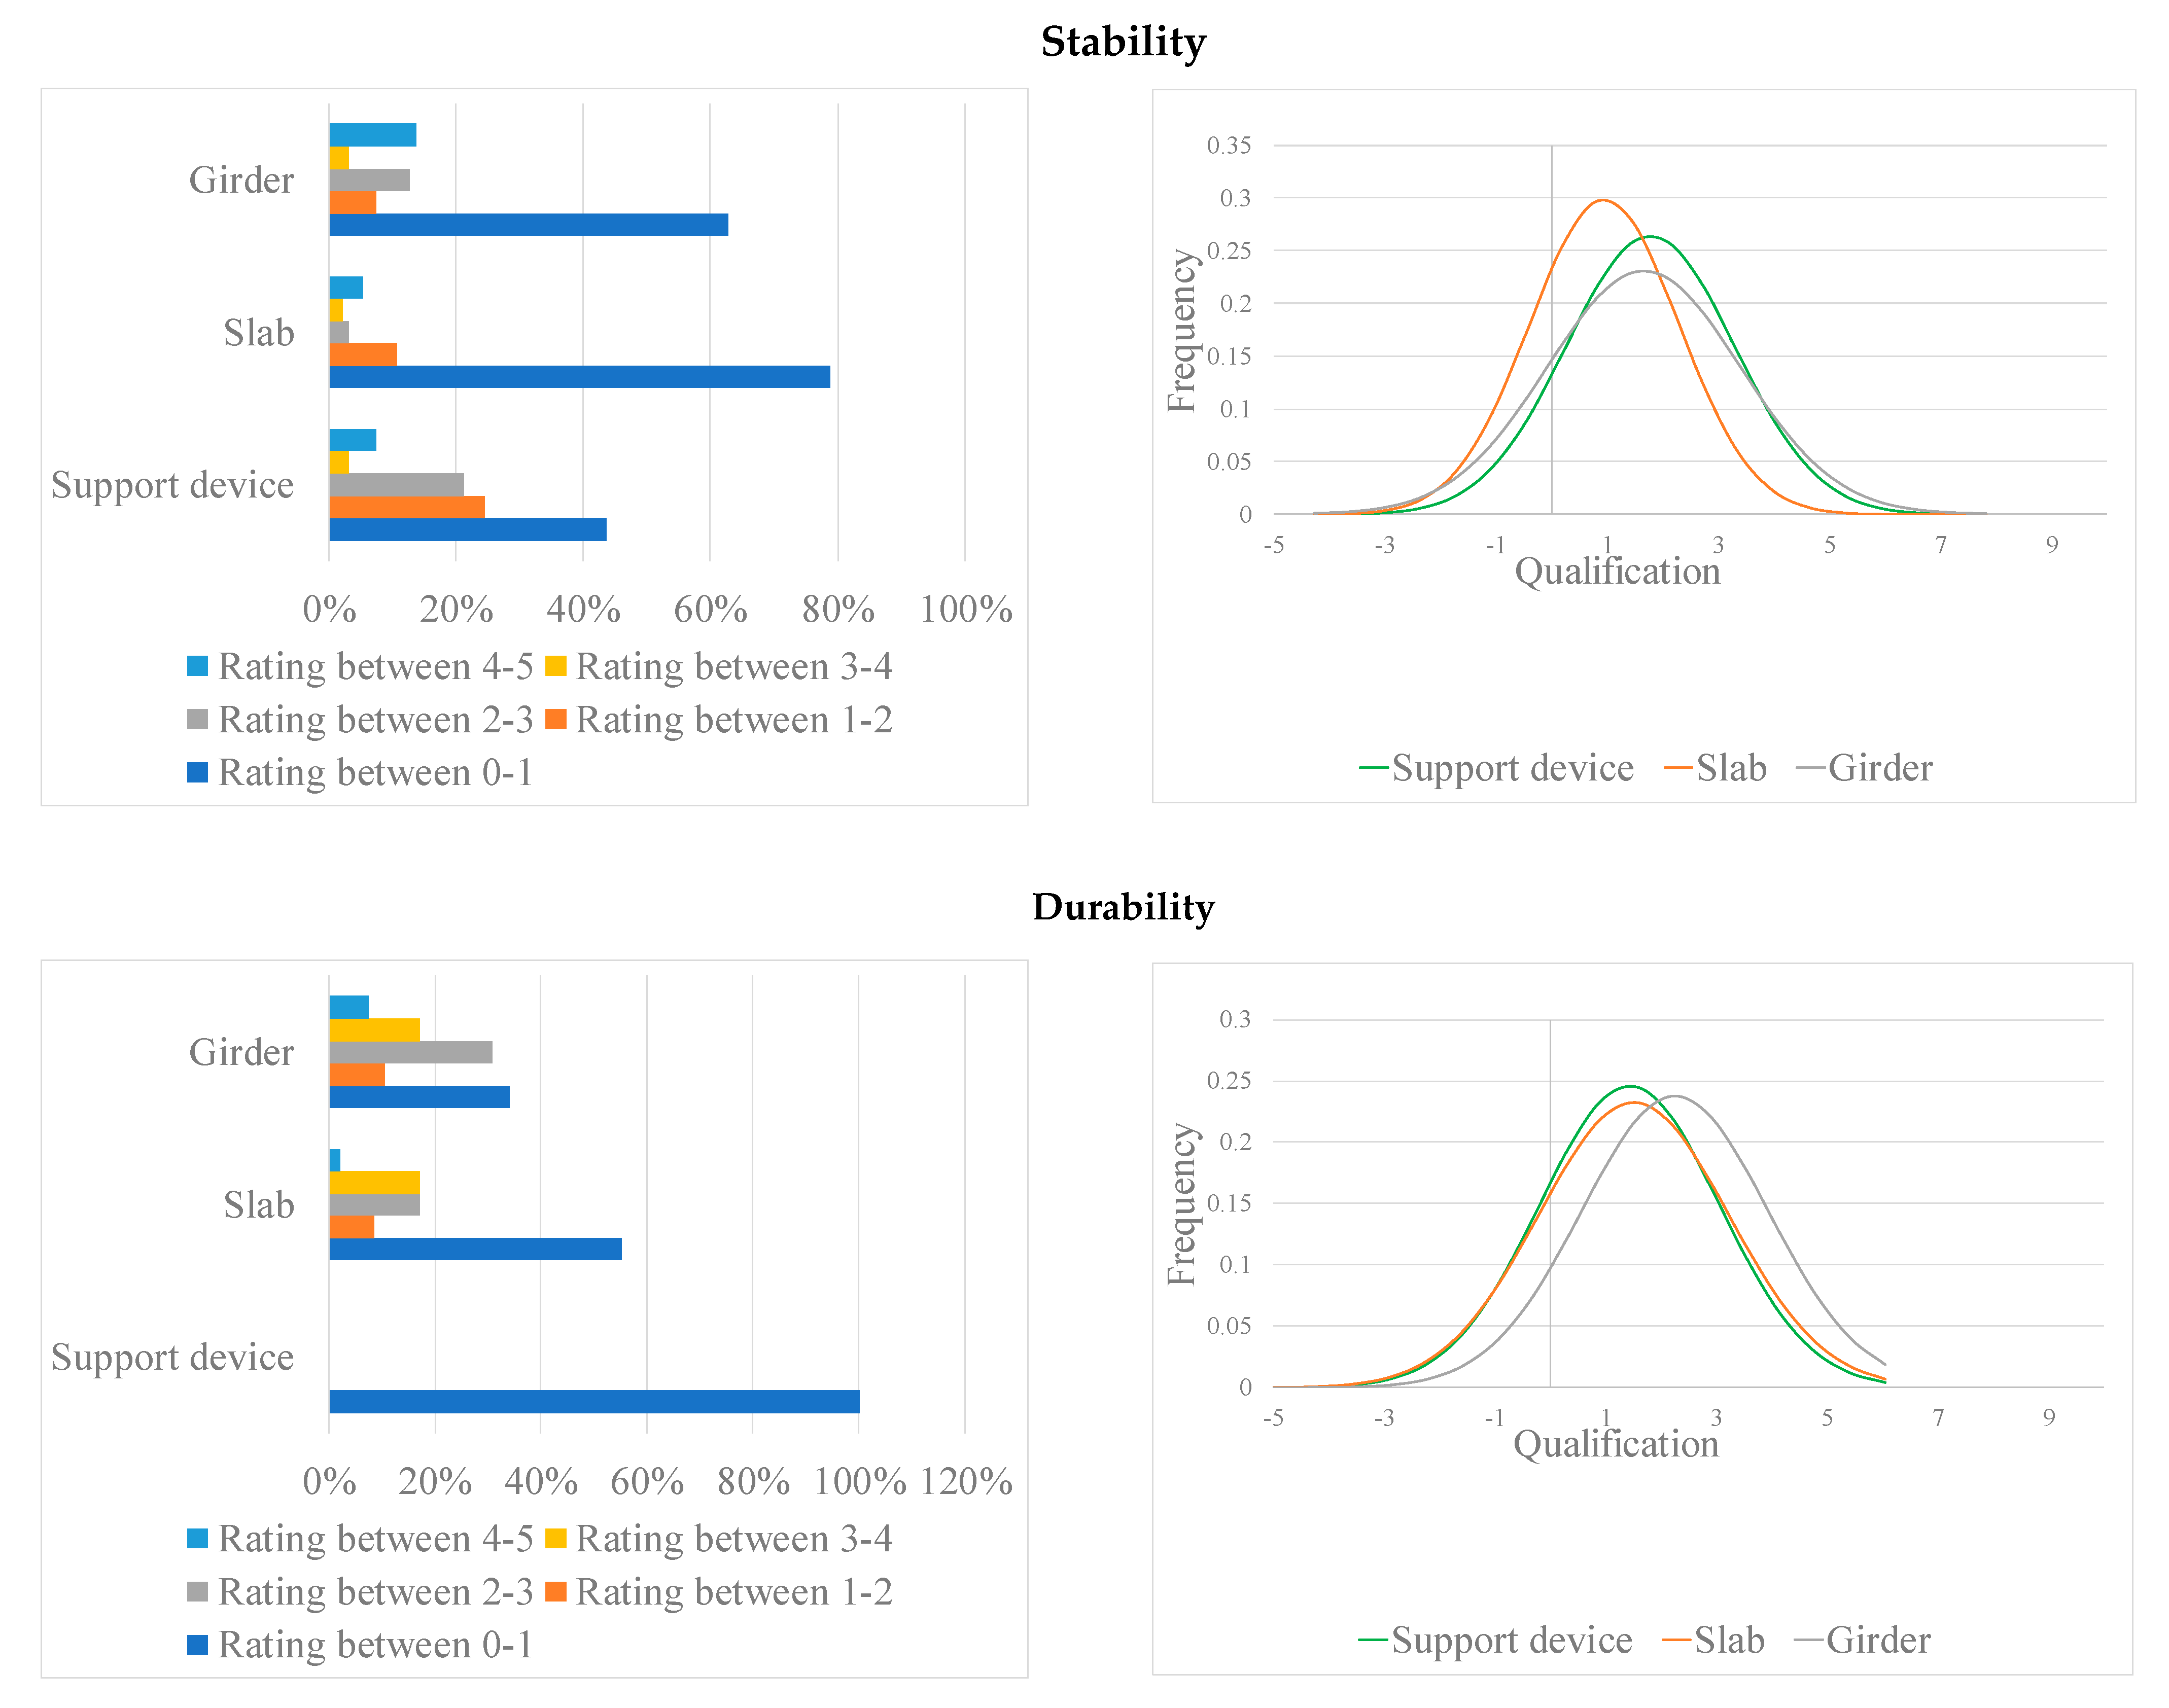
Figure 18 shows the severity evaluation results for each evaluation area of the components that are part of the superstructure group. In the stability area, higher damage was observed in the beam and support components, with a percentage of 15 and 7 percent, respectively, at the “extreme” severity level. In addition, 3 percent damage was observed in these same components at the “severe” severity level. From a probabilistic perspective, the average rating had the following order from highest to lowest carrier, beam, and plate. A higher standard deviation was found for the beams and a lower one for the slab.
In terms of durability, the beam and slab components had greater damage, with a percentage of 7 percent and 2 percent, respectively, at the “extreme” severity level. In addition, 16 percent damage was observed in the same components at the “severe” severity level. For this area, the average rating followed the order from highest to lowest from a probabilistic perspective: support, beam, and plate. A higher standard deviation was found in the beams and a lower one in the slab.
In the superstructure elements, damage related to infiltration was found in the slab drains, as well as some shear and/or flexural cracks in the reinforced concrete beams. In the steel reinforcement, there were problems of fatigue in joints and elements, generalized corrosion, and cracking in welded joints.
In the context of the environment,
Figure 19 illustrates that the severity levels in the stability domain, from highest to lowest, are as follows: torrential flooding, landslides, and scour. In the environmental group, damage due to scour and torrential flooding was found in the foundations of fins, abutments, and piers, as most of these bridges were not designed to avoid this risk. Some bridges were also found to have problems with landslides or mass movements on the slopes near and parallel to these structures.
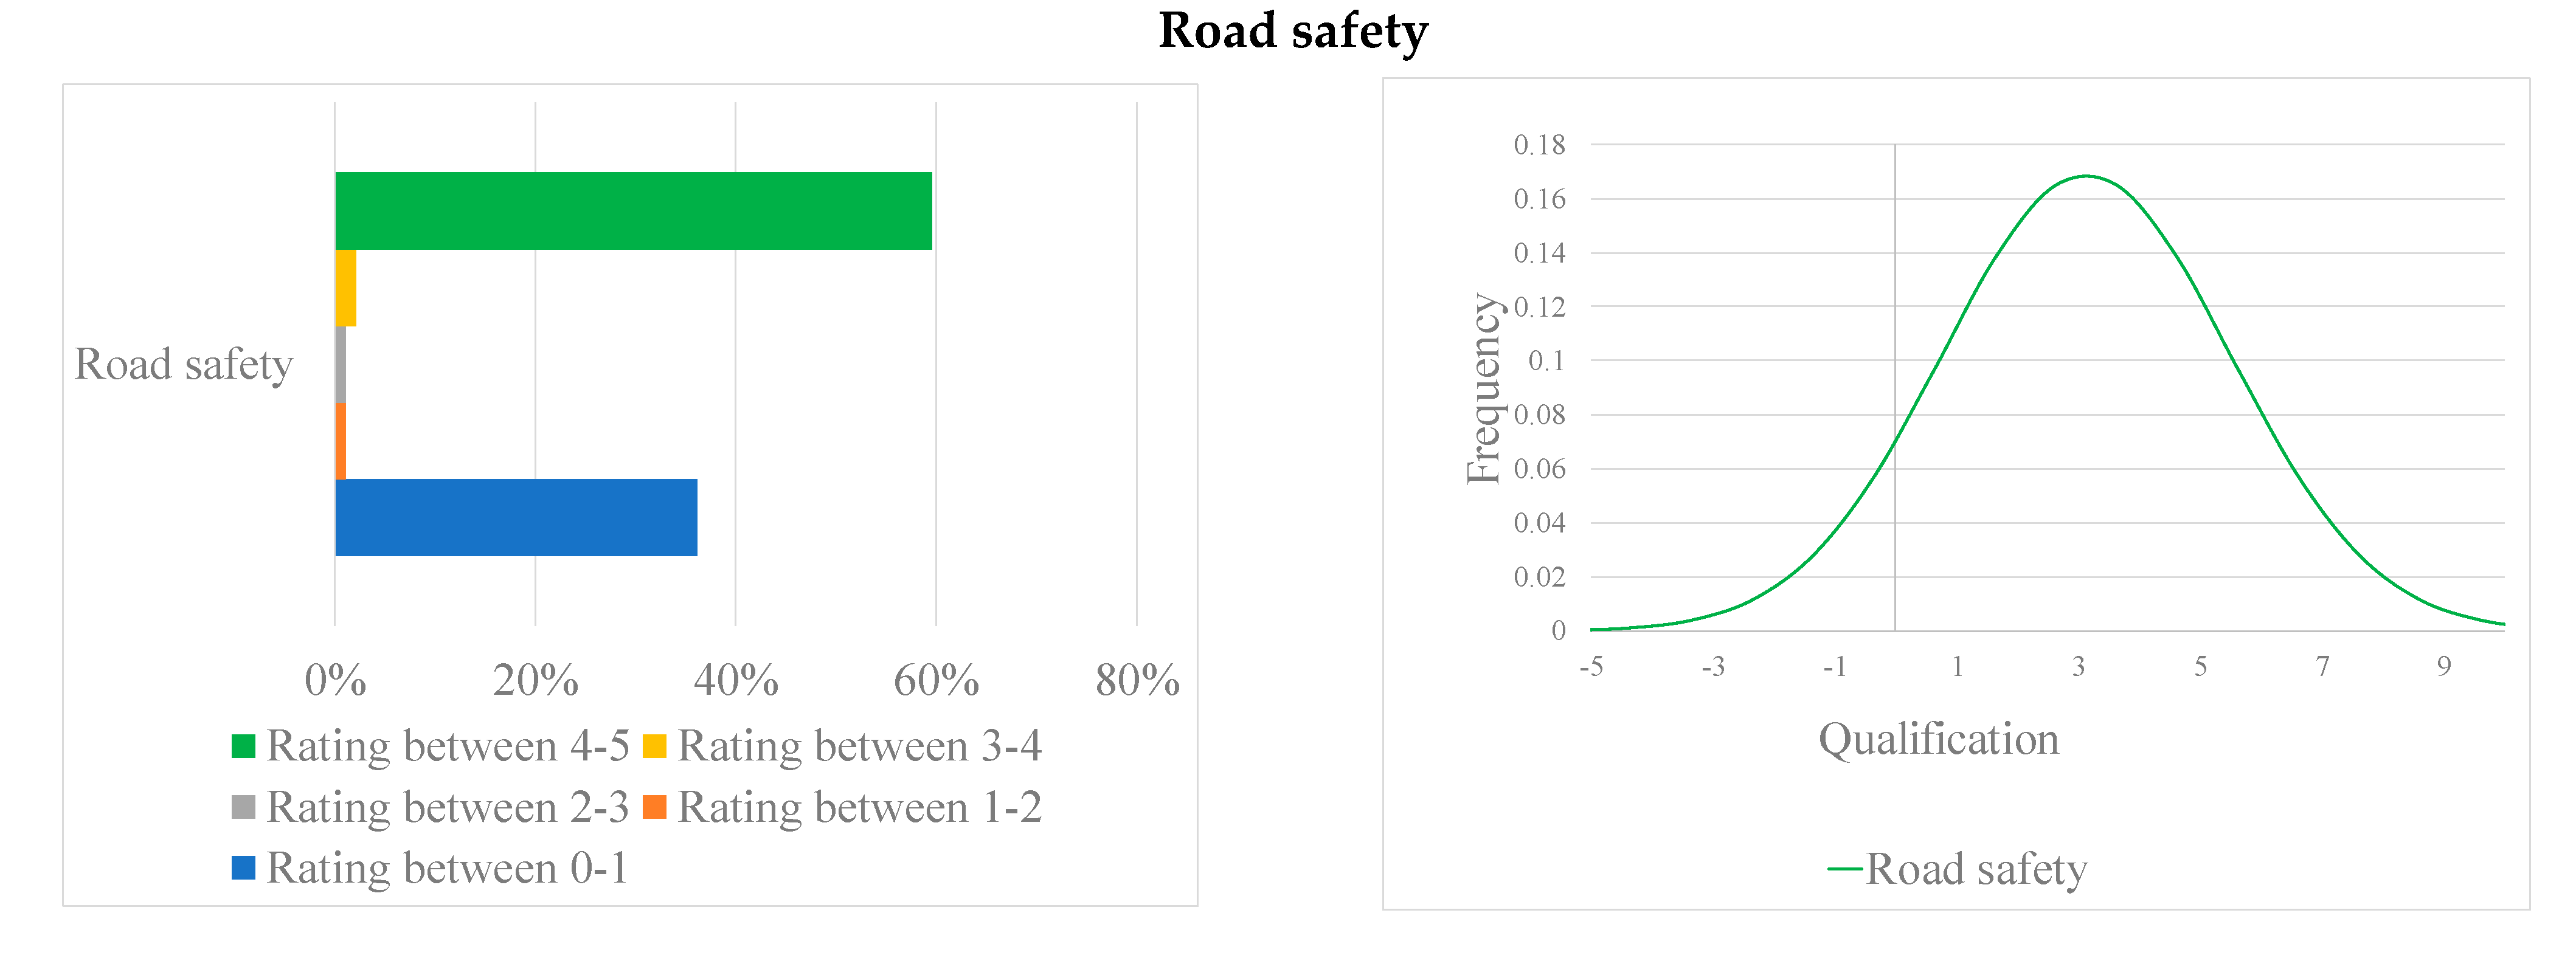
Figure 20 shows the results of the road safety severity rating; 60 percent was rated with an “extreme” severity level, which serves as a warning to consider in the maintenance and rehabilitation tasks of this part of the bridges. From a probabilistic perspective, the average rating is 3.2 with a standard deviation of 2.4, which is also high compared to components in other groups. Most bridges do not meet traffic safety requirements, as they lack pedestrian crossings and signage.
For the substructure group, significant damage was found in the fins and abutments in the areas of stability and durability. For the superstructure group, significant damage was identified in the following order: girders, supports, and slabs. In the environmental group, the main damages were identified in the following order: torrential floods, landslides, and scours. Traffic safety is the group with the highest ratings, indicating that most of these bridges do not meet the minimum design requirements for roads.
Figure 21 shows the results of the visual inspection of the 94 bridges in the pilot section using thematic maps with a color scale of the condition indexes and the overall weighted rating. The map in
Figure 21 identifies locations of varying severity levels among the bridges in the pilot section. This includes critical areas that require intervention such as maintenance, rehabilitation, and/or monitoring and instrumentation. This information is critical to decision making because it takes into account the environment, traffic levels, and social and economic conditions.
4. Conclusions
A new visual inspection and diagnostic module has been developed and implemented for the Intelligent Bridge Management System of Colombia, which allows the identification of relevant damages in the different components of the bridges with greater rigor and precision. This is the result of the development of a damage catalog that incorporates more than 20 years of experience in the identification of the main pathologies, the determination of the condition indexes of the structure, and the qualification of the three (3) evaluation areas—stability, durability, and traffic safety.
In particular, the inclusion of the road safety component makes it different from the main management systems in the world, since it was designed to respond to the needs of bridges in the Colombian context and was articulated to collect and store in a database in real time information on the condition of bridges through an app.
This innovative module also identifies the need for intervention on the bridges through urgent and/or definitive maintenance, rehabilitation, or repowering works, as well as to avoid the partial or total collapse of the bridges.
This module is a fundamental part of the intelligent bridge system and is one of the main inputs for Module 5, the prioritization and decision module.
This article presents examples of the application of this module’s methodology to two bridges with different structural typologies, demonstrating its reliability through field visual inspections. In particular, the process is supported by a damage catalog included in a mobile application.
Figure 16 show an in-depth visual inspection evaluation of the bridges in the pilot section, providing critical input for decision making within the system. The innovation lies in the results, which detail different levels of severity in the evaluation areas: stability, durability, and traffic safety. The information includes not only the numerical ratings of the bridges but also their geographic distribution based on severity levels throughout Colombia, as shown in
Figure 20. This allows for the identification of critical bridges across different rating areas and condition indices.
Based on this assessment of the condition of the bridges in the pilot section, the guardrails and expansion joints in the stability areas were found to have significant damage related to impact and structural deficiencies. The guardrails were found to have significant damage in the road safety area with an “extreme” severity level. Relevant damage with a higher severity level was found in the slopes and abutments of the substructure group in the stability area, related to landslides, scours, and the poor management of runoff water. The most severe damage was found in the fins and abutments in the durability group, related to infiltration problems and the lack of maintenance.
In the beam component of the superstructure group, significant damage was detected in the stability area, rated high severity, related to structural deficiencies identified by flexural and shear cracking. In the durability group, the main damages were identified in the beams and slabs, related to construction defects (lack of concrete cover) and infiltration. In the environmental group, the main damage detected is related to flash floods and landslides. In the area of road safety, 60% of the bridges in the pilot section were classified as “extreme”. The level of detail and the diversity of these results, obtained by this methodology, represent a significant input for the decision making regarding the specifications and the costs of the works necessary for the preservation and the stability of the bridges, clearly demonstrating the usefulness and the advantages of this inspection module.


 ,
, 


