
Assessing Safety Efficiency in China’s Provincial Construction Industry: Trends, Influences, and Implications

Abstract
:1. Introduction
2. Literature Review
2.1. Evaluation of Construction Safety Efficiency
2.2. Analysis of Factors Influencing Safety Efficiency
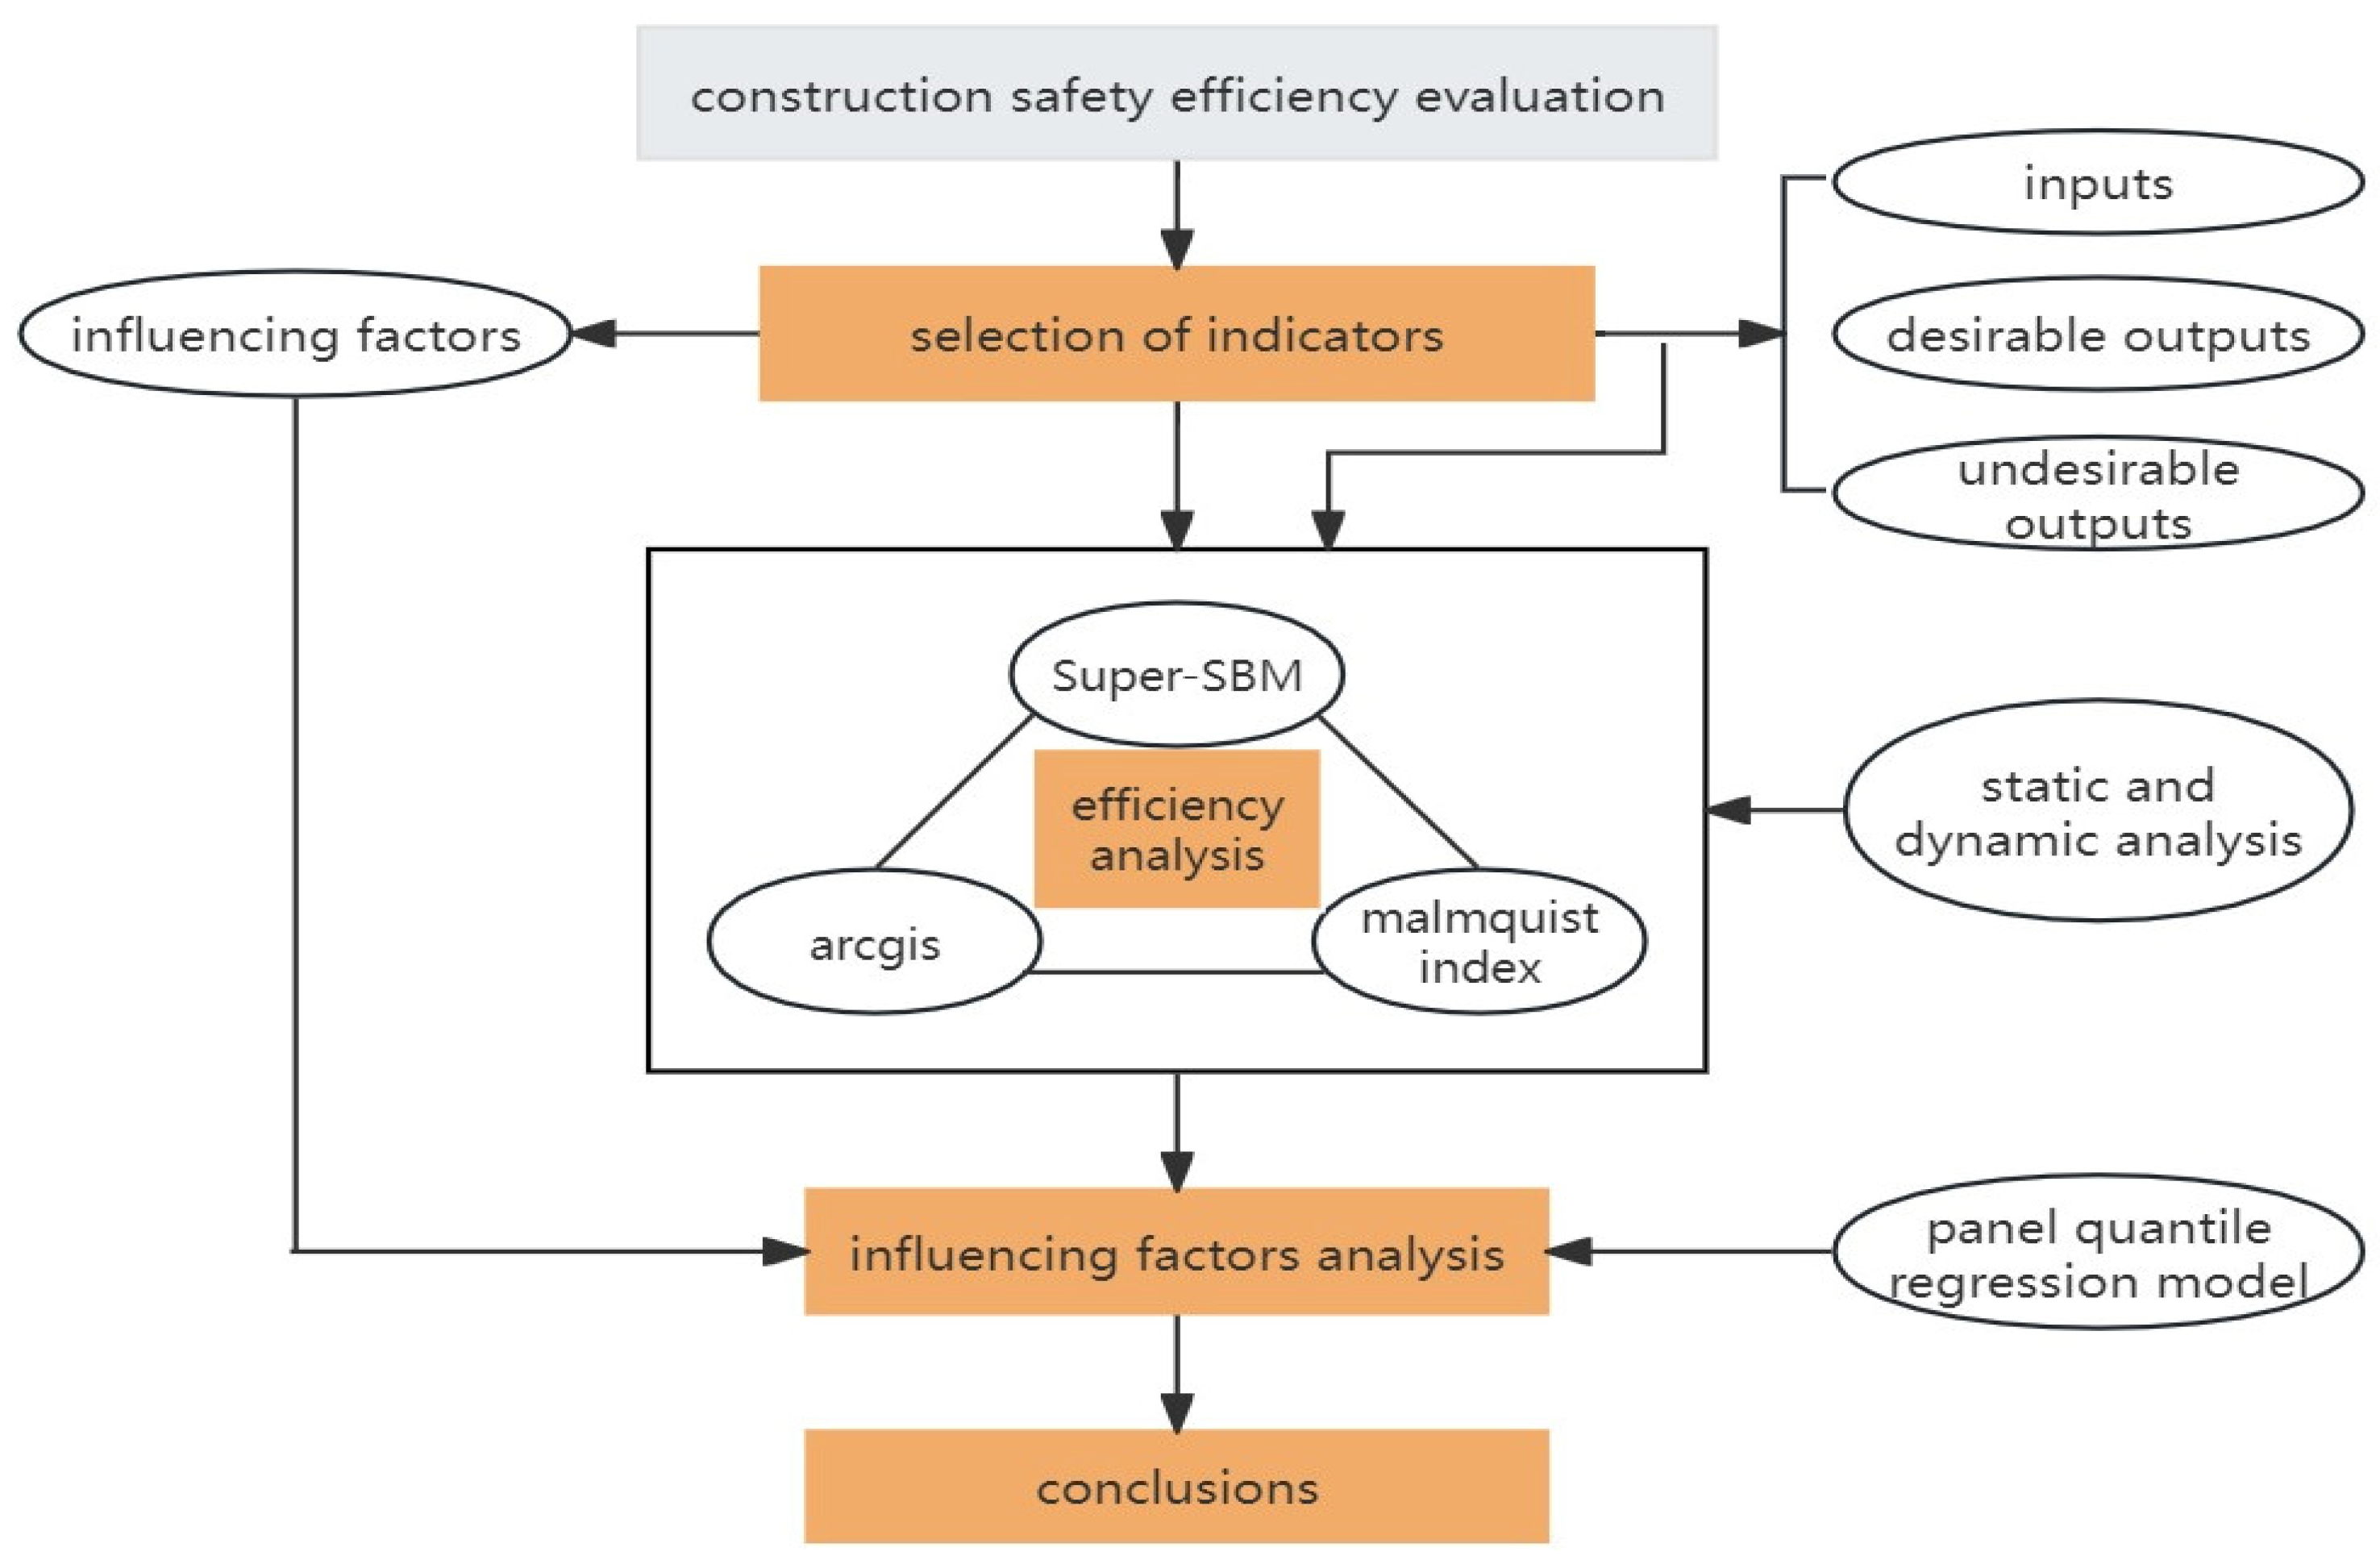
3. Methodology
3.1. Super-SBM Model
3.2. Malmquist Index
3.3. Panel Quantile Regression Model
4. Index Selection and Data Source
4.1. Index Selection
4.1.1. Selection of Input–Output Indicators
4.1.2. Selection of Influencing Factors Indicators
4.2. Data Sources
5. Results
5.1. Static Analysis of Safety Efficiency Results
5.1.1. Temporal Evolution Characteristics
5.1.2. Spatial Evolution Characteristics
5.2. Dynamic Analysis of Safety Efficiency Results
5.3. Analysis of Influencing Factors
5.3.1. Descriptive Statistics of Variables
5.3.2. Quantile Regression Results Analysis
6. Discussion
- (1)
- Some provinces show better performance in safety efficiency, such as Beijing and Hainan. However, the overall level of construction safety efficiency is relatively low, with most provinces’ efficiency values ranging from 0.2 to 0.6. A similar conclusion was drawn by Kang et al. [25]. However, the efficiency values obtained in this study are even lower, indicating an overestimation issue with the traditional DEA model. The data obtained using the Super-SBM model are closer to the actual values. Several reasons contribute to the low level of safety efficiency in China: firstly, the construction industry has witnessed a substantial surge in growth in recent years, particularly in the context of intensified competition in the real estate market. This has led to enterprises prioritizing scale expansion while overlooking resource utilization optimization, emphasizing profit-driven and unsustainable expansion. Secondly, as the cost of accidents rises with the country’s increased supervision of building safety, there has been a reduction in unsafe behaviors to some extent, subsequently decreasing the probability of accidents. However, the extent of improvement remains inadequate, necessitating the strengthening of further measures, as incomplete safety measures result in a decline in safety efficiency.
- (2)
- Similarly, the dynamic change results show that the total factor productivity index was consistently below 1 over the course of 7 years, indicating a declining trend in safety efficiency in the Chinese construction industry. This result has not been described previously. The lowest total factor productivity index was observed in 2015–2016, at 0.924. One possible reason for this situation is that in 2015, China’s macroeconomic conditions experienced a downturn, with continuous sluggishness in real estate investment and building material prices frequently hitting rock bottom. This challenging environment led to a historic low in the growth rate of the construction industry’s total output value, posing significant challenges to the survival and development of the construction industry. Under such circumstances, enterprises had limited bandwidth to focus on enhancing their technical capabilities and improving management efficiency. Consequently, there was an overall decline in both technological progress efficiency and technical efficiency during this period. This decline, in turn, contributed to a decrease in safety efficiency.
- (3)
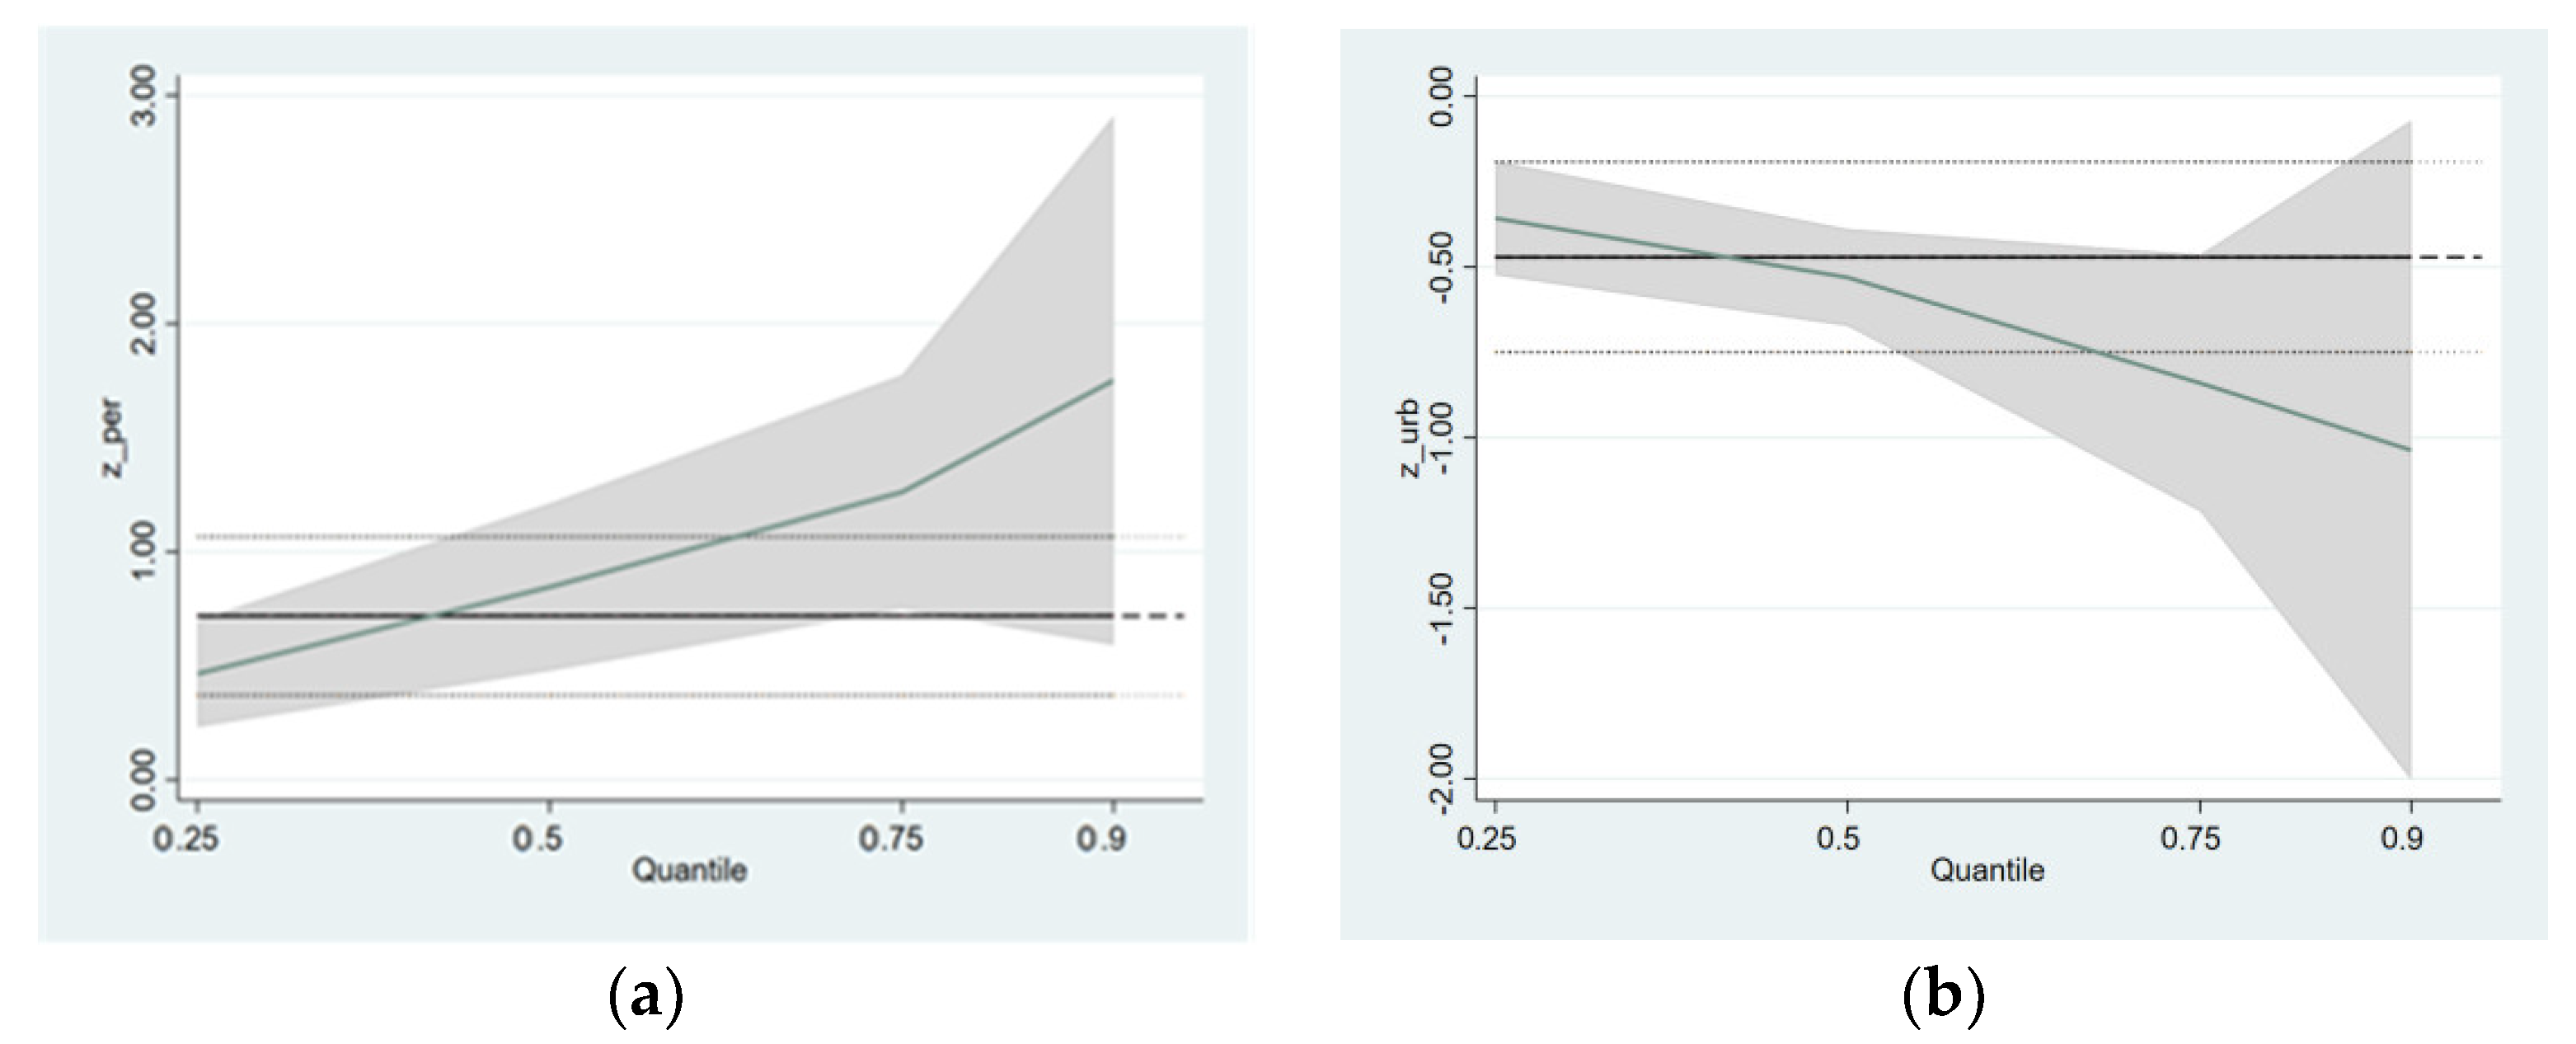
- Then, we find that the influence coefficient and significance of each factor change with the change in different quantiles of safety efficiency, indicating that the influence of determinants of safety efficiency is heterogeneous among different quantiles. However, this result has not been described before. Relevant decision-making departments should consider the differences in the driving forces of safety efficiency in different provinces and formulate policies reasonably. The impact of the urbanization rate on building safety efficiency shows a negative downward trend, indicating that the negative impact of the urbanization rate on the low safety efficiency level is the least, while the negative impact on the high safety efficiency level is relatively large. This may be caused by the rate of urbanization, which causes rural labor to flood into cities. While providing abundant labor resources for the construction industry, the complexity of safety management faced by the construction industry increases, increasing the risk of safety accidents.
7. Conclusions
- (1)
- The results of the Super-SBM model indicate that the overall safety efficiency of provincial-level construction in China is relatively low, with only a few provinces showing good safety efficiency, such as Beijing, Jiangsu, and Hainan. There is a significant spatial clustering feature, with higher safety efficiency levels observed in eastern and central provinces. High-efficiency provinces are mainly distributed in the central and eastern regions and coastal areas, exhibiting a phenomenon of mutual connection between low-efficiency provinces and medium–high-efficiency regions.
- (2)
- The decomposition results of the Malmquist index show a downward trend from 2015 to 2021, with technological efficiency being the main factor hindering the development of safety efficiency in enterprises. Except for Beijing, Tianjin, Inner Mongolia, Shanghai, Jiangsu, and Gansu, the total factor productivity (TFP) of each province has shown a declining trend. The changes in technological progress and technical efficiency vary in different provinces, so different regions should improve and optimize technological progress, technical efficiency, and management levels according to their local conditions to promote the improvement of construction safety efficiency.
- (3)
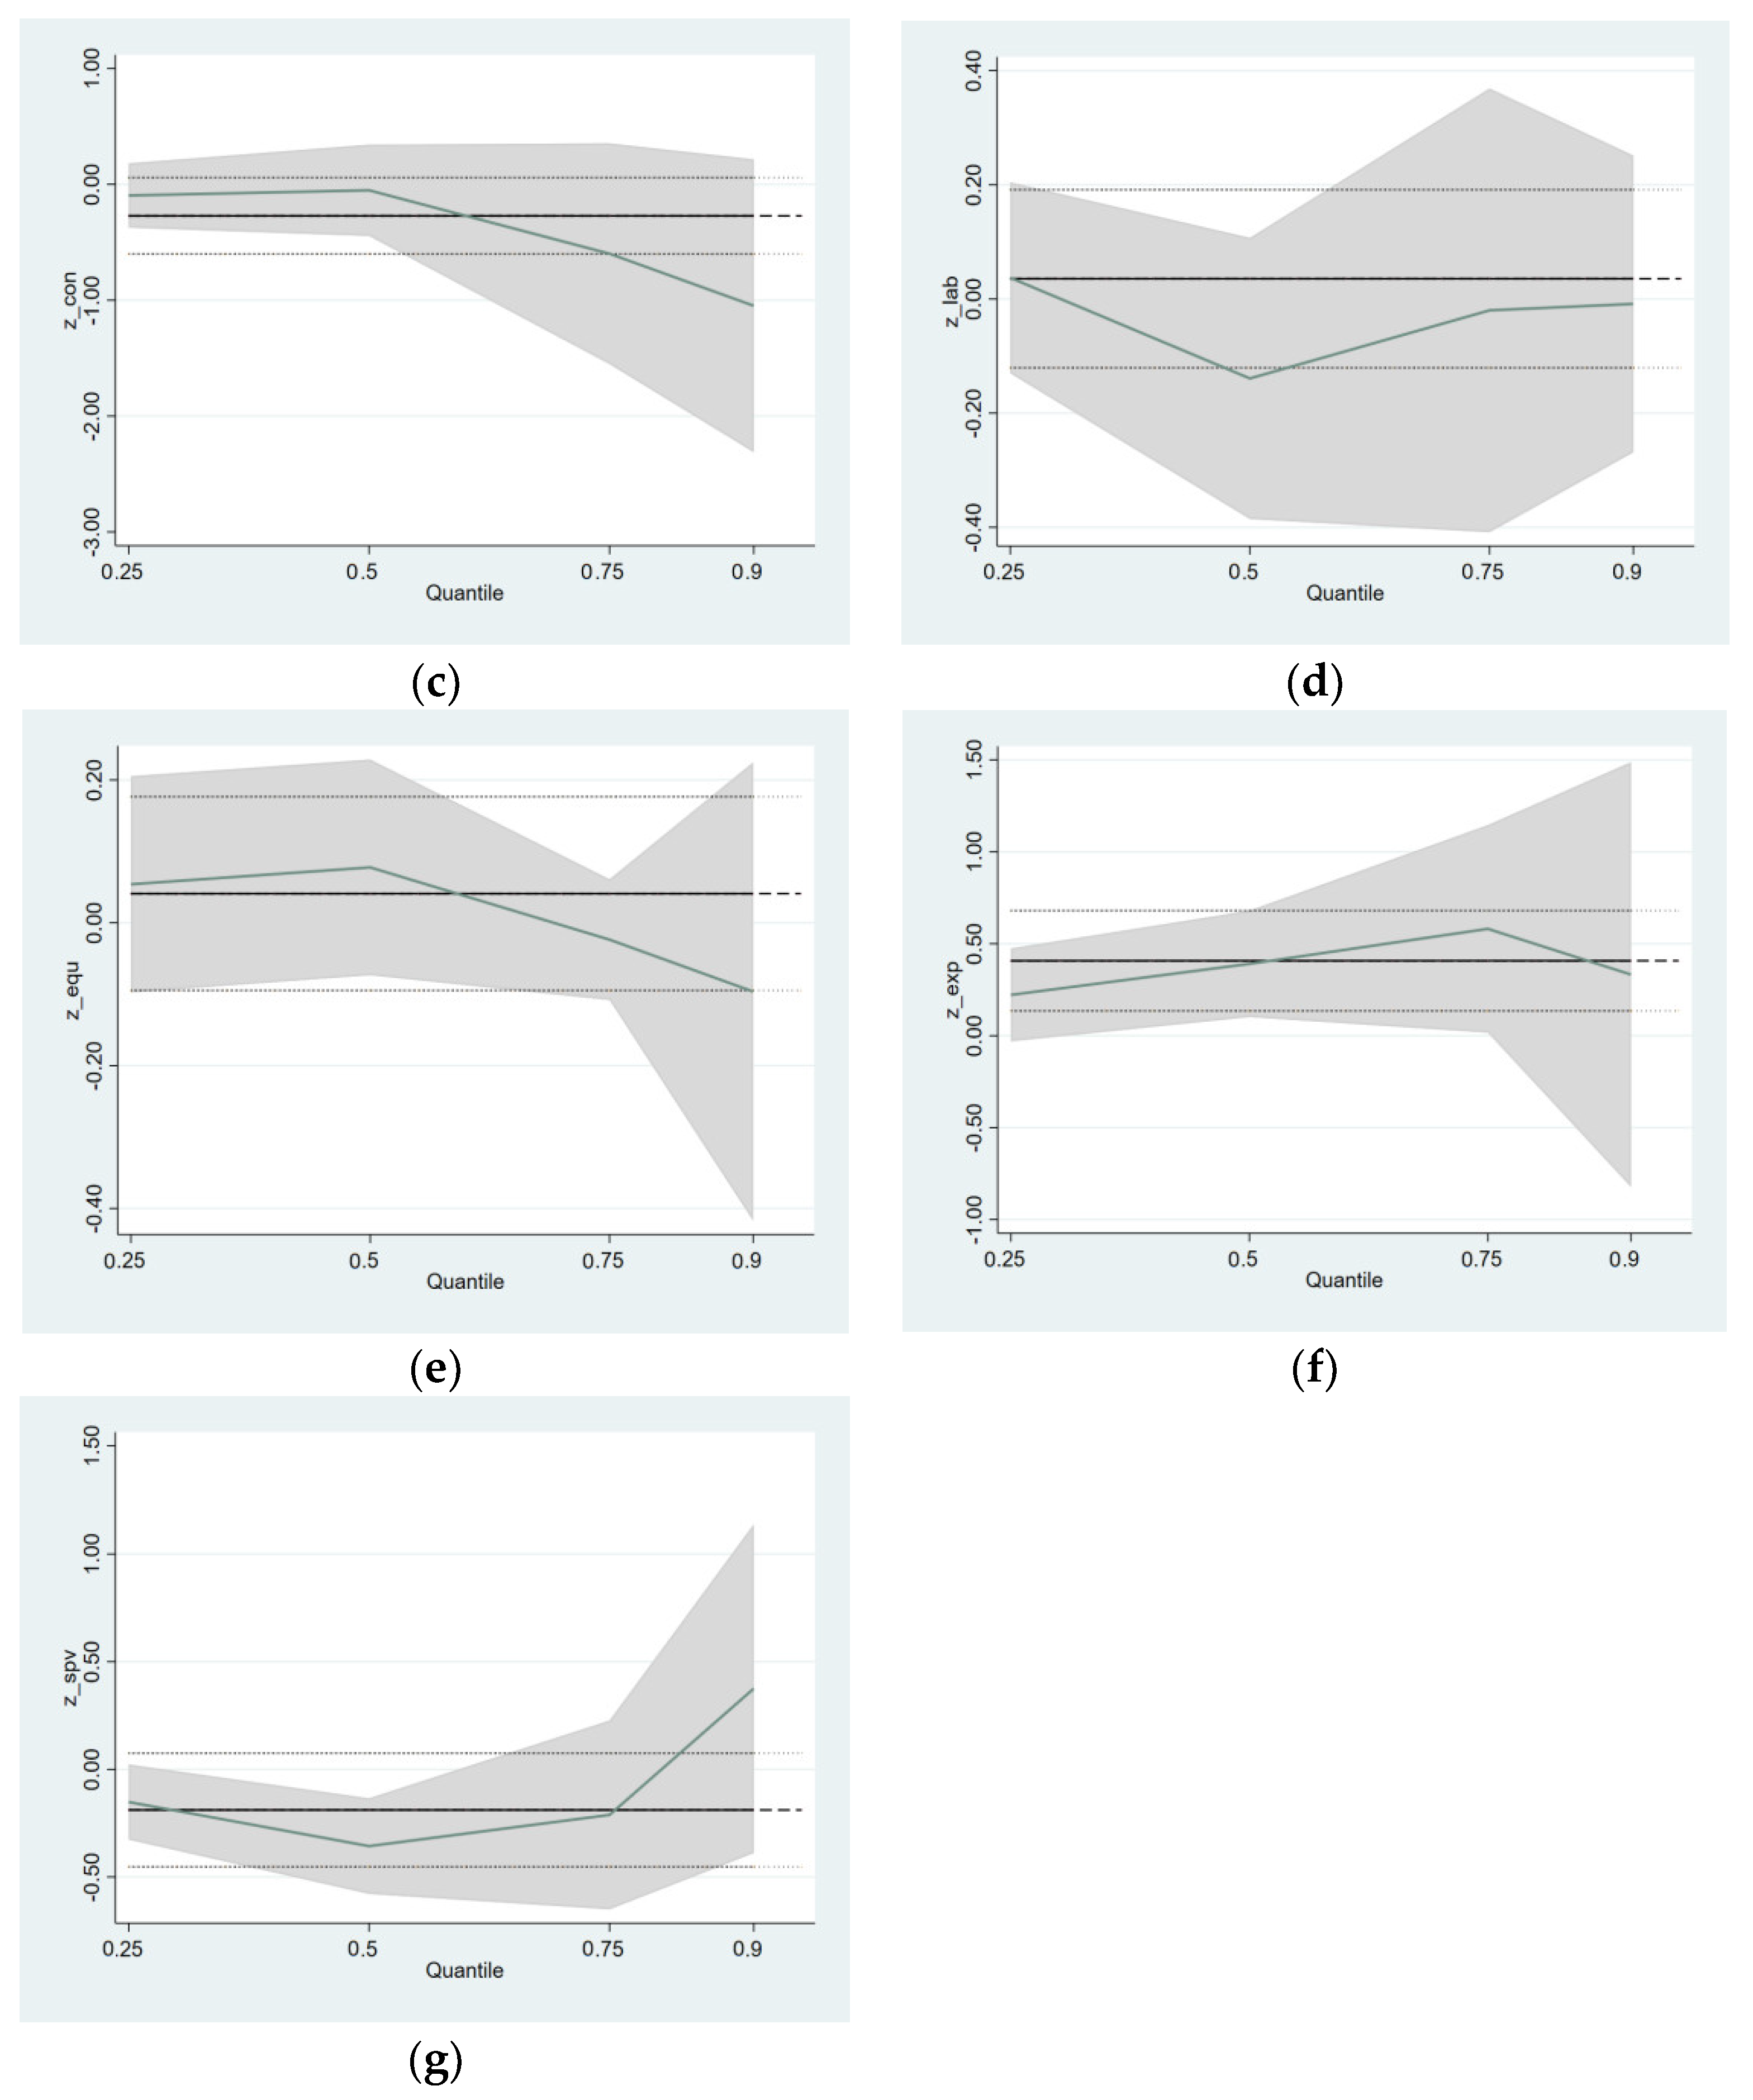
- The results of the panel quantile regression show that per capita GDP, urbanization rate, contract amount, and the number of professionals engaged in survey and design, and engineering supervision have an impact on construction safety efficiency. Specifically, regardless of whether safety efficiency is low (0.25), medium (0.5), relatively high (0.75), or high (0.9), per capita GDP and urbanization rate have a significant impact on safety efficiency; the negative impact of the contract amount is most pronounced at the 0.9 quantile; the number of professionals in survey and design has the most significant impact at the 0.5 quantile; and the number of engineering supervision professionals has the strongest impact at the 0.75 quantile.
Author Contributions
Funding
Data Availability Statement
Conflicts of Interest
References
- Abueisheh, Q.; Manu, P.; Mahamadu, A.-M.; Cheung, C. Design for safety implementation among design professionals in construction: The context of Palestine. Saf. Sci. 2020, 128, 104742. [Google Scholar] [CrossRef]
- Hendrickson, C.; Au, T. Project Management for Construction: Fundamental Concepts for Owners, Engineers, Architects, and Builders; Prentice Hall: Saddle River, NJ, USA, 1989. [Google Scholar]
- Mahamid, I. Factors affecting contractor’s business failure: Contractors’ perspective. Eng. Constr. Archit. Manag. 2012, 19, 269–285. [Google Scholar] [CrossRef]
- Robinson, G. Global construction market to grow $8 trillion by 2030: Driven by China, US and India. Glob. Constr. 2015, 44, 8–10. [Google Scholar]
- Bavafa, A.; Mahdiyar, A.; Marsono, A.K. Identifying and assessing the critical factors for effective implementation of safety programs in construction projects. Saf. Sci. 2018, 106, 47–56. [Google Scholar] [CrossRef]
- Choudhry, R.M. Achieving safety and productivity in construction projects. J. Civ. Eng. Manag. 2017, 23, 311–318. [Google Scholar] [CrossRef]
- McCabe, B.Y.; Alderman, E.; Chen, Y.; Hyatt, D.E.; Shahi, A. Safety performance in the construction industry: Quasi-longitudinal study. J. Constr. Eng. Manag. 2017, 143, 04016113. [Google Scholar] [CrossRef]
- Sunindijo, R.Y.; Zou, P.X. Political skill for developing construction safety climate. J. Constr. Eng. Manag. 2012, 138, 605–612. [Google Scholar] [CrossRef]
- Ma, L.; Fan, J.; Guo, R.Z. Characteristics of fires in coal mine roadways and comparative analysis of control effectiveness between longitudinal ventilation and cross-section sealing. Case Stud. Therm. Eng. 2024, 53, 103878. [Google Scholar] [CrossRef]
- Deng, J.; Qu, G.; Ren, S.; Wang, C.; Su, H.; Yuan, Y.; Duan, X.; Yang, N.; Wang, J. Effect of water soaking and air drying on the thermal effect and heat transfer characteristics of coal oxidation at the low-temperature oxidation stage. Energy 2024, 288, 129705. [Google Scholar] [CrossRef]
- Manu, P.; Emuze, F.; Saurin, T.A.; Hadikusumo, B.H. Construction Health and Safety in Developing Countries; Routledge: New York, NY, USA, 2019. [Google Scholar]
- Tixier, A.J.P.; Hallowell, M.R.; Rajagopalan, B. Construction Safety Risk Modeling and Simulation. Risk Anal. 2017, 37, 1917–1935. [Google Scholar] [CrossRef]
- Shao, B.; Hu, Z.; Liu, Q. Fatal accident patterns of building construction activities in China. Saf. Sci. 2019, 111, 253–263. [Google Scholar] [CrossRef]
- Tejada, Á.; Sánchez, M.P.; Escribano, F. Road safety efficiency on interurban roads in Spain. Eval. Rev. 2023, 0193841X231207443. [Google Scholar] [CrossRef] [PubMed]
- Jin, F.; Garg, H.; Pei, L. Multiplicative consistency adjustment model and data envelopment analysis-driven decision-making process with probabilistic hesitant fuzzy preference relations. Int. J. Fuzzy Syst. 2020, 22, 2319–2332. [Google Scholar] [CrossRef]
- Trinh, M.T.; Feng, Y. Impact of project complexity on construction safety performance: Moderating role of resilient safety culture. J. Constr. Eng. Manag. 2020, 146, 04019103. [Google Scholar] [CrossRef]
- Li, J.; Alburaikan, A.; Muniz, R.d.F. Evaluation of safety-based performance in construction projects with neutrosophic data envelopment analysis. Manag. Decis. 2023, 61, 552–568. [Google Scholar] [CrossRef]
- Djordjević, B.; Krmac, E.; Mlinarić, T.J. Non-radial DEA model: A new approach to evaluation of safety at railway level crossings. Saf. Sci. 2018, 103, 234–246. [Google Scholar] [CrossRef]
- Seyedalizadeh Ganji, S.; Rassafi, A. Measuring the road safety performance of Iranian provinces: A double-frontier DEA model and evidential reasoning approach. Int. J. Inj. Control Saf. Promot. 2019, 26, 156–169. [Google Scholar] [CrossRef] [PubMed]
- Miao, C.; Duan, M.; Sun, X. Safety management efficiency of China’s coal enterprises and its influencing factors—Based on the DEA-Tobit two-stage model. Process Saf. Environ. Prot. 2020, 140, 79–85. [Google Scholar] [CrossRef]
- Yang, W.; He, S. Coal mine safety management index system and environmental risk model based on sustainable operation. Sustain. Energy Technol. Assess. 2022, 53, 102721. [Google Scholar] [CrossRef]
- Barak, S.; Dahooei, J.H. A novel hybrid fuzzy DEA-Fuzzy MADM method for airlines safety evaluation. J. Air Transp. Manag. 2018, 73, 134–149. [Google Scholar] [CrossRef]
- Cui, Q.; Li, Y. The change trend and influencing factors of civil aviation safety efficiency: The case of Chinese airline companies. Saf. Sci. 2015, 75, 56–63. [Google Scholar] [CrossRef]
- Nahangi, M.; Chen, Y.; McCabe, B. Safety-based efficiency evaluation of construction sites using data envelopment analysis (DEA). Saf. Sci. 2019, 13, 382–388. [Google Scholar] [CrossRef]
- Kang, L.; Wu, C.; Liao, X.; Wang, B. Safety performance and technology heterogeneity in China’s provincial construction industry. Saf. Sci. 2020, 121, 83–92. [Google Scholar] [CrossRef]
- Qi, H.; Zhou, Z.; Li, N. Construction safety performance evaluation based on data envelopment analysis (DEA) from a hybrid perspective of cross-sectional and longitudinal. Saf. Sci. 2022, 146, 105532. [Google Scholar] [CrossRef]
- Xu, J.; Meng, Q.; Li, X. Evaluating Building Construction Safety Performance in Different Regions in China. Buildings 2023, 13, 1845. [Google Scholar] [CrossRef]
- Li, G.; Ma, X.; Song, Y. Green building efficiency and influencing factors of transportation infrastructure in china: Based on three-stage super-efficiency sbm–dea and tobit models. Buildings 2022, 12, 623. [Google Scholar] [CrossRef]
- Qi, B.; Wang, H.; Li, K. Research on Evaluation of Safety Input Efficiency of Construction Enterprise-On the basis of DEA-Tobit model. In Proceedings of the 4th International Conference on Manufacturing Science and Engineering (ICMSE 2013), Dalian, China, 30–31 March 2013; pp. 3423–3427. [Google Scholar]
- Gunduz, M.; Birgonul, M.T.; Ozdemir, M. Fuzzy structural equation model to assess construction site safety performance. J. Constr. Eng. Manag. 2017, 143, 04016112. [Google Scholar] [CrossRef]
- Winge, S.; Albrechtsen, E.; Arnesen, J. A comparative analysis of safety management and safety performance in twelve construction projects. J. Saf. Res. 2019, 71, 139–152. [Google Scholar] [CrossRef]
- Zheng, X.; Tong, L.; Chen, G. Spatial-temporal evolution characteristics and influencing factors of work safety level in construction industry. China Saf. Sci. J. CSSJ 2020, 30, 27–34. [Google Scholar]
- Boakye, M.K.; Adanu, S.K.; Adzivor, E.K. Factors influencing health and safety performance at construction sites in Ghana: The perspective of building artisans. Int. J. Occup. Saf. Ergon. 2023, 29, 1121–1127. [Google Scholar] [CrossRef]
- Koenker, R. Quantile regression for longitudinal data. J. Multivar. Anal. 2004, 91, 74–89. [Google Scholar] [CrossRef]
- Lin, X.; Cui, W.; Wang, D. The heterogeneous effects of environmental regulation on industrial carbon emission efficiency in China using a panel quantile regression. Environ. Sci. Pollut. Res. 2023, 30, 55255–55277. [Google Scholar] [CrossRef] [PubMed]
- Zhang, H.; Zhou, P.; Sun, X. Disparities in energy efficiency and its determinants in Chinese cities: From the perspective of heterogeneity. Energy 2024, 289, 129959. [Google Scholar] [CrossRef]
- Koenker, R.; Hallock, K.F. Quantile regression. J. Econ. Perspect. 2001, 15, 143–156. [Google Scholar] [CrossRef]
- Tone, K. A slacks-based measure of super-efficiency in data envelopment analysis. Eur. J. Oper. Res. 2002, 143, 32–41. [Google Scholar] [CrossRef]
- Tian, T.; Qin, Y. An Analysis of Safety Efficiency of Coal Enterprises in China and Factors Affecting. China Saf. Sci. J. CSSJ 2012, 22, 128–134. [Google Scholar]
- Zha, J.; Wang, X. Construction Safety Management Efficiency Evaluation Based on DEA. China Saf. Sci. J. CSSJ 2013, 23, 14–19. [Google Scholar]
- Qiang, M.; Fang, D.; Xiao, H.; Chen, Y. Research on safety input and safety performance of construction engineering projects. China Civ. Eng. J. 2004, 37, 101–107. [Google Scholar]
- Yuxin, W.; Gui, F.; Qian, L.; Xiao, L.; Yiran, C.; Yali, W.; Xuecai, X. Modelling and analysis of unsafe acts in coal mine gas explosion accidents based on network theory. Process Saf. Environ. Prot. 2023, 170, 28–44. [Google Scholar] [CrossRef]
- Yang, B.; Zhang, Z.; Wu, H. Detection and attribution of changes in agricultural eco-efficiency within rapid urbanized areas: A case study in the Urban agglomeration in the middle Reaches of Yangtze River, China. Ecol. Indic. 2022, 144, 109533. [Google Scholar] [CrossRef]
- Huang, D.; Wang, X. Study on Production Efficiency of Flue-cured Tobacco in China Based on DEA-Malmquist Model. In Proceedings of the 5th International Conference on Advances in Energy Resources and Environment Engineering (ICAESEE), Chongqing, China, 6–8 December 2019. [Google Scholar]


| Type | Specific Indicators | Specific Measurement |
|---|---|---|
| Input | Safe investment | Gross output value of regional construction industry × safety input rate (2.36%) |
| Number of employees in construction industry | Number of employees in general contracting and professional contracting construction enterprises | |
| Unexpected output | Number of construction safety accidents | Number of safety accidents in housing municipal engineering |
| Number of deaths from construction safety accidents | Number of deaths in housing municipal engineering safety accidents | |
| Expected output | Construction area of construction industry | Housing construction area of general contracting and professional contracting construction enterprises |
| Category | Specific Indicators |
|---|---|
| Economic and social development | Per capita GDP (PER) |
| urbanization rate (URB) | |
| Auxiliary industry development | Number of employees in exploration and design institutions (EXP) |
| Number of employees in engineering supervision institutions (SPV) | |
| Construction industry development | Technical equipment rate of construction industry (EQU) |
| Labor productivity of construction industry (LAB) | |
| Contract value of construction industry (CON) |
| Province | 2015 | 2016 | 2017 | 2018 | 2019 | 2020 | 2021 | Mean | Rank |
|---|---|---|---|---|---|---|---|---|---|
| Beijing | 1.053 | 0.861 | 0.828 | 0.891 | 1.002 | 1.051 | 1.834 | 1.074 | 1 |
| Tianjin | 0.343 | 0.354 | 0.375 | 0.357 | 0.364 | 0.358 | 0.415 | 0.366 | 28 |
| Hebei | 0.587 | 1.102 | 0.795 | 0.552 | 0.962 | 1.781 | 0.742 | 0.932 | 5 |
| Shanxi | 1.038 | 1.032 | 0.413 | 0.388 | 0.360 | 0.395 | 0.484 | 0.587 | 12 |
| Inner Mongolia | 0.607 | 0.525 | 0.505 | 0.534 | 0.601 | 0.714 | 0.745 | 0.604 | 10 |
| Liaoning | 0.459 | 0.442 | 0.394 | 0.364 | 0.417 | 0.428 | 0.494 | 0.428 | 25 |
| Jilin | 0.496 | 0.437 | 0.418 | 0.430 | 0.441 | 0.471 | 0.438 | 0.447 | 24 |
| Heilongjiang | 0.328 | 0.342 | 0.336 | 0.351 | 0.348 | 0.358 | 0.406 | 0.353 | 29 |
| Shanghai | 0.585 | 0.552 | 0.616 | 0.666 | 0.664 | 0.690 | 0.663 | 0.634 | 8 |
| Jiangsu | 1.016 | 1.001 | 0.998 | 1.010 | 1.006 | 1.024 | 1.025 | 1.011 | 3 |
| Zhejiang | 0.905 | 0.870 | 0.859 | 0.821 | 1.129 | 1.099 | 0.967 | 0.950 | 4 |
| Anhui | 0.660 | 0.563 | 0.556 | 0.511 | 0.495 | 0.462 | 0.458 | 0.529 | 16 |
| Fujian | 0.701 | 0.637 | 0.532 | 0.514 | 0.474 | 0.477 | 0.456 | 0.541 | 14 |
| Jiangxi | 0.530 | 0.467 | 0.430 | 0.426 | 0.382 | 0.360 | 0.339 | 0.419 | 26 |
| Shandong | 1.000 | 0.630 | 0.582 | 0.543 | 0.507 | 0.513 | 0.567 | 0.620 | 9 |
| Henan | 0.561 | 0.528 | 0.465 | 0.482 | 0.435 | 0.436 | 0.548 | 0.494 | 19 |
| Hubei | 0.501 | 0.529 | 0.513 | 0.530 | 0.531 | 0.501 | 0.521 | 0.518 | 17 |
| Hunan | 0.627 | 0.576 | 0.541 | 0.520 | 0.512 | 0.491 | 0.501 | 0.538 | 15 |
| Guangdong | 0.488 | 0.485 | 0.457 | 0.469 | 0.446 | 0.459 | 0.536 | 0.477 | 21 |
| Guangxi | 0.779 | 0.715 | 0.512 | 0.506 | 0.471 | 0.440 | 0.410 | 0.548 | 13 |
| Hainan | 1.586 | 0.954 | 0.935 | 0.946 | 0.910 | 0.909 | 1.033 | 1.039 | 2 |
| Chongqing | 0.441 | 0.385 | 0.369 | 0.401 | 0.381 | 0.369 | 0.340 | 0.384 | 27 |
| Sichuan | 1.006 | 0.455 | 0.424 | 0.397 | 0.361 | 0.368 | 0.364 | 0.482 | 20 |
| Guizhou | 0.968 | 0.876 | 0.545 | 0.450 | 0.400 | 0.580 | 0.391 | 0.601 | 11 |
| Yunnan | 0.413 | 0.383 | 0.314 | 0.319 | 0.292 | 0.278 | 0.251 | 0.322 | 30 |
| Shanxi | 0.527 | 0.546 | 0.509 | 0.377 | 0.409 | 0.411 | 0.387 | 0.452 | 23 |
| Gansu | 0.521 | 0.486 | 0.482 | 0.511 | 0.515 | 0.503 | 0.531 | 0.507 | 18 |
| Qinghai | 0.682 | 0.664 | 0.680 | 0.695 | 0.761 | 0.805 | 1.033 | 0.760 | 7 |
| Ningxia | 0.745 | 1.215 | 0.865 | 0.622 | 0.579 | 0.810 | 0.539 | 0.768 | 6 |
| Xinjiang | 0.555 | 0.517 | 0.428 | 0.414 | 0.381 | 0.471 | 0.492 | 0.466 | 22 |
| Mean | 0.690 | 0.638 | 0.556 | 0.533 | 0.551 | 0.600 | 0.597 | 0.595 |
| Year | EC | TC | PEC | SEC | MI |
|---|---|---|---|---|---|
| 2015~2016 | 0.961 | 0.961 | 0.987 | 0.974 | 0.924 |
| 2016~2017 | 0.936 | 0.997 | 0.886 | 1.056 | 0.933 |
| 2017~2018 | 0.986 | 1.007 | 1.150 | 0.857 | 0.993 |
| 2018~2019 | 0.919 | 1.068 | 0.881 | 1.043 | 0.982 |
| 2019~2020 | 0.989 | 1.005 | 0.987 | 1.002 | 0.994 |
| 2020~2021 | 1.043 | 0.960 | 1.073 | 0.971 | 1.001 |
| Mean | 0.972 | 0.999 | 0.990 | 0.982 | 0.971 |
| Province | EC | TC | PEC | SEC | MI |
|---|---|---|---|---|---|
| Beijing | 0.968 | 1.175 | 0.984 | 0.984 | 1.137 |
| Tianjin | 1.034 | 0.993 | 1.045 | 0.989 | 1.027 |
| Hebei | 0.991 | 0.995 | 1.143 | 0.867 | 0.986 |
| Shanxi | 0.996 | 0.996 | 0.957 | 1.041 | 0.992 |
| Inner Mongolia | 1.019 | 0.995 | 1.046 | 0.974 | 1.014 |
| Liaoning | 0.998 | 0.995 | 1.168 | 0.855 | 0.993 |
| Jilin | 0.969 | 0.995 | 1.008 | 0.961 | 0.964 |
| Heilongjiang | 1.001 | 0.995 | 1.054 | 0.950 | 0.997 |
| Shanghai | 1.011 | 0.994 | 1.014 | 0.998 | 1.006 |
| Jiangsu | 1.074 | 0.939 | 0.984 | 1.092 | 1.009 |
| Zhejiang | 0.991 | 1.009 | 1.014 | 0.977 | 1.000 |
| Anhui | 0.964 | 0.995 | 0.967 | 0.997 | 0.959 |
| Fujian | 0.959 | 0.984 | 0.960 | 0.999 | 0.944 |
| Jiangxi | 0.937 | 0.995 | 0.935 | 1.003 | 0.932 |
| Shandong | 0.942 | 1.031 | 0.943 | 0.999 | 0.972 |
| Henan | 0.967 | 0.993 | 1.034 | 0.935 | 0.961 |
| Hubei | 0.997 | 0.995 | 0.998 | 1.000 | 0.992 |
| Hunan | 0.978 | 1.000 | 0.961 | 1.018 | 0.977 |
| Guangdong | 0.997 | 0.994 | 0.997 | 1.000 | 0.991 |
| Guangxi | 0.929 | 0.994 | 0.961 | 0.967 | 0.924 |
| Hainan | 0.913 | 0.995 | 0.740 | 1.233 | 0.909 |
| Chongqing | 0.967 | 0.994 | 0.972 | 0.996 | 0.962 |
| Sichuan | 0.901 | 0.965 | 0.898 | 1.002 | 0.869 |
| Guizhou | 0.900 | 0.996 | 0.948 | 0.949 | 0.896 |
| Yunnan | 0.927 | 0.995 | 0.936 | 0.990 | 0.922 |
| Shanxi | 0.981 | 0.996 | 0.991 | 0.990 | 0.978 |
| Gansu | 1.010 | 0.994 | 1.026 | 0.985 | 1.005 |
| Qinghai | 0.977 | 0.996 | 1.077 | 0.908 | 0.973 |
| Ningxia | 0.897 | 0.994 | 0.981 | 0.915 | 0.892 |
| Xinjiang | 0.977 | 0.993 | 1.034 | 0.945 | 0.970 |
| Mean | 0.972 | 0.999 | 0.990 | 0.982 | 0.971 |
| Variable | Mean | StDev | Min | Max |
|---|---|---|---|---|
| TE | 0.595 | 0.256 | 0.251 | 1.834 |
| PER | 64,456 | 31,091 | 25,264 | 183,980 |
| URB | 62.20 | 10.81 | 42.93 | 89.30 |
| CON | 163,700,000 | 140,900,000 | 6,129,000 | 614,400,000 |
| LAB | 400,197 | 110,232 | 228,326 | 761,375 |
| EQU | 13,273 | 10,542 | 3723 | 108,588 |
| EXP | 137,335 | 148,880 | 5021 | 683,409 |
| SPV | 40,659 | 32,752 | 3712 | 210,047 |
| Variable | Coefficients | |||
|---|---|---|---|---|
| θ = 0.25 | θ = 0.5 | θ = 0.75 | θ = 0.9 | |
| PER | 0.465 *** | 0.845 *** | 1.262 *** | 1.751 ** |
| URB | −0.357 *** | −0.531 *** | −0.84 *** | −1.037 * |
| CON | −0.096 | −0.051 | −0.598 | −1.048 * |
| LAB | 0.037 | −0.139 | −0.02 | −0.009 |
| EQU | 0.054 | 0.078 | −0.024 | −0.096 |
| EXP | 0.222 | 0.391 ** | 0.581 * | 0.333 |
| SPV | −0.152 | −0.357 | −0.212 * | 0.375 |
Disclaimer/Publisher’s Note: The statements, opinions and data contained in all publications are solely those of the individual author(s) and contributor(s) and not of MDPI and/or the editor(s). MDPI and/or the editor(s) disclaim responsibility for any injury to people or property resulting from any ideas, methods, instructions or products referred to in the content. |
© 2024 by the authors. Licensee MDPI, Basel, Switzerland. This article is an open access article distributed under the terms and conditions of the Creative Commons Attribution (CC BY) license (https://creativecommons.org/licenses/by/4.0/).
Share and Cite
Wang, X.; Zhao, B.; Su, C. Assessing Safety Efficiency in China’s Provincial Construction Industry: Trends, Influences, and Implications. Buildings 2024, 14, 893. https://doi.org/10.3390/buildings14040893
Wang X, Zhao B, Su C. Assessing Safety Efficiency in China’s Provincial Construction Industry: Trends, Influences, and Implications. Buildings. 2024; 14(4):893. https://doi.org/10.3390/buildings14040893
Chicago/Turabian StyleWang, Xinping, Boxi Zhao, and Chang Su. 2024. "Assessing Safety Efficiency in China’s Provincial Construction Industry: Trends, Influences, and Implications" Buildings 14, no. 4: 893. https://doi.org/10.3390/buildings14040893