Article

Indoor Air Temperature Distribution and Heat Transfer Coefficient for Evaluating Cold Storage of Phase-Change Materials during Night Ventilation

1
Department of Architecture, Pusan National University, 2, Busandaehak-ro 63beon-gil, Geumjeong-gu, Busan 46241, Republic of Korea
2
School of Systems Engineering, Kochi University of Technology, 185 Miyanokuchi, Tosayamada, Kami City 782-8502, Kochi, Japan
3
School of Environment and Society, Tokyo Institute of Technology, 4259 Nagatsuda-cho, Midori-ku, Yokohama 226-8502, Kanagawa, Japan
*
Author to whom correspondence should be addressed.
Buildings 2024, 14(6), 1872; https://doi.org/10.3390/buildings14061872
Submission received: 9 May 2024 / Revised: 13 June 2024 / Accepted: 19 June 2024 / Published: 20 June 2024
(This article belongs to the Special Issue Indoor Climate and Energy Efficiency in Buildings)

Abstract

:
This paper focuses on clarifying the heat transfer coefficient necessary for determining the indoor temperature distribution during night ventilation using floor-level windows. Measurements were used to identify the factors that influence the vertical temperature distribution within a room wherein phase-change materials (PCMs) were installed at the floor level. The investigation revealed a temperature differential ranging from 1 °C to a maximum of 3 °C between the floor and the center of the room, attributable to external climatic conditions (outdoor temperature and wind speed). This variation was found to depend on the degree of mixing of indoor air currents. This deviation was critical because it significantly affected the phase-change temperature of PCMs, thereby impacting their thermal storage capabilities. Consequently, this study aimed to refine the predictive accuracy of indoor temperature distributions by proposing a modified vertical temperature distribution model that incorporated these findings. The results of this study are expected to provide better design strategies for building constructions that incorporate PCMs, and to optimize their functionality in passive cooling systems.

1. Introduction

1.1. Background

The global climate crisis, which is characterized by unprecedented changes in temperature, precipitation patterns, and extreme weather events, is largely attributed to the increased concentration of greenhouse gases in the Earth’s atmosphere. This has rendered the goal of net-zero carbon emissions a topic of global interest. According to the 6th comprehensive report by the Intergovernmental Panel on Climate Change (IPCC), the global average temperature is expected to rise by 1.5 °C by 2040 owing to greenhouse gas emissions, which is 10 years earlier than predicted in the previous report [1]. The building sector accounts for approximately 40% of the world’s total energy consumption [2]. Santamouris reported that the average cooling energy demands of residential and commercial buildings are expected to increase by 750% and 275%, respectively, by 2050 [3]. These figures highlight the sector’s carbon footprint as part of its carbon neutrality goals. Consequently, the architectural industry has been focused on zero-energy buildings and the incorporation of passive designs [4], active techniques, and renewable energy sources.
Passive design aims to enhance indoor thermal comfort and reduce energy consumption in buildings. The passive design principle facilitates the prevention of outdoor-to-indoor heat transfer in summer and indoor-to-outdoor heat transfer in winter. Passive design is targeted at the minimization of indoor heat gain and the maximization of the use of solar radiation for indoor heating without the use of active mechanical systems. Techniques such as shading, natural ventilation, thermal mass, and reflective materials can lower indoor temperatures, enhance occupant comfort, and reduce reliance on energy-intensive air-conditioning systems in the summers.
Research on night ventilation was conducted according to building uses in various climate zones [5]. The indoor temperature reduction effect by night ventilation is significantly affected by the heat capacity of the building, the amount of ventilation, and the change in outdoor temperature [6]. Exizidou et al. [7] found that thermal comfort levels improved by an average of 26% with the use of night ventilation in vernacular buildings. Geros et al. [8] presented the key parameters, which include the effective night-time airflow rate, as well as the indoor–outdoor temperature differential. There-fore, when planning the night ventilation in building, it is important to take the opening area, outdoor air temperature, as well as heat capacity of the building into account. In wooden buildings, PCMs are a good means to gain additional heat capacity.
On the other hand, studies on the application of PCMs to buildings have recently been conducted. Borderon et al. [9] conducted in-situ tests using PCMs combined with ventilation in the crawl space in office buildings. They concluded that overall thermal inertia in the crawl space was increased, leading to better pre-cooling of air in summer. Ling et al. [10] carried out a study using experimental and numerical methods to evaluate the effect of PCMs on the indoor thermal environment of greenhouses. This study demonstrated that sunny weather could help to promote the efficiency of PCMs. Wang et al. [11] evaluated the year-round applicability of a kind of composite PCMs wall through a full-scale experiment. The PCMs wall was able to reduce cooling energy and nearly 10–30% in heating energy. Wonorahardjo et al. [12] implemented an experimental study on the influence of a PCM-based passive air conditioner on temperature distribution in the room under tropical climatic conditions. Researchers have attempted to maximize the performance of PCMs under various climactic conditions. Additionally, coupling PCMs with natural or mechanical ventilation, and incorporating them into building design, have been important considerations for achieving optimal effectiveness using PCMs. The surrounding environment of the building is also crucial to fully exploit the benefits of PCMs in buildings.
This study focused on the passive cooling of houses using night ventilation and phase-change materials (PCMs). Figure 1 visually depicts the proposed research methodology. Cold air entering a room through a floor-level window, which is commonly used to promote natural ventilation in Japan, solidifies the PCMs, thereby preventing an increase in the indoor temperature in the morning and reducing the cooling load. Typically, night ventilation occurs through buoyancy. Cold air enters the room from the outside and moves to the upper floors through stairwells [13,14]. Thermal buoyancy creates a vertical temperature gradient in an indoor space. The larger the temperature difference between the upper and lower levels of the indoor area, the greater the thermal discomfort for occupants [15]. Therefore, indoor spaces are typically designed to prevent variations in temperature. However, in the case of an unoccupied space, there is no thermal discomfort. Space usage in residential buildings can vary depending on the time of the day; for example, living rooms may not be used frequently at night. Therefore, living rooms in residential buildings are suitable for night ventilation without compromising the thermal comfort of occupants. Moreover, the incorporation of PCMs into the fabric of rooms ventilated at night promotes thermal mass cooling. Therefore, by utilizing the cold air accumulated in the lower part of the room, the PCM of the indoor floor structure can maximize the cooling effect of night ventilation using floor-level windows.
Considering that indoor thermal stratification occurs owing to night ventilation, and that the PCM is placed on the floor of the room, the air temperature near the floor must be predicted while designing the cold storage of a PCM. The existing methods for predicting the heating and cooling loads of a building, or the prediction of indoor air temperature, conventionally involve calculations using one node per room. However, night ventilation results in a vertical air temperature distribution that is difficult to interpret using a nodal model. Meanwhile, the computational fluid dynamics (CFD) model cannot calculate the annual cooling and heating loads or predict the indoor air temperature for the cold storage of PCMs because of the computational load. The zonal model is an intermediate model between the nodal and CFD models. Figure 2 shows the visual features of the numerical analysis methodologies for the indoor air temperature distribution. Therefore, in this study, we employed a type of zonal model that can analyze the indoor temperature distribution by considering the thermal characteristics.

1.2. Previous Research on Indoor Air Temperature Distribution

Ito et al. [16] reported a correlation between the indoor temperature distribution and Archimedes numbers at the intake while heating an air-conditioned room with air intake at the top and exhaust from the floor of the room. The vertical air temperature distribution of the room was predicted using the correlation between the ratio of the height at which the indoor and outdoor air was perfectly mixed with the room height, and the Archimedes number. Togari et al. [17,18] proposed a simple prediction model for describing the vertical air temperature distribution generated by an air conditioner flow when the upper part of the space was warmed by solar radiation and cooled via downflow along the wall. Considering a room with temperature variations, Inard et al. [19] established a model for the determination of indoor air temperature and airflow distribution using mass and heat balance equations between each zone via vertical and horizontal zoning. Wurtz et al. [20] simplified the calculation of natural and mixed convection, and verified two-dimensional and three-dimensional zonal models to study the temperature and airflow distributions in spaces with temperature variations. Haghighat et al. [21] developed and proposed a simplified numerical model called the pressurized zonal model with an air diffuser (POMA) to predict indoor airflow patterns and heat distribution. The jet airflow equation model was based on the balance of the airflow rate, buoyancy force, and pressure loss because of fan and duct resistances. Musy et al. [22,23] improved Inard et al.’s zonal model by expanding it to multiple rooms to predict temperature and airflow distribution in the presence of a heat source. Higashimoto et al. [24] evaluated the predictability of vertical air temperature and pollutant distribution in a large room, based on displacement ventilation using a block model. Ren et al. [25] used Conjunction of Multlzone Infiltration Specialists(COMIS), a building airflow modeling program, to predict indoor temperature distribution and changes in airflow.
Wurtz et al. [26] used a mixed convection model to predict the indoor airflow and temperature distribution in residential buildings with an electric heater, and conducted an annual thermal comfort analysis. Some models [27] examined the effects of temperature stratification, natural convection, and wind-induced ventilation on indoor temperature distribution.
Various studies have proposed models for the analysis of temperature distribution based on the air age of a room where substitution ventilation is performed [28]. A review paper by Chen [29] highlighted the computational load problem of a zonal model.
Megri and Yu [30] developed a POMA model for predicting indoor air temperature distribution based on the differences in indoor surface temperature, and validated the prediction accuracy of the model by comparing its results with the measurement results.
Huang et al. [31] predicted indoor temperature distribution using the Block–Gebhart model (BG model), which combines the Block model with the Gebhart model. They predicted the indoor temperature distribution of a large space with a low-sidewall air supply system. This predictive model includes additional considerations for calculating radiant heat transfer loads, and its validity was verified through measurements. X. Wang et al. [32] used the BG model to predict and evaluate the temperature distribution in a large atrium building.
Considering the computational load and thermal characteristics of the target space in several existing studies, we have chosen the Block model by Togari et al. [17,18] as the analytical model for this research.

1.3. Purpose and Methodology
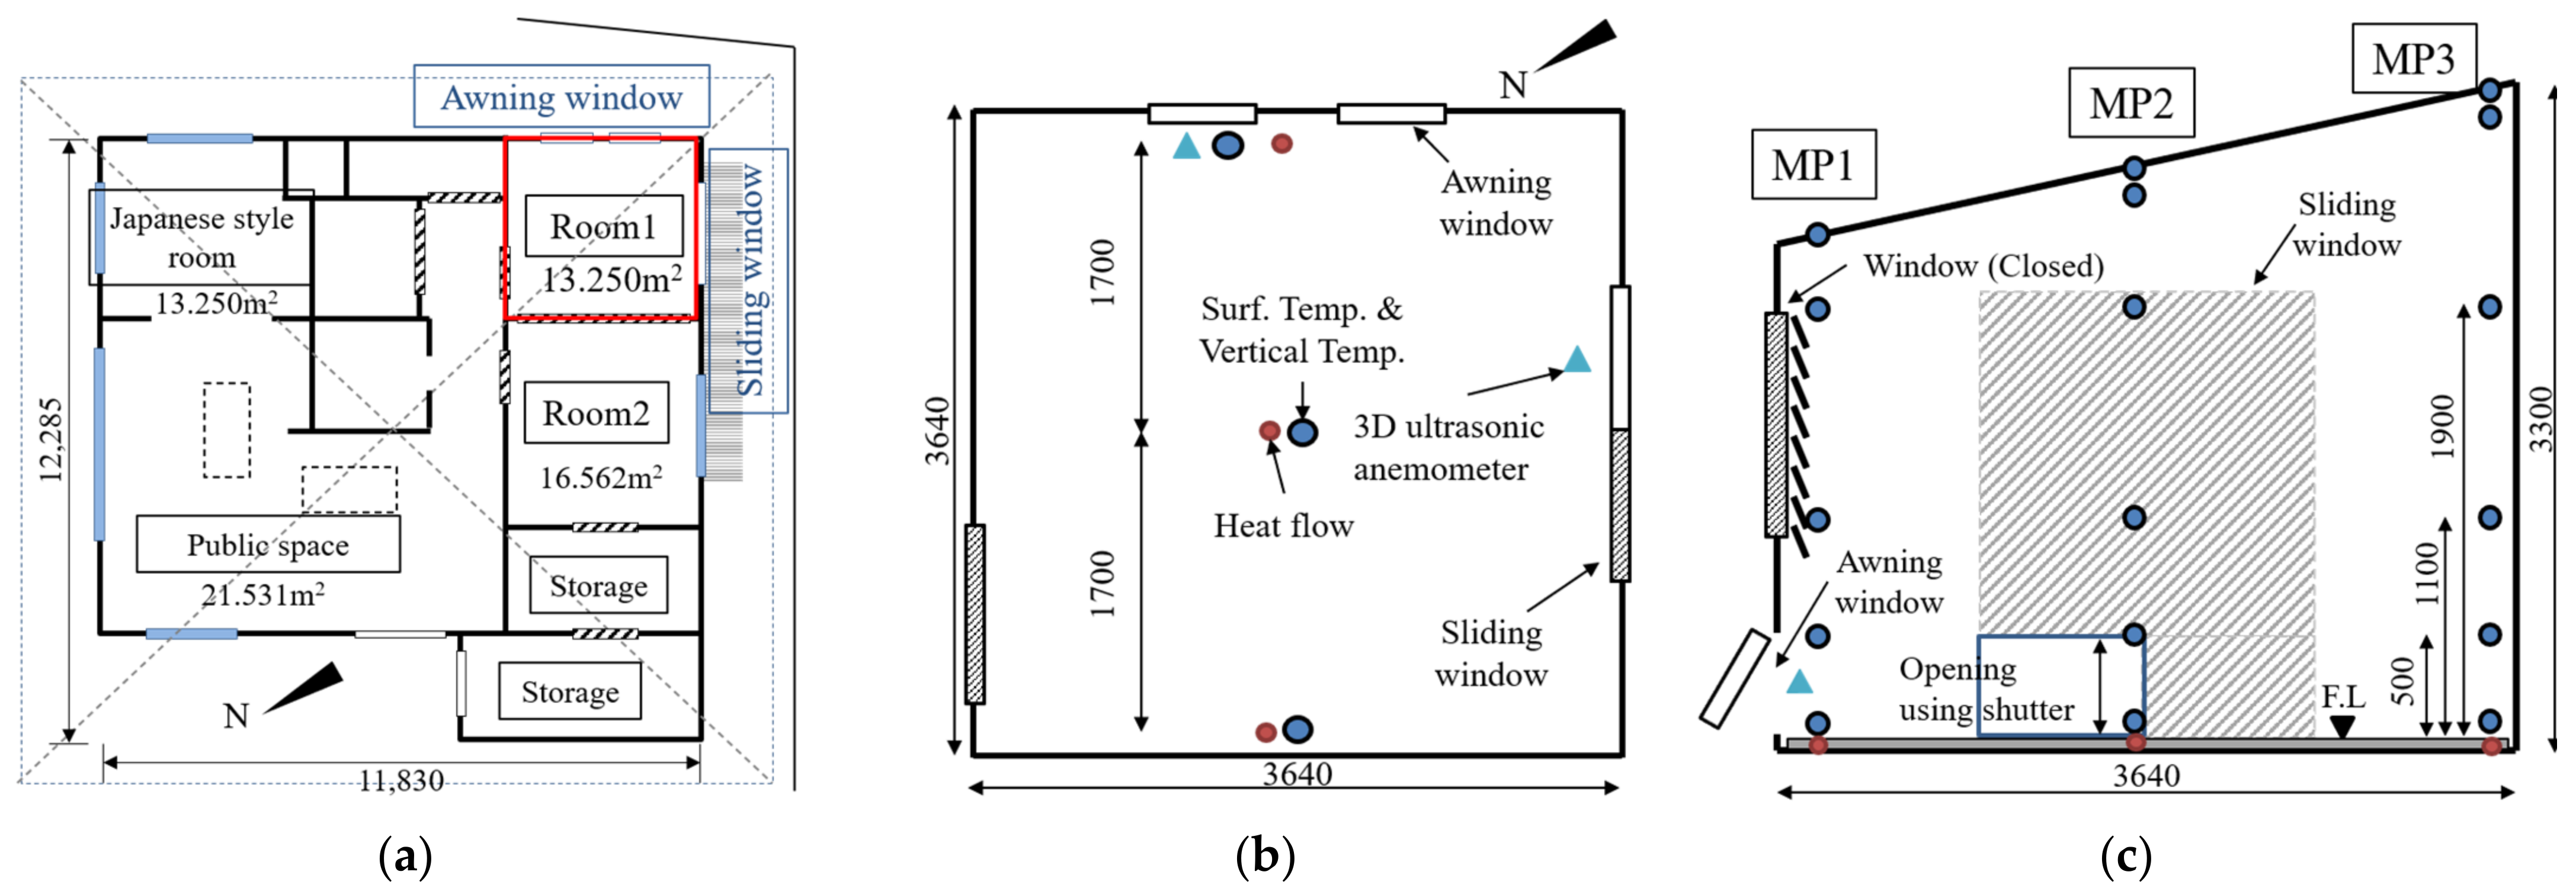
As previously mentioned, natural ventilation at night, facilitated by floor-level windows, contributes to the distribution of indoor temperatures. This ventilation primarily operates on the basis of temperature differentials, resulting in relatively stable indoor air. Considering the stability and nature of the ventilation process, this study posited that detailed airflow analysis models would not be required for predicting the temperature distribution under these specific conditions.
It was anticipated that the temperature distribution resulting from the disparity between indoor and outdoor temperatures would surpass the inflow wind speed. Thus, our study initially aimed to elucidate the factors influencing indoor vertical temperature distribution during night ventilation through floor-level windows by utilizing measurements. Subsequently, based on the measurements’ findings, this study aimed to determine the heat transfer coefficient that is essential for accurately predicting indoor temperature distribution through the application of a vertical temperature distribution model.

2. Measurement

Measurements [33] were conducted to clarify the variables that affect the indoor temperature distribution during night ventilation through the floor-level windows. During night ventilation, the cold storage of the PCMs installed on the floor of the room was determined, and the variables affecting cold storage were analyzed.

2.1. Overview

The measurements were conducted in a single-story wooden public building in Kumagaya City, Japan. The measurement target was Room 1, shown in Figure 3a, with a floor area of 13.3 m2 and a ceiling height of 2700 mm at the center of the room. Measurements were conducted from the end of September to the beginning of October 2014, and some portions of the data were used for analysis. The measured parameters (Table 1) were temperature, humidity, wind speed, and heat flow on the floor. The measurement points (Figure 3c) were at the inflow side (MP1), center of the room (MP2), and inside the room (MP3). When night ventilation was performed using a floor-level window, it was assumed that indoor temperature stratification occurred along the vertical direction. Therefore, the measurements were conducted vertically (TF.L+0.1m, TF.L+0.5m, TF.L+1.1m, TF.L+1.9m, and TF.L+2.6m). A heat flow meter was installed to measure the cold storage of the PCMs during night ventilation. The value obtained by adding up the differences between the values recorded by the upper and lower heat flow meters during ventilation was calculated as the daily accumulated cold storage.
Figure 4 shows a cross section of the floor, and a photograph of the target measurement room. The maximum cooling effect of a 6 mm resinous PCM mat installed on the floor was measured. The PCM mat contained microcapsules primarily composed of n-paraffin. The phase-change temperature of PCMs is within 23.8–24.2 °C during solidification and 26.6–27.6 °C during melting.
The PCMs were ventilated at night for 10 or 11 h (8 p.m. to 6 a.m. or 7 a.m.) to maximize the cooling effect. Two lower windows (awning windows) measuring 818 mm × 362 mm were opened (Table 2). One side of the sliding window, with a height of 2118 mm, was opened to facilitate the lowering of the external shutters by 500 mm for maximum ventilation. The windows are shown in Figure 4b.

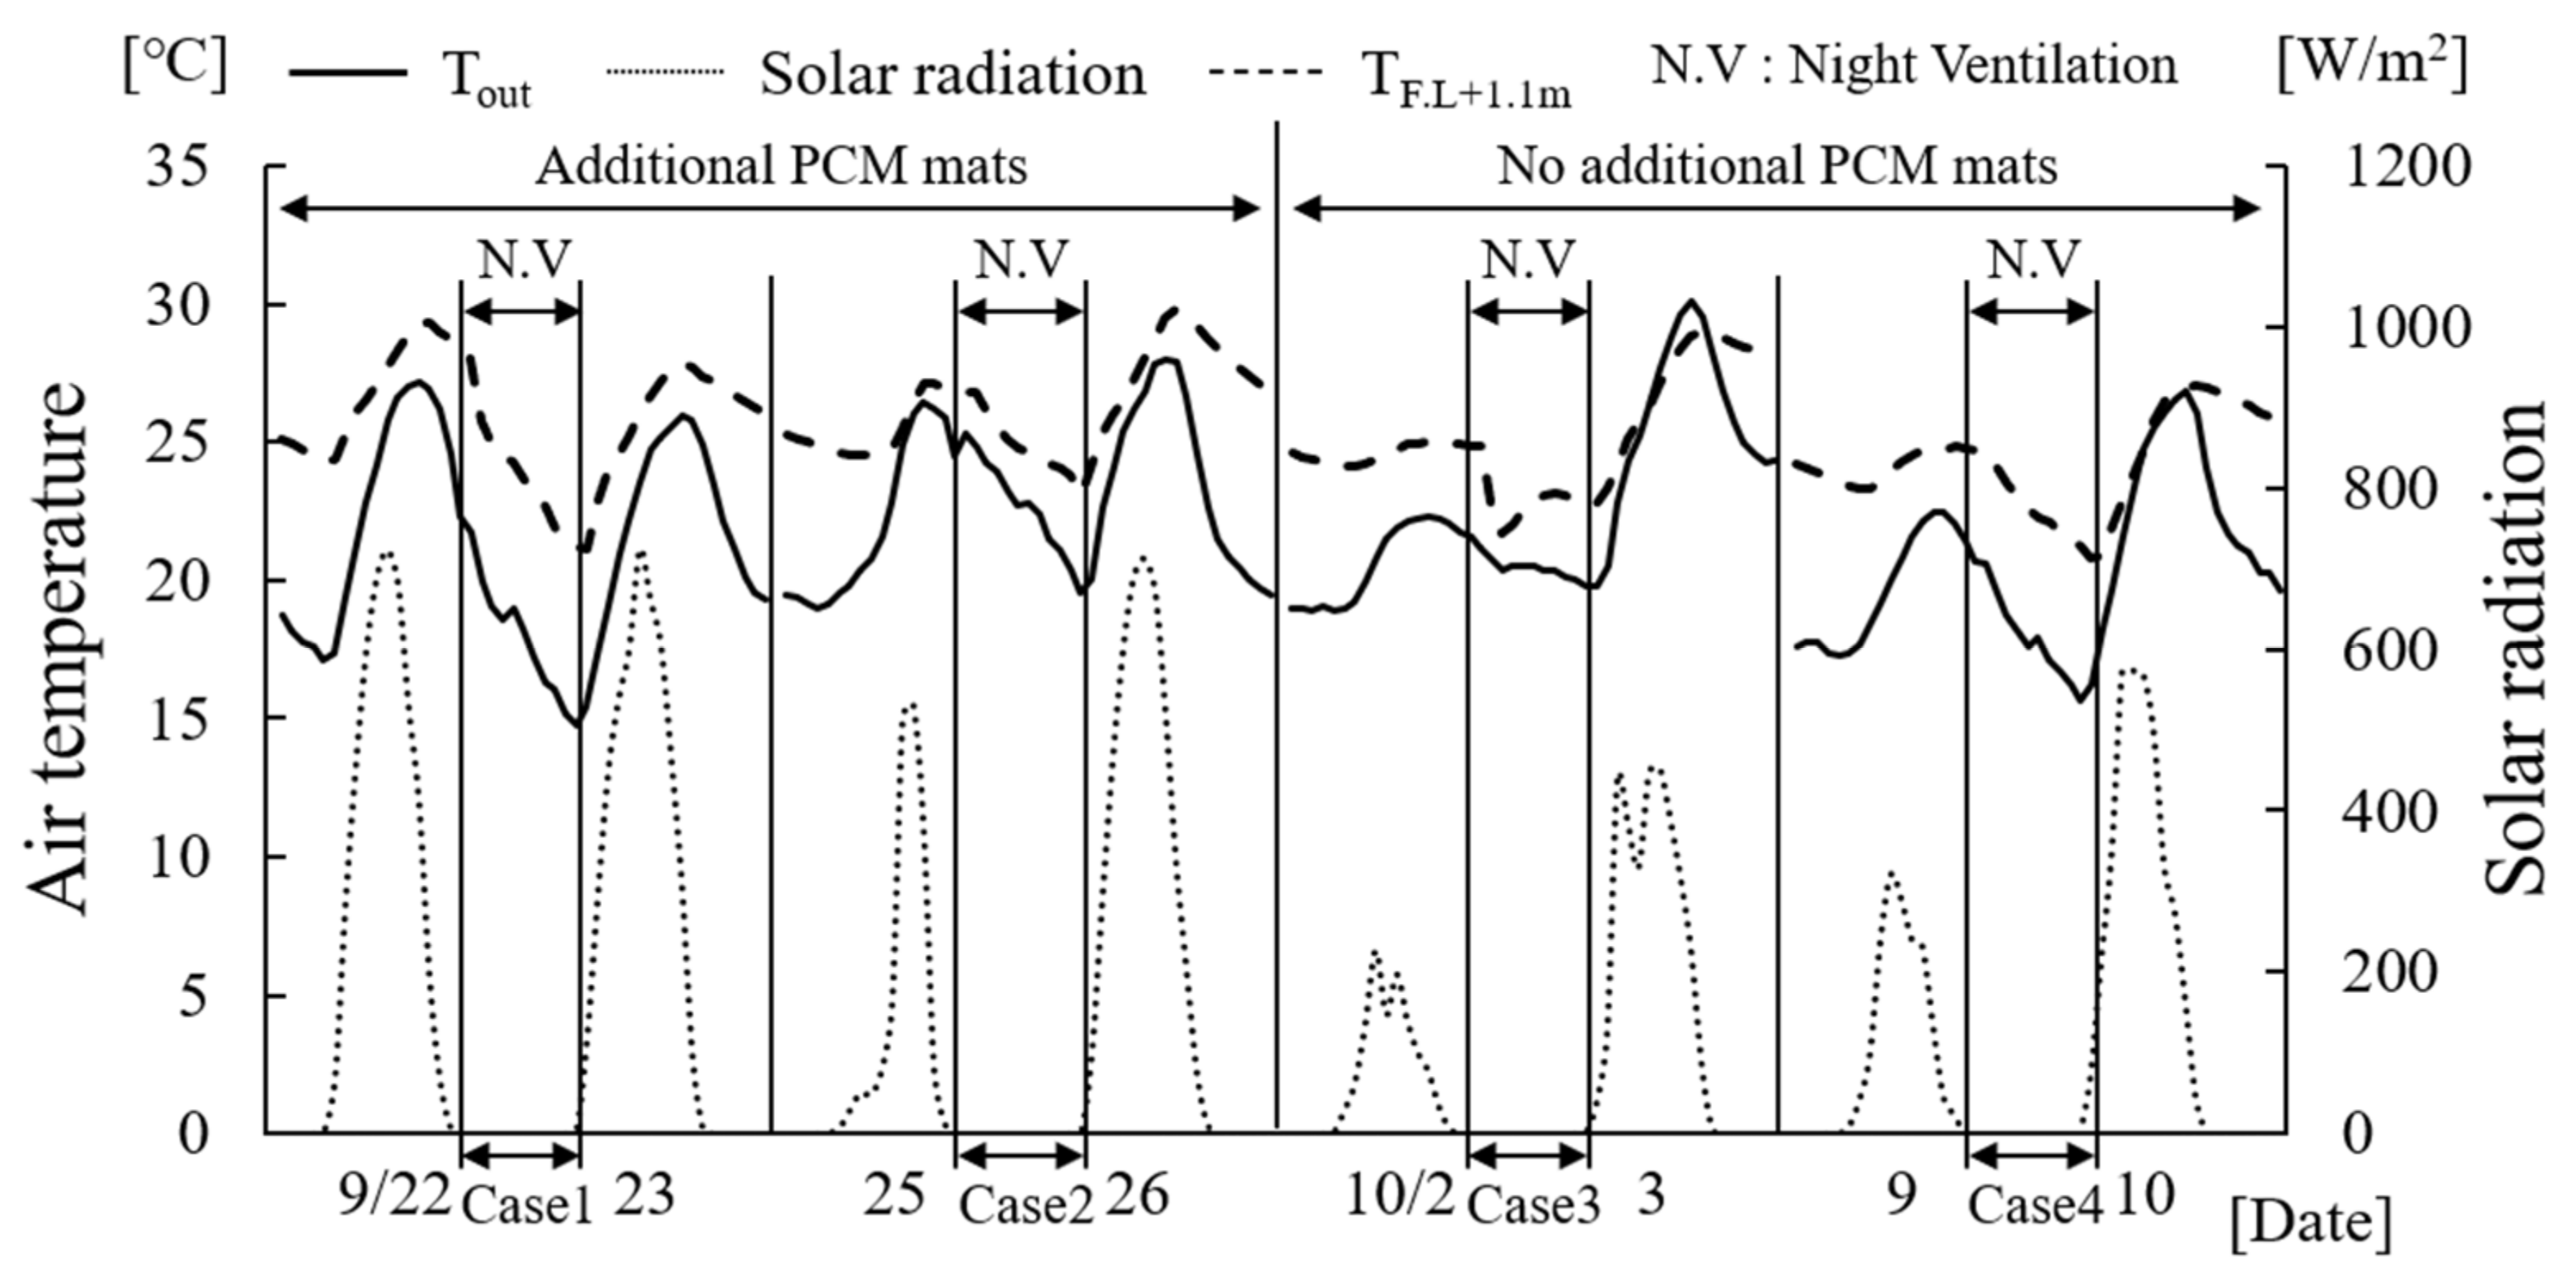
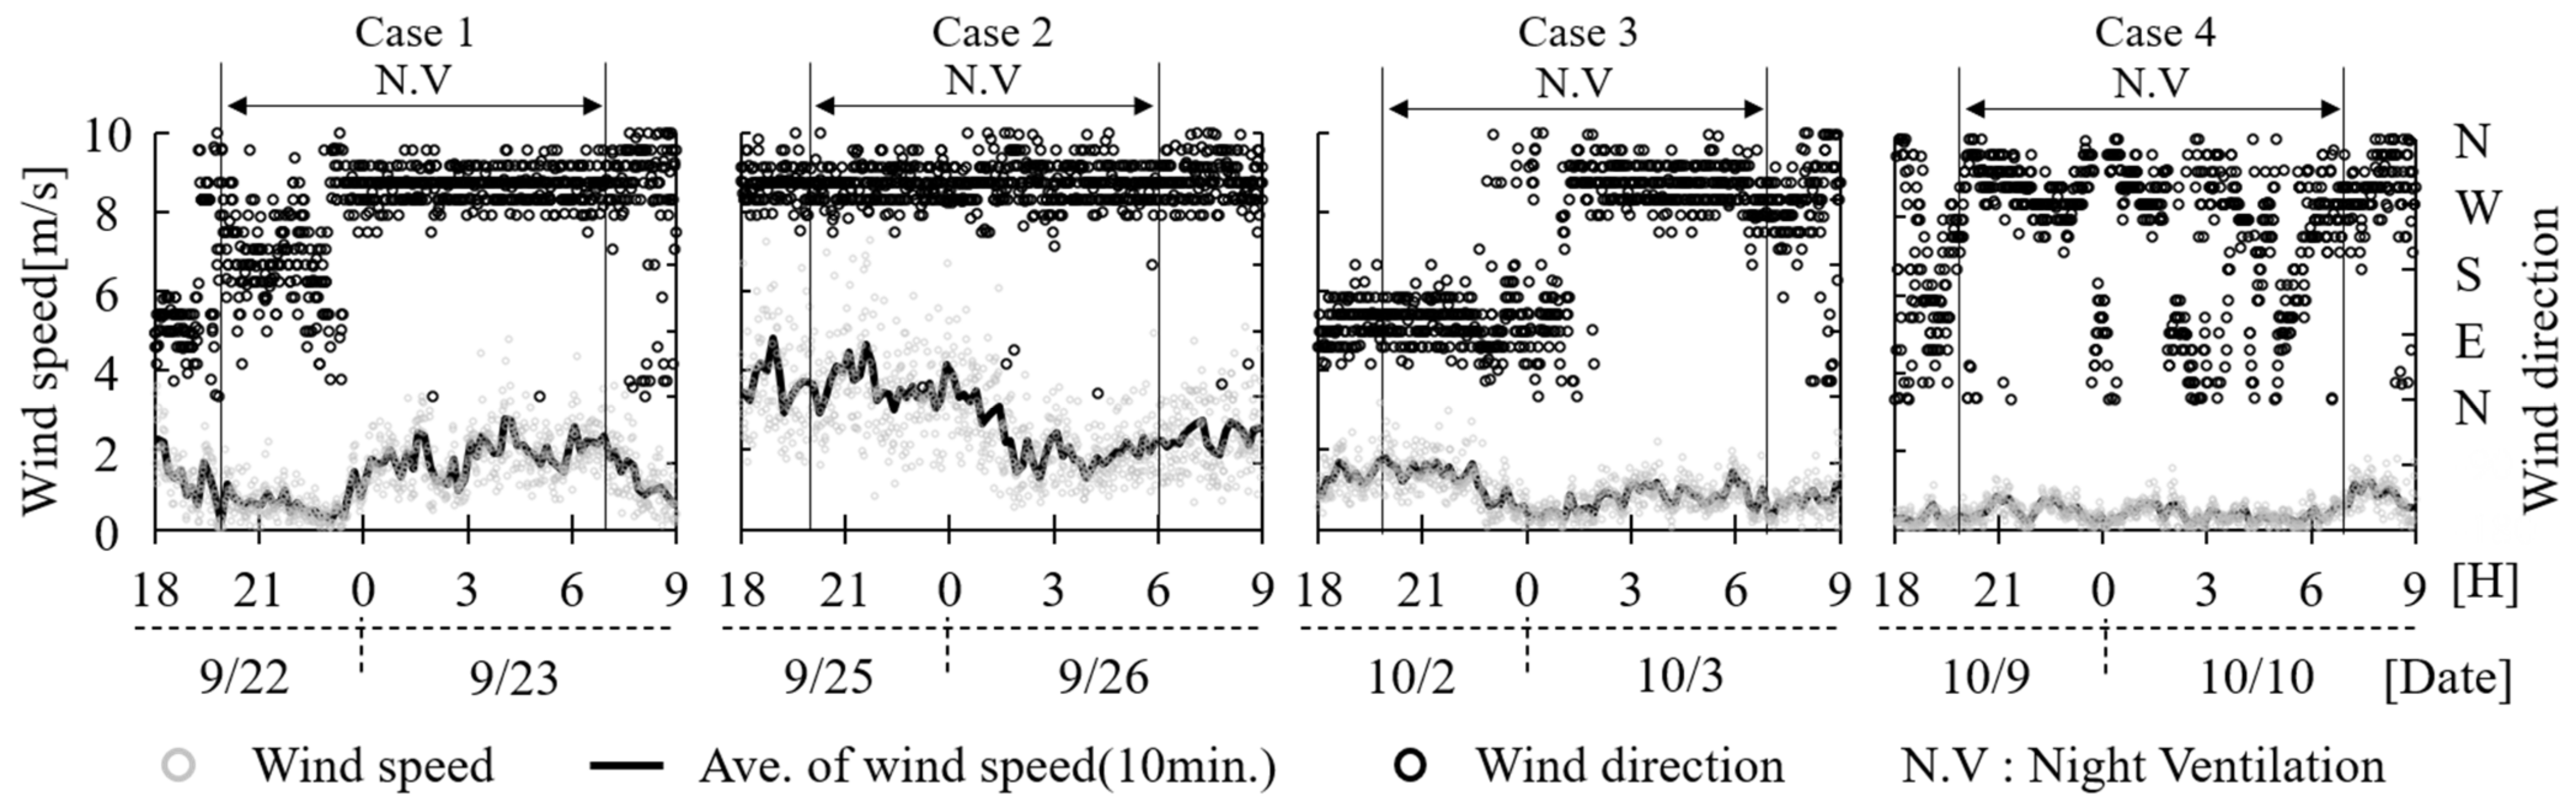
2.2. Weather Conditions

Figure 5 and Figure 6 present the meteorological conditions observed on the measurement days. Here, TF.L+1.1m indicates the indoor air temperature at a height of 1.1 m, which is shown in Figure 5 to demonstrate the difference between the indoor and outdoor air temperatures on the measurement day. Case 1 denotes a day when the outside temperature reduced to 14.8 °C and the wind speed was low (approximately 2.3 m/s). Case 2 denotes a day when the outside temperature was 19.4–24.8 °C and the wind speed was high during the night-ventilation period. Case 3 was a cloudy day, where the outside temperature remained stable at approximately 20 °C. Lastly, Case 4 was an almost windless day where the outside temperature was 15.7 °C and the wind speed was less than 1 m/s. Four measurements were performed to determine the distribution of the indoor temperature during night ventilation under various weather conditions.

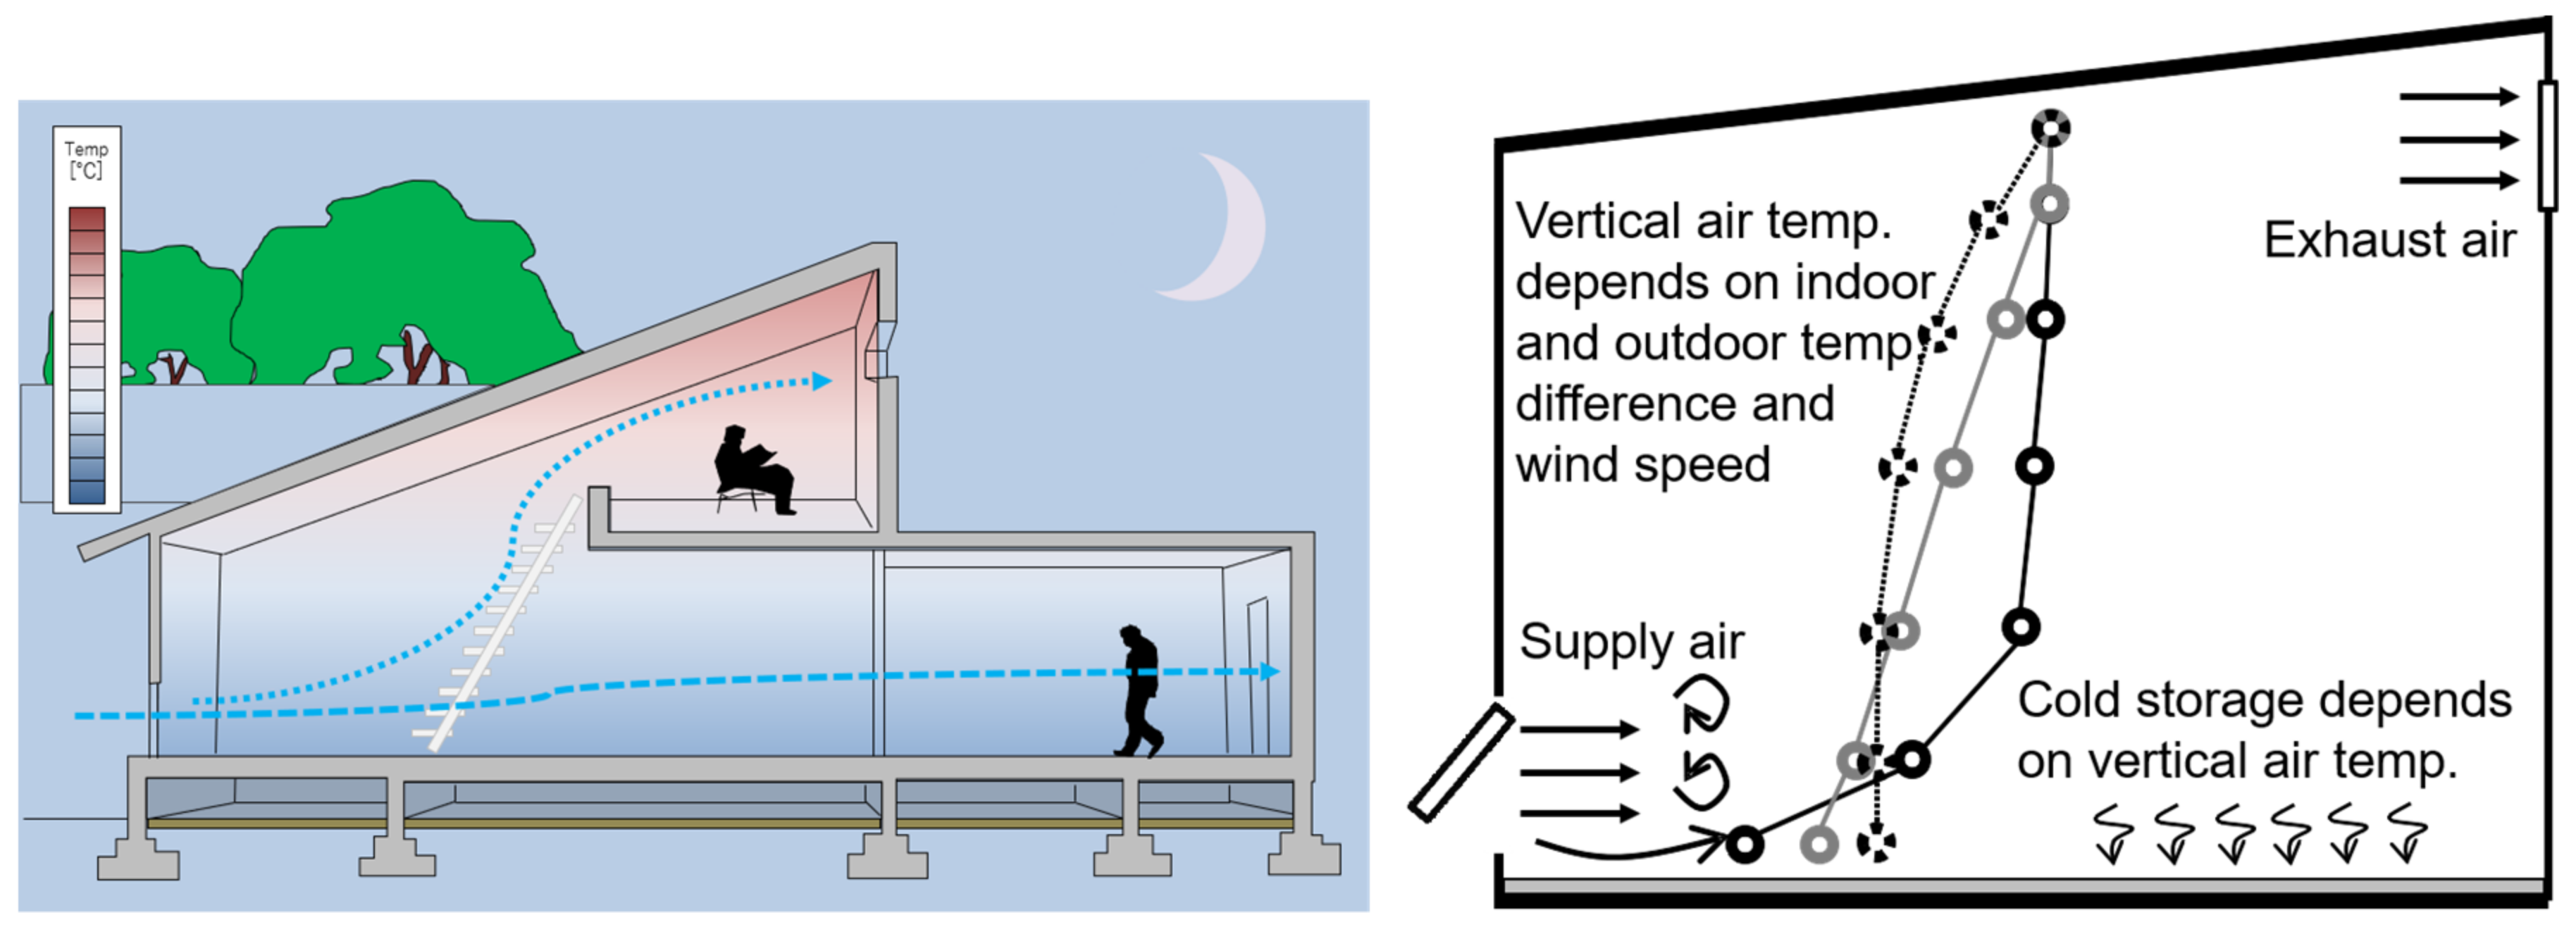
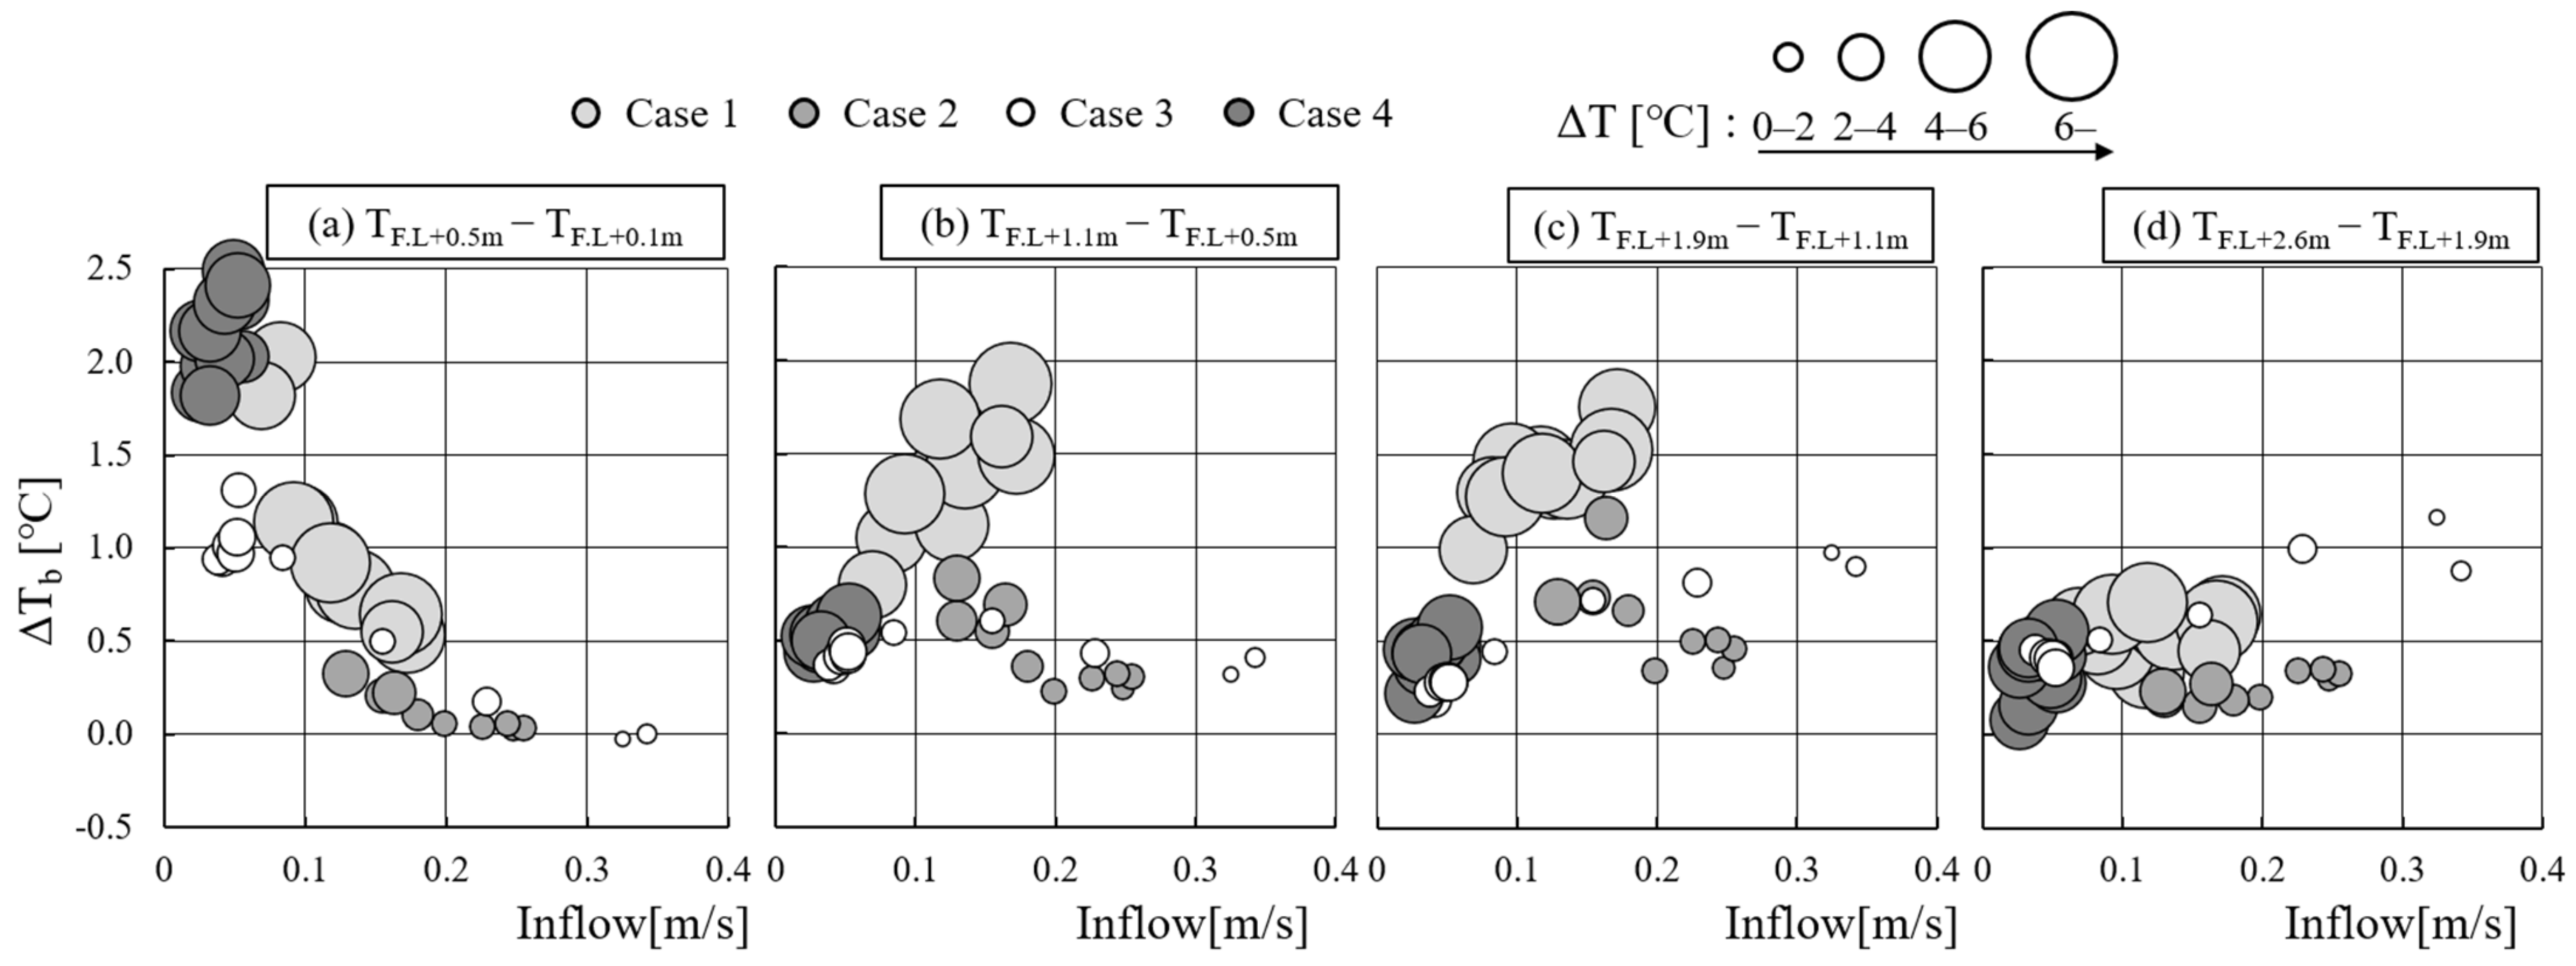
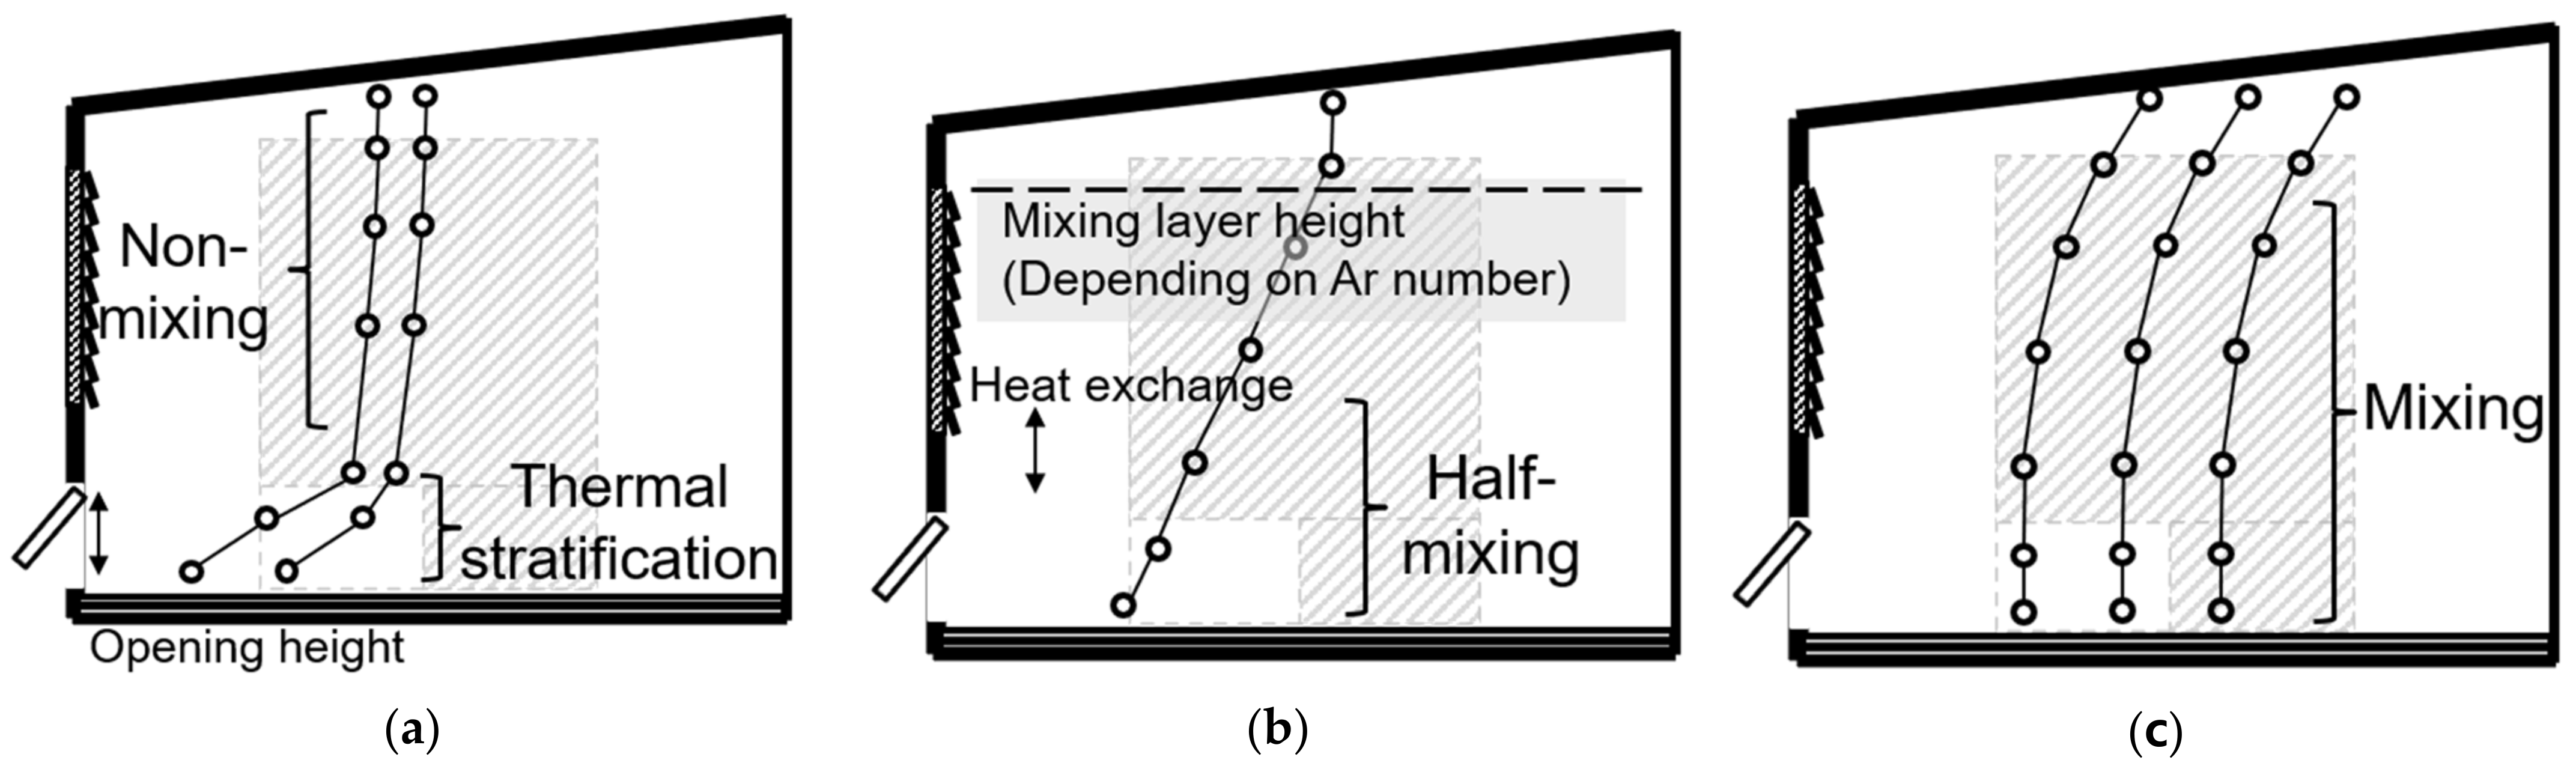
2.3. Parameters Affecting the Vertical Indoor Temperature Distribution

For each measurement day, Figure 7 presents the relationship between the indoor temperature distribution, indoor and outdoor temperature differences, and inflow wind speed. In Cases 1 and 4, when the outside temperature decreased to approximately 15 °C during night ventilation, the most significant temperature drop was observed, particularly on the room floor. In Case 4, the external wind speed was negligible and the inflow wind speed was less than 0.1 m/s. Compared to that in Case 1, the temperature difference near the floor, at a height immediately above the opening, exceeded 2 °C, indicating less heat transfer and a stable temperature distribution. In Cases 2 and 3, with minor changes in the outside temperature, the indoor temperature changes were minimal. In Case 3, the indoor air was well-mixed because of the high inflow wind speed, which facilitated an insignificant change in temperature.
Figure 8 shows the temperature difference between the blocks based on the inflow wind speed for each block, and that between the indoor and outdoor temperatures (circle size). The temperature difference between the blocks increased with an increase in the indoor–outdoor temperature, while the inlet wind speed decreased.
Thus, the measurement findings indicate that cold air entered the room during night ventilation, thereby generating a vertical temperature distribution. As is evident, the greater the difference between the outdoor and indoor air temperatures, the smaller the inflow velocity, and the lower the air temperature near the floor.

2.4. Thermal Characteristics of the Space with Night Ventilation

Figure 9 shows the results of the classification of the characteristics of the indoor vertical temperature distribution under each weather condition, obtained from the current measurement results. (a) At inflow wind speeds of 0.1 m/s or less, a temperature gradient that corresponded to the difference in the temperature between the inside and outside occurred up to the height of the opening; however, almost no temperature difference was observed in spaces exceeding the height of the opening. (b) Whereas, when the indoor inflow wind speed was 0.2 m/s or greater, a temperature gradient was observed even in the upper part of the room, depending on the difference in the temperature between the inside and outside, as well as on the magnitude of the inflow wind speed. (c) The size of the temperature gradient tended to be determined via the difference in temperature between the inside and outside of the room, and the speed of the inflowing wind. With an increase in the speed of the inflow air, the air in the lower part of the room was completely mixed, and the temperature difference tended to almost disappear.

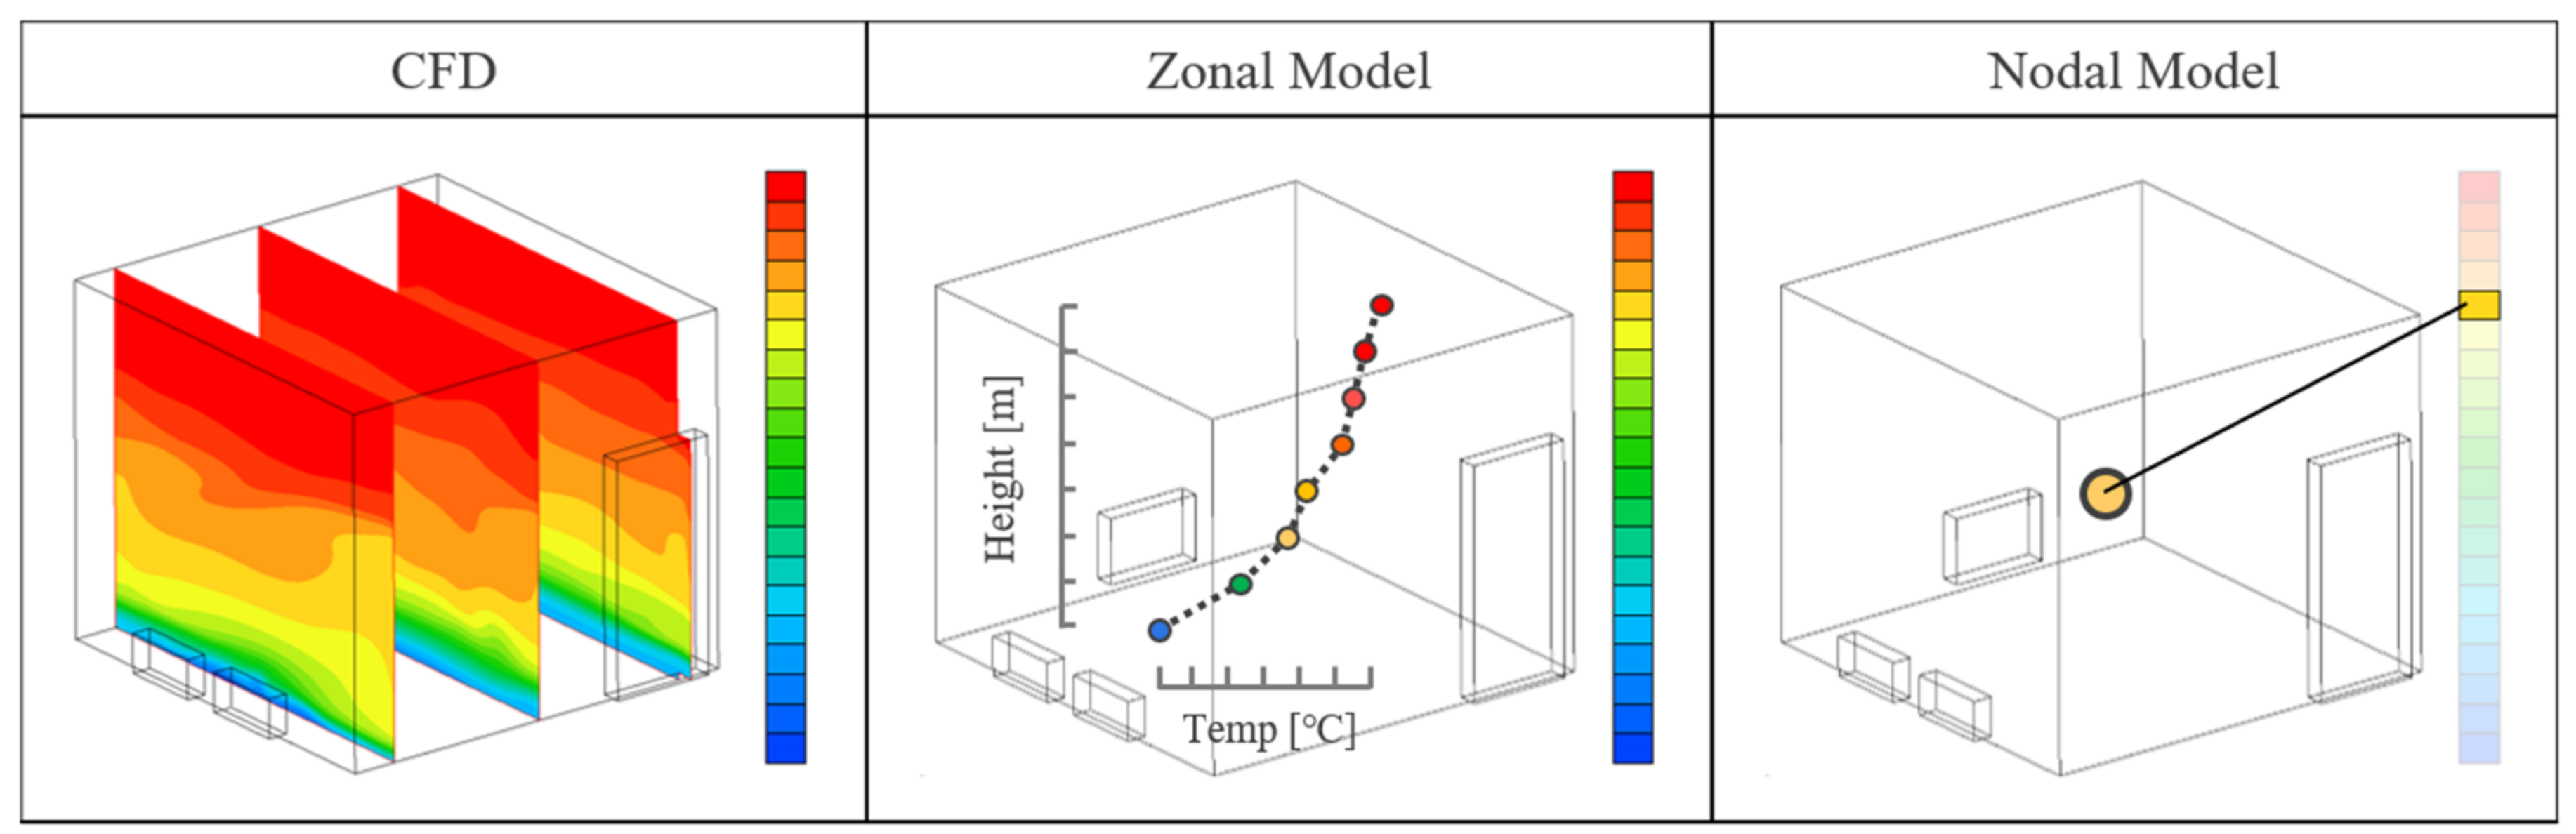
3. Block Model (Zonal Simulation or Numerical Analysis)

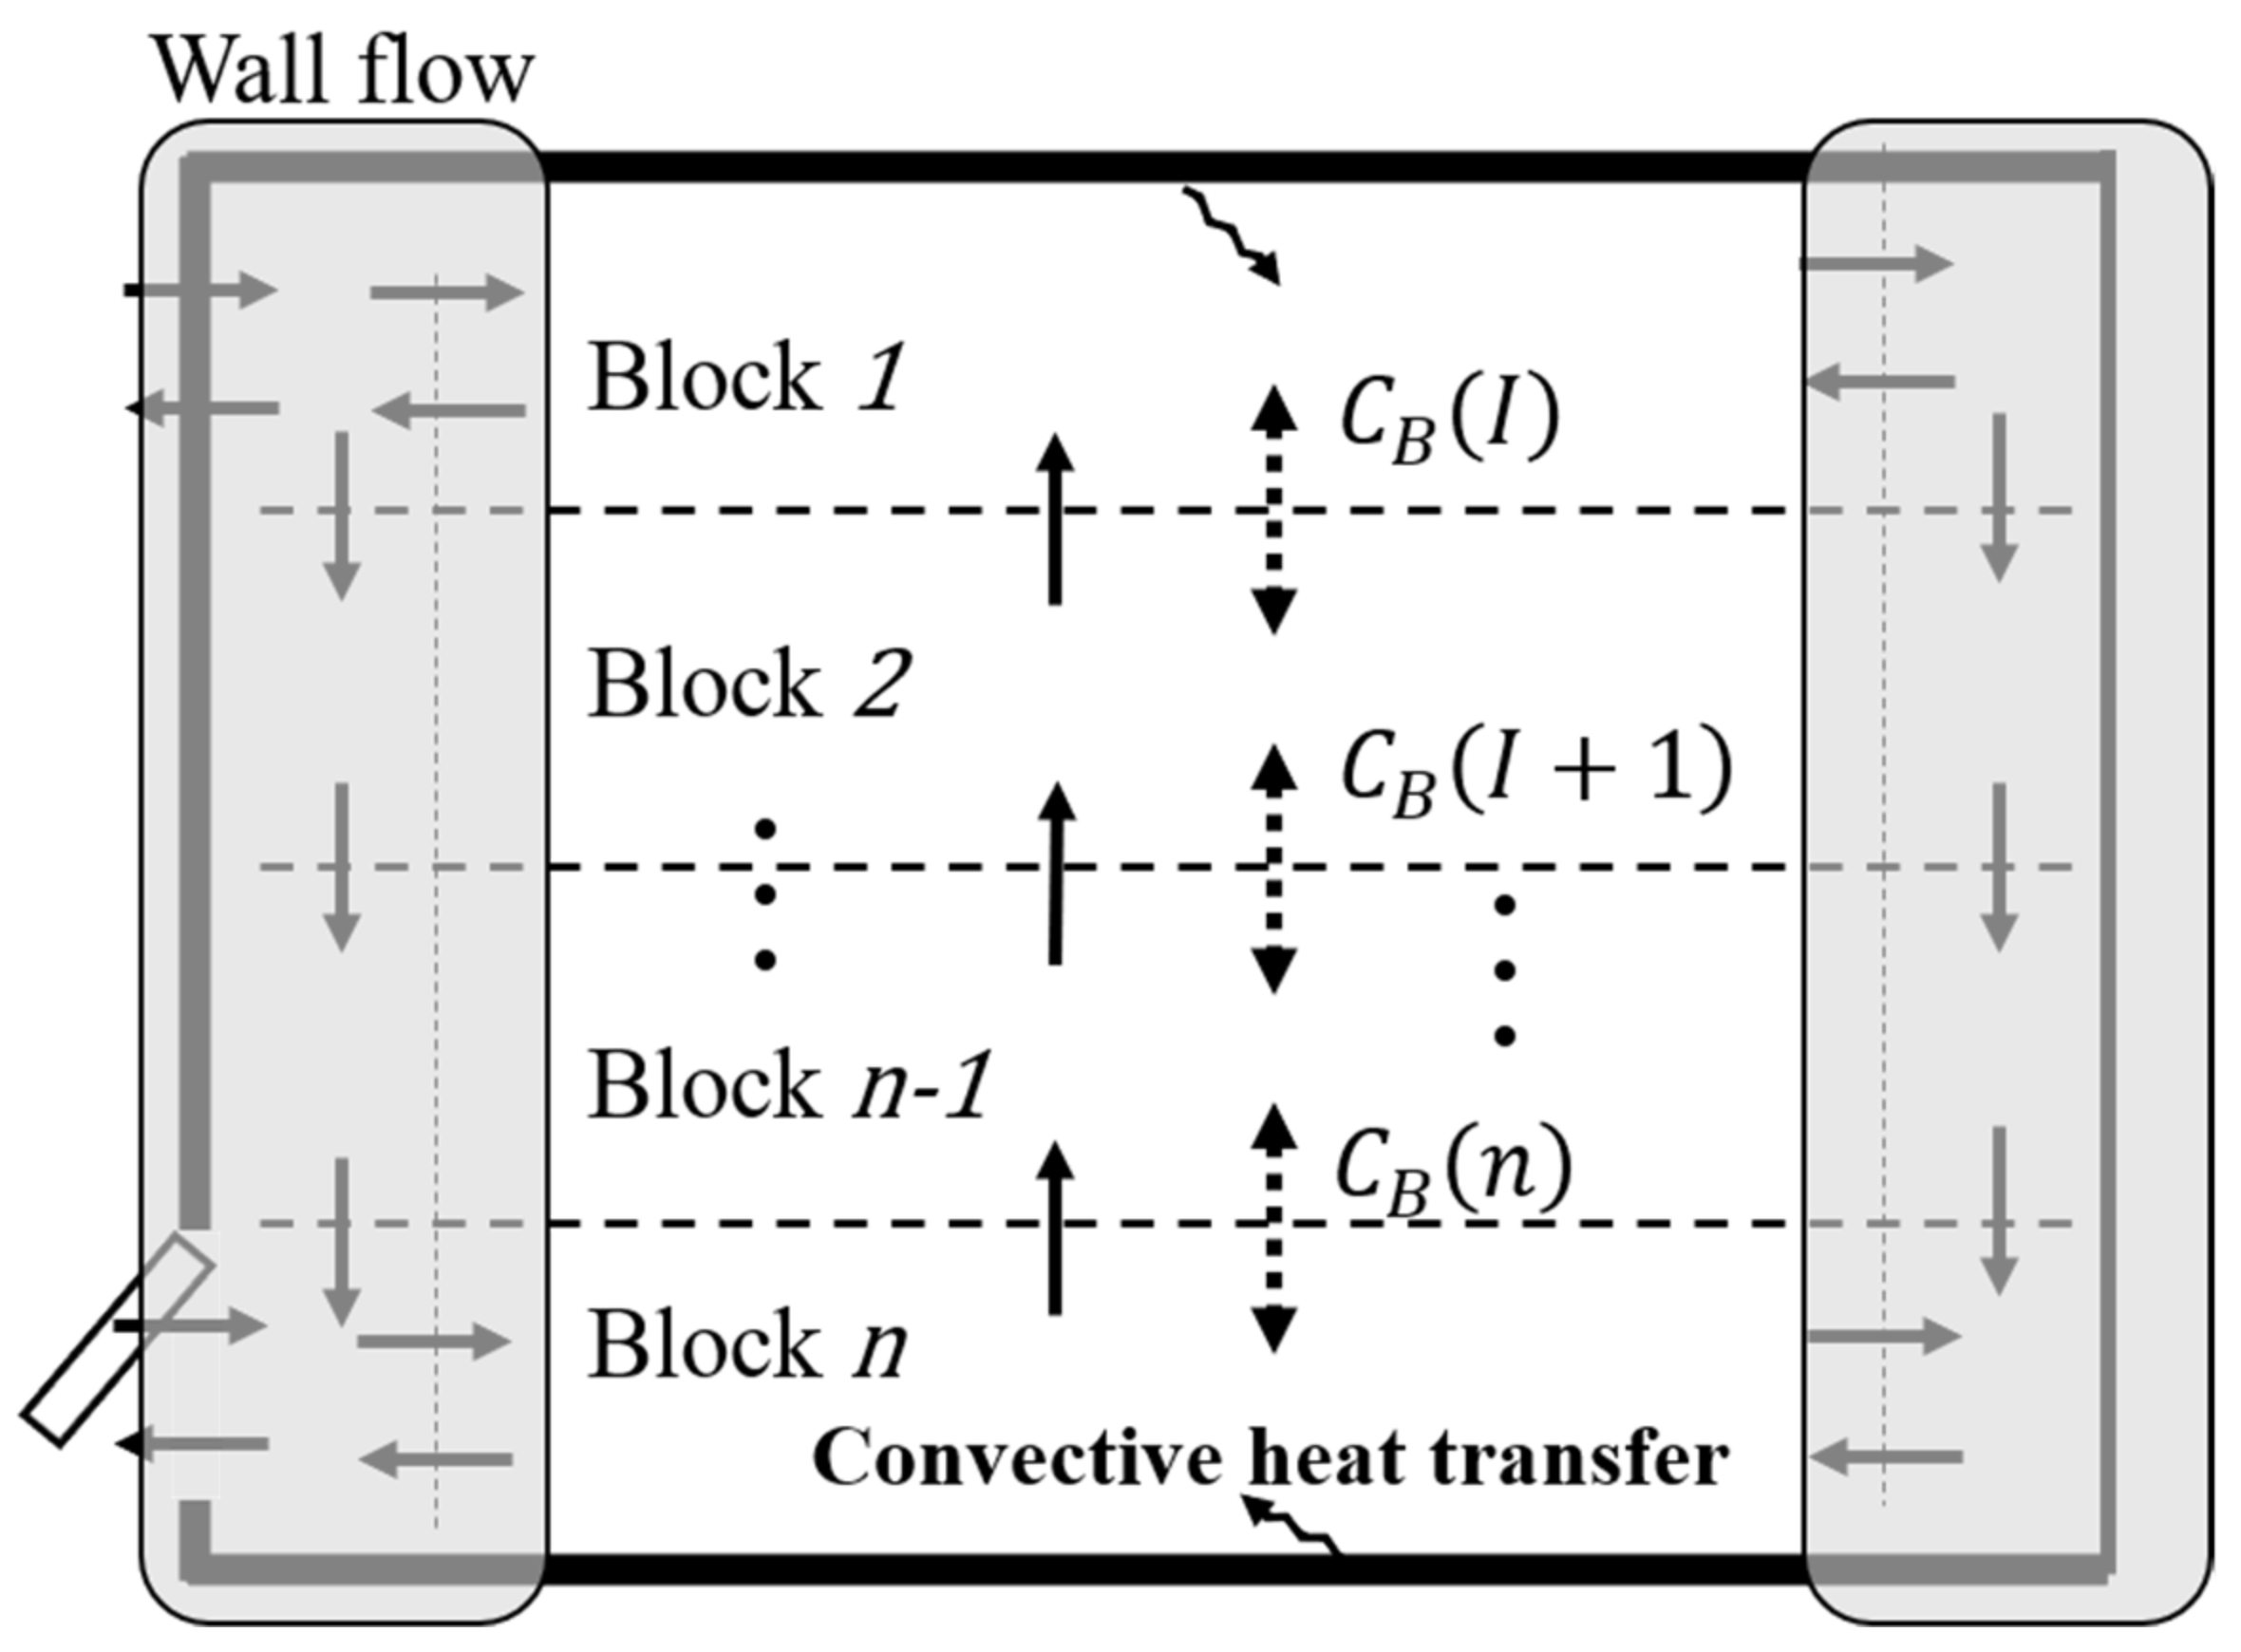
3.1. Model Description

Togari et al. [17,18] proposed a block model to predict the vertical temperature distribution in large spaces as a simplified theoretical framework that vertically divided a large space into multiple zones to assess and calculate the temperature gradients. This model comprises the following three types:
  • Wall surface current model: This model evaluates the ascending and descending air currents along vertical surfaces due to convective heat transfer. It employs boundary layer analysis on a flat plate to determine the air currents formed along the wall owing to the temperature difference between the wall and air (Figure 10);
  • Primary airstream evaluation model: This model considers the air streams discharged from the outlets as non-isothermal free jets. It assesses the influence of these jets on the vertical temperature distribution by entraining air from different zones, moving upward owing to buoyancy, and affecting the surrounding air temperatures;
  • Heat transfer by temperature difference between adjacent zones: This component is used to calculate the heat transfer caused by the temperature difference between vertically adjacent zones. It employs a heat transfer factor to model the conduction and convection processes between zones.
These combined models aid the prediction and analysis of the vertical temperature distribution in large spaces.
In this study, the indoor air temperature distribution was predicted using a block model owing to its similarity to the indoor thermal environment caused by natural ventilation at night and temperature stratification. The primary airstream evaluation model was not considered in this study owing to the low air inflow.

3.2. Indoor Air Temperature Distribution

The block model, which predicts the vertical temperature distribution through the division of the space into multiple blocks, wherein non-uniform temperature distributions are known to occur, was used as the indoor temperature distribution model in this study. The room was divided into 27 upper and lower blocks, as well as blocks adjacent to the wall. The vertical temperature distribution was predicted by solving the mass balance equation between each adjacent block and the heat balance equation, considering advection, diffusion, and convective heat transfer with the wall (Figure 11). This analysis was performed in the same room as that used for the measurements described in Section 2. To facilitate easier calculations, a room with a flat rather than sloped roof, set at a height of 2.7 m, was used. Figure 12 shows the block model for the numerical simulations used in this study.
The block model employed a non-isothermal jet model to calculate the mass and heat movement attributable to the vortex generated by the inflow air. However, owing to the inflow not being sufficiently strong in this study, the non-isothermal jet model was not used. This is because it did not significantly affect the analysis results. The air movement was calculated by considering the flow rate entering through the floor-level window, and the cooling downflow along the wall at night. Heat transfer between the blocks in the room was determined using the heat transfer coefficient (CB). Herein, CB is generally assumed to be 2.3 W/(m2·°C) for large-space buildings [17,18]. However, the CB was determined to be 14.8 W/(m2·°C) in the DOE-2 software (version DOE-2) [34], and set at 10 W/(m2·°C) in an atrium space [35]. This coefficient varies according to the different regions of an indoor space, and its value can be calibrated using CFD [36]. The maximum CB reached 28 W/(m2·°C) in the case of an extremely turbulent flow [37]. Furthermore, the indoor temperature distribution was predicted considering the measured values of the heat transfer coefficient.

3.3. Heat Transfer in Each Block

The indoor temperature and airflow during night ventilation were proportional to the indoor–outdoor temperature difference, and inversely proportional to the inflow wind speed. The Archimedes number (Ar) was introduced to represent the relationship between the indoor–outdoor temperature difference and wind speed, based on the measurement results. Consequently, Ar can be used to determine the turbulent diffusion coefficient in each block, and to predict the indoor temperature distribution in a room with night ventilation.
The relationship between the heat transfer and turbulent diffusion coefficients, and the formula for Ar, are as follows:
CB(I) = at∙C·r⁄Hb,
CB(I): Heat transfer coefficient [J/K·m3]
at: Turbulent diffusion coefficient [m2/s]
C∙r: Heat capacity [J/K]
Hb: Height [m]
Ar = {g × β × √Ain × (T − TSA)}/VSA2,
g: Gravitational acceleration [m2/s]
VSA: Inflow wind speed [m/s]
TSA: Inflow air temperature [°C]
Ain: Opening area [m2]
β: Coefficient of expansion [1/K]
T: Air temperature [°C]
The relationship between Ar and the turbulent diffusion coefficient in each block is shown in Figure 13. The lowest turbulent diffusion coefficient (at_lower) was highly correlated with Ar; the correlation decreased with increased distance from the opening (upper block). However, the cold storage capacity of PCMs was closely related to the floor surface temperature. The air temperature of the lowest block strongly influenced the surface temperature of the PCMs on the floor of a detached house. These results can be used to predict the air temperature distribution.

3.4. Verification

In the verification phase of this study, the indoor air temperature distribution was systematically predicted by employing the heat transfer coefficient derived from the empirical correlations, as depicted in Figure 14. For each day of measurement, predictions were based on weather data specific to the study’s target area. The wall surface temperatures, floor and ceiling temperatures, inflow air temperature, and wind speed were obtained as input data from the weather data of the target area.
Additionally, the convective heat transfer coefficient was determined to be 5 kcal/hm2K. The initial temperatures of the building blocks were estimated using assumed baseline values. The simulation’s predictive accuracy was validated by comparing the predicted results with measurements taken during the study. These comparisons are graphically represented in Figure 14. The alignment between measured and predicted temperature distributions was quantitatively assessed at several intervals—specifically 4, 7, and 10 h following the initiation of night ventilation. The root–mean–square error (RMSE) was calculated for temperatures near the floor (0.1 m above floor level), where the thermal effects of the PCM were most pronounced. The RMSE values for Cases 1 through 4 were found to be 0.28, 0.36, 0.25, and 0.44 °C, respectively.
These findings not only confirm the reliability of our predictive model but also underscore the significance of the heat transfer coefficient in modeling indoor temperature dynamics during night ventilation with PCM.

3.5. Discussion

A typical nodal model predicts the temperatures based on the assumption of homogeneous thermal conditions within a room. However, in this study, which utilized night ventilation combined with floor-installed PCMs as a passive cooling strategy, some temperature differences were observed. Specifically, temperatures near the floor were found to be approximately 3 °C lower than those at the center of the room. This is attributable to the outdoor climatic conditions. Such a disparity is critical, as a deviation of 3 °C can significantly influence the phase-change temperature of the PCMs, resulting in inaccuracies in the assessment of their cold storage. Therefore, this study underscores the need to reconsider the placement and utilization of PCMs in building designs, particularly when they are employed in night-time floor-level installations.

4. Conclusions

This study conducted in-situ measurements to clarify the indoor temperature distribution during night ventilation through a floor-level window, and consequently confirm the synergistic effect. Subsequently, the heat transfer coefficient was clarified for use in a numerical analysis model to design an optimal building with night ventilation and PCMs. The indoor air temperature was distributed during night ventilation with a floor-level window. The temperature distribution was proportional to the difference between the indoor and outdoor temperatures, and inversely proportional to the inflow wind speed. Further, the numerical analysis model predicted indoor air temperature distributions using blocks along the vertical direction. In such analyses, the numerical heat transfer coefficient must be specified. The heat transfer coefficient can be calculated from the measurement findings using Ar, which is a dimensionless number based on the temperature difference and wind speed. The predicted and measured indoor air temperature distributions were compared using the calculated heat transfer coefficients. The predicted air temperature near the floor yielded an RMSE of 0.25–0.44 °C.
This study focused primarily on thermal management strategies during the summer season. However, for comprehensive year-round efficiency, special consideration is required for the selection of phase-change materials (PCMs) during the winter. The phase-change temperature of these materials is critical, particularly in ensuring effective indoor heating. Moreover, strategic placement of PCM, such as in the flooring where direct heat gain is more prevalent during winter months, can facilitate the melting of PCM. This placement leverages the latent heat release of PCM to enhance the indoor heating environment effectively in winter, while still contributing to cooling in the summer.
In future research, we will focus on the cold storage of PCM with night ventilation, and explore models for evaluating its performance. This research will be expanded to encompass various general climatic conditions and different types and scales of buildings.

Author Contributions

Conceptualization, T.L., R.S. and T.A.; methodology, T.L. and R.S.; software, T.L.; validation, T.L.; formal analysis, T.L.; investigation, T.L. and R.S.; resources, T.L., R.S. and T.A.; data curation, T.L., R.S. and T.A.; writing—original draft preparation, T.L. and R.S.; writing—review and editing, T.L., R.S., T.A. and S.Y.; visualization, T.L.; supervision, T.A. and S.Y.; project administration, R.S. and T.A.; funding acquisition, S.Y. All authors have read and agreed to the published version of the manuscript.

Funding

This research was funded by 2023 BK21 FOUR Graduate School Innovation Support funded by Pusan National University (PNU-Fellowship program), Korea Ministry of Environment (MOE) as “Graduate School specialized in Climate Change” and National Research Foundation of Korea (NRF) grant funded by the Korea government (MSIT) (No. RS-2023-00218875).

Data Availability Statement

The authors do not have permission to share data.

Acknowledgments

The authors would like to thank the Misawa Homes Institute of Research and Development Co., Ltd. for their support, especially for providing the measurement facilities.

Conflicts of Interest

The authors declare no conflicts of interest.

References

  1. IPCC AR6 SYR, Summary for Policemakers. Available online: https://www.ipcc.ch/report/ar6/syr/ (accessed on 1 April 2023).
  2. International Energy Agency. World Energy Outlook 2018; International Energy Agency: Paris, France, 2018. [CrossRef]
  3. Santamouris, M. Cooling the buildings—past, present and future. Energy Build. 2016, 128, 617–638. [Google Scholar] [CrossRef]
  4. Santamouris, M.; Asimakopoulos, D. Passive Cooling of Buildings; James and James Science Publishers: London, UK, 1996. [Google Scholar]
  5. Solgi, E.; Hamedani, Z.; Fernando, R.; Skates, H.; Orji, N.E. A literature review of night ventilation strategies in buildings. Energy Build. 2018, 173, 337–352. [Google Scholar] [CrossRef]
  6. Shaviv, E.; Yezioro, A.; Capeluto, I.G. Thermal mass and night ventilation as passive cooling design strategy. Renew. Energy 2001, 24, 445–452. [Google Scholar] [CrossRef]
  7. Exizidou, P.; Christoforou, E.; Fokaides, P.A. Numerical assessment of night ventilation impact on the thermal comfort of vernacular buildings. J. Build. Pathol. Rehabil. 2017, 2, 2. [Google Scholar] [CrossRef]
  8. Blondeau, P.; Spérandio, M.; Allard, F. Night ventilation for building cooling in summer. Sol. Energy 1997, 61, 327–335. [Google Scholar] [CrossRef]
  9. Borderon, J.; Virgone, J.; Cantin, R.; Kuznik, F. Full-scale study of a building equipped with a multi-layer rack latent heat thermal energy storage system. HVACR Res. 2011, 17, 566–576. [Google Scholar] [CrossRef]
  10. Ling, H.; Chen, C.; Wei, S.; Guan, Y.; Ma, C.; Xie, G.; Li, N.; Chen, Z. Effect of phase change materials on indoor thermal environment under different weather conditions and over a long time. Appl. Energy 2015, 140, 329–337. [Google Scholar] [CrossRef]
  11. Wang, X.; Yu, H.; Li, L.; Zhao, M. Experimental assessment on the use of phase change materials (PCMs)-bricks in the exterior wall of a full-scale room. Energy Convers. Manag. 2016, 120, 81–89. [Google Scholar] [CrossRef]
  12. Wonorahardjo, S.; Sutjahja, I.M.; Tunçbilek, E.; Achsani, R.A.; Arıcı, M.; Rahmah, N. PCM-based passive air conditioner in urban houses for the tropical climates: An experimental analysis on the stratum air circulation. Build. Environ. 2021, 192, 107632. [Google Scholar] [CrossRef]
  13. Andersen, K.T. Theory for natural ventilation by thermal buoyancy in one zone with uniform temperature. Build. Environ. 2003, 38, 1281–1289. [Google Scholar] [CrossRef]
  14. Fanger, P.O. Local discomfort to the human body caused by non-uniform thermal environments. Ann. Occup. Hyg. 1977, 20, 285–291. [Google Scholar] [CrossRef] [PubMed]
  15. Santamouris, M.; Sfakianaki, A.; Pavlou, K. On the efficiency of night ventilation techniques applied to residential buildings. Energy Build. 2010, 42, 1309–1313. [Google Scholar] [CrossRef]
  16. Ito, H.; Yokoi, M.; Nakahara, N. Simplified calculation model of vertical air temperature distribution during heating in air-conditioned room—Studies on thermal properties in air-conditioned space Part 2. J. Archit. Plann. Environ. Engng AIJ 1989, 398, 59–67. [Google Scholar] [CrossRef] [PubMed]
  17. Togari, S.; Arai, Y.; Miura, K. Simplified prediction model of vertical air temperature distribution in a large space—Study on a thermal environment design system for large spaces, Part 1. J. Archit. Plan. Environ. Eng. AIJ 1991, 427, 9–19. [Google Scholar] [CrossRef] [PubMed]
  18. Togari, S.; Arai, Y.; Miura, K. A simplified model for predicting vertical temperature distribution in a large space. ASHRAE Trans. 1993, 99, 84–99. Available online: https://www.scopus.com/inward/record.uri?eid=2-s2.0-0027269039&partnerID=40&md5=8a73bb2ccc4ca8ee55fa2759b0ced9b3 (accessed on 2 April 2024).
  19. Inard, C.; Bouia, H.; Dalicieux, P. Prediction of air temperature distribution in buildings with a zonal model. Energy Build. 1996, 24, 125–132. [Google Scholar] [CrossRef]
  20. Wurtz, E.; Nataf, J.M.; Winkelmann, F. Two- and three-dimensional natural and mixed convection simulation using modular zonal models in buildings. Int. J. Heat Mass Transf. 1999, 42, 923–940. [Google Scholar] [CrossRef]
  21. Haghighat, F.; Li, Y.; Megri, A.C. Development and validation of a zonal model—POMA. Build. Environ. 2001, 36, 1039–1047. [Google Scholar] [CrossRef]
  22. Musy, M.; Wurtz, E.; Winkelmann, F.; Allard, F. Generation of a zonal model to simulate natural convection in a room with a radiative/convective heater. Build. Environ. 2001, 36, 589–596. [Google Scholar] [CrossRef]
  23. Musy, M.; Winkelmann, F.; Wurtz, E.; Sergent, A. Automatically generated zonal models for building air flow simulation: Principles and applications. Build. Environ. 2002, 37, 873–881. [Google Scholar] [CrossRef]
  24. Higashimoto, T.; Yamanaka, T.; Kotani, H.; Hanano, H. Temperature and contaminant concentration distribution of displacement ventilated rooms with cooled wall. J. Environ. Eng. AIJ 2003, 68, 47–53. [Google Scholar] [CrossRef] [PubMed]
  25. Ren, Z.; Stewart, J. Simulating air flow and temperature distribution inside buildings using a modified version of COMIS with sub-zonal divisions. Energy Build. 2003, 35, 257–271. [Google Scholar] [CrossRef]
  26. Wurtz, E.; Mora, L.; Inard, C. An equation-based simulation environment to investigate fast building simulation. Build. Environ. 2006, 41, 1571–1583. [Google Scholar] [CrossRef]
  27. Gao, J.; Zhao, J.; Xiaodong, L.; Gao, F. A Zonal Model for Large Enclosures With Combined Stratification Cooling and Natural Ventilation Part 1—Model Generation and its Procedure. J. Sol. Energy Eng. 2006, 128, 367–375. [Google Scholar] [CrossRef]
  28. Zhao, B.; Yang, X.; Jiang, Y.; Gopal, V.; Dobbs, G.; Sahm, M. A new approach on zonal modeling of indoor environment with mechanical ventilation. Build. Environ. 2008, 43, 278–286. [Google Scholar] [CrossRef]
  29. Chen, Q. Ventilation performance prediction for buildings A method overview and recent applications. Build. Environ. 2009, 44, 848–858. [Google Scholar] [CrossRef]
  30. Megri, A.C.; Yu, Y. New calibrated zonal model (POMA+) for temperature and airflow predictions. Build. Environ. 2015, 94, 109–121. [Google Scholar] [CrossRef]
  31. Huang, C.; Li, R.; Liu, Y.; Liu, J.; Wang, X. Study of indoor thermal environment and stratified air-conditioning load with low-sidewall air supply for large space based on Block-Gebhart model. Build. Environ. 2019, 147, 495–505. [Google Scholar] [CrossRef]
  32. Wang, X.; Yang, Y.; Xu, Y.; Wang, F.; Zhang, Q.; Huang, C.; Shi, C. Prediction of vertical thermal stratification of large space buildings based on Block-Gebhart model: Case studies of three typical hybrid ventilation scenarios. J. Build. Eng. 2021, 41, 102452. [Google Scholar] [CrossRef]
  33. Lee, T.; Sato, R.; Asawa, T.; Kawai, H.; Hirayama, Y.; Ohya, I.; Sato, Y.; Hayashi, Y. Study on cold storage of phase change material on the floor of a house with night natural ventilation. J. Environ. Eng. (Trans. AIJ) 2017, 82, 1025–1034. (In Japanese) [Google Scholar] [CrossRef]
  34. Landsberg, D.R.; Misuriello, H.P.; Moreno, S. Design strategies for energy-efficient atrium spaces. ASHRAE Trans. 1986, 92 Pt 2, 310–328. Available online: https://www.scopus.com/inward/record.uri?eid=2-s2.0-0022940710&partnerID=40&md5=88e2d69119e7811b3c330f27ac78b0d2 (accessed on 15 January 2023).
  35. Chow, W.K. Assessment of thermal environment in an atrium with air-conditioning. J. Environ. Syst. 1996, 25, 409–420. [Google Scholar] [CrossRef]
  36. Gao, J.; Zhang, X.; Zhao, J.; Gao, F. A heat transfer parameter at air interfaces in the BLOCK model for building thermal environment. Int. J. Therm. Sci. 2010, 49, 463–470. [Google Scholar] [CrossRef]
  37. Wang, H.; Zhou, P.; Guo, C.; Tang, X.; Xue, Y.; Huang, C. On the calculation of heat migration in thermally stratified environment of large space building with sidewall nozzle air-supply. Build. Environ. 2019, 147, 221–230. [Google Scholar] [CrossRef]
Figure 1. Visual representation of natural night ventilation with phase-change materials (PCMs).
Buildings 14 01872 g001
Figure 2. Numerical analysis methodologies for indoor air temperature distribution.
Buildings 14 01872 g002
Figure 3. Floor plan and measurement points: (a) floor plan of the target building; (b) measurement points (floor plan); (c) measurement points (cross-section) [33].
Buildings 14 01872 g003
Figure 4. (a) cross-section of the floor; (b) photo of target space [33].
Buildings 14 01872 g004
Figure 5. Weather conditions (air temperature and solar radiation) [33].
Buildings 14 01872 g005
Figure 6. Weather conditions (windspeed and direction) [33].
Buildings 14 01872 g006
Figure 7. Measurement results (indoor air and surface temperature distribution, and inflow air) [33].
Buildings 14 01872 g007
Figure 8. Correlation between inflow speed and difference in air temperature in each block (ΔTb), and difference in indoor and outdoor air temperatures [33].
Buildings 14 01872 g008
Figure 9. Classification of shape of vertical air temperature distribution by wind speed: (a) Vin: below 0.1 m/s; (b) Vin: approximately 0.2 m/s; (c) Vin: exceeding 0.3 m/s [33].
Buildings 14 01872 g009
Figure 10. Togari et al.’s wall surface current model (descending flow) [17,18].
Buildings 14 01872 g010
Figure 11. Mass conservation and heat balance equations of the Togari model [17,18].
Buildings 14 01872 g011
Figure 12. Schematic of numerical model of vertical air temperature distribution.
Buildings 14 01872 g012
Figure 13. Correlation between Ar number and turbulent diffusion coefficient.
Buildings 14 01872 g013
Figure 14. Comparison of verification of air temperature distribution measurement, and numerical results.
Buildings 14 01872 g014
Table 1. Measurement items.
ItemsInstrumentAccuracy
Air temperature0.1-mmΦ T-type thermocouple−40 °C to 125 °C: ±0.5 °C
Relative humidityResistance change type (TDK (Tokyo, Japan), CHS-UPS)0 °C to 50 °C: ±3% RH
Globe temperature0.1-mmΦ T-type thermocouple inside a globe thermometer−40 °C to 125 °C: ±0.5 °C
Surface temperature0.3-mmΦ T-type thermocouple−40 °C to 125 °C: ±0.5 °C
Wind speed in indoor spacesAir velocity probe (KANOMAX (Tokyo, Japan), 0965-09)±3% (KANOMAX)
Wind direction & speed3D ultrasonic anemometers
(Young-81000): Outdoor measurement
(KAIJO (Tokyo, Japan), DA-600): Indoor measurement
±1%, ±0.05 m/s
(Young-81000)
±2° (Young-81000)
±3% (KAIJO, DA-600)
±3° (KAIJO, DA-600)
Weather dataAir temp.: 0.1-mmΦ T-type thermocouple
Humidity: Resistance change type (TDK, CHS-UPS)
Wind: Wind vane anemometer (EKO (Tokyo, Japan), MA-110)
Solar radiation: Thermopile pyranometer
±5% (EKO, MA-110)
±5° (EKO, MA-110)
±5% (Thermopile pyranometer)
Table 2. Measurement information.
Case No.Date & Time of Natural VentilationAdditional PCM Mats on the Floor
Case 122 September—20 p.m.–23 September—7 a.m.
Case 225 September—20 p.m.–26 September—6 a.m.
Case 32 October—20 p.m.–3 October—7 a.m.×
Case 49 October—20 p.m.–10 October—7 a.m.×
Disclaimer/Publisher’s Note: The statements, opinions and data contained in all publications are solely those of the individual author(s) and contributor(s) and not of MDPI and/or the editor(s). MDPI and/or the editor(s) disclaim responsibility for any injury to people or property resulting from any ideas, methods, instructions or products referred to in the content.

