
Study on the Damping Efficiency of a Structure with Additional Viscous Dampers Based on the Shaking Table Test

Abstract
1. Introduction
2. Shaking Table Test Design
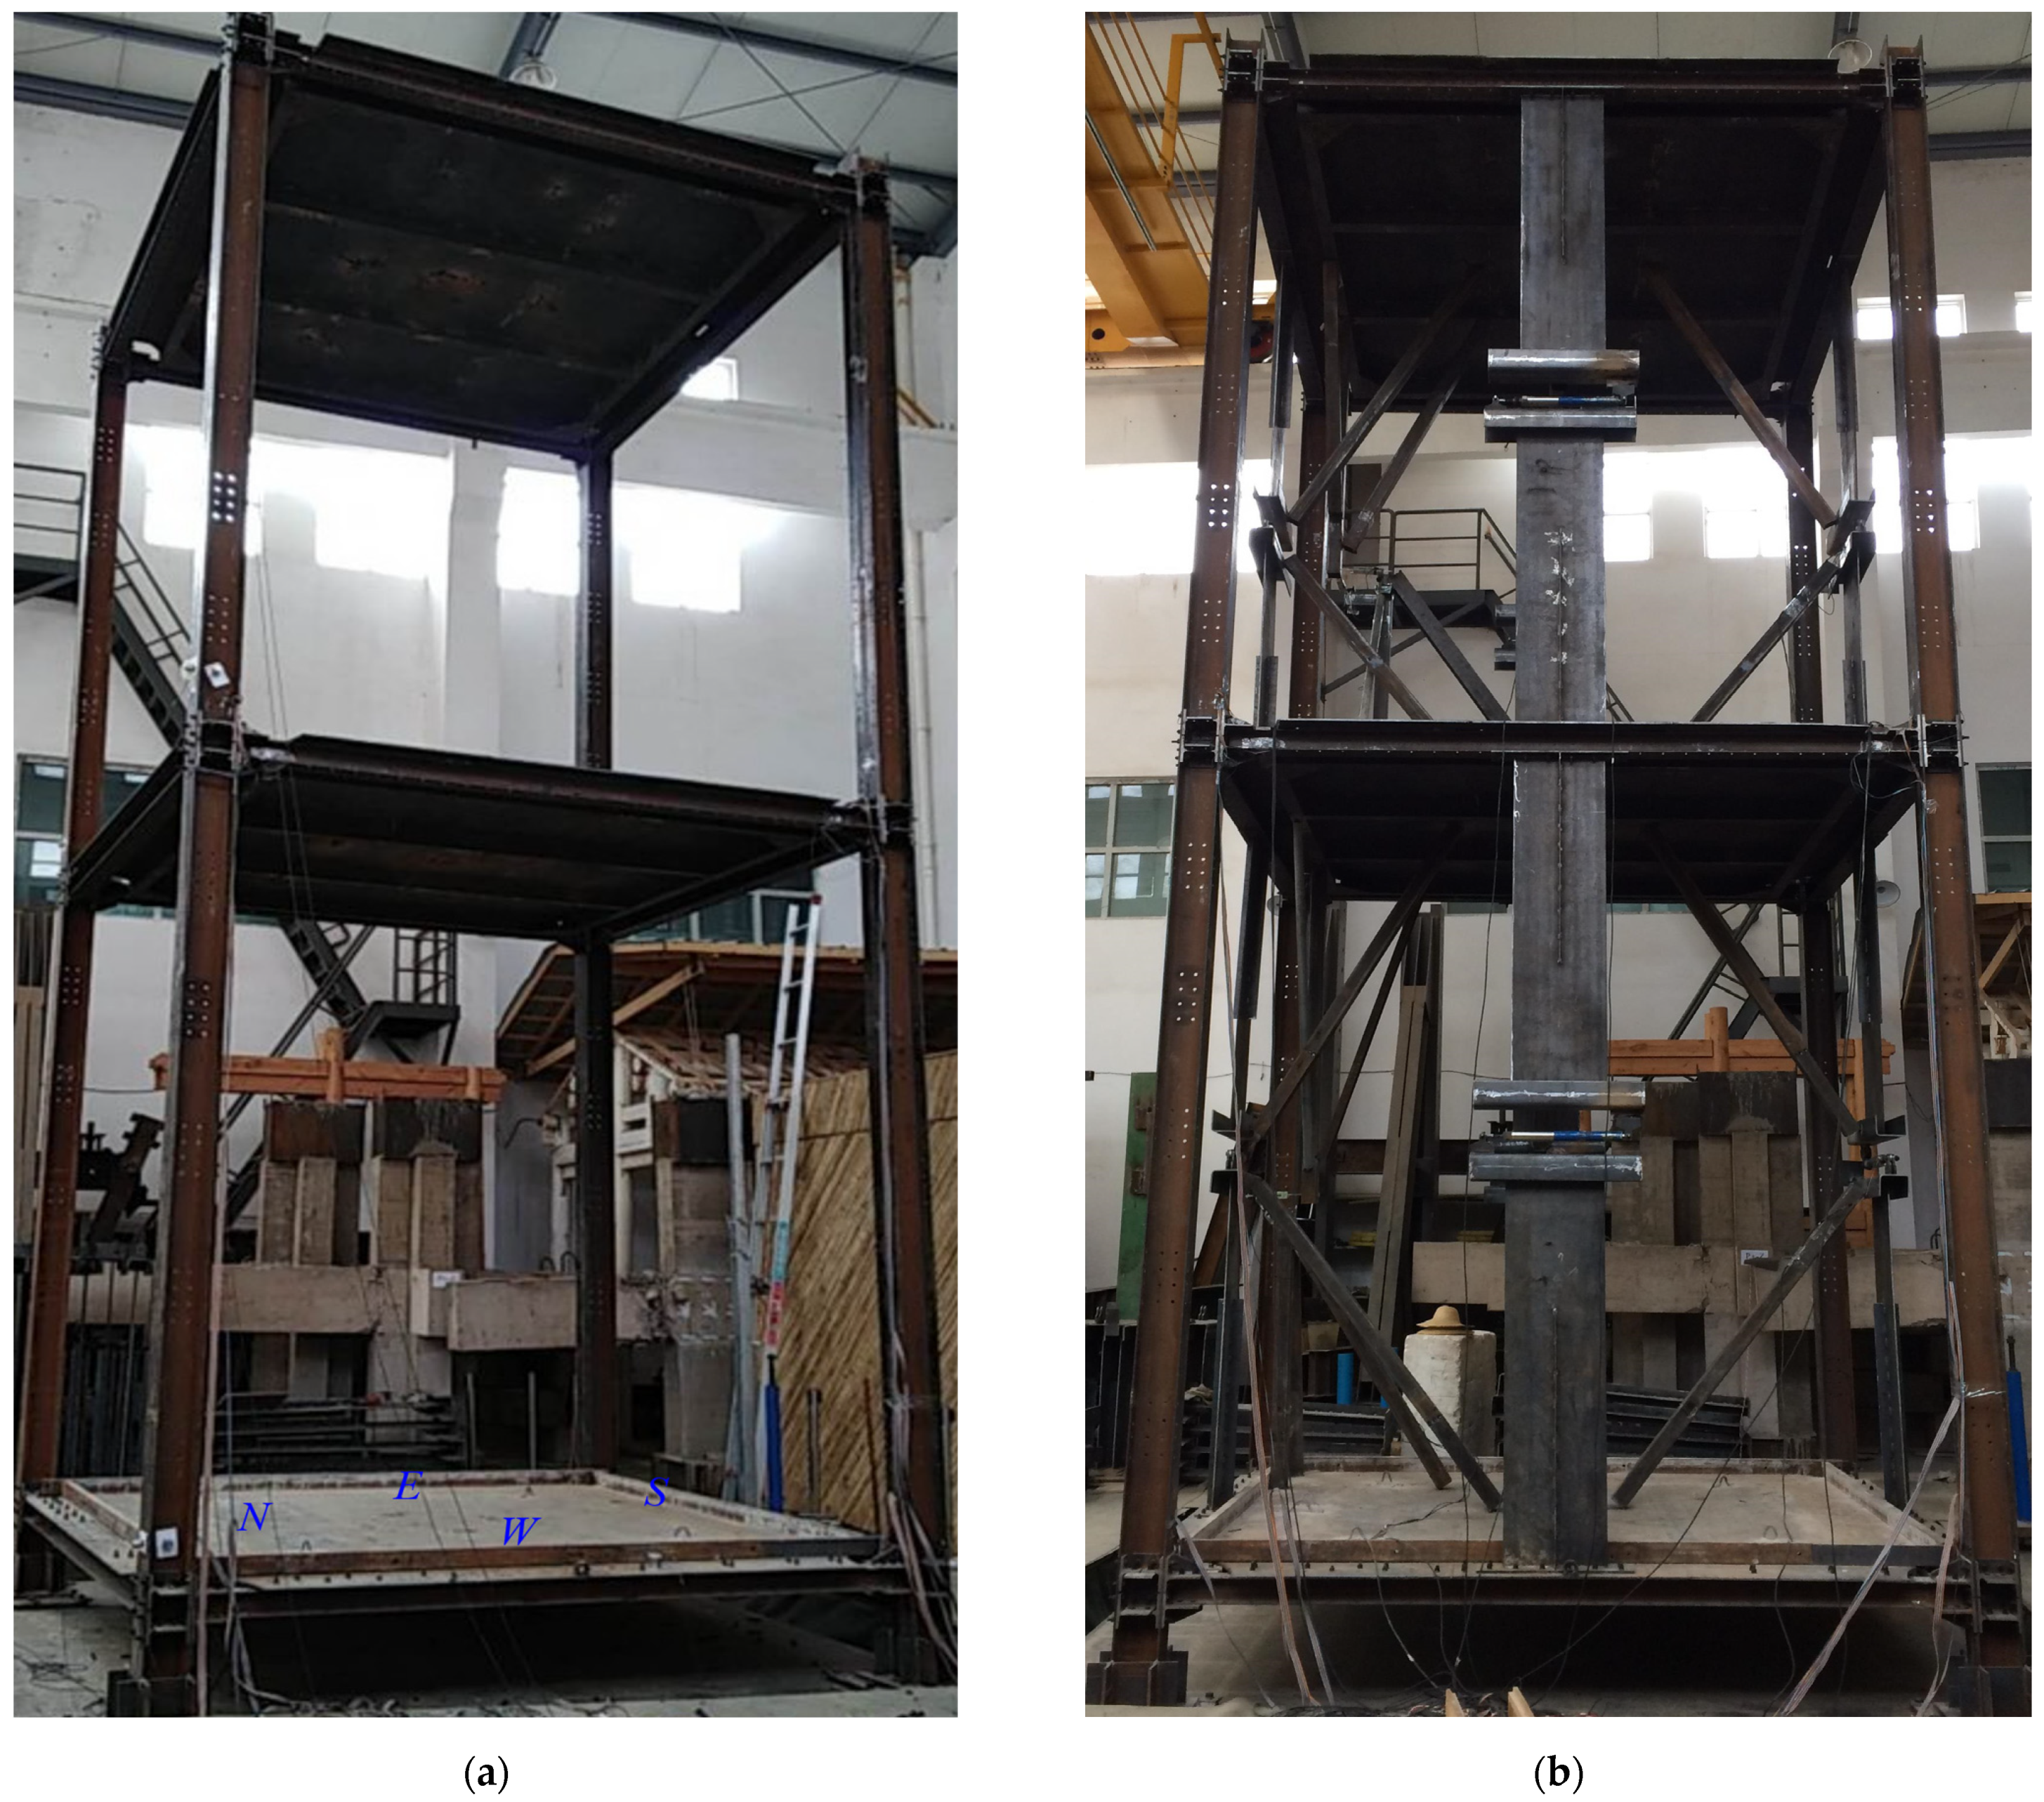
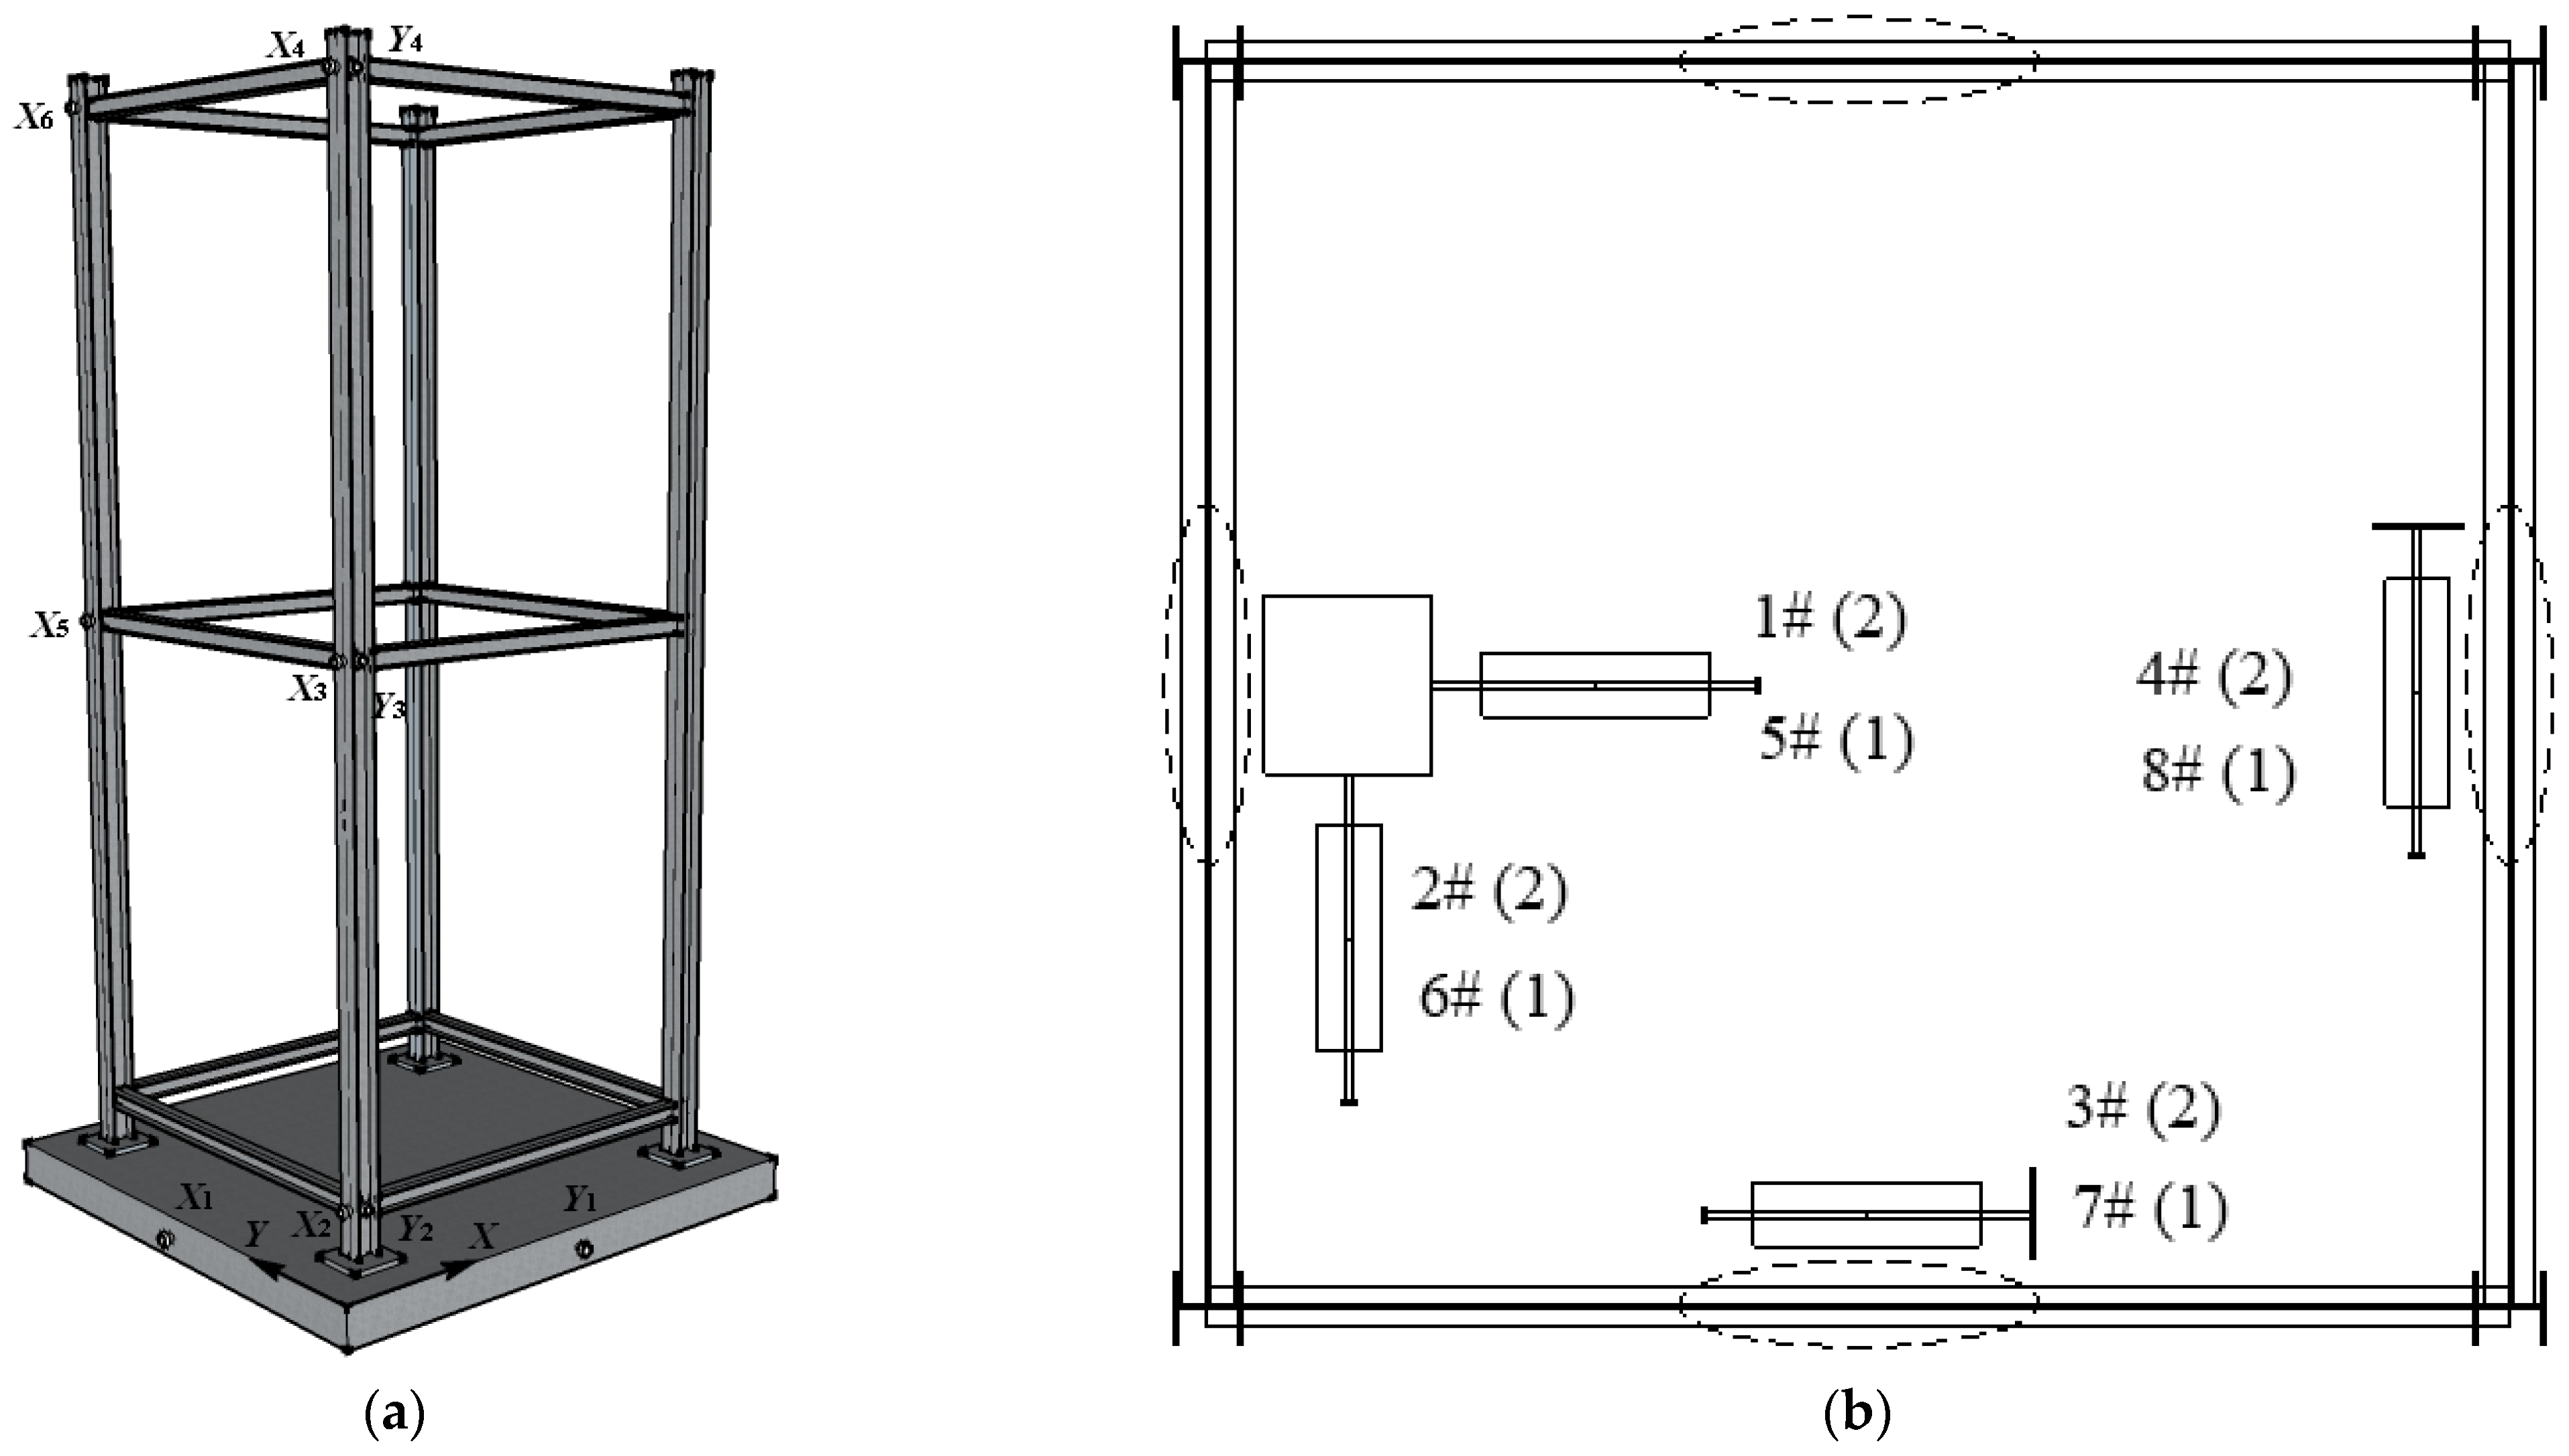
2.1. Test Equipment
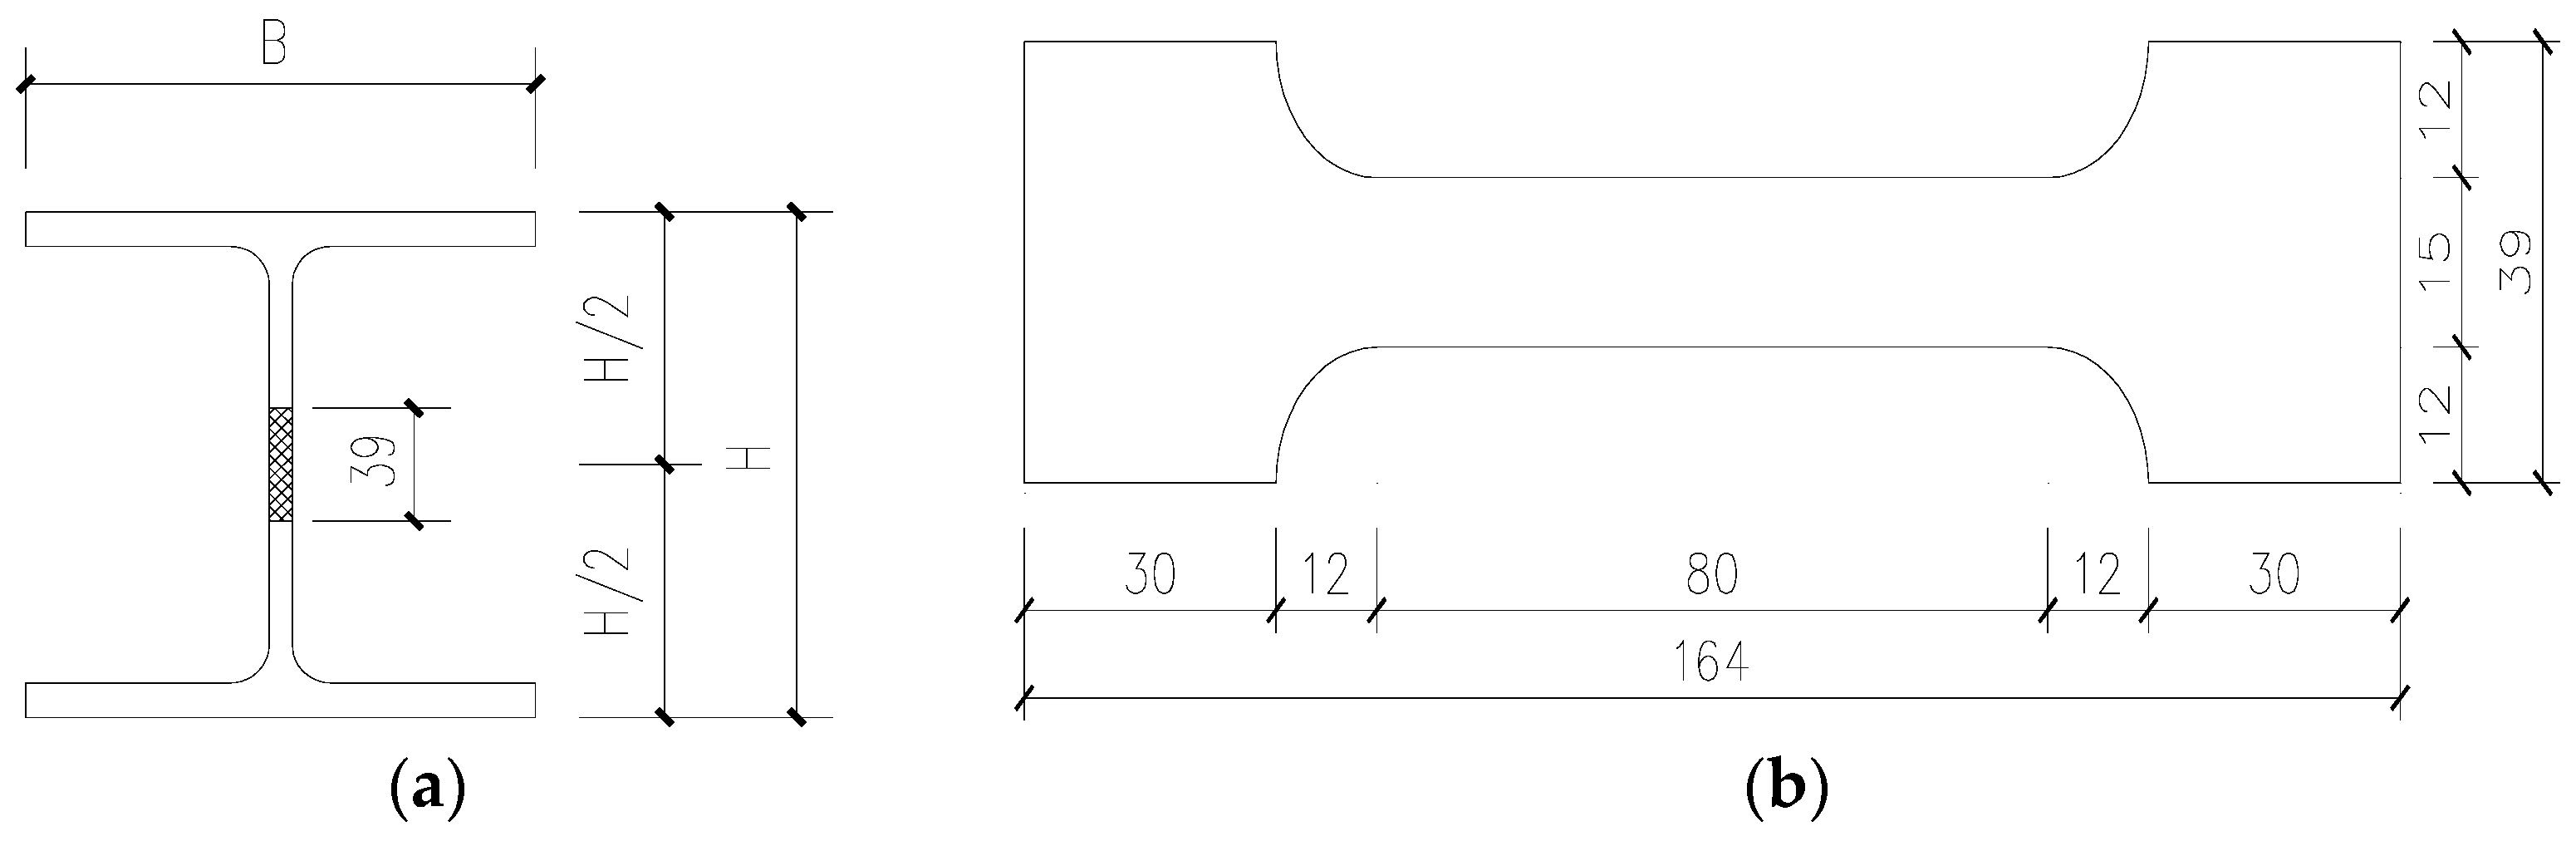
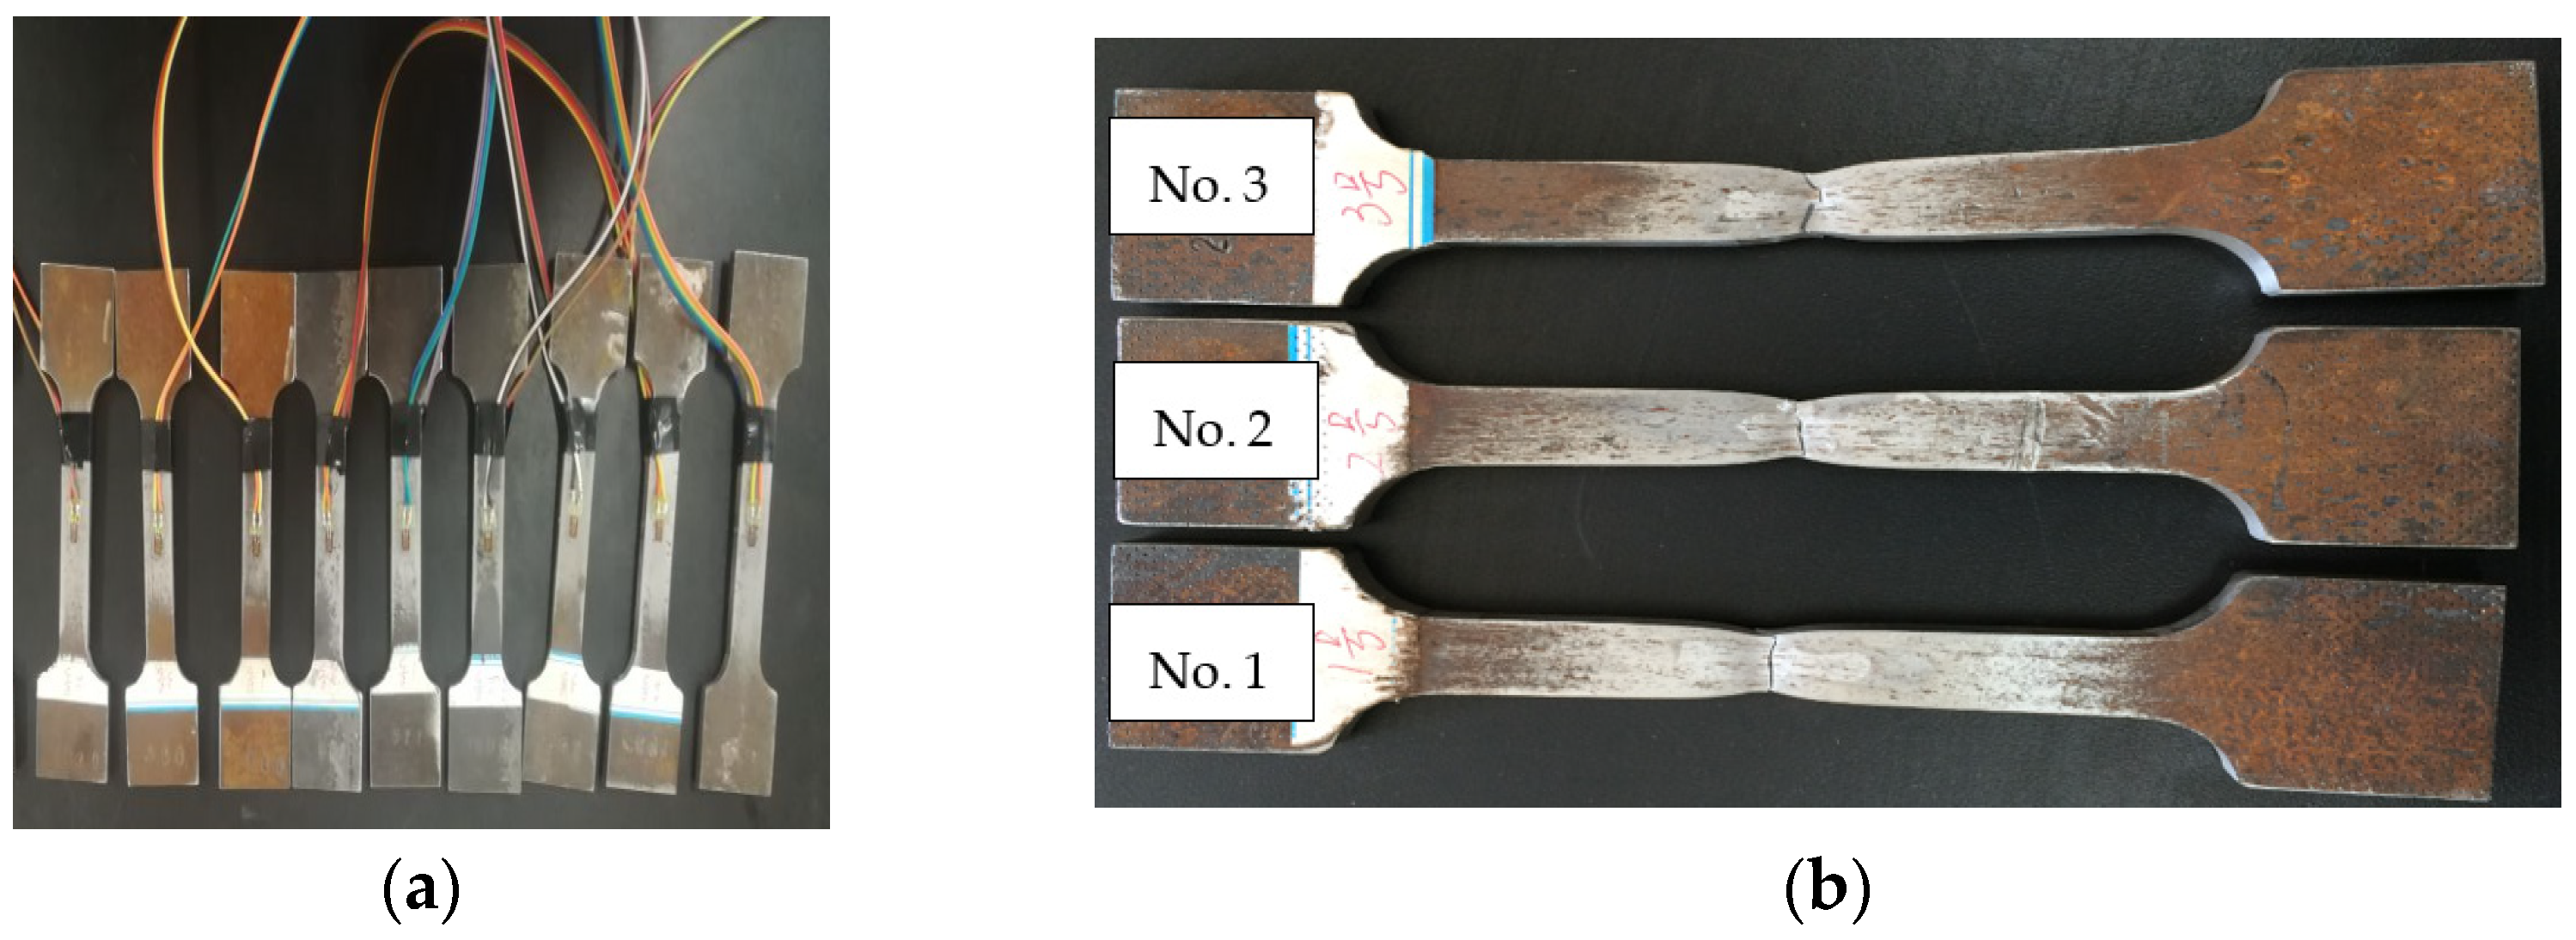
2.2. Selection of Materials and Their Material Property Testing
2.3. Experimental Model Fabrication
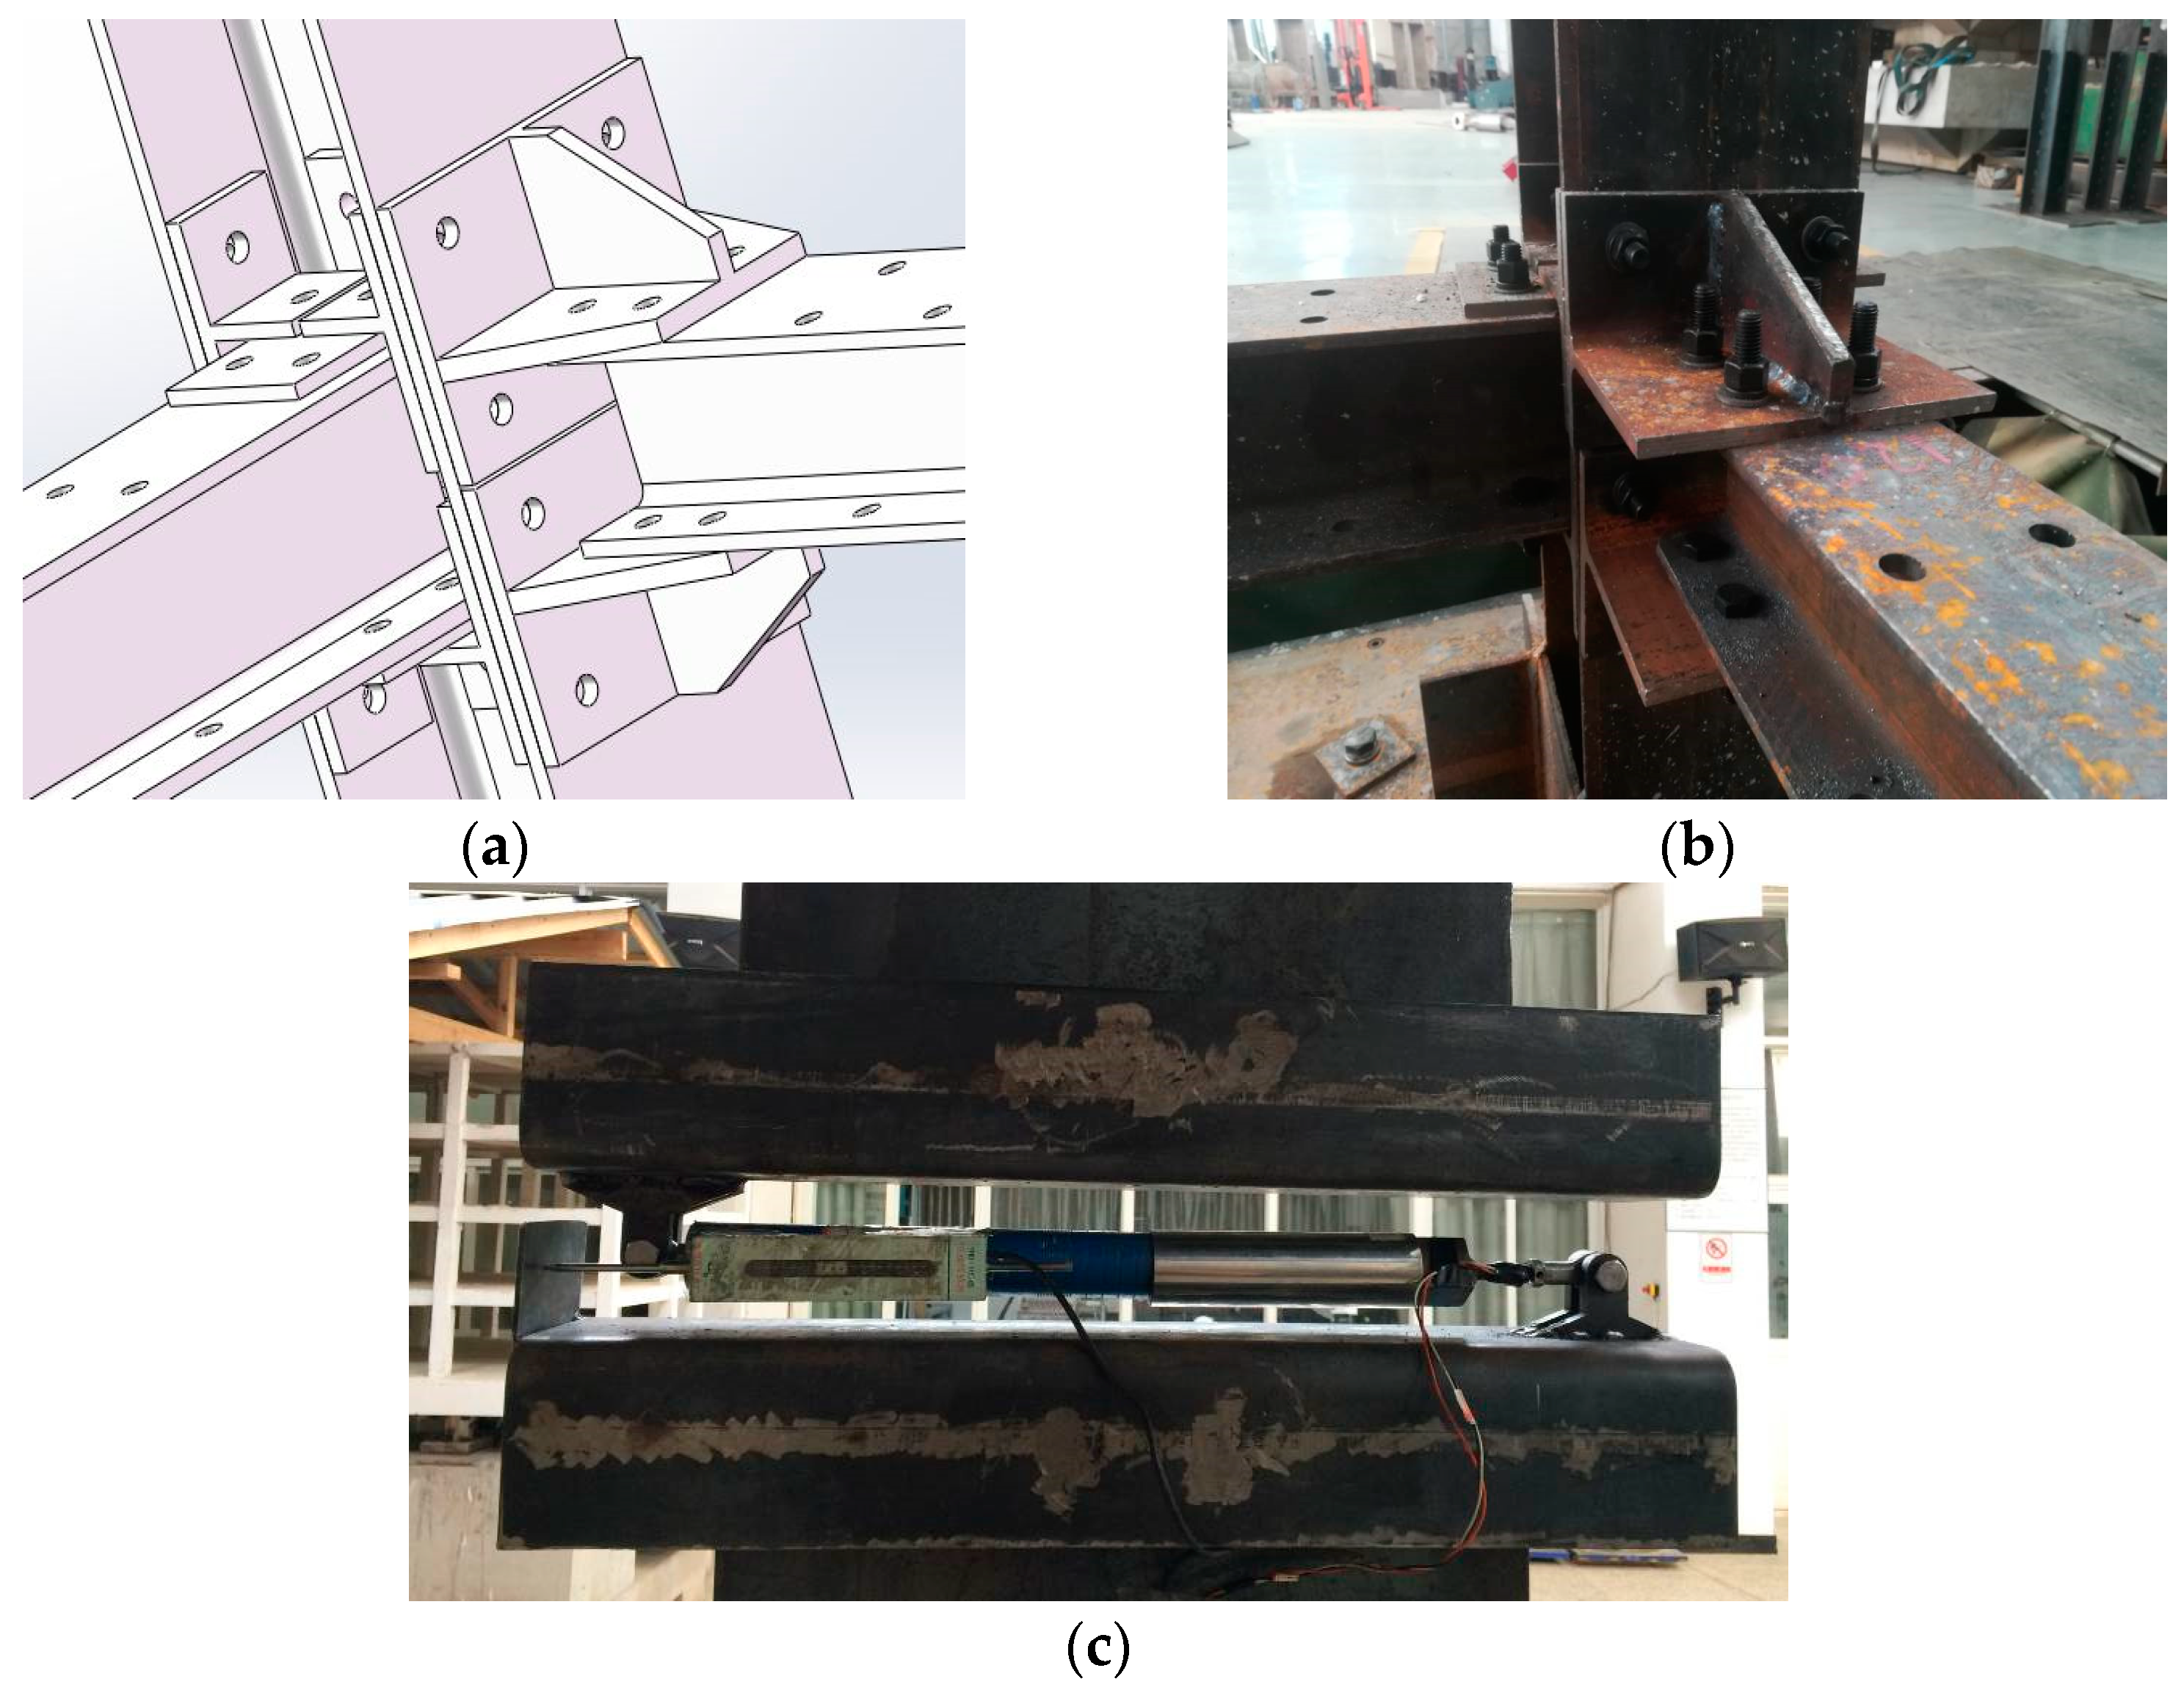
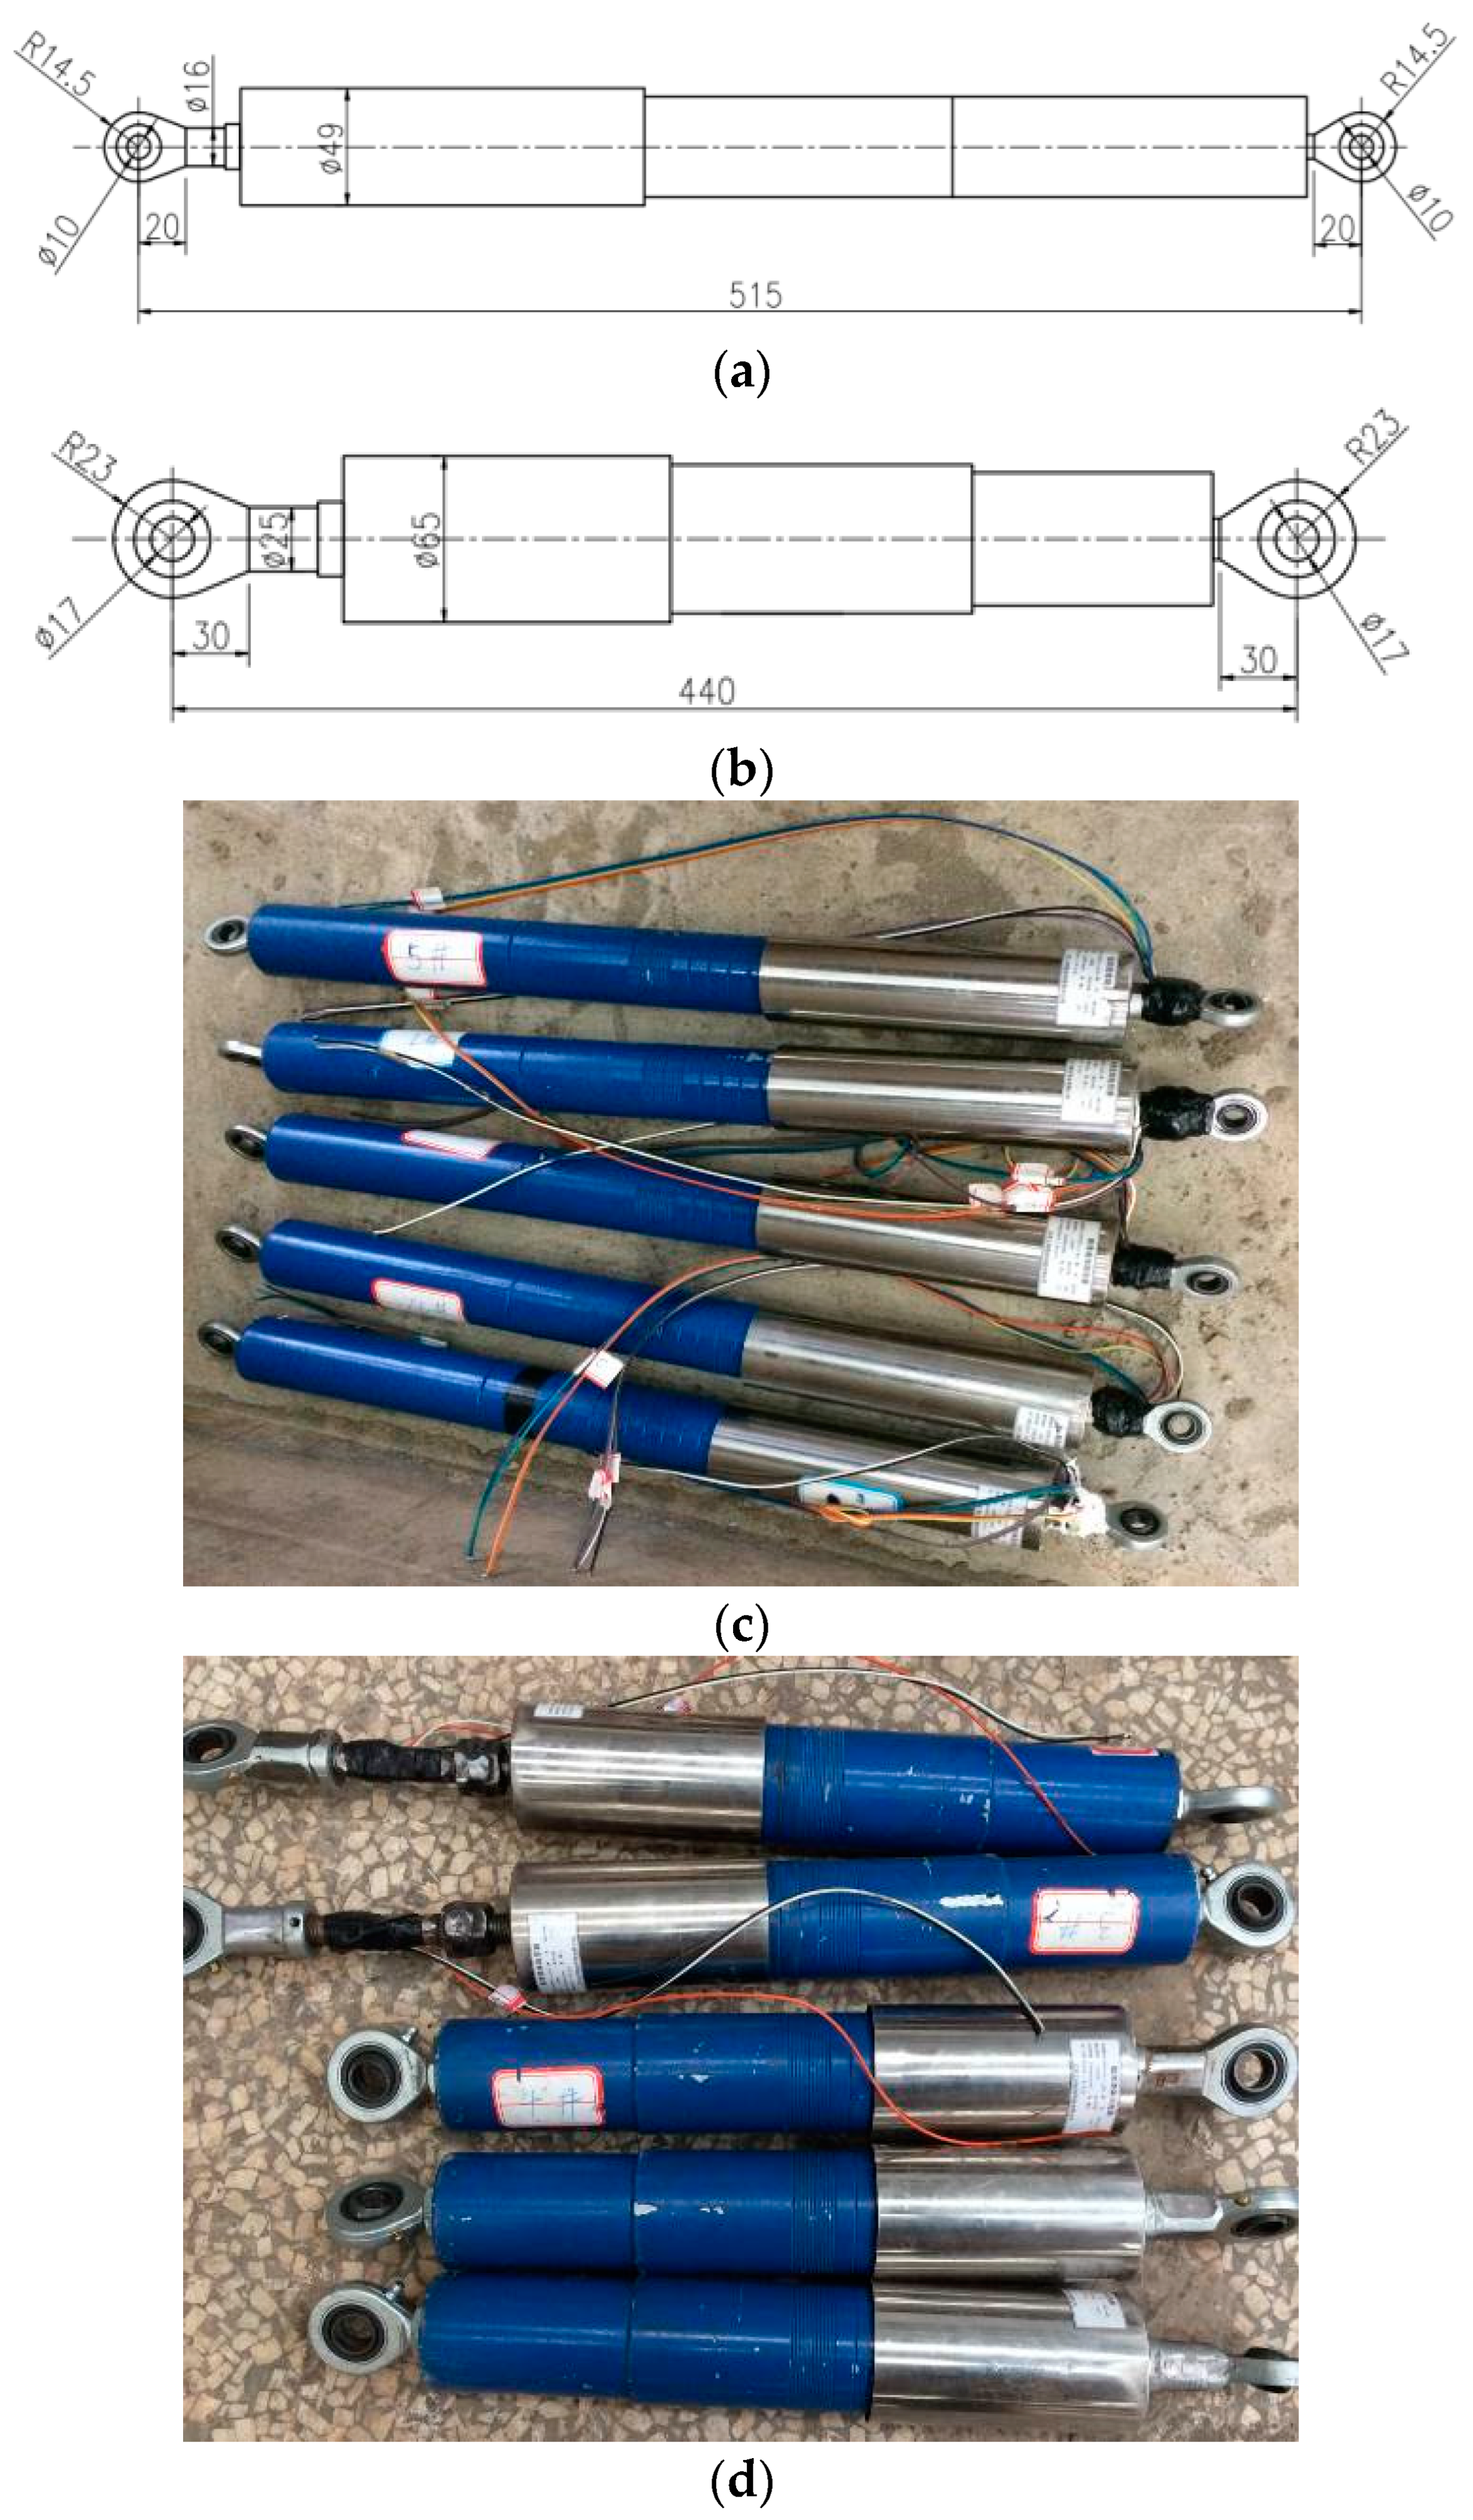
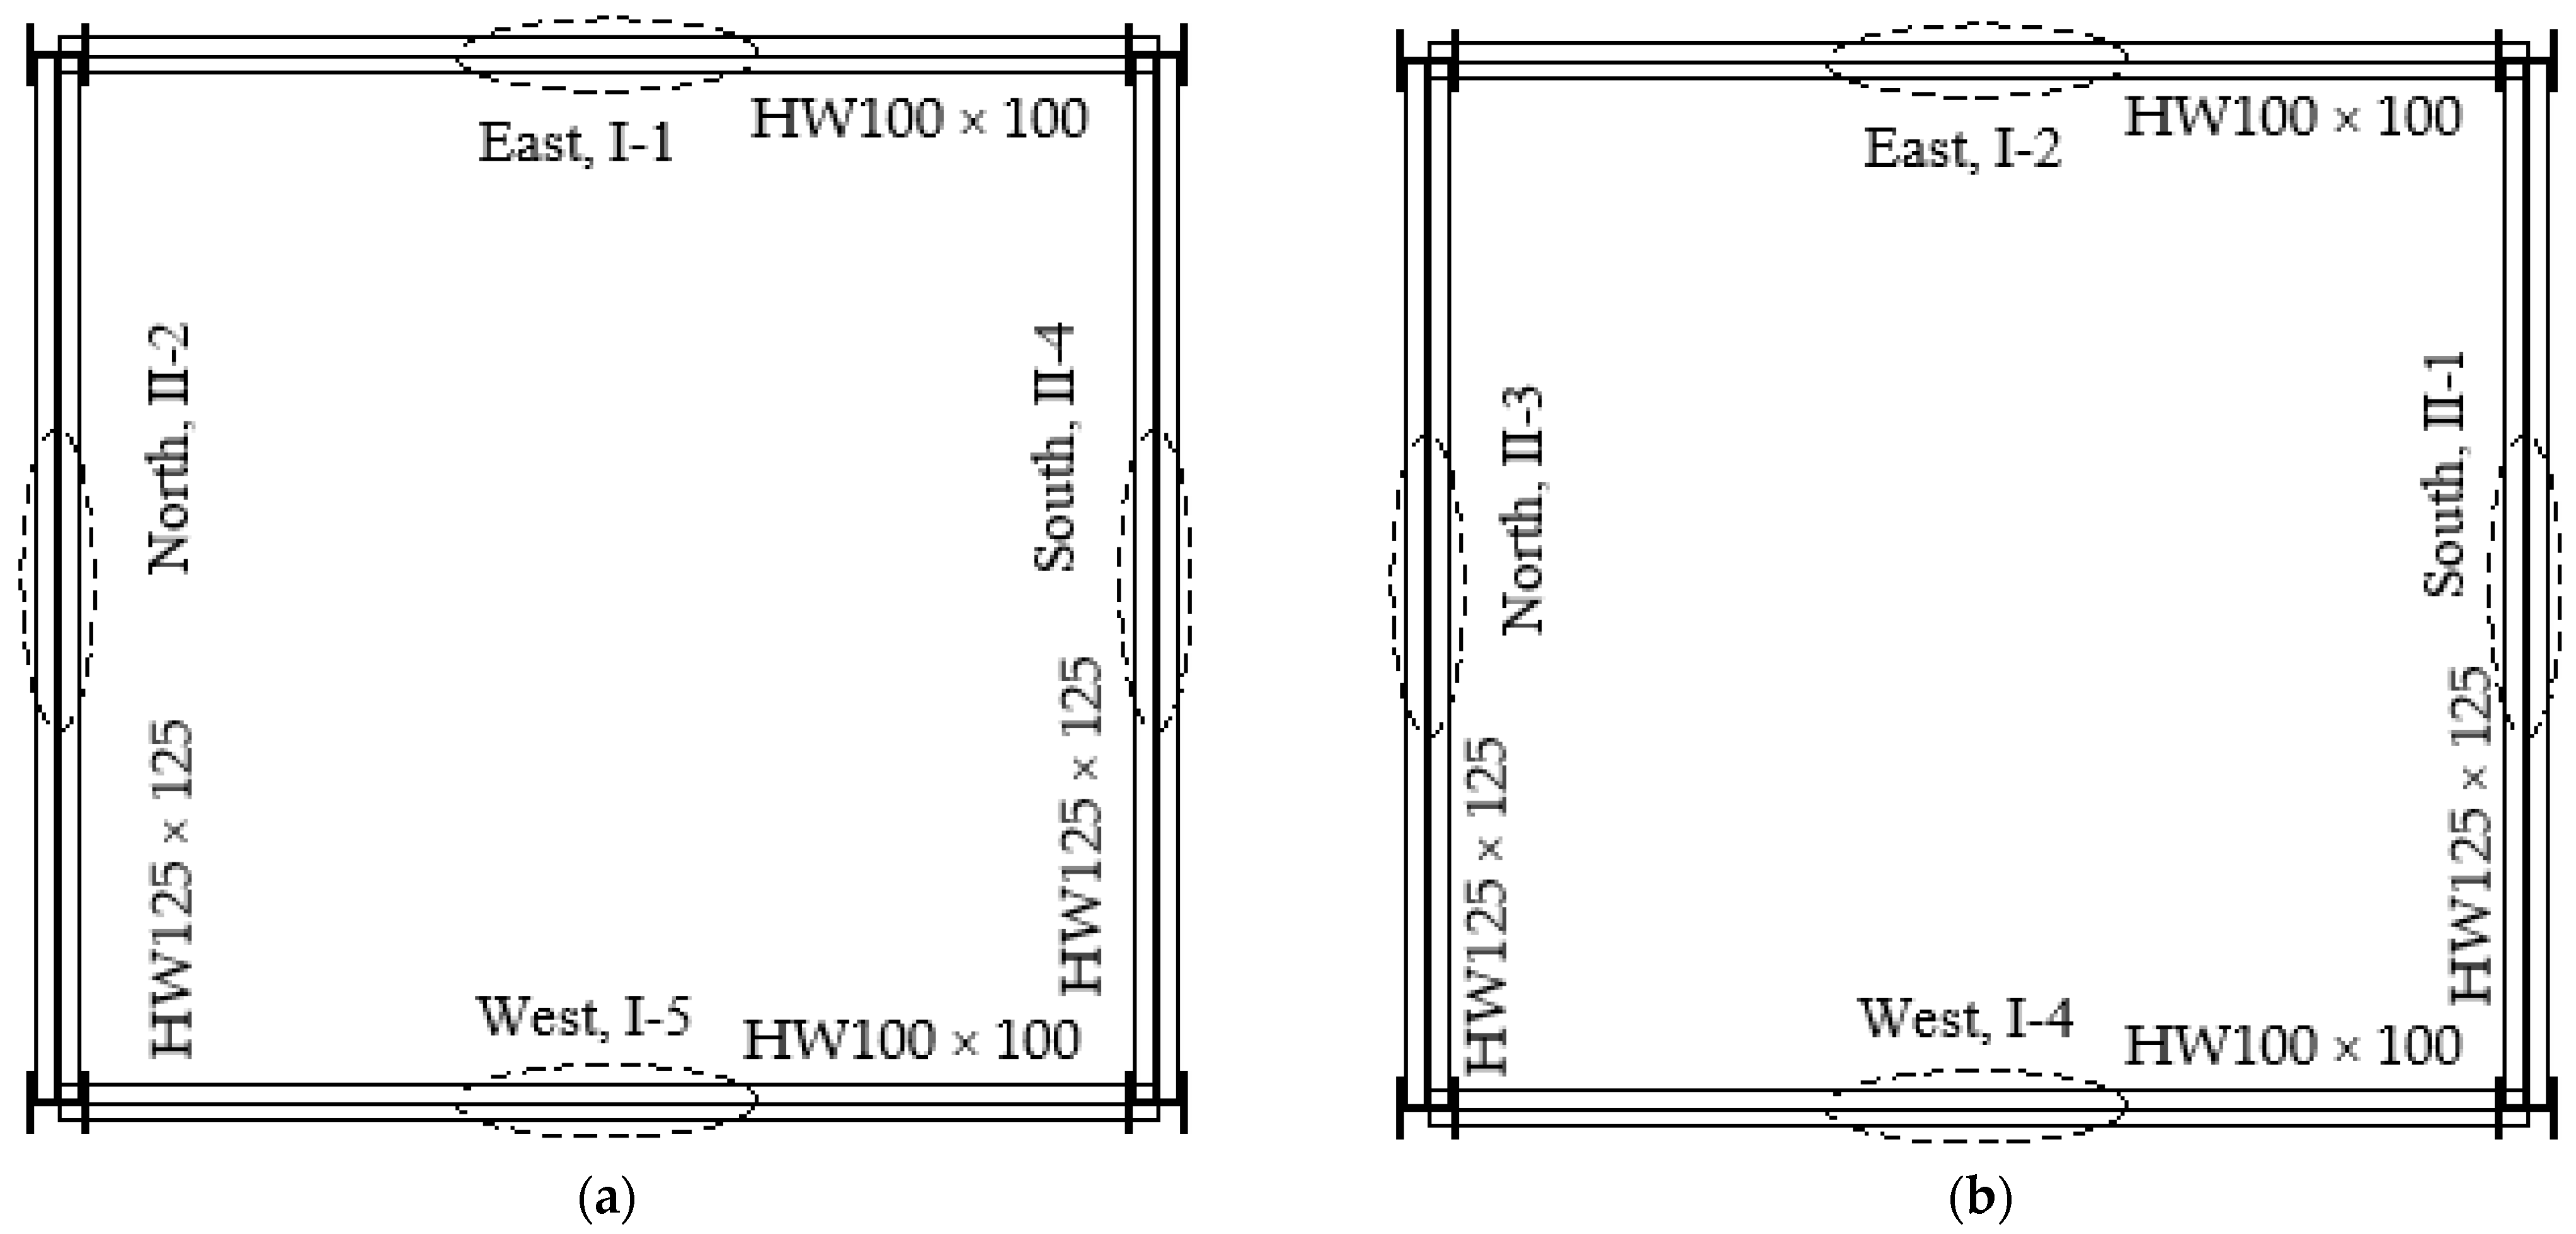
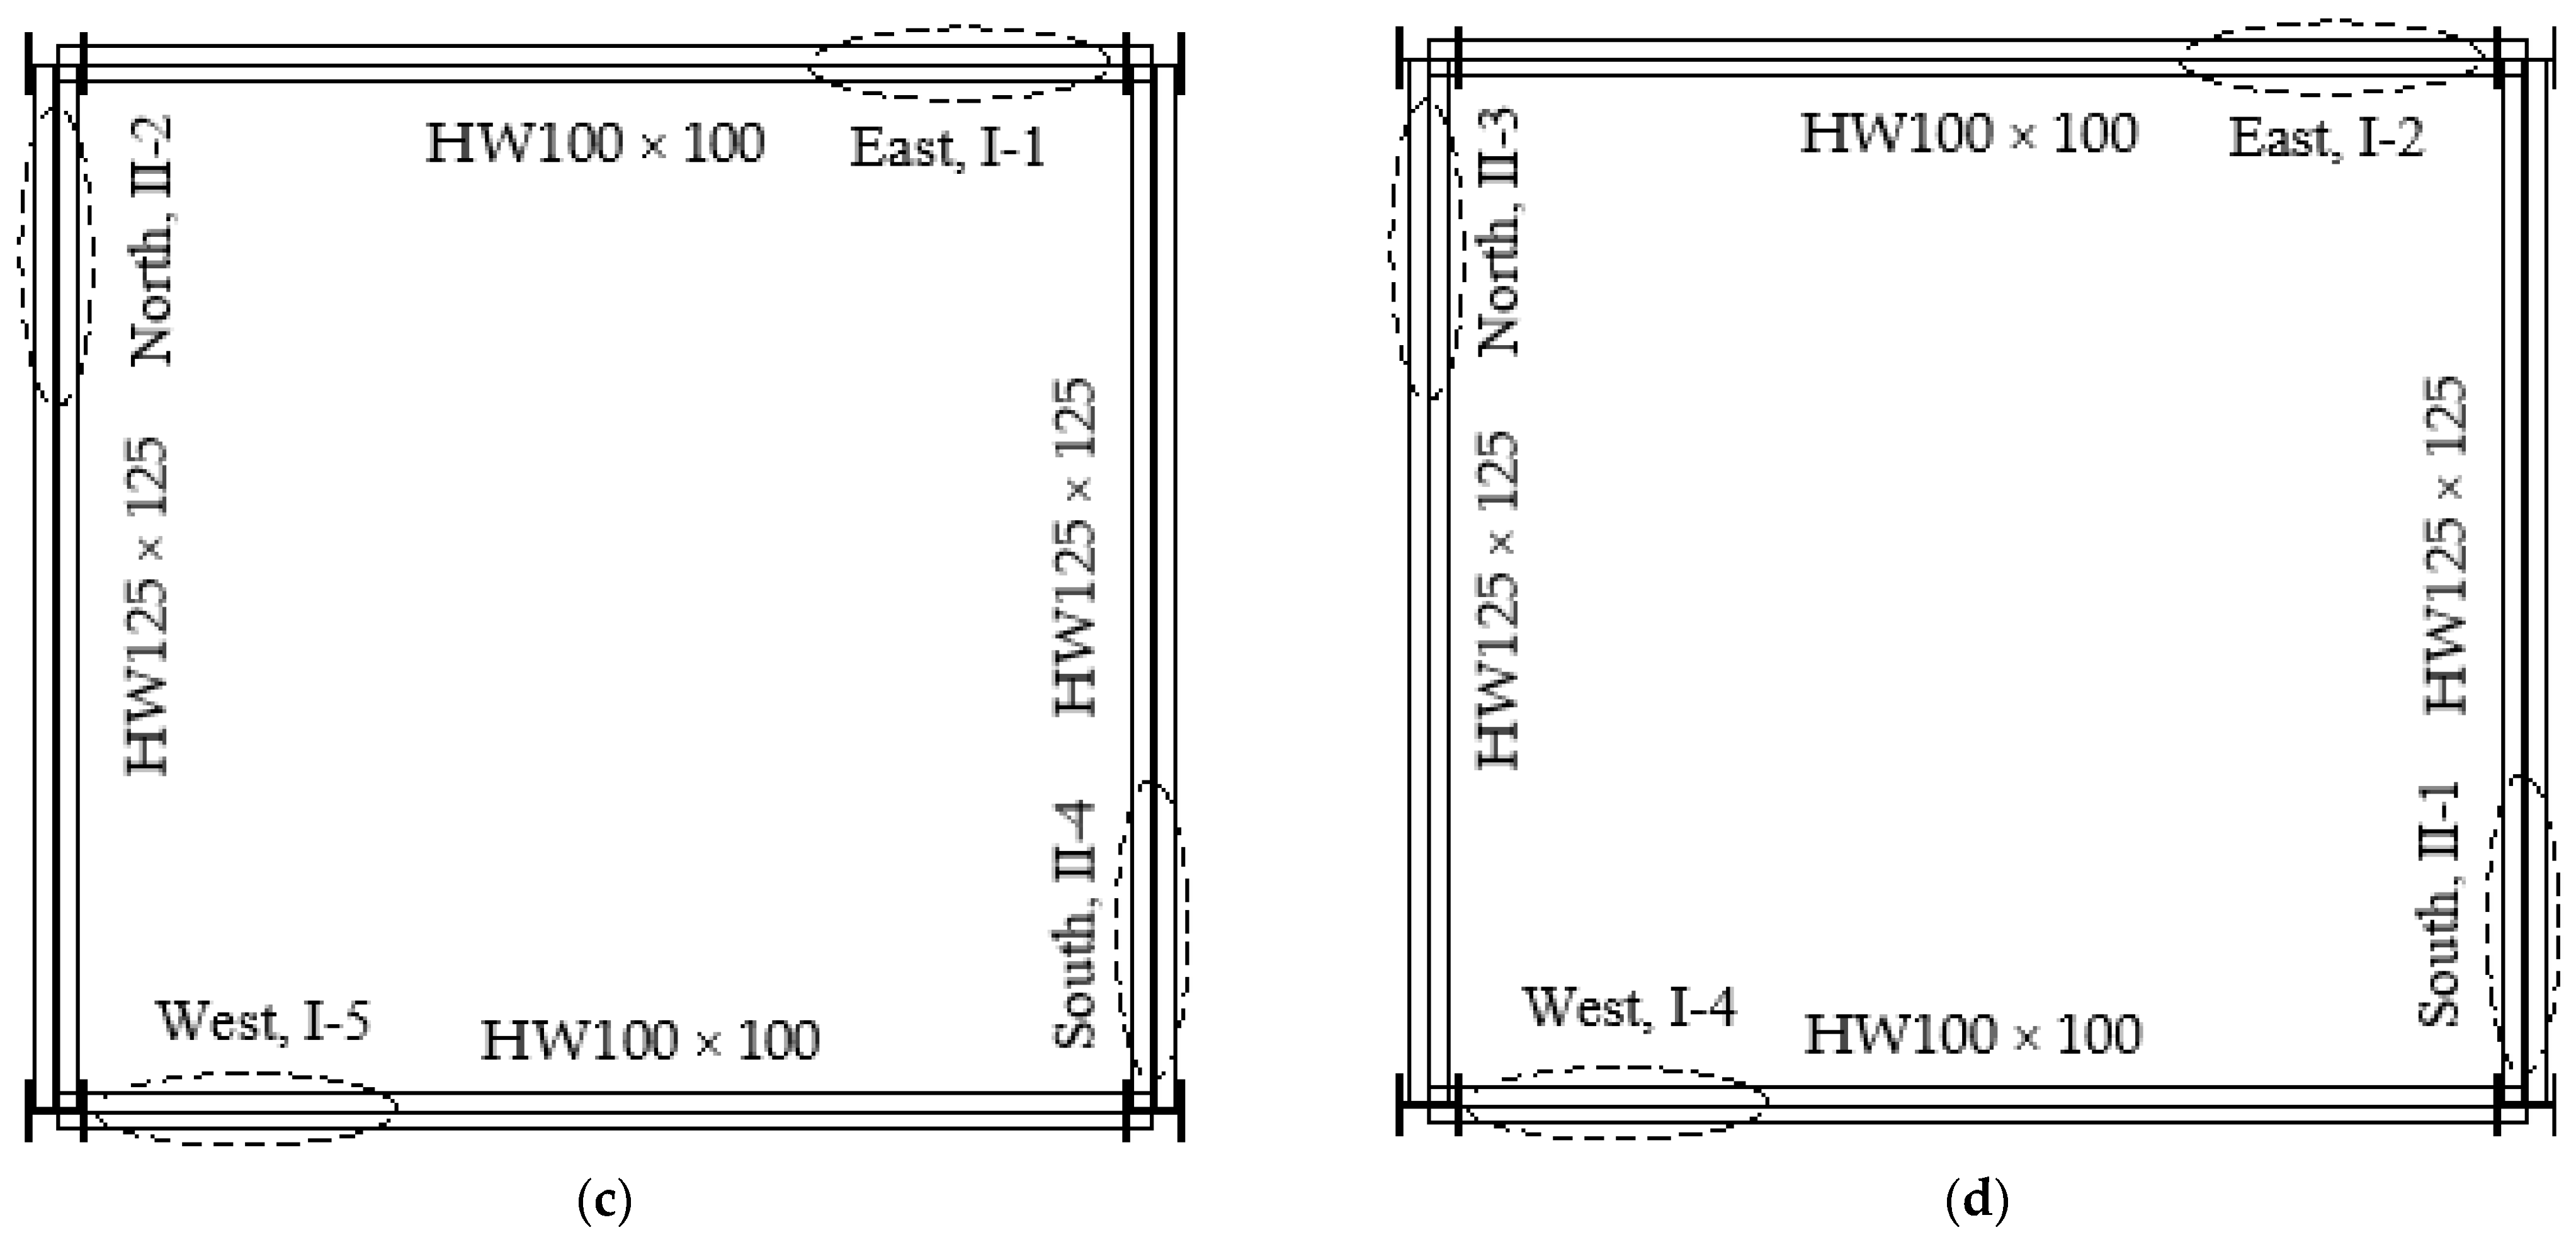
2.4. Damping Device Design Parameters and Arrangement Positions
2.5. Sensor Placement
2.6. Experimental Loading Conditions
3. Test Results Analysis
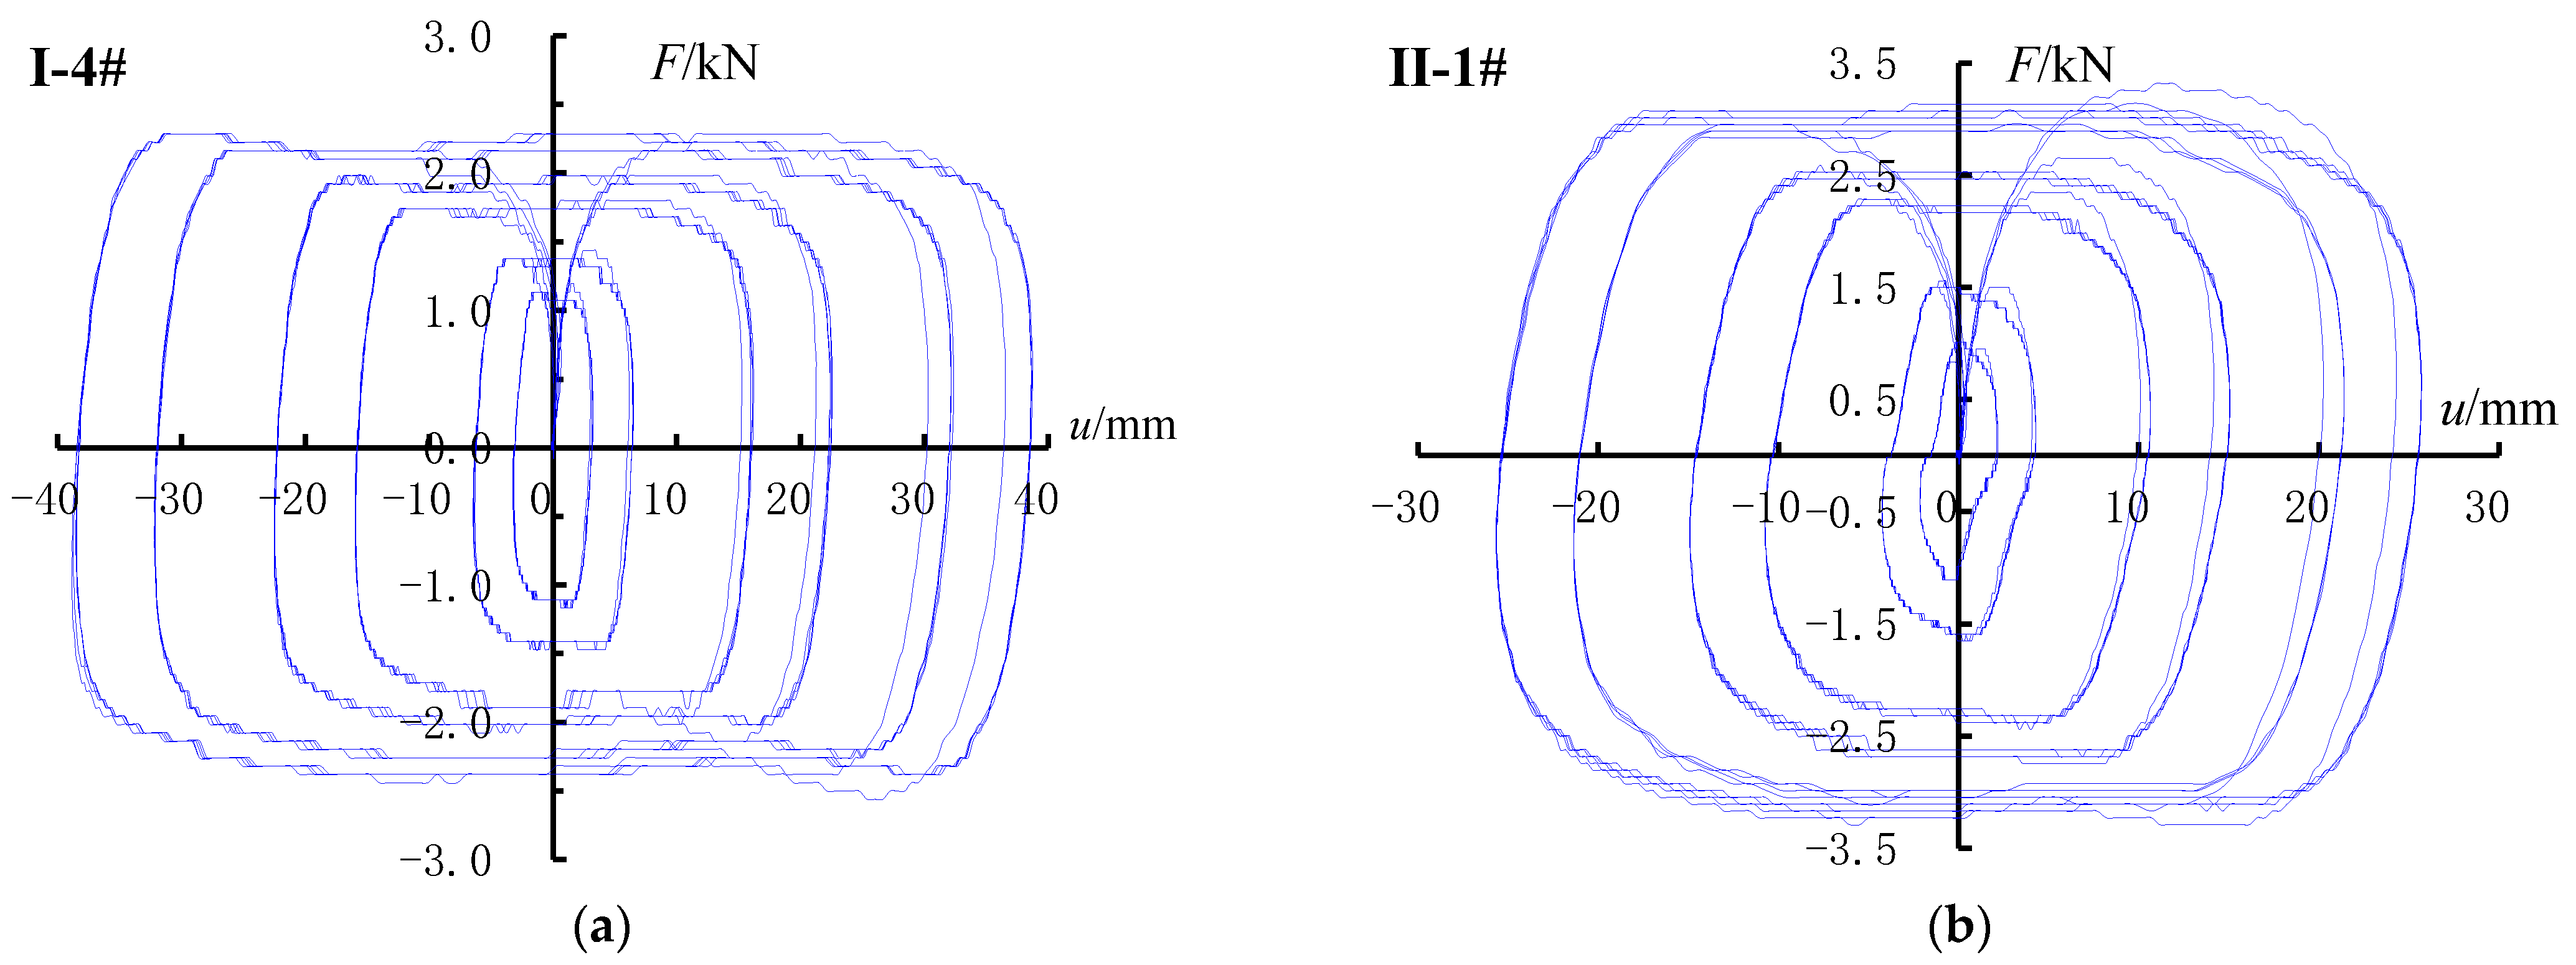
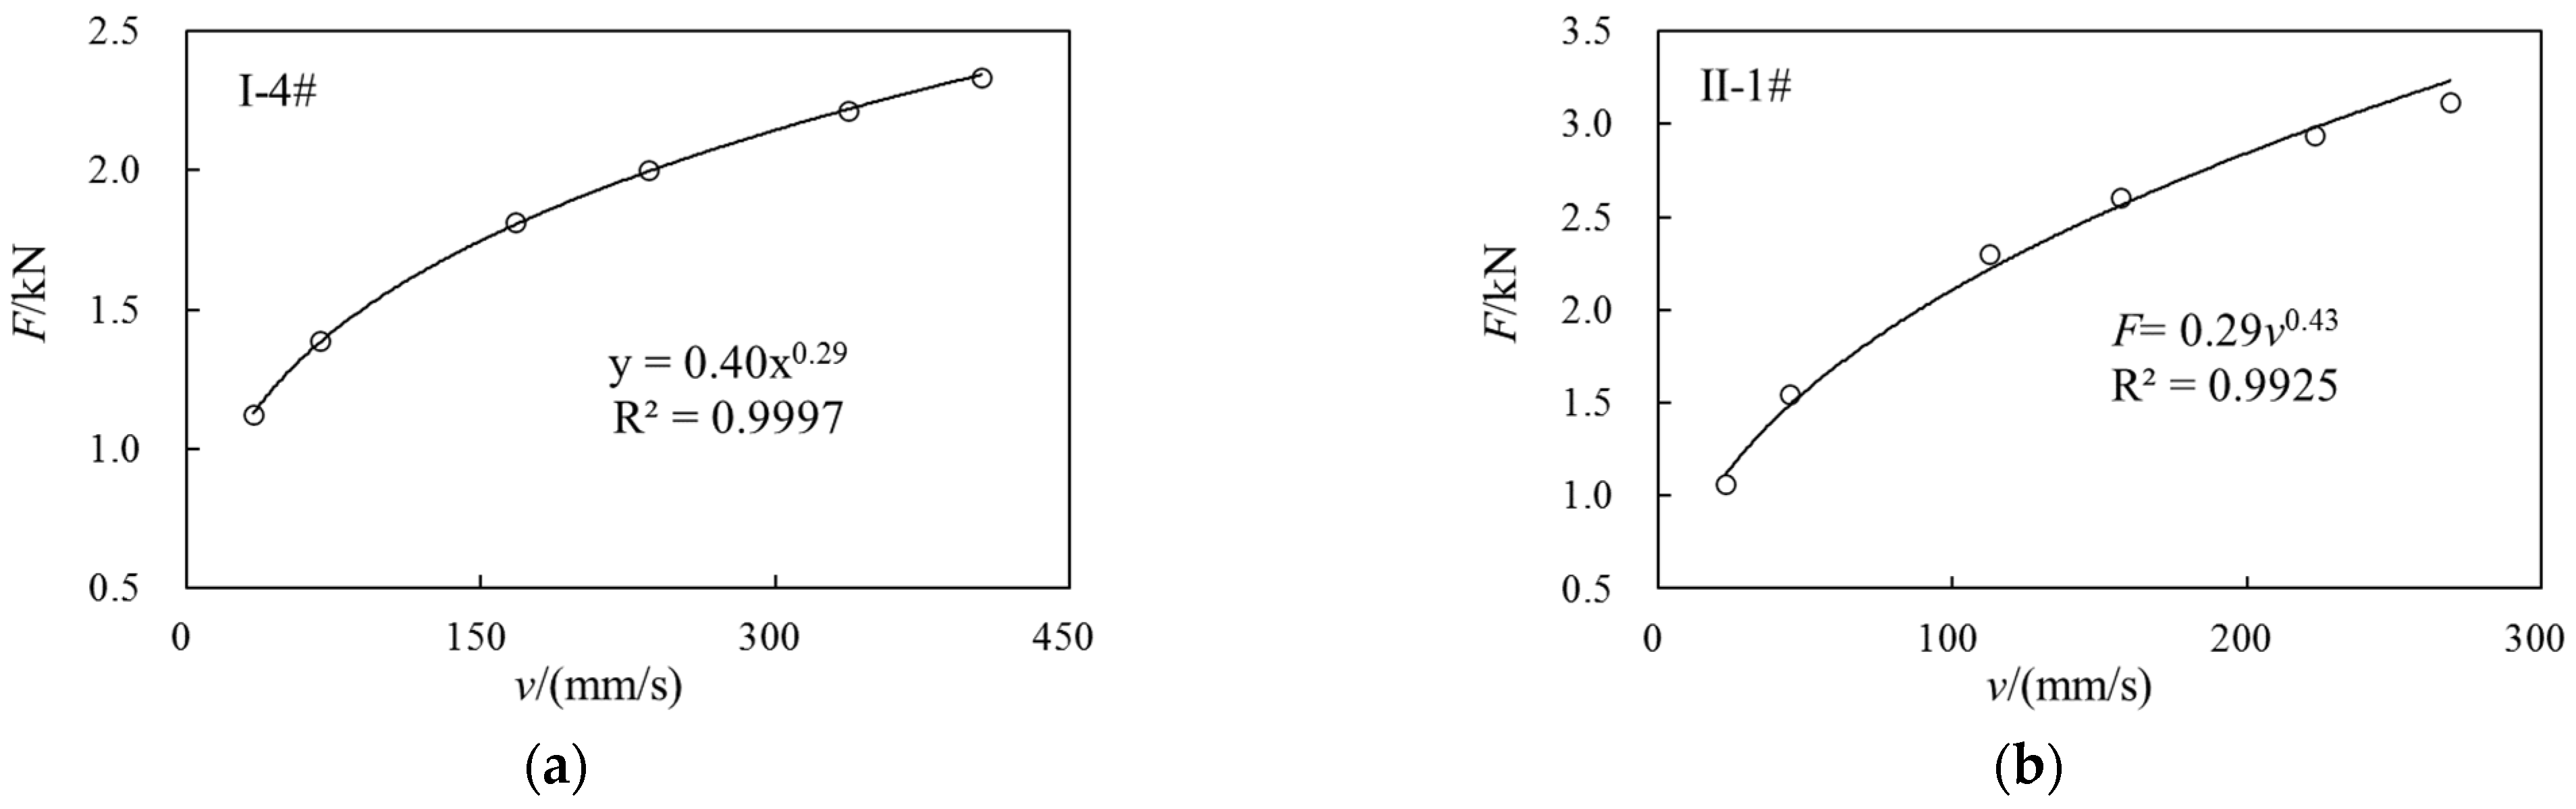
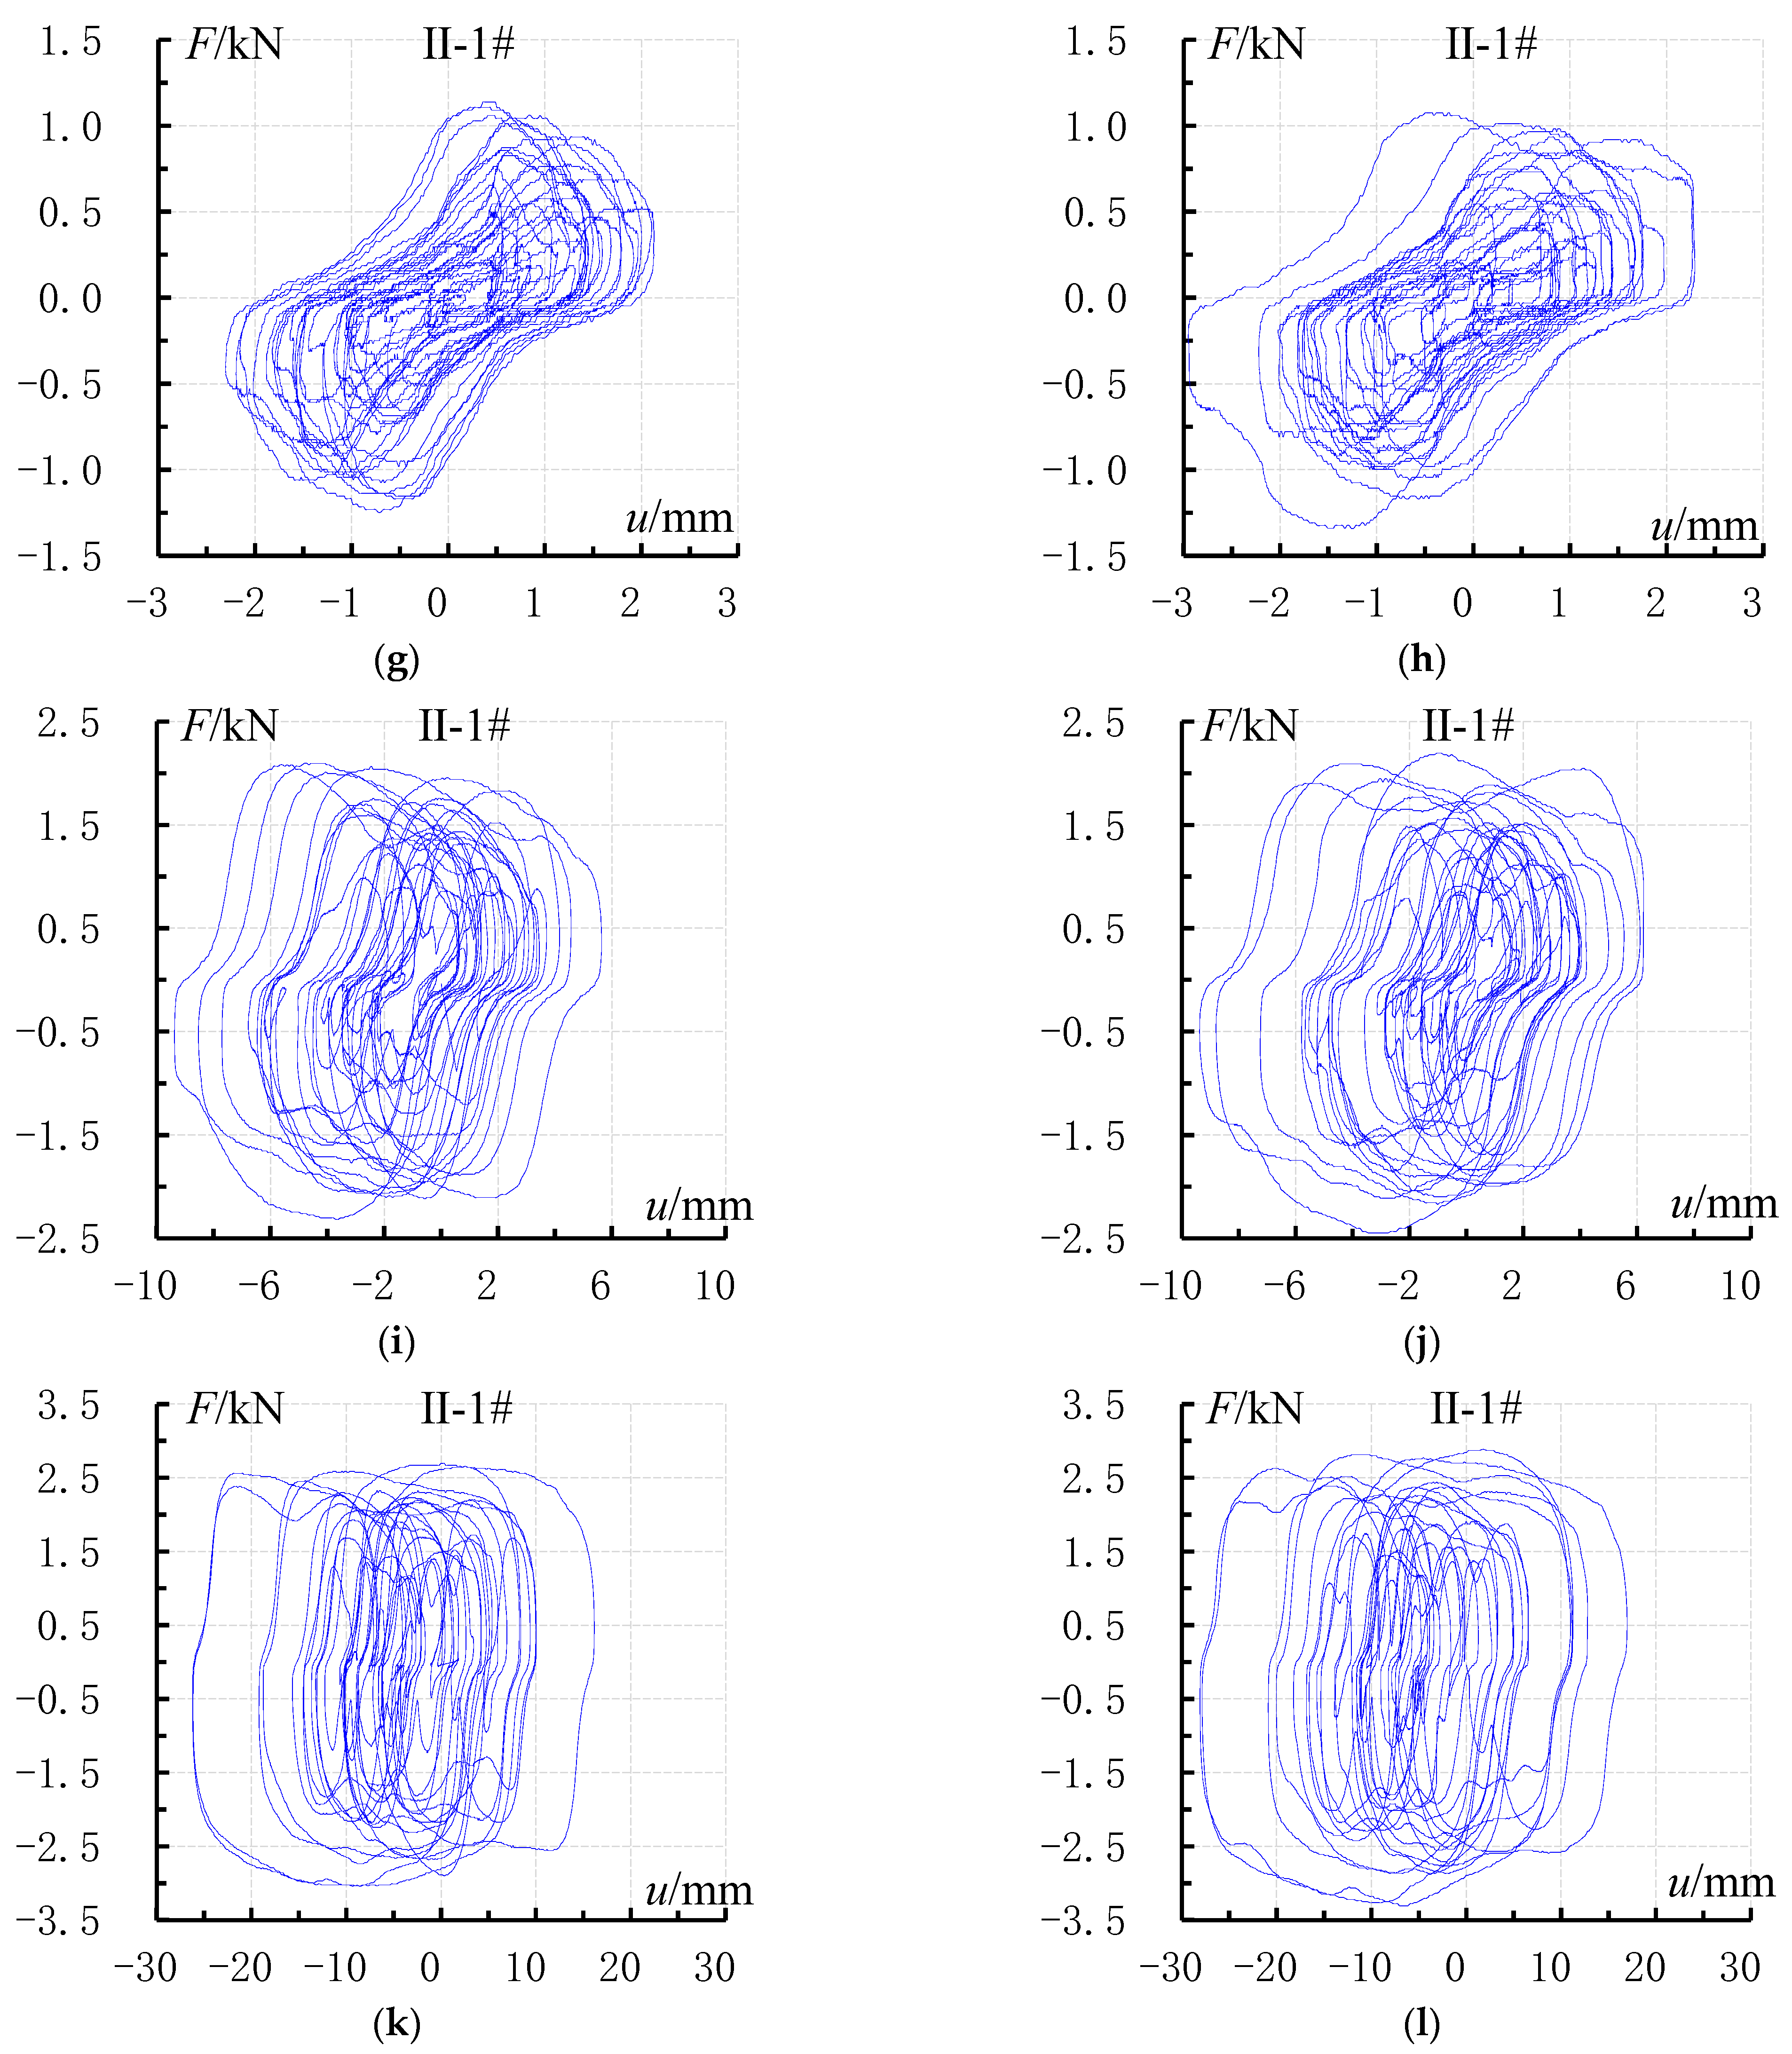
3.1. Hysteresis Loops of the Dampers
- (1)
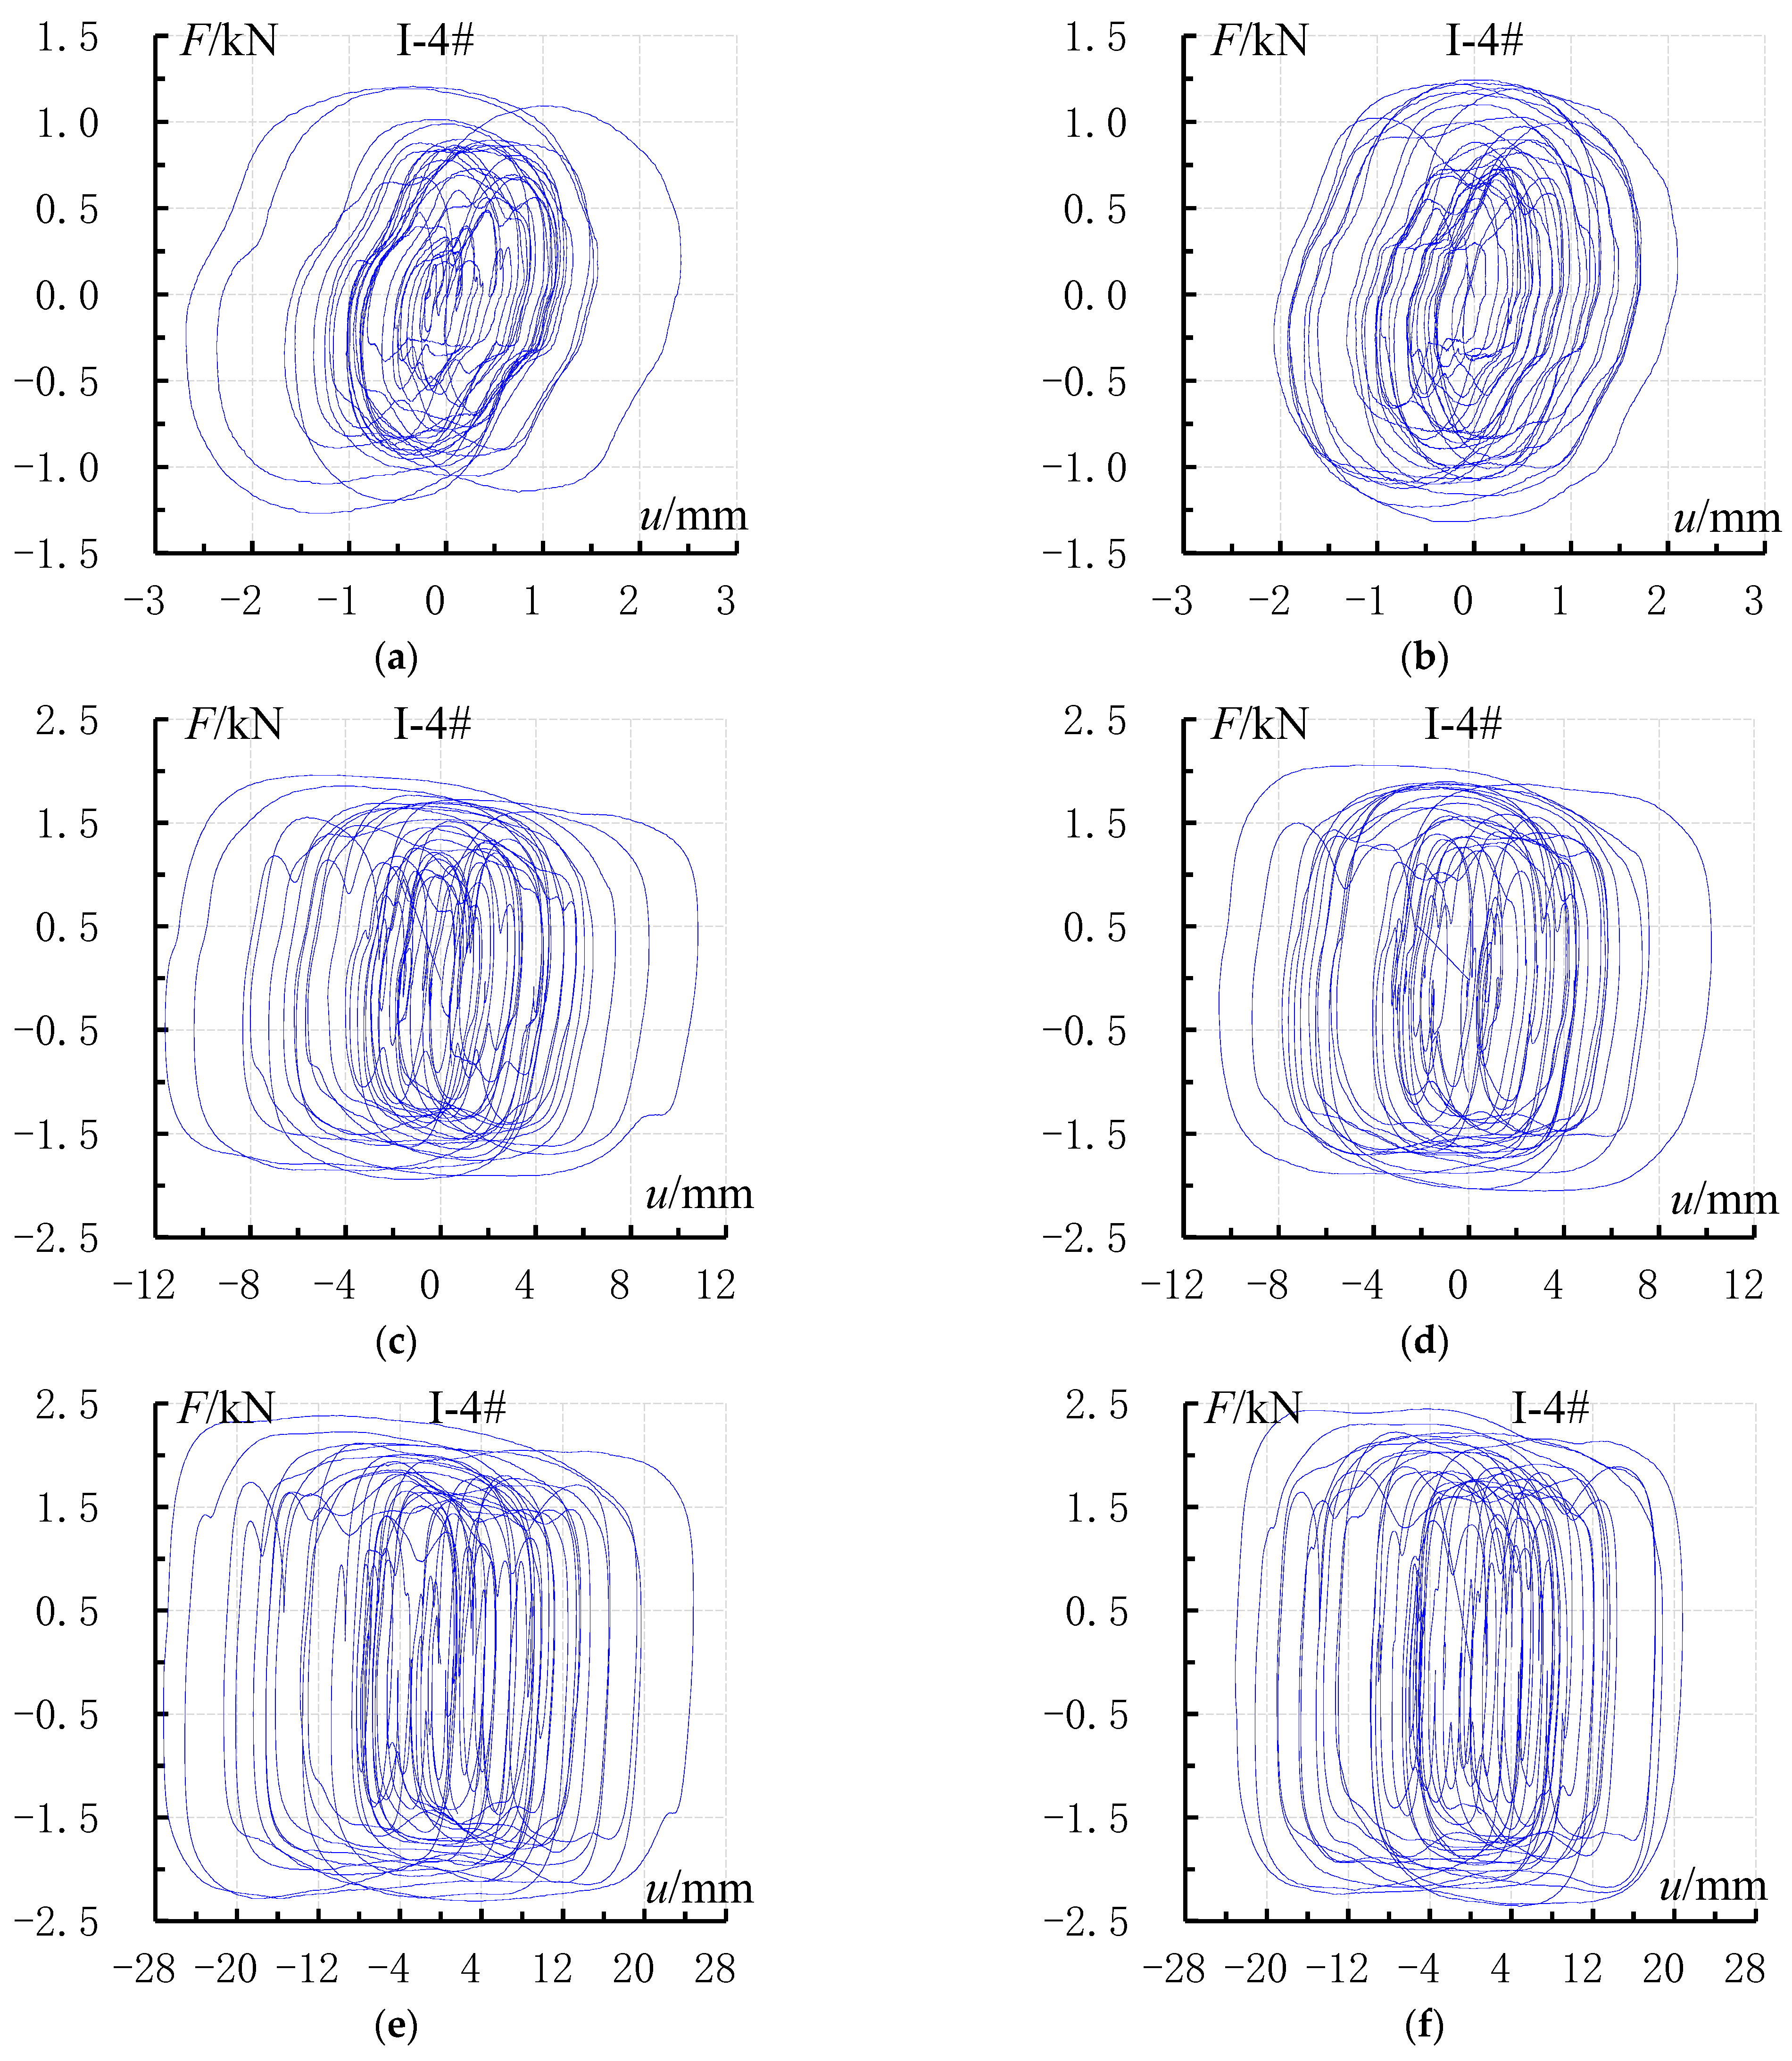
- The hysteresis loops of the dampers are uniformly full at different seismic levels, indicating strong energy dissipation capacity. With the increase in seismic level, the energy dissipation capacity of the dampers increases rapidly.
- (2)
- The area of the hysteresis loops when the damper is arranged at the 1/2 position within the beam span, i.e., the energy dissipation effect of the damper, is significantly larger than that when the damper is arranged at the 1/6 position within the beam span.
- (3)
- The force and displacement of the I-4 and II-1 dampers under rare earthquakes are in good agreement with the design parameters in Table 4.
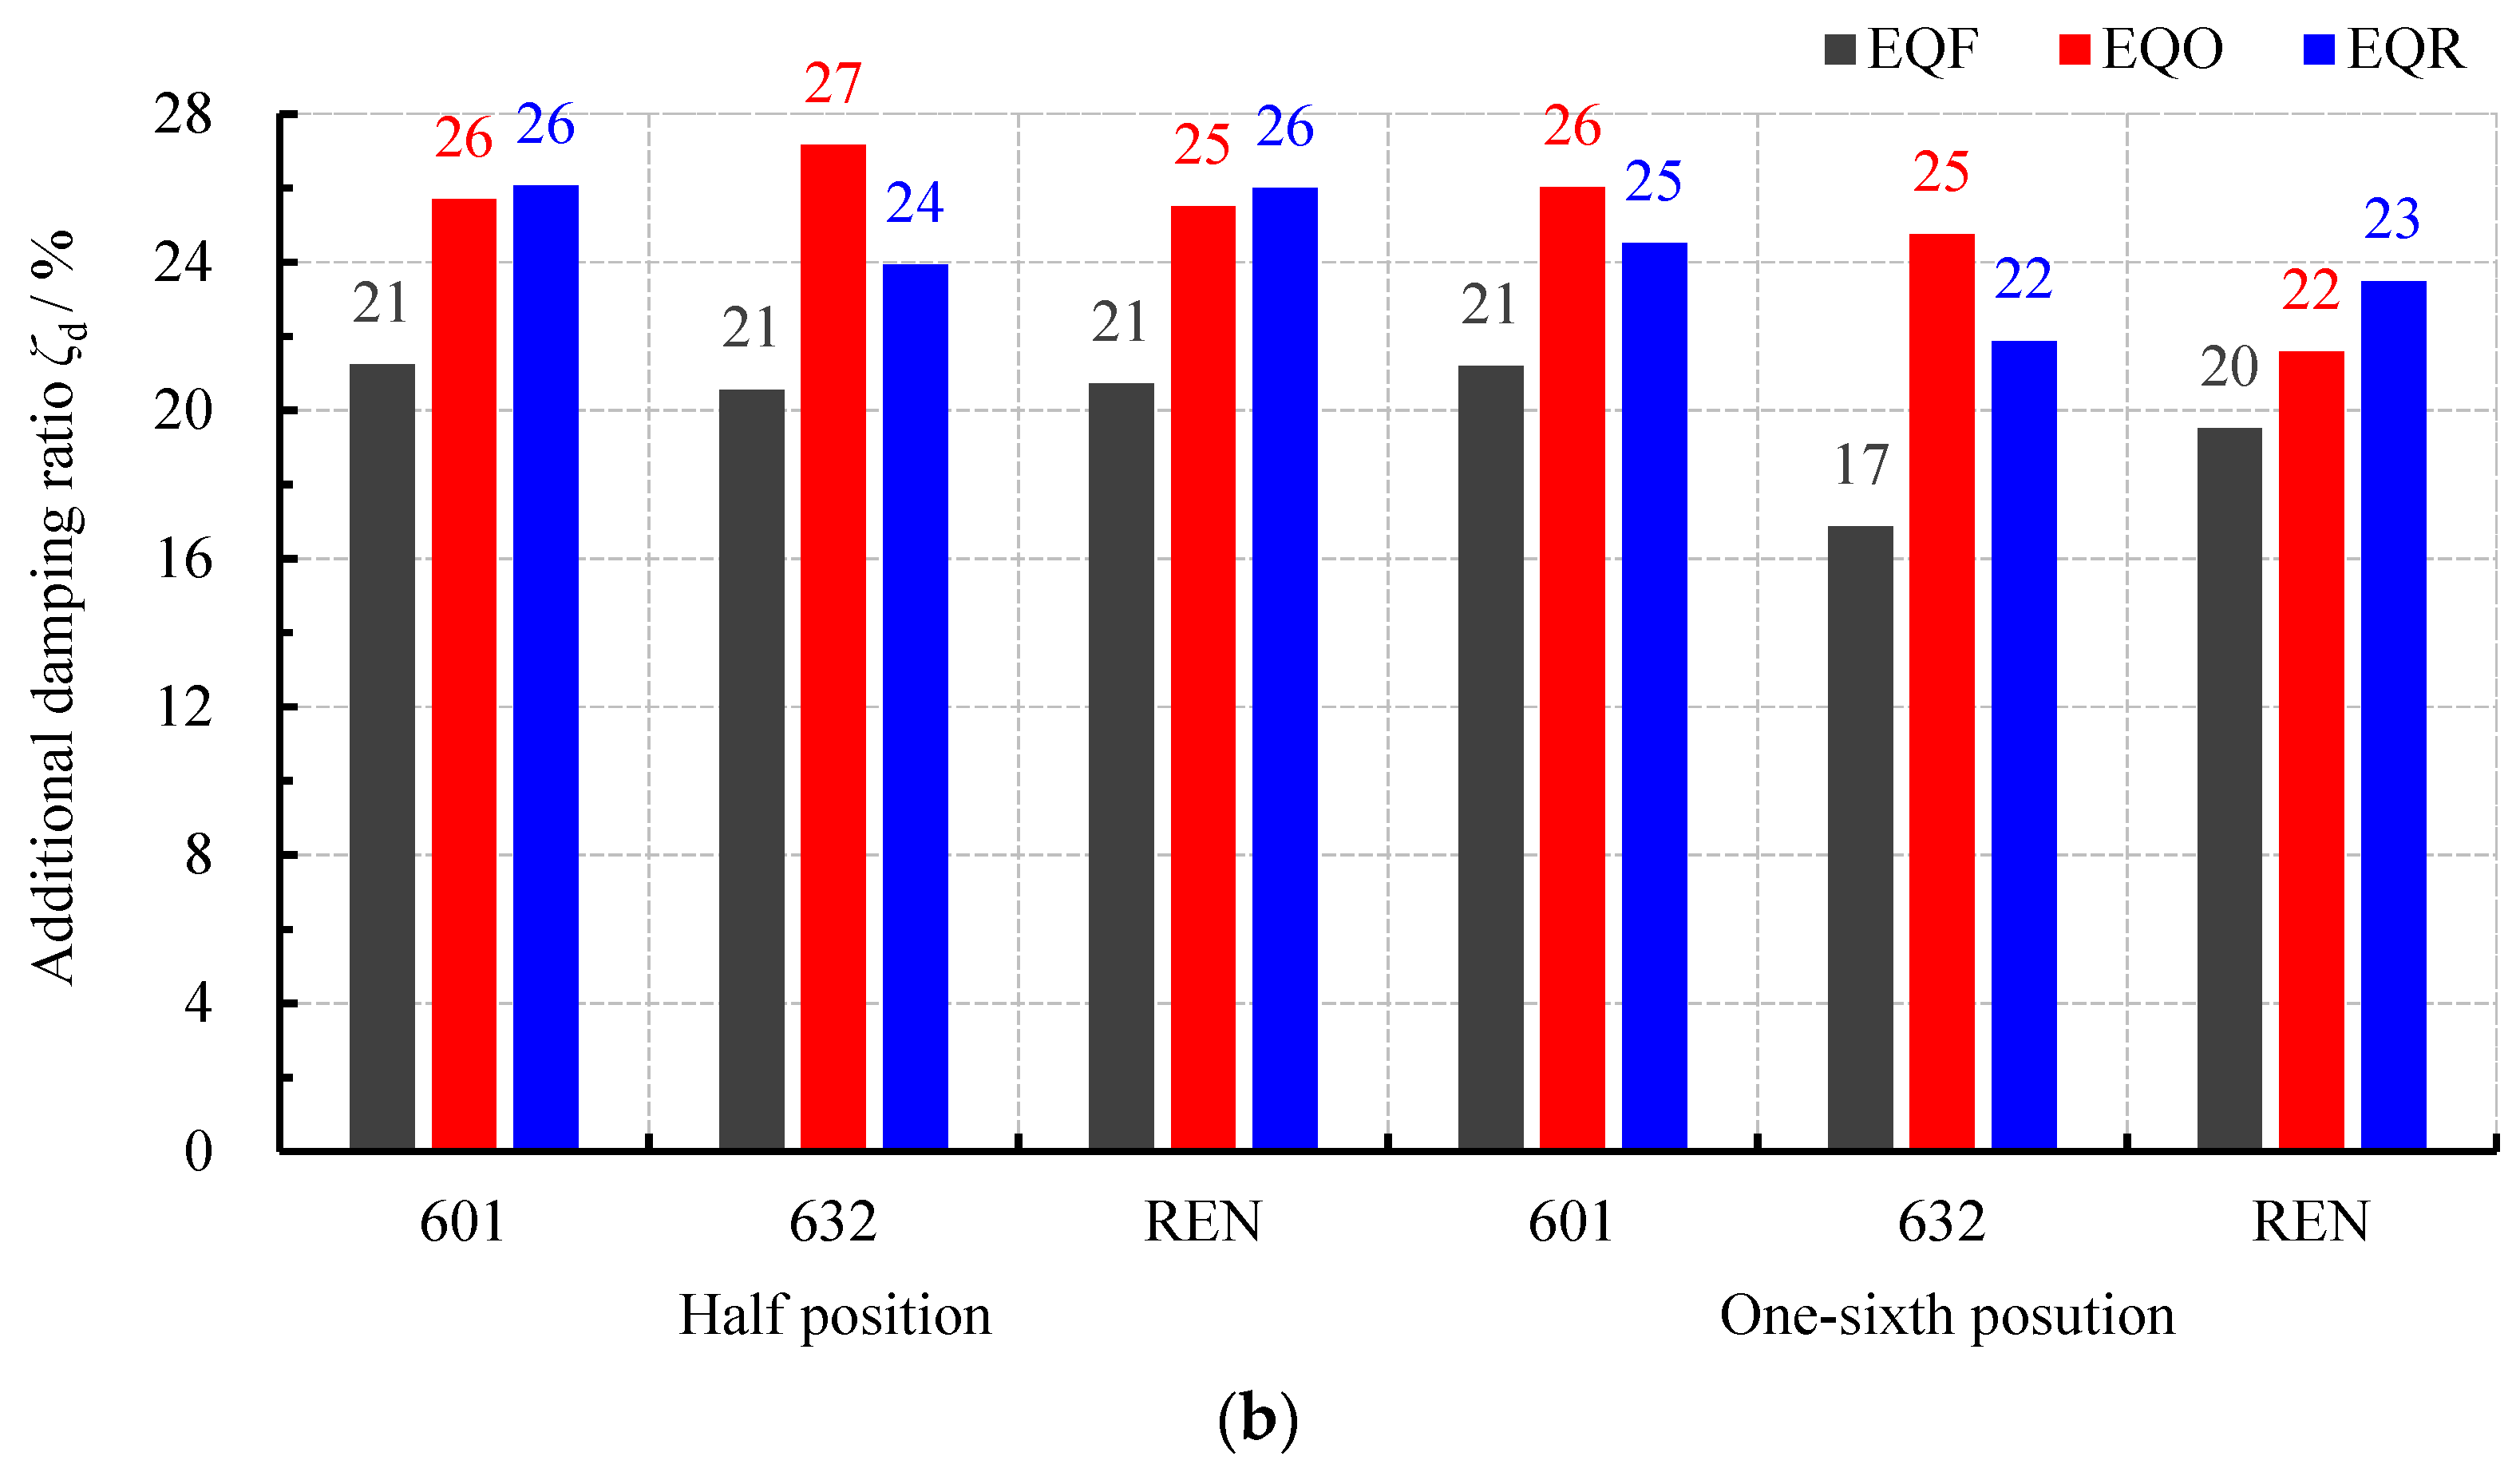
3.2. Additional Damping Ratio
- (1)
- The additional damping ratio varies significantly with different locations of damper arrangement.
- (2)
- Regardless of whether the earthquake is frequent, occasional, or rare, the additional damping ratio of the damper arrangement at the 1/2 position within the beam span is significantly greater than that at the 1/6 position within the beam span. For example, for the artificial seismic wave REN, the additional damping ratios are 19% and 11%, 20% and 13%, and 13% and 11% at different seismic levels and different arrangement positions, respectively.
- (3)
- The overall trend is that the additional damping ratio decreases with increasing seismic level, especially when the damper is arranged at the 1/2 position of the beam span. For instance, the additional damping ratios of the natural seismic wave 601 under frequent, occasional, and rare earthquake conditions are 21%, 17%, and 13%, respectively.
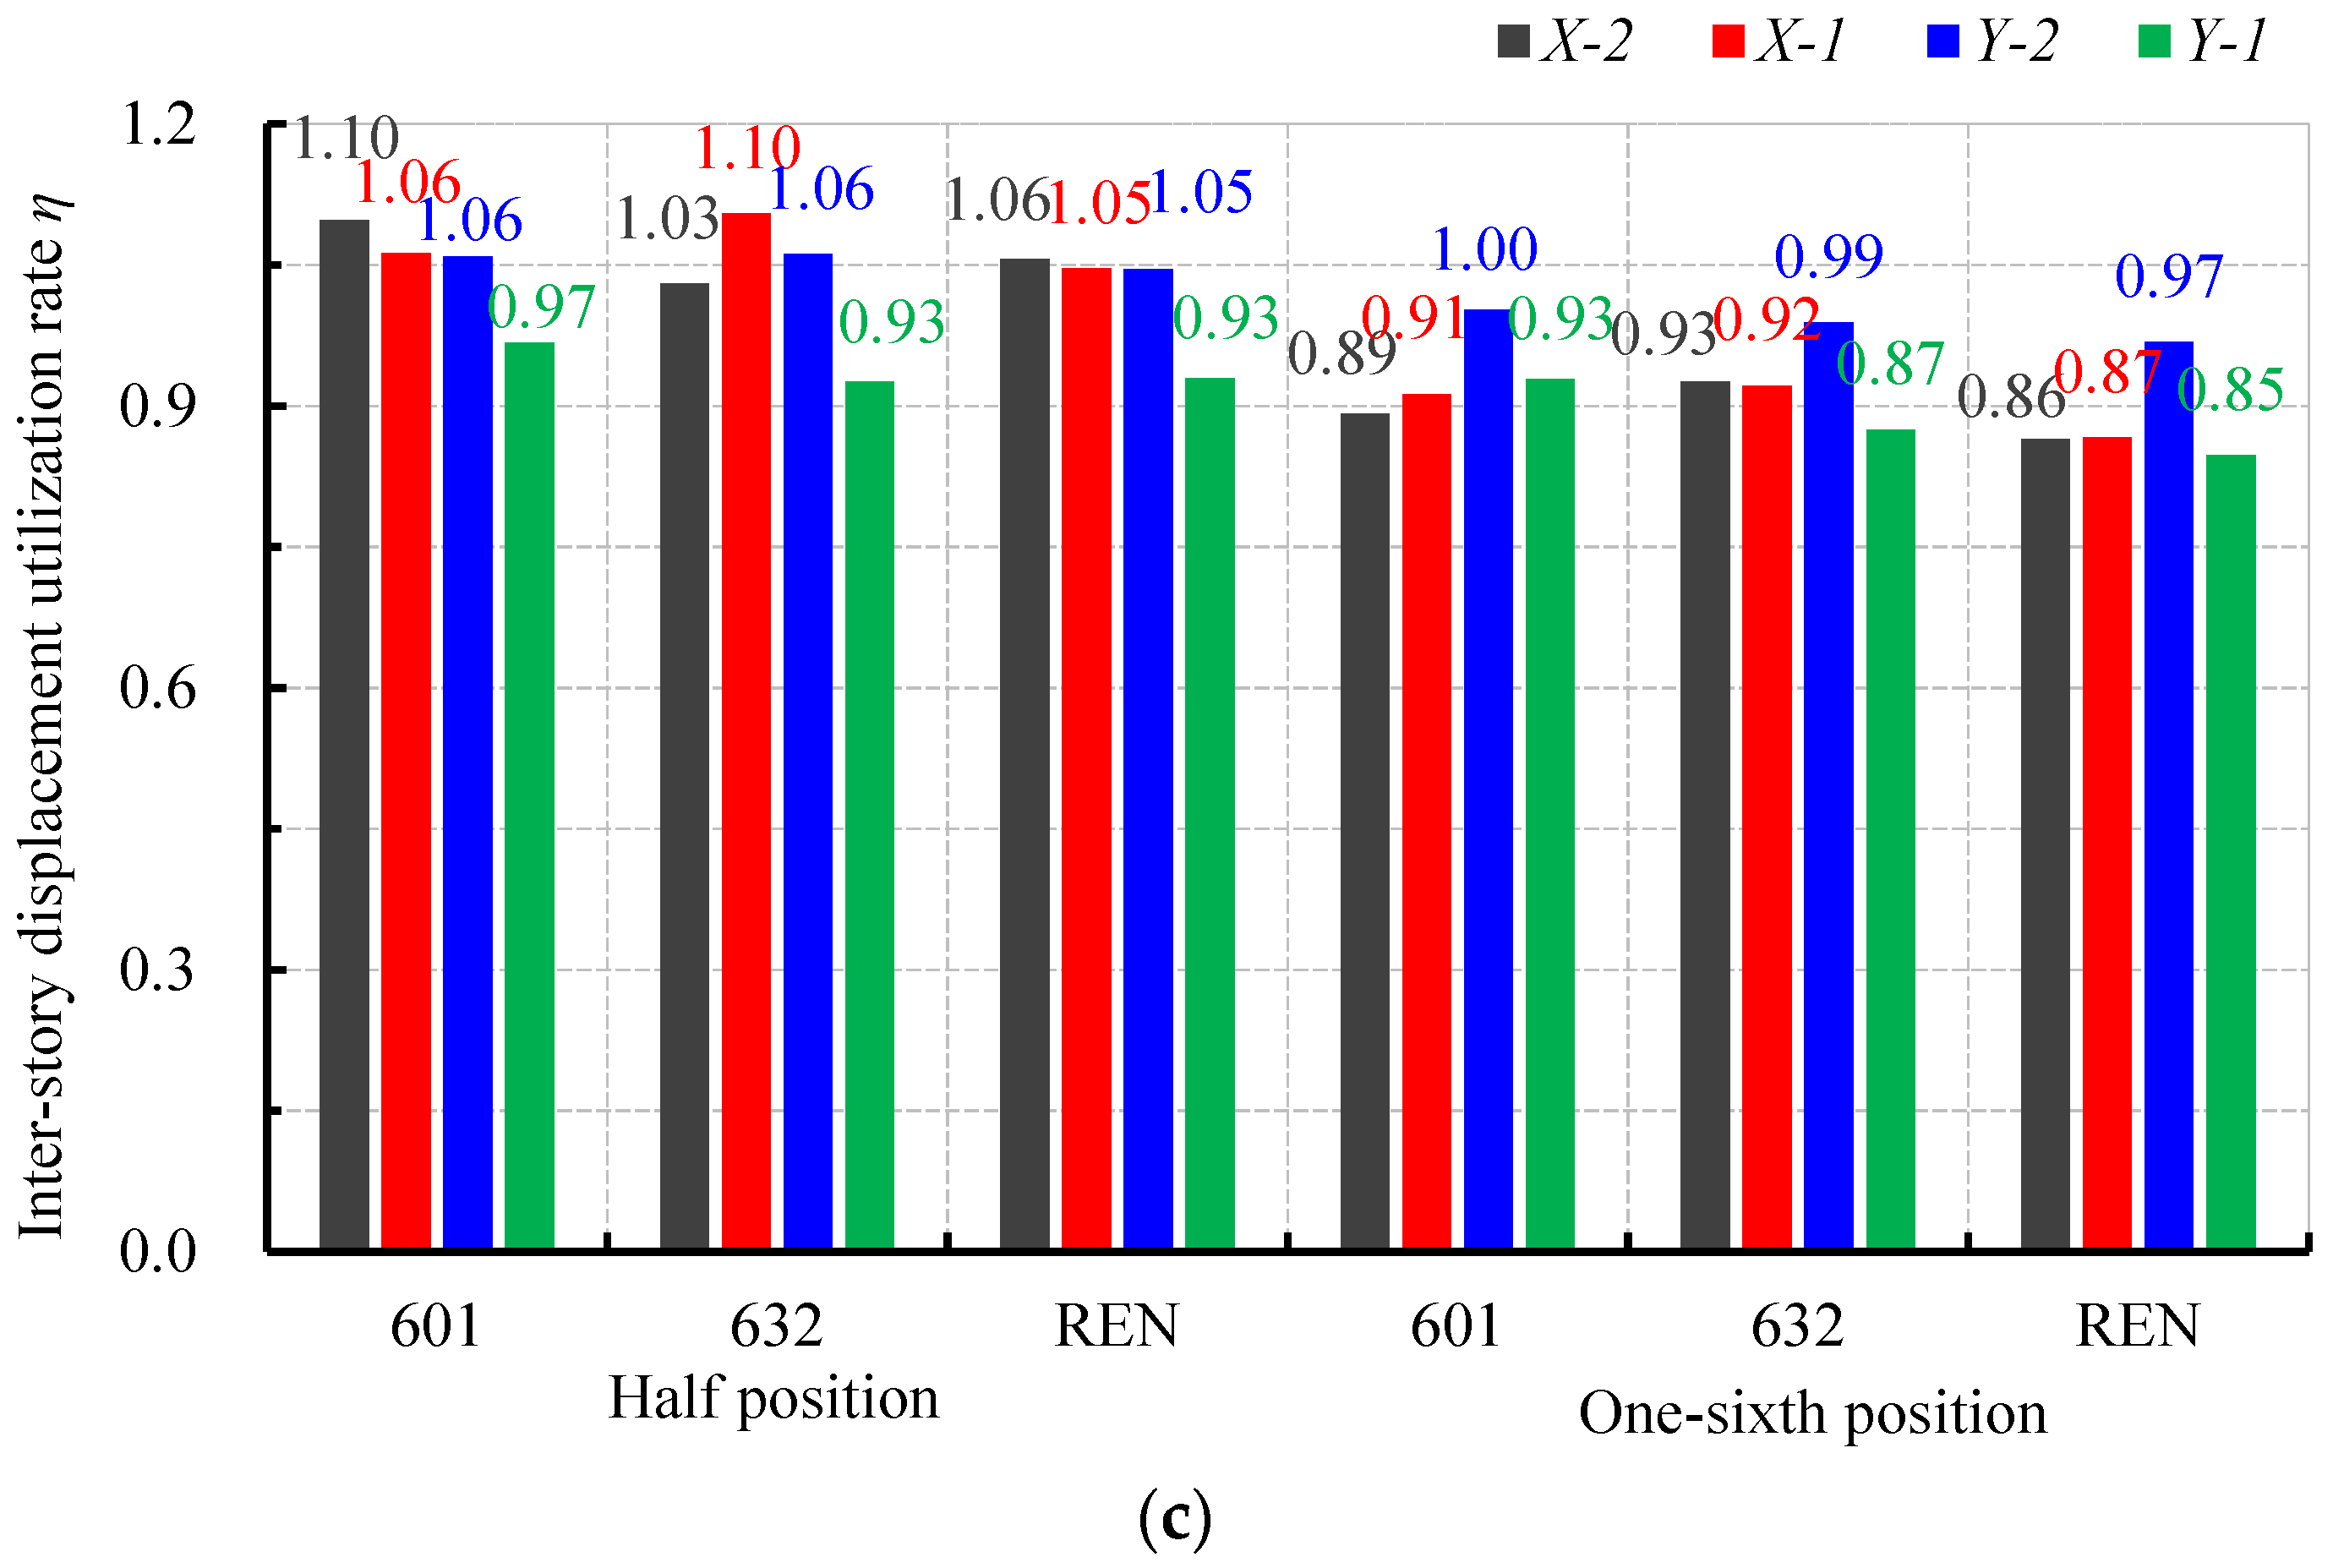
3.3. Inter-Story Displacement Utilization Rate
- (1)
- There is a significant difference in the inter-story displacement utilization rate for different damper placement positions, regardless of whether it is subjected to frequent, occasional, or rare earthquakes. The inter-story displacement utilization rate is significantly higher when the dampers are placed at the 1/2 position within the beam span compared to the 1/6 position within the beam span.
- (2)
- With the increase in seismic levels, the inter-story displacement utilization rate also noticeably increases. For the 1/2 position, the inter-story displacement utilization rate ranges from 0.74 to 0.90 for frequent earthquakes, from 0.87 to 1.04 for occasional earthquakes, and from 0.93 to 1.10 for rare earthquakes.
- (3)
- It can also be observed from the figure that the inter-story displacement utilization rate of the second floor is greater than that of the first floor.
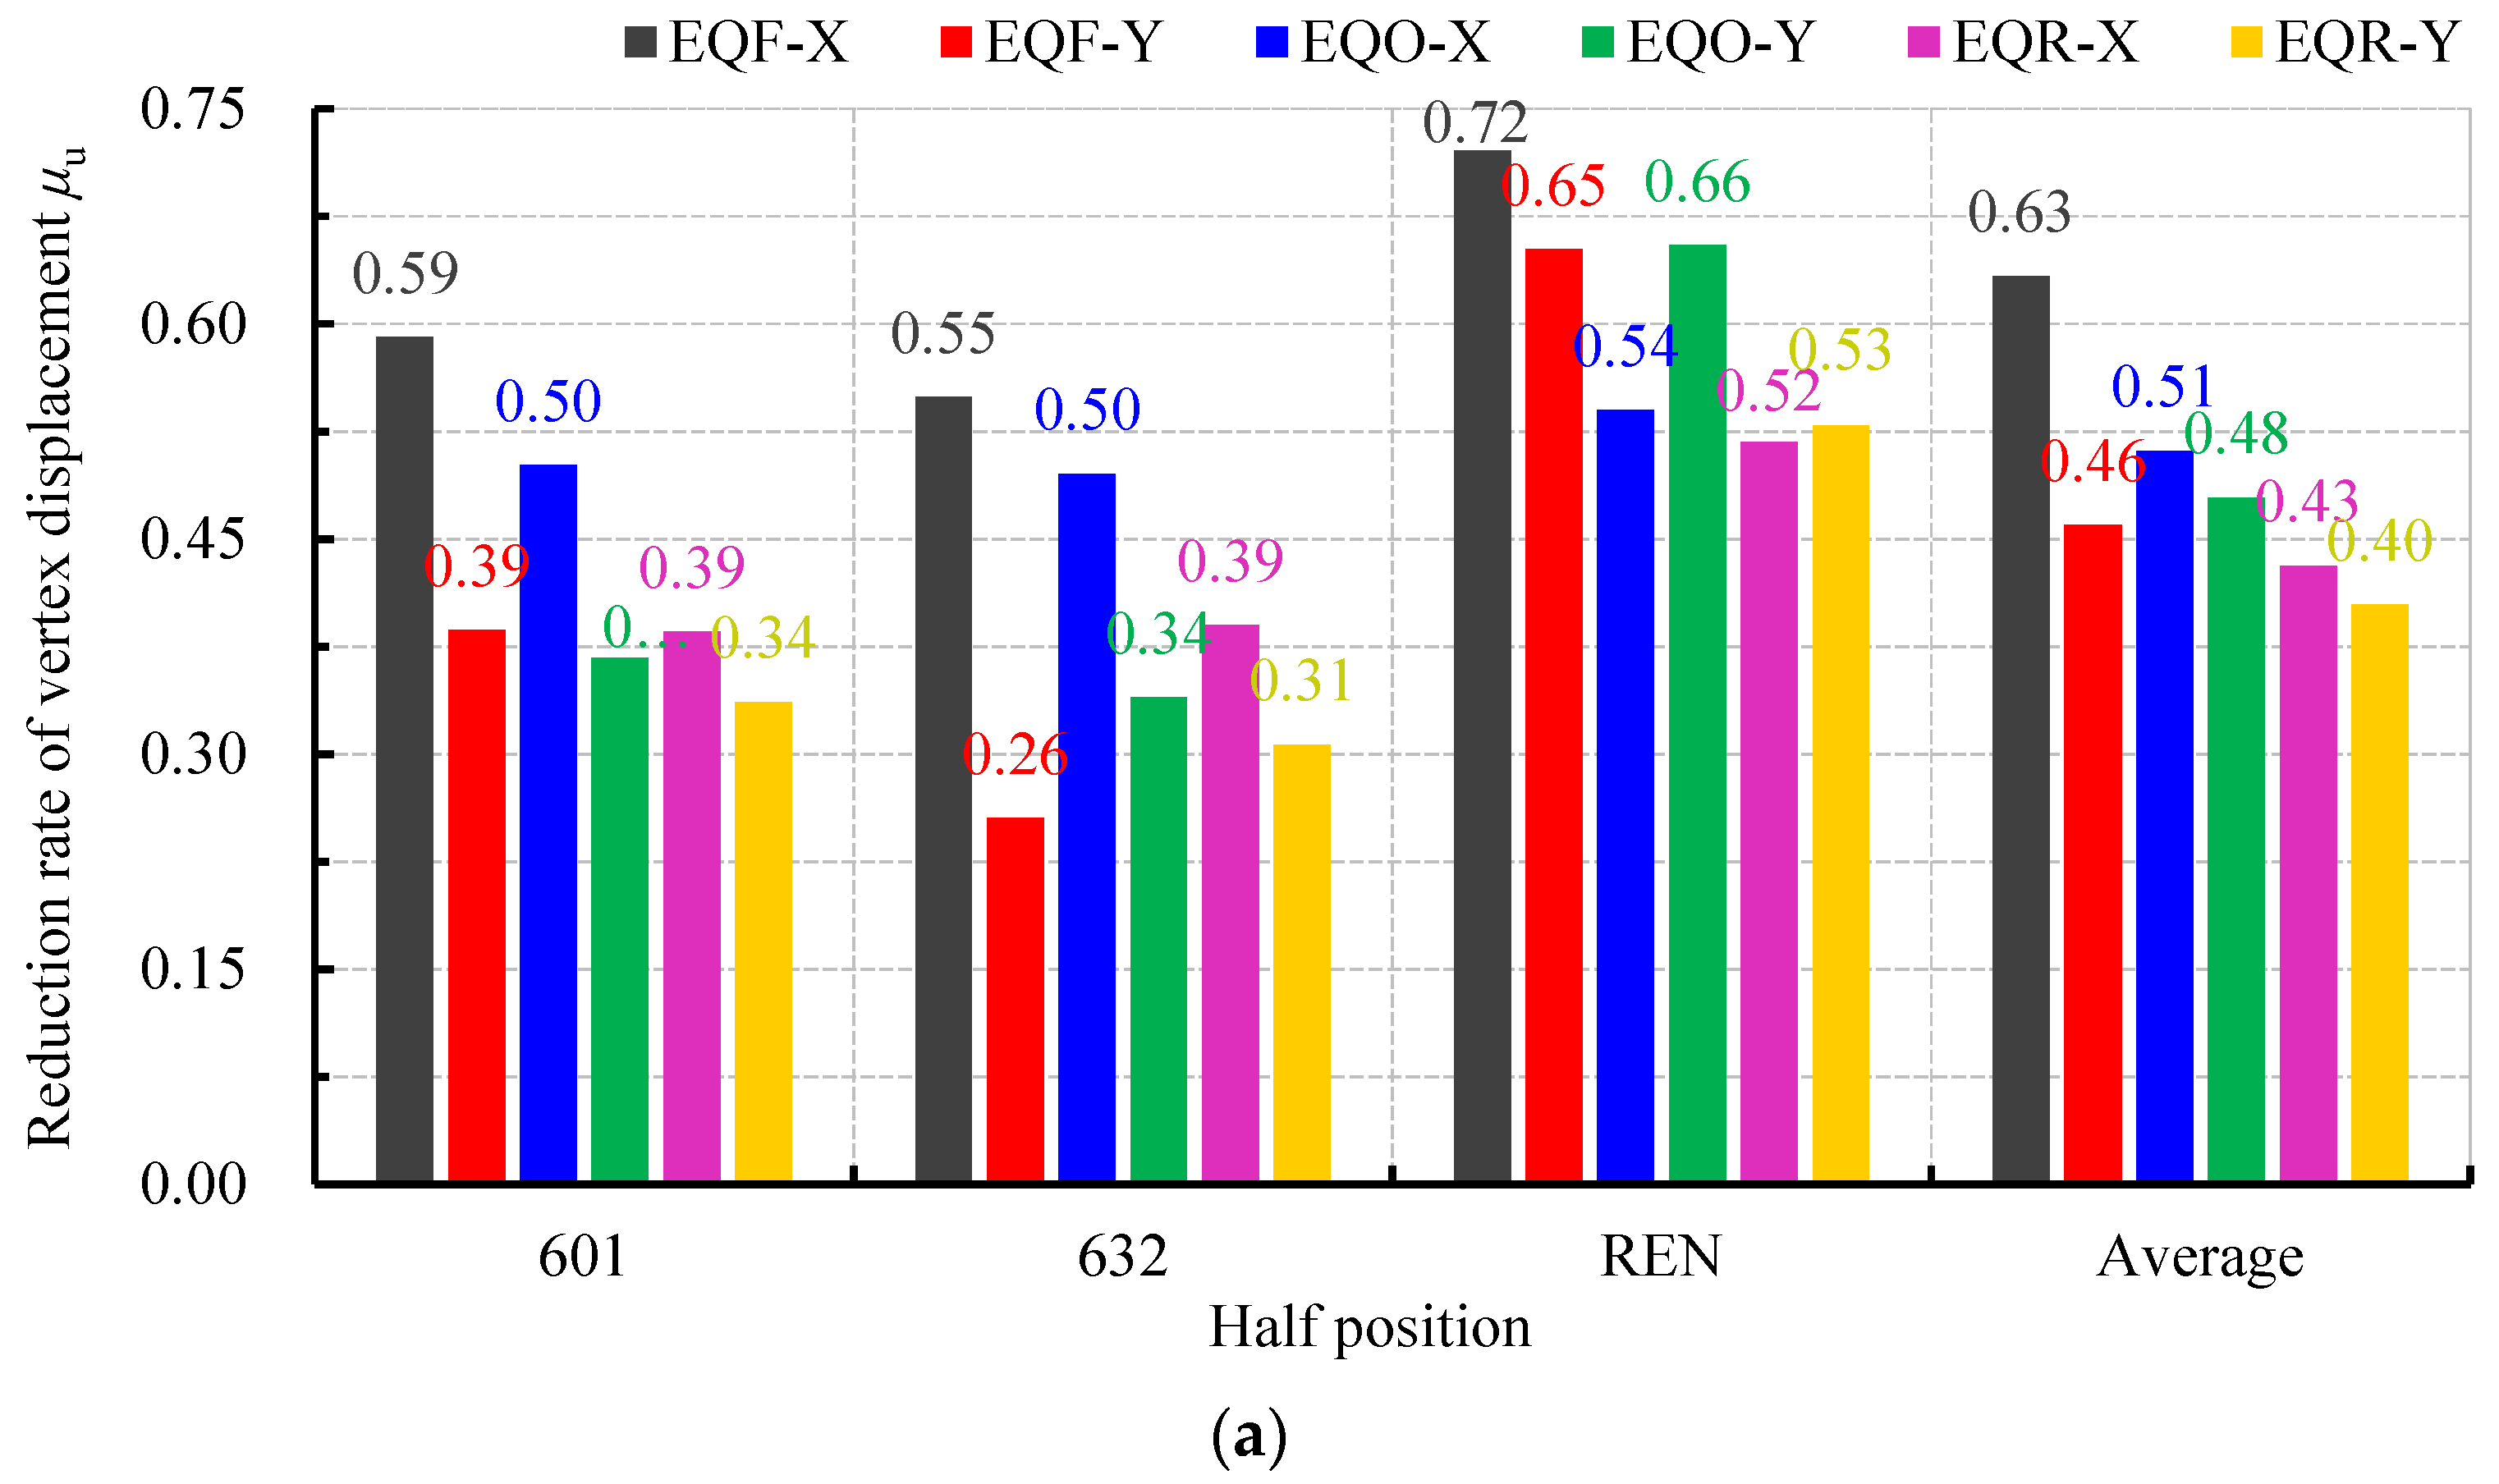
3.4. Reduction Rate of Vertex Displacement
- (1)
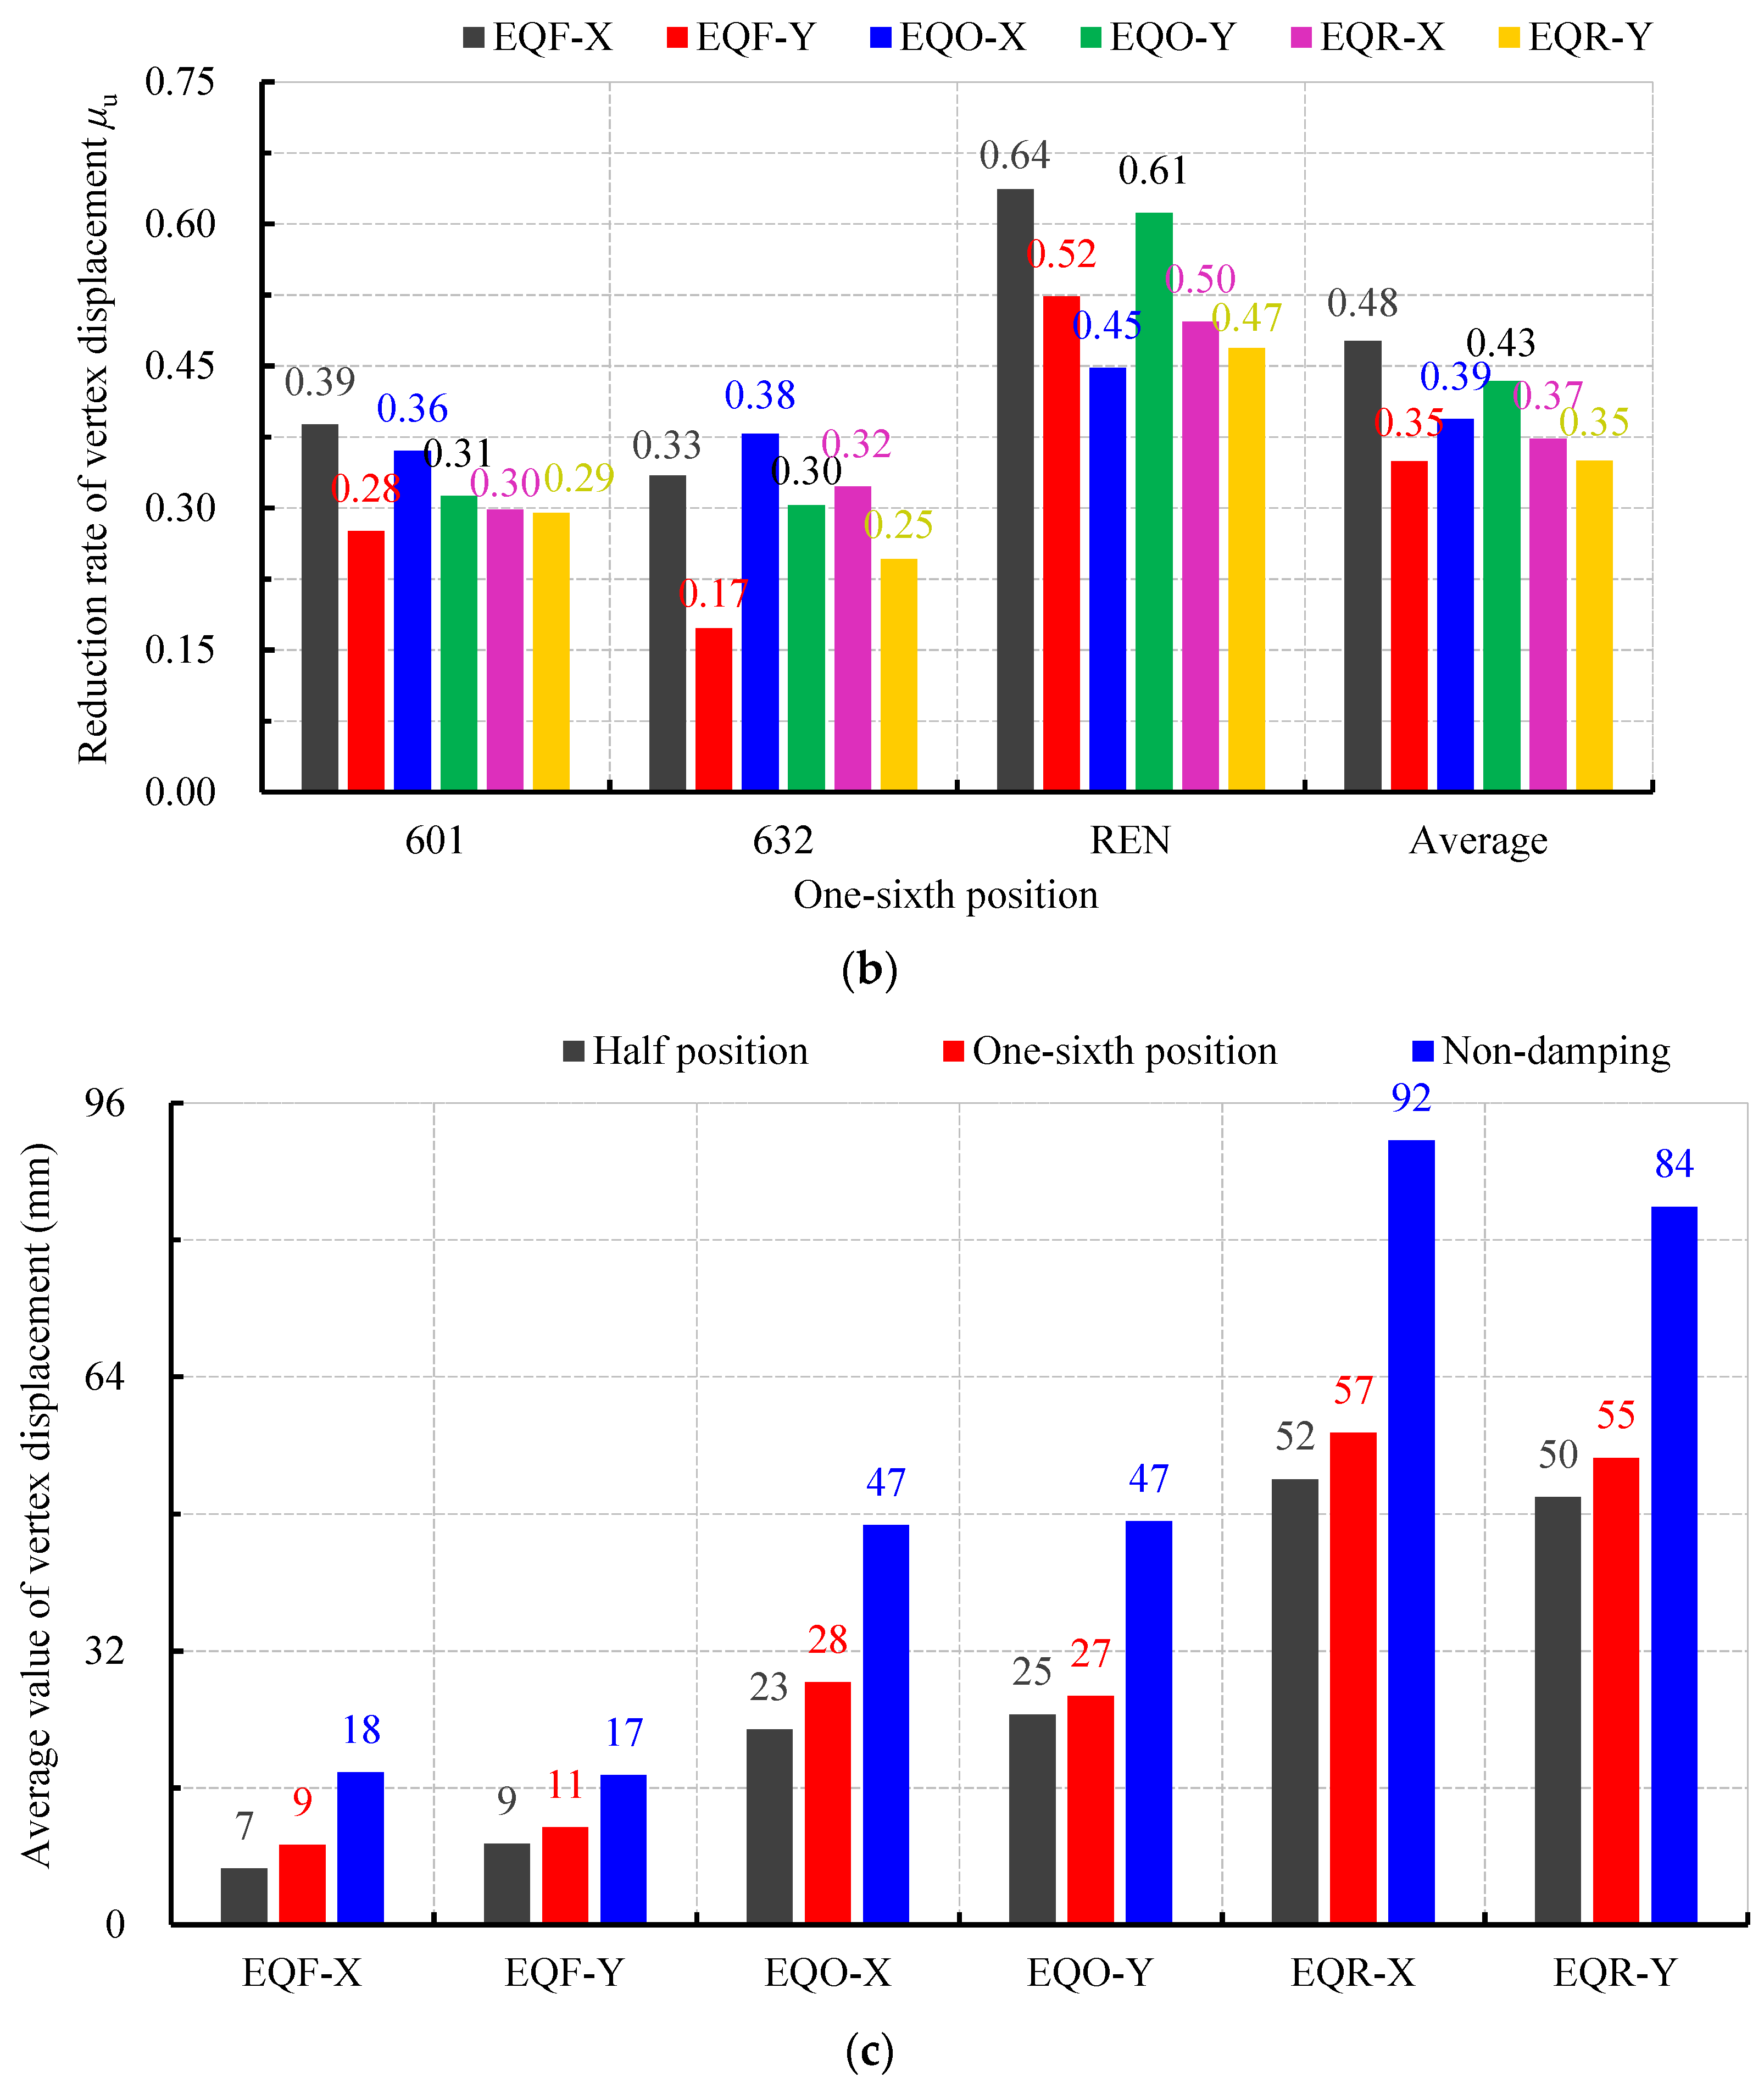
- The reduction rate of the vertex displacement in the damped structure is significant. When the dampers are arranged at the 1/2 position within the beam span, the reduction rates of the vertex displacement for the three waves range from 0.26 to 0.72, while when the dampers are arranged at the 1/6 position within the beam span, the reduction rates of the vertex displacement for the three waves range from 0.17 to 0.64. The average reduction rates of the vertex displacement for the three seismic waves range from 0.40 to 0.63 and 0.35 to 0.48, respectively.
- (2)
- The reduction rate of the vertex displacement under the action of the artificial wave REN is significantly higher than that of the other two natural waves, 601 and 632.
- (3)
- From Figure 14c, it can be seen that the vertex displacement of the damped structure is significantly smaller than that of the non-damped structure. For example, under rare earthquakes, the vertex displacement in the X-direction for the damped and non-damped structures is 50-plus mm and 92 mm, respectively, while in the Y-direction, it is 50-plus mm and 84 mm, respectively. This indicates that the damped structure with additional viscous dampers has excellent damping efficiency. Moreover, the vertex displacement when the dampers are arranged at the 1/2 position within the beam span is smaller than that when the dampers are arranged at the 1/6 position, indicating that the closer the damper is to the middle of the beam span, the better the damping efficiency of the structure.
3.5. Reduction Rate of Base Shear
- (1)
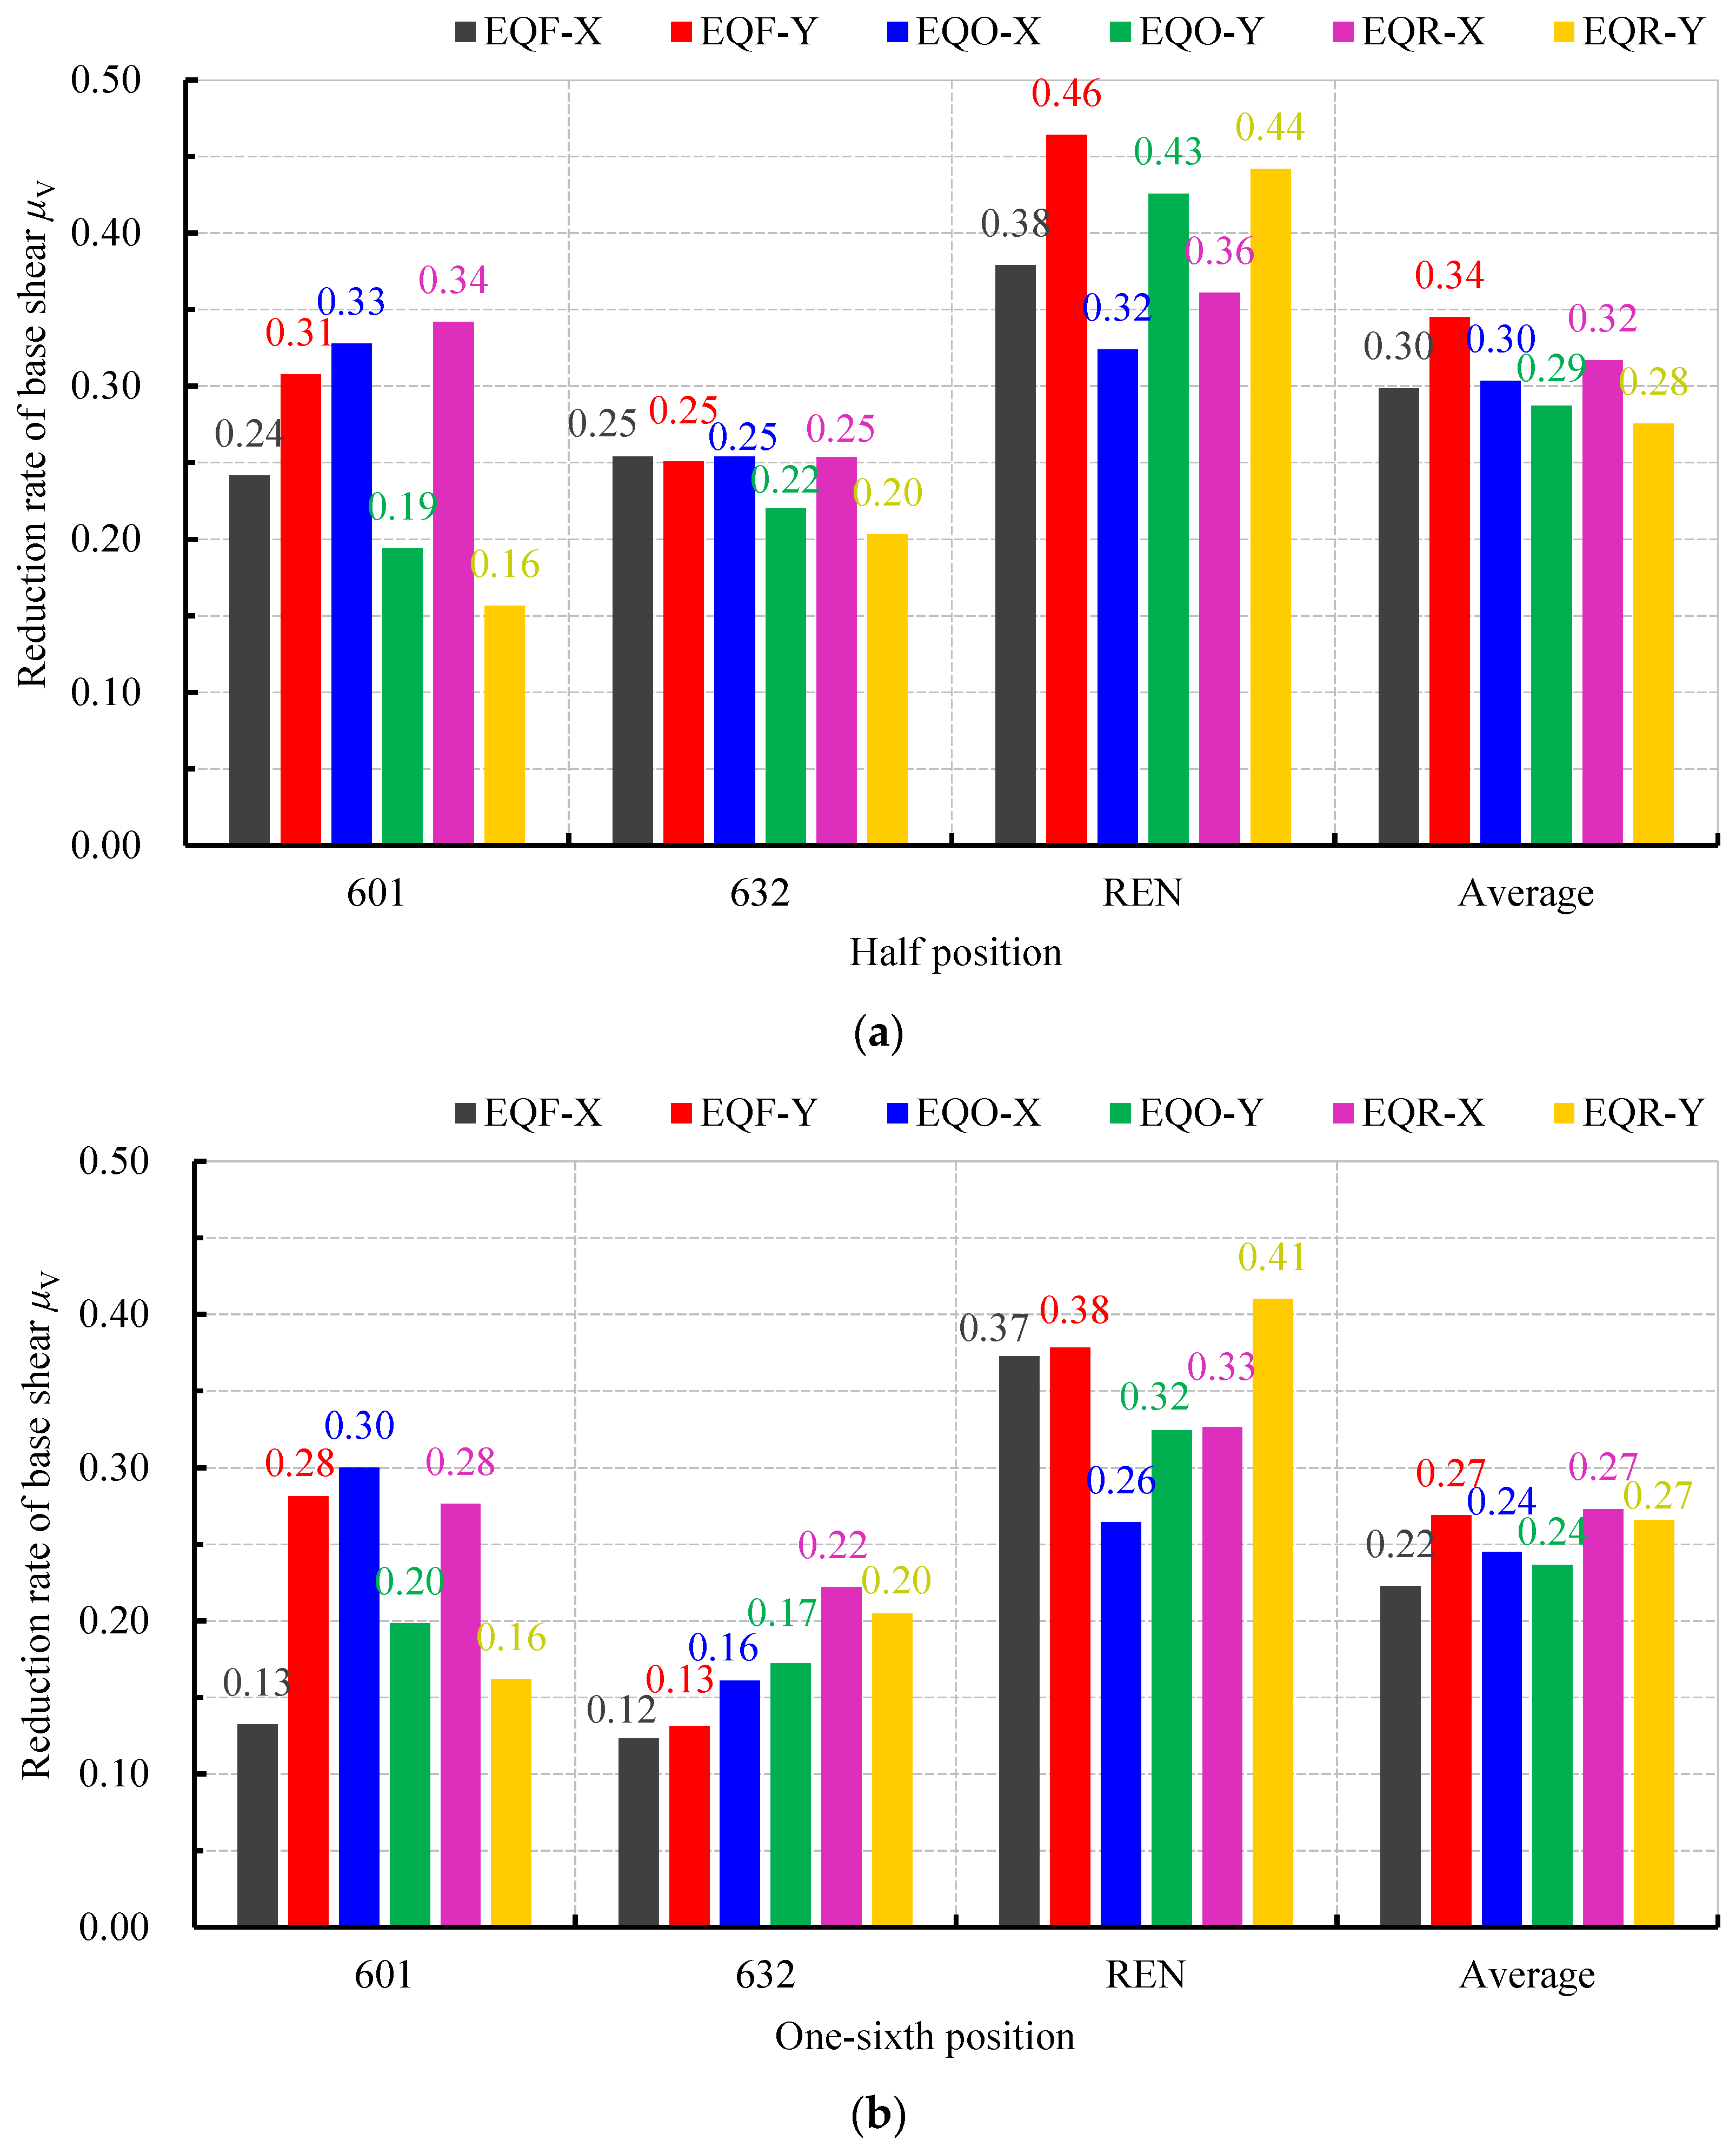
- The reduction rate of the base shear in the damped structure is significant. When dampers are arranged at the 1/2 position within the beam span, the reduction rates of the base shear for the three waves range from 0.16 to 0.46. When dampers are arranged at the 1/6 position within the beam span, the reduction rates of the base shear for the three waves range from 0.12 to 0.41. The average reduction rates of the base shear for the three waves are between 0.28 and 0.34, and between 0.22 and 0.27, respectively.
- (2)
- The reduction rate of the base shear under the artificial wave REN is significantly higher than that of the other two natural waves, 601 and 632.
- (3)
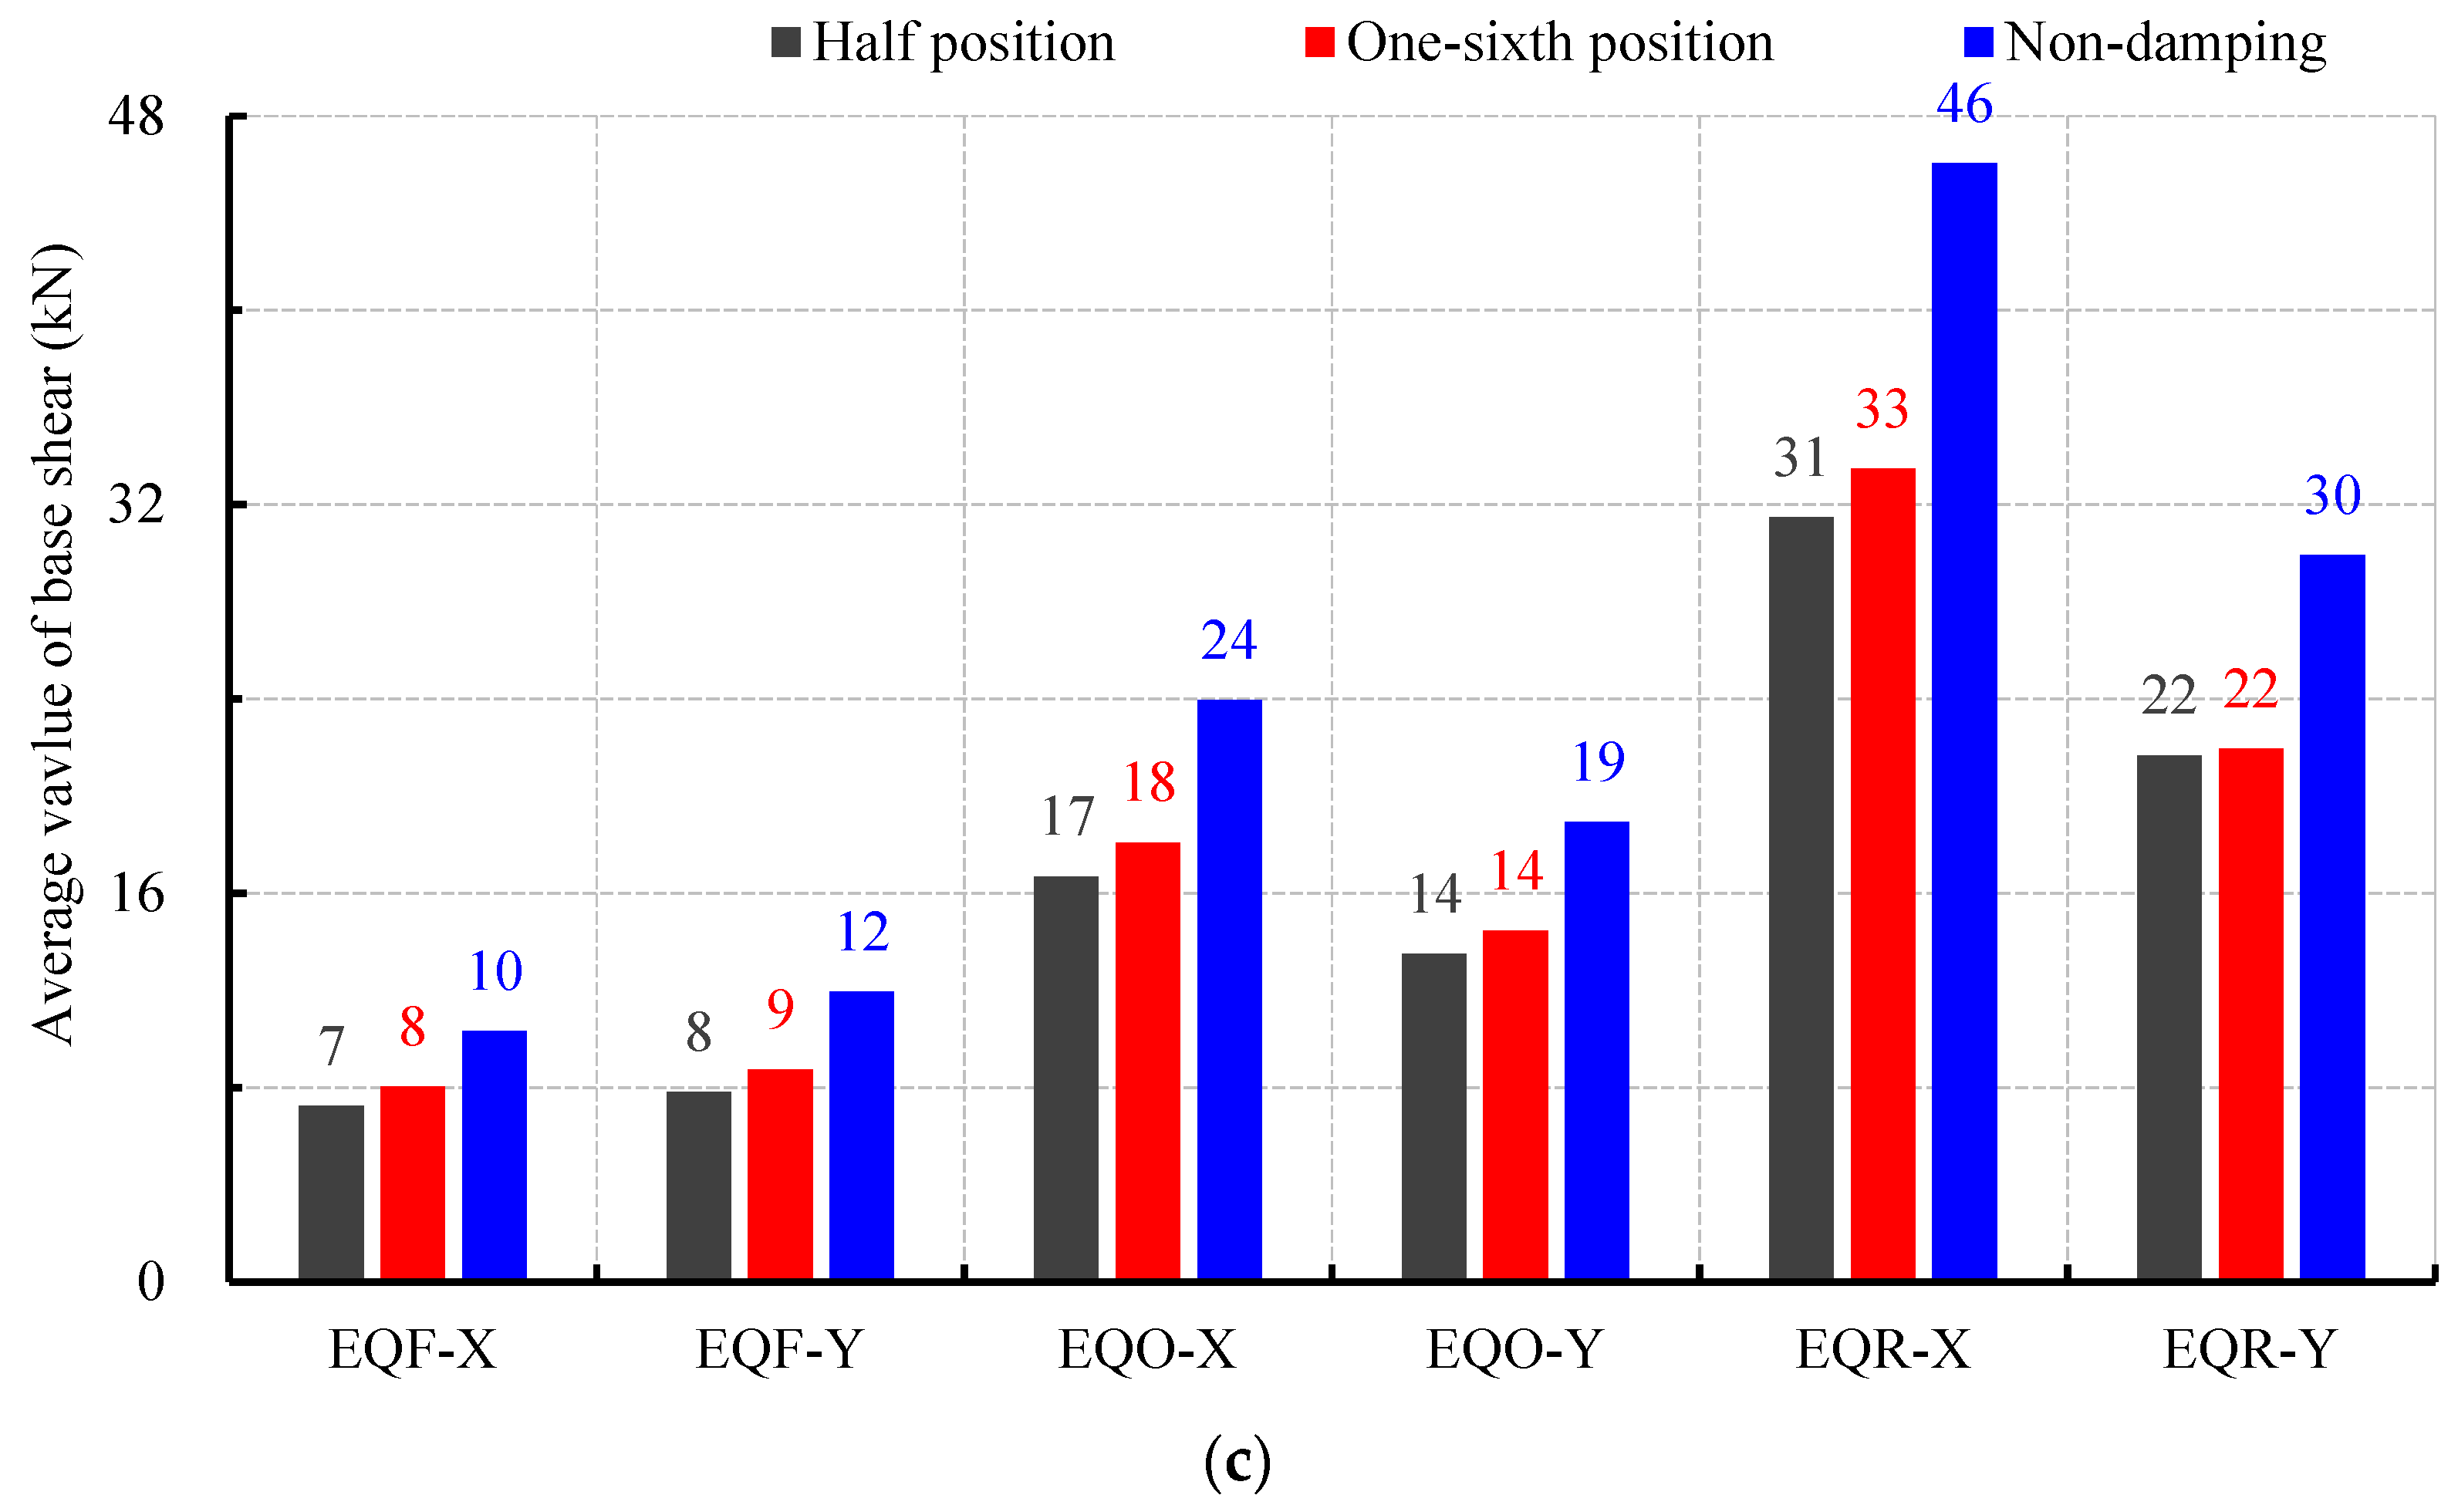
- From Figure 15c, it can be observed that the base shear of the damped structure is significantly smaller than that of the non-damped structure. For example, under rare earthquake conditions, the base shear in the X-direction for the damped and non-damped structures are 30-plus kN and 46 kN, respectively, and in the Y-direction, they are 20-plus kN and 30 kN, respectively. This indicates that the damped structure with additional viscous dampers has excellent damping efficiency. Moreover, the base shear when dampers are arranged at the 1/2 span position is smaller than that when dampers are arranged at the 1/6 span position, indicating that the closer the damper is to the middle of the beam span, the better the damping efficiency of the structure.
4. Conclusions
- (1)
- The response of damped structures and non-damped structures under different seismic levels is significantly different. The vertex displacement was reduced from 17–18 mm to 7–11 mm for frequent earthquakes, from 47 mm to 23–28 mm for occasional earthquakes, and from 84–92 mm to 50–57 mm for rare earthquakes. The base shear was reduced from 10–12 kN to 7–9 kN for frequent earthquakes, from 19–24 kN to 14–18 kN for occasional earthquakes, and from 30–46 kN to 22–31 kN for rare earthquakes. This fully demonstrated that the damped structures with additional viscous dampers had good damping effects.
- (2)
- From the hysteresis loops of the damper, it can be seen that the viscous damper added to the structure effectively dissipated seismic energy. This further significantly reduced the seismic response of the structure. Compared with the non-damped structures, the average reduction rates of the vertex displacement and base shear for the three waves of damped structures were 0.35–0.63 and 0.22–0.34, respectively. This fully demonstrated that the damped structures using viscous dampers exhibited excellent damping efficiency.
- (3)
- The arrangement position of dampers within the beam span significantly affected the damping efficiency of the damped structure. Overall, the damping effect was significantly better when the dampers were placed at the 1/2 position of the beam span compared to the 1/6 position. The hysteresis loops representing the energy dissipation of the dampers illustrated this phenomenon. As for the additional damping ratio of the structures, taking the artificial wave REN in the X-direction as an example, they were 19% and 11% for frequent earthquakes, 20% and 13% for occasional earthquakes, and 13% and 11% for rare earthquakes under the two placement positions, respectively. The inter-story displacement utilization rate was 0.74–0.90 and 0.48–0.69, 0.87–1.04 and 0.73–0.95, and 0.93–1.10 and 0.85–1.0 for the two positions under frequent, occasional, and rare earthquakes, respectively. The average reduction rate of the vertex displacement for the three waves was 0.40–0.63 and 0.35–0.48 for the two placement positions, respectively. The average reduction rate of the base shear for the three waves was 0.28–0.34 and 0.22–0.27 for the two placement positions, respectively.
- (4)
- Introducing a novel evaluation metric known as the inter-story displacement utilization rate, which is primarily utilized to gauge the displacement utilization of dampers in damped structures based on the floor’s displacement where the damper is located. This study revealed that the closer the damper was positioned to the center of the beam span, the higher the inter-story displacement utilization rate. Furthermore, as seismic levels increased, so did the inter-story displacement utilization rate. When a centrally placed damper experienced significant seismic activity, the inter-story displacement utilization rate approached 1.0, indicating that the damper’s displacement can reach a level comparable to that of the floor.
Author Contributions
Funding
Data Availability Statement
Conflicts of Interest
References
- Lin, W.H.; Chopra, A.K. Earthquake response of elastic SDF systems with nonlinear fluid viscous dampers. Earthq. Eng. Struct. Dyn. 2002, 31, 1623–1642. [Google Scholar] [CrossRef]
- Soong, T.T.; Spencer, B.F., Jr. Supplemental energy dissipation: State-of-the-art and state-of-the-practice. Eng. Struct. 2002, 24, 243–259. [Google Scholar] [CrossRef]
- Titirla, M.D. A state-of-the-art review of passive energy dissipation systems in steel braces. Buildings 2023, 13, 851. [Google Scholar] [CrossRef]
- Constantinou, M.C.; Symans, M.D. Experimental study of seismic response of buildings with supplemental fluid dampers. Struct. Design Tall Build. 1993, 2, 93–132. [Google Scholar] [CrossRef]
- Vaiana, N.; Sessa, S.; Marmo, F.; Rosati, L. Nonlinear dynamic analysis of hysteretic mechanical systems by combining a novel rate-independent model and an explicit time integration method. Nonlinear Dyn. 2019, 98, 2879–2901. [Google Scholar] [CrossRef]
- Vaiana, N.; Napolitano, C.; Rosati, L. Some recent advances on the modeling of the hysteretic behavior of rate-independent passive energy dissipation devices. In Proceedings of the 8th International Conference on Computational Methods in Structural Dynamics and Earthquake Engineering, Athens, Greece, 28–30 June 2021; pp. 2435–2445. [Google Scholar]
- Zoccolini, L.; Bruschi, E.; Cattaneo, S.; Quaglini, V. Current trends in fluid viscous dampers with semi-active and adaptive behavior. Appl. Sci. 2023, 13, 10358. [Google Scholar] [CrossRef]
- Lu, Z.; Wang, Z.; Zhou, Y.; Lu, X. Nonlinear dissipative devices in structural vibration control: A review. J. Sound Vib. 2018, 423, 18–49. [Google Scholar] [CrossRef]
- Lavan, O. On the efficiency of viscous dampers in reducing various seismic responses of wall structures. Earthq. Eng. Struct. Dyn. 2012, 41, 1673–1692. [Google Scholar] [CrossRef]
- Hwang, J.S.; Huang, Y.N.; Yi, S.L.; Song, Y.H. Design formulations for supplemental viscous dampers to building structures. J. Struct. Eng. 2008, 134, 22–31. [Google Scholar] [CrossRef]
- Xie, Y.; Zhang, J.; Xi, W. Effectiveness evaluation and optimal design of nonlinear viscous dampers for inelastic structures under pulse-type ground motions. Earthq. Eng. Struct. Dyn. 2018, 47, 2802–2820. [Google Scholar] [CrossRef]
- Gherbi, A.; Belgasmia, M. A simplified design strategy of nonlinear fluid viscous dampers for MDOF structures. Iran. J. Sci. Technol. Trans. Civ. Eng. 2022, 46, 857–864. [Google Scholar] [CrossRef]
- Diotallevi, P.P.; Landi, L.; Dellavalle, A. A methodology for the direct assessment of the damping ratio of structures equipped with nonlinear viscous dampers. J. Earthq. Eng. 2012, 16, 350–373. [Google Scholar] [CrossRef]
- Xu, W.; Du, D.; Wang, S.; Li, W. A new method to calculate additional damping ratio considering the effect of excitation frequency. Adv. Civ. Eng. 2020, 2020, 3172982. [Google Scholar] [CrossRef]
- Occhiuzzi, A. Additional viscous dampers for civil structures: Analysis of design methods based on effective evaluation of modal damping ratios. Eng. Struct. 2009, 31, 1093–1101. [Google Scholar] [CrossRef]
- Rama, R.K.; Ansu, M.; Iyer, N.R. A methodology of design for seismic performance enhancement of buildings using viscous fluid dampers. Struct. Control Health Monit. 2014, 21, 342–355. [Google Scholar] [CrossRef]
- Domenico, D.D.; Hajirasouliha, I. Multi-level performance-based design optimisation of steel frames with nonlinear viscous dampers. Bull. Earthq. Eng. 2021, 19, 5015–5049. [Google Scholar] [CrossRef]
- Ding, J.; Wang, S.; Wu, H. Seismic performance analysis of viscous damping outrigger in super high-rise buildings. Struct. Design Tall Spec. Build. 2018, 27, e1486. [Google Scholar] [CrossRef]
- Dargush, G.F.; Sant, R.S. Evolutionary aseismic design and retrofit of structures with passive energy dissipation. Earthq. Eng. Struct. Dyn. 2005, 34, 1601–1626. [Google Scholar] [CrossRef]
- Lavan, O.; Amir, O. Simultaneous topology and sizing optimization of viscous dampers in seismic retrofitting of 3D irregular frame structures. Earthq. Eng. Struct. Dyn. 2014, 43, 1325–1342. [Google Scholar] [CrossRef]
- Tubaldi, E.; Ragni, L.; Dall’Asta, A. Probabilistic seismic response assessment of linear systems equipped with nonlinear viscous dampers. Earthq. Eng. Struct. Dyn. 2015, 44, 101–120. [Google Scholar] [CrossRef]
- Tubaldi, E.; Kougioumtzoglou, I.A. Nonstationary stochastic response of structural systems equipped with nonlinear viscous dampers under seismic excitation. Earthq. Eng. Struct. Dyn. 2015, 44, 121–138. [Google Scholar] [CrossRef]
- Zhang, Y.; Xu, W.; Du, D.; Wang, S. Stochastic optimization of dissipation structures based on Lyapunov differential equations and the full stress design method. Buildings 2023, 13, 665. [Google Scholar] [CrossRef]
- Su, C.; Li, B.; Chen, T.; Dai, X. Stochastic optimal design of nonlinear viscous dampers for large-scale structures subjected to non-stationary seismic excitations based on dimension-reduced explicit method. Eng. Struct. 2018, 175, 217–230. [Google Scholar] [CrossRef]
- Rodolfo, J.T.G.; Yeudy, F.V.A.; Ramon, G.D. Probabilistic estimation of the dynamic response of high-rise buildings via transfer functions. Eng. Struct. 2024, 302, 117299. [Google Scholar]
- Wang, Z.; Zhao, J.; Chen, X.; Liu, S.; Ma, B. Experimental investigation of seismic response of precast concrete panels with castellated keys support pillar connections under in-plane cyclic loading. Sci. Rep. 2023, 13, 21764. [Google Scholar] [CrossRef] [PubMed]
- Chang, K.C.; Lin, Y.Y.; Chen, C.Y. Shaking table study on displacement-based design for seismic retrofit of existing buildings using nonlinear viscous dampers. J. Struct. Eng. 2008, 134, 671–681. [Google Scholar] [CrossRef]
- Bogdanovic, A.; Rakicevic, Z.; Noroozinejad Farsangi, E. Shake table tests and numerical investigation of a resilient damping device for seismic response control of building structures. Struct. Control Health Monit. 2019, 26, e2443. [Google Scholar] [CrossRef]
- Singh, M.P.; Moreschi, L.M. Optimal seismic response control with dampers. Earthq. Eng. Struct. Dyn. 2001, 30, 553–572. [Google Scholar] [CrossRef]
- Aguirre, J.J.; Almazan, J.L.; Paul, C.J. Optimal control of linear and nonlinear asymmetric structures by means of passive energy dampers. Earthq. Eng. Struct. Dyn. 2013, 42, 377–395. [Google Scholar] [CrossRef]
- Parcianello, E.; Chisari, C.; Amadio, C. Optimal design of nonlinear viscous dampers for frame structures. Soil Dyn. Earthq. Eng. 2017, 100, 257–260. [Google Scholar] [CrossRef]
- Whittle, J.K.; Williams, M.S.; Karavasilis, T.L.; Blakeborough, A. A comparison of viscous damper placement methods for improving seismic building design. J. Earthq. Eng. 2012, 16, 540–560. [Google Scholar] [CrossRef]
- Lopez, G.D. A simple method for the design of optimal damper configurations in MDOF structures. Earthq. Spectra. 2001, 17, 387–398. [Google Scholar]
- Takewaki, I. Optimal damper placement for minimum transfer functions. Earthq. Eng. Struct. Dyn. 1997, 26, 1113–1124. [Google Scholar] [CrossRef]
- Takewaki, I. Optimal damper placement for critical excitation. Probabilist. Eng. Mech. 2000, 15, 317–325. [Google Scholar] [CrossRef]
- Lin, T.K.; Hwang, J.S.; Chen, K.H. Optimal distribution of damping coefficients for viscous dampers in buildings. Int. J. Struct. Stab. Dyn. 2017, 17, 1750054. [Google Scholar] [CrossRef]
- Aydin, E.; Boduroglu, M.H.; Guney, D. Optimal damper distribution for seismic rehabilitation of planar building structures. Eng. Struct. 2007, 29, 176–185. [Google Scholar] [CrossRef]
- GB/T 228.1-2021; Chinese Standard, Metallic Materials-Tensile Testing–Part 1: Method of Test at Room Temperature. Chinese Architecture and Building Press: Beijing, China, 2021.
- Lan, X.; Pan, W.; Zhang, L.; Yu, W.; Wu, K. Application and research of viscous fluid damper in frame structure. Sichuan Build. Sci. 2022, 48, 10–17. (In Chinese) [Google Scholar]
- JGJ 297-2013; Chinese Standard, Technical Specification for Seismic Energy Dissipation of Buildings. Chinese Architecture and Building Press: Beijing, China, 2013.
- GB 50011-2016; Chinese Standard, Code for Seismic Design of Buildings. Chinese Architecture and Building Press: Beijing, China, 2016.


| Projects | Basic Parameters |
|---|---|
| Tabletop dimensions | 4 m × 4 m |
| Maximum load capacity | 30 tons |
| Vibration direction | Bi-directional three degrees of freedom (X and Y translational motion, and Z rotational motion) |
| Vibration waveforms | Various types of waves, including regular waves, random waves, and simulated seismic waves. |
| The maximum acceleration | ±1.0 g (Payload of 20 tons), ±0.8 g (Payload of 30 tons) |
| Maximum velocity | 800 mm/s |
| Maximum displacement | ±125 mm |
| Frequency range | 0.1 Hz~100 Hz |
| Types | Width b/mm | Height h/mm | The Thickness of the Web Plate/mm | The Thickness of the Flange/mm |
|---|---|---|---|---|
| HW100 × 100 | 100 | 100 | 5.3 | 7.0 |
| HW125 × 125 | 125 | 125 | 6.0 | 8.0 |
| HW175 × 175 | 175 | 175 | 6.4 | 9.3 |
| Types | Test Specimen Number | Measured Yield Strength fy/MPa | Measured Tensile Strength fu/MPa | fu/fy ≥ 1.25 | fy/235 ≤ 1.30 | Young’s Modulus E/GPa | Elongation at Fracture δ/% |
|---|---|---|---|---|---|---|---|
| HW 100 × 100 | No.1 | 263 | 376 | 1.43 | 1.12 | 195 | 31 |
| No.2 | 264 | 378 | 1.43 | 1.12 | 193 | 27 | |
| No.3 | 256 | 375 | 1.47 | 1.09 | 190 | 31 | |
| Average | 261 | 376 | 1.44 | 1.11 | 193 | 30 | |
| HW 125 × 125 | No.1 | 262 | 429 | 1.64 | 1.11 | 202 | 28 |
| No.2 | 261 | 430 | 1.65 | 1.11 | 203 | 27 | |
| No.3 | 261 | 425 | 1.63 | 1.11 | 204 | 27 | |
| Average | 261 | 428 | 1.64 | 1.11 | 203 | 27 | |
| HW 175 × 175 | No.1 | 260 | 424 | 1.63 | 1.10 | 204 | 27 |
| No.2 | 258 | 419 | 1.62 | 1.10 | 212 | 26 | |
| No.3 | 262 | 427 | 1.63 | 1.12 | 209 | 28 | |
| Average | 260 | 423 | 1.63 | 1.11 | 208 | 27 |
| Types | Damping Coefficient C/kN·(s/mm)α | Damping Index α | Design Stroke/mm | Design Load/kN | Quantity/Set | Quantity in Reserve/Set |
|---|---|---|---|---|---|---|
| I | 0.4 | 0.3 | ±30 | 2.25 | 4 | 1 |
| II | 0.3 | 0.45 | ±20 | 3.33 | 4 | 1 |
| Types | Damping Coefficient C | Types | Damping Coefficient C |
|---|---|---|---|
| I-1 | 0.52 kN/(mm/s)0.28 | II-1 | 0.29 kN/(mm/s)0.43 |
| I-2 | 0.20 kN/(mm/s)0.38 | II-2 | 0.21 kN/(mm/s)0.49 |
| I-3 | 0.28 kN/(mm/s)0.34 | II-3 | 0.37 kN/(mm/s)0.40 |
| I-4 | 0.40 kN/(mm/s)0.29 | II-4 | 0.27 kN/(mm/s)0.44 |
| I-5 | 0.36 kN/(mm/s)0.30 | II-5 | 0.31 kN/(mm/s)0.42 |
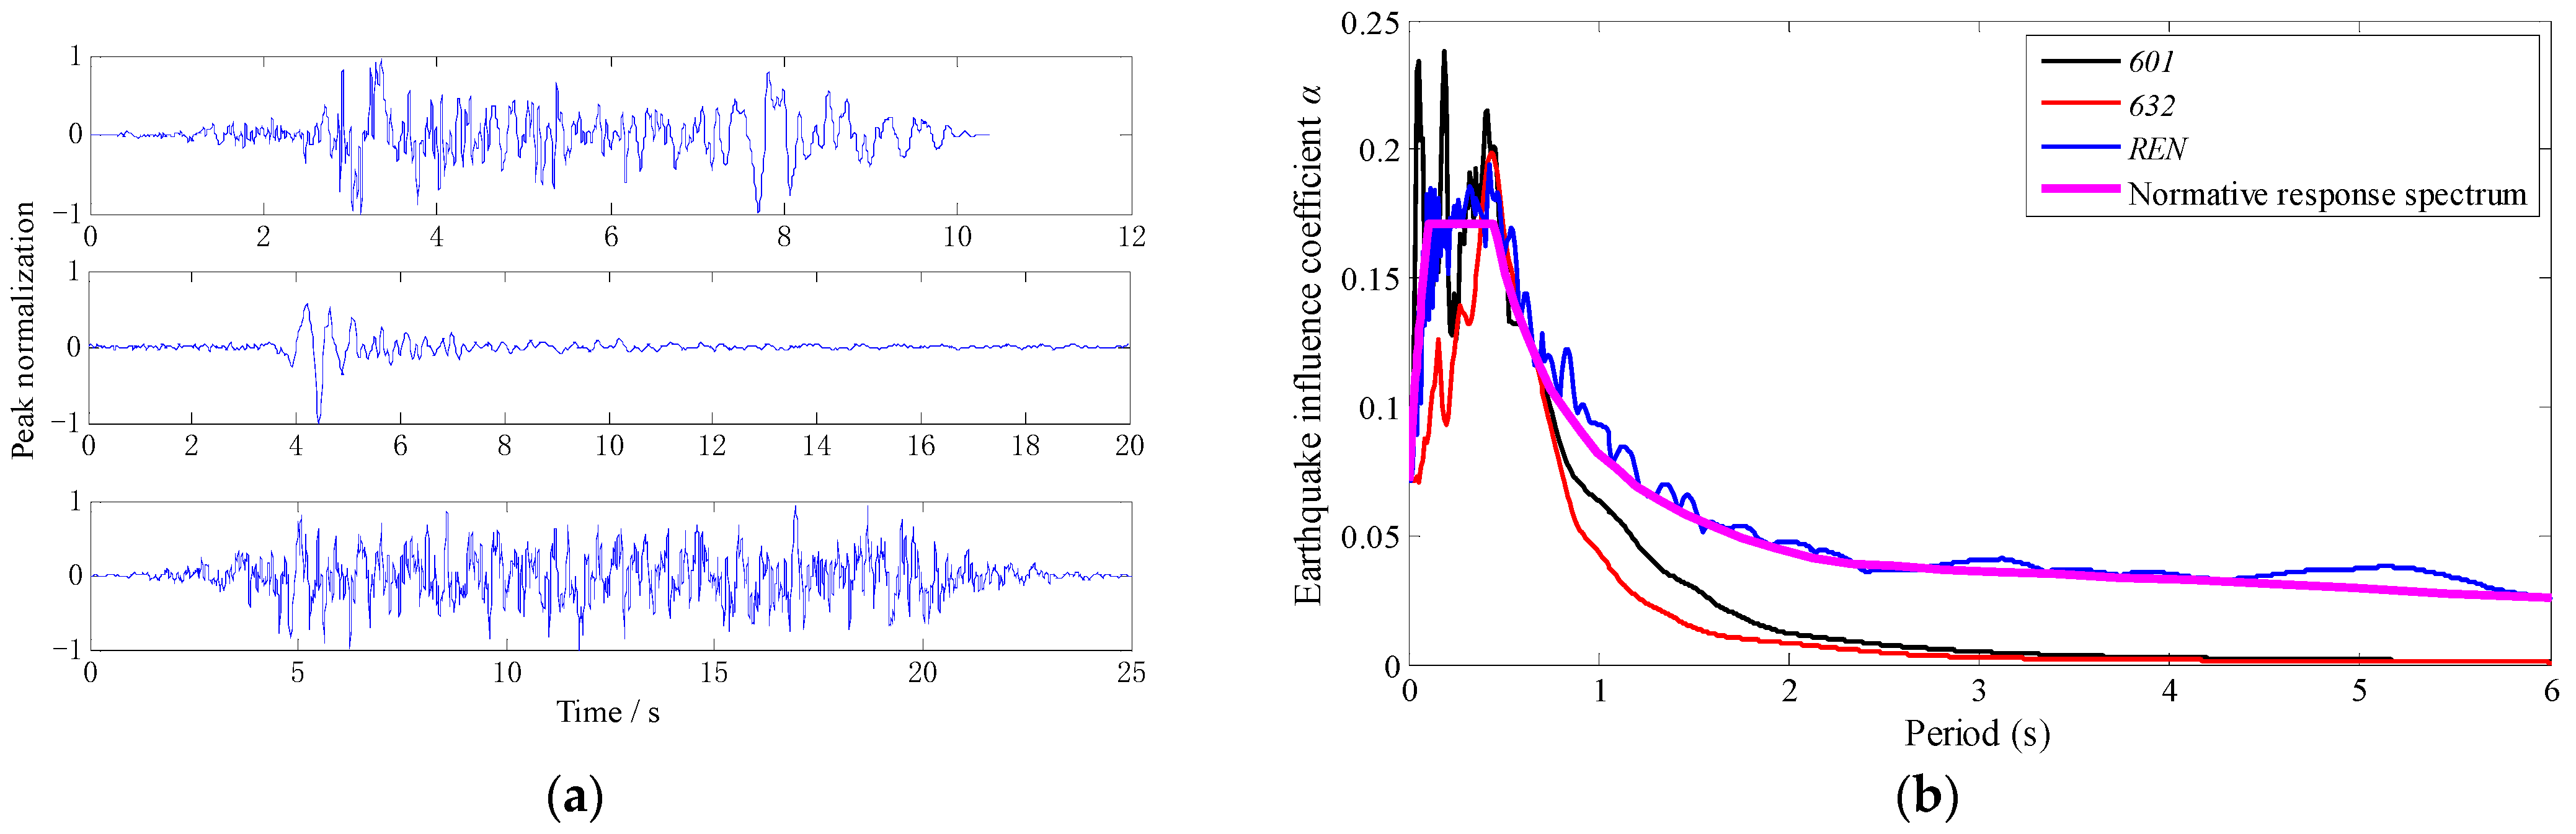
| Numbered | Earthquake Name | Occurrence Time | Recording Station | PGA (m/s2) |
|---|---|---|---|---|
| 601 | Imperial Valley-07 | 15 October 1979 | USGS STATION 412 | 3.20 |
| 632 | Northridge-05 | 17 January 1994 | SYLMAR-COUNTY HOSPITAL PARKING LOT | 0.90 |
| Operating Condition Numbers | Operating Condition Name | Seismic Levels | Seismic Waves | Direction | PGA/g |
|---|---|---|---|---|---|
| 1 | W1 | the first white noise | XY | 0.07 | |
| 2 | FX-601 | Frequent earthquake | 601 | X | 0.07 |
| 3 | FY-601 | 601 | Y | 0.07 | |
| 4 | FX-632 | 632 | X | 0.07 | |
| 5 | FY-632 | 632 | Y | 0.07 | |
| 6 | FX-REN | REN | X | 0.07 | |
| 7 | FY-REN | REN | Y | 0.07 | |
| 8 | W2 | the second white noise | XY | 0.07 | |
| 9 | OX-601 | Occasional earthquake | 601 | X | 0.20 |
| 10 | OY-601 | 601 | Y | 0.20 | |
| 11 | OX-632 | 632 | X | 0.20 | |
| 12 | OY-632 | 632 | Y | 0.20 | |
| 13 | OX-REN | REN | X | 0.20 | |
| 14 | OY-REN | REN | Y | 0.20 | |
| 15 | W3 | the third white noise | XY | 0.07 | |
| 16 | RX-601 | Rare earthquake | 601 | X | 0.40 |
| 17 | RY-601 | 601 | Y | 0.40 | |
| 18 | RX-632 | 632 | X | 0.40 | |
| 19 | RY-632 | 632 | Y | 0.40 | |
| 20 | RX-REN | REN | X | 0.40 | |
| 21 | RY-REN | REN | Y | 0.40 | |
| 22 | W4 | the fourth white noise | XY | 0.07 | |
Disclaimer/Publisher’s Note: The statements, opinions and data contained in all publications are solely those of the individual author(s) and contributor(s) and not of MDPI and/or the editor(s). MDPI and/or the editor(s) disclaim responsibility for any injury to people or property resulting from any ideas, methods, instructions or products referred to in the content. |
© 2024 by the authors. Licensee MDPI, Basel, Switzerland. This article is an open access article distributed under the terms and conditions of the Creative Commons Attribution (CC BY) license (https://creativecommons.org/licenses/by/4.0/).
Share and Cite
Lan, X.; Zhang, L.; Sun, B.; Pan, W. Study on the Damping Efficiency of a Structure with Additional Viscous Dampers Based on the Shaking Table Test. Buildings 2024, 14, 1506. https://doi.org/10.3390/buildings14061506
Lan X, Zhang L, Sun B, Pan W. Study on the Damping Efficiency of a Structure with Additional Viscous Dampers Based on the Shaking Table Test. Buildings. 2024; 14(6):1506. https://doi.org/10.3390/buildings14061506
Chicago/Turabian StyleLan, Xiang, Longfei Zhang, Baifeng Sun, and Wen Pan. 2024. "Study on the Damping Efficiency of a Structure with Additional Viscous Dampers Based on the Shaking Table Test" Buildings 14, no. 6: 1506. https://doi.org/10.3390/buildings14061506
APA StyleLan, X., Zhang, L., Sun, B., & Pan, W. (2024). Study on the Damping Efficiency of a Structure with Additional Viscous Dampers Based on the Shaking Table Test. Buildings, 14(6), 1506. https://doi.org/10.3390/buildings14061506