Article

Numerical Simulation and Calculation Method Study on Seamless Construction of Super-Length Raft Structures Based on Novel Magnesium Oxide Expansive Strengthening Band Method

China Construction Third Engineering Bureau Group Co., Ltd., Wuhan 430075, China
*
Author to whom correspondence should be addressed.
Buildings 2024, 14(6), 1531; https://doi.org/10.3390/buildings14061531
Submission received: 7 April 2024 / Revised: 10 May 2024 / Accepted: 21 May 2024 / Published: 25 May 2024

Abstract

:
The drive for continuous innovation in large-scale infrastructure necessitates advancements in techniques, addressing the challenges of constructing super-length concrete structures. This study investigated the emerging shift from traditional united expanding agent (UEA) to magnesia expansive agent (MEA) in conjunction with expansive strengthening bands (ESBs), marking a pivotal transition in ensuring monolithic integrity. Despite a decade of exploration, MEA–ESB implementation in real-world projects remains underdocumented, with scholarly focus primarily confined to material characterization. This research integrated empirical on-site tests of MEA–ESB with high-fidelity numerical simulations in ABAQUS. The finite element model (FEM) validation against actual test data underscored the precision of our modeling, capturing the complex thermomechanical behavior of the system. We introduced a sophisticated parametric analysis framework, elucidating the influence of critical parameters like the ESB-to-raft-width ratio and MEA concrete expansion rates. This granular understanding facilitated the fine-tuning of design parameters, advancing the practical application of MEA methodologies. A groundbreaking contribution entailed the formulation of predictive models for early-stage cracking, anchored in the guidelines of the ACI Committee 207 and refined through extensive parametric exploration. These formulae empower engineers to anticipate and mitigate cracking risks during the design phase, thereby enhancing project safety and efficiency. Notably, this study identified limitations in current prediction models, highlighting the need for future research to incorporate comprehensive lifecycle considerations, including hydration heat effects and time-dependent mechanical property evolution.

1. Introduction

To meet the demands of societal production and daily life, modern architectural structures continue to evolve toward greater spans and larger volumes, resulting in the proliferation of super-length concrete structures. Traditional construction methods for such structures involve the incorporation of expansion joints or post-cast strips [1]. However, expansion joints disrupt the continuity of the building structure and introduce water seepage issues that are difficult to resolve, leading to their gradual phase-out [2]. The implementation of post-cast strips necessitates separate formwork support and chipping operations, adding complexity to the construction process. Moreover, post-cast strips must be cast after the main structure has been cured, thereby extending the construction duration. Additionally, engineering experience has shown that the interface between new and old concrete at post-cast strips is prone to leakage and other quality issues [1]. To address these concerns, You et al. proposed an innovative seamless construction method for super-length concrete structures using the united expanding agent (UEA)–expansive strengthening band (ESB) [1,3]. Following its introduction, this method has garnered extensive attention from scholars and practitioners worldwide, prompting a plethora of studies on its efficacy.
Yang et al. [4] employed the UEA–ESB method in the design and construction of a 95.8 m long beam–slab foundation for the Xinfei Sales Building, where the structure remained in excellent condition years after commissioning. Zhang et al. [5] employed a construction method in which post-cast strips were replaced with UEA–ESB during the Bank of China Jining Branch Head Office project. This substitution resulted in an expedited construction schedule and cost savings, and it upheld high-quality engineering standards throughout the execution process. Jin [6] elucidated the design philosophy and specific practices of the UEA–ESB method and pointed out its sensitivity to climate conditions, highlighting that while expansion could be maintained in humid areas, issues might arise in dry regions. Therefore, he recommended moisture retention curing and suggested cautious adoption in dry areas. Li et al. [7] stated that the UEA–ESB method can achieve the goal of self-sealing structures and control the occurrence of cracks in mass concrete structures, and they proposed relevant design and construction measures. Dong and Lin [8] designed and implemented post-cast UEA–ESB in a super-length and ultra-wide foundation structure with plan dimensions of 97.8 × 76.1 m. This resolved the problems of dry and cold shrinkage effects in super-length and ultra-wide slabs and achieved self-sealing for both the large foundation and roof structures.
Despite the widespread use of UEA in engineering practice, existing research indicates that it possesses certain limitations. For instance, the incorporation of UEA may actually increase the risk of concrete contraction cracking in projects where wet curing is challenging [9], and the products of UEA are unstable, decomposing at around 80 °C. To address these issues, Liu et al. [10] proposed the use of magnesia expansive agent (MEA) as a substitute for UEA. Studies have demonstrated that under different curing conditions, MEA effectively suppressed the drying shrinkage of concrete. Studies by Mo and coauthors investigated MgO and MgO-based expansive agents in cementitious materials for shrinkage mitigation and performance enhancement. Key findings include the following: MEA expansion properties were strongly influenced by calcination conditions, with microstructure playing a critical role [11]; quaternary blended cements with reactive MgO, slag, and fly ash effectively reduced autogenous shrinkage and exhibited improved late-age strengths [12]; homogeneous distribution of MgO additives with varying reactivities led to faster expansion and shrinkage compensation in expansive cements [13]; curing temperature significantly impacted MgO expansion behavior [14]; MgO-based additives compensated for autogenous and thermal shrinkage under non-wet conditions [15]; biochar combined with MEA synergistically mitigated shrinkage and induced expansion, while enhancing late-age compressive strength [16]. Jiao et al. [17] conducted systematic research on the impact of MEA on the microstructure, mechanical properties, contraction performance, and durability of concrete. Their findings revealed that while MEA reduced the early strength and chloride ion permeability resistance of concrete, it improved its contraction characteristics and enhanced later-stage strength. Li et al. [18,19] reviewed the influence of various expansive agents, including MEA, on the performance of compensatory contraction concrete. The MEA–ESB methodology innovates by employing MEA-compensated shrinkage concrete and introducing ESBs to supplant traditional post-tensioning or construction joints, thereby enabling near-seamless continuity. The method offers several advancements over conventional practices: it simplifies construction through reduced jointing requirements, accelerating formwork cycling and overall project timelines. Moreover, it markedly improves waterproofing efficacy by limiting potential weak points, ensuring enhanced durability and resilience against water infiltration, especially vital in subterranean infrastructures. The reduction in joint treatments significantly decreases construction time and costs, while the promotion of a monolithic structure bolsters structural integrity and mitigates crack formation attributed to environmental factors. Furthermore, this technique’s adaptability to intricate designs fosters greater architectural creativity without compromising structural dependability, positioning the MEA–ESB method as a highly advantageous strategy within contemporary construction practices.
In the field of thermal crack control in the seamless construction of super-long concrete structures, Klemczak, Zmij [20], and Jędrzejewskaa et al. [21] delved into the reliability and application of existing guidelines for designing and evaluating early-age cracking in concrete structures, focusing particularly on tank walls, bridge abutments, and wall-on-slab structures. These studies compared international guidelines (American [22], European [23,24], and Japanese [25]) and practical standards (like EN 1991-4 [26] and CIRIA C766 [27]), identifying discrepancies between predicted and actual crack widths. The need for refined predictive models was underscored, with the literature [21] proposing adjustments to the calculation methods to better anticipate cracking behavior under restrained hardening conditions. Smolana et al. [28] and Klemczak et al. [29] emphasized the importance of realistic estimations of early-age thermal loads and induced stresses in mass foundation slabs and reinforced concrete walls. They reviewed analytical and numerical methods for assessing cracking risks, highlighting the significance of considering the exothermic reactions of cement hydration and subsequent temperature variations. Notably, the literature [28] presented a case study involving real-world application of these methods alongside on-site measurements, underlining the practical implications and limitations of each approach. Klemczak, Knoppik-Wróbel [30], and Li et al. [31] presented case studies, the former detailing the construction of a mass concrete tunnel in Shantou City, China, and the latter discussing the behavior of tank walls and bridge abutments. Both highlighted the importance of understanding thermal-shrinkage mechanisms and showcased successful mitigation techniques, such as gradient concrete and plastic anti-crack grids. The superiority of gradient concrete in controlling cracking while reducing temperatures was emphasized, suggesting its broader implementation. Kanavaris et al. [32] and Azenha et al. [33] contributed to the understanding of thermal and shrinkage stress development by offering comprehensive analytical models and expert recommendations. The literature [32], as part of RILEM TC 254-CMS’s work, improved the concept of ‘massivity’ to predict thermal cracking potential, incorporating binder type, content, and casting conditions. Meanwhile, the literature [33] provided recommendations from RILEM TC 287-CCS focusing on the simulation of thermo-chemo-mechanical behavior in massive concrete structures, covering aspects from material properties to numerical modeling peculiarities.
In summary, while the ESB technology has existed for over three decades, the adoption of MEA as a substitute for UEA is a relatively recent development, with merely a decade of exploration. Past research predominantly focused on material-level investigations, with limited documentation of real-world implementations. This study broke new ground by integrating on-site MEA–ESB test data with numerical simulations, affirming the precision of our Finite Element Model constructed in ABAQUS. By introducing advanced parametric analysis and devising calculation formulas for predicting cracking in super-long raft structures with ESBs, our work transcended conventional material-centric studies. The significance of our approach lies in three advancements. Firstly, our simulation-driven exploration of MEA–ESB dynamics, validated against empirical evidence, illuminated the underlying mechanics governing these systems. It bridged the gap between theoretical constructs and practical engineering manifestations, reinforcing the foundation for future design and construction practices. Secondly, the creation of a parametric analysis framework offered a quantitative lens to decipher the impacts of critical variables, including the ESB-to-raft-width ratio and expansion rates of MEA concrete, empowering engineers with a toolset for fine-tuning and enhancing the MEA methodology. Lastly, the introduction of formulaic predictions for early-stage cracking, informed by the framework of the ACI Committee 207 and findings from parametric analysis, streamlined the comprehension of intricate parameter interactions. It empowered proactive decision-making during the design stage by enabling the anticipation of structural crack, thereby mitigating construction hazards and safeguarding overall project integrity. Our findings thus chart a progressive path for the broader adoption and optimization of the MEA–ESB strategy in large-scale engineering projects.

2. Materials and Methods

2.1. Model Establishment

A finite element model (FEM) of the raft structure was constructed using the general-purpose finite element software ABAQUS 2022. The implicit analysis was run in the simulations. User subroutines were developed in Fortran language for secondary development. The heat generation in concrete was realized through the HETVAL user subroutine interface. Concrete shrinkage and expansion of the strengthening bands were achieved using the UEXPAN user subroutine interface. Lastly, the change in concrete’s elastic modulus over time was implemented via the UMAT user subroutine.

2.1.1. Material Constitutive Relations

The standard region of the raft was constructed with C35 concrete, and the ESB employed C40 concrete; detailed mix proportions are outlined in Reference [34]. The testing procedures for assessing the physical and mechanical properties of the concrete, not detailed in [34], adhered to the requirements outlined in the ‘Standard for test methods of concrete physical and mechanical properties’ (GB/T50081-2019) [35], ensuring a rigorous evaluation of the materials’ performance. According to the ‘Test code for hydraulic concrete’ SL/T 352-2020 [36], the thermodynamic properties of both C35 and C40 concrete were calculated separately, as presented in Table 1. Additionally, the 28-day cube compressive strengths of the concrete are also listed in Table 1.
The calculation of contraction for concrete without MEA adopted the contraction model stipulated by CEB-FIP (1990) [37]. The variation in the elastic modulus of C35 and C40 concrete with age was computed according to the specifications of ‘Standard for Construction of Mass Concrete’ [38]. The heat source function for concrete was determined using the function model specified in the ‘Test code for hydraulic concrete’ SL/T 352-2020 [36], with the relevant thermodynamic parameters calculated based on the concrete mix proportion.
Experiments were conducted on the concrete with MEA to obtain their strain–time curves, as shown in Figure 1. As depicted in the figure, in the absence of expansion agents, noticeable shrinkage of the concrete commenced on the second day post-pouring, with shrinkage strain escalating progressively over time, culminating in a maximum value of 411 με at 56 days. Conversely, concrete admixed with CaO as an expansion agent initially exhibited expansion, peaking at a maximum expansion strain of 83 με on the eighth day, after which shrinkage set in as the age increased, leading to a final maximum shrinkage strain of 120 με at 56 days. Compared with CaO-injected concrete, concrete incorporating MgO as the expansion agent sustained expansion until the 17th day, achieving a maximum expansion strain of 374 με, which was 4.5 times that of the CaO counterpart. Thereafter, the concrete underwent marginal contraction; nonetheless, at 56 days, it still registered an expansion strain of 298 με, indicative of a sustained expansion effect.

2.1.2. Element Type

The raft and the foundation were simulated using the eight-node thermally coupled hexahedral element C3D8T. A sensitivity analysis was performed on the mesh to establish an appropriate grid size of 1000 mm. The raft was divided into 10 layers in the thickness direction, resulting in a total of 44,427 elements. Meanwhile, the foundation contained 85,791 elements. The established FEM is illustrated in Figure 2.

2.1.3. Boundary Conditions

The bottom of the foundation was subjected to consolidation boundary conditions. Equally important are the thermal boundary conditions for the structure. An equivalent coefficient of heat dissipation was introduced, treating the insulation layer in contact with air as a third-type boundary condition. The heat dissipation coefficient was calculated in accordance with the formula specified in the ‘Test code for hydraulic concrete’ SL/T 352-2020 [36], based on the thickness of the insulation layer. The ambient air temperature was taken as the average value of 25 °C from on-site measurements, and the mold temperature of the concrete was also determined based on on-site measurements. In the initial step of the analysis, the raft structure and foundation were subjected to an initial temperature by defining the temperature field variables. Subsequently, the temperatures of the raft and foundation were computed using the HETVAL user subroutine. To facilitate comparison with experimental results, a thermal analysis step was used with a fixed time step of 1 h.

2.2. Numerical Simulation Results and Validation

This section aims to rigorously validate the predictive capability of the established FEM for the mechanical and thermodynamic performance of super-length raft structures with ESBs through systematic comparative analyses. Specifically, this section presents in detail the outcomes from finite element analysis (FEA), including the principle of temperature distribution, principle of strain distribution, temperature–time characteristics, and strain–time characteristics, juxtaposing them directly with data obtained from on-site tests [34]. The validation process encompassed not only quantitative comparisons of results, such as the congruence between modeled temperatures and strains with actual measurements, but also qualitative assessments of characteristic features to ensure that the simulation accurately replicates physical phenomena observed in the on-site tests. Furthermore, any notable discrepancies were meticulously examined to identify their potential causes and evaluate their implications on the overall efficacy of the model. Through this comprehensive validation exercise, the objective was to ascertain the accuracy and validity of the constructed FEM, thereby laying a robust foundation for subsequent parametric studies and practical engineering applications.
While the fundamental parameters of the model were rigorously calculated based on material properties, we acknowledged that any theoretical model inevitably involves a degree of approximation. Consequently, a parameter sensitivity analysis was conducted to investigate the impacts of minor variations in key parameters, such as the maximum adiabatic temperature rise of concrete and the reaction rate coefficient, on the model outputs. This process aided in understanding the model’s responsiveness to input variations, not by directly ‘tuning’ parameters to fit on-site test data, but rather through scientific analysis to delineate the optimal range of parameter estimates. In light of these analyses, when systematic discrepancies emerged between model predictions and test findings, rigorous scientific methodologies were employed to scrutinize the validity of model assumptions, boundary conditions, and computational methodologies. For instance, enhancements to numerical simulation parameters, like optimizing grid density and time steps, were pursued to minimize numerical errors rather than blindly manipulating parameters to achieve data concordance.

2.2.1. Principle of Temperature Distribution

According to the literature [34], during the thermal accumulation phase, the temperature of the raft continuously rose, reaching its peak at 48 h post-pouring. The principle of temperature distribution across the surface, center, and bottom of the raft, as compared between FEA and experimental data, are depicted in Figure 3. The figure also presents the temperature cloud maps obtained through numerical simulation. It is apparent from the figure that the principle of surface temperature distribution simulated by the finite element method deviated most significantly from the experimental results, with a maximum discrepancy of 11.2 °C. This is attributable to the fact that surface temperatures are heavily influenced by environmental factors such as ambient temperature, wind speed, sunlight, and curing conditions—influences that finite element methods cannot accurately simulate. Nevertheless, the finite element method still managed to reflect the trend of temperature distribution across the surface of the raft. The simulated temperature distributions at the center and bottom of the raft aligned well with the experimental findings. The finite element approach accurately captured the localized temperature peaks of the central temperature within the ESB and accurately reflected the high-temperature plateaus observed at the bottom of the raft in areas with dense pits or wells.
During the thermal balance phase, the temperature of the raft tended to stabilize. As illustrated in Figure 4, the FEA closely mirrored the observed trends in temperature distribution across the raft’s surface, center, and bottom after 28 days of curing. The FEA accurately captured the characteristic pattern of lower temperatures at both ends and a peak in the center, which aligns well with the empirical data obtained from the experiments.

2.2.2. Principle of Strain Distribution

Upon completion of 48 h post-casting, the distribution principle of strain across the surface, center, and bottom of the raft, as depicted in Figure 5, were analyzed through FEA. The FEA results accurately captured the characteristic of compressive strains being minimal at the ends and maximal at the center. Moreover, the FEA was able to reflect the unique distribution principle of increased strains on the surface within the lowering plate region. The results obtained from the FEA demonstrated a commendable congruence with the data collected from the experiments.
After casting for a duration of 28 days, the FEA results concerning the strain distribution principle across the surface, center, and bottom of the raft were compared with experimental data, as illustrated in Figure 6. The FEA demonstrated a high level of accuracy in simulating the strain distribution characteristics, including the special trend where the surface strain increases in the central region of the ESB. The congruence between the finite element predictions and the experimental findings was satisfactory.

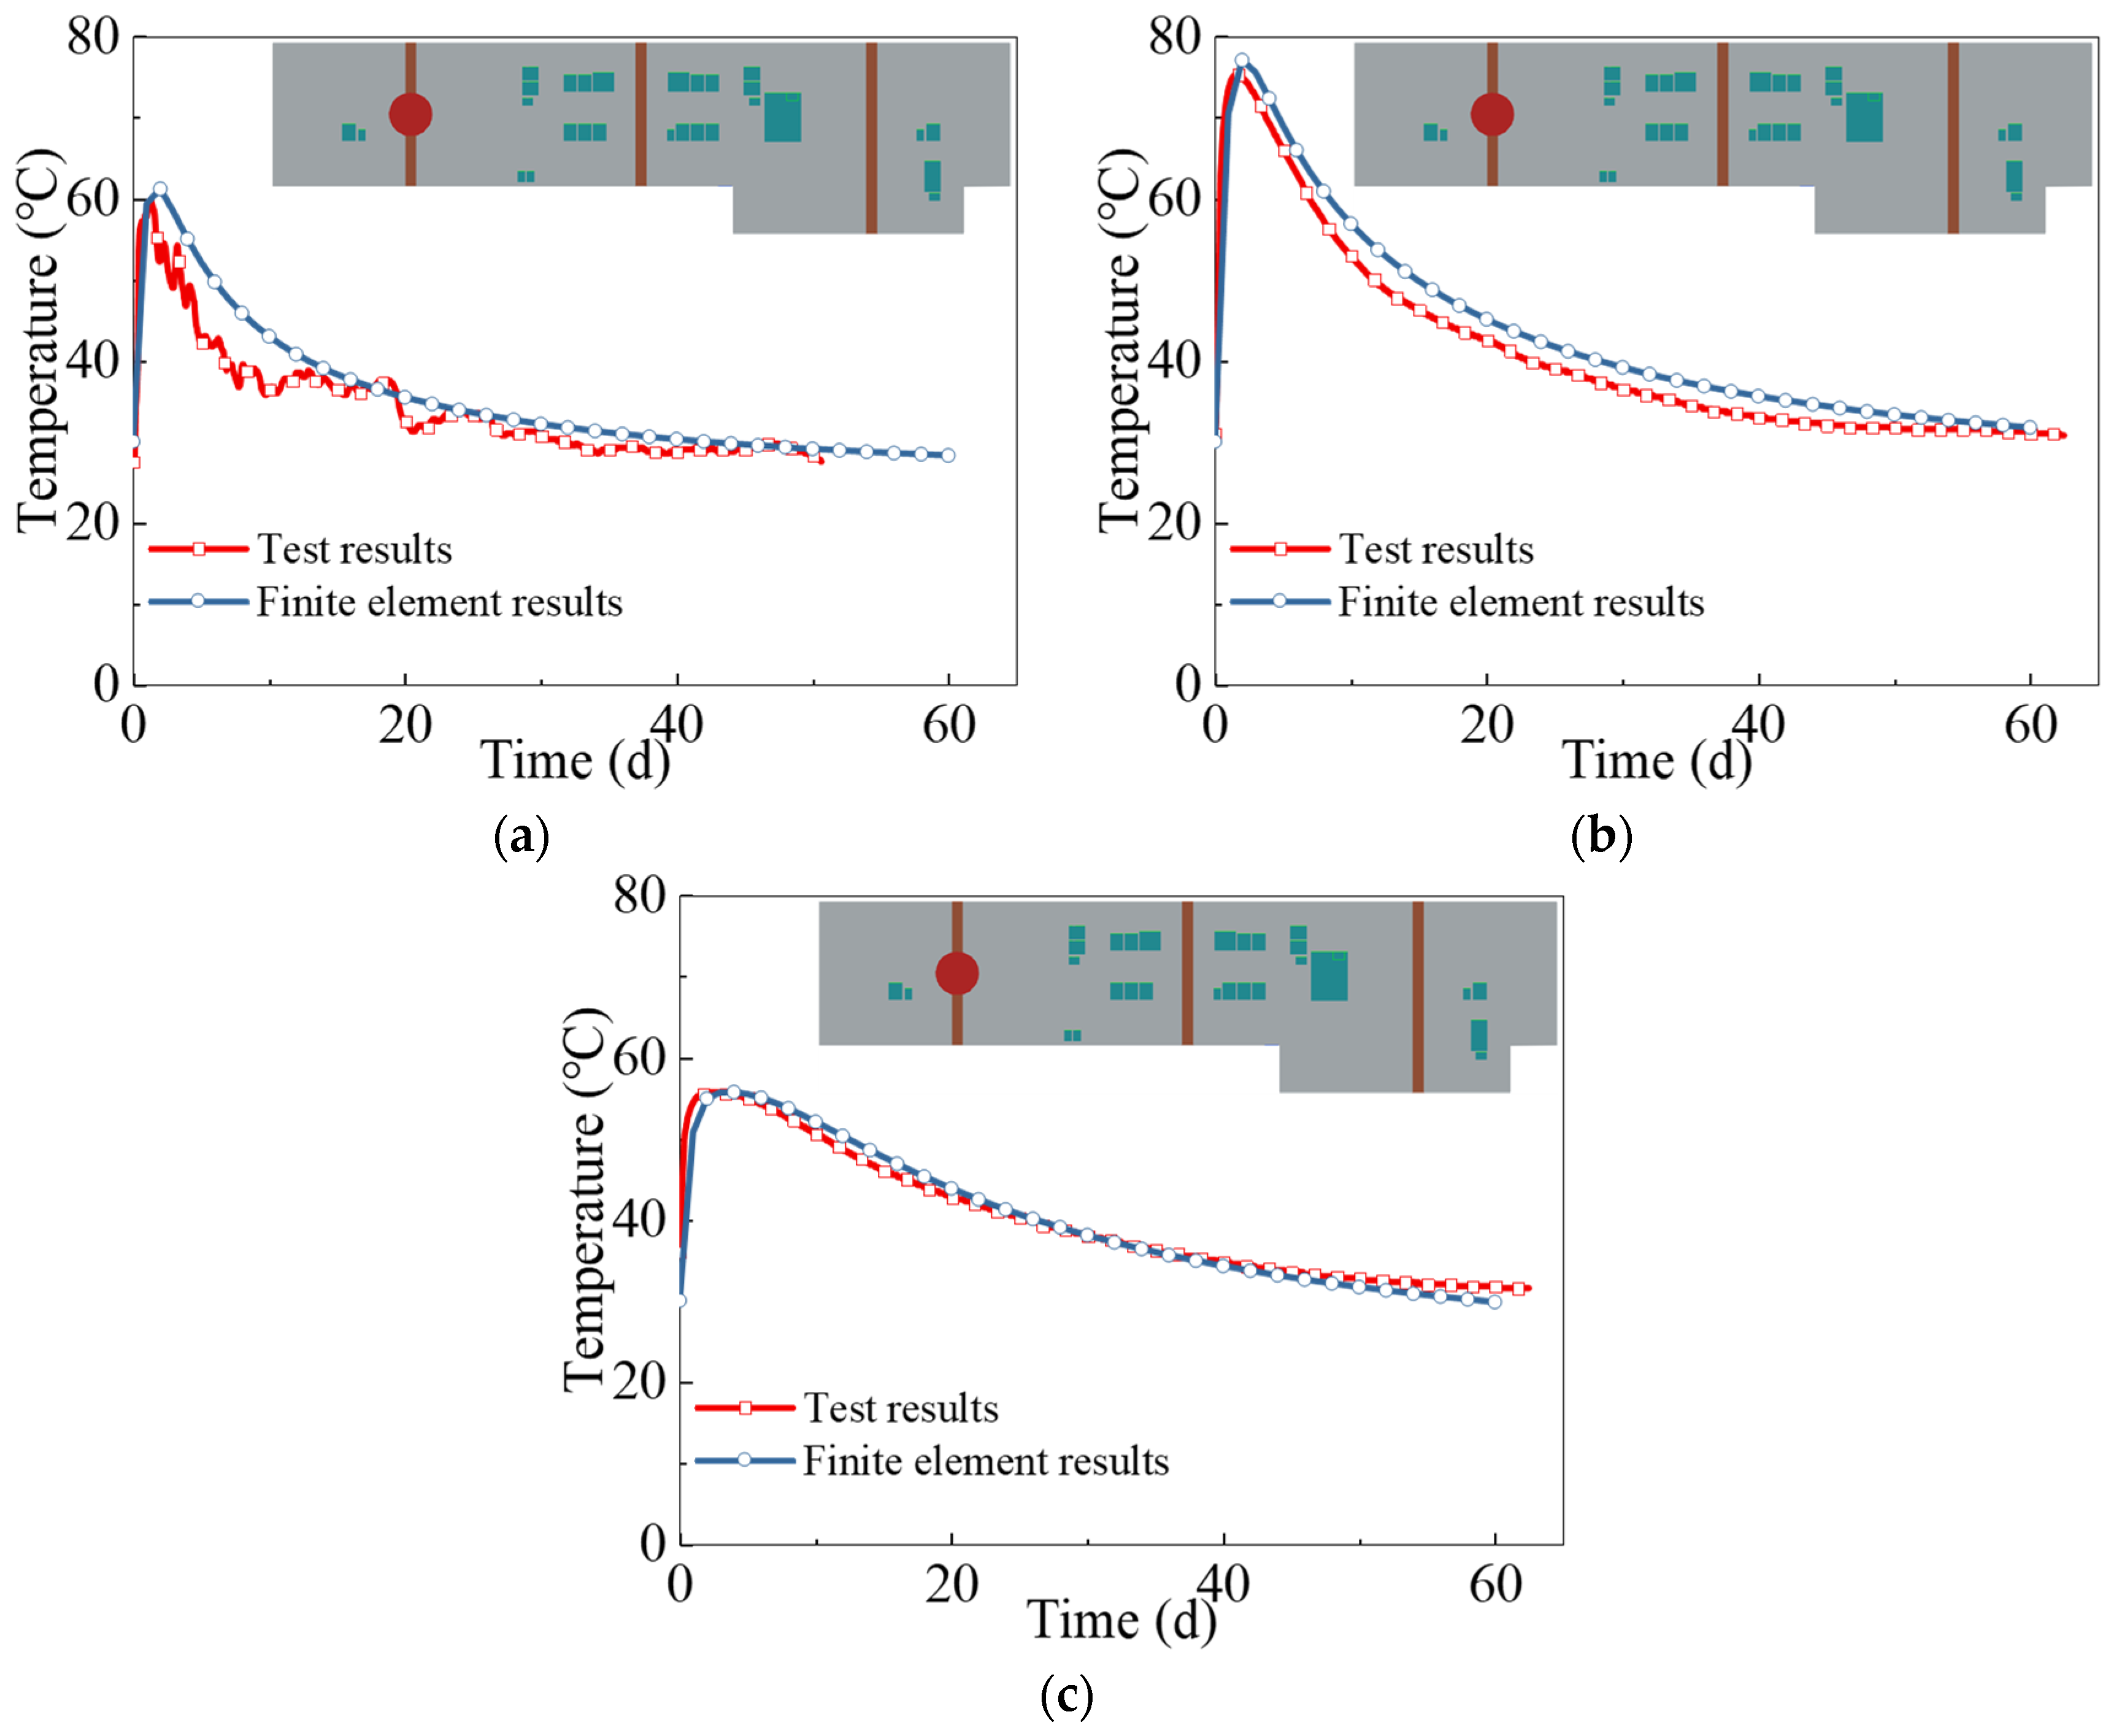
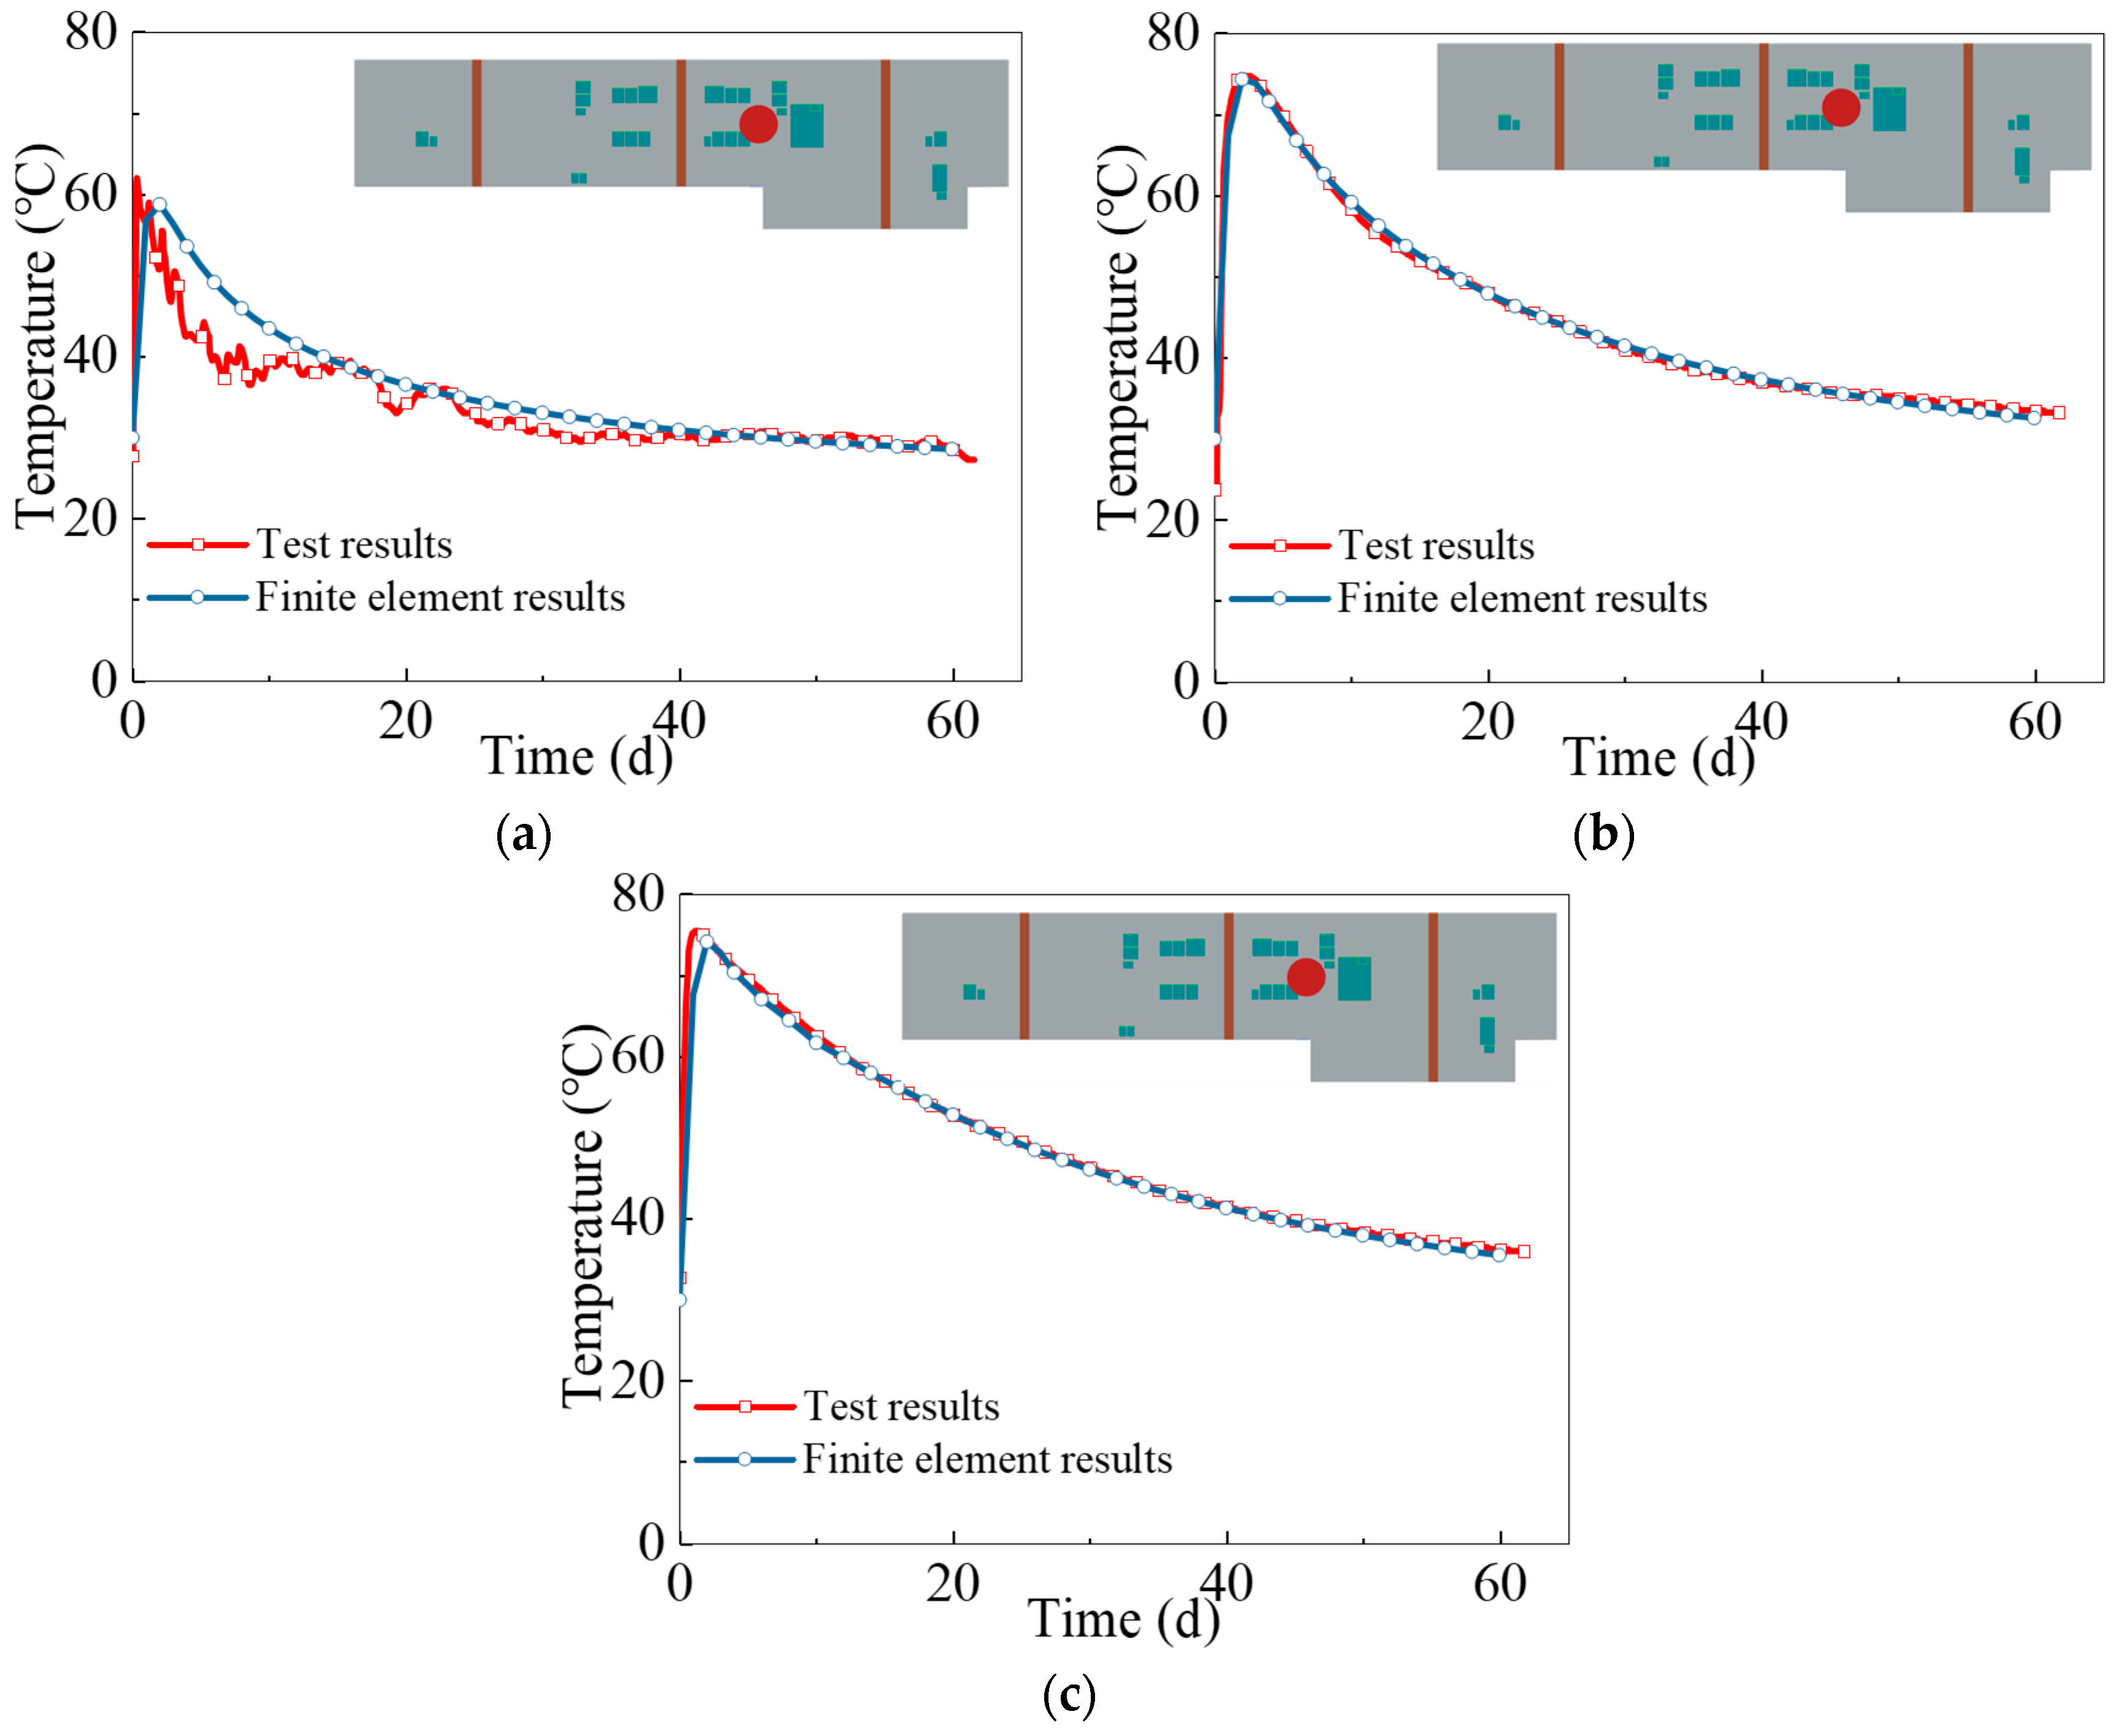
2.2.3. Temperature–Time Characteristic

The temperature–time curves of the ESB 1 are presented in Figure 7, comparing the FEA results with those from the experimental tests. The correlation between the FEA outcomes and the data derived from experimental trials exhibits a noteworthy degree of alignment. The maximum temperatures predicted by the FEA at the surface, center, and bottom of the ESB were 60.8 °C, 76.6 °C, and 55.8 °C, respectively, showing deviations of 0.7%, 0.8%, and 0% when compared with the experimental values of 61.2 °C, 77.2 °C, and 55.8 °C. Furthermore, the FEA accurately simulated the temporal evolution of temperatures within the ESB.
As shown in Figure 8, the FEA and experimental data exhibited a commendable degree of concurrence regarding the temperature–time curves for standard region 2. The FEA predicted maximum surface, center, and bottom temperatures of 58.8 °C, 74.4 °C, and 74.2 °C, respectively. These values reflect deviations of 5.2%, 0.5%, and 1.7% from the corresponding experimental measurements of 62 °C, 74.8 °C, and 75.5 °C. Consequently, the FEA effectively captured the temporal progression of temperatures within the standard region, underscoring its reliability in such simulations.

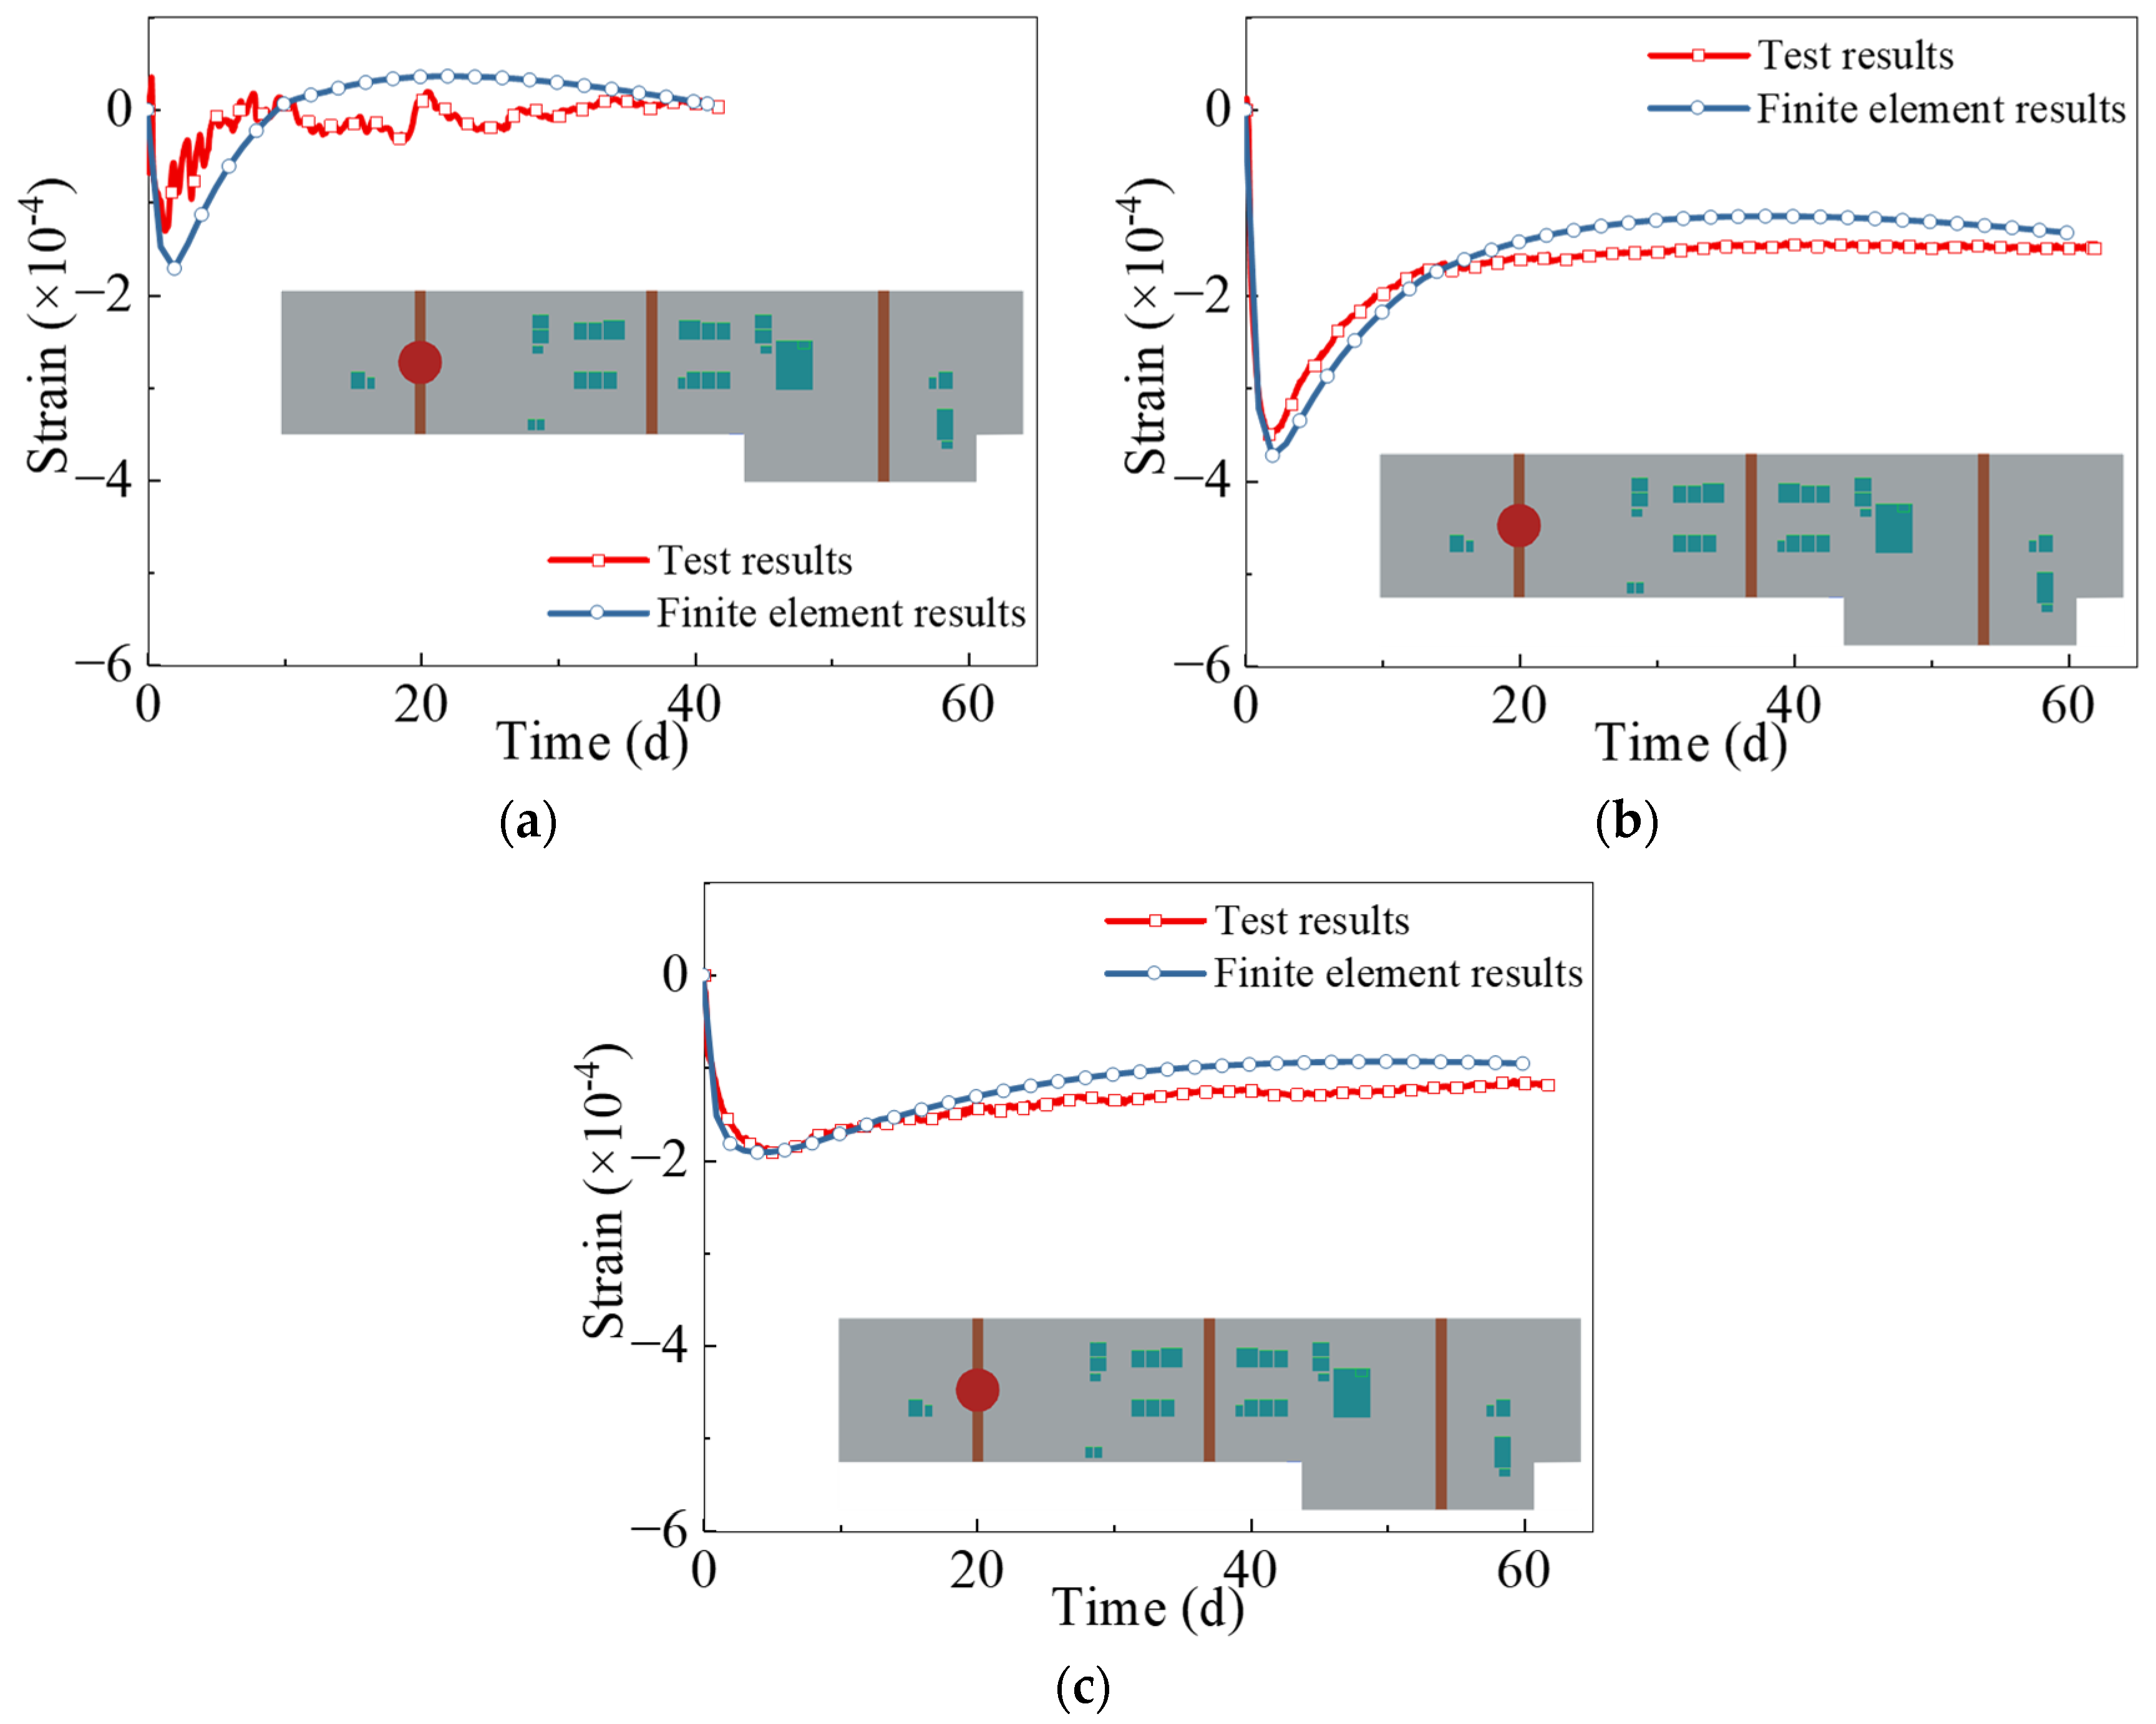
2.2.4. Strain–Time Characteristic

The strain–time curves for the ESB 1 are illustrated in Figure 9, where the FEA demonstrates a satisfactory alignment with the experimental data. The FEA simulations determined the maximum compressive strains at the surface, center, and bottom of the band to be −171.7 με, −373.2 με, and −191.9 με, respectively. These values exhibit discrepancies of 23.5%, 6.1%, and 0% when compared with the experimental findings of −131.4 με, −351.6 με, and −191.9 με. This indicates that the FEA was capable of accurately replicating the temporal evolution of strains within the ESB.
The strain–time curves for standard region 2, as depicted in Figure 10, exhibit a commendable correlation between the FEA and the experimental data. The FEA simulations yielded maximum compressive strains of −72.6 με at the surface, −334.6 με at the center, and −168.4 με at the bottom. These values reflect discrepancies of 10.3%, 9.4%, and 7.5%, respectively, when compared with the experimental results of −80.9 με, −306.0 με, and −182.2 με. Consequently, the FEA was deemed to accurately simulate the temporal development of strains within the standard region.

3. Parameter Analysis

3.1. Parameter Analysis Model

According to ACI Committee 207 [22], cracking in raft structures initiates when the tensile stress σt(t) within the raft equals the tensile strength ft(t) of the concrete. The criterion they propose for predicting early-age cracking in the raft structures is as follows:
σt(t) ≥ ft(t).
The ACI Committee 207 [22] recommends applying the aforementioned criterion at 7 days after pouring and suggests that the maximum tensile stress σt in the raft concrete can be calculated using the following formula:
σ(t) = KRKfαTΔTEcm,eff(t).
The meanings and calculation methods of the parameters in this equation will be elaborated upon in Section 4. This formula pertains to ordinary super-length concrete structures without considering the influence of ESBs. The ESBs impose a pre-compressive strain on the raft concrete, which in turn reduces the tensile stress experienced by the concrete, as illustrated in Figure 11. Consequently, taking the impact of ESBs into account, the adjusted formula for calculating the maximum tensile stress σ(t) in the raft concrete becomes:
σ(t) = (KRKfαTΔTεESB) Ecm,eff(t).
The paramount design parameters for ESBs are the ESB width and the MEA concrete expansion rate [1,3]. To facilitate dimensionless analysis, the ESB width was normalized, and the ESB-to-raft-width ratio and the MEA concrete expansion rate were adopted as the analytical parameters. An FEM of the basic load-bearing elements was established using ABAQUS, with relevant parameter values consistent with those detailed in Section 2.1, as shown in Figure 12. The dimensions of the standard region of the raft structure were specified as 20 × 20 × 2 m, with the ESB width set at 2 m and the MEA concrete expansion rate at 0.04%.

3.2. Parameter Analysis Results

3.2.1. The ESB-to-Raft-Width Ratio r

The range for the ESB-to-raft-width ratio was selected to be between 0 and 0.2. When the ESB-to-raft-width ratio was 0, it indicated that no ESB had been implemented. The strain–time curves for the surface of the raft at varying ESB-to-raft-width ratios are depicted in Figure 13a. It is observed that as the ESB-to-raft-width ratio increased, the surface strain of the raft became less pronounced at the same time point. Figure 13b illustrates that the 7-day strain decreased linearly from −307 με to −411 με as the ESB-to-raft-width ratio rose from 0 to 0.2, representing a 34.1% decrease. A broader ESB width resulted in greater pre-compressive stress exerted upon the raft, thereby effectively reducing the surface strain [39].

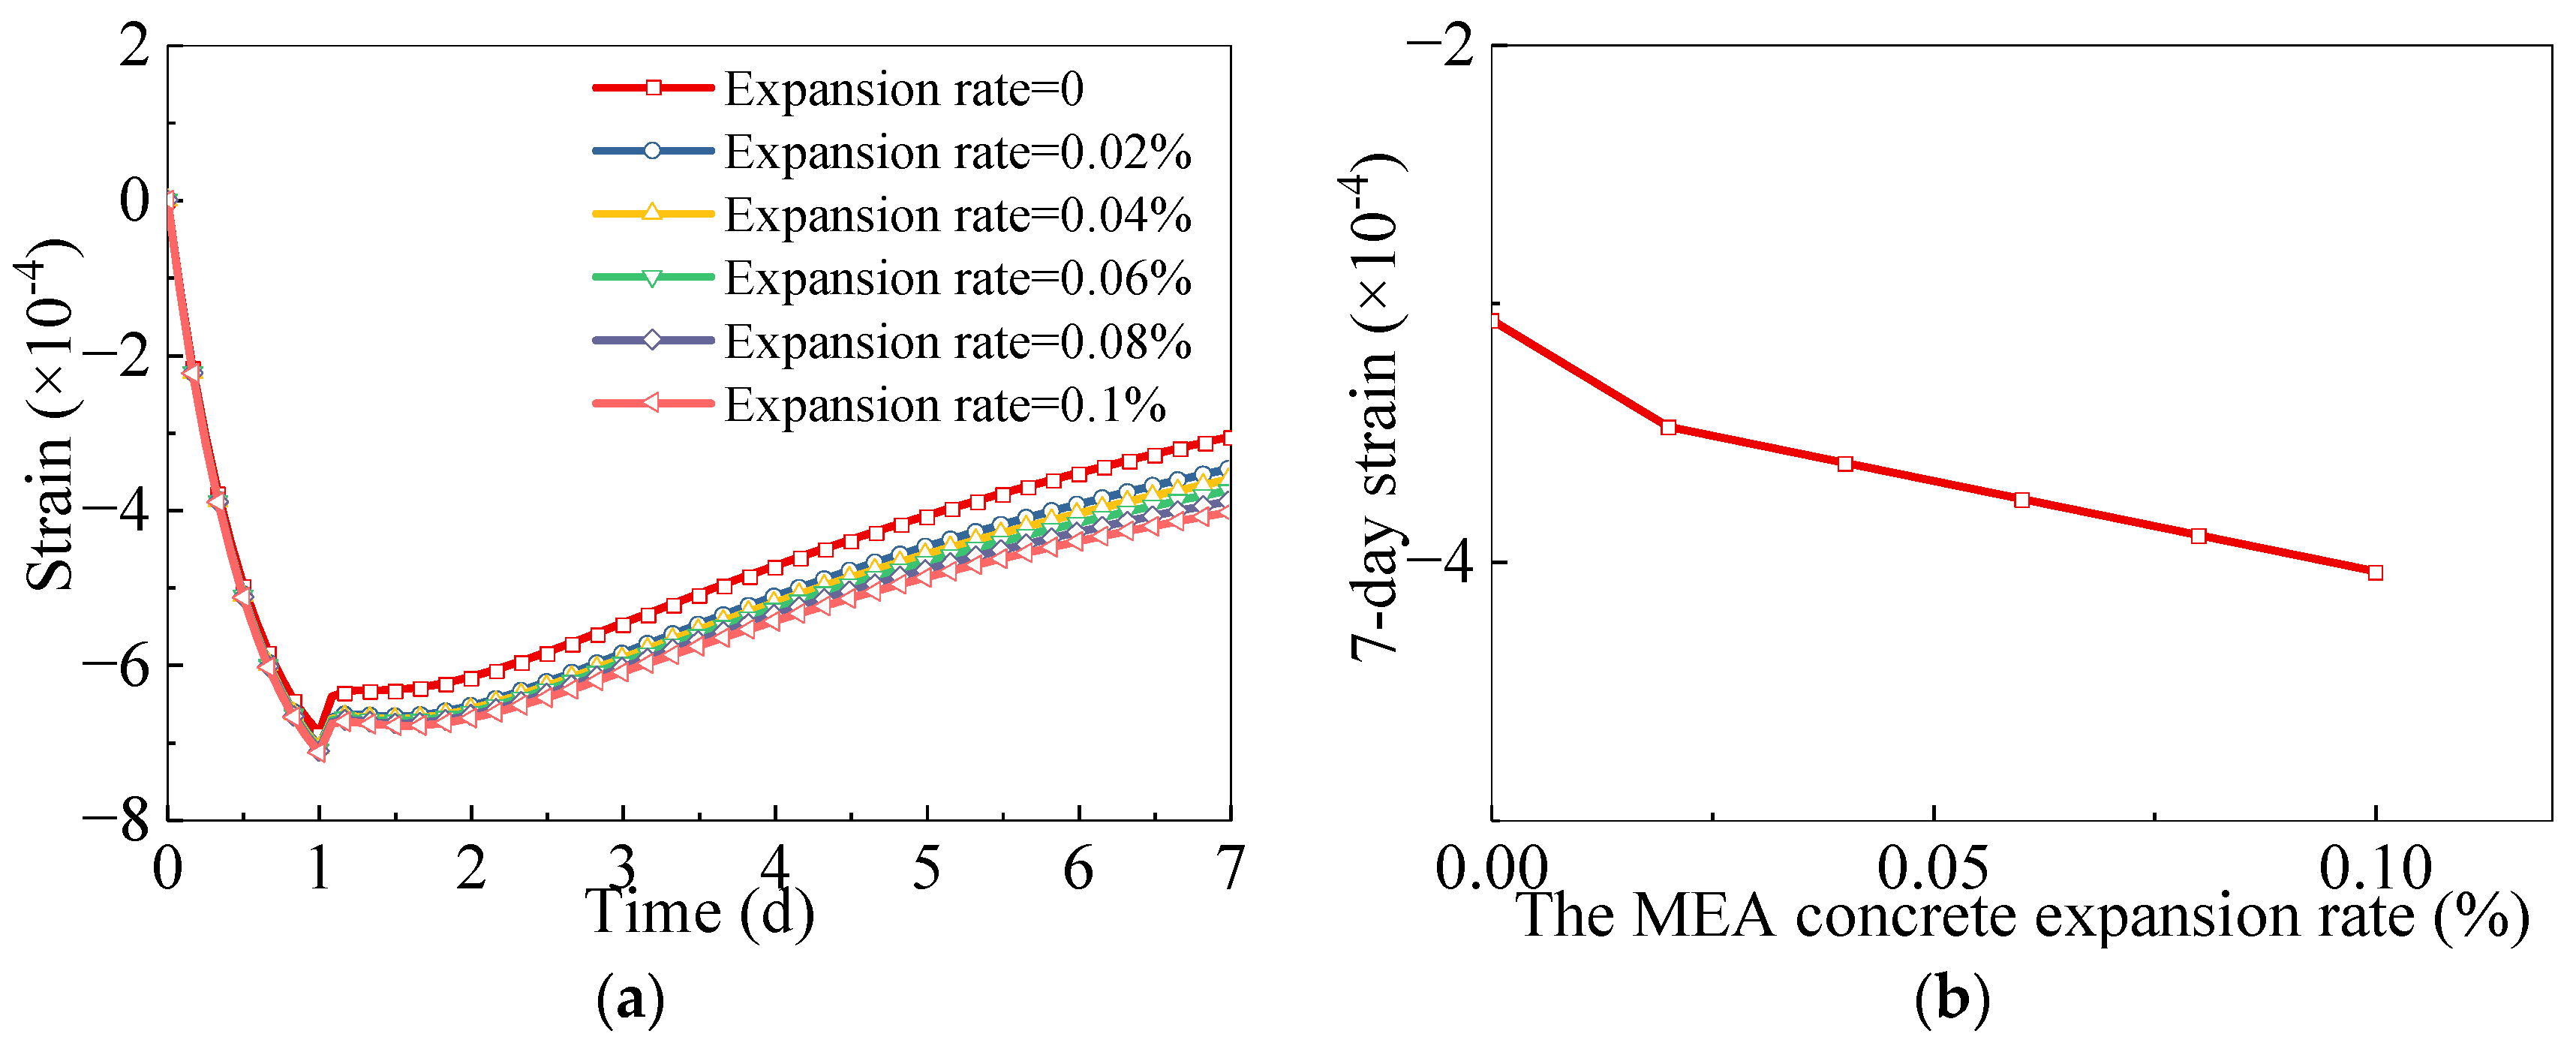
3.2.2. The MEA Concrete Expansion Rate e

Pursuant to the provisions stipulated in the current national standard ‘Code for Concrete Admixture Application’ [40], the value for limiting the expansion rate of ESB was generally categorized at a level of 0.005%, with a minimum limit of 0.015%. Concrete with an expansion rate exceeding 0.06% is classified as self-stress concrete [40]. In the present study, the parameter range for the MEA concrete expansion rate was set between 0% and 0.1%, with each level being 0.02%. The conditions where the MEA concrete expansion rate was 0 represented scenarios without the installation of ESB. The strain–time curves on the surface of the raft at varying MEA concrete expansion rates are presented in Figure 14a, indicating that as the MEA concrete expansion rate increased, the surface strain of the raft decreased at the same time point. Figure 14b reveals that when the MEA concrete expansion rate increased from 0% to 0.1%, the 7-day strain decreased linearly from −307 με to −404 με, a reduction of 31.7%.

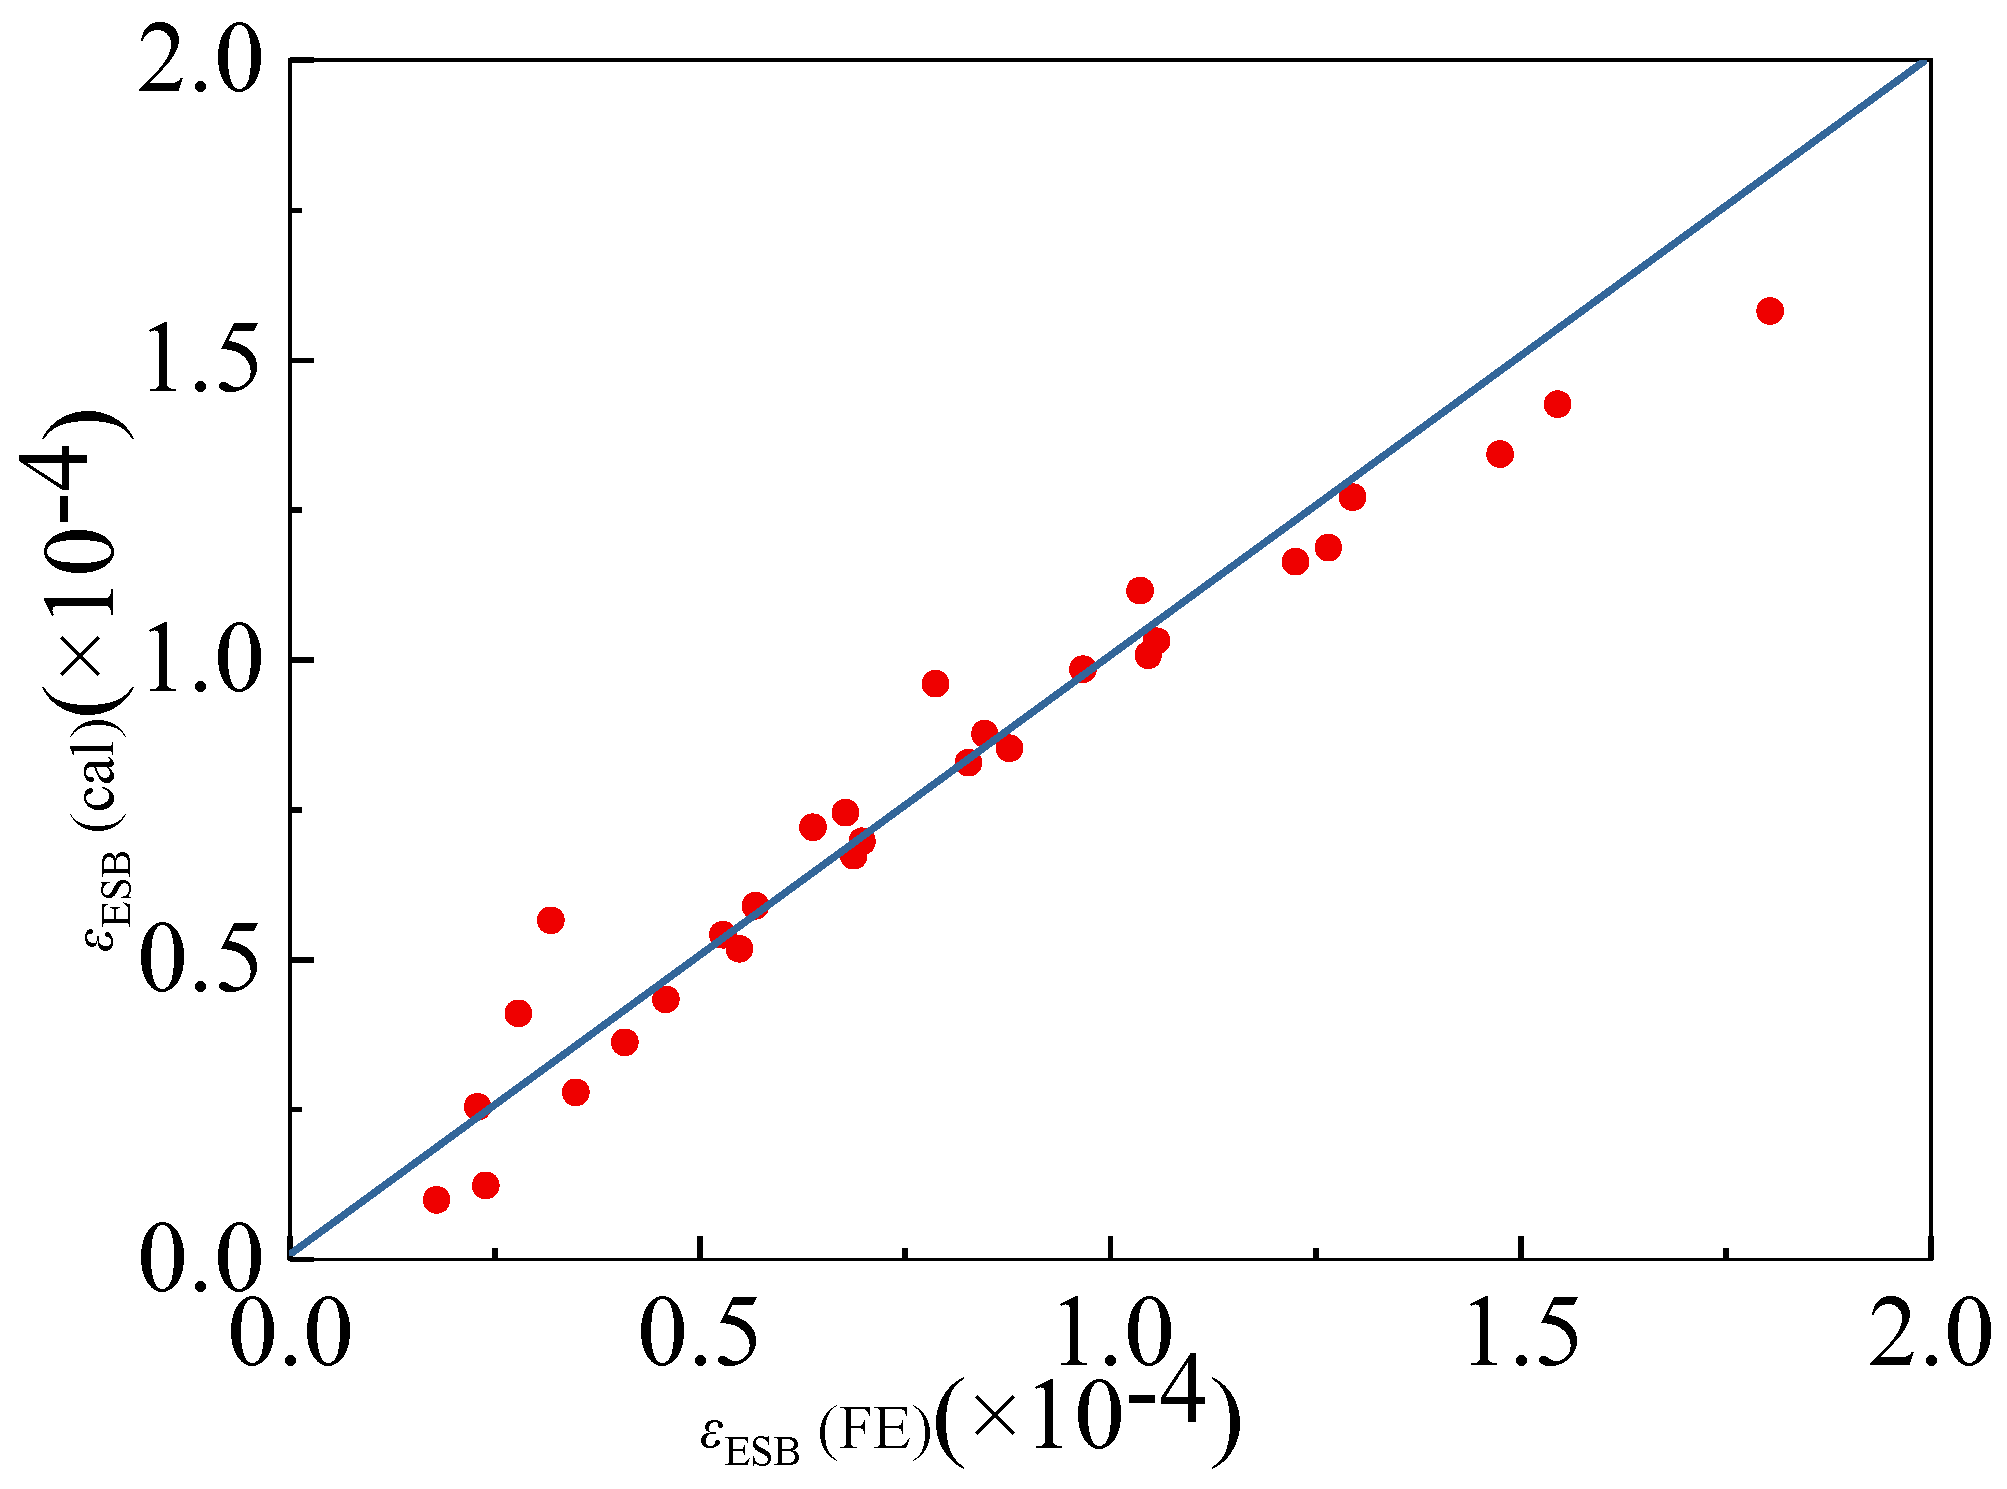
4. Computational Formula

Section 3.2 presented selected outcomes from the parametric analysis, which encompassed numerical simulations of a total of 31 raft structures. Numerical simulation results under varying parameter conditions are presented in Table 2.
Compared with the raft structures without ESBs, those with ESBs exhibited reduced 7-day strain, as the ESB imposed a pre-compressive strain on the raft structure. The differential 7-day strain between these two conditions is denoted by εESB. The response surface methodology (RSM) is a statistical technique capable of establishing an implicit functional relationship between research factors and response values through a judiciously selected finite number of simulations [41]. In this study, RSM was employed to determine the correlation between the 7-day strain of the raft and the parametric variables.
The calculation formula for the εESB, as obtained using the RSM, is presented as follows:
εESB = −4 × 10⁻⁵ + 6 × 10⁻⁴r + 0.078e
where εESB is the pre-compressive strain imposed on the raft concrete by the ESB; r is the ESB-to-raft-width ratio; and e is the MEA concrete expansion rate.
The εESB of the raft calculated using Equation (4) was compared with the results from the FEA, as depicted in Figure 15. Inspection of the data revealed a high level of concordance between the strains computed using the specified formula and those determined through FEA, as evidenced by an adjusted R2 value of 0.946, indicating a strong predictive model fit.
By substituting Equation (4) into Equation (3), the resultant formula for calculating the maximum tensile stress in raft structures with ESBs was obtained:
σ(t) = (KRKfαTΔT − 6 × 10⁻⁴r − 0.078e + 4 × 10⁻⁵) Ecm,eff(t).
where σ(t) is the maximum tensile stress in the raft concrete with ESBs 7 days after pouring.; KR is the coefficient pertaining to the vertical distribution of restraint intensity along the element’s height; Kf is the factor quantifying the extent of restraint implementation; αT is the thermal expansion factor, µε/°C; ΔT is the inner–surface temperature difference of the raft, °C; and Ecm,eff(t) is the enduring Young’s modulus associated with concrete 7 days after casting.
For raft structures, the ratio of length L to height H is generally greater than 2.5. According to ACI Committee 207 [22], KR = [(L/H − 2)/(L/H + 1)]h/H, where h is the vertical distance from the plane of the restraining element.
The factor Kf is calculated using the following formula:
Kf = 1/(1 + AcEc/ArEr)
where Ac is the sectional area under consideration for the concrete component, m2; Ec is the Young’s modulus of the concrete, MPa; Ar is the restraining element’s cross-sectional area that imposes confinement on the subject component, m2; and Er is the Young’s modulus of the restraining element, MPa.
The inner–surface temperature difference ΔT is computed using the one-dimensional finite difference method, as prescribed in reference [38], and is therefore not elaborated upon further in this paper.
The enduring Young’s modulus Ecm,eff(t) associated with concrete 7 days after casting is calculated using the following formula:
Ecm,eff(t) = βE0 (1 − e−0.63)
where β is the correction coefficient for fly ash and slag content, according to the table in reference [38] and E0 is the elastic modulus of concrete at 28 days under standard curing conditions.
Following these calculations, the maximum tensile stress in the raft structures with ESBs was obtained, which was then compared against the tensile strength of the concrete. Employing the cracking criterion outlined in Equation (1), a determination was made regarding the potential for cracking in the raft structures. This process provided a valuable reference for the design and construction of super-length raft structures with ESBs.
This study, grounded in the specifications of ACI Committee 207 [22], established crack control criteria for super-length raft structures with ESBs and proposed a formula to calculate the maximum tensile stress 7 days after concrete pouring. Nonetheless, the methodology put forth herein is limited to utilizing the maximum tensile stress at 7 days post-pouring as the sole criterion for cracking assessment, and does not extend to determinations at other time intervals. Additionally, the study assumes the age-dependent mechanical behavior of concrete follows the general trends prescribed by standards, overlooking the potential acceleration in the concrete’s mechanical property development due to the influence of hydration heat.

5. Conclusions

This study utilized on-site test data based on the MEA–ESB to construct an FEM of a raft structure using the finite element software ABAQUS. Comparison with test data revealed that the FEM accurately simulated the spatiotemporal distribution and variation principles of temperature and strain within the raft. A parametric analysis model was established, and the cracking calculation formula for the super-long raft structure with ESBs was studied. The key conclusions drawn from this research are as follows:
(1) An FEM of the super-length raft structure with ESBs was developed using the ABAQUS software. The HEATVAL, UEXPAN, and UMAT user subroutines were utilized to simulate the thermal hydration, autogenous shrinkage and expansion behavior, and development of the elastic modulus of concrete, respectively. This approach effectively replicated the spatial and temporal distribution principles of temperature and strain within the raft, thereby demonstrating the viability of this modeling methodology.
(2) Based on the framework of the ACI Committee 207 and findings from parametric analysis, a crack determination formula for super-long raft structures with ESBs was proposed. The employment of formula-based methods circumvents the substantial workload associated with finite element approaches, enabling designers and engineers to make relatively accurate assessments of the cracking status in super-length raft structures with ESBs.
(3) The proposed formula-based method was unable to predict cracking for all times following the pouring of super-long raft structures with ESBs and did not account for the effects of hydration heat on the development of the concrete’s mechanical properties. Future research necessitates the development of a more comprehensive mathematical model, one which simultaneously incorporates the evolution of hydration heat in concrete, temperature field distribution, variations in stress and strain, as well as shrinkage effects, and integrates a time variable into the model. This enhancement will enable the model to dynamically reflect the performance changes in concrete throughout its entire lifecycle.

Author Contributions

Conceptualization, H.L. and B.H.; methodology, B.H.; software, H.L. and B.H.; validation, Y.T., C.D. and J.P.; formal analysis, H.L. and B.H.; investigation, H.L. and B.H.; resources, Y.T. and C.D.; data curation, J.P.; writing—original draft preparation, H.L. and B.H.; writing—review and editing, H.L., C.D. and B.H.; visualization, H.L.; supervision, C.D.; project administration, Y.T.; funding acquisition, Y.T. and C.D. All authors have read and agreed to the published version of the manuscript.

Funding

This research was funded by the Chongqing Construction Science and Technology Plan Project, grant number Chengke Zi 2023 No. 8-6.

Data Availability Statement

The original contributions presented in the study are included in the article, further inquiries can be directed to the corresponding author.

Acknowledgments

The authors express their gratitude to the reviewers for their valuable feedback and suggestions aimed at enhancing the paper’s quality.

Conflicts of Interest

Authors Hong Liao, Yuan Tan, Chao Dai, Jie Pu, and Bin Han are employed by China Construction Third Engineering Bureau Group Co., Ltd. The authors declare that the research was conducted in the absence of any commercial or financial relationships that could be construed as a potential conflict of interest.

References

  1. You, B.K.; Wu, W.C.; Han, L.L.; Zhang, L.J.; Dong, T.G.; Chen, F.Y. A New Design Method for the Cancellation of Expansion Joints. Build. Struct. 1993, 1, 44–45. [Google Scholar] [CrossRef]
  2. Zhang, Y.M. Study on Crack Control of Over-Long Concrete Frame Structures. Ph.D. Thesis, Southeast University, Nanjing, China, 2007. [Google Scholar]
  3. You, B.K.; Li, G.M.; Wang, D.M.; Fang, R.L. Super-length Reinforced Concrete Structures: UEA Continuous Design and Construction Methodologies. Build. Struct. 1998, 6, 21–23. [Google Scholar] [CrossRef]
  4. Yang, J.; Yang, P.; Wan, Y. Xinfei Sales Building Structural Design. Build. Struct. 2009, 39 (Suppl. 1), 327–330. [Google Scholar] [CrossRef]
  5. Zhang, J.G.; Li, S.H.; Wang, L.B. Application of UEA Concrete Expansive Strengthening Band Seamless Design in Engineering. Coal Eng. 2003, 10, 20–21. [Google Scholar]
  6. Jin, J.M. Design Suggestion about Crack Precaution and Reduction Caused by Temperature and Shrinkage Jointly in Over-long Concrete Structures. Ind. Archit. 2002, 6, 57–59. [Google Scholar]
  7. Li, W.B.; Zhong, W.P.; Song, C.Y. The Technical Measures of Crack Control for Bed Plate Engineering. Ind. Archit. 2005, S1, 908–910. [Google Scholar]
  8. Dong, P.; Lin, B.X. Seismic Analysis and Crack Control of the Superlong and Superwide Structure with Multi-Tower Buildings. J. Hefei Univ. Technol. Nat. Sci. 2001, 1, 106–111. [Google Scholar]
  9. Zhou, Q.; Lachowski, E.E.; Glasser, F.P. A Decomposition Product of Ettringite. Cem. Concr. Res. 2004, 34, 703–710. [Google Scholar] [CrossRef]
  10. Liu, J.P.; Zhang, S.Z.; Tian, Q.; Guo, F.; Wang, Y. Deformation Behavior of High Performance Concrete Containing MgO Composite Expansive Agent. J. Southeast Univ. Nat. Sci. Ed. 2010, 40 (Suppl. 2), 150–154. [Google Scholar]
  11. Mo, L.W.; Deng, M.; Tang, M.S. Effects of calcination condition on expansion property of MgO-type expansive agent used in cement-based materials. Cem. Concr. Res. 2010, 40, 437–446. [Google Scholar] [CrossRef]
  12. Mo, L.W.; Liu, M.; Al-Tabbaa, A.; Deng, M.; Lau, W.Y. Deformation and mechanical properties of quaternary blended cements containing ground granulated blast furnace slag, fly ash, and magnesia. Cem. Concr. Res. 2015, 71, 7–13. [Google Scholar] [CrossRef]
  13. Mo, L.W.; Liu, M.; Al-Tabbaa, A.; Deng, M. Deformation and mechanical properties of the expansive cements produced by inter-grinding cement clinker and MgOs with various reactivities. Constr. Build. Mater. 2015, 80, 1–8. [Google Scholar] [CrossRef]
  14. Mo, L.W.; Fang, J.W.; Hou, W.H.; Ji, X.K.; Yang, J.B.; Fan, T.T.; Wang, H.L. Synergetic effects of curing temperature and hydration reactivity of MgO expansive agents on their hydration and expansion behaviours in cement pastes. Constr. Build. Mater. 2019, 207, 206–217. [Google Scholar] [CrossRef]
  15. Mo, L.W.; Deng, M.; Wang, A. Effects of MgO-based expansive additive on compensating the shrinkage of cement paste under non-wet curing conditions. Cem. Concr. Compos. 2012, 34, 377–383. [Google Scholar] [CrossRef]
  16. Mo, L.W.; Fang, J.W.; Huang, B.; Wang, A.G.; Deng, M. Combined effects of biochar and MgO expansive additive on the autogenous shrinkage, internal relative humidity, and compressive strength of cement pastes. Constr. Build. Mater. 2019, 229, 116877. [Google Scholar] [CrossRef]
  17. Jiao, M.P.; Wang, P.G.; Tian, L.; Cui, D.B.; Zhao, T.J.; Sun, X.G. Influence of S-type Magnesia Expansive Agent on Micro-structure, Shrinkage and Durability of Concrete. J. Chin. Ceram. Soc. 2023, 51, 2905–2913. [Google Scholar] [CrossRef]
  18. Li, P.; Miao, M.; Miao, F.; Jiang, H.W.; Ma, X.J. Research progress of deformation performance of shrinkage-compensated concrete. Bull. Chin. Ceram. Soc. 2016, 35, 192–197, 208. [Google Scholar] [CrossRef]
  19. Li, P.; Miao, M.; Ma, X. Effect of expansive agent on the performance of shrinkage-compensated concrete. Bull. Chin. Ceram. Soc. 2016, 35, 167–173. [Google Scholar] [CrossRef]
  20. Klemczak, B.; Żmij, A. Reliability of standard methods for evaluating the early-age cracking risk of thermal-shrinkage origin in concrete walls. Constr. Build. Mater. 2019, 226, 651–661. [Google Scholar] [CrossRef]
  21. Jędrzejewska, A.; Kanavaris, F.; Zych, M.; Schlicke, D.; Azenha, M. Experiences on early age cracking of wall-on-slab concrete structures. Structures 2020, 27, 2520–2549. [Google Scholar] [CrossRef]
  22. ACI 207.2R-07; Report on Thermal and Volume Change Effects on Cracking of Mass Concrete. American Concrete Institute: Farmington Hills, MI, USA, 2007; ACI Committee 207.
  23. EN 1992-1-1; Eurocode 2–Design of Concrete Structures–Part 1-1: General Rules and Rules for Buildings. European Committee for Standardization: Brussels, Belgium, 2008.
  24. EN 1992-3; Eurocode 2–Design of Concrete Structures–Part 3: Liquid Retaining and Containment Structures. European Committee for Standardization: Brussels, Belgium, 2006.
  25. Japanese Concrete Institute. Guidelines for Control of Cracking of Mass Concrete 2016; Japanese Concrete Institute: Tokyo, Japan, 2017. [Google Scholar]
  26. EN 1991-4; Eurocode 1: Actions on structures–Part 4: Silos and Tanks. European Committee for Standardization: Brussels, Belgium, 2006.
  27. Bamforth, P.B. CIRIA C766: Control of Cracking Caused by Restrained Deformation in Concrete; CIRIA: London, UK, 2007. [Google Scholar]
  28. Smolana, A.; Klemczak, B.; Azenha, M.; Schlicke, D. Early age cracking risk in a massive concrete foundation slab: Comparison of analytical and numerical prediction models with on-site measurements. Constr. Build. Mater. 2021, 301, 124135. [Google Scholar] [CrossRef]
  29. Klemczak, B.; Flaga, K.; Knoppik-Wróbel, A. Analytical model for evaluation of thermal-shrinkage strains and stresses in RC wall-on-slab structures. Arch. Civ. Mech. Eng. 2017, 17, 75–95. [Google Scholar] [CrossRef]
  30. Klemczak, B.; Knoppik-Wróbel, A. Reinforced concrete tank walls and bridge abutments: Early-age behaviour, analytic approaches and numerical models. Eng. Struct. 2015, 84, 233–251. [Google Scholar] [CrossRef]
  31. Li, X.; Yu, Z.; Chen, K.; Deng, C.; Yu, F. Investigation of temperature development and cracking control strategies of mass concrete: A field monitoring case study. Case Stud. Constr. Mater. 2023, 18, e02144. [Google Scholar] [CrossRef]
  32. Kanavaris, F.; Jędrzejewska, A.; Sfikas, I.P.; Schlicke, D.; Kuperman, S.; Šmilauer, V.; Honório, T.; Fairbairn, E.M.R.; Valentim, G.; de Faria, E.F.; et al. Enhanced massivity index based on evidence from case studies: Towards a robust pre-design assessment of early-age thermal cracking risk and practical recommendations. Constr. Build. Mater. 2021, 271, 121570. [Google Scholar] [CrossRef]
  33. Azenha, M.; Kanavaris, F.; Schlicke, D.; Jędrzejewska, A.; Benboudjema, F.; Honorio, T.; Šmilauer, V.; Serra, C.; Forth, J.; Riding, K.; et al. Recommendations of RILEM TC 287-CCS: Thermo-chemo-mechanical modelling of massive concrete structures towards cracking risk assessment. Mater. Struct. 2021, 54, 135. [Google Scholar] [CrossRef]
  34. Han, B.; Wang, H.; Liao, H.; Dai, C.; Zhao, Y.; Xu, W.; Zhou, G.; Shi, C. Investigation into the seamless construction for hundred-meter scale super-length raft structure based on magnesia expansive agent concrete. Front. Mater. 2024, 11, 1367600. [Google Scholar] [CrossRef]
  35. GB/T 50081-2019; Standard for Test Methods of Concrete Physical and Mechanical Properties. China Architecture & Building Press: Beijing, China, 2019. (In Chinese)
  36. SL/T 352-2020; Test Code for Hydraulic Concrete. China Water & Power Press: Beijing, China, 2020. (In Chinese)
  37. CEB-FIP. CEB-FIP Model Code 1990; Thomas Telford: London, UK, 1993. [Google Scholar]
  38. GB 50496-2018; Standard for Construction of Mass Concrete. China Architecture & Building Press: Beijing, China, 2018. (In Chinese)
  39. Liu, F.; Shen, S.-L.; Hou, D.-W.; Arulrajah, A.; Horpibulsuk, S. Enhancing behavior of large volume undersubgrade concrete structures using expansive agents. Constr. Build. Mater. 2016, 114, 49–55. [Google Scholar] [CrossRef]
  40. GB 50119-2013; Code for Concrete Admixture Application. China Construction Publishing Media Co., Ltd.: Beijing, China, 2014. (In Chinese)
  41. Box, G.E.P.; Wilson, K.B. On the experimental attainment of optimum conditions. J. R. Stat. Soc. Ser. B Methodol. 1951, 13, 1–45. [Google Scholar] [CrossRef]
Figure 1. The impact of different expansive agents on unrestrained volume deformation of concrete.
Buildings 14 01531 g001
Figure 2. The finite element model of raft structure and foundation.
Buildings 14 01531 g002
Figure 3. Finite element analysis (FEA) versus experimental results of raft temperature distribution at 48 h. (a) Surface; (b) Center; (c) Bottom.
Buildings 14 01531 g003
Figure 4. FEA versus experimental results of raft temperature distribution at 28 d. (a) Surface; (b) Center; (c) Bottom.
Buildings 14 01531 g004
Figure 5. FEA versus experimental results of raft strain distribution at 48 h. (a) Surface; (b) Center; (c) Bottom.
Buildings 14 01531 g005
Figure 6. FEA versus experimental results of raft strain distribution at 28 d. (a) Surface; (b) Center; (c) Bottom.
Buildings 14 01531 g006
Figure 7. Temperature–time curves comparison for expansive strengthening band (ESB) 1: FEA vs. experimental results. (a) Surface; (b) Center; (c) Bottom.
Buildings 14 01531 g007
Figure 8. Temperature–time curves comparison for standard region 2: FEA vs. experimental results. (a) Surface; (b) Center; (c) Bottom.
Buildings 14 01531 g008
Figure 9. Strain–time curves comparison for ESB 1: FEA vs. experimental results. (a) Surface; (b) Center; (c) Bottom.
Buildings 14 01531 g009
Figure 10. Strain–time curves comparison for standard region 2: FEA vs. experimental results. (a) Surface; (b) Center; (c) Bottom.
Buildings 14 01531 g010
Figure 11. The mechanical analysis model for the raft structure.
Buildings 14 01531 g011
Figure 12. The parametric analysis model for the raft structure.
Buildings 14 01531 g012
Figure 13. The impact of the ESB-to-raft-width ratio on the strain–time curves and the 7-day strain. (a) Strain–time curves; (b) 7-day strain.
Buildings 14 01531 g013
Figure 14. The impact of the MEA concrete expansion rate on the strain–time curves and the 7-day strain. (a) Strain–time curves; (b) 7-day strain.
Buildings 14 01531 g014
Figure 15. Comparison of calculation results from the formula and FEA.
Buildings 14 01531 g015
Table 1. The mechanical and thermodynamic properties of concrete.
Material NameDensity
(kg/m3)
Specific Heat
(kJ/(kg·K))
Conductivity
((kJ/(m·s·K))
28-Day Cube Compressive Strength (MPa)
C3523600.9479.550645.9
C4023980.9439.539952.1
Table 2. Parameter analysis computational results.
Condition Identifierre (%)ε7-day (×10−4)Condition Identifierre (%)ε7-day (×10−4)
100−3.07170.130.02−3.60
20.030.02−3.21180.130.04−3.77
30.030.04−3.25190.130.06−3.95
40.030.06−3.30200.130.08−4.12
50.030.08−3.35210.130.1−4.30
60.030.1−3.39220.160.02−3.71
70.060.02−3.31230.160.04−3.92
80.060.04−3.42240.160.06−4.13
90.060.06−3.53250.160.08−4.34
100.060.08−3.64260.160.1−4.55
110.060.1−3.75270.20.02−3.86
120.10.02−3.48280.20.04−4.11
130.10.04−3.62290.20.06−4.37
140.10.06−3.76300.20.08−4.62
150.10.08−3.90310.20.1−4.88
160.10.1−4.04
Disclaimer/Publisher’s Note: The statements, opinions and data contained in all publications are solely those of the individual author(s) and contributor(s) and not of MDPI and/or the editor(s). MDPI and/or the editor(s) disclaim responsibility for any injury to people or property resulting from any ideas, methods, instructions or products referred to in the content.

