
Behavior of Existing Box Beams Repaired with High-Strength Mortar Layer and Ultra-High-Performance Concrete (UHPC) Overlay: Experimental, Numerical, and Theoretical Investigations
 and
and
Abstract
:1. Introduction
2. Experimental Program
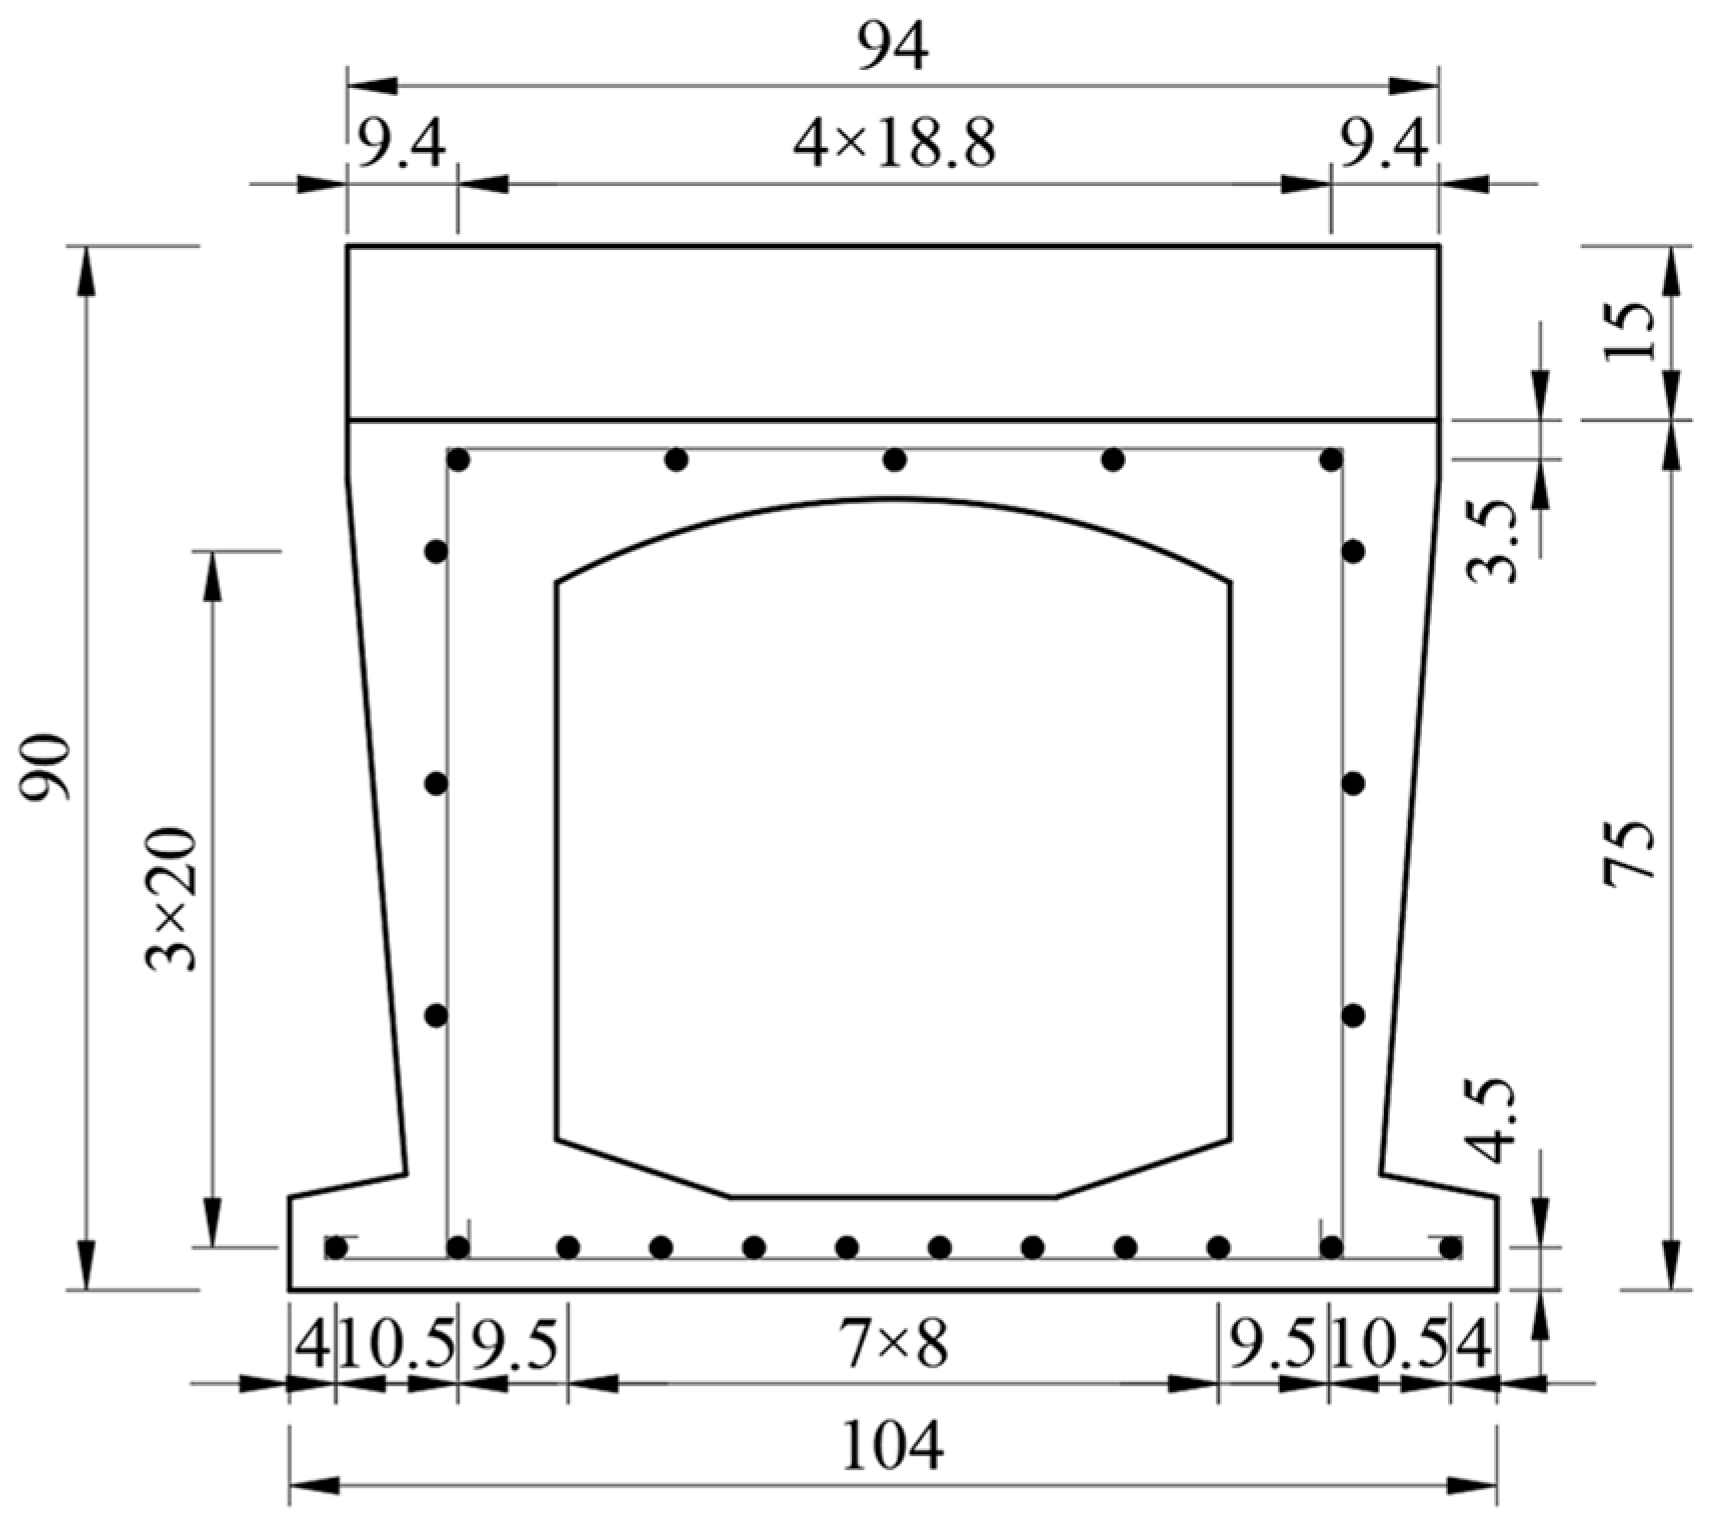
2.1. Specimens
2.1.1. Unstrengthened Beam (Control Beam)
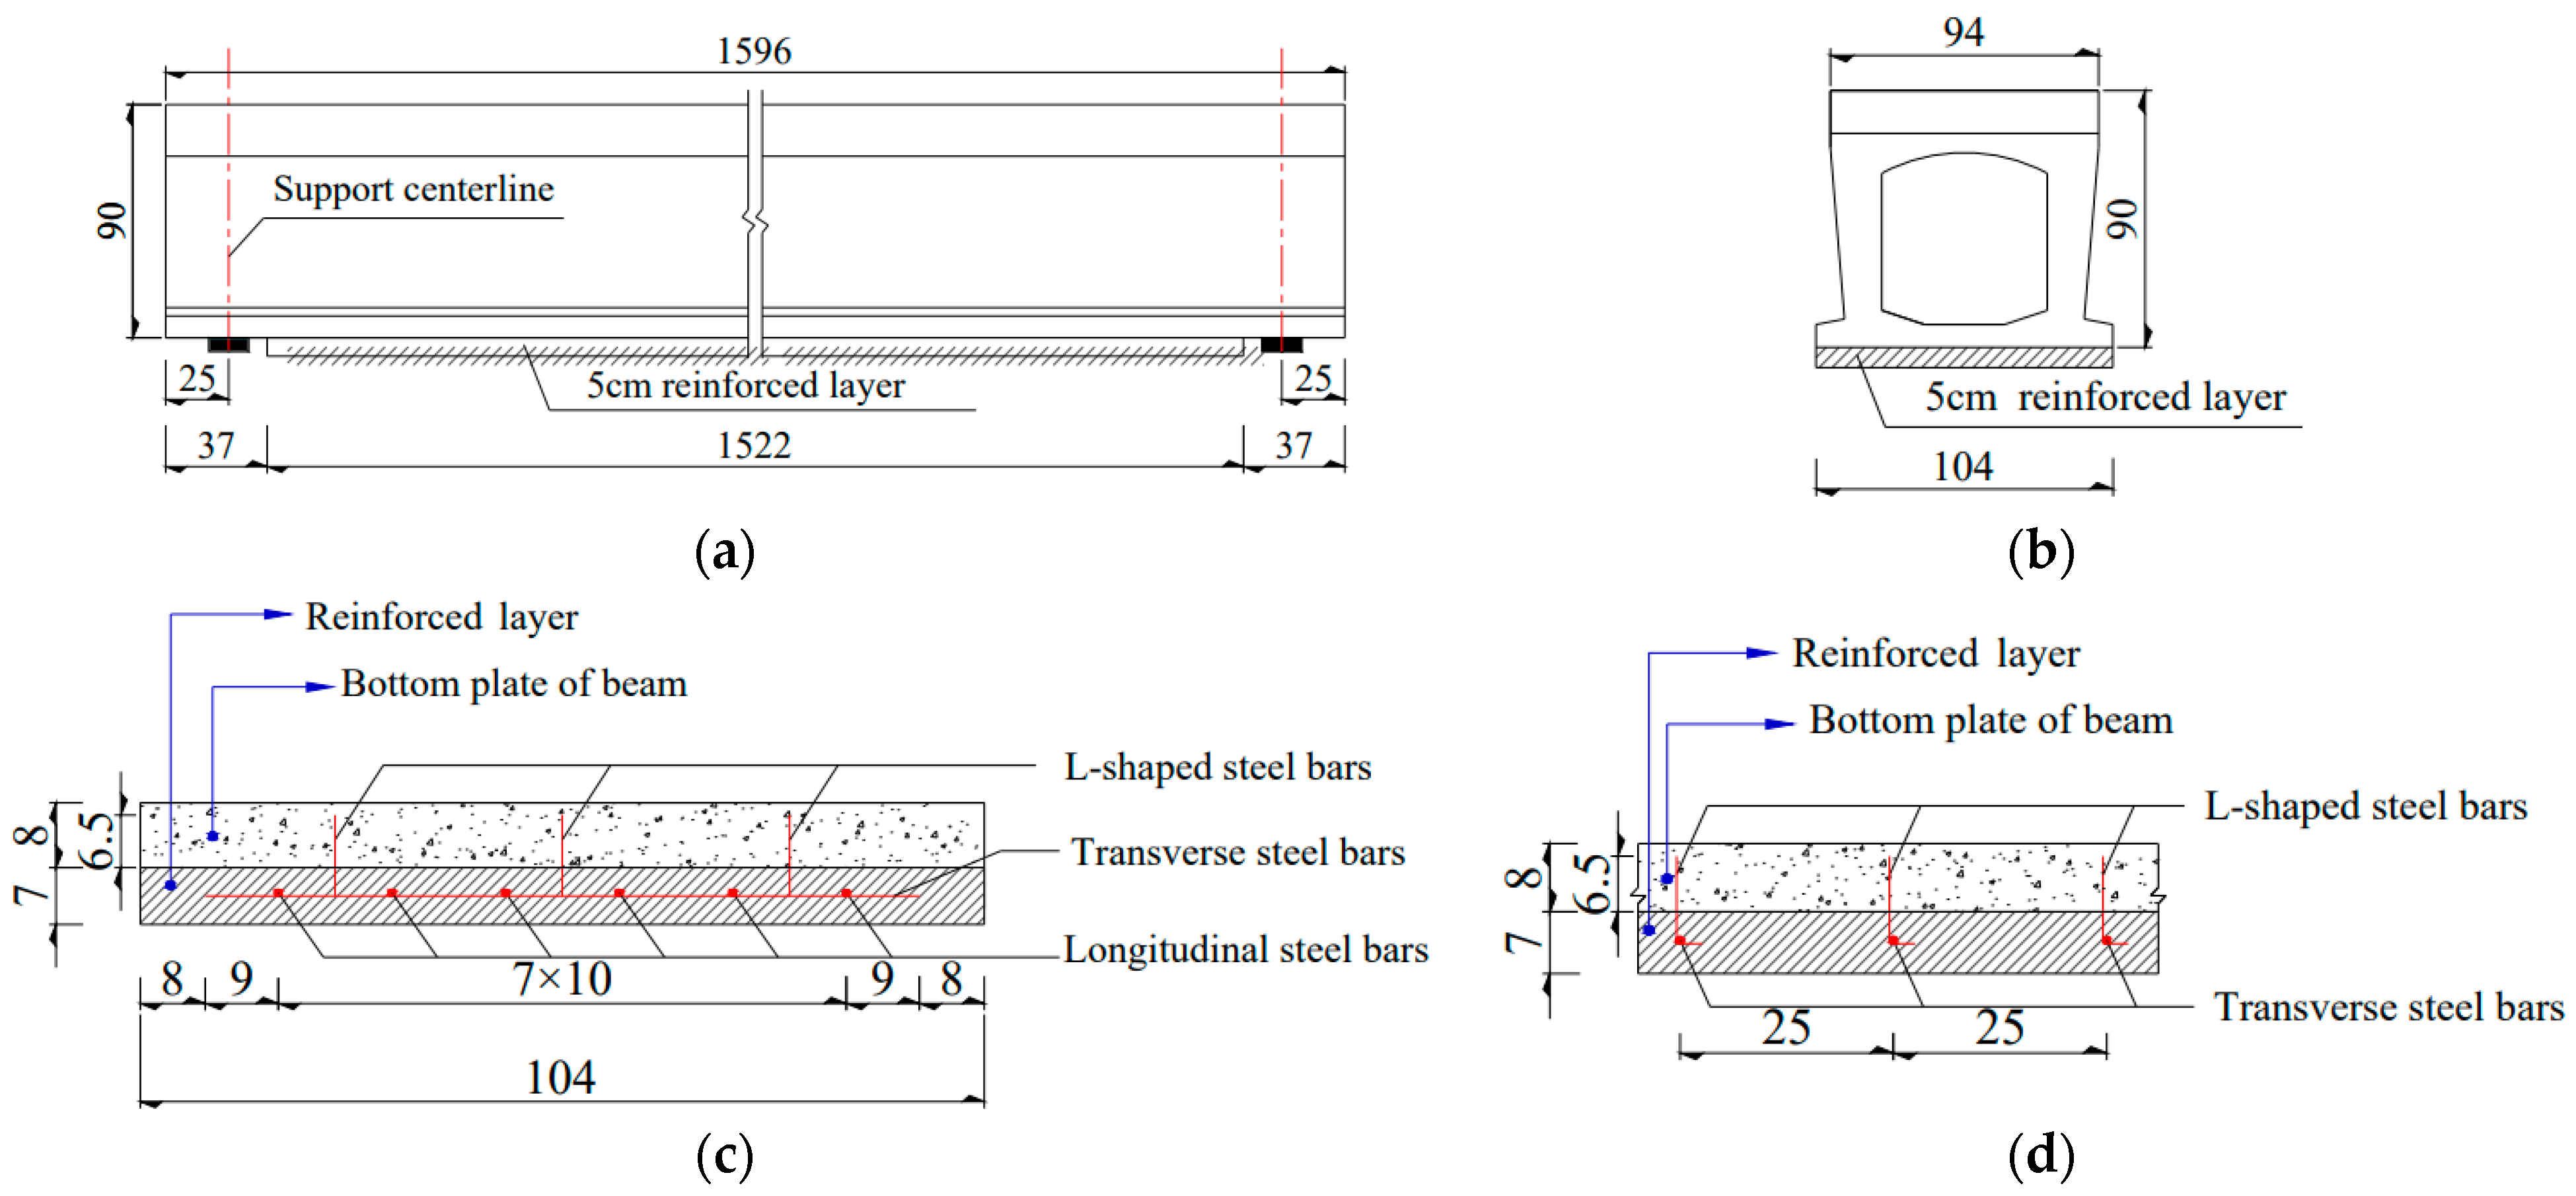
2.1.2. Strengthened Beams (Mortar Beam and UHPC Beam)
2.2. Material Properties
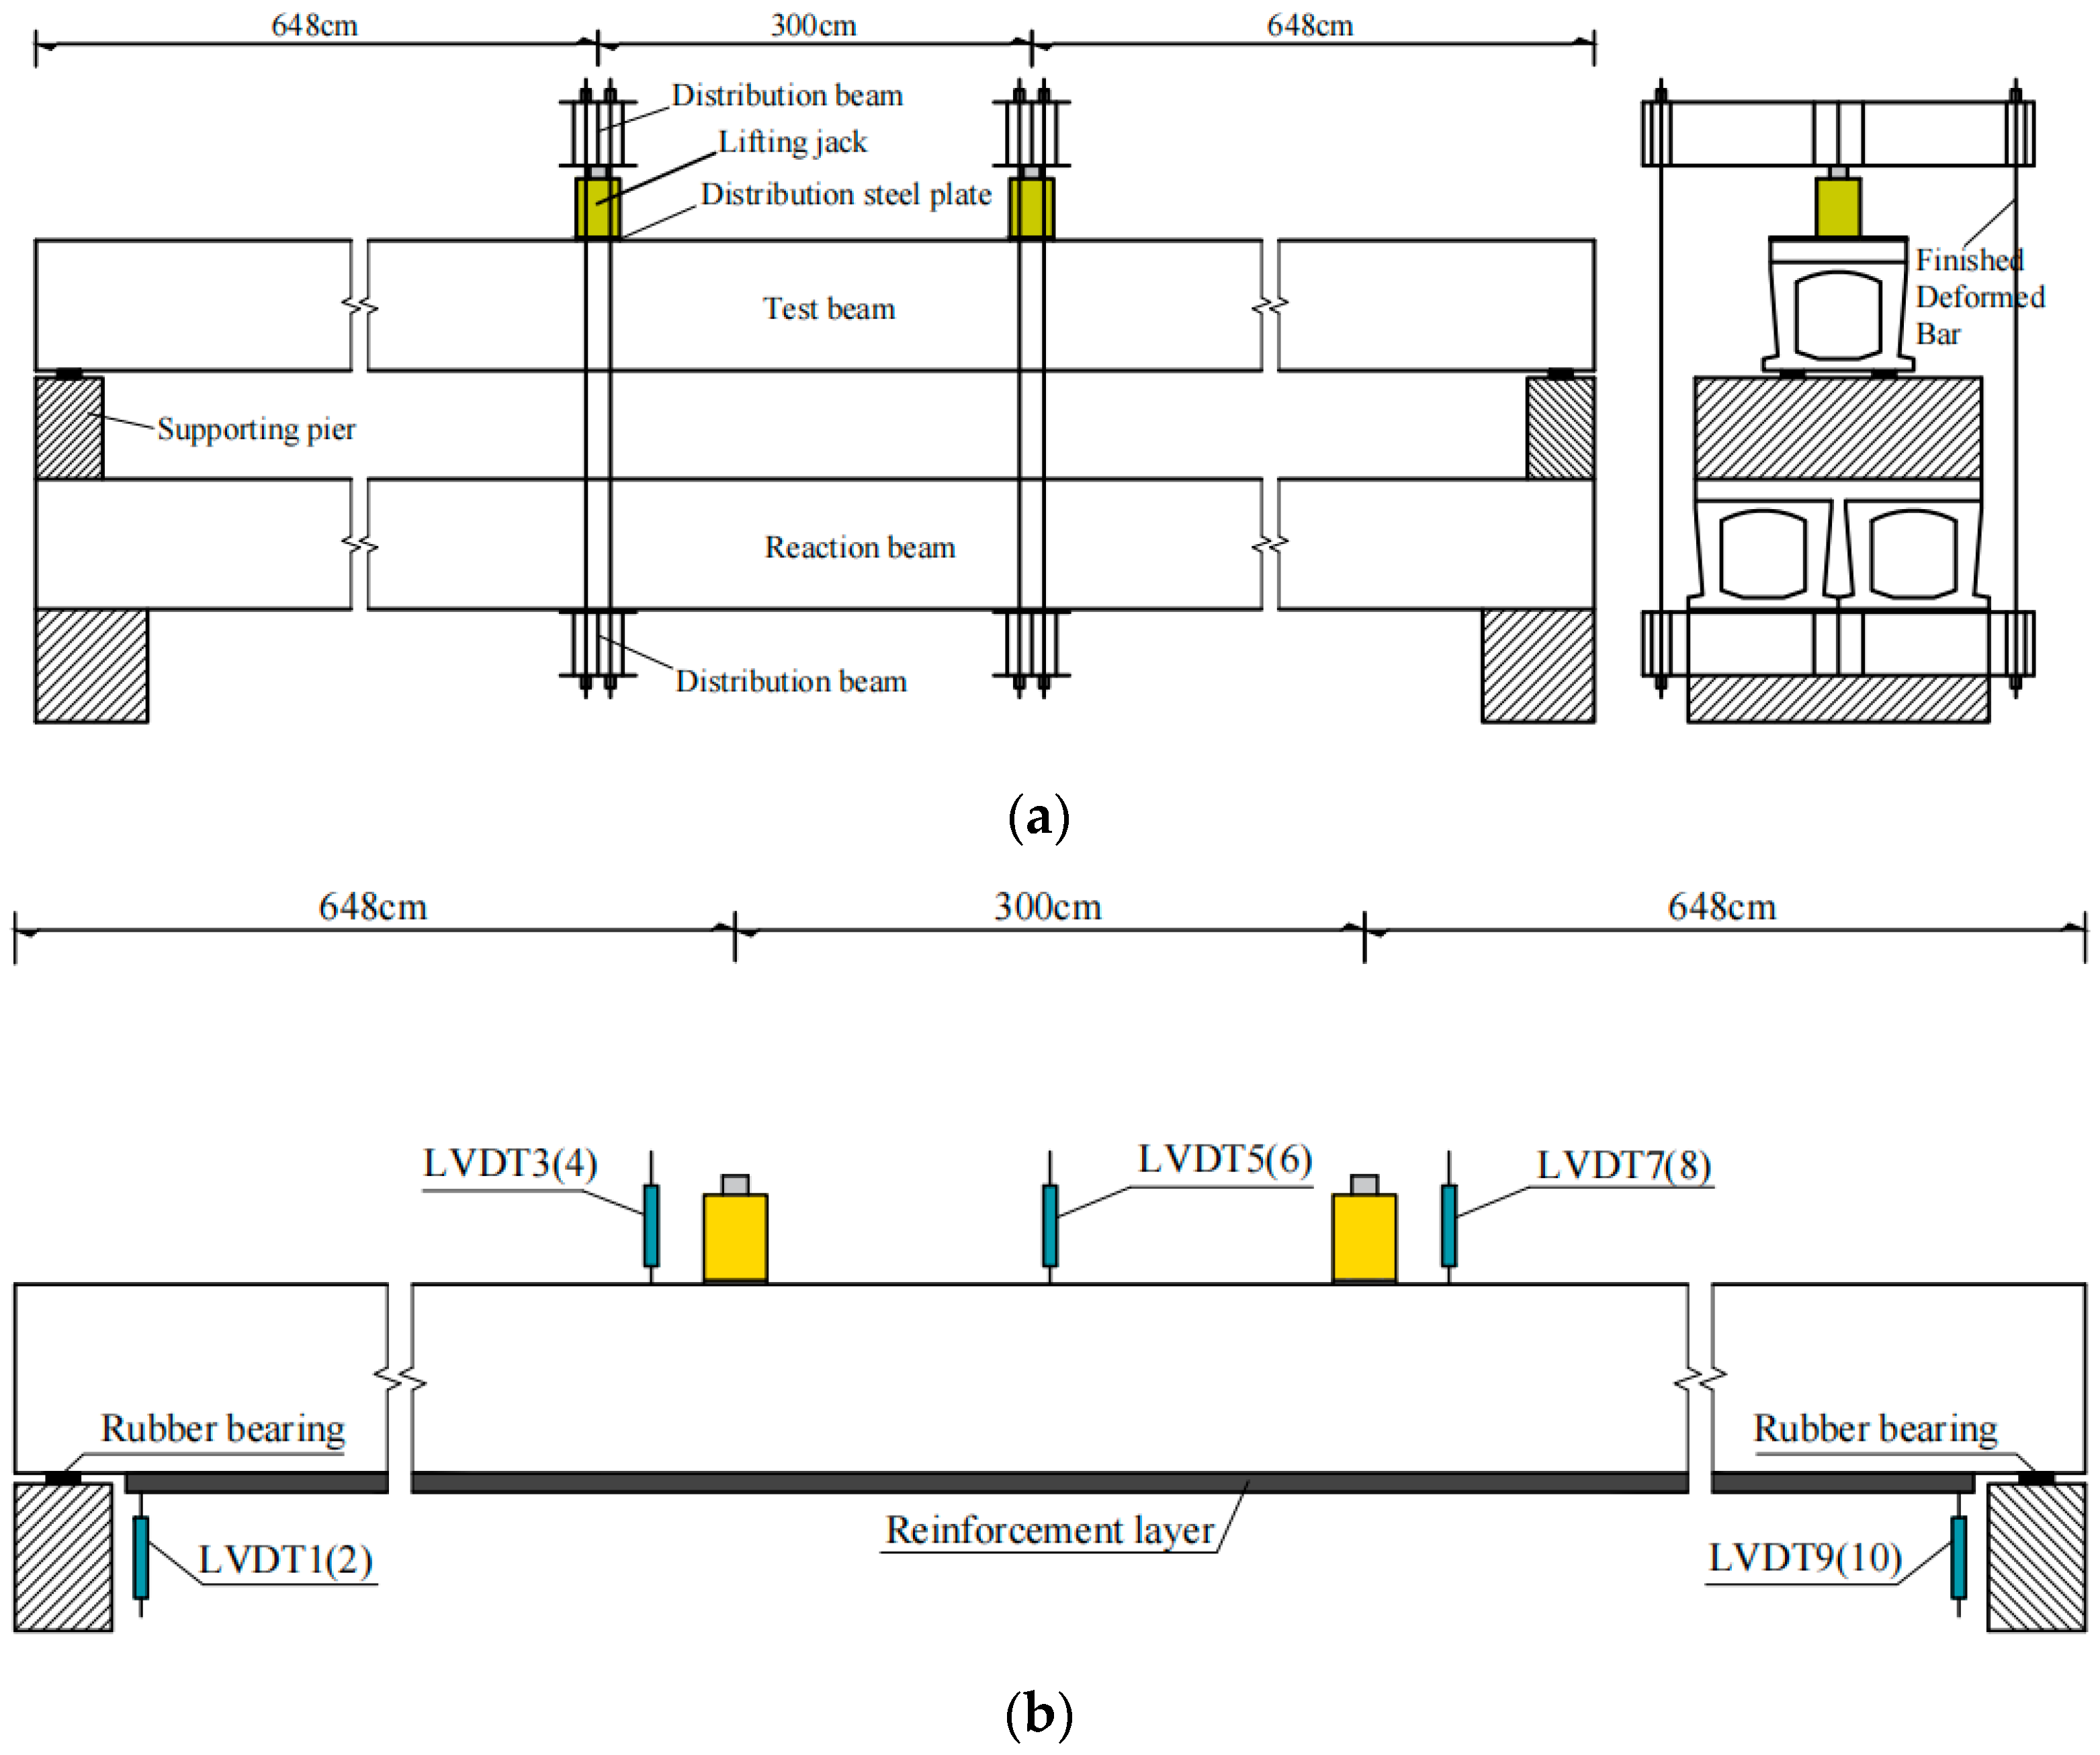
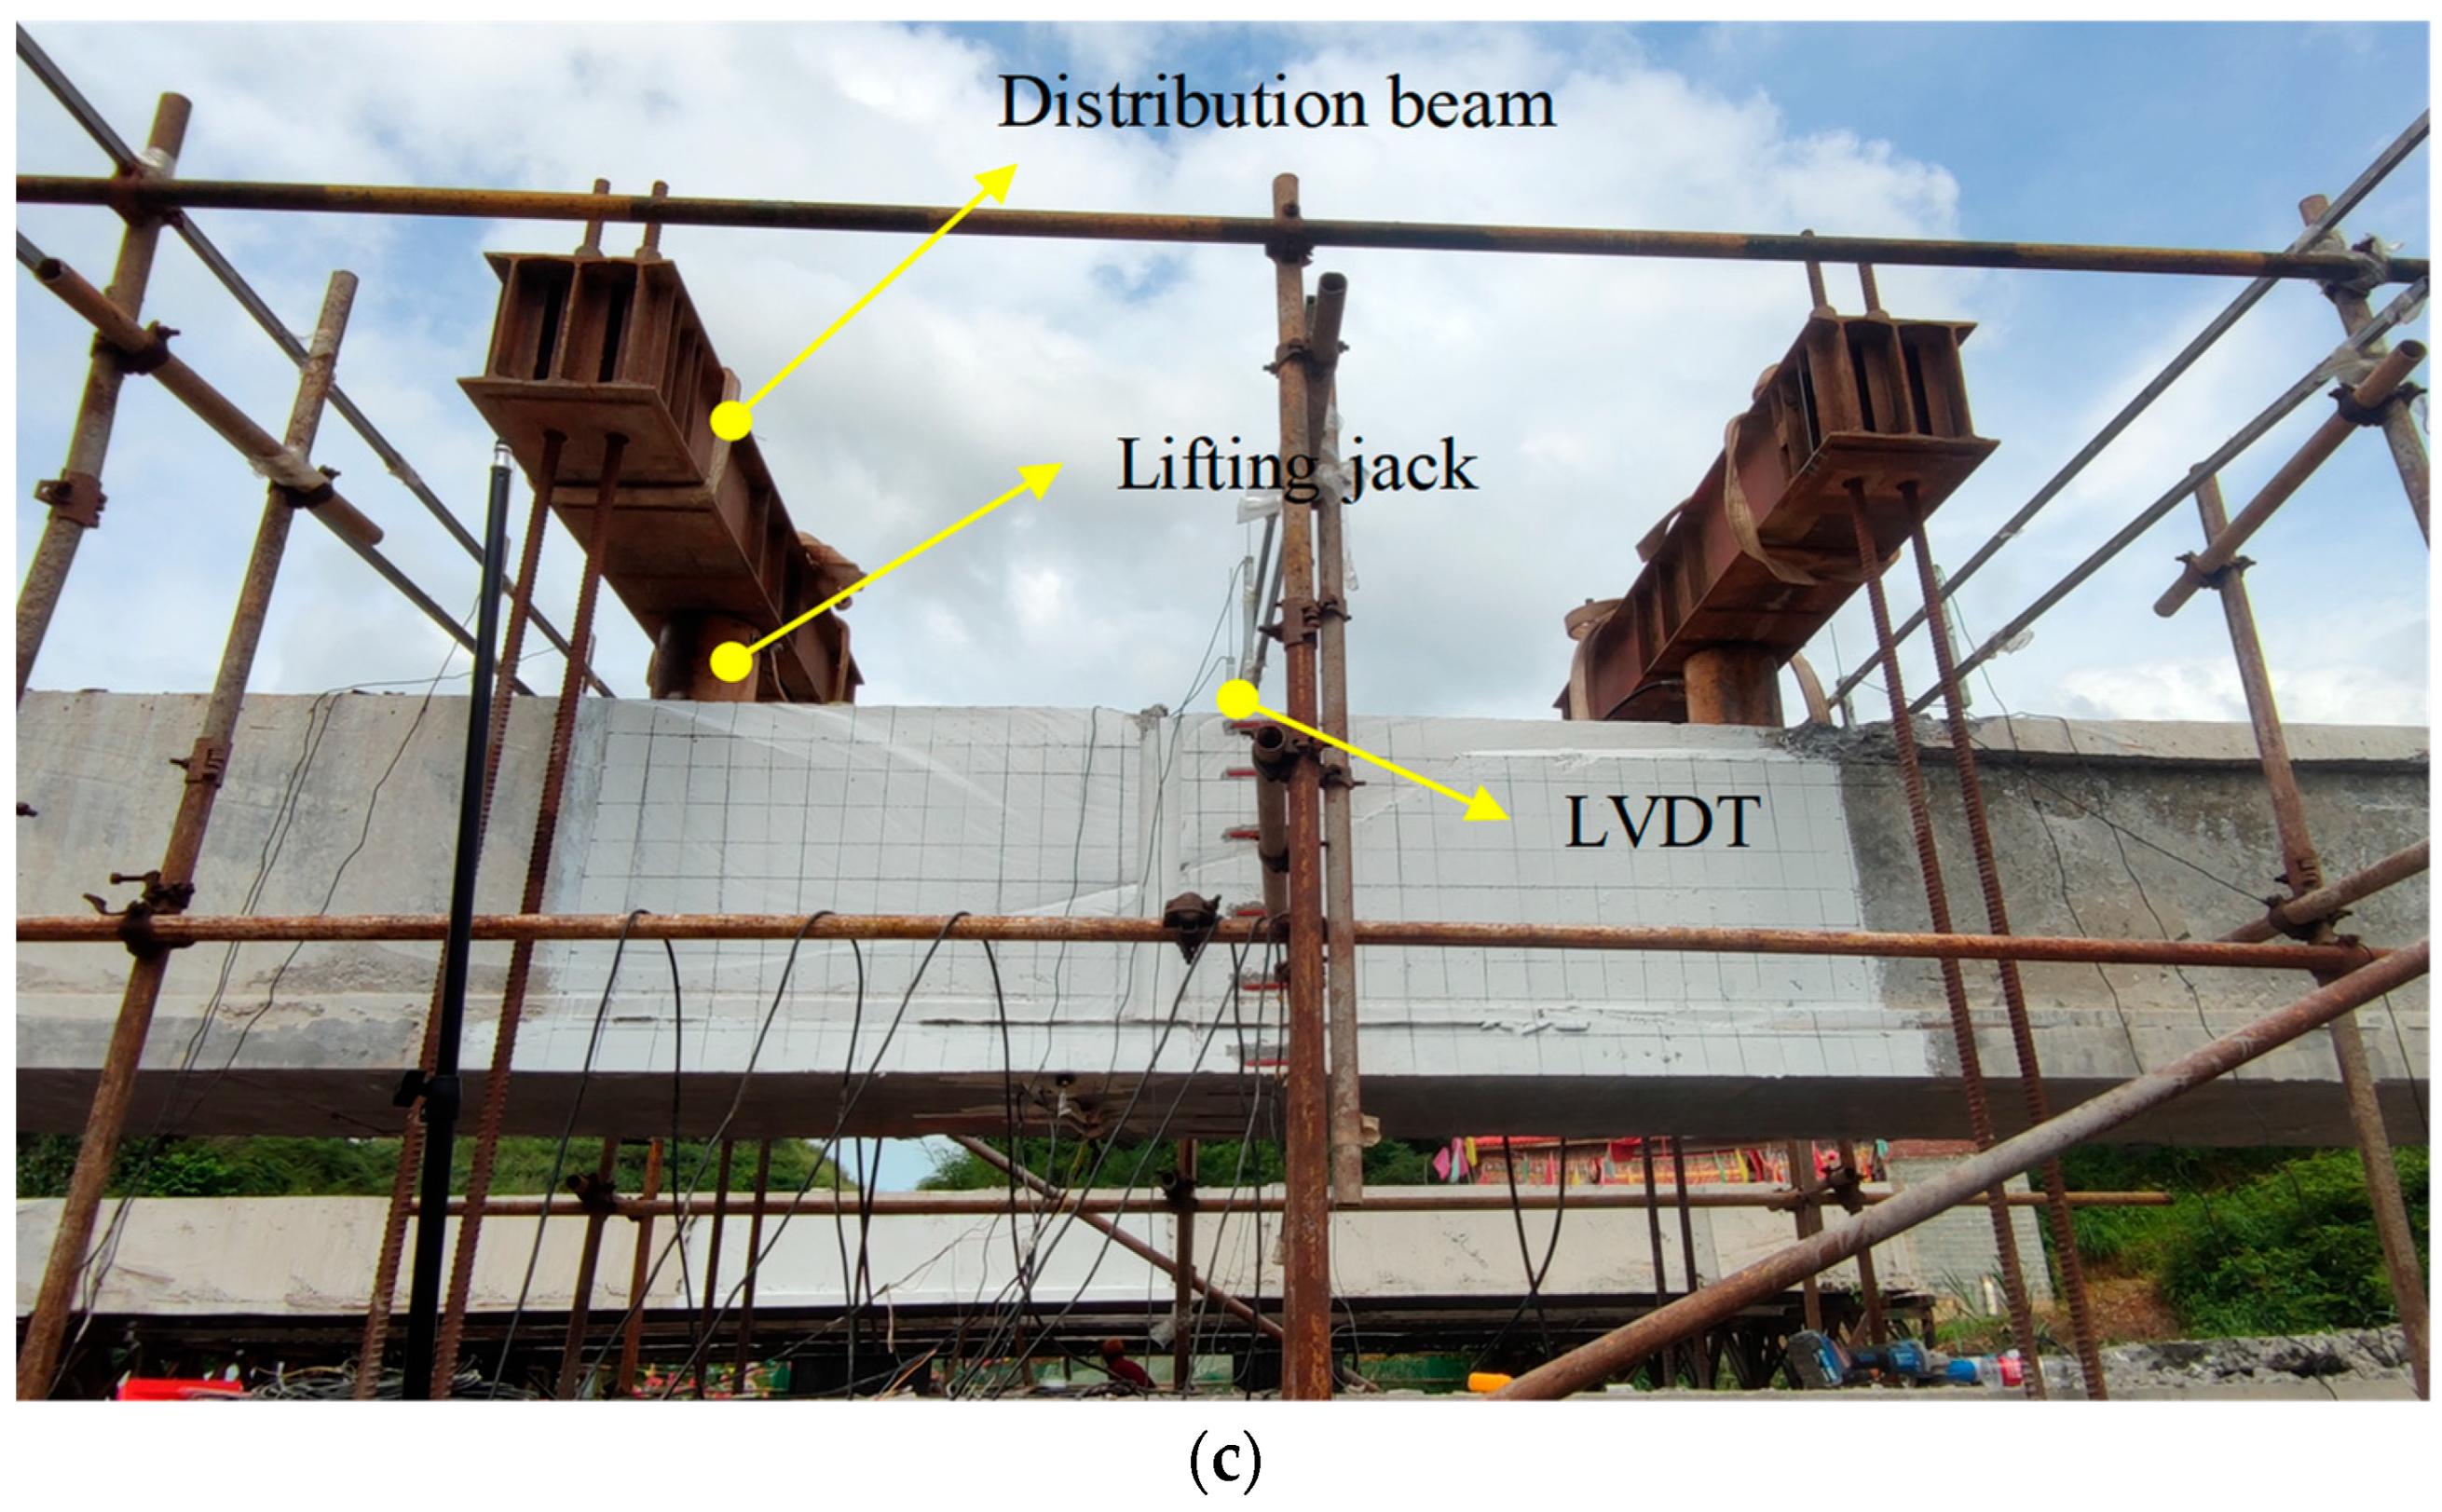
2.3. Test Setup and Instrumentations
3. Test Results
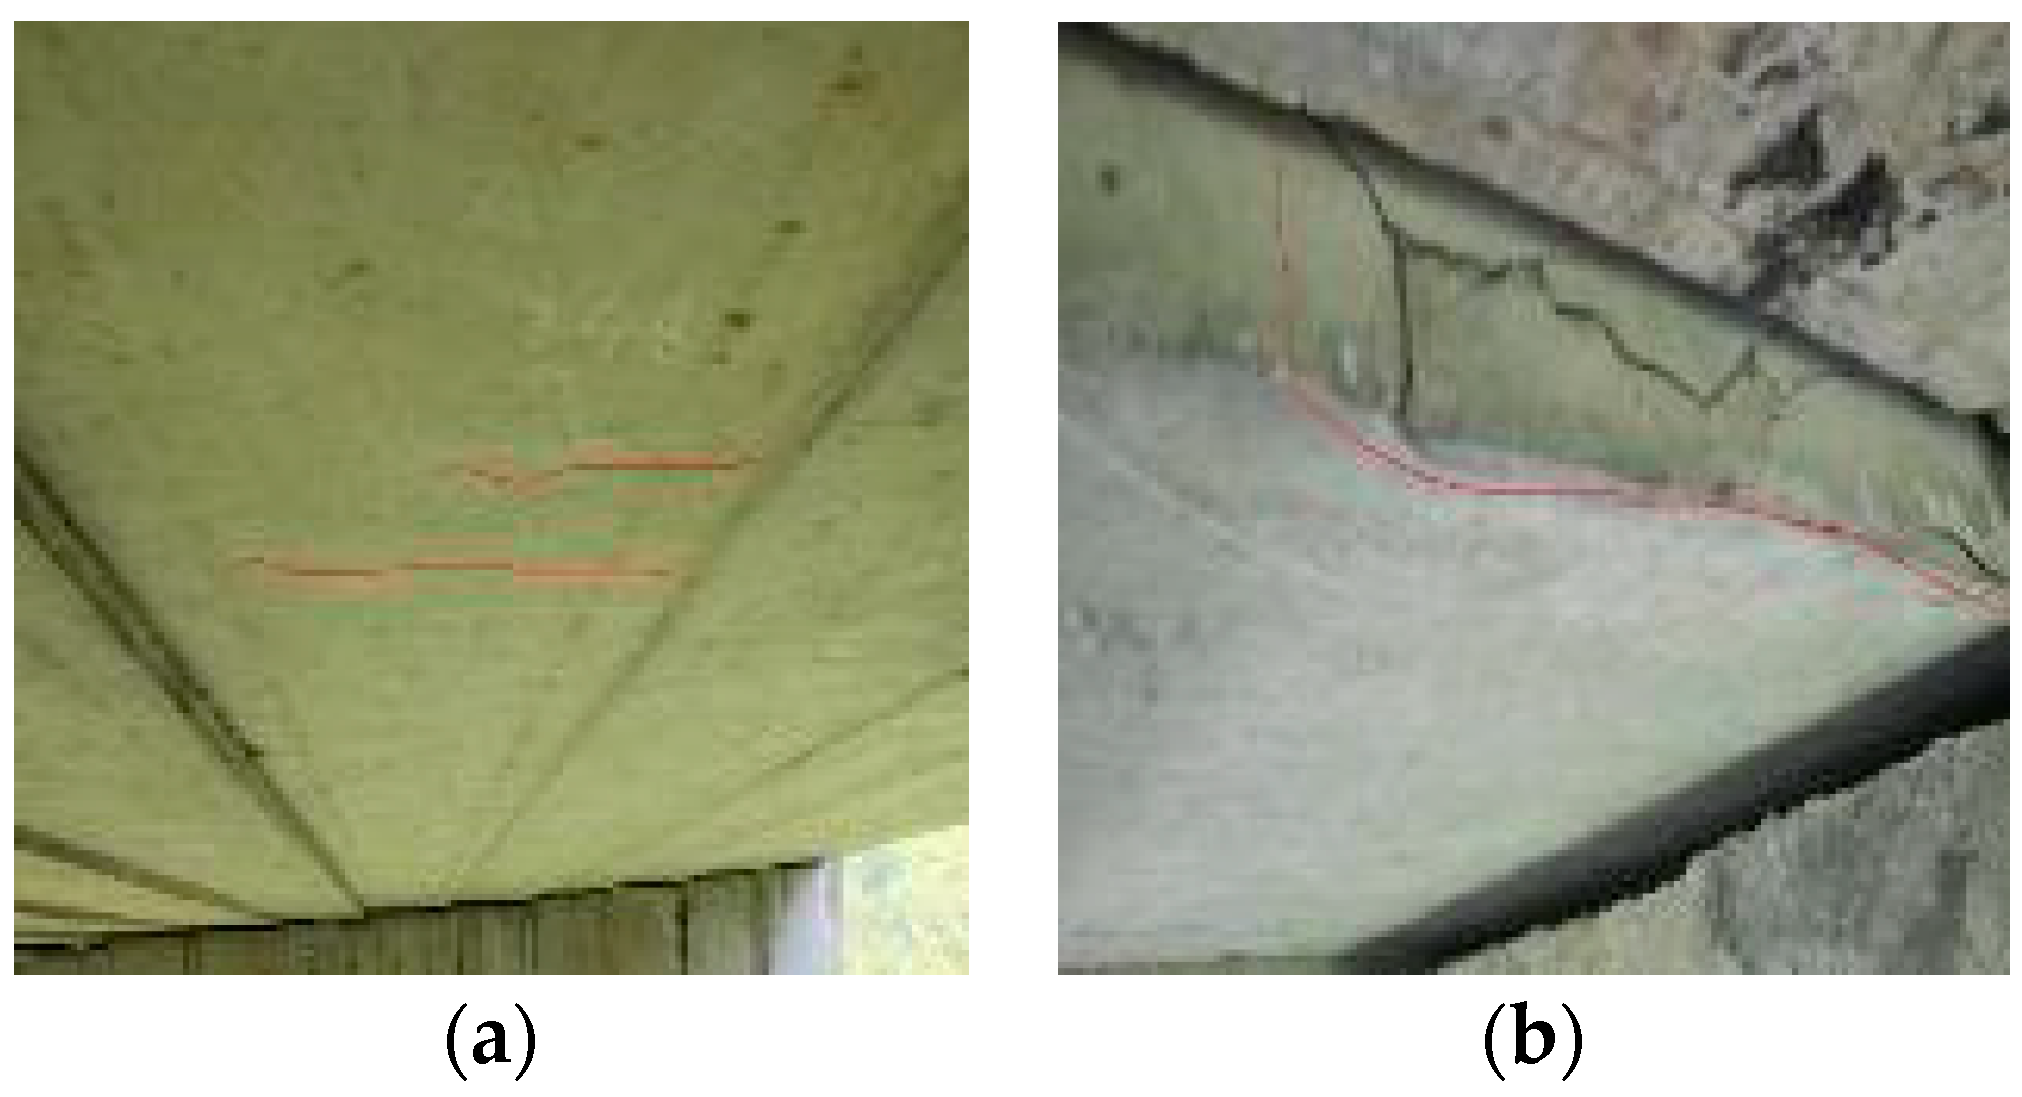
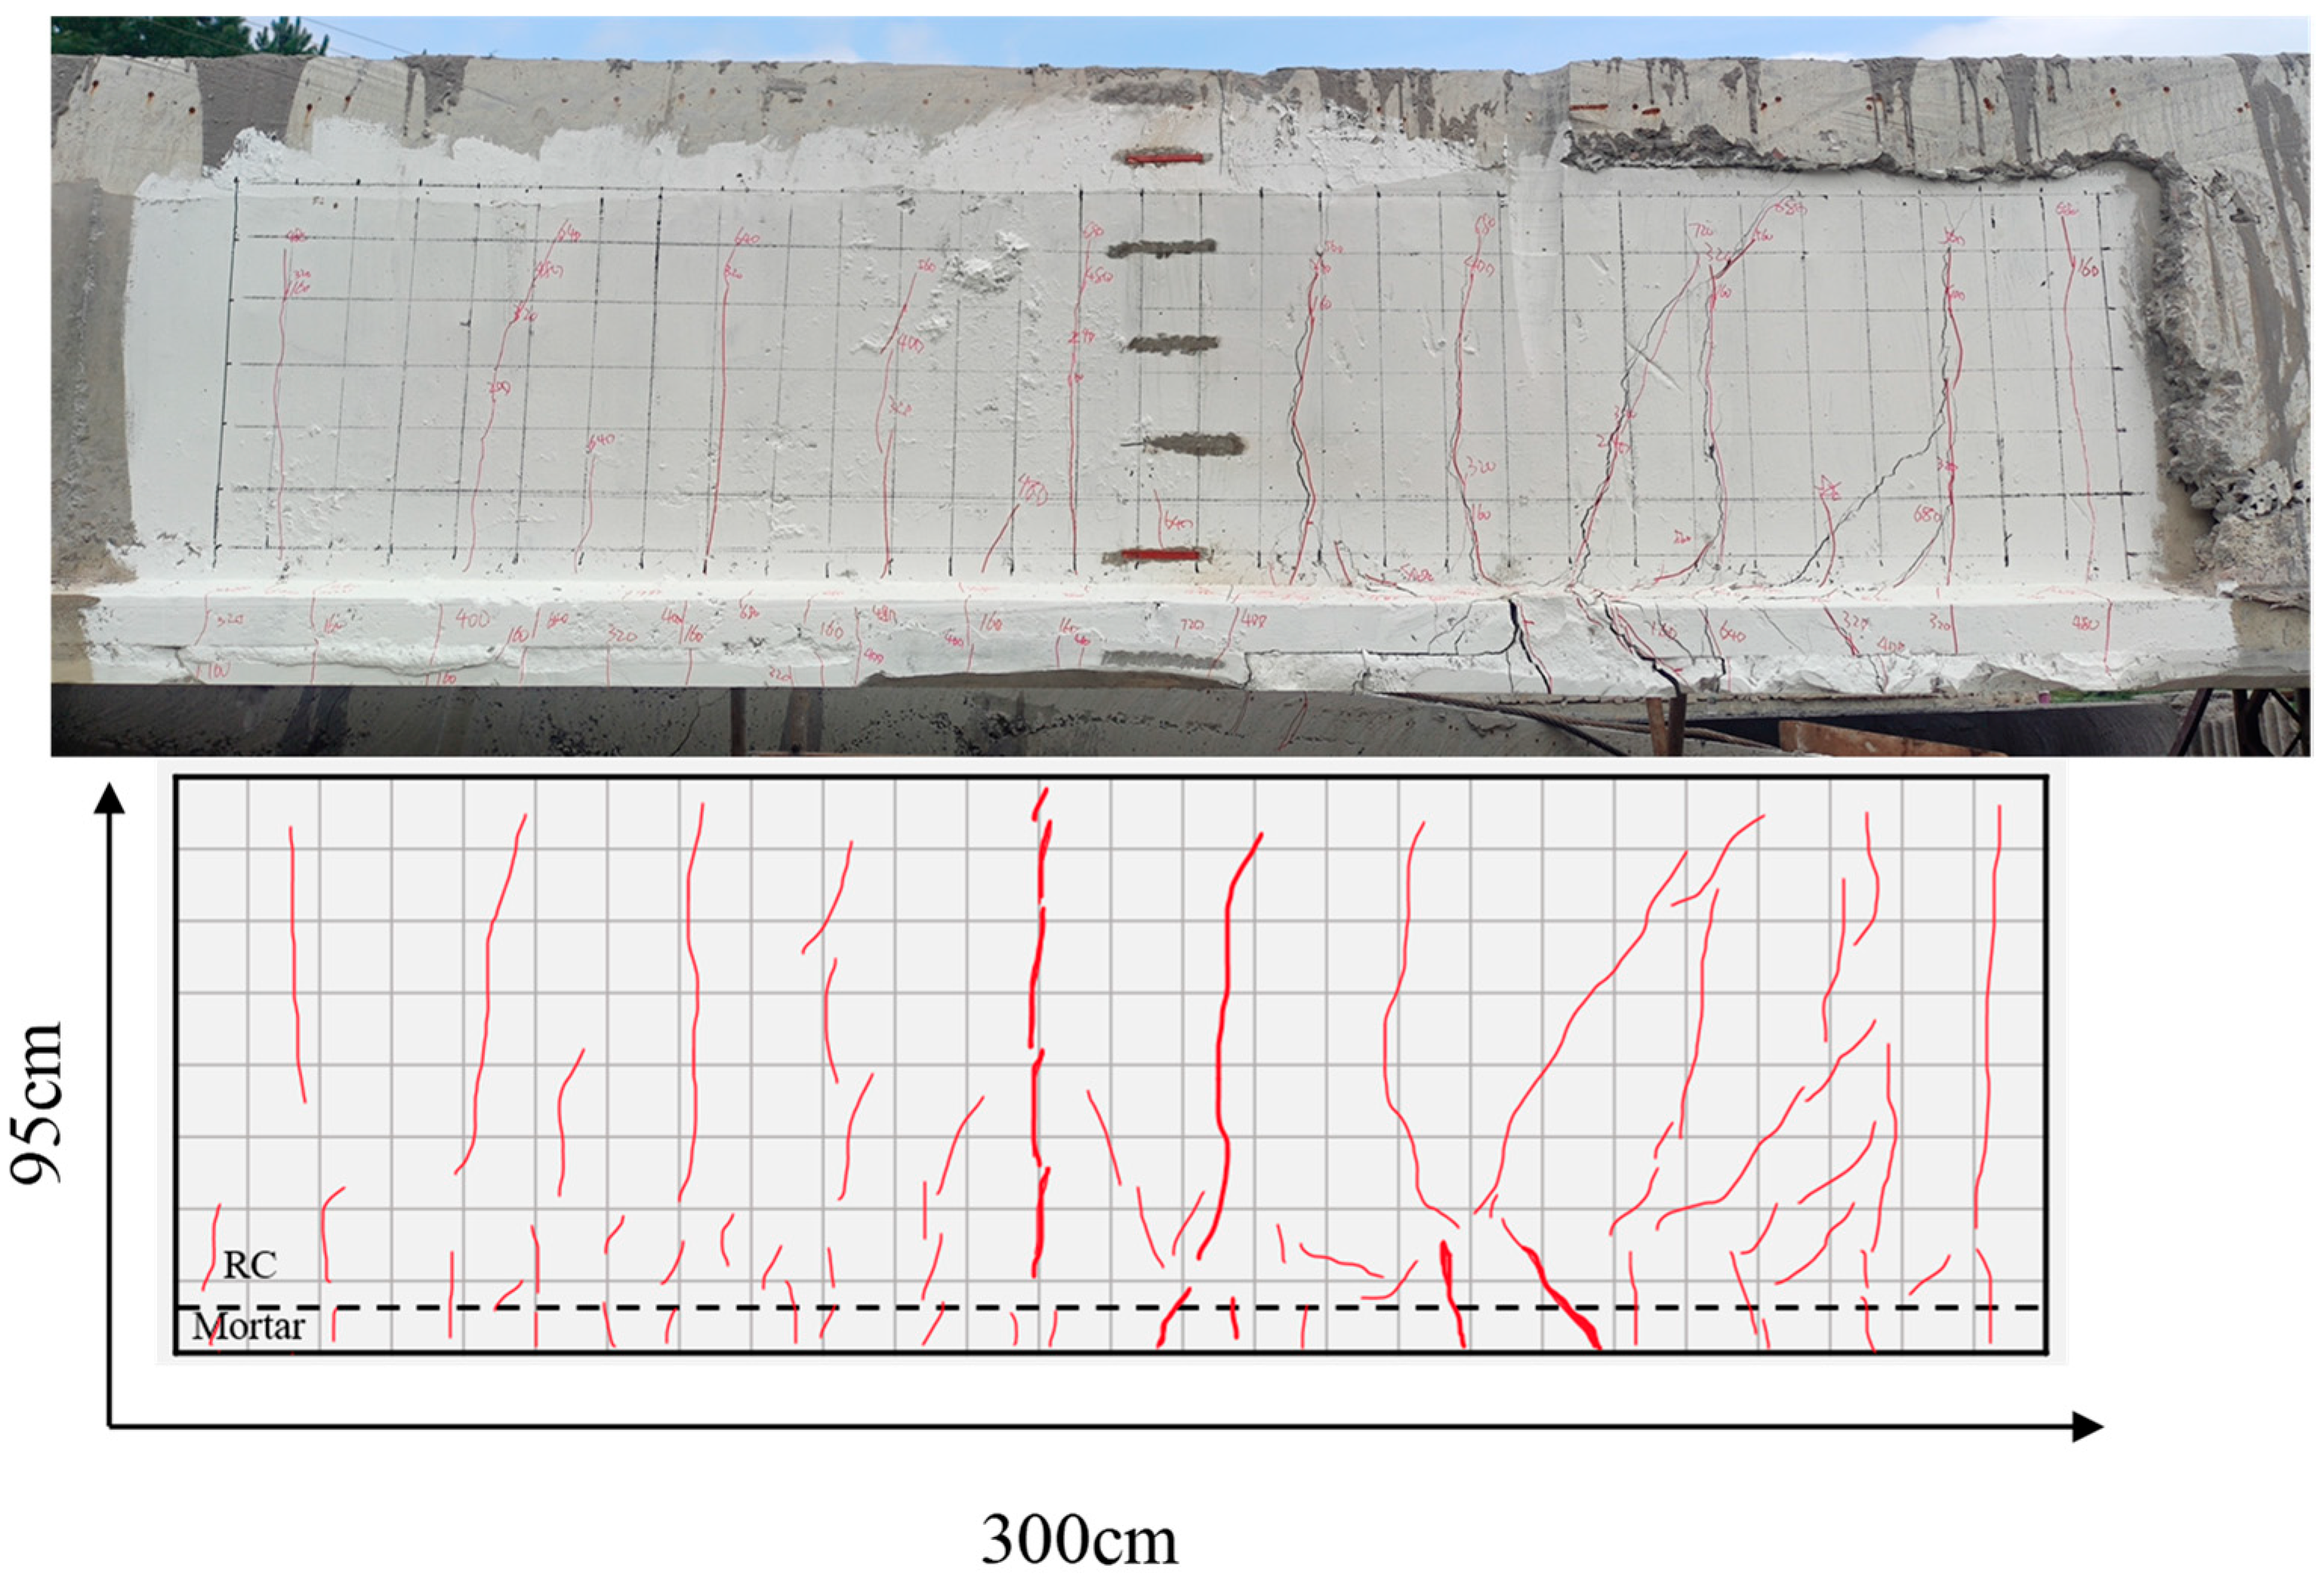
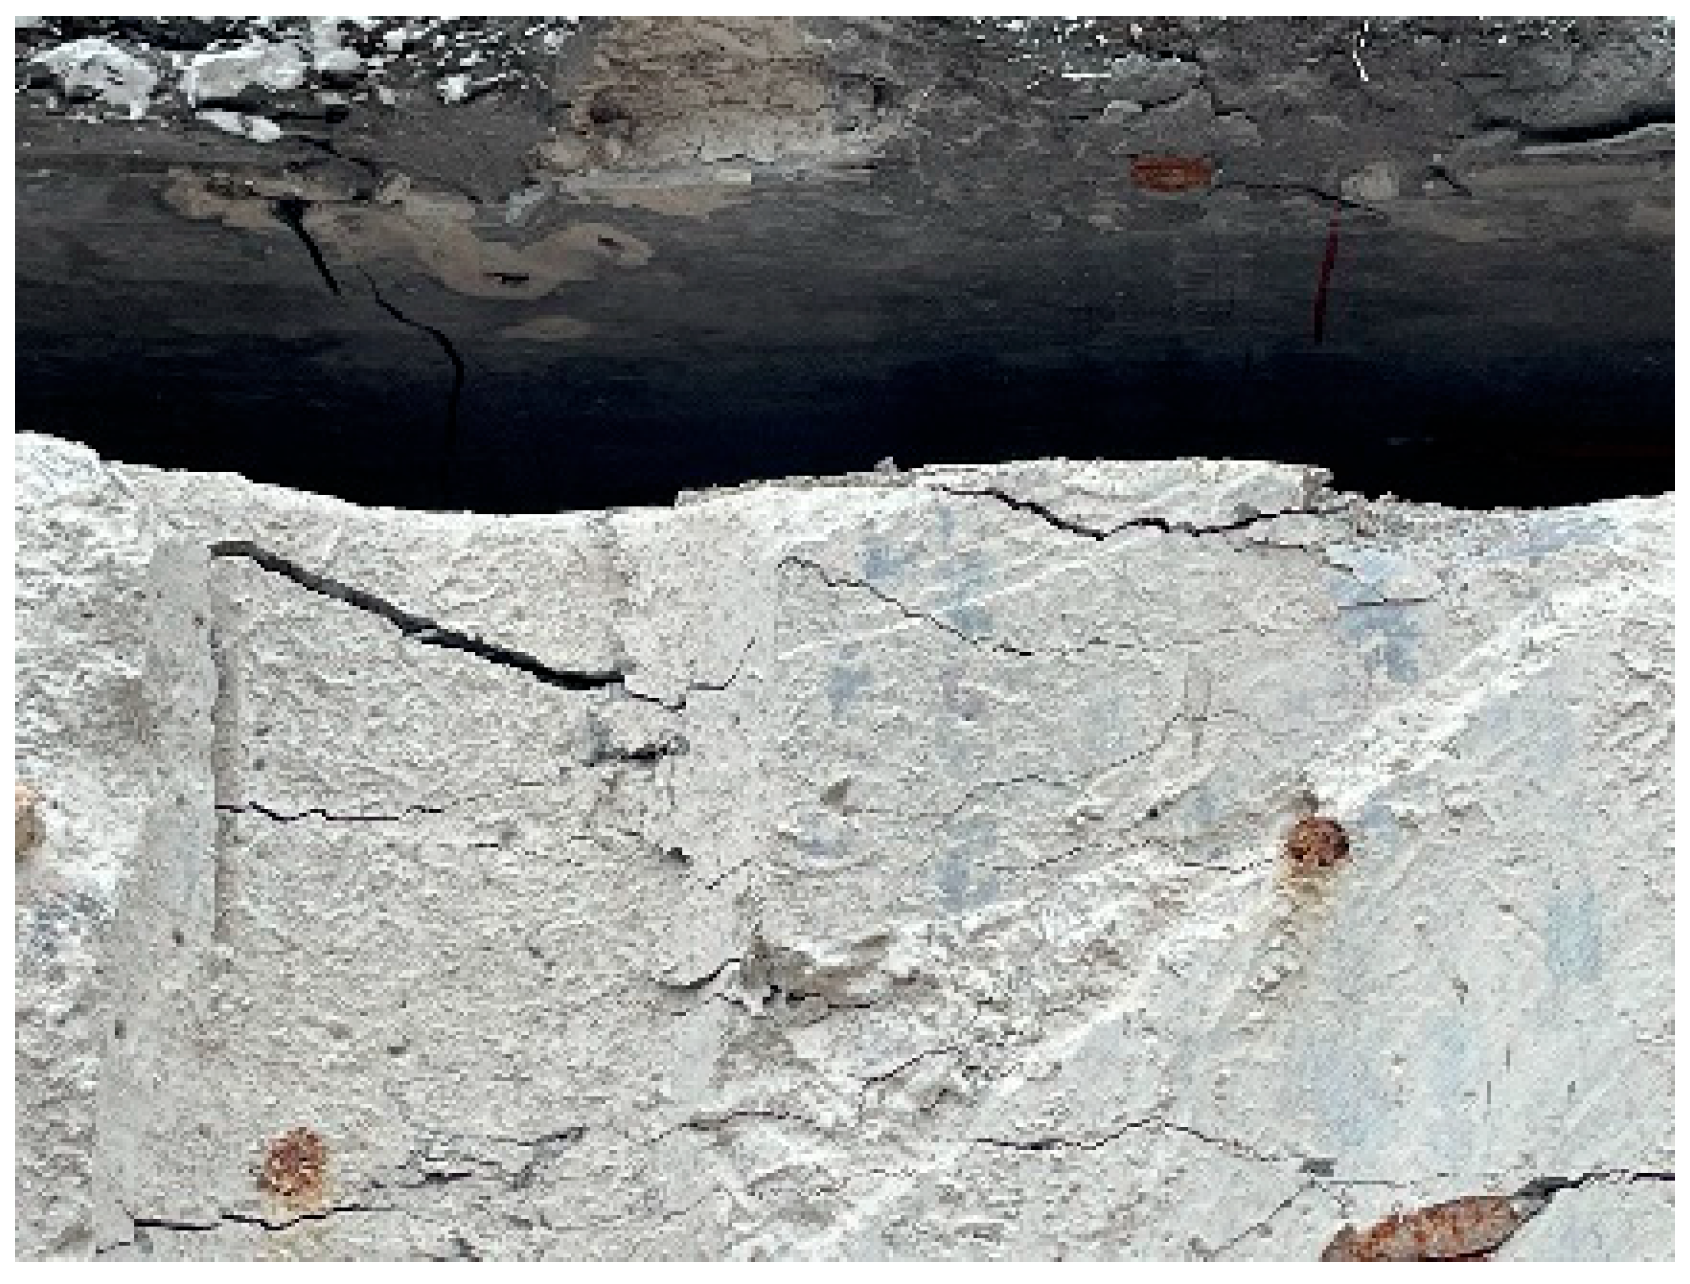
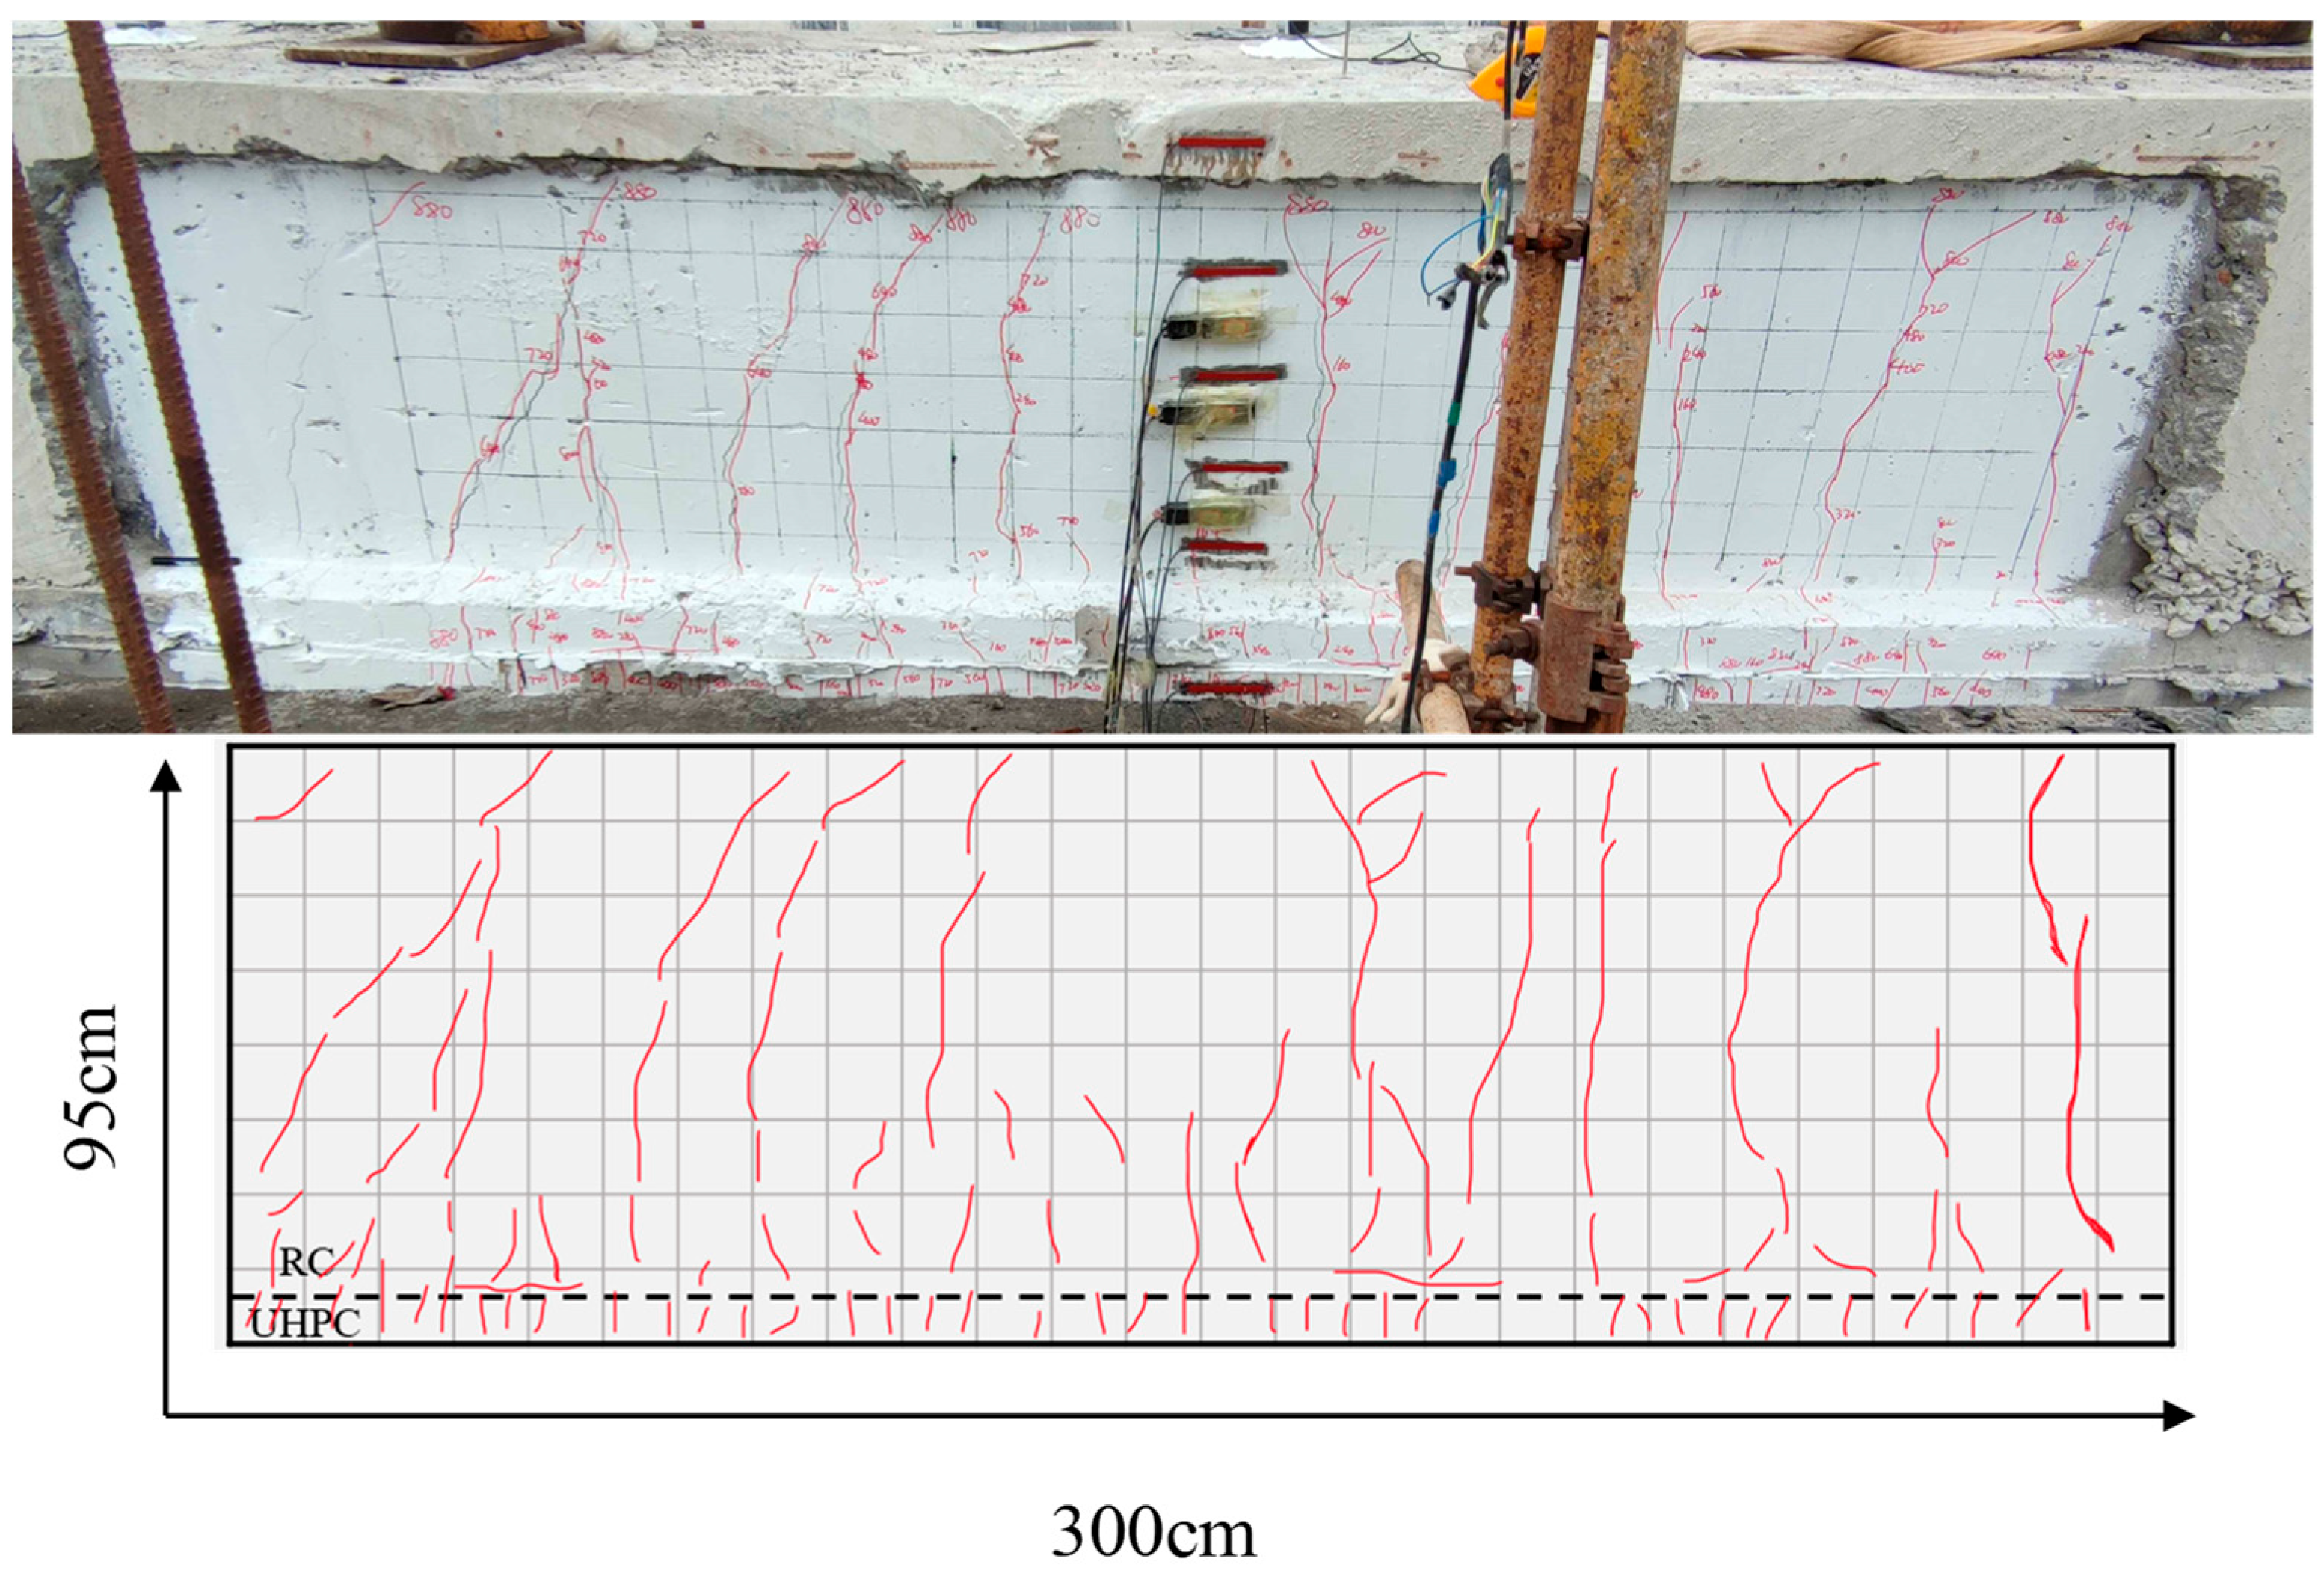
3.1. Failure Process
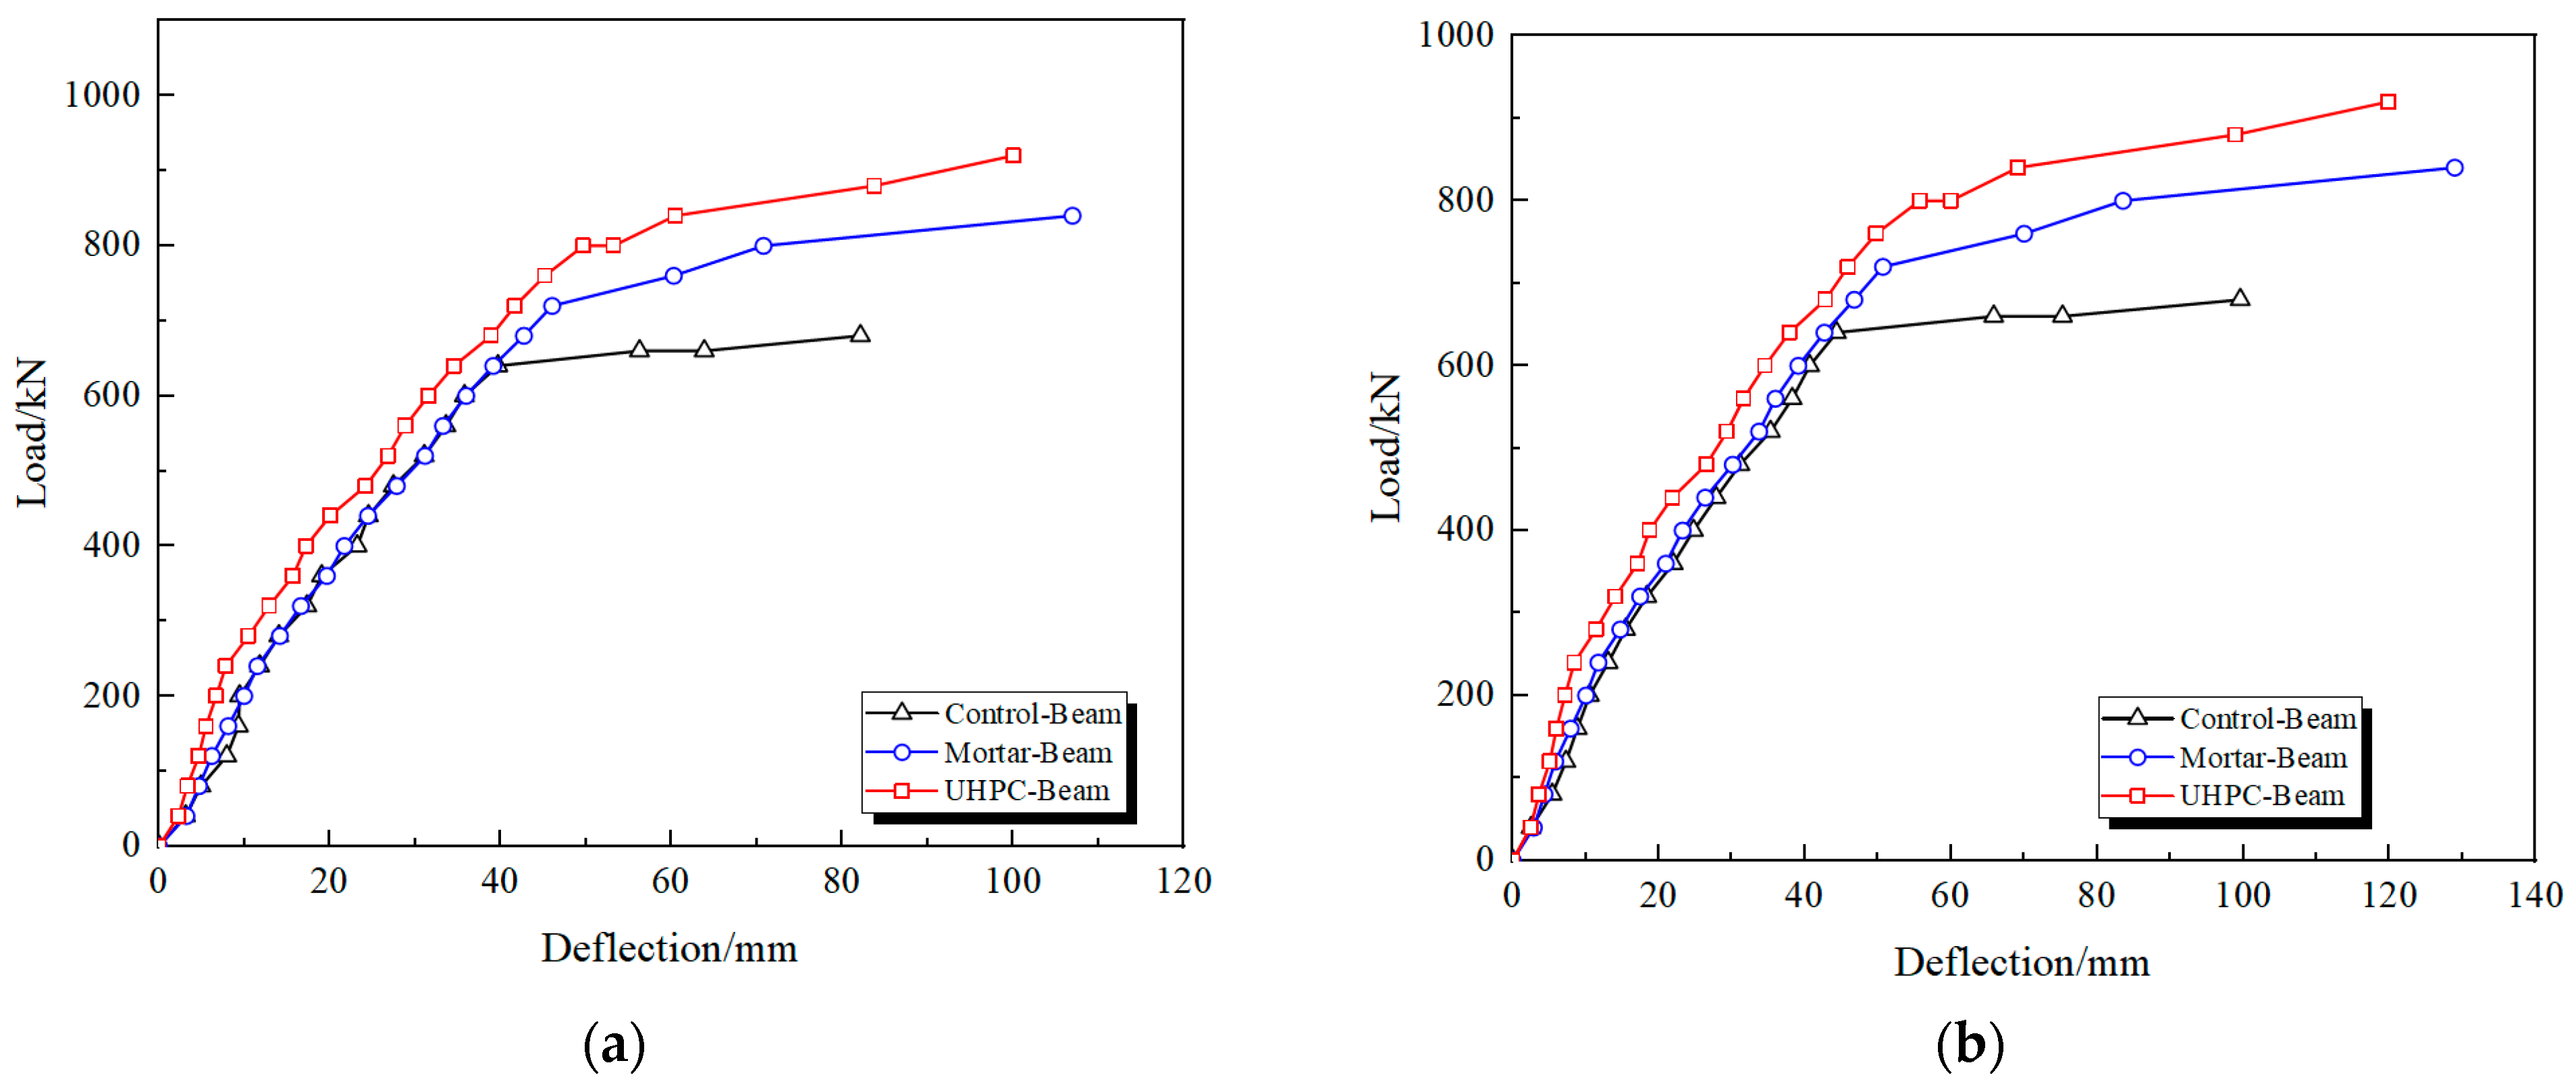
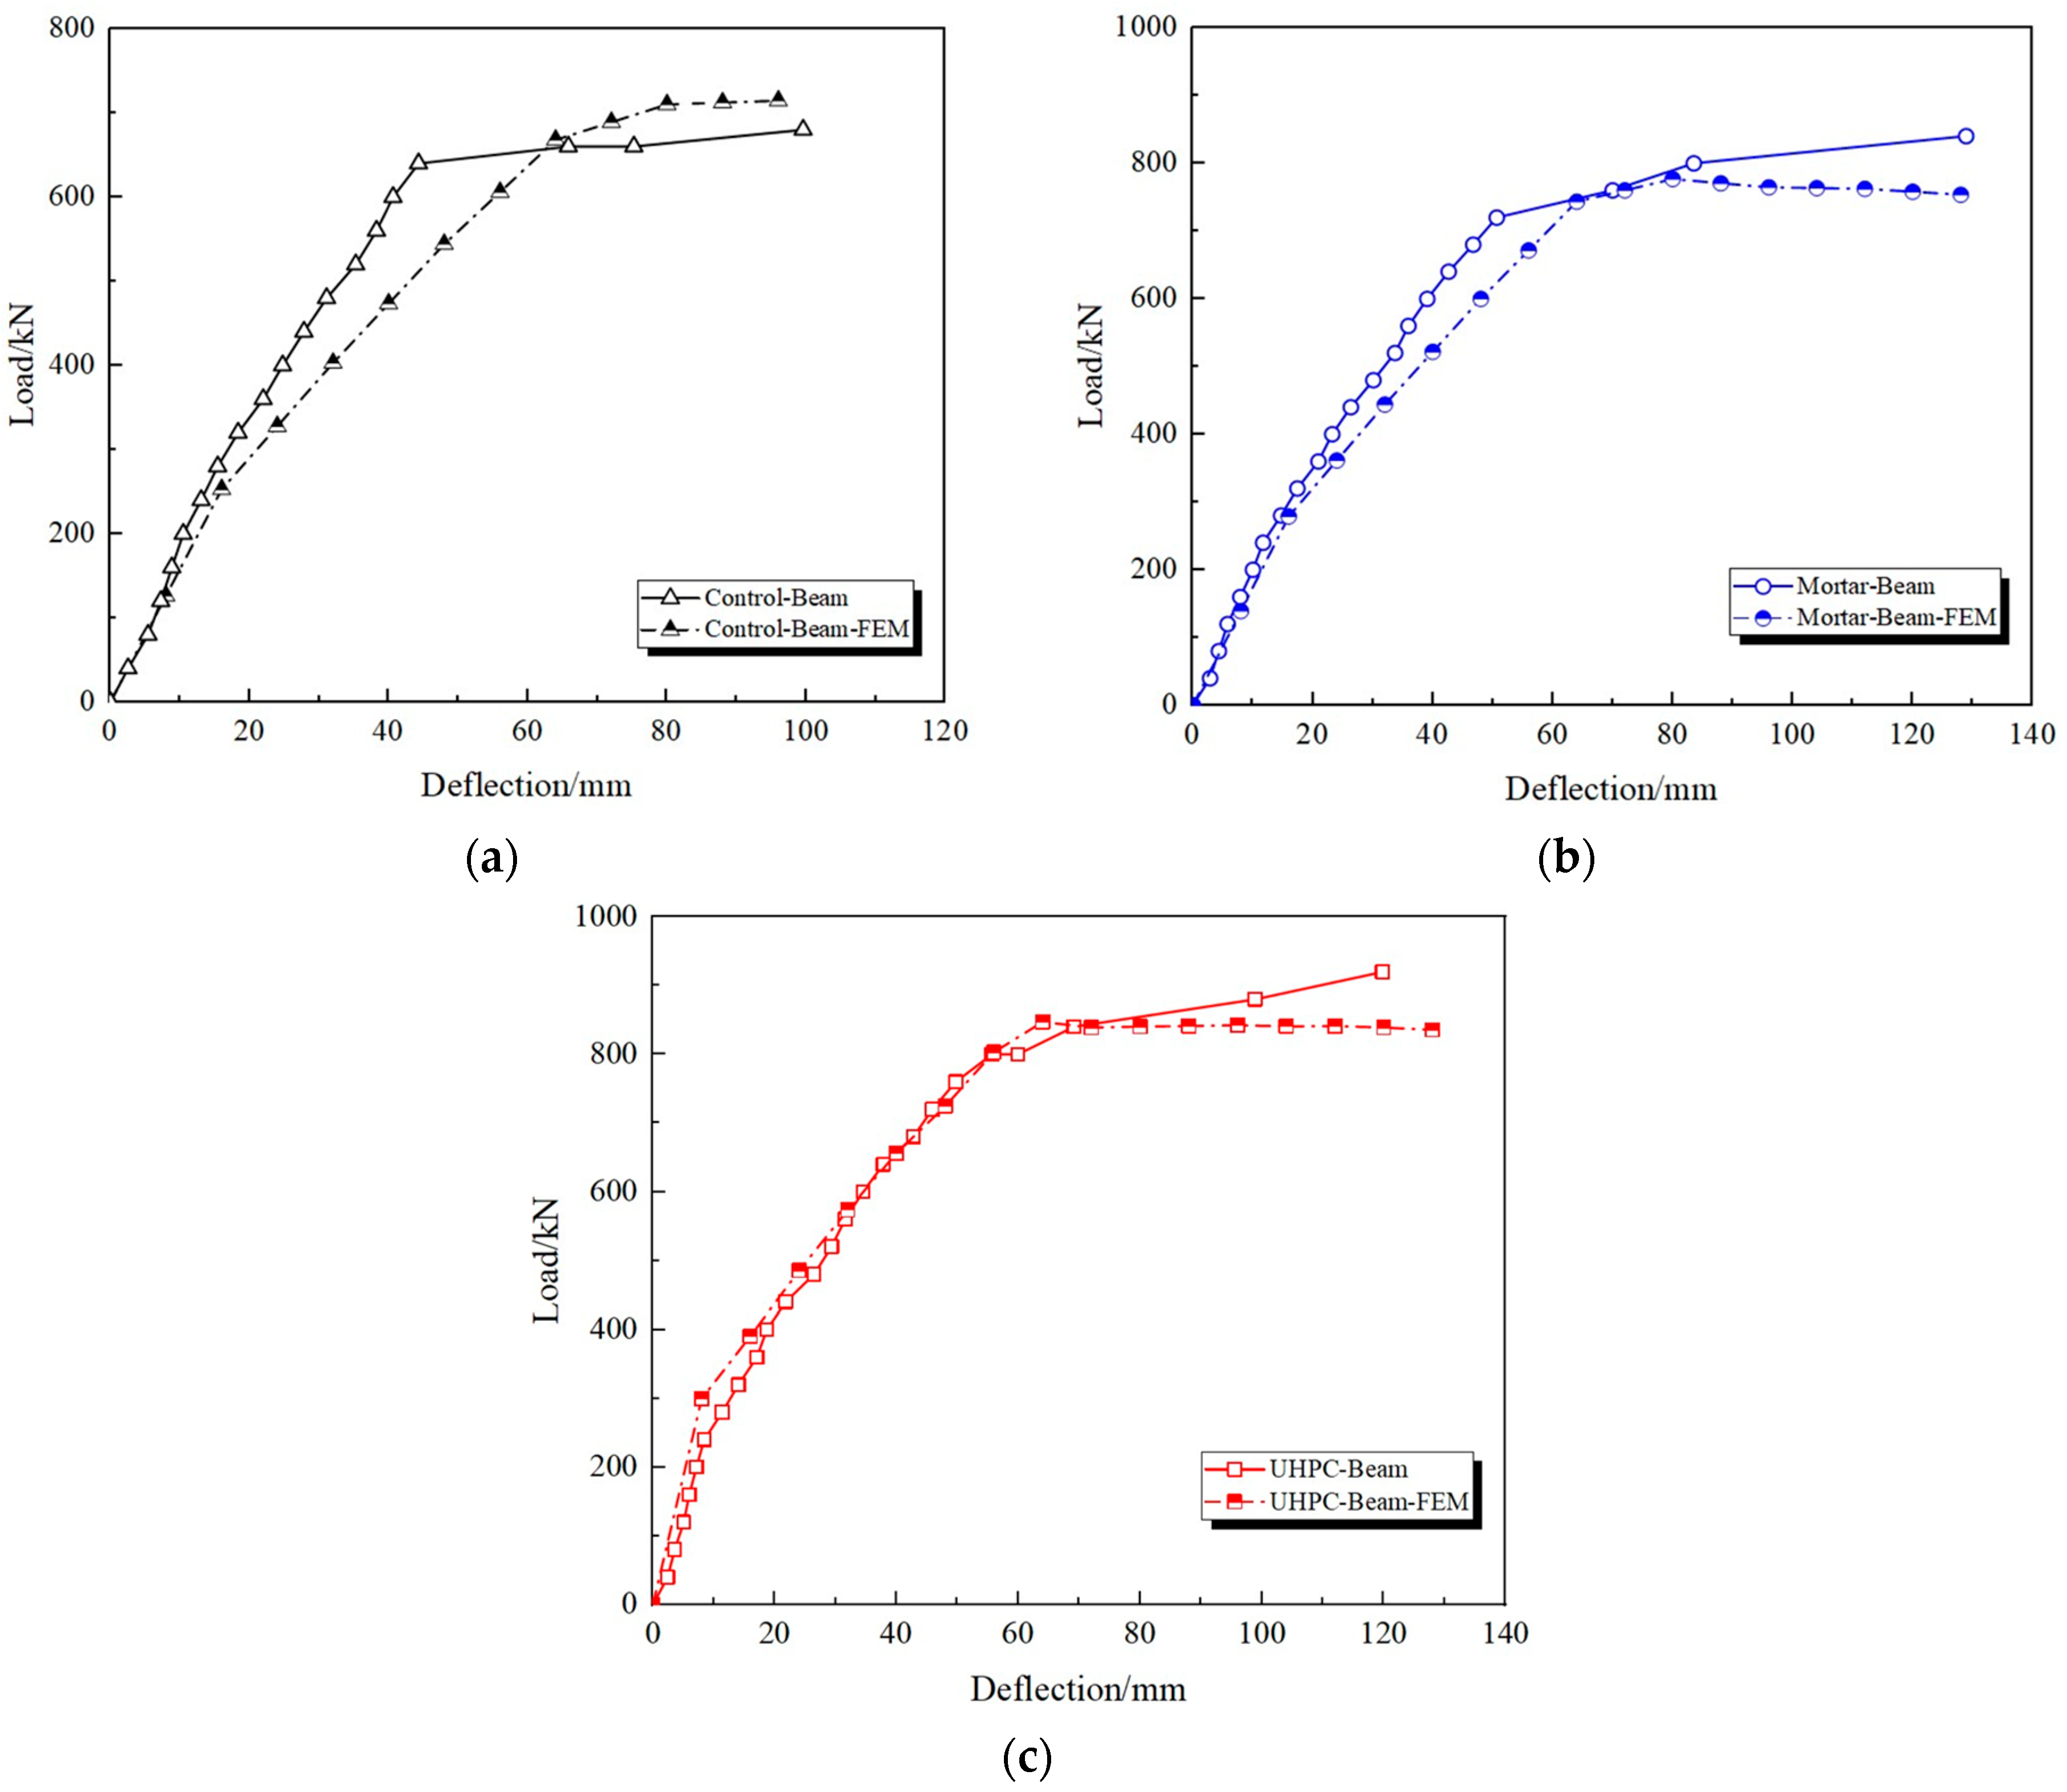
3.2. Load-Deflection Curves
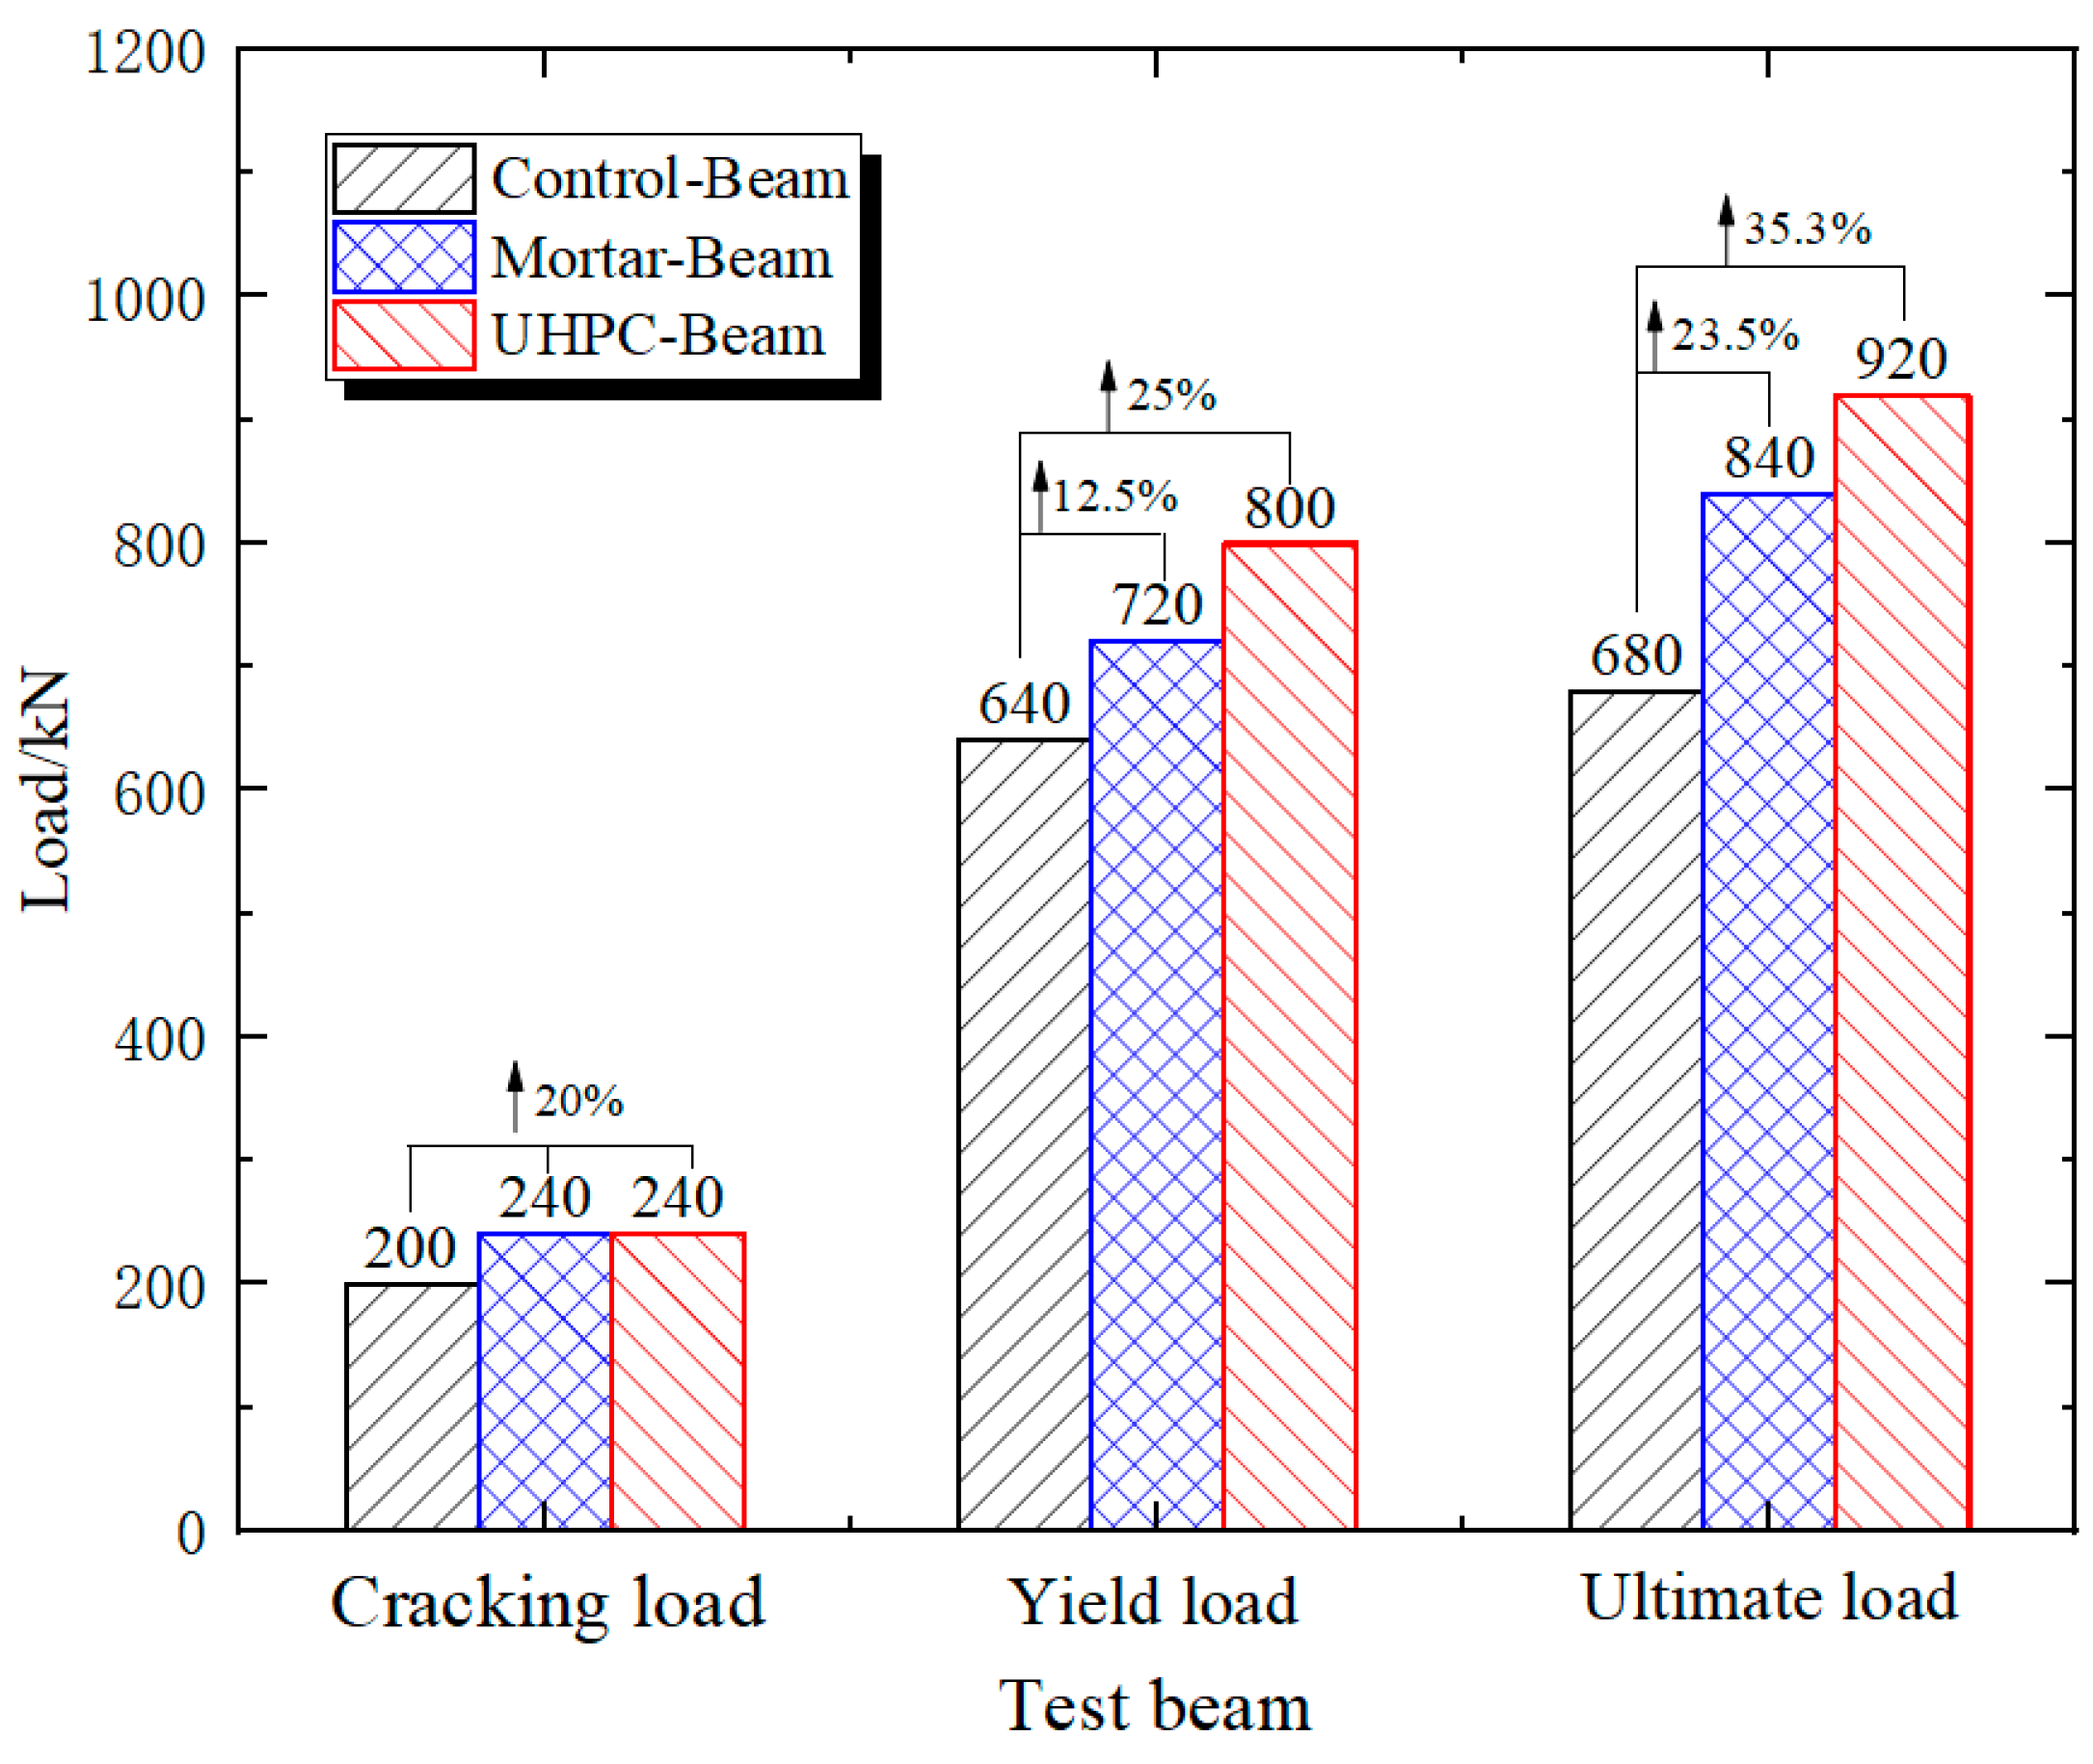
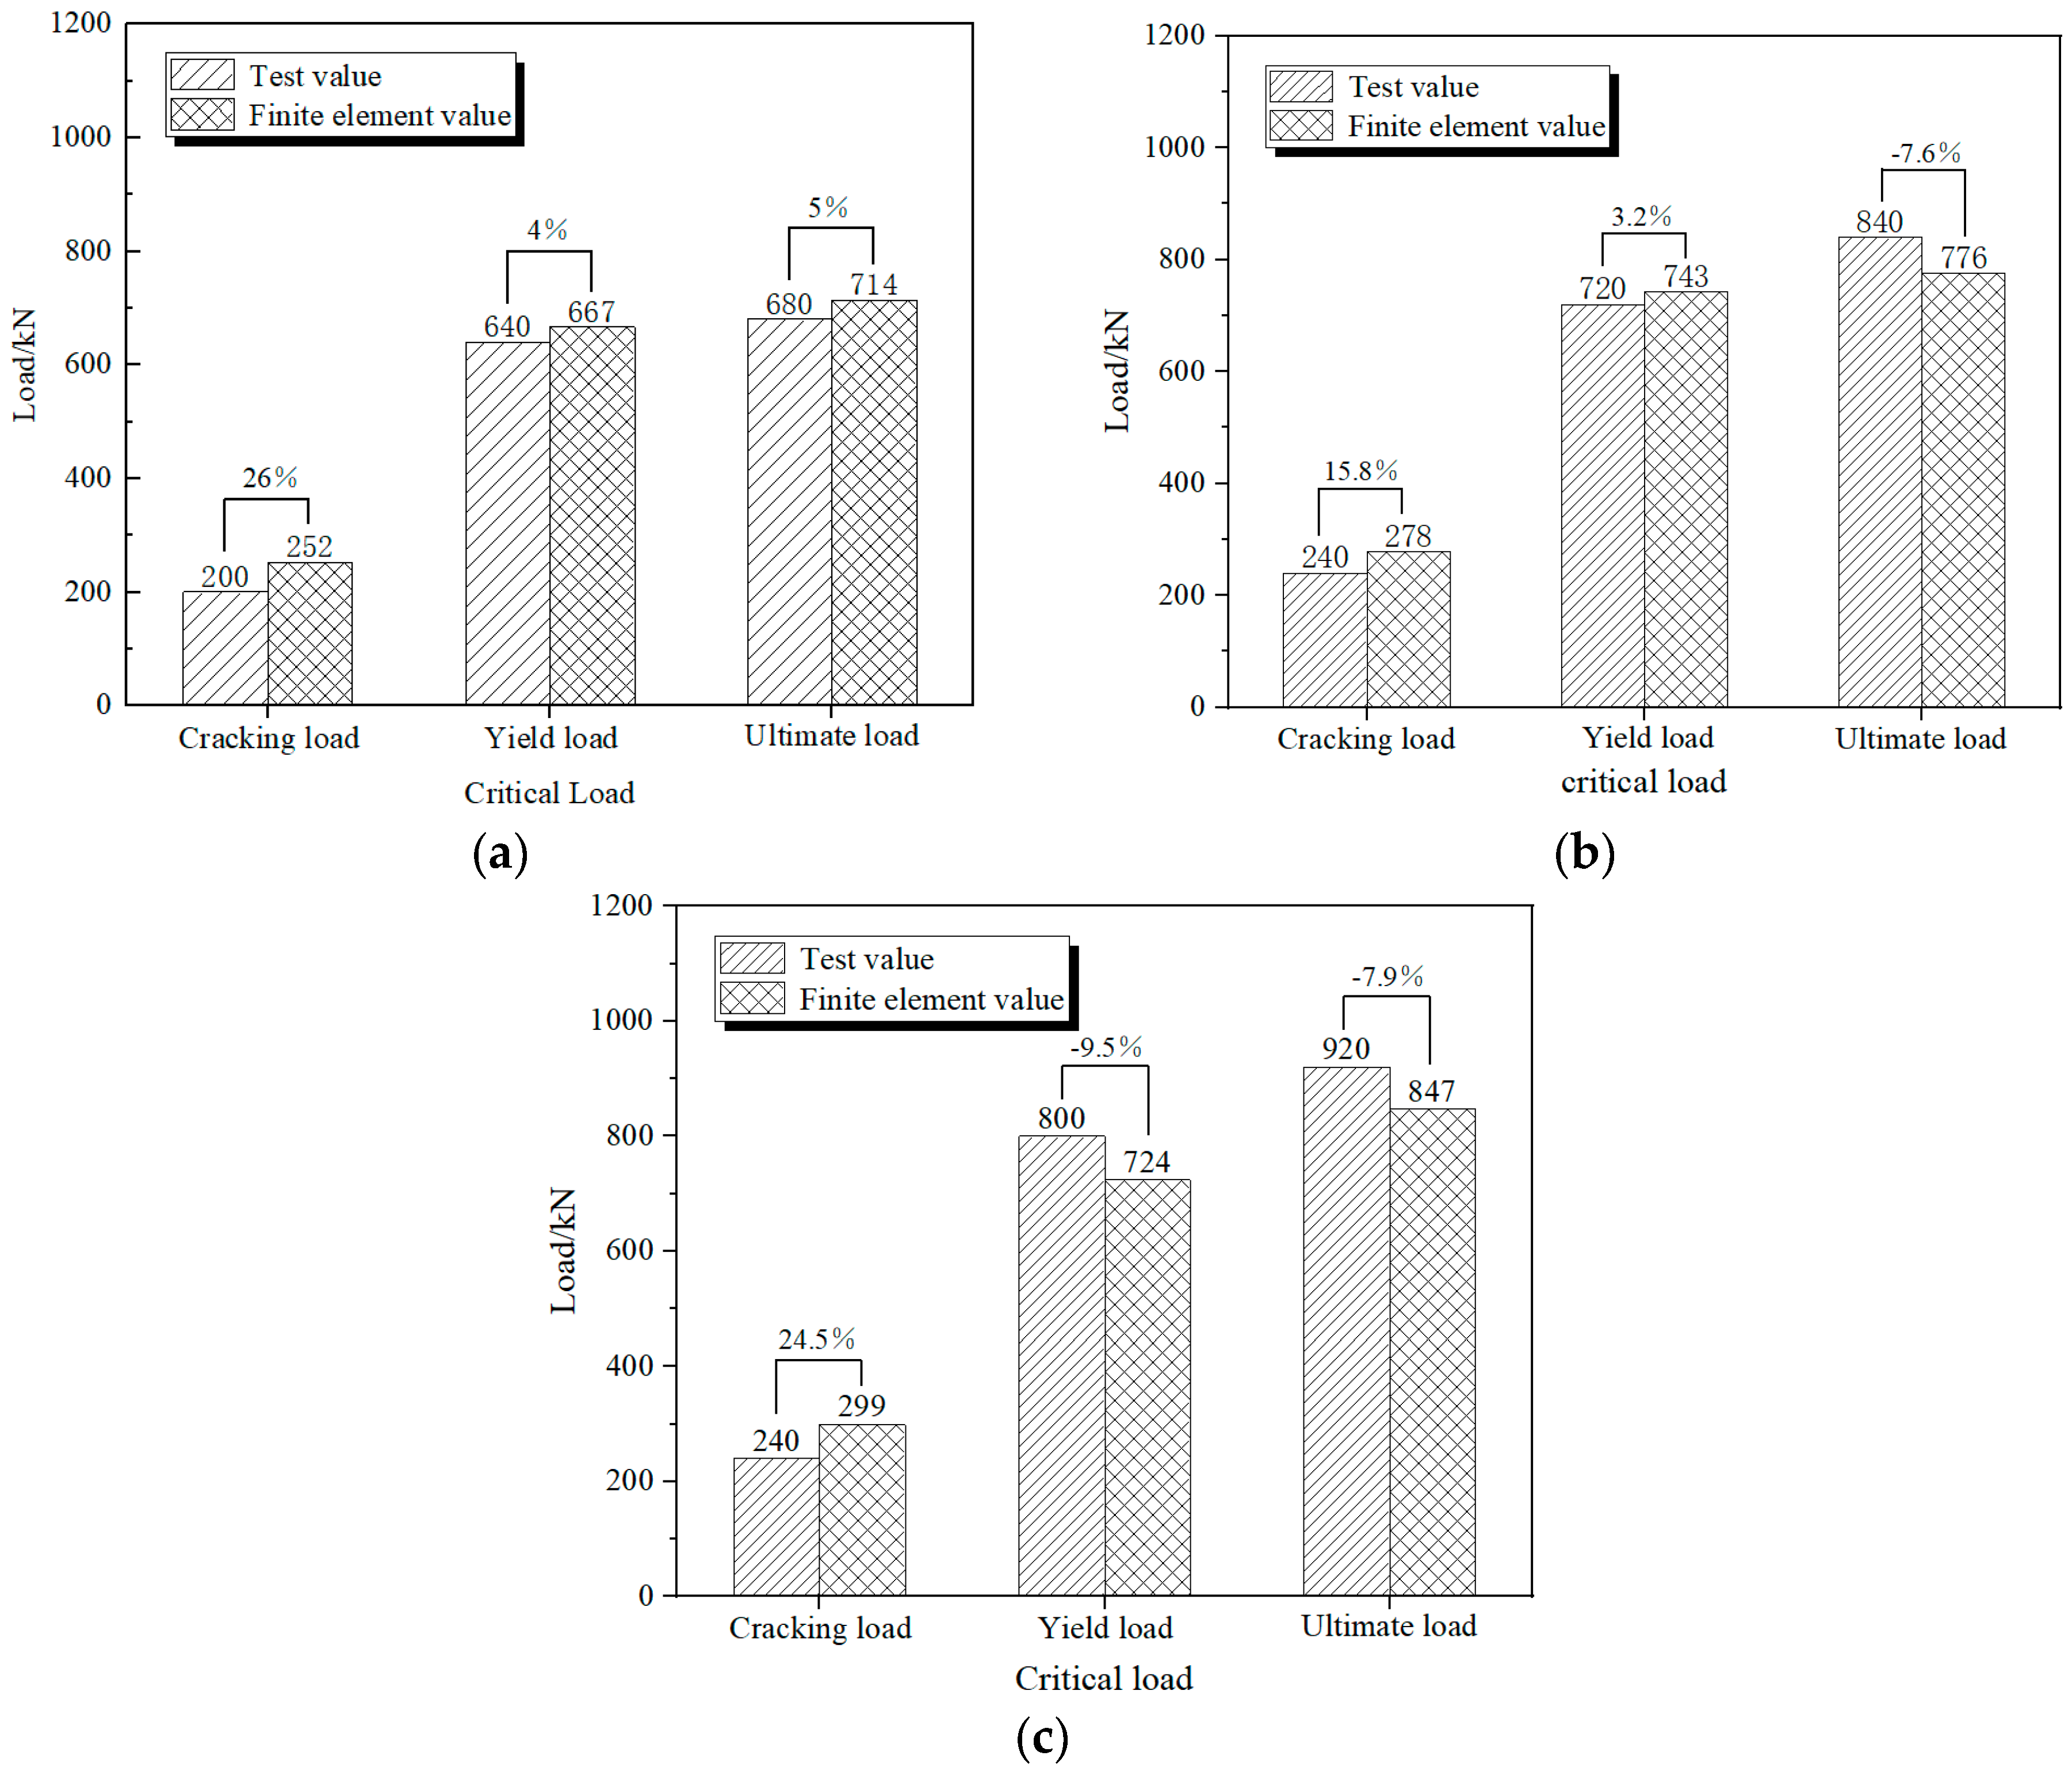
3.3. Critical Load
3.4. Stiffness
3.5. Ductility
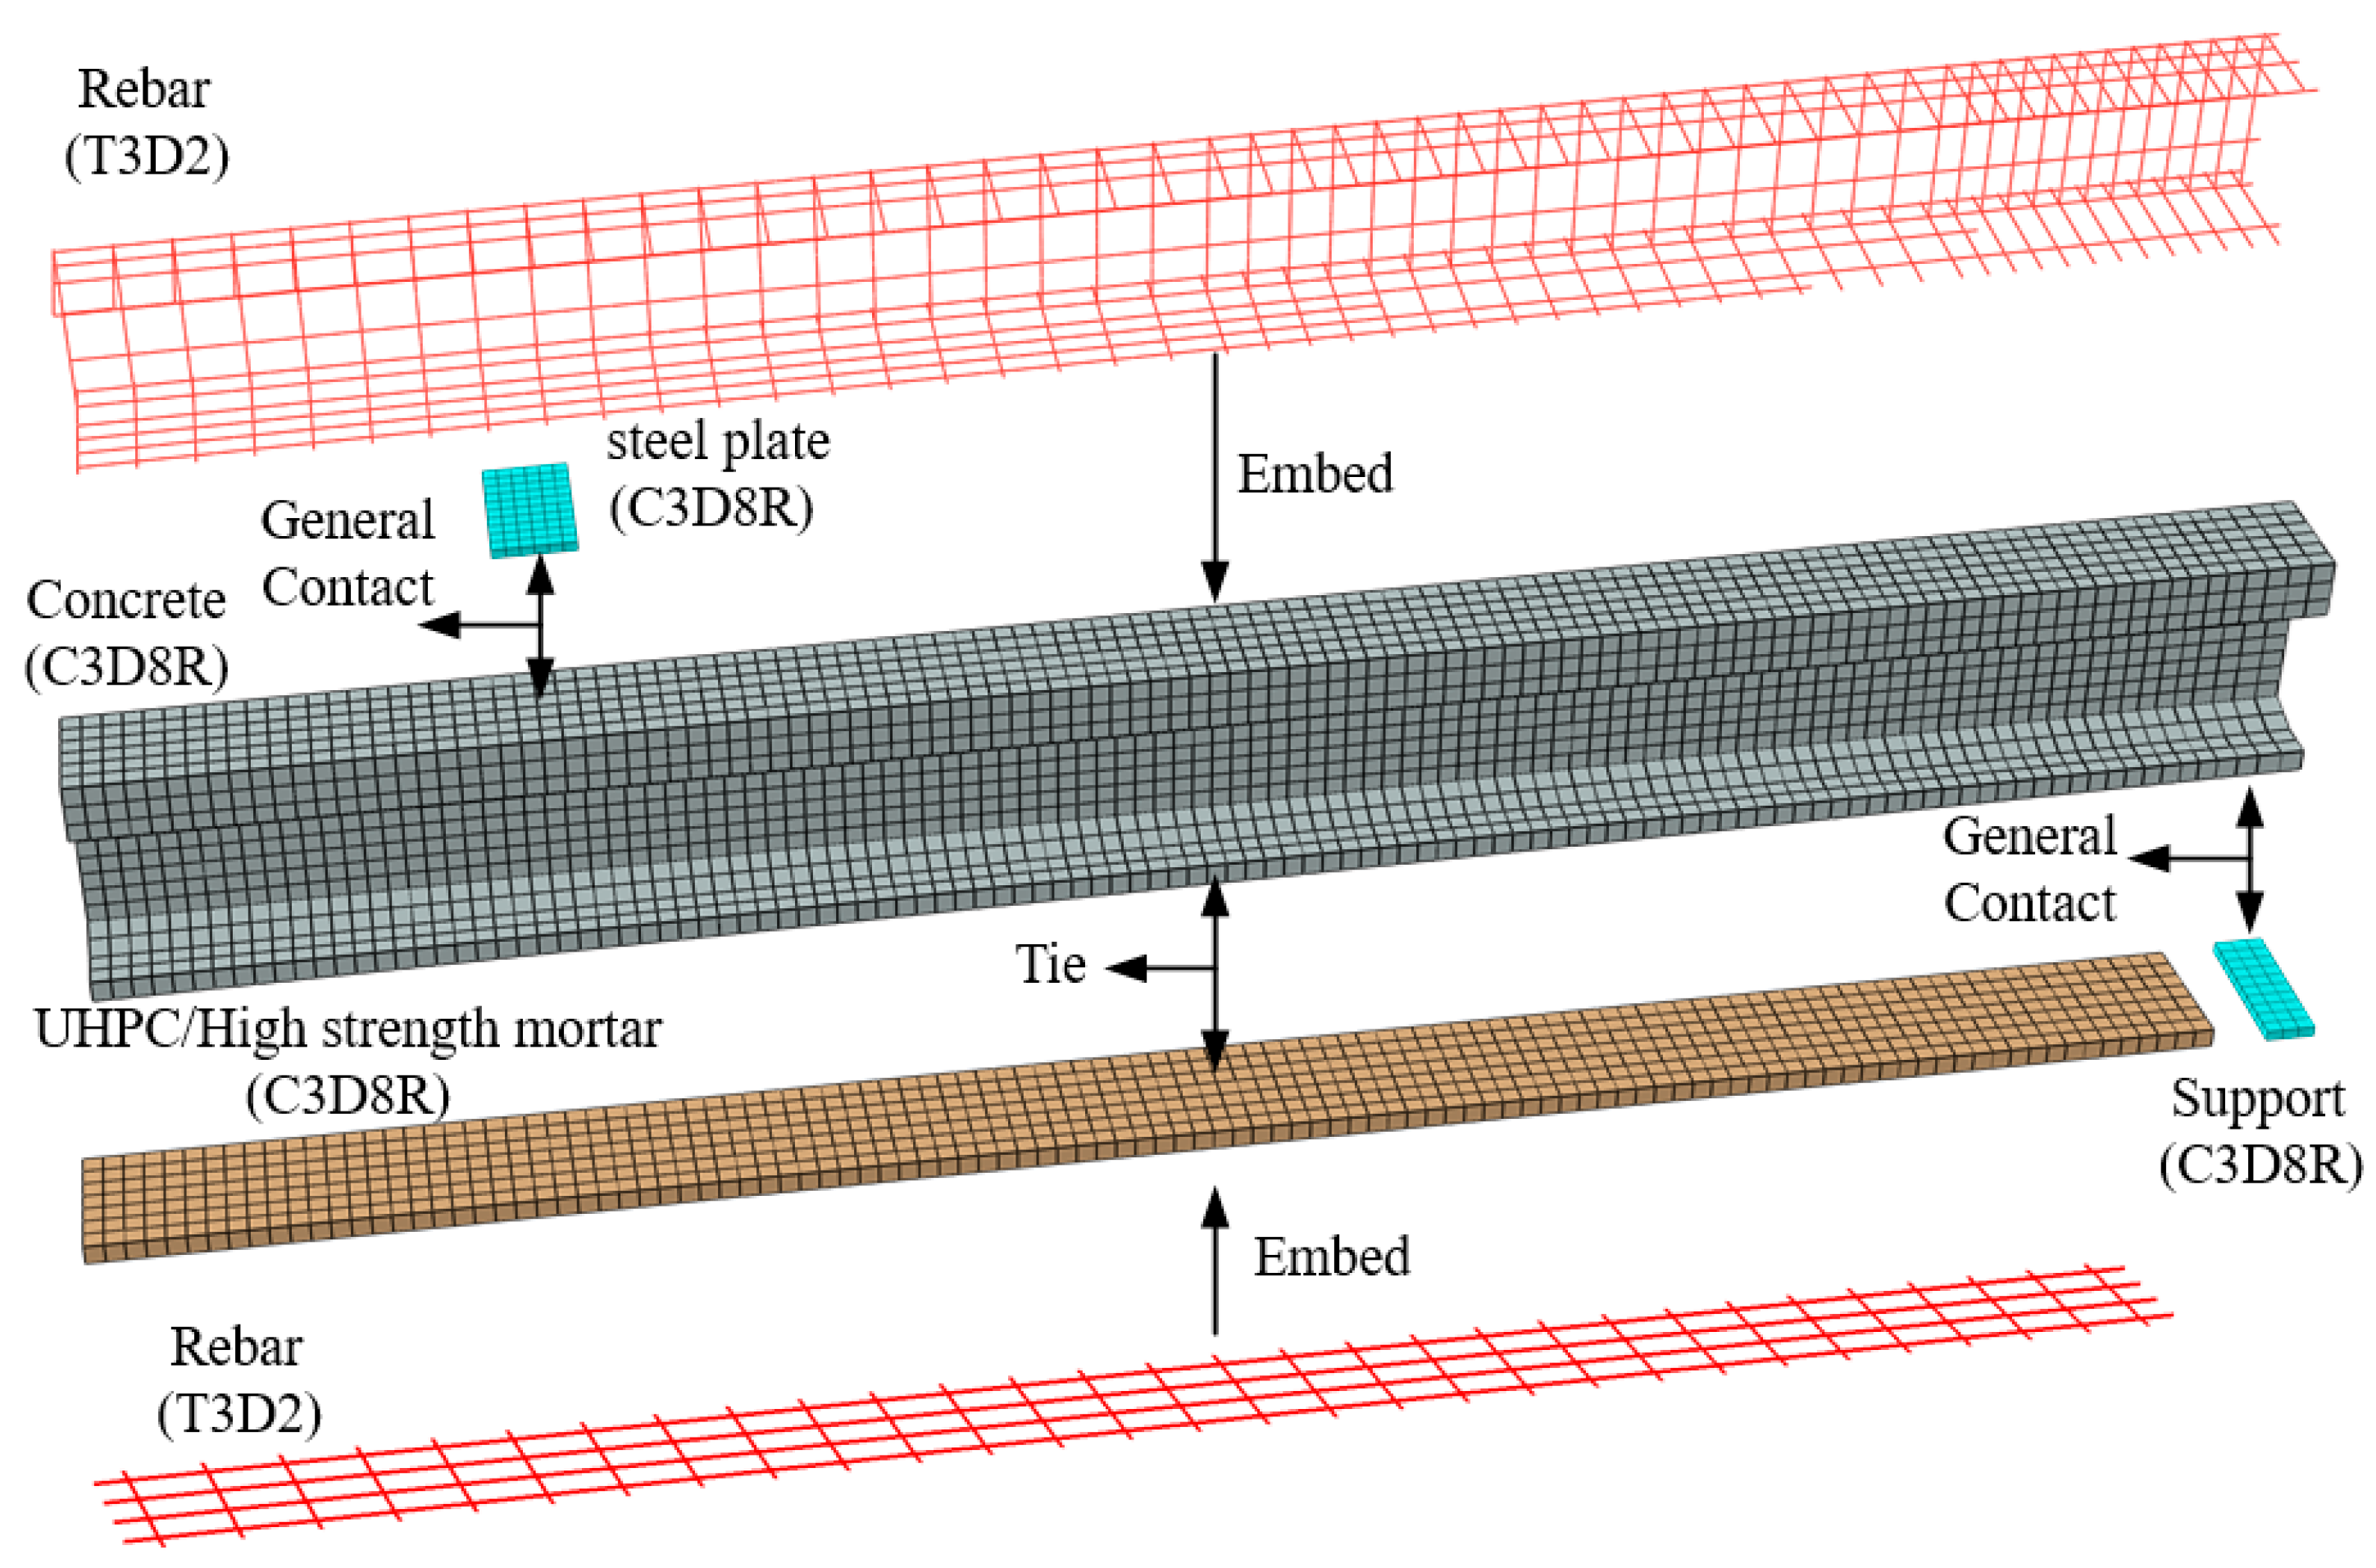
4. Finite Element Model
4.1. Element Type and Meshing
4.2. Material Constitutive Properties
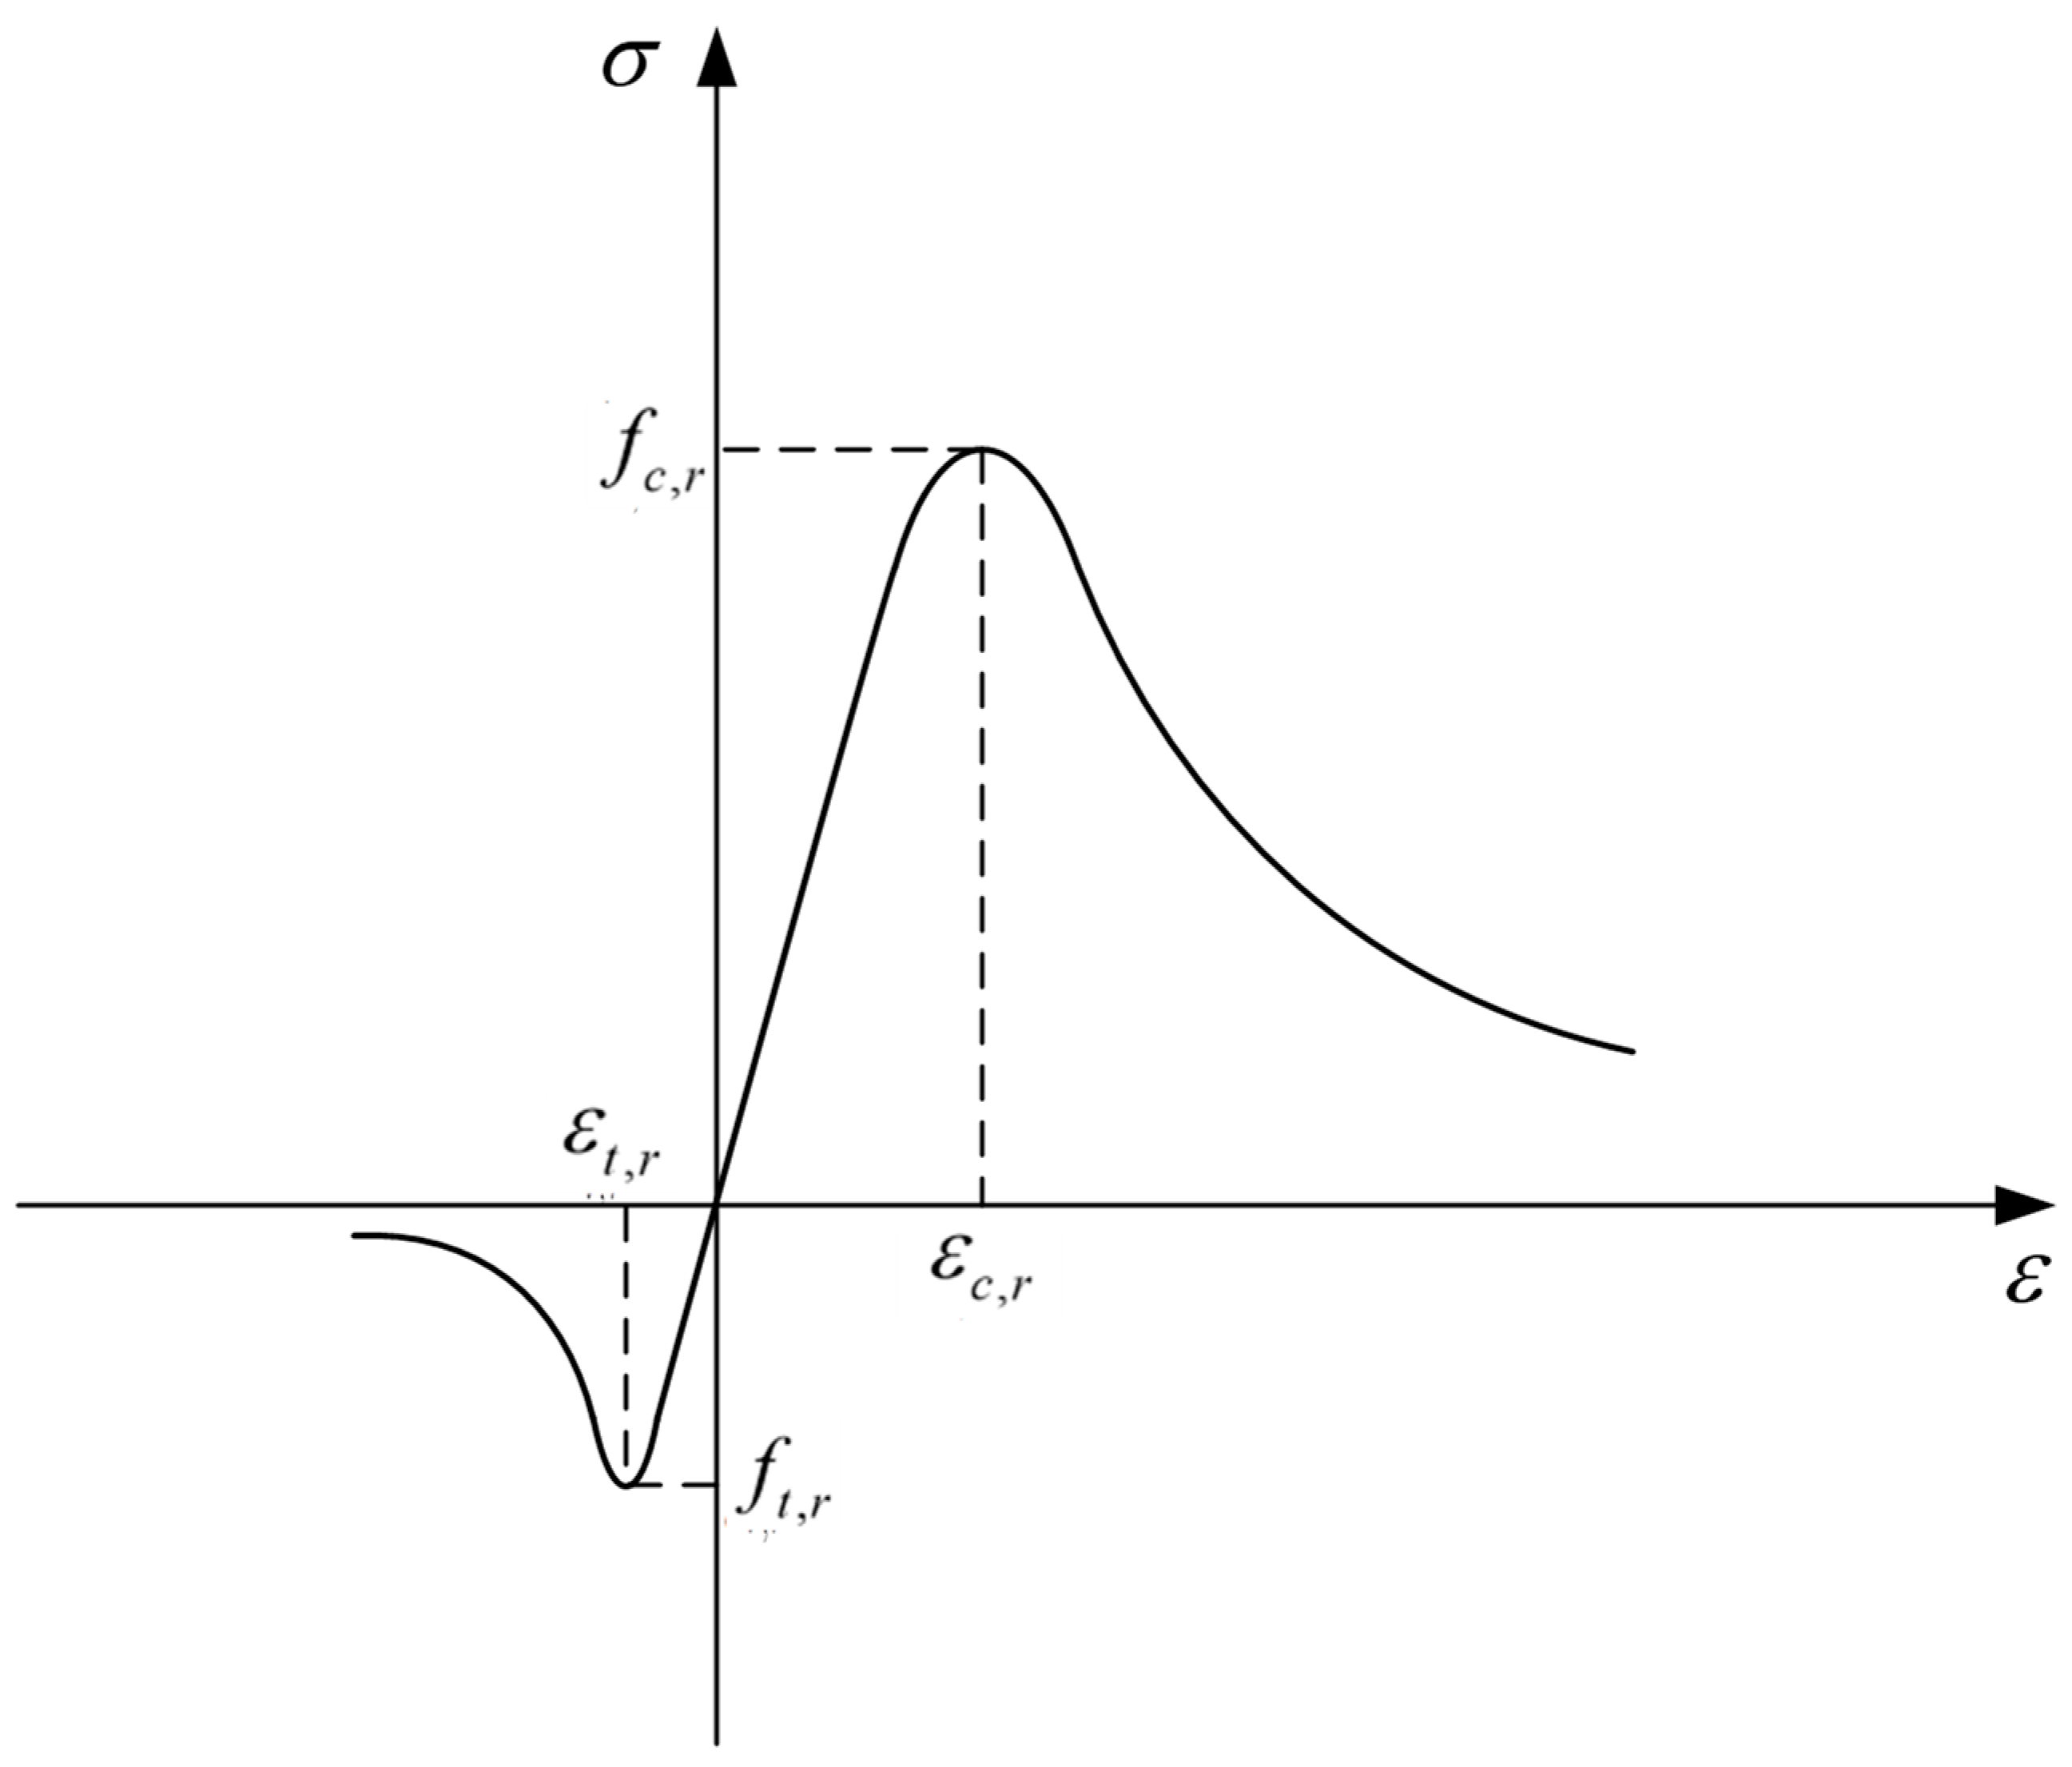
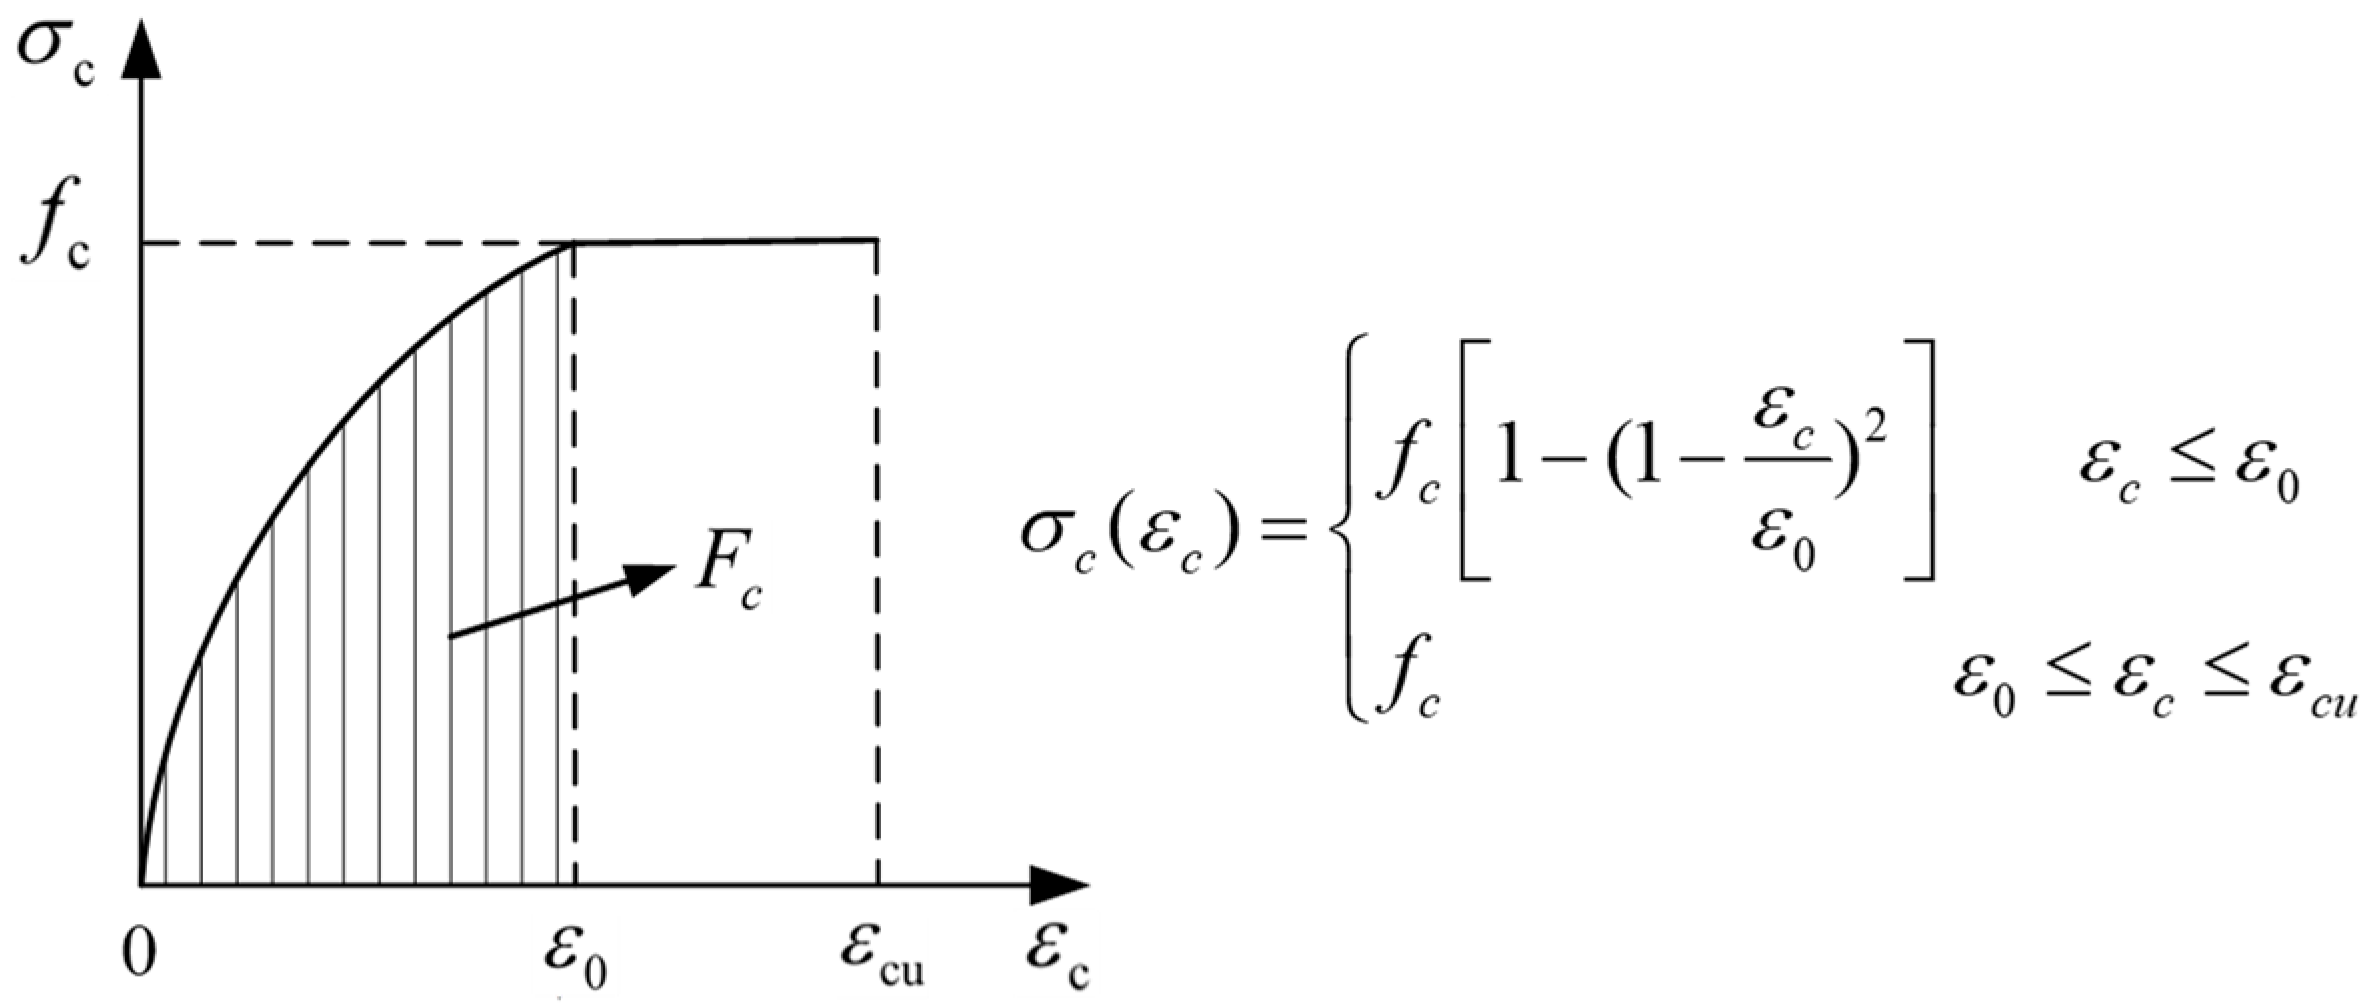
4.2.1. Concrete
- (1)
- Concrete under uniaxial compression:where denotes the parameter value of the descending section of the stress–strain curve of concrete under uniaxial compression, denotes the uniaxial compressive strength of concrete, denotes the peak compressive strain of concrete, denotes the damage factor of concrete under uniaxial compression, and denotes the elastic modulus of concrete.
- (2)
- Concrete under uniaxial tension:where denotes the parameter value of the descending section of the stress–strain curve of concrete under uniaxial tension, denotes the uniaxial tensile strength of concrete, denotes the peak tensile strain of concrete, and denotes the damage factor of concrete under uniaxial compression.
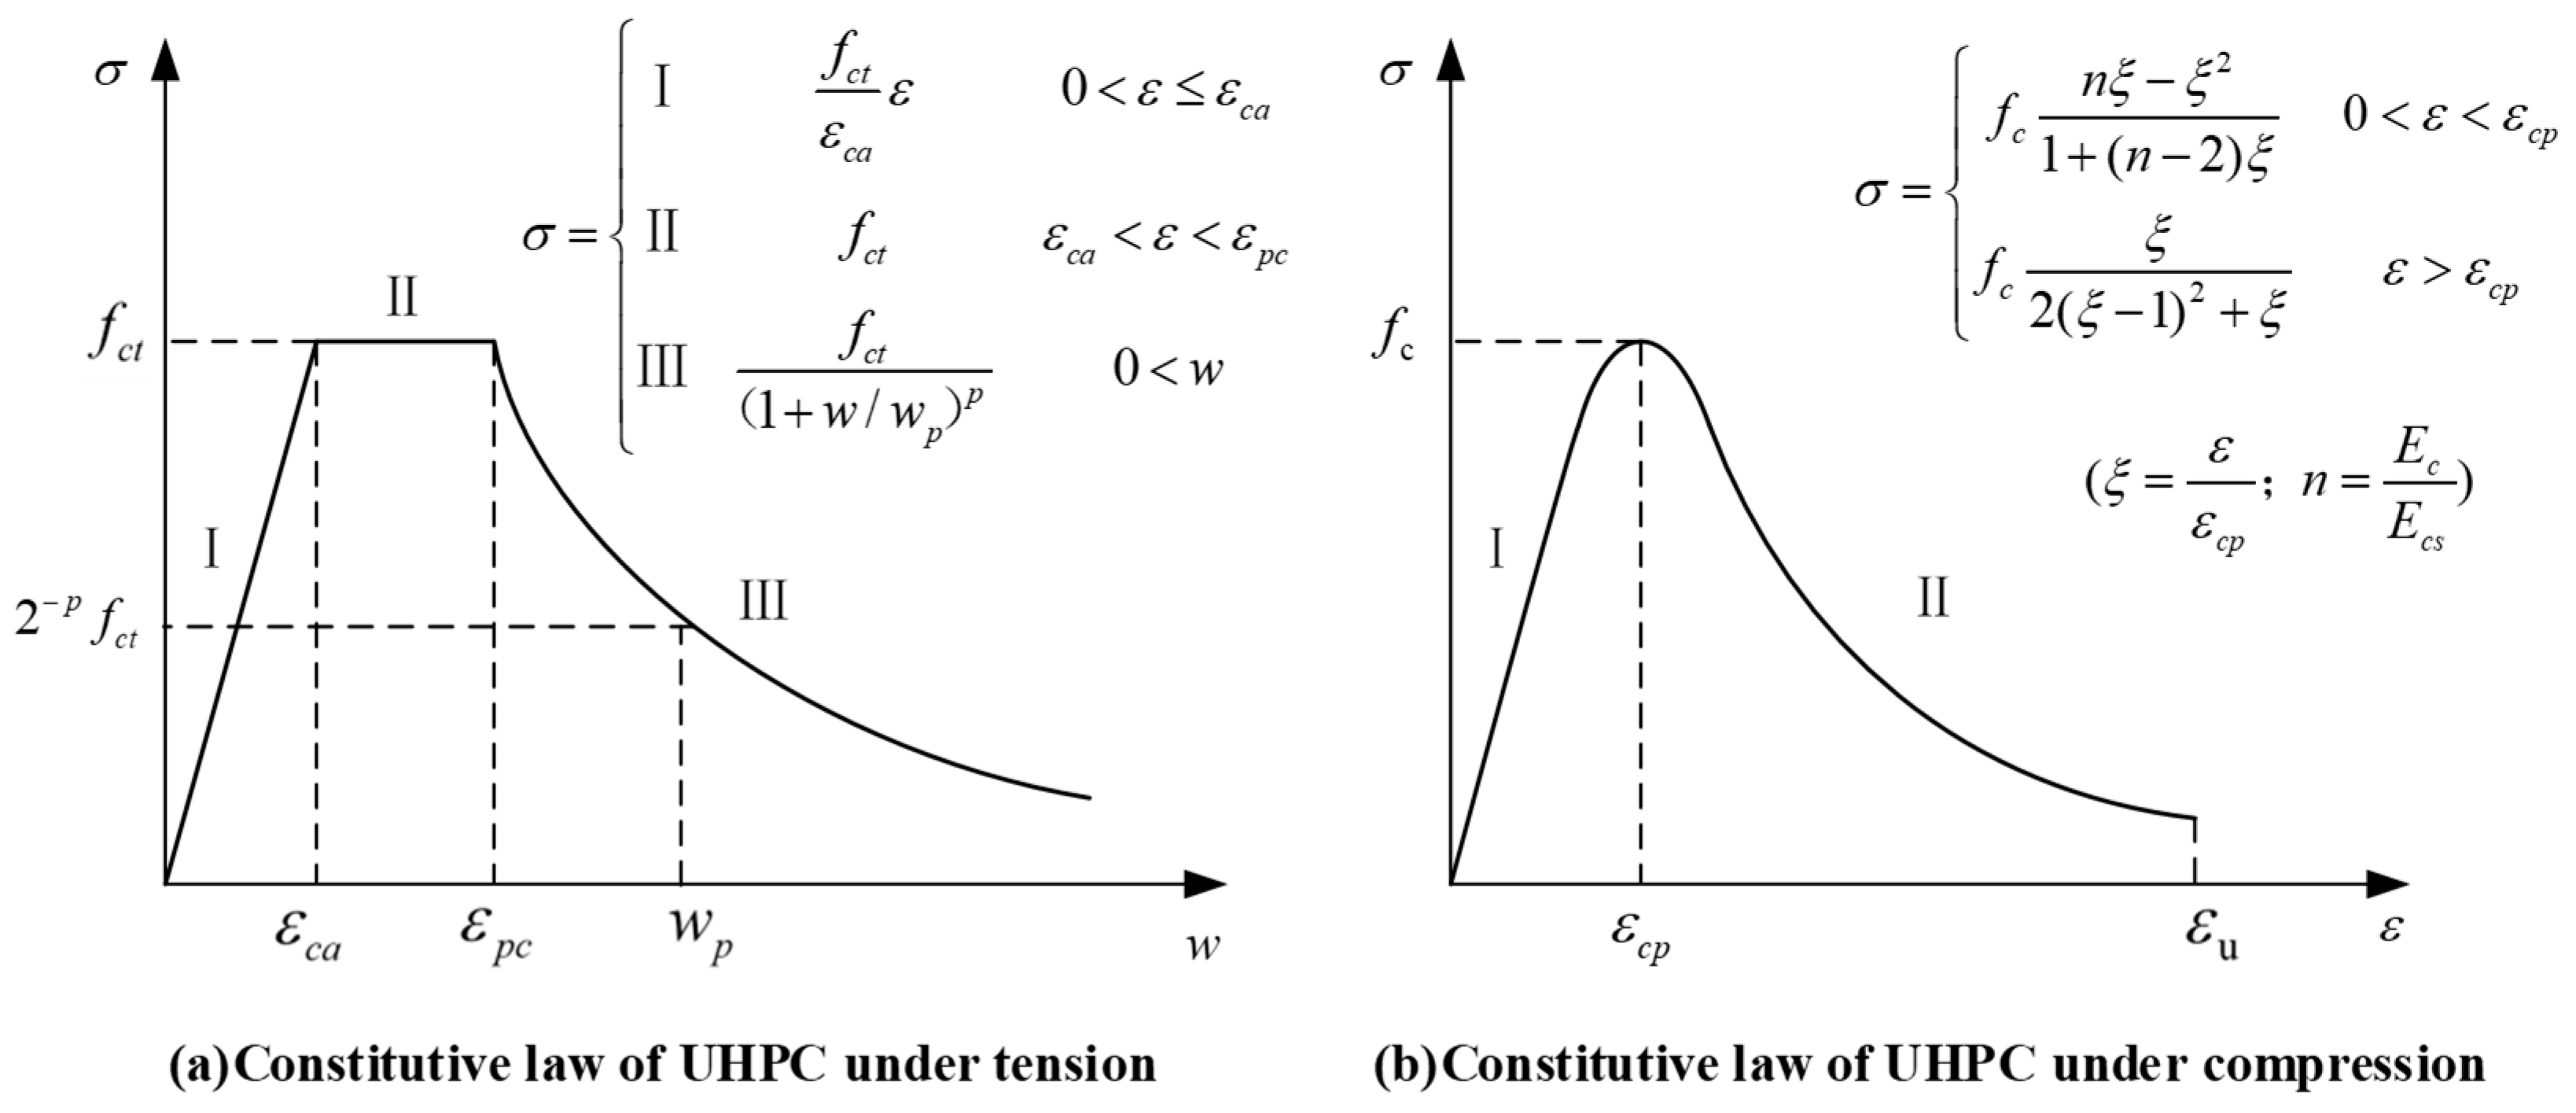
4.2.2. UHPC
- (1)
- UHPC under uniaxial compression:where denotes the compressive strength of the UHPC prism, denotes the peak compressive strain, taken as 0.0035 (the failure strain is taken as 0.01), denotes the elastic modulus of UHPC, denotes the secant elastic modulus at the peak, taken as 35.8 MPa, and denotes the elastic modulus ratio, taken as 1.19.
- (2)
- UHPC under uniaxial tension:where denotes the tensile strength of UHPC, denotes the peak tensile strain, taken as 0.0002, denotes the limit tensile strain, taken as 0.01, denotes the crack width, denotes the curve parameter, taken as 0.95, and denotes the crack width when the tensile stress decreases to , taken as 1 mm.
4.2.3. High-Strength Mortar
4.2.4. Steel Bars
4.3. Validation of Finite Element Analysis
5. Calculation of the Ultimate Bearing Capacity
5.1. Computational Simplification and Assumptions
- (a)
- Plane-section assumption: the strain of the section is linearly distributed along the height.
- (b)
- Without considering the contribution of concrete in the tensile area to bearing capacity: ignoring the tensile strength of concrete.
- (c)
- Without considering the bond slip between the UHPC layer and the bottom of the box beam: the full section strain is continuous.
5.2. Control Beam
5.3. Mortar Beam
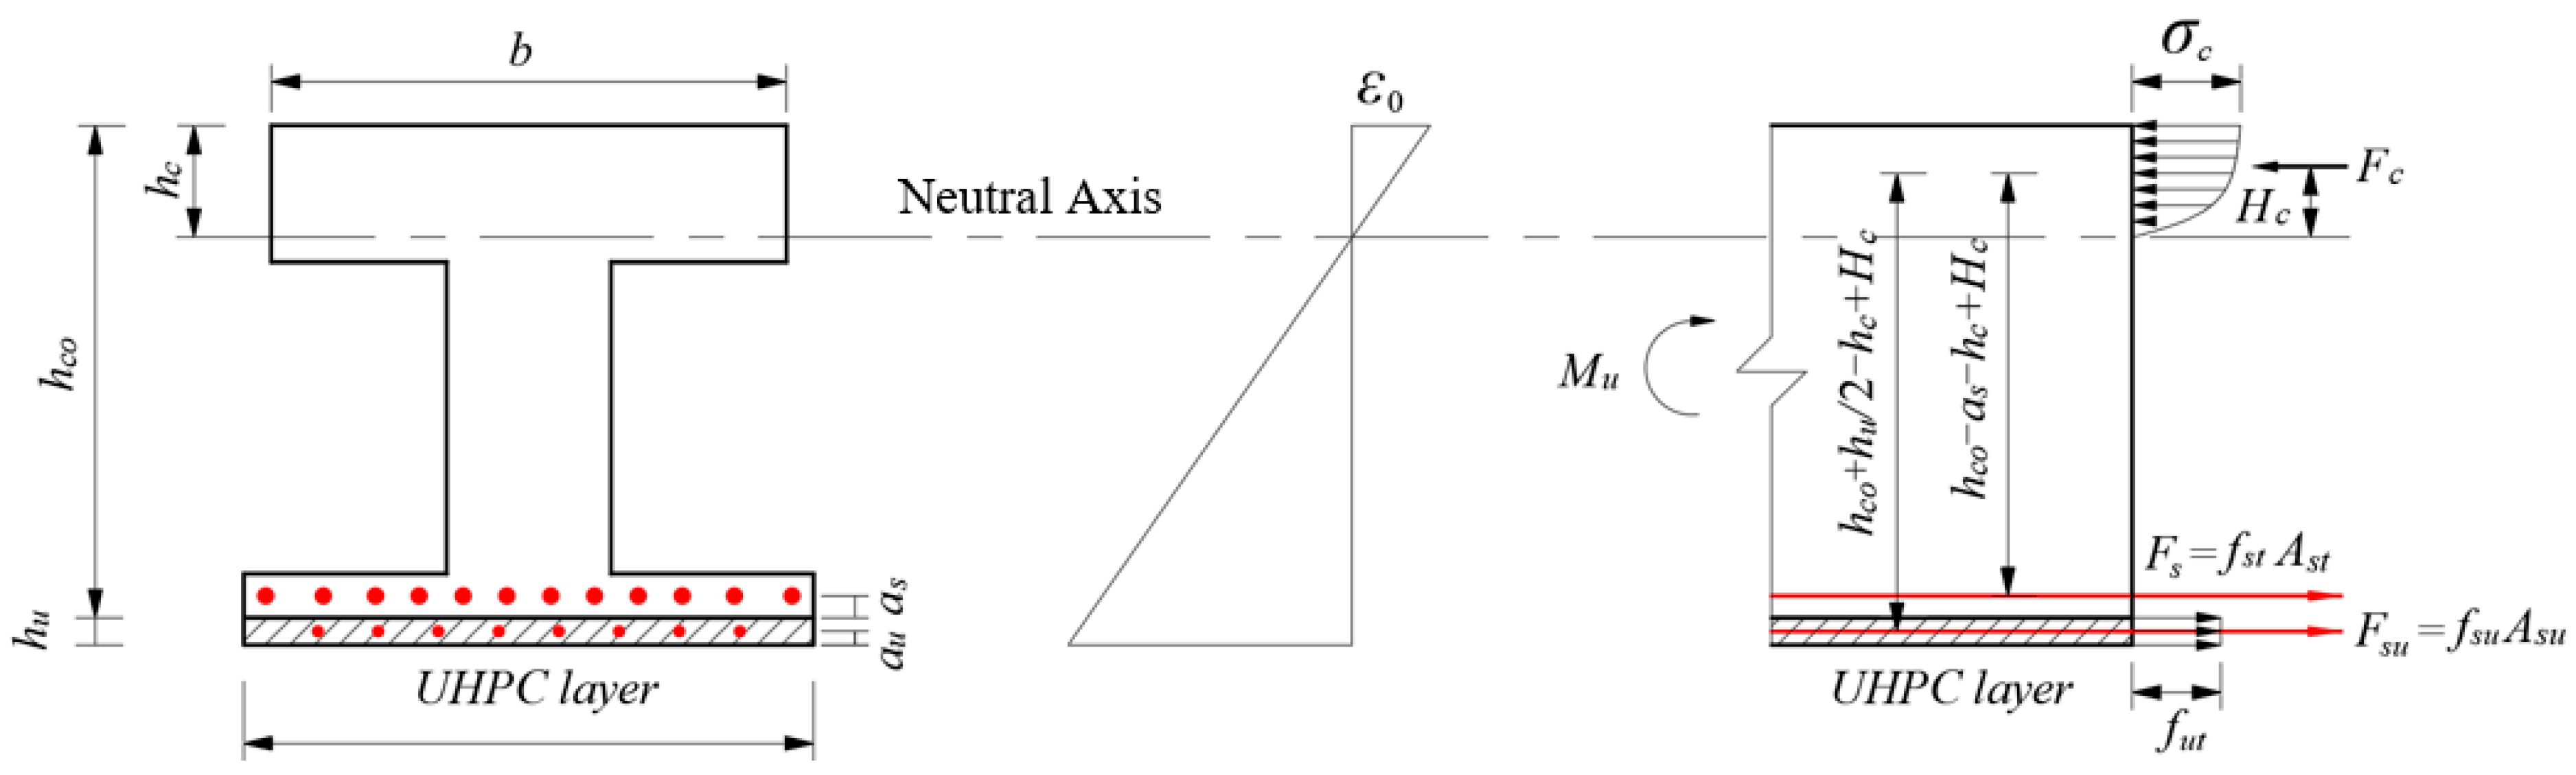
5.4. UHPC Beam
6. Conclusions
- Reinforced high-strength mortar layer had little effect on the stiffness of box beams, but it can effectively improve the ductility of box beams. The reinforced UHPC layer increased the stiffness of the box beams in the elastic stage by 32.9%, but it also slightly reduced the ductility of the box beams.
- Reinforced high-strength mortar layer and reinforced UHPC layer can effectively improve the cracking strengths of box beams, and the cracking load increased by 20%. Moreover, the reinforced high-strength mortar layer and the reinforced UHPC layer can effectively improve the ultimate bearing capacities of box beams. Compared with the control beam, the ultimate bearing capacity of the mortar beam and the UHPC beam was increased by 23.5% and 35.3%, respectively.
- The results of nonlinear finite-element simulations were in good agreement with the experimental results. The established model can effectively simulate the flexural failure process of box beams in service and strengthened box beams and accurately predict the yield load and ultimate load.
- The prediction formula for the ultimate bearing capacity derived from the combination of experimental phenomena and finite-element analysis in this study had high accuracy. The ratios of the experimental values to the predicted values of the control beam, mortar beam, and UHPC beam were 1.095, 1.193, and 1.115, respectively. The established prediction method can accurately predict the flexural bearing capacities of the box beams after strengthening.
Author Contributions
Funding
Data Availability Statement
Conflicts of Interest
References
- Hosseinzadehfard, E.; Mobaraki, B. Investigating concrete durability: The impact of natural pozzolan as a partial substitute for microsilica in concrete mixtures. Constr. Build. Mater. 2024, 419, 135491. [Google Scholar] [CrossRef]
- Di, J.; Sun, Y.; Yu, K.; Liu, L.; Qin, F. Experimental investigation of shear performance of existing PC hollow slab. Eng. Struct. 2020, 211, 110451. [Google Scholar] [CrossRef]
- Mobaraki, B.; Ma, H.; Lozano Galant, J.A.; Turmo, J. Structural health monitoring of 2D plane structures. Appl. Sci. 2021, 11, 2000. [Google Scholar] [CrossRef]
- Zhang, Z.Y.; Jin, X.G.; Luo, W. Long-term behaviors of concrete under low-concentration sulfate attack subjected to natural variation of environmental climate conditions. Cem. Concr. Res. 2019, 116, 217–230. [Google Scholar] [CrossRef]
- Waal, L.D.; Fernando, D.; Cork, R.; Foote, J. FRP strengthening of 60 year old prestressed concrete bridge deck units. Eng. Struct. 2017, 143, 346–357. [Google Scholar] [CrossRef]
- Kang, J.; Wang, X.; Yang, J.; Du, Y. Strengthening double curved arch bridges by using extrados section augmentation method. Constr. Build. Mater. 2013, 41, 165–174. [Google Scholar] [CrossRef]
- Zhang, Z.Y.; Pang, K.; Xu, L.H.; Zou, Y.; Yang, J.; Wang, C. The bond properties between UHPC and stone under different interface treatment methods. Constr. Build. Mater. 2023, 365, 130092. [Google Scholar] [CrossRef]
- Du, J.; Meng, W.N.; Khayat, K.H.; Bao, Y.; Guo, P.; Lyu, Z.; Abu-Obeidah, A.; Nassif, H.; Wang, H. New development of ultra-high-performance concrete (UHPC). Compos. Part B Eng. 2021, 224, 109220. [Google Scholar] [CrossRef]
- Leng, J.C.; Yang, J.; Zhang, Z.Y.; Zou, Y.; Du, J.; Zhou, J. Mechanical behavior of a novel compact steel-UHPC joint for hybrid girder bridges: Experimental and numerical investigation. J. Constr. Steel Res. 2024, 218, 108742. [Google Scholar] [CrossRef]
- Fang, Z.C.; Wu, J.J.; Xu, X.Q.; Ma, Y.; Fang, S.; Zhao, G.; Jiang, H. Grouped rubber-sleeved studs–UHPC pocket connections in prefabricated steel–UHPC composite beams: Shear performance under monotonic and cyclic loading. Eng. Struct. 2024, 305, 117781. [Google Scholar] [CrossRef]
- Fang, Z.; Wu, J.; Xian, B.; Zhao, G.; Fang, S.; Ma, Y.; Jiang, H. Shear performance and design recommendations of single embedded nut bolted shear connectors in prefabricated steel–UHPC composite beams. Steel Compos. Struct. 2024, 50, 319–336. [Google Scholar]
- Zou, Y.; Zheng, K.D.; Zhou, Z.X.; Zhang, Z.; Guo, J.; Jiang, J. Experimental study on flexural behavior of hollow steel-UHPC composite bridge deck. Eng. Struct. 2023, 274, 115087. [Google Scholar] [CrossRef]
- Zhang, Z.; Jin, X.G.; Luo, W. Numerical study on the collapse behaviors of shallow tunnel faces under open-face excavation condition using mesh-free method. J. Eng. Mech. 2019, 145, 04019085. [Google Scholar] [CrossRef]
- Leng, J.C.; Yang, J.; Zhang, Z.Y.; Du, J.; Zou, Y.; Zhou, J. Effect of vehicle-induced vibration on the strength, nano-mechanical properties, and microstructural characteristics of ultra-high-performance concrete during hardening process. Cem. Concr. Compos. 2024, 148, 105487. [Google Scholar] [CrossRef]
- Huang, Y.T.; Grünewald, S.; Schlangen, E.; Luković, M. Strengthening of concrete structures with ultra-high performance fiber reinforced concrete (UHPFRC): A critical review. Constr. Build. Mater. 2022, 336, 127398. [Google Scholar] [CrossRef]
- Charron, J.; Denarié, E.; Brühwiler, E. Transport properties of water and glycol in an ultra high performance fiber reinforced concrete (UHPFRC) under high tensile deformation. Cem. Concr. Res. 2008, 38, 689–698. [Google Scholar] [CrossRef]
- Xue, J.; Briseghella, B.; Huang, F.; Nuti, C.; Tabatabai, H.; Chen, B. Review of ultra-high performance concrete and its application in bridge engineering. Constr. Build. Mater. 2020, 260, 119844. [Google Scholar] [CrossRef]
- Chen, R.; Zhang, Z.Y.; Zou, Y.; Yang, J.; Zhou, J.; Kuang, Y.; Wang, Y. In-situ evaluation on existing RC beam strengthened with GFRP-reinforced UHPC overlay. Constr. Build. Mater. 2024, 429, 136363. [Google Scholar] [CrossRef]
- Habel, K.; Denarié, E.; Brühwiler, E. Time dependent behavior of elements combining ultra-high performance fiber reinforced concretes (UHPFRC) and reinforced concrete. Mater. Struct. 2006, 39, 557–569. [Google Scholar] [CrossRef]
- Zhang, Y.; Li, X.L.; Zhu, Y.P.; Shao, X. Experimental study on flexural behavior of damaged reinforced concrete (RC) beam strengthened by toughness-improved ultra-high performance concrete (UHPC) layer. Compos. Part B Eng. 2020, 186, 107834. [Google Scholar] [CrossRef]
- Zhang, Z.Y.; Zhou, J.T.; Zou, Y.; Yang, J.; Bi, J. Change on shear strength of concrete fully immersed in sulfate solutions. Constr. Build. Mater. 2020, 235, 117463. [Google Scholar] [CrossRef]
- Safdar, M.; Matsumoto, T.; Kakuma, K. Flexural behavior of reinforced concrete beams repaired with ultra-high performance fiber reinforced concrete (UHPFRC). Compos. Struct. 2016, 157, 448–460. [Google Scholar] [CrossRef]
- Yang, J.; Chen, R.; Zhang, Z.Y.; Zou, Y.; Zhou, J.; Xia, J. Experimental study on the ultimate bearing capacity of damaged RC arches strengthened with ultra-high performance concrete. Eng. Struct. 2023, 279, 115611. [Google Scholar] [CrossRef]
- Lim, C.; Jeong, Y.; Kim, J.; Kwon, M. Experimental study of reinforced concrete beam-column joint retrofitted by CFRP grid with ECC and high strength mortar. Constr. Build. Mater. 2022, 340, 127694. [Google Scholar] [CrossRef]
- Abdullah, M.A.H.; Zahid, M.Z.A.M.; Ayob, A.; Muhamad, K. Flexural behavior of fire-damaged reinforced concrete beams re-paired with high-strength fiber reinforced mortar. J. Struct. Fire Eng. 2019, 10, 56–75. [Google Scholar] [CrossRef]
- Dong, Z.F.; Deng, M.K.; Dai, J.; Song, S. Flexural strengthening of RC slabs using textile reinforced mortar improved with short PVA fibers. Constr. Build. Mater. 2021, 304, 124613. [Google Scholar] [CrossRef]
- Escrig, C.; Gil, L.; Bernat-Maso, E.; Puigvert, F. Experimental and analytical study of reinforced concrete beams shear strengthened with different types of textile-reinforced mortar. Constr. Build. Mater. 2015, 83, 248–260. [Google Scholar] [CrossRef]
- Guo, R.; Pan, Y.; Cai, L.H.; Hino, S. Study on design formula of shear capacity of RC beams reinforced by CFRP grid with PCM shotcrete method. Eng. Struct. 2018, 166, 427–440. [Google Scholar] [CrossRef]
- Cai, L.H.; Liu, Q.; Guo, R. Study on the shear behavior of RC beams strengthened by CFRP grid with epoxy mortar. Compos. Struct. 2021, 275, 114419. [Google Scholar] [CrossRef]
- JGJ/T 384-2016; Technical Specification for Testing Concrete Strength with Drilled Core Method. China Architecture and Building Press: Beijing, China, 2016. (In Chinese)
- GB/T 288.1-2010; Metallic Materials—Tensile Testing—Part 1: Method of Test at Room Temperature. Standardization Administration of People’s Republic of China: Beijing, China, 2010. (In Chinese)
- GB/T 31387-2015; Reactive Powder Concrete. Standardization Administration of People’s Republic of China: Beijing, China, 2015. (In Chinese)
- JGJ/T70-2019; Standard for Test Method of Performance on Building Mortar. China Architecture and Building Press: Beijing, China, 2019. (In Chinese)
- GB/T50152-2012; Standard for Test Method of Concrete Structures. China Architecture and Building Press: Beijing, China, 2012. (In Chinese)
- GB 50010-2010; Code for Design of Concrete Structures. China Architecture and Building Press: Beijing, China, 2010. (In Chinese)
- Wang, Z.; Nie, X.; Fan, J.S.; Lu, X.Y.; Ding, R. Experimental and numerical investigation of the interfacial properties of non-steam-cured UHPC-steel composite beams. Constr. Build. Mater. 2019, 195, 323–339. [Google Scholar] [CrossRef]
- Cao, J.H.; Shao, X.D. Finite element analysis of headed studs embedded in thin UHPC. J. Constr. Steel Res. 2019, 161, 355–368. [Google Scholar] [CrossRef]
- Zhu, B.L. Principles of Masonry Structural Design; Tongji University Press: Shanghai, China, 1991. (In Chinese) [Google Scholar]
- Yang, X.B. Numerical Analysis of Earthquake Resistance of Brick Masonry Strengthened with Pasted Steel and Polymer Mortar; Harbin Institute of Technology: Harbin, China, 2019. [Google Scholar]
- Yang, J.; Yu, J.; Zhang, Z.Y.; Zou, Y.; Chen, R.; Zhou, J.; Li, B. Flexural behavior of 15-year-old full-scale hollow slab beams strengthened with fiber-reinforced composites. Case Stud. Constr. Mater. 2023, 19, e02545. [Google Scholar] [CrossRef]
- Zhu, Y.P.; Zhang, Y.; Li, X.L.; Chen, G. Finite element model to predict structural response of predamaged RC beams reinforced by toughness-improved UHPC under unloading status. Eng. Struct. 2021, 235, 112019. [Google Scholar] [CrossRef]
Disclaimer/Publisher’s Note: The statements, opinions, and data contained in all publications are solely those of the individual author(s) and contributor(s) and not of MDPI and/or the editor(s). MDPI and/or the editor(s) disclaim responsibility for any injury to people or property resulting from any ideas, methods, instructions, or products referred to in the content. |


| Constituents | UHPC |
|---|---|
| Cement | 1000 |
| Silica fume | 100 |
| Fly ash | 300 |
| Basalt sand | 1100 |
| Water | 240 |
| Steel fiber | 170 |
| Material | Cube Strength (MPa) | Axial Compressive Strength (MPa) | Yield Strength (MPa) | Cracking Strength (MPa) | Elastic Modulus (GPa) |
|---|---|---|---|---|---|
| Concrete | 66.8 | 50.3 | 3.5 × 10⁴ | ||
| UHPC | 142.5 | 7.0 | 4.22 × 10⁴ | ||
| High-strength Mortar | 0.8 × 10⁴ | ||||
| HRB300 | 335.0 | 2.0 × 10⁵ | |||
| HRB335 | 376.0 | 2.1 × 10⁵ | |||
| HRB400 | 435.0 | 2.2 × 10⁵ |
| Test Beams | ||||||
|---|---|---|---|---|---|---|
| Control-Beam | 200 | 10.49 | 640 | 44.29 | 680 | 99.56 |
| Mortar-Beam | 240 | 11.72 | 720 | 50.64 | 840 | 128.90 |
| UHPC-Beam | 240 | 8.42 | 800 | 55.66 | 920 | 119.81 |
| Test Beam | |||
|---|---|---|---|
| Control Beam | 19.1 | 13.0 | 0.7 |
| Mortar Beam | 20.5 | 12.3 | 1.5 |
| UHPC Beam | 28.5 | 11.9 | 1.8 |
| Material | |||||
|---|---|---|---|---|---|
| Concrete | 36° | 0.1 | 1.16 | 0.6667 | 0.0005 |
| UHPC | 38° | 0.1 | 1.16 | 0.6667 | 0.00005 |
| High-strength mortar | 26° | 0.1 | 1.16 | 0.667 | 0.00005 |
| Test Beam | |||
|---|---|---|---|
| Control Beam | 680 | 621 | 1.095 |
| Mortar Beam | 840 | 704 | 1.193 |
| UHPC Beam | 920 | 825 | 1.115 |
Disclaimer/Publisher’s Note: The statements, opinions and data contained in all publications are solely those of the individual author(s) and contributor(s) and not of MDPI and/or the editor(s). MDPI and/or the editor(s) disclaim responsibility for any injury to people or property resulting from any ideas, methods, instructions or products referred to in the content. |
© 2024 by the authors. Licensee MDPI, Basel, Switzerland. This article is an open access article distributed under the terms and conditions of the Creative Commons Attribution (CC BY) license (https://creativecommons.org/licenses/by/4.0/).
Share and Cite
Nong, S.; Li, B.; Kong, L.; Huang, J.; Chen, X.; Jiang, Z.; Yang, J.; Zou, Y.; Zhang, Z. Behavior of Existing Box Beams Repaired with High-Strength Mortar Layer and Ultra-High-Performance Concrete (UHPC) Overlay: Experimental, Numerical, and Theoretical Investigations. Buildings 2024, 14, 2052. https://doi.org/10.3390/buildings14072052
Nong S, Li B, Kong L, Huang J, Chen X, Jiang Z, Yang J, Zou Y, Zhang Z. Behavior of Existing Box Beams Repaired with High-Strength Mortar Layer and Ultra-High-Performance Concrete (UHPC) Overlay: Experimental, Numerical, and Theoretical Investigations. Buildings. 2024; 14(7):2052. https://doi.org/10.3390/buildings14072052
Chicago/Turabian StyleNong, Shengwei, Baojun Li, Lingcai Kong, Jian Huang, Xiaohuang Chen, Zhimei Jiang, Jun Yang, Yang Zou, and Zhongya Zhang. 2024. "Behavior of Existing Box Beams Repaired with High-Strength Mortar Layer and Ultra-High-Performance Concrete (UHPC) Overlay: Experimental, Numerical, and Theoretical Investigations" Buildings 14, no. 7: 2052. https://doi.org/10.3390/buildings14072052