Abstract
As concerns about indoor air quality increase, air purifiers and fresh air systems are increasingly being used in conjunction with air conditioners in office buildings. To study the synergistic effects of multisystem joint operation on indoor air quality, this study used a combination of experimental and simulation methods to study the indoor particulate matter with a diameter of less than 2.5 µm (PM2.5) and carbon dioxide (CO2) concentrations under different operation conditions. The purification time and the PM2.5 concentration distribution under different conditions were compared with the condition in which the purifier was used alone. The results showed that the purification time required for the condition that the air conditioner runs together with the purifier was shortened by 15.2%. When the fresh air system is running together with the purifier, the purification time can be reduced by 30.4%. It was reduced by 32.6% when the three systems were operating at the same time. The PM2.5 concentration distribution under the joint operating condition was much more even than that under the condition in which the purifier was running alone. To analyze the impact on the CO2 distribution, the CO2 distributions under different joint operations were compared. The results show that the fresh air system can effectively dilute CO2 below 1000 ppm in 30 min. The air conditioner and purifier could help to mix the indoor air to provide a much more uniform indoor CO2 distribution.
1. Introduction
Individuals spend as much as 90% of their time within buildings where air pollutant concentrations can be several times higher than outdoor levels, posing significant health risks [1,2,3]. With the rapid development of the economy and the continuous improvement of people’s living standards, the requirements for the indoor environment are becoming more stringent. From the initial focus on thermal comfort to the concern of indoor humidity conditions, increasing attention has been given to the quality of indoor air quality (IAQ), such as the concentration of indoor particulate matter with a diameter of less than 2.5 µm (PM2.5), and carbon dioxide (CO2) [4,5]. In the summer, to pursue a more comfortable and cleaner office environment, the most commonly used methods are using air conditioners for indoor cooling [6], employing air purifiers to purify indoor polluting particles [1,7], and utilizing fresh air systems to supply fresh outdoor air to dilute the indoor CO2. [8]. Many researchers have indicated that one of the major factors affecting indoor air quality is the ventilation system, which is associated with the distribution and dilution of indoor pollutants. The air distribution and its impact on the indoor air quality have often been considered as an important consideration [9]. For rooms that combine different systems in the same zone, a more complex organization of indoor airflow is formed, which in turn affects the purification efficiency of the air purifier and the effectiveness of the ventilation system [10]. Thus, the airflow and its impact on the indoor quality of the combined system is of great significance for creating a good indoor air quality environment.
The airflow organization generated by air conditioners, air purifiers or fresh air systems has been recognized as crucial in evaluating indoor air quality. Using both field tests and simulation methods, Sekhar and Willem [9] studied the impact of airflow profiles on the indoor air quality within an office building in Singapore. The results show that the airflow pattern significantly influences the distribution path of pollutants, which provides important scientific evidence for improving and enhancing the building environment. Dai and Zhao [11] emphasized the importance of properly arranging portable air cleaners (PACs) in indoor environments to reduce the risk of COVID-19 transmission through the air, and they provided a simple and easy-to-use model to guide the placement strategy of PACs in actual engineering projects. Luis et al. [12] studied the impact of the varying positions and orientations of air purifiers on the ventilation efficiency and air age within elevator cabins. The results demonstrate that selecting the optimal position can significantly improve ventilation efficiency. However, determining the correct air purification flow rate is even more critical for ensuring proper air renewal. Placing the air purifier on the larger sidewall and directing the airflow downward is considered the best position, with a flow rate in the range of 0.4 to 0.6 m3/min being sufficient to ensure adequate ventilation.
With increasing concern over indoor air quality issues, air purifiers or fresh air systems have been used together with air conditioners in office buildings. The airflow organization became much more complicated due to the interaction between them. Zhang et al. [13] employed a combination of experimental measurements and computational fluid dynamics (CFD) modeling to study the impact of various air conditioner and air purifier placement methods, air conditioner diffuser type, cooling or heating mode, and pollution source location on the effectiveness of air purification. The results indicated that when the air conditioner and the air purifier are positioned opposite to each other, the efficacy of air purification in the human breathing zone is enhanced. In addition, when an air conditioner utilizes a grid grille diffuser, compared to a dual-slot diffuser, the air conditioner is more compatible with portable air purifiers, leading to improved air purification outcomes. Shang et al. [14] emphasized the significant impact of occupants’ window-opening behavior on the indoor PM2.5 concentration, and a reinforcement learning-based control strategy was proposed to provide better indoor air quality with lower energy consumption. Zhang et al. [15] investigated the impact of air purifiers and window operation on the indoor air quality. The study revealed that air purifiers, when used in conjunction with appropriate window operation, can effectively reduce indoor PM2.5 levels. Additionally, the study highlighted changes in window operation behavior during the COVID-19 pandemic due to increased demand for ventilation, which could affect the thermal comfort and air quality of the indoor environment. Karam et al. [16] investigated the impact of combining an intermittent air jet system (IAJS) with portable air cleaners (PACs) on the indoor air quality within a classroom. The results demonstrated that the use of an IAJS and PAC integrated system in classrooms can reduce cross-contamination, and the optimal operating flow rate is 350 m3/h for PACs, ensuring protection against cross-contamination without increasing energy consumption. Shi and Li [6] compared two indoor air purification strategies—the air purifier (AP) mode with open-window ventilation (AP-Mode) and the fresh air unit (FAU) mode with positive pressure control (FAU-Mode)—to determine which strategy is most suitable for split air-conditioned (SAC) buildings. The results show that the FAU-Mode has an advantage in terms of energy consumption, especially in conditions with more severe outdoor PM2.5 pollution. However, the FAU-Mode requires the room to be airtight to maintain positive pressure control. For rooms with less than 1 ACH fresh air requirement, the AP-Mode should be used. For rooms with a fresh air requirement greater than 1 ACH, the FAU-Mode is the appropriate and energy-efficient choice.
According to the aforementioned literature review, most studies have focused on the effects of different flow patterns of air conditioning systems and the placement of air purifiers on the indoor air quality. The combined system of air purifiers and air conditioning has also been studied, and the optimal relative placement and supply air volume have been recommended. However, there is a lack of research on the synergistic effects of an integrated system of air conditioners, air purifiers and fresh air units on indoor air quality, which is commonly used in large office buildings. By integrating the three systems in one room, the indoor airflow pattern becomes more complex. The mutual influence mechanism of flow filed and mass transportation under the combine of three systems is not clear. Due to the existence of this gap, the combined operation system lacks theoretical guidance and cannot achieve optimal operational effects. Thus, further research is required to maintain high indoor air quality efficiently.
To fill the gap mentioned, this study adopted a combined approach of experimentation and numerical simulation to investigate the synergistic effects on the indoor air quality of an integrated air conditioner, air purifier, and fresh air system. The IAQ under different operation conditions was analyzed. Since the PM2.5 was found to be related to lung cancer and cardiovascular diseases and overall mortality [17,18]. In term of CO2, although it does not have a direct adverse effect, it is considered a good indicator of pollutants emitted by humans and ventilation efficiency, which have a significant impact on IAQ [19,20]. Thus, in this study, we employ the PM2.5 and CO2 as the indicators of IAQ and the indoor PM2.5 and CO2 concentrations were analyzed and compared under different operation conditions. The result of this study would provide guidance for the operation and placement of the combined system, and it would also serve as the basis for an intelligent control system to maintain high indoor air quality efficiently.
2. Methods
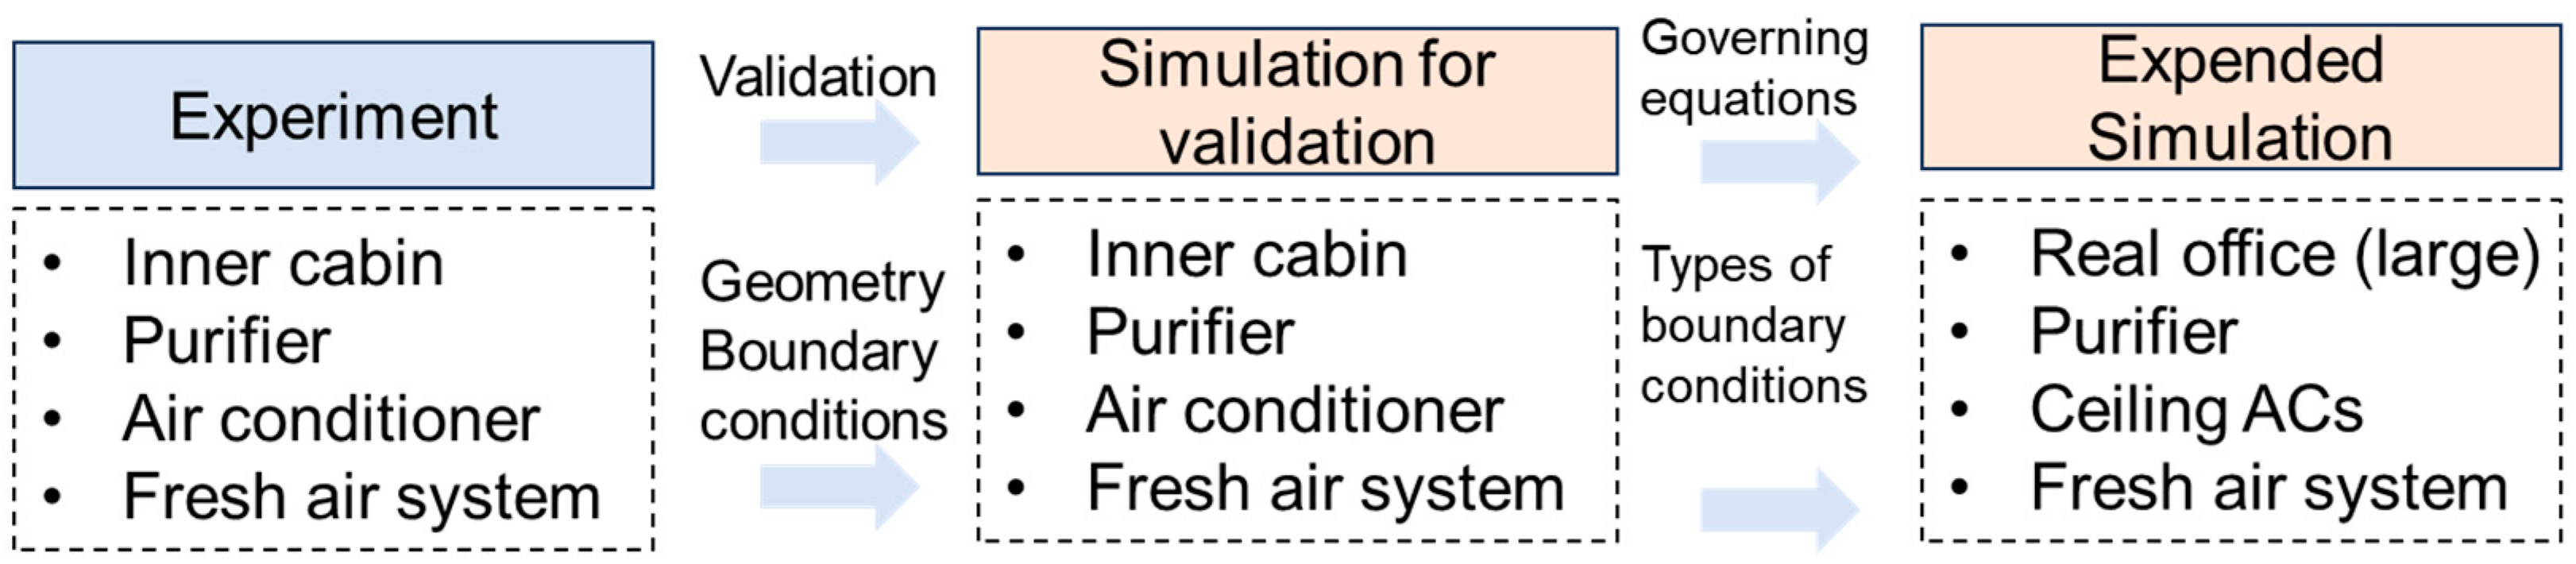
In this study, the impact of the joint operation of an air conditioner, a fresh air system and an air purifier on the indoor air quality was analyzed using the combination of experimental and simulation methods. The overall technical roadmap of this paper was shown in Figure 1. First, the indoor PM2.5 concentration and CO2 concentration were tested via experiments under joint operation conditions. Second, the numerical model was established according to the actual situation of the laboratory, and the accuracy of the numerical model was validated by the experimental results. Finally, based on the validated numerical model, the joint operation of multiple systems in an actual office room was further analyzed via simulation.

Figure 1.
The overall technical roadmap of the paper.
2.1. Experimental Study
2.1.1. Experimental Setup
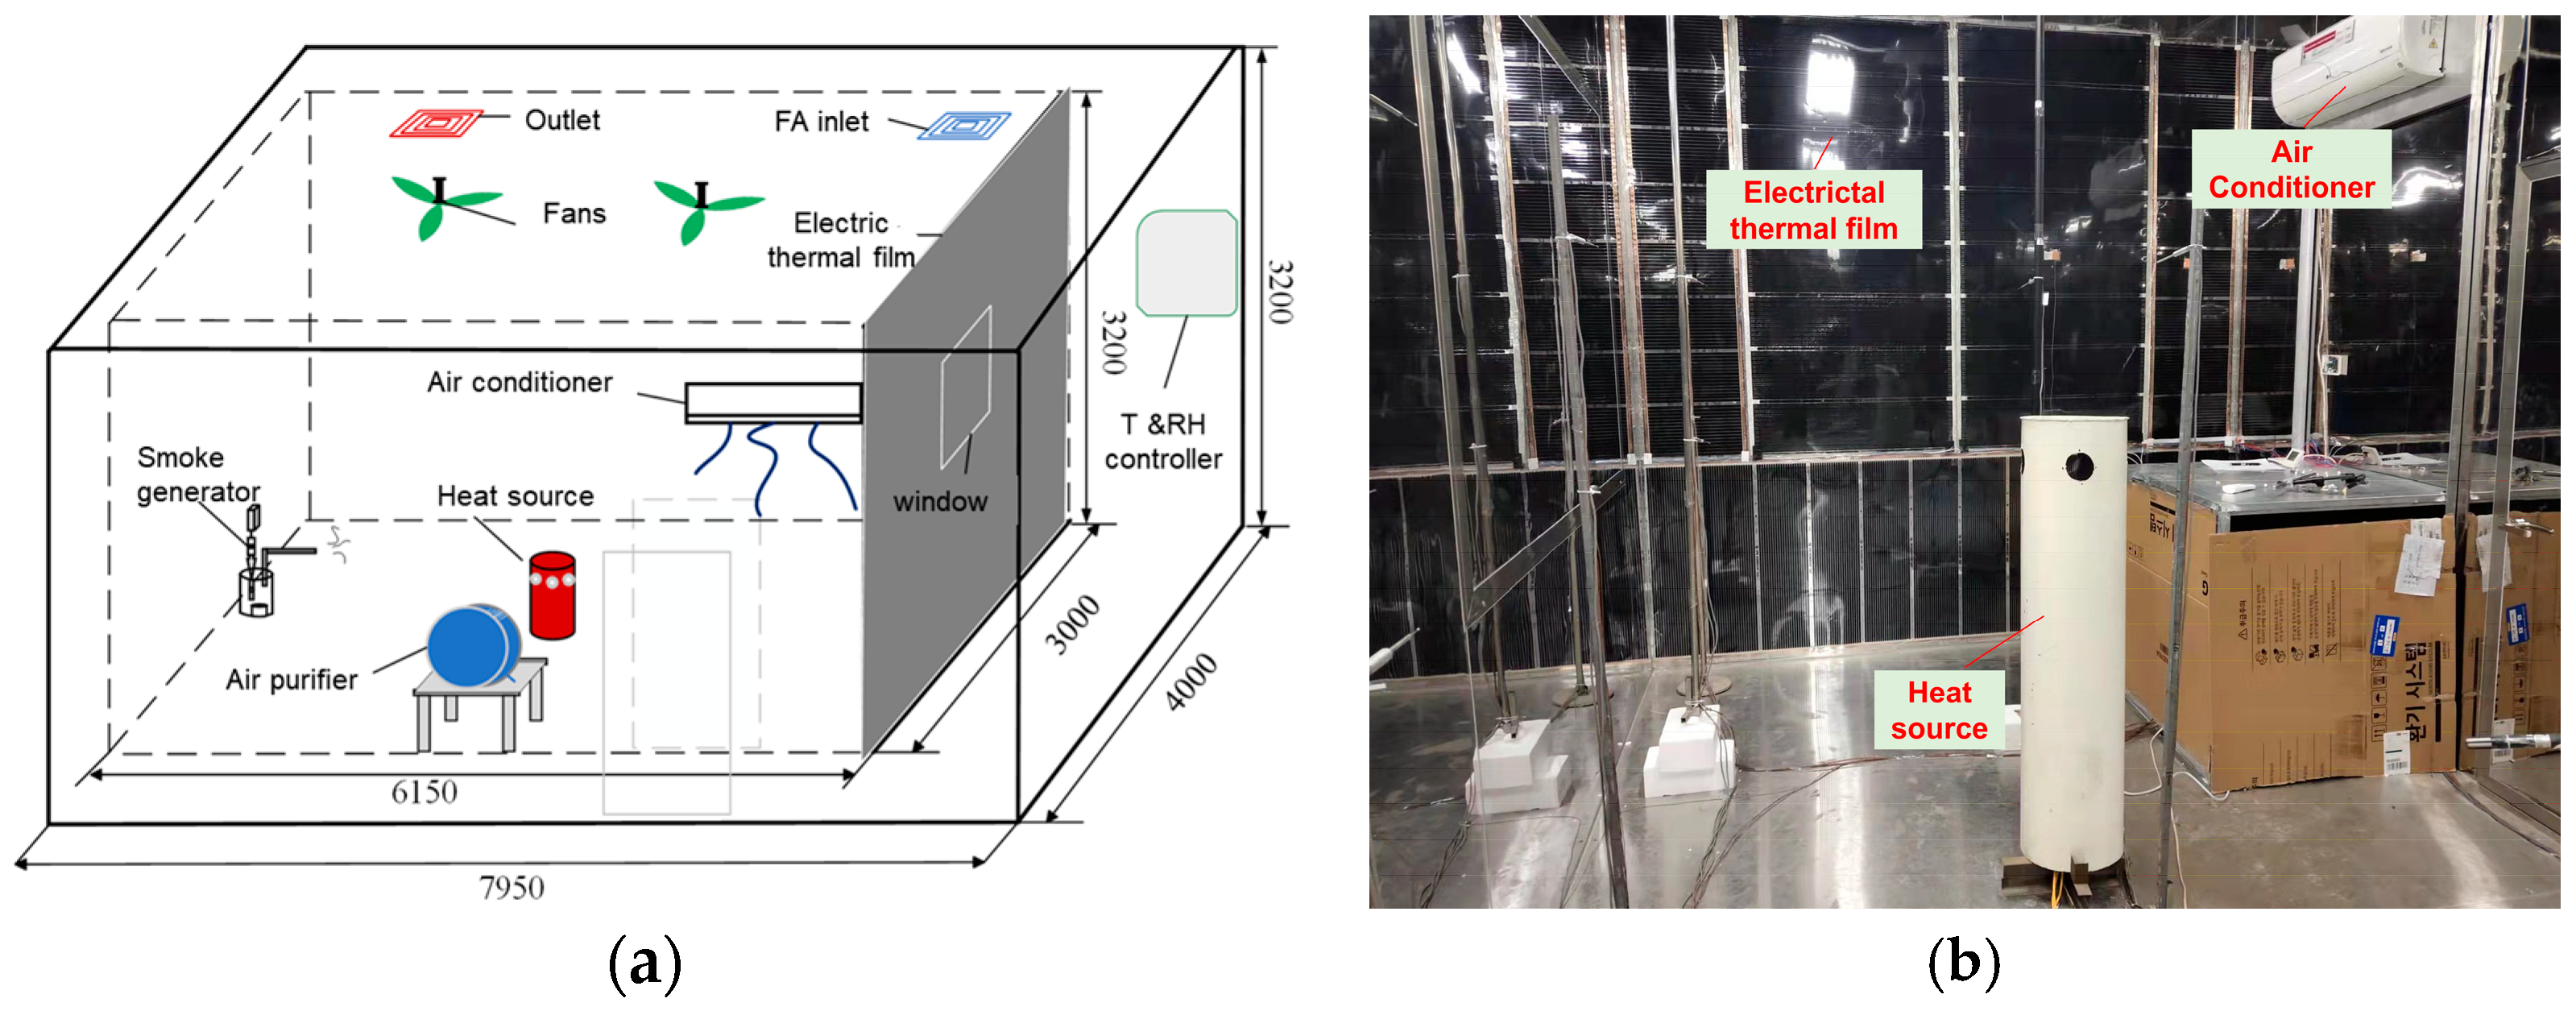
To study the indoor PM2.5 and CO2 concentrations, a multifunction environment cabin was built according to the GB/T 18801-2022 standard [21]. The cabin consists of an inner cabin and an outer cabin, as shown in Figure 2. An inner cabin with a size of 6.15 m × 3.00 m × 3.20 m was used for the test, and an outer cabin with a size of 7.95 m × 4.00 m × 3.20 m was used for environment temperature control. The inner cabin contains an air purifier, an air conditioner and a fresh air system, and the actual test room is shown in Figure 2b.

Figure 2.
The experimental cabin. (a) Schematic diagram of test cabin; (b) actual view of the inner cabin.
For the inner cabin, an electric heating film was employed, and the surface temperature of the electric thermal film could be independently controlled to simulate the heat gain from the exterior wall and the window. The area of the inner cabin is 18.4 m2, and there are 4 people in it generally, according to the office building personnel density index. In the experiment, thermal manikins were used to simulate the heat production of the human body, and the heat generation rate was 60 W/person, for a total of 240 W. To ensure that the temperature in the cabin was maintained at a set temperature of 26 °C, a split-type air conditioner with a cooling capacity of 2600 W was installed on the wall of the inner cabin at the height of 2.4 m, as shown in Figure 2b. The operation condition of the AC was listed in Table 1.

Table 1.
Experimental conditions.
The fresh air system was designed according to the standard [22]. The total fresh air volume is 120 m3/h, and the supply air temperature is 29 °C. The fresh air system adopts an up-supply and up-return airflow organization. The sizes of the fresh air system inlet and outlet are both 24 cm × 24 cm, and the inlet and outlet vents are located on the same side of the room, as shown in Figure 2a.
A mechanical filtration air purifier was selected according to the area of the inner cabin, and its clean air delivery rate (CADR) was 36 m3/h. The purification efficiency for PM2.5 is 98%. The air speed at the outlet is 4 m/s. The air purifier was located on the opposite side of the air conditioner, and the air purifier utilized a top supply and side return airflow pattern.
To analyze the PM2.5 purification performance, cigarettes were used as the source of PM2.5 following the air purifier test standard [21]. The initial indoor particle concentration was set to 300 μg/m3. To analyze the impact of the indoor CO2 distribution, a CO2 storage tank was utilized to simulate the CO2 generation of the human body. The specific experimental conditions and working conditions are shown in Table 1.
2.1.2. Experimental Content
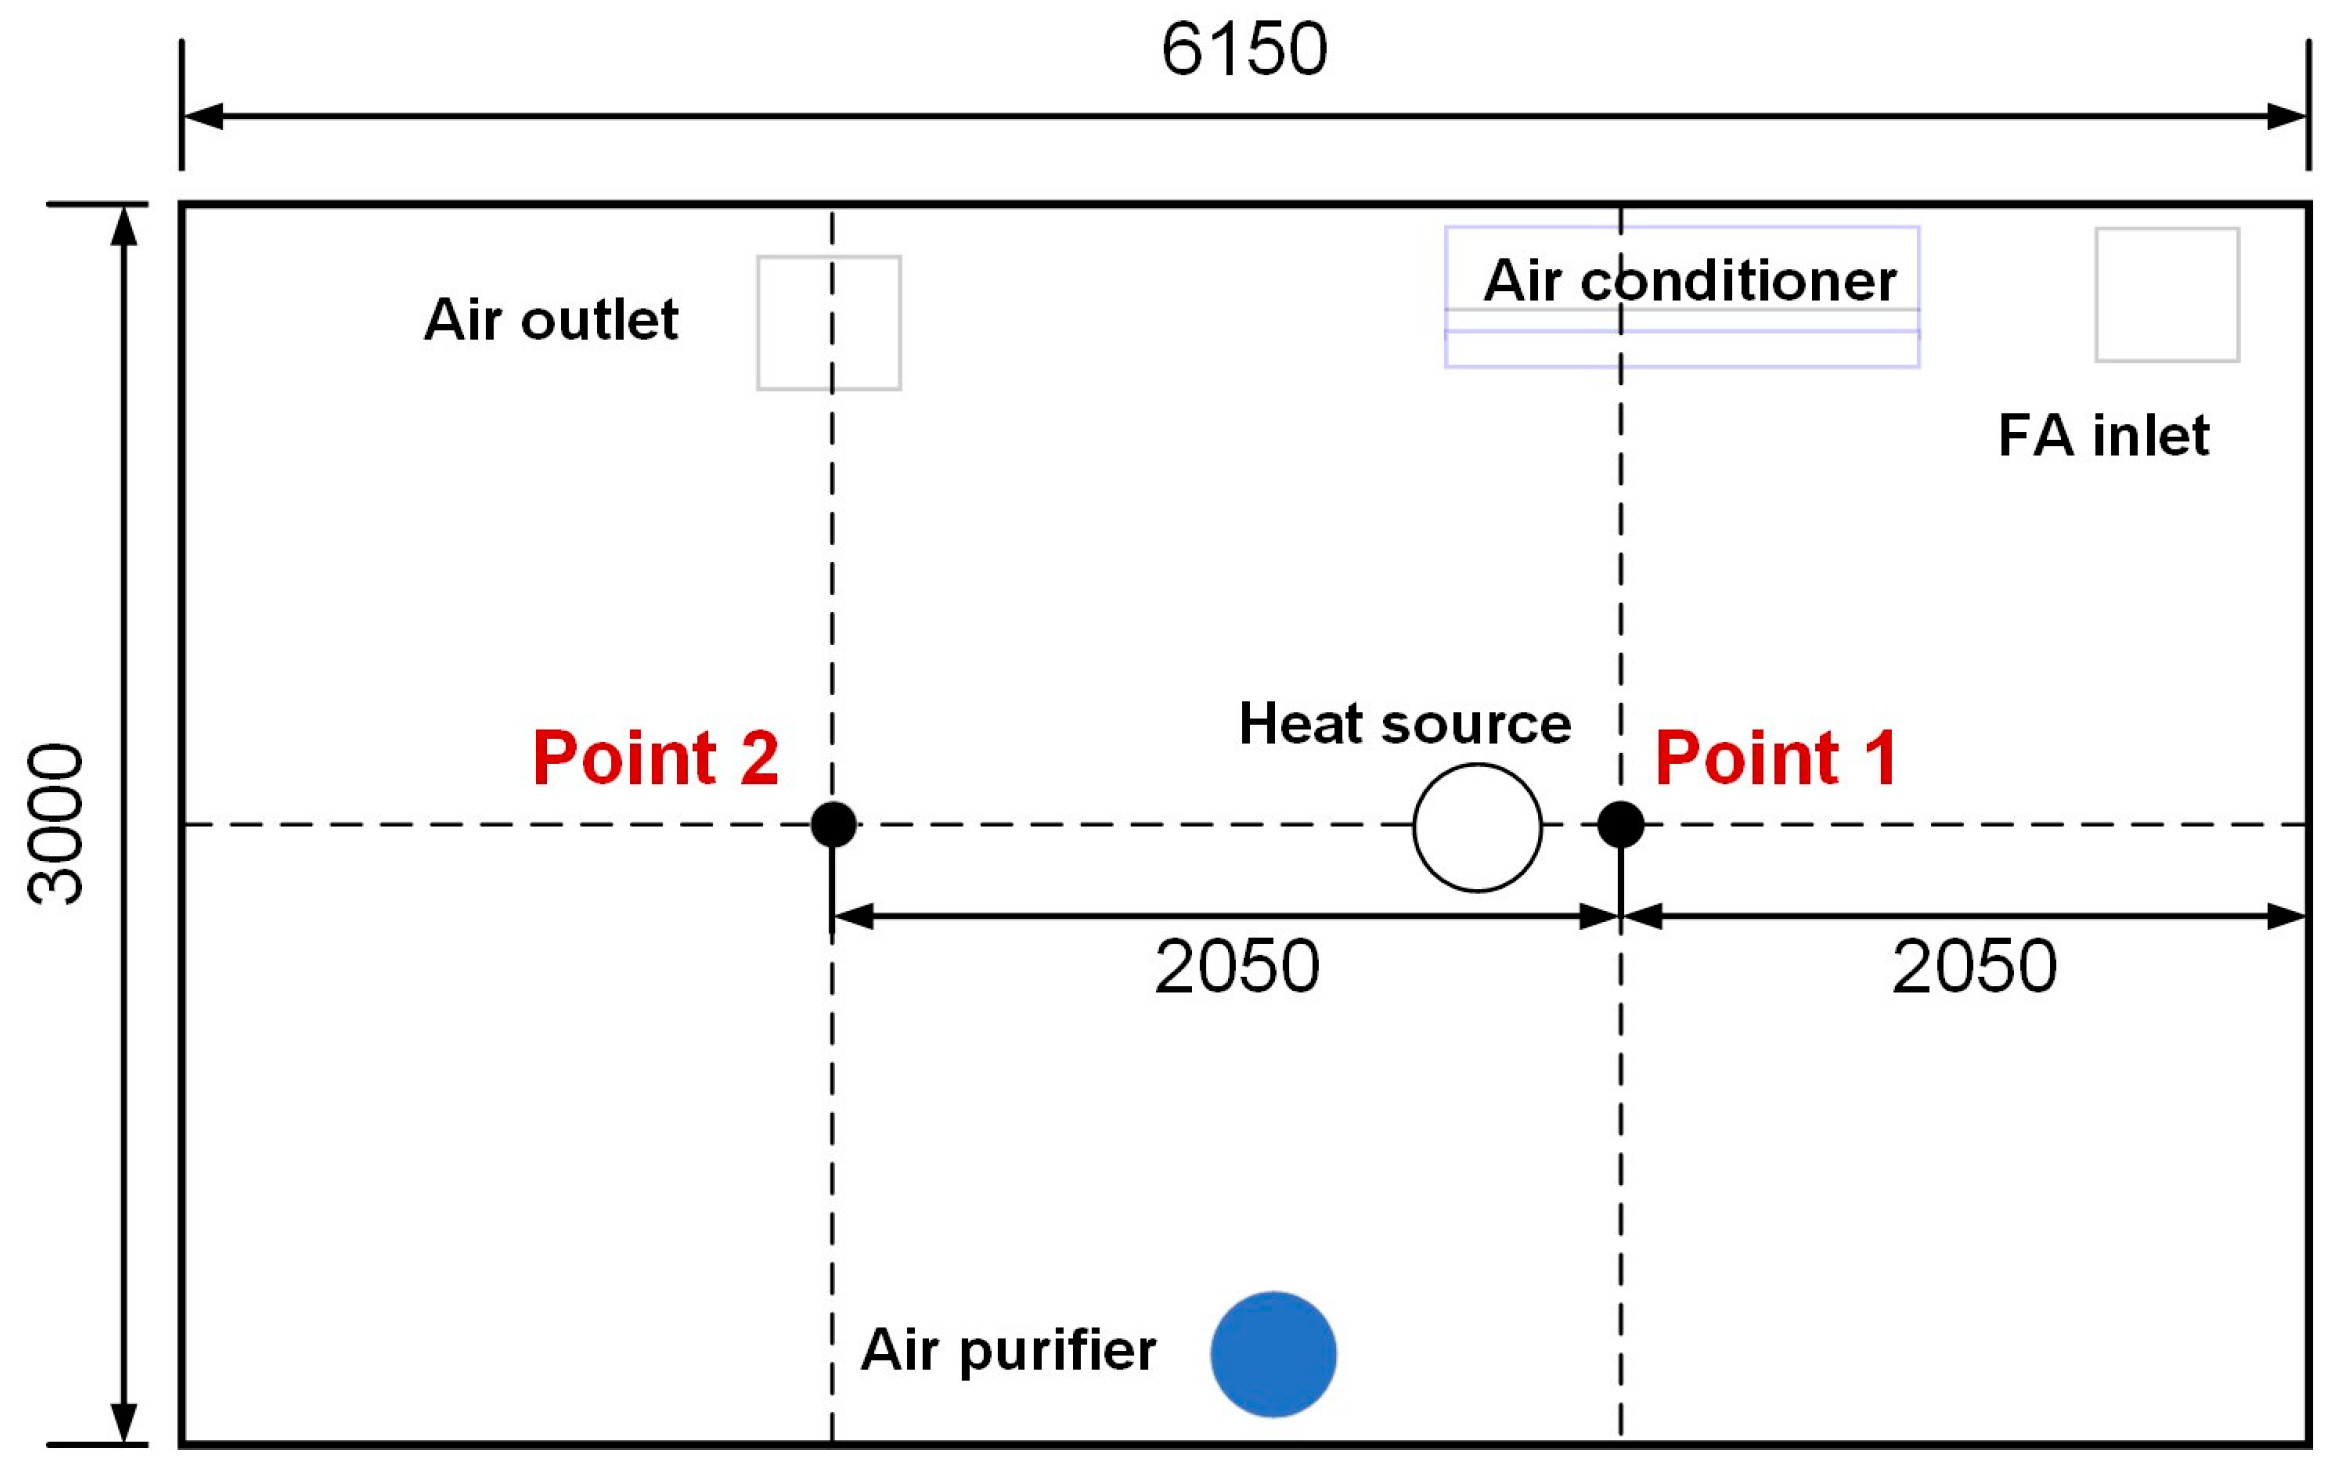
To ensure good repeatability of the experiment, the air purifier and fresh air system were turned on before the start of the experiment and left running until the PM2.5 concentration decreased to 15 μg/m3 and the CO2 concentration decreased to 500 ppm, respectively. Then, the particle generator device, CO2 generation tank, and the mixing fan are started simultaneously to obtain a uniform distribution. When the PM2.5 concentration in the environmental cabin reached 300 μg/m3 and 3000 ppm for CO2, the PM2.5 and CO2 sources and fan were turned off. The air purifier, air conditioner and fresh air system were turned on, and the PM2.5 and CO2 concentrations in the seated breathing area (1.2 m above the floor) in the room were recorded at the intervals of 1 min. The test points are shown in Figure 3. The experiment was terminated when the PM2.5 concentration and CO2 concentration in the inner cabin were less than 15 μg/m3 and 500 ppm, respectively. To ensure the accuracy of the measured PM2.5 concentration and CO2 concentration, each group of experiments was repeated 3 times to determine the average concentration at each point. In the experiment, the measurement instruments listed in Table 2 were used to measure the PM2.5 and CO2 concentrations.

Figure 3.
Diagram of the distribution of experimental measurement points.
Table 2.
Measurement instruments used in the experiment.
2.2. Simulation
2.2.1. Physical Model
The geometric model with a size of 6.15 m × 3.00 m × 3.20 m was established according to the inner cabin, and geometric model of the air conditioner, air purifier and fresh air inlet and outlet was built according to the real size respectively. The nonstructured meshing was used for the geometric model. After the mesh independence check, the final used mesh was 21,736 in total with a maximum size of 250 mm, and the quality of the mesh ranged from 0.30 to 0.99, which indicates good mesh quality.
2.2.2. Mathematical Model
To calculate the concentrations of PM2.5 and CO2 accurately, appropriate mathematical models should be selected to describe indoor physical processes such as flow, heat and mass transfer. The general format of the governing control equation for mass, heat, and momentum can be expressed as Equation (1):
where ρ is the air density, is a scalar variable, is time, is the component of velocity in three directions, is directions (i = 1, 2, 3), is the effective diffusion coefficient, and is the source term. By changing , the above equation can represent continuity, momentum, energy, and turbulence equations. Chen [23] compared the calculation effects of five K-ε turbulence models on indoor air flow, and the results showed that the K-ε RNG model has good performance and is recommended for indoor air flow simulation. Therefore, in this study, the K-ε RNG model was employed using the commercial software of Ansys Fluent 17.2 (Canonsburg, PA, USA).
To analysis the diffusion and purification process of pollutants indoors, a specific transportation model was employed to analyze component transport in this study. The transportation model can be described by Equation (2):
where is the volume concentration of the specie of s, is the diffusion coefficient of the specie of s, is the generation rate of the specie of s. The detailed model selected in this study is shown in Table 3. The governing transport equations were solved by means of the finite volume method. Pressure–velocity coupling equations were solved by the semi-implicit method for the pressure-linked equations (SIMPLE) algorithm. The discretization scheme for momentum, turbulence, and energy was the first-order upwind type.
Table 3.
Mathematical model settings.
2.2.3. Model Validation
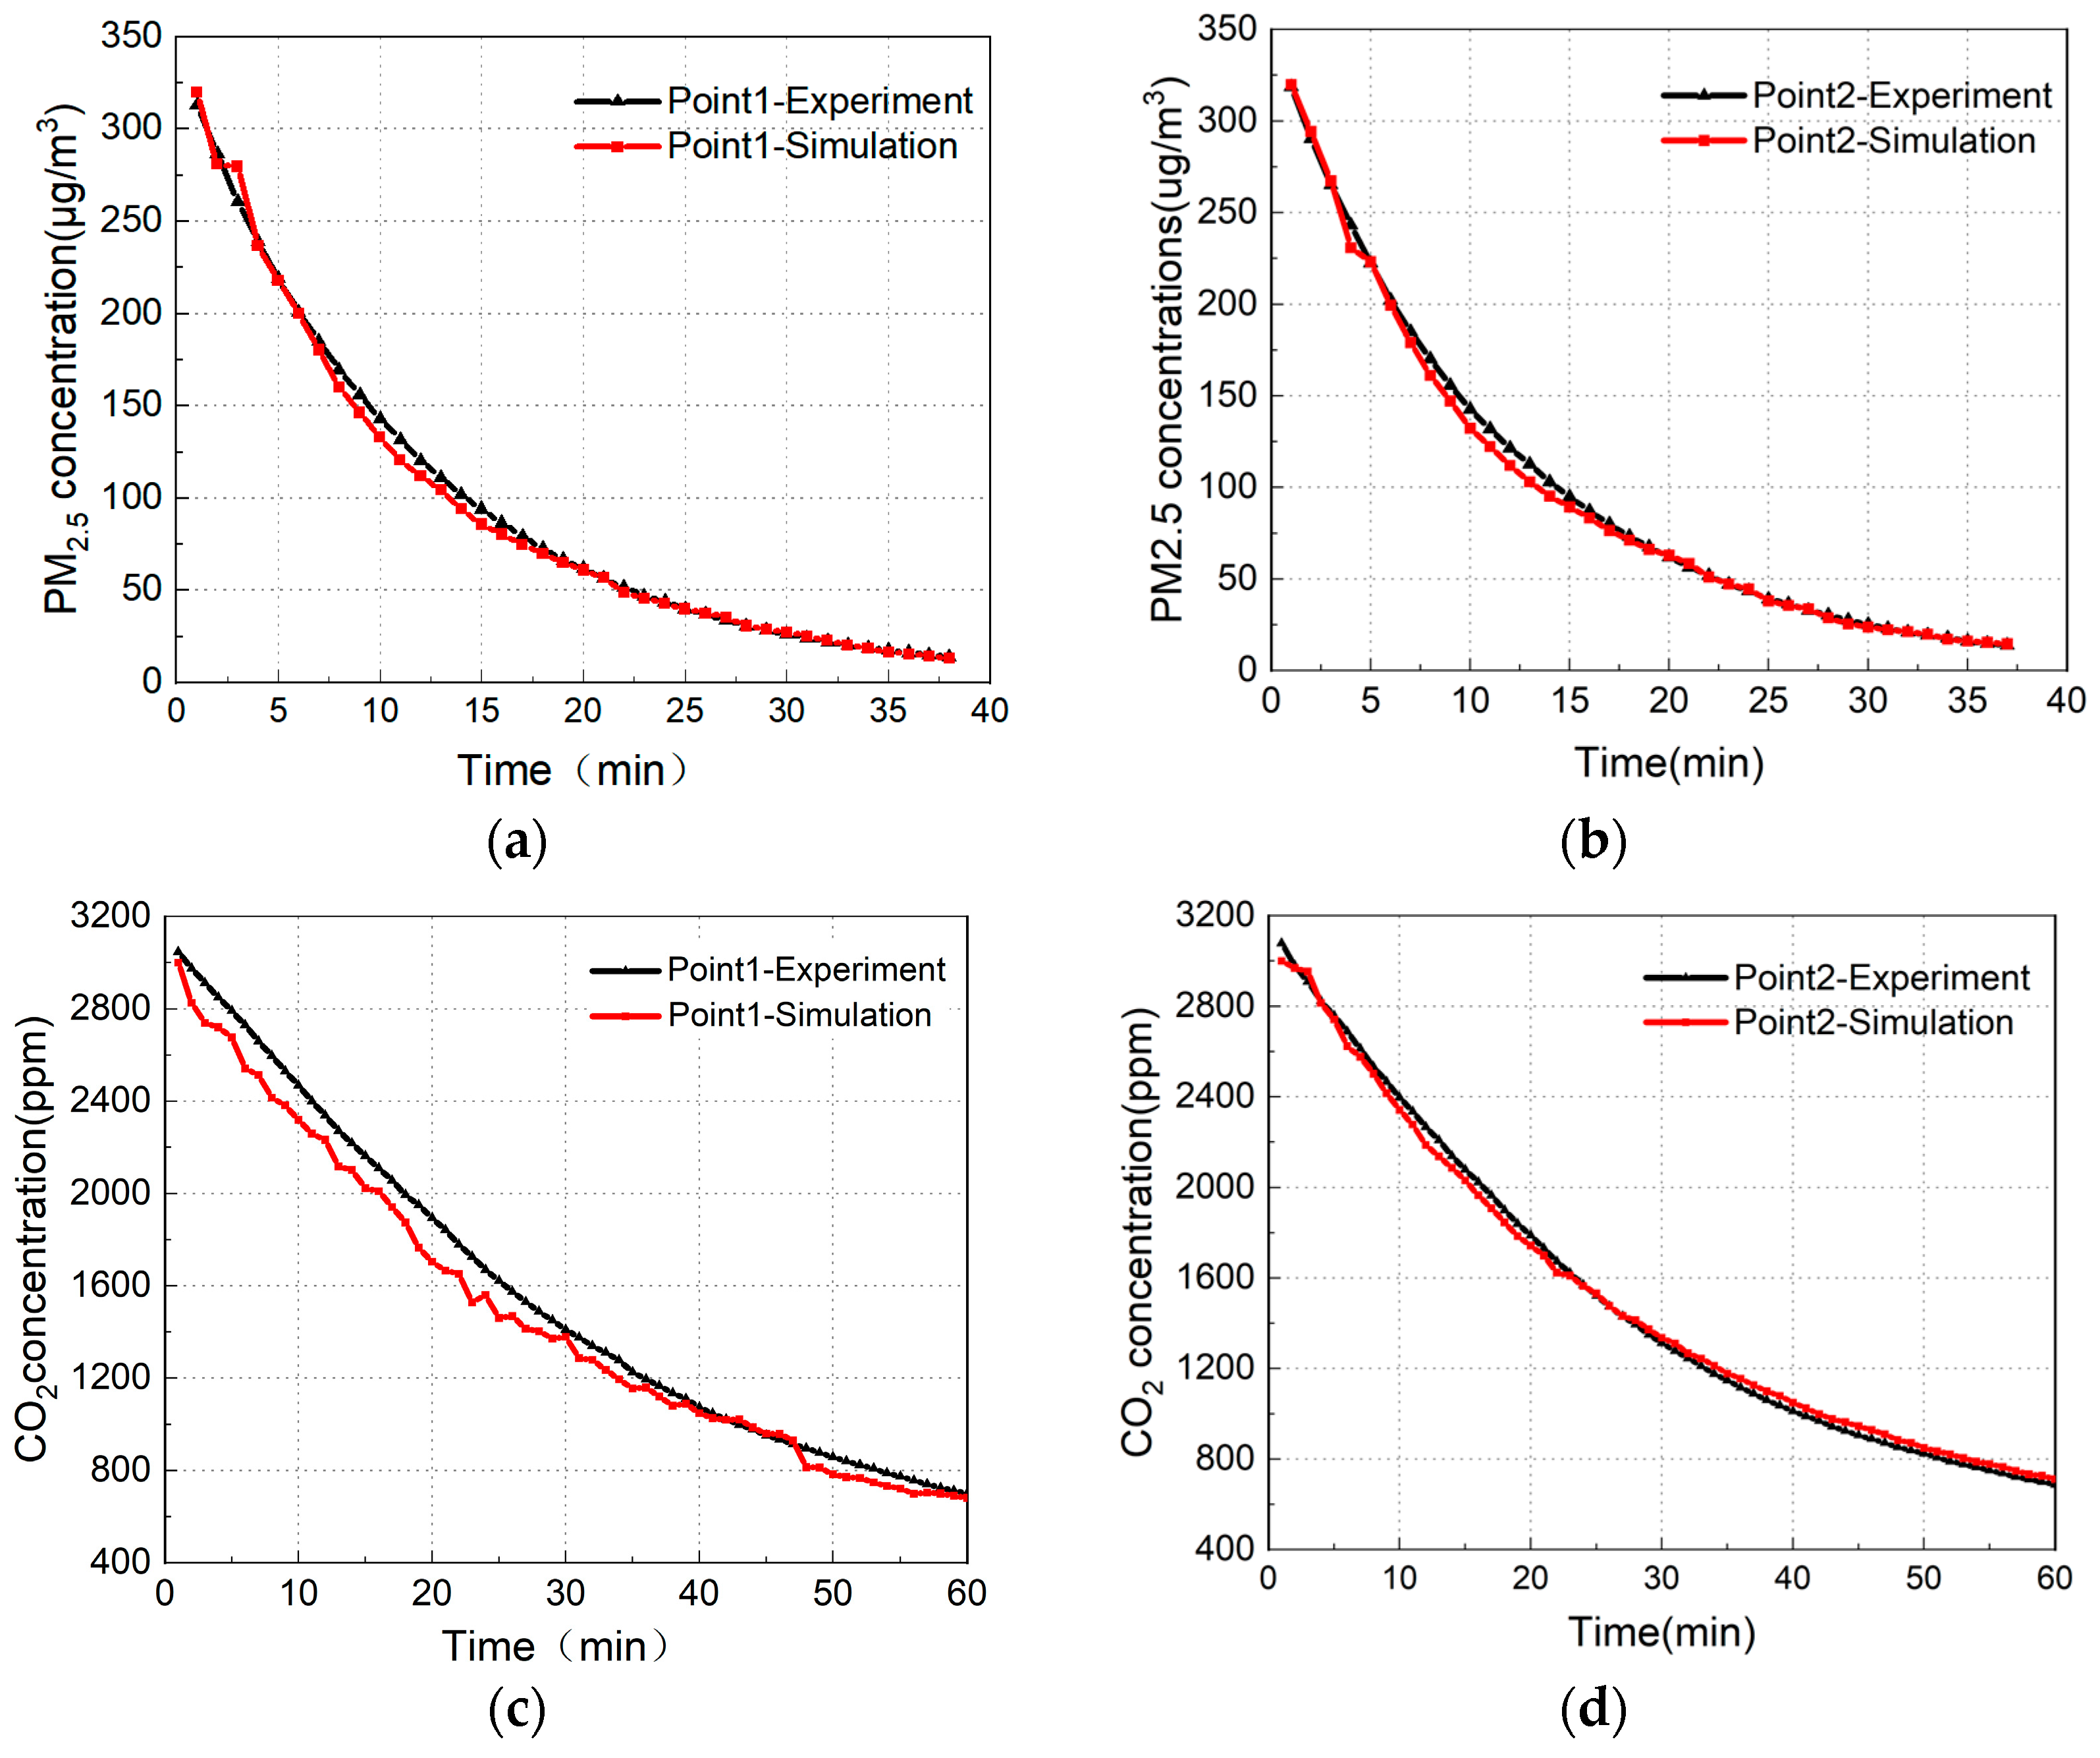
Figure 4 shows the comparison between the simulation and experimental results under the three-system joint operation condition. The PM2.5 concentration variations at test points 1 and 2 are shown in Figure 4a,b. The variation in the PM2.5 concentration shows good agreement with the experimental results, indicating that the selected mathematical model can better reflect the indoor air flow and mass transfer process. In Figure 4c,d, similar conclusions can be drawn for CO2.

Figure 4.
Comparison of the experimental and simulated results. (a) PM2.5 concentration at point 1; (b) PM2.5 concentration at point 2; (c) CO2 concentration at point 1; (d) CO2 concentration at point 2.
By comparing the simulation results with the experimental results, the relative error of the model can be obtained, as shown in Table 4. From the error analysis, it can be seen that the maximum error between the simulation results and the experimental results of test point 1 is less than 13%, and the average error is less than 5%. To better verify the accuracy of the model, statistical analysis was performed on the experimental and simulation results. Since the data did not meet the normality assumption, in this study, the non-parametric test method, Kruskal-Wallis ANOVA, was used for statistical analysis and the results was listed in Table 4. The median value of the experiment and simulation was close and the p value (Prob > Chi-Square) is much greater than 0.05, indicating that the simulation and experiment results are not significantly different at 0.05 significance level. Therefore, the established model is considered to have good accuracy and can be further expanded upon in simulation research.
Table 4.
The Kruskal-Wallis ANOVA test of the simulation and experiment data.
3. Simulation in a Real Office Room
The validation results of the above model show that the selected mathematical model can reflect the processes of indoor air flow, heat, and mass transfer well. In this section, the model is applied to study the effect of multisystem joint operation on the indoor air quality in a real office room. The mathematical model was consistent with the validated model above, as well as the type of boundary conditions.
3.1. Case Setup
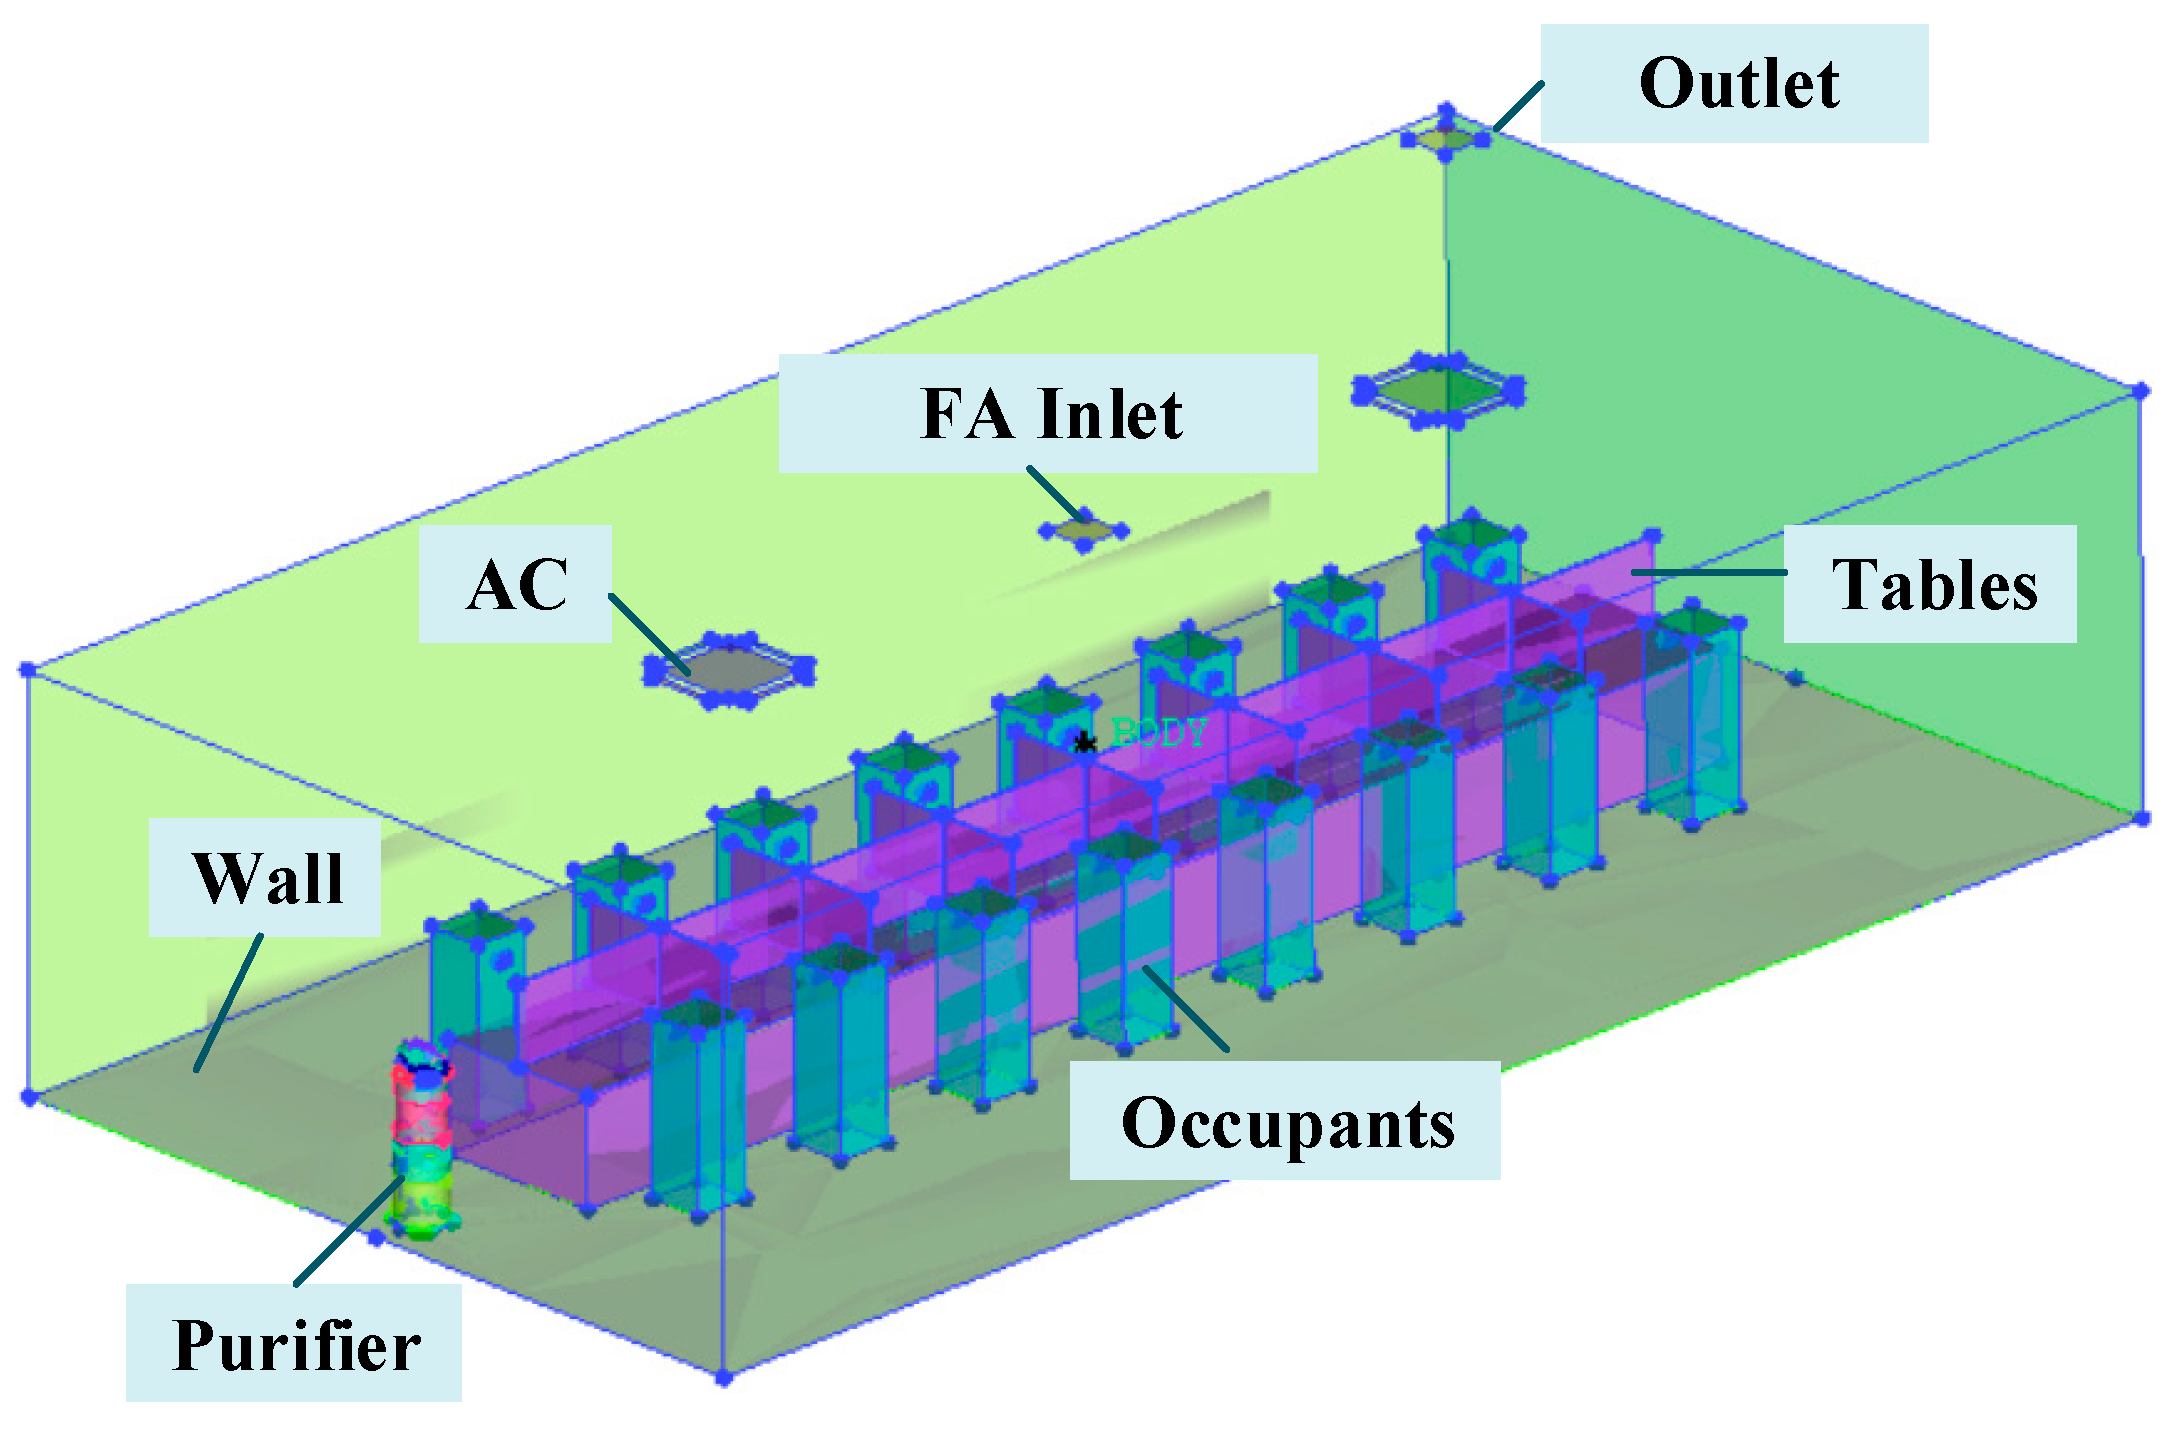
The actual office room size is 12.0 m × 6.0 m × 2.8 m, and the office can accommodate 16 people. The cooling load of the office is 8640 W. Thus, two cassette air conditioners with a cooling capacity of 6300 W are installed in the ceiling. The size of the inner part of the air conditioner is 840 mm × 204 mm × 840 mm. According to the required fresh air volume, the fresh air volume is designed to be 540 m3/h, and a 320 mm × 320 mm square diffuser is located at the exact center of the ceiling for the fresh air supply. In this large office room, a mechanical filtration air purifier with the size of 376 mm × 376 mm × 1310 mm was selected to remove the particles, which is suitable for building areas of 54~90 m2. The purification efficiency is 98% for PM2.5. The air supply velocity of the purifier is approximately 3.85 m/s. The geometric model of the actual office room and the equipment in it were built using the ANSYS ICEM CFD, as shown in Figure 5.
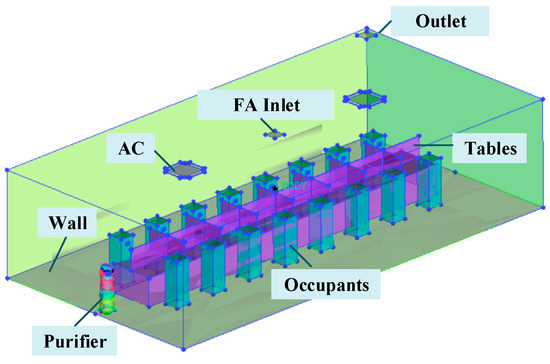
Figure 5.
Geometry of the real office room.
This simulation mainly studies the influence of different joint operation modes of air conditioners, fresh air systems and air purifiers on the purification effect of PM2.5 and CO2 in different areas of a room. Thus, in this study, four cases were designed, as listed in Table 5.
Table 5.
Simulation cases.
To analyze the impact of joint operation modes on the concentration of PM2.5 and CO2, it is necessary to determine the air supply parameters of the air conditioner, fresh air system and air purifier. A relevant study has shown that when the air supply elevation angle of the air conditioner is approximately 30°, the air temperature in the working area is least affected by the heat source [24]. Therefore, the air supply elevation angle of the air conditioner used in the simulation study is set at 39°, and the air supply wind speed is 2.33 m/s. Our pre-test results showed that when the air supply speed of an air purifier is 100%, setting the air supply elevation angle of the air purifier at 35° is more beneficial for room purification. Therefore, the air purifier is set at a maximum wind speed of 3.85 m/s, and the air supply elevation angle is set at 35°. The air supply speed of the fresh air system is 1.5 m/s. The severe pollution of the outdoor environment (PM2.5 concentration of 200 μg/m3) is taken as an example, so the initial indoor PM2.5 concentration is set at 200 μg/m3, and the CO2 concentration is set to 2000 ppm in this study. The specific boundary conditions and initial conditions of the simulation are shown in Table 6.
Table 6.
Boundary and initial conditions.
3.2. Monitoring Points
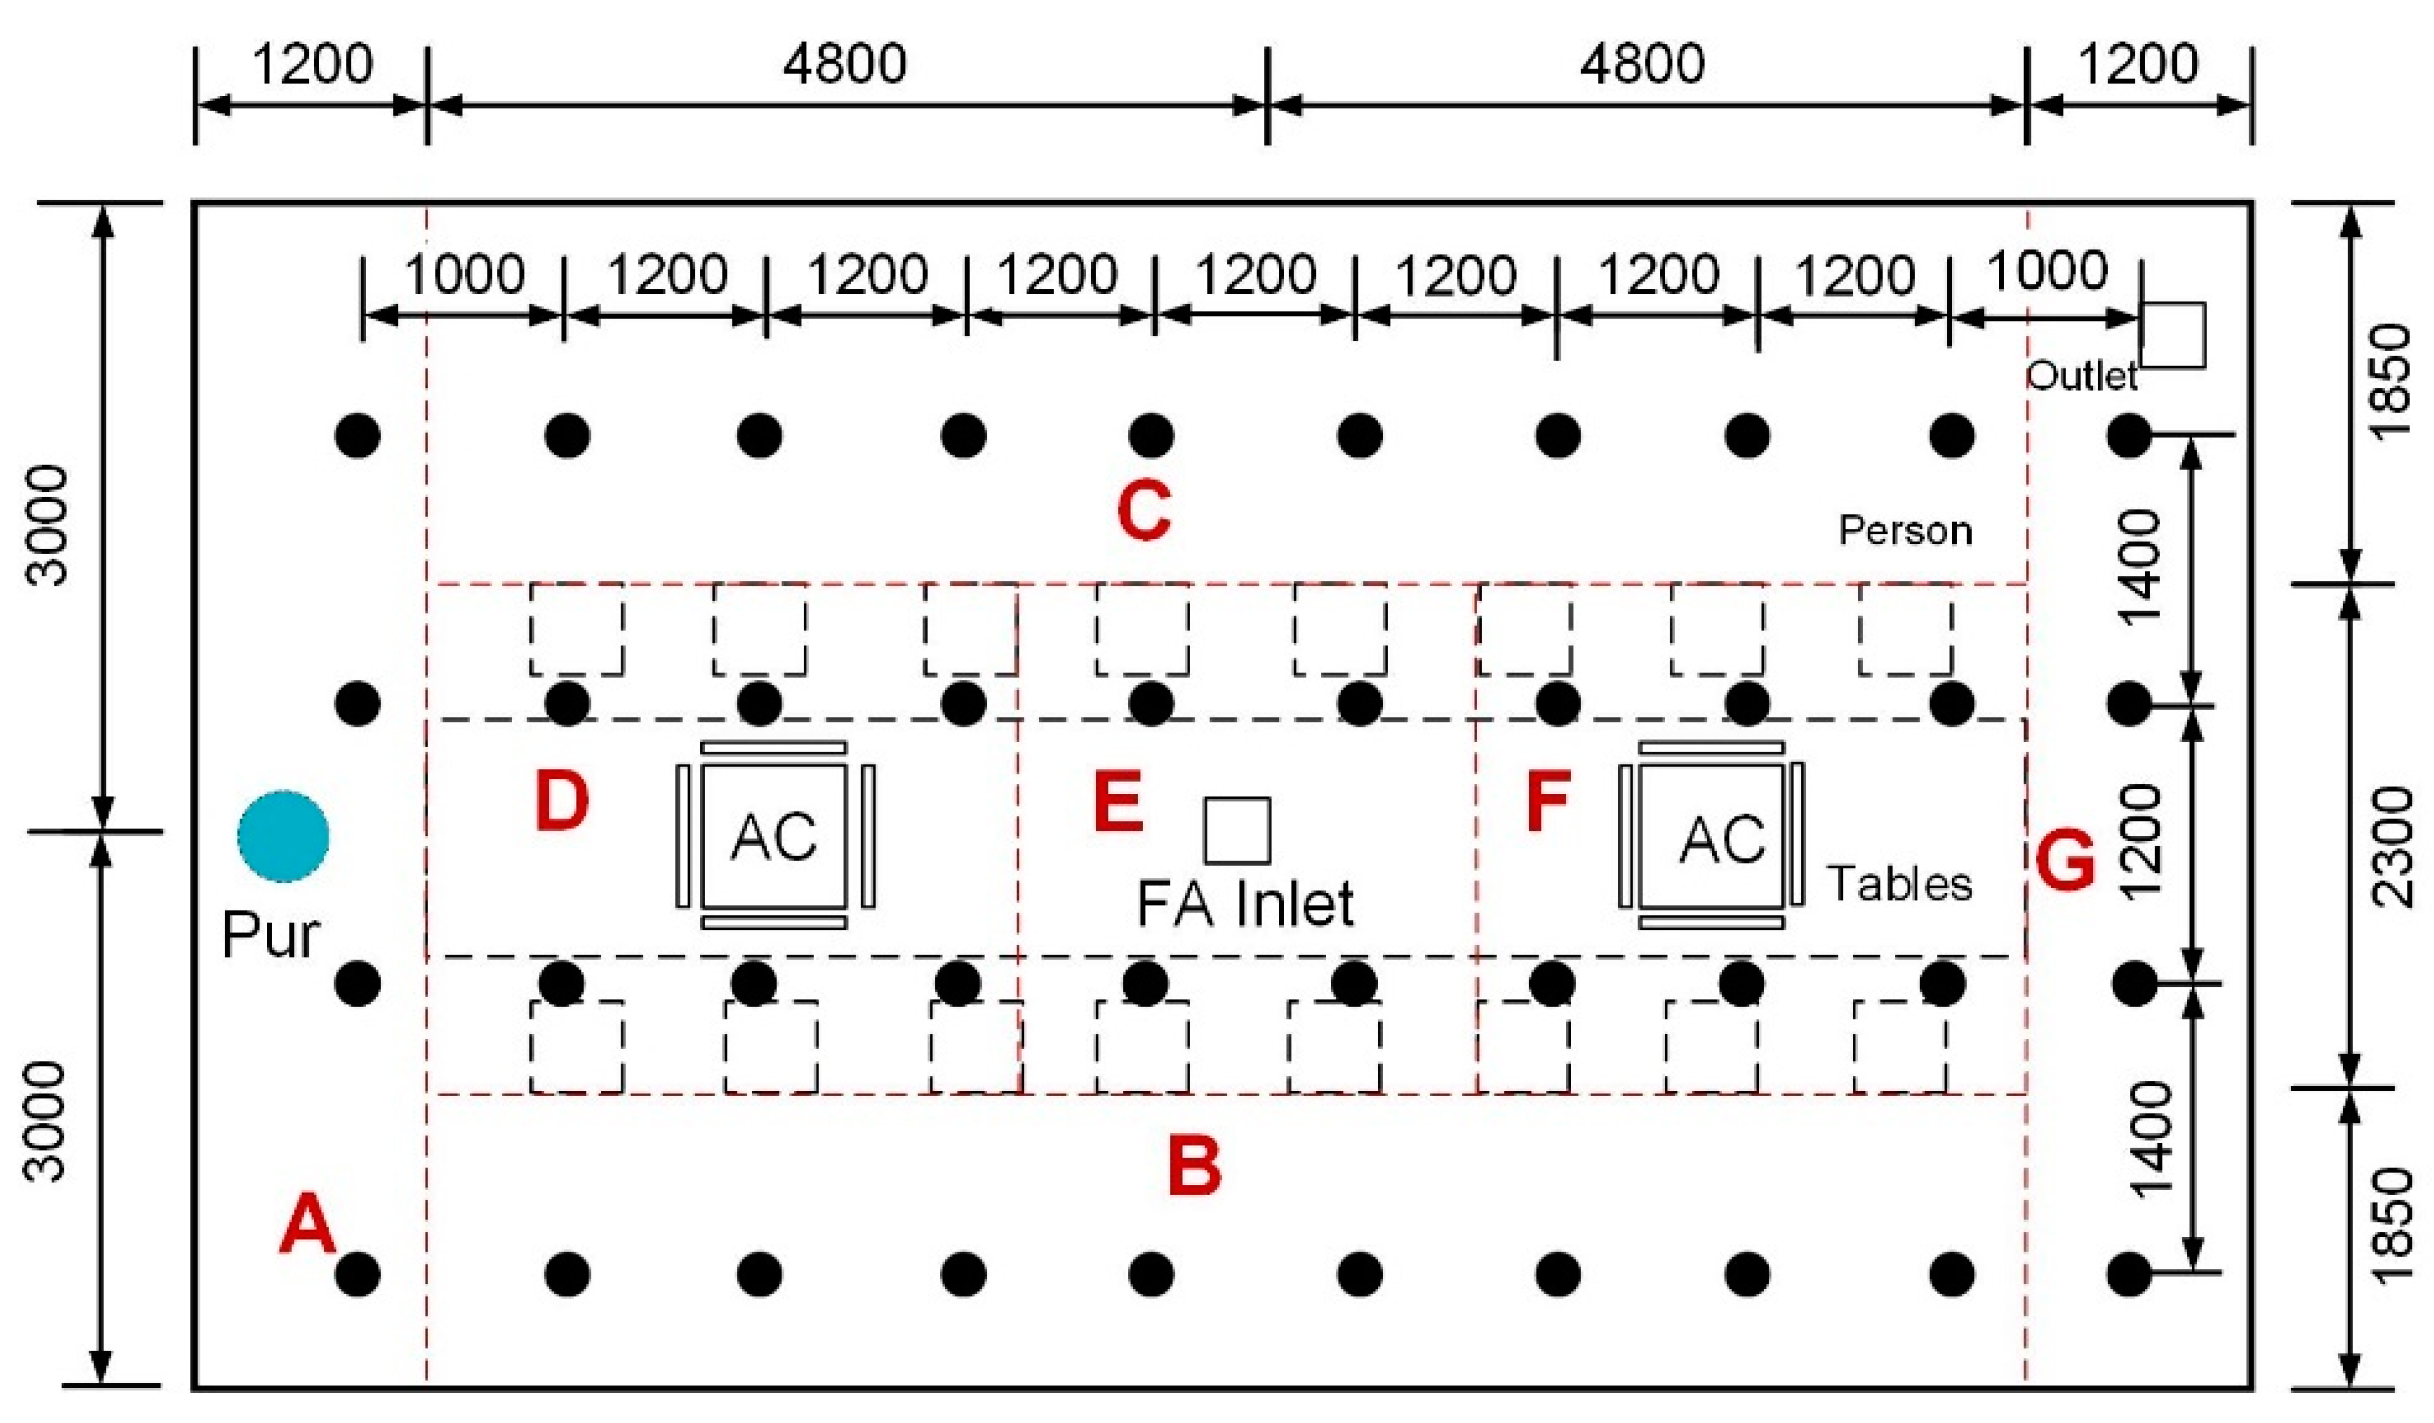
To analyze the PM2.5 and CO2 distributions in the occupied working zone, the concentrations of PM2.5 and CO2 at a height of 1.2 m above the floor were monitored. Due to the different indoor air distributions under different operating conditions, the indoor temperature, wind speed, and PM2.5 and CO2 concentration distributions are uneven. To analyze the airflow pattern and the effect of airflow pattern on PM2.5 and CO2 distribution under different operation modes, the office is divided into 7 zones (zone A to zone G), and 40 measuring points are set up after comprehensive consideration of the office layout and personnel distribution. The zones divided by the red dash line and the arrangement of the measuring points are shown in Figure 6.
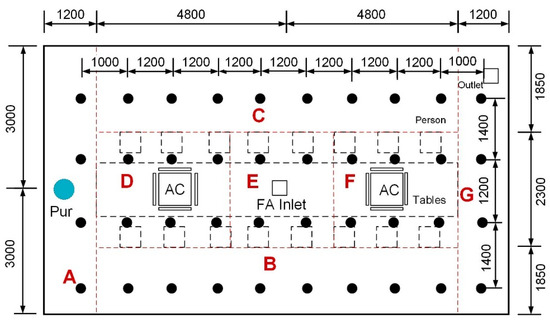
Figure 6.
Layout of the different zones and measuring points. Office area: D, E, F; Aisle area: A, B, C, G.
4. Results
In this section, the simulation results of the cases were analyzed and compared to study the impact of different operation conditions on the indoor air quality. The airflow pattern has a significant impact on the concentration distribution of PM2.5 and CO2. Thus, the airflow pattern under different operation conditions was analyzed first in this section. Then, the PM2.5 and CO2 distributions under different operation conditions were analyzed.
4.1. Airflow Pattern
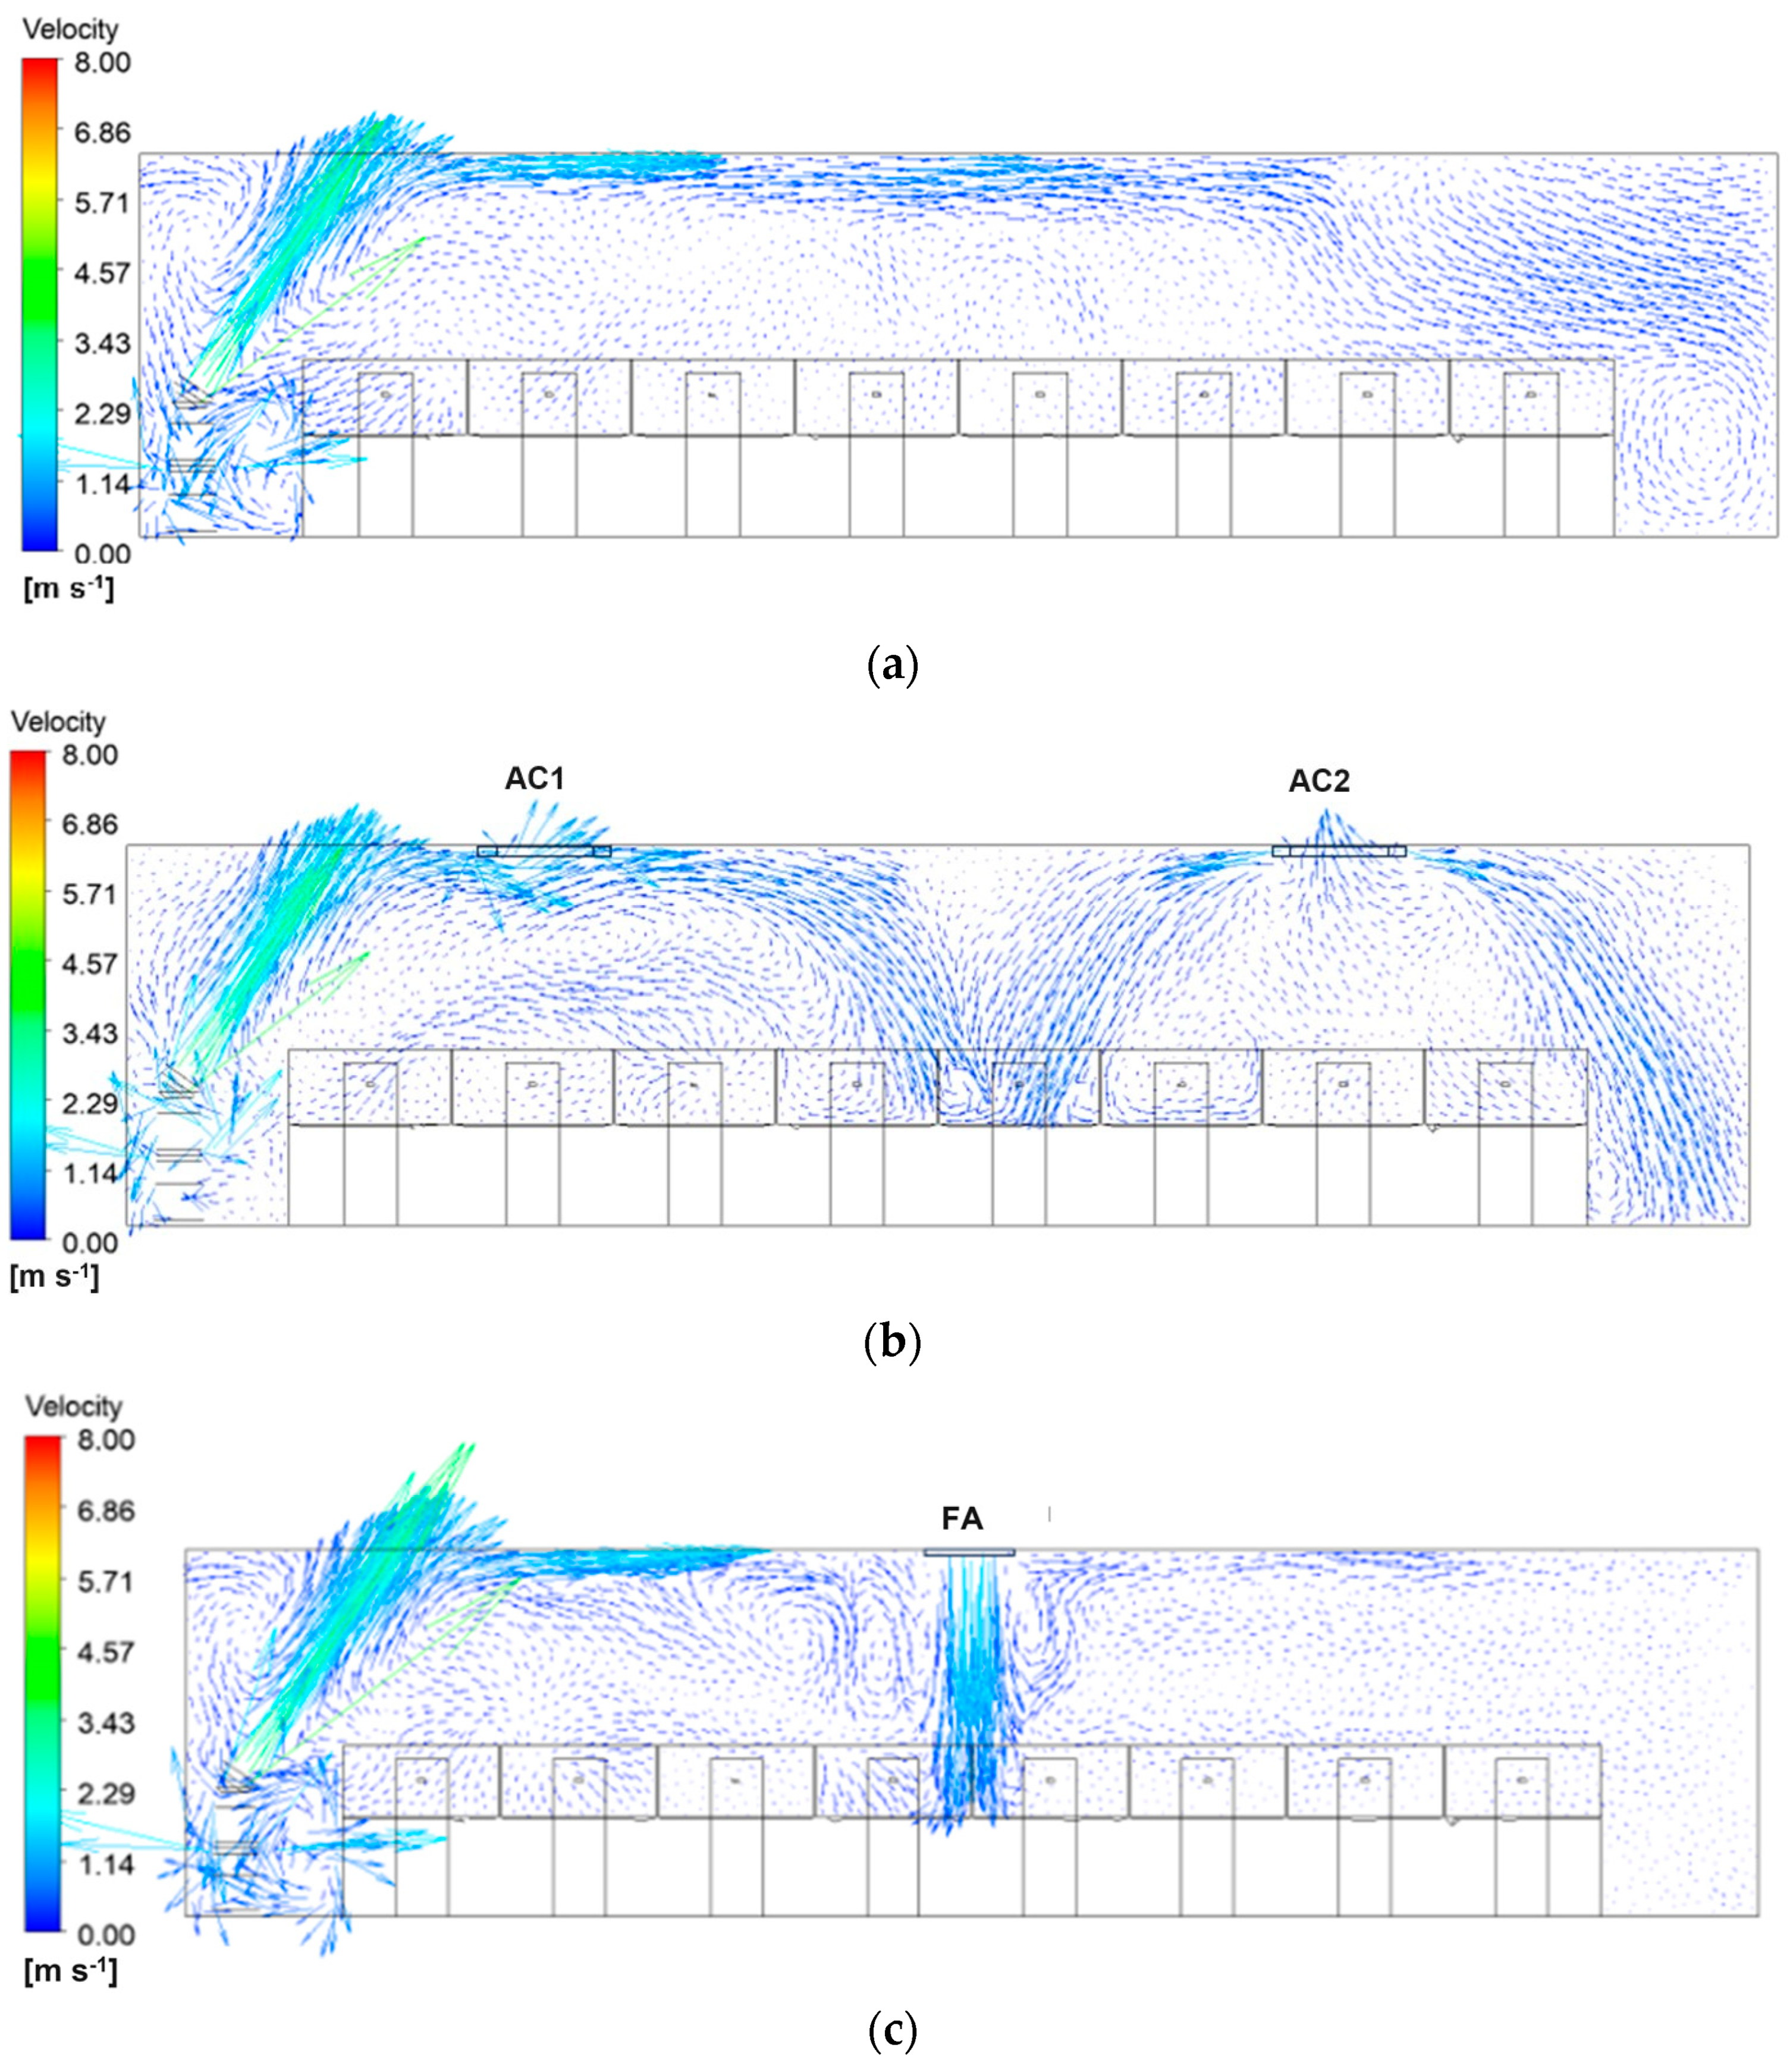
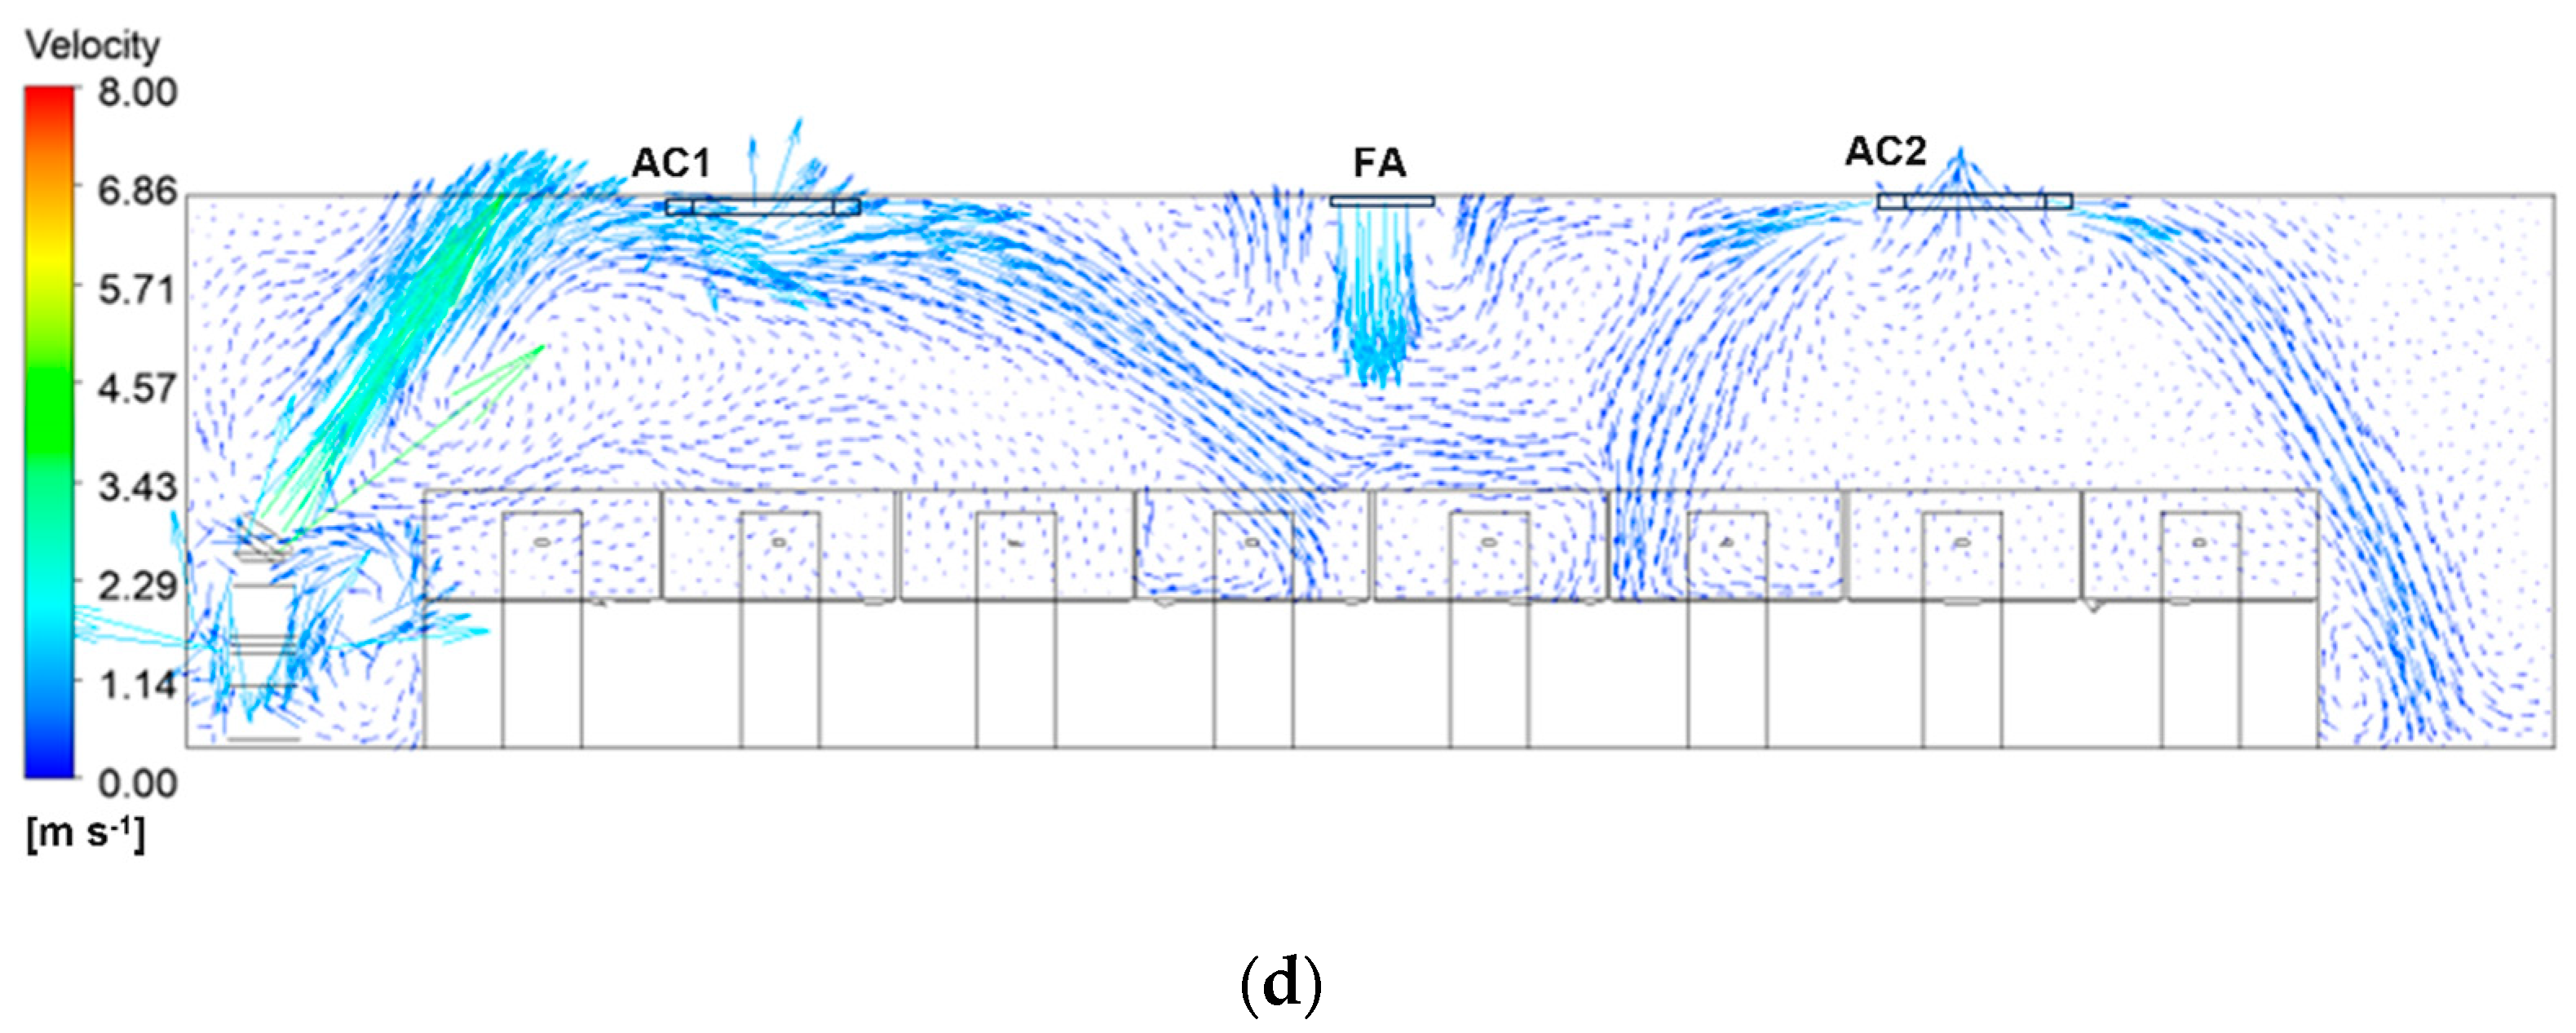
Figure 7a shows the velocity vector diagram at the plane of y = 3.0 m in the room when the purifier is running alone. The air flow from the purifier inclines upward first and then adheres along the ceiling under the influence of a high initial velocity, while the flow velocity in the lower part of the room is low. As the supply air moves forward, the horizontal velocity gradually decreases, and it can no longer continue to adhere to the ceiling, forming local vortices in the right part of the room. Figure 7b shows the indoor velocity vector diagram when the purifier and air conditioners are running at the same time. The airflow from the purifier intersects and mixes with the airflow from the AC1. In the middle of the room, the airflow from AC1 and AC2 collided and moved downward. Part of the airflow returns to the purifier, accelerating the process of the pollutants between the air purifier and the AC1 returning to the air purifier. The airflow in the right part of the room was mainly determined by AC2 due to the impact of the airflow from the purifier deceased, which may make it more difficult for the polluted air on the right side to return to the purifier.
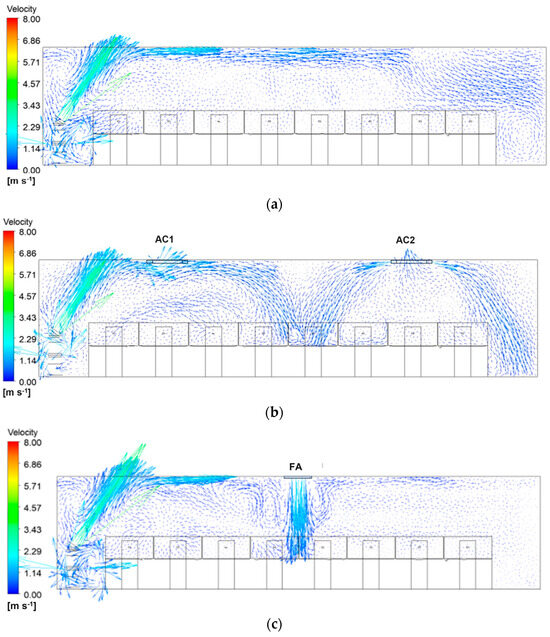
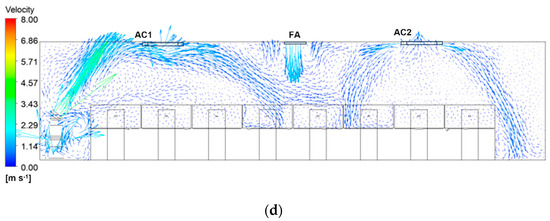
Figure 7.
Airflow pattern at y = 3.0 m under different conditions. (a) Velocity field at y = 3.0 m under the K1 condition; (b) Velocity field at y = 3.0 m under the K2 condition; (c) Velocity field at y = 3.0 m under the K3 condition; (d) Velocity field at y = 3.0 m under the K4 condition.
In K3 condition, the fresh air system operates together with the purifier. The attached layer generated by the purifier was disrupted due to the large supply air velocity of the fresh air system, as shown in Figure 7c. Then, the airflow from the purifier returns. Thus, the air velocity in the right part of the room was significantly lower than that in the left part. Thus the pollutants in the right part are mainly removed by the fresh air system, since the fresh air can dilute and exhaust the pollution.
In Figure 7d, the purifier, AC and fresh air system operate together. Under this condition (K4), the velocity field is consistent with the superposition of K2 and K3. The airflow from the air purifier collided and mixed with the air outlet of AC1, and the fresh air system separated the room into two parts. On the left part, the air flow pattern is similar to the K3 condition. On the right, the air flow in the right part of the room is determined by the AC2, and the polltant remove mainly depended on the dilution of the fresh air system. Compared with K3, the fresh air velocity attenuation of the airflow from the fresh air system was more serious due to the disturbance of the airflow from the ACs. The air flow of the ACs may help to enhance the mix of different airflow and improve the indoor air quality. The detailed air quality improvement was analysed in the following sections.
4.2. PM2.5 Concentrations
To analyze the influence of the joint operation of air conditioners, a fresh air system and a purifier on the indoor PM2.5 concentration, the indoor PM2.5 concentration distribution and the purification time required to reach the upper limit of the PM2.5 concentration (15 μg/m3) [24] were calculated. To ensure the stability of the indoor air flow, the results of joint operation of the purifier, air conditioner and fresh air system for 15 min were selected to analyze the PM2.5 concentration distribution, and finally, the influence of different operating conditions on the purification time of each area of the room was further analyzed.
4.2.1. The Impact of Air Conditioners
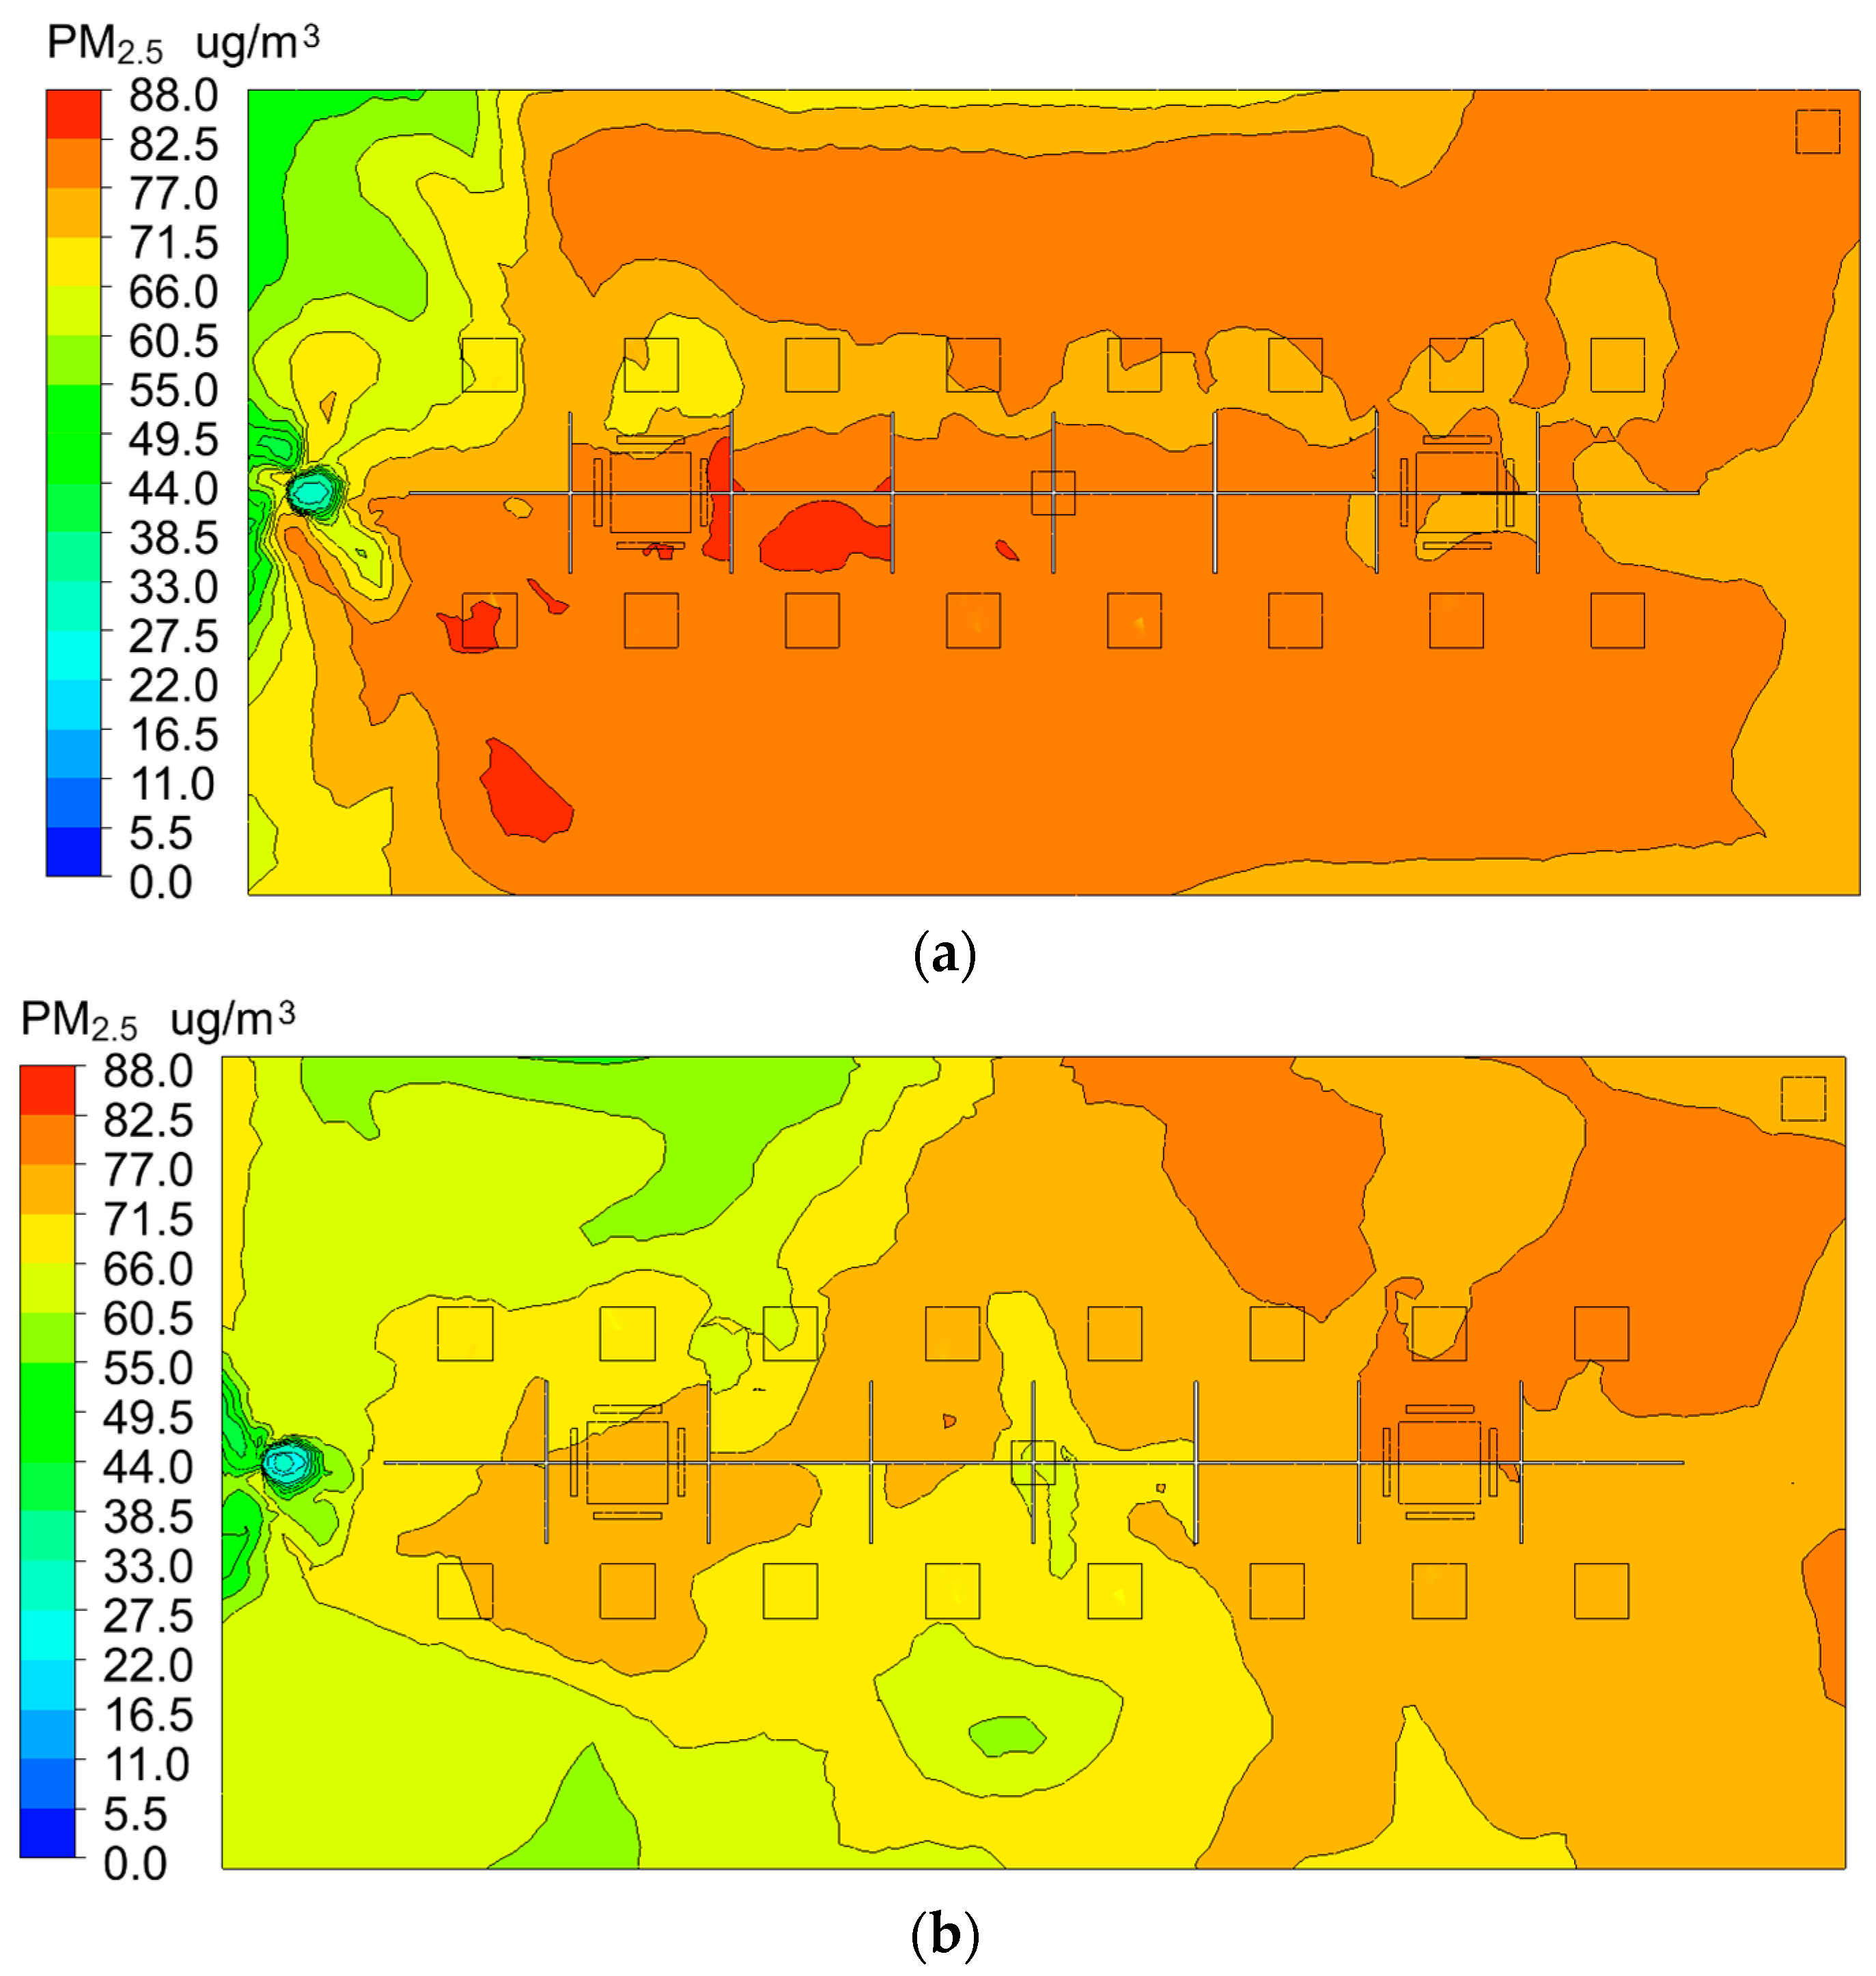
Figure 8 shows the PM2.5 concentration distributions under the K1 and K2 conditions. When the purifier runs alone, the PM2.5 concentration distributions was uniform in most zone of the room except that the zone A shows much lower concentration, as shown in Figure 8a. The mean concentration is about 80 μg/m3. It is because that the purifier located in zone A. When air purifier runs only, the purifier is recommended to located near the occupants to achieve better purification performance for the active zone of the occupants. When the air conditioners run together with the purifier, good purification can be achieved in the left part of the room due to the increased airflow disturbance, as shown in Figure 8b. Compared with that of K1, the mean PM2.5 concentration in the left part of the room under K2 decreased by approximately 10 μg/m3, indicating that the air conditioner helped to speed up purification. However, the PM2.5 concentration in the right part of the room decreased by only approximately 3 μg/m3 because the air flow from the purifier was hindered by that of the ACs, which was caused by the mixing effect of the AC airflow. Thus, the PM2.5 concentration of the left part of the room is lower than that of the right part. Based on this result, the occupants are recommended to work in the zones between air purifier and AC when they operate together. In other words, it is recommended to arrange the air purifier and air conditioner in opposite position to prevent air flow obstruction that could lead to slightly higher pollutant concentrations in some areas.

Figure 8.
PM2.5 concentration distributions under K1 and K2. (a) PM2.5 concentration distribution under the K1 condition; (b) PM2.5 concentration distribution under K2 condition.
To further analyze the impact of different operating conditions, this paper defines the time used to reduce the PM2.5 concentration to 15 μg/m3 as the purification time, and the purification time of each zone of the room is the average purification time of each measuring point in the zone. Table 7 lists the purification times for the different zones of the room. From Table 7, the purification times of the different zones are similar under case K1, approximately 46 min. The purification time of zone A was slightly shorter than that of the other zones since zone A is nearest to the purifier. Under case K2, the air conditioner operates together with the purifier, and the purification times of zones F and G were slightly longer than those of the other zones due to the long distance. Compared with that of K1, the purification time of K2 was 15.2% shorter since the mixing of the air conditioner accelerated the purification.
Table 7.
Purification time in different zones under different operating conditions.
4.2.2. The Impact of the Fresh Air System
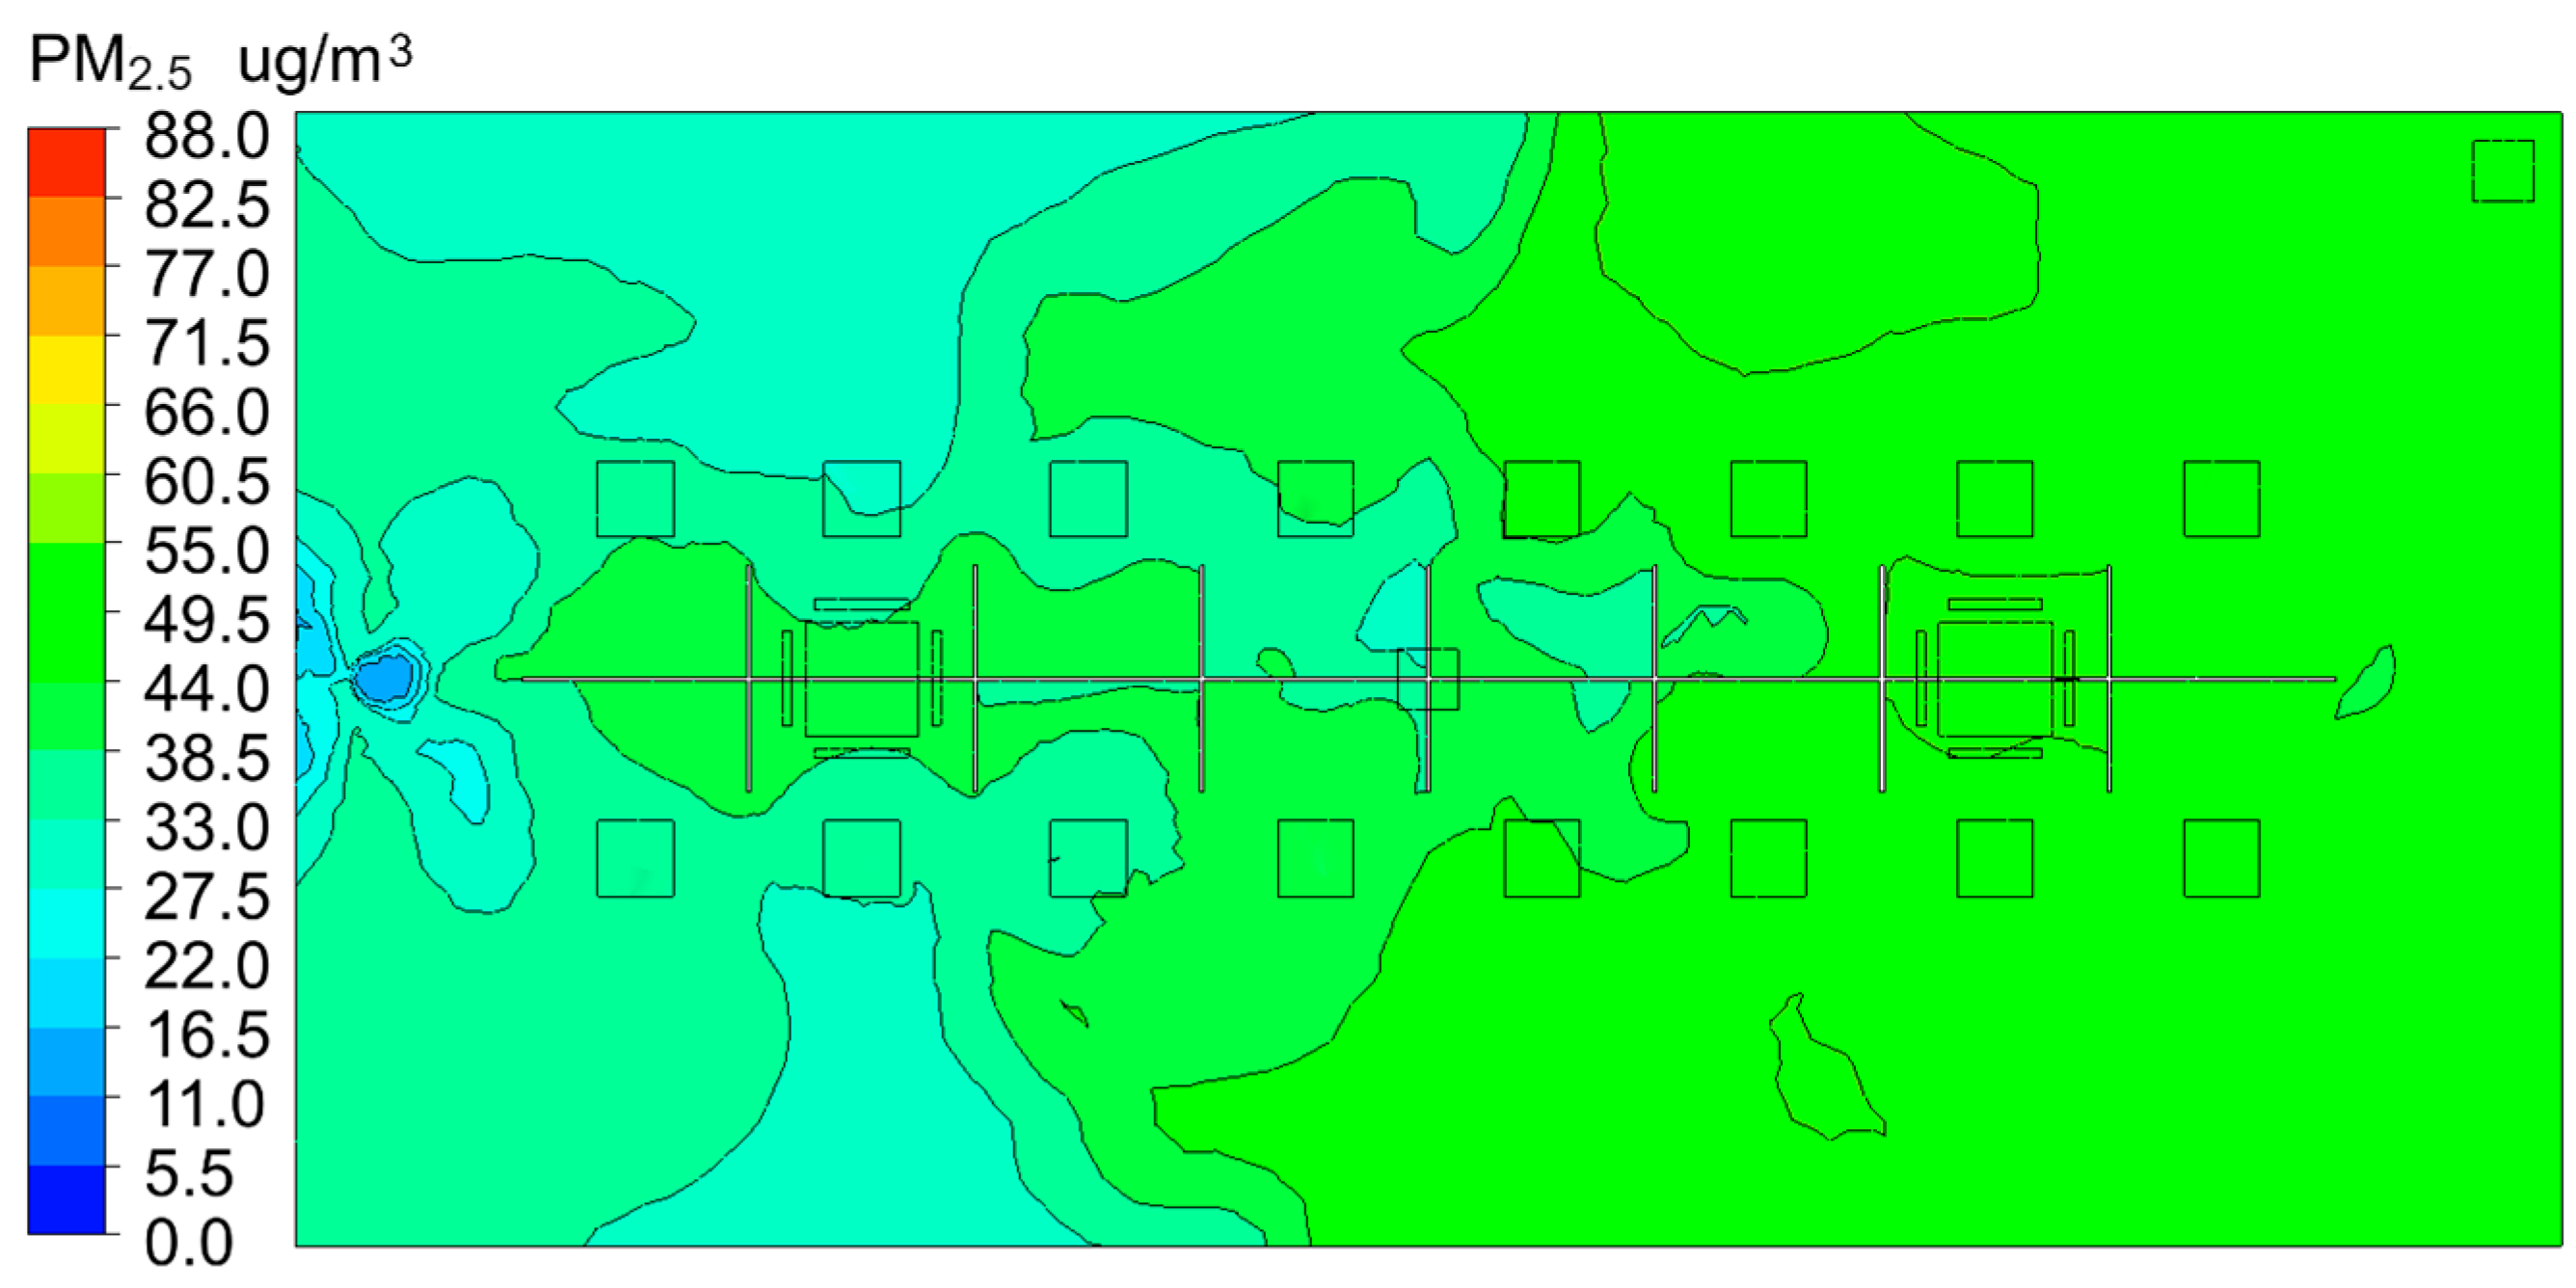
Figure 9 shows the PM2.5 concentration distribution under K3. When the fresh air system was turned on, the concentration of the human breathing zone decreased from approximately 80 μg/m3 to approximately 65 μg/m3 compared with that under K1, and the purification effect was significantly enhanced because the indoor pollutants were diluted by the fresh air and then exhausted from the outlet. Therefore, fresh air systems have a great dilution effect on indoor pollutants. Comparing zone B with zone C, the pollutants in area B are not easily discharged due to the location of the outlet. Thus, the concentration in area C was approximately 6.7 μg/m3 lower than that in area B. In addition, the mean concentration in the right part of the room was slightly greater than that in the right part. This is because of the combined effect of the purifier and fresh air system in the left part and the weaker effect of the purifier in the right part of the room, which can also be seen from the velocity field in Figure 7c. Thus, the maximum concentration occurred near the human body in the right part of the room, with a maximum value of 68.3 μg/m3.
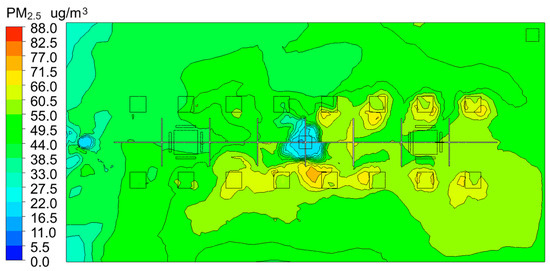
Figure 9.
PM2.5 concentration distribution under K3.
The purification times under K3 are listed in Table 7. Compared with that under K1, the purification time under K3 decreased to 32 min, which reduced the purification time by 30.4%. The purification time of the middle area of the room (zones D and E) was reduced to 31 min, and the purification time of area A was reduced to 30 min. It can be concluded that the dilution and discharge of pollutants by the fresh air system can significantly shorten the purification time.
4.2.3. The Impact of the Joint Operation Mode
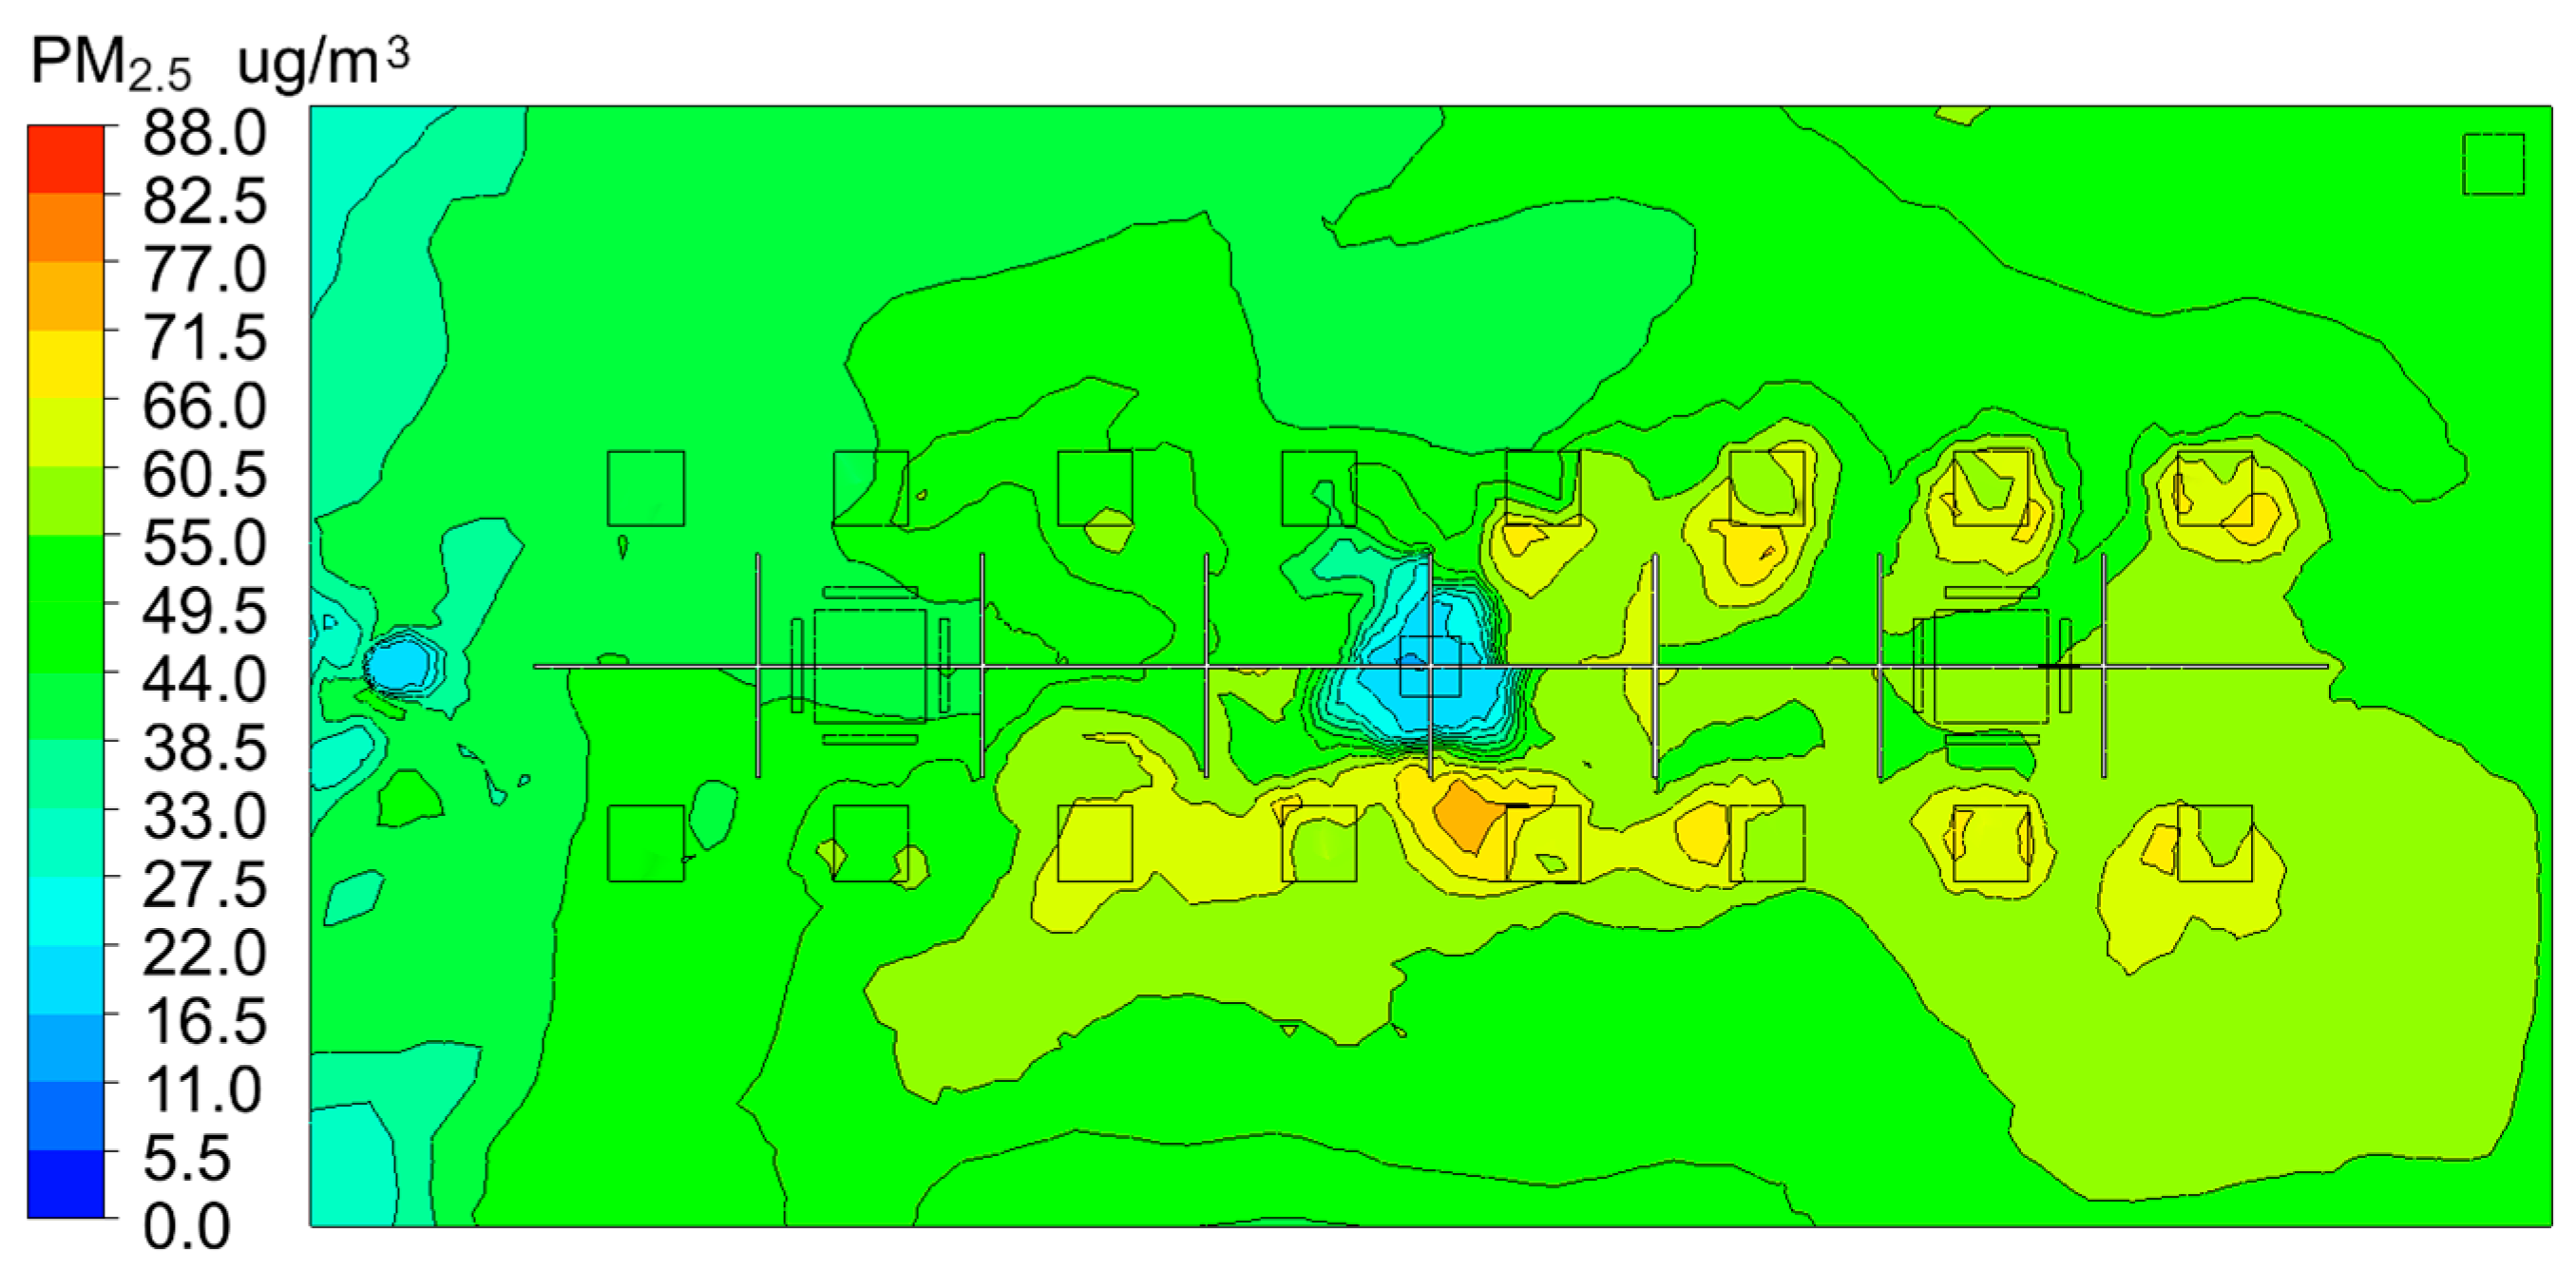
When the systems were operated in full joint operation mode, the PM2.5 concentration of the occupant zone was much lower due to the dilution of fresh air system and the disturbance of the airflow from air conditioners, as shown in Figure 10. Compared with K1, the mean PM2.5 concentration for the left part of the room decreased from approximately 86.9 μg/m3 to approximately 43.4 μg/m3 and from approximately 83.8 μg/m3 to approximately 52.8 μg/m3 for the right part of the room. Because the fresh air system and air conditioners caused a certain obstacle to the jet from the purifier, the concentration of pollutants in the right part of the room was nearly 10 μg/m3 higher than that in the left part of the room. Compared with K3, the air conditioner enhanced the disturbance of the airflow, which helped to improve the dilution of the fresh air system and purification of the purifier. Thus, the maximum concentration for the left part of the room decreased from 62.1 μg/m3 to 46.6 μg/m3 and from 68.3 μg/m3 to 49.7 μg/m3 for the right part of the room, respectively.
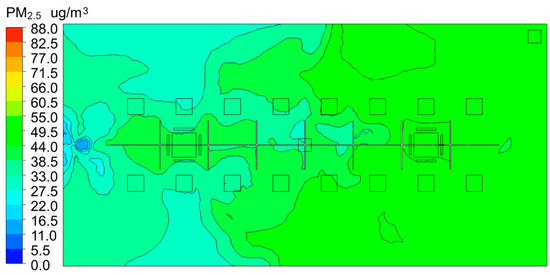
Figure 10.
PM2.5 concentration distribution under K4.
Zone A had the shortest purification time of 25 min. The purification time of the middle part of the room (zones C, D and E) was 28 min. The maximum purification time under the K4 condition was 31 min (zone G), which was 32.6% shorter than that under the K1 condition. Compared with that under K2, the purification time under K4 was 20.5% shorter, and compared with that under K3, the purification time under K4 was 3% shorter. It can be concluded that the joint operation of the three systems has the greatest effect on the purification of PM2.5. The fresh air system and air conditioner can help to enhance the purification effect, especially the fresh air system, since the fresh air system can dilute and remove pollution effectively.
The air conditioners can improve the performance by enhance the mix of indoor air. When the air purifier operates together with air conditioners, there arrangement should prevent air flow obstruction. For instance, they can be in opposite position and occupant working in the middle zone of the room. The fresh air system can significantly enhance the performance for remove PM2.5 due to dilution effect. The air flow from AC also improves the uniformity of PM2.5 distribution.
4.3. CO2 Concentration
The indoor CO2 concentration is a crucial indicator for assessing the indoor air quality. This section provides a comparative analysis of the indoor CO2 levels under conditions with and without a fresh air system, as well as the impact of the combined operation of air conditioners or purifiers on the distribution of the indoor CO2 concentration.
4.3.1. Without a Fresh Air System
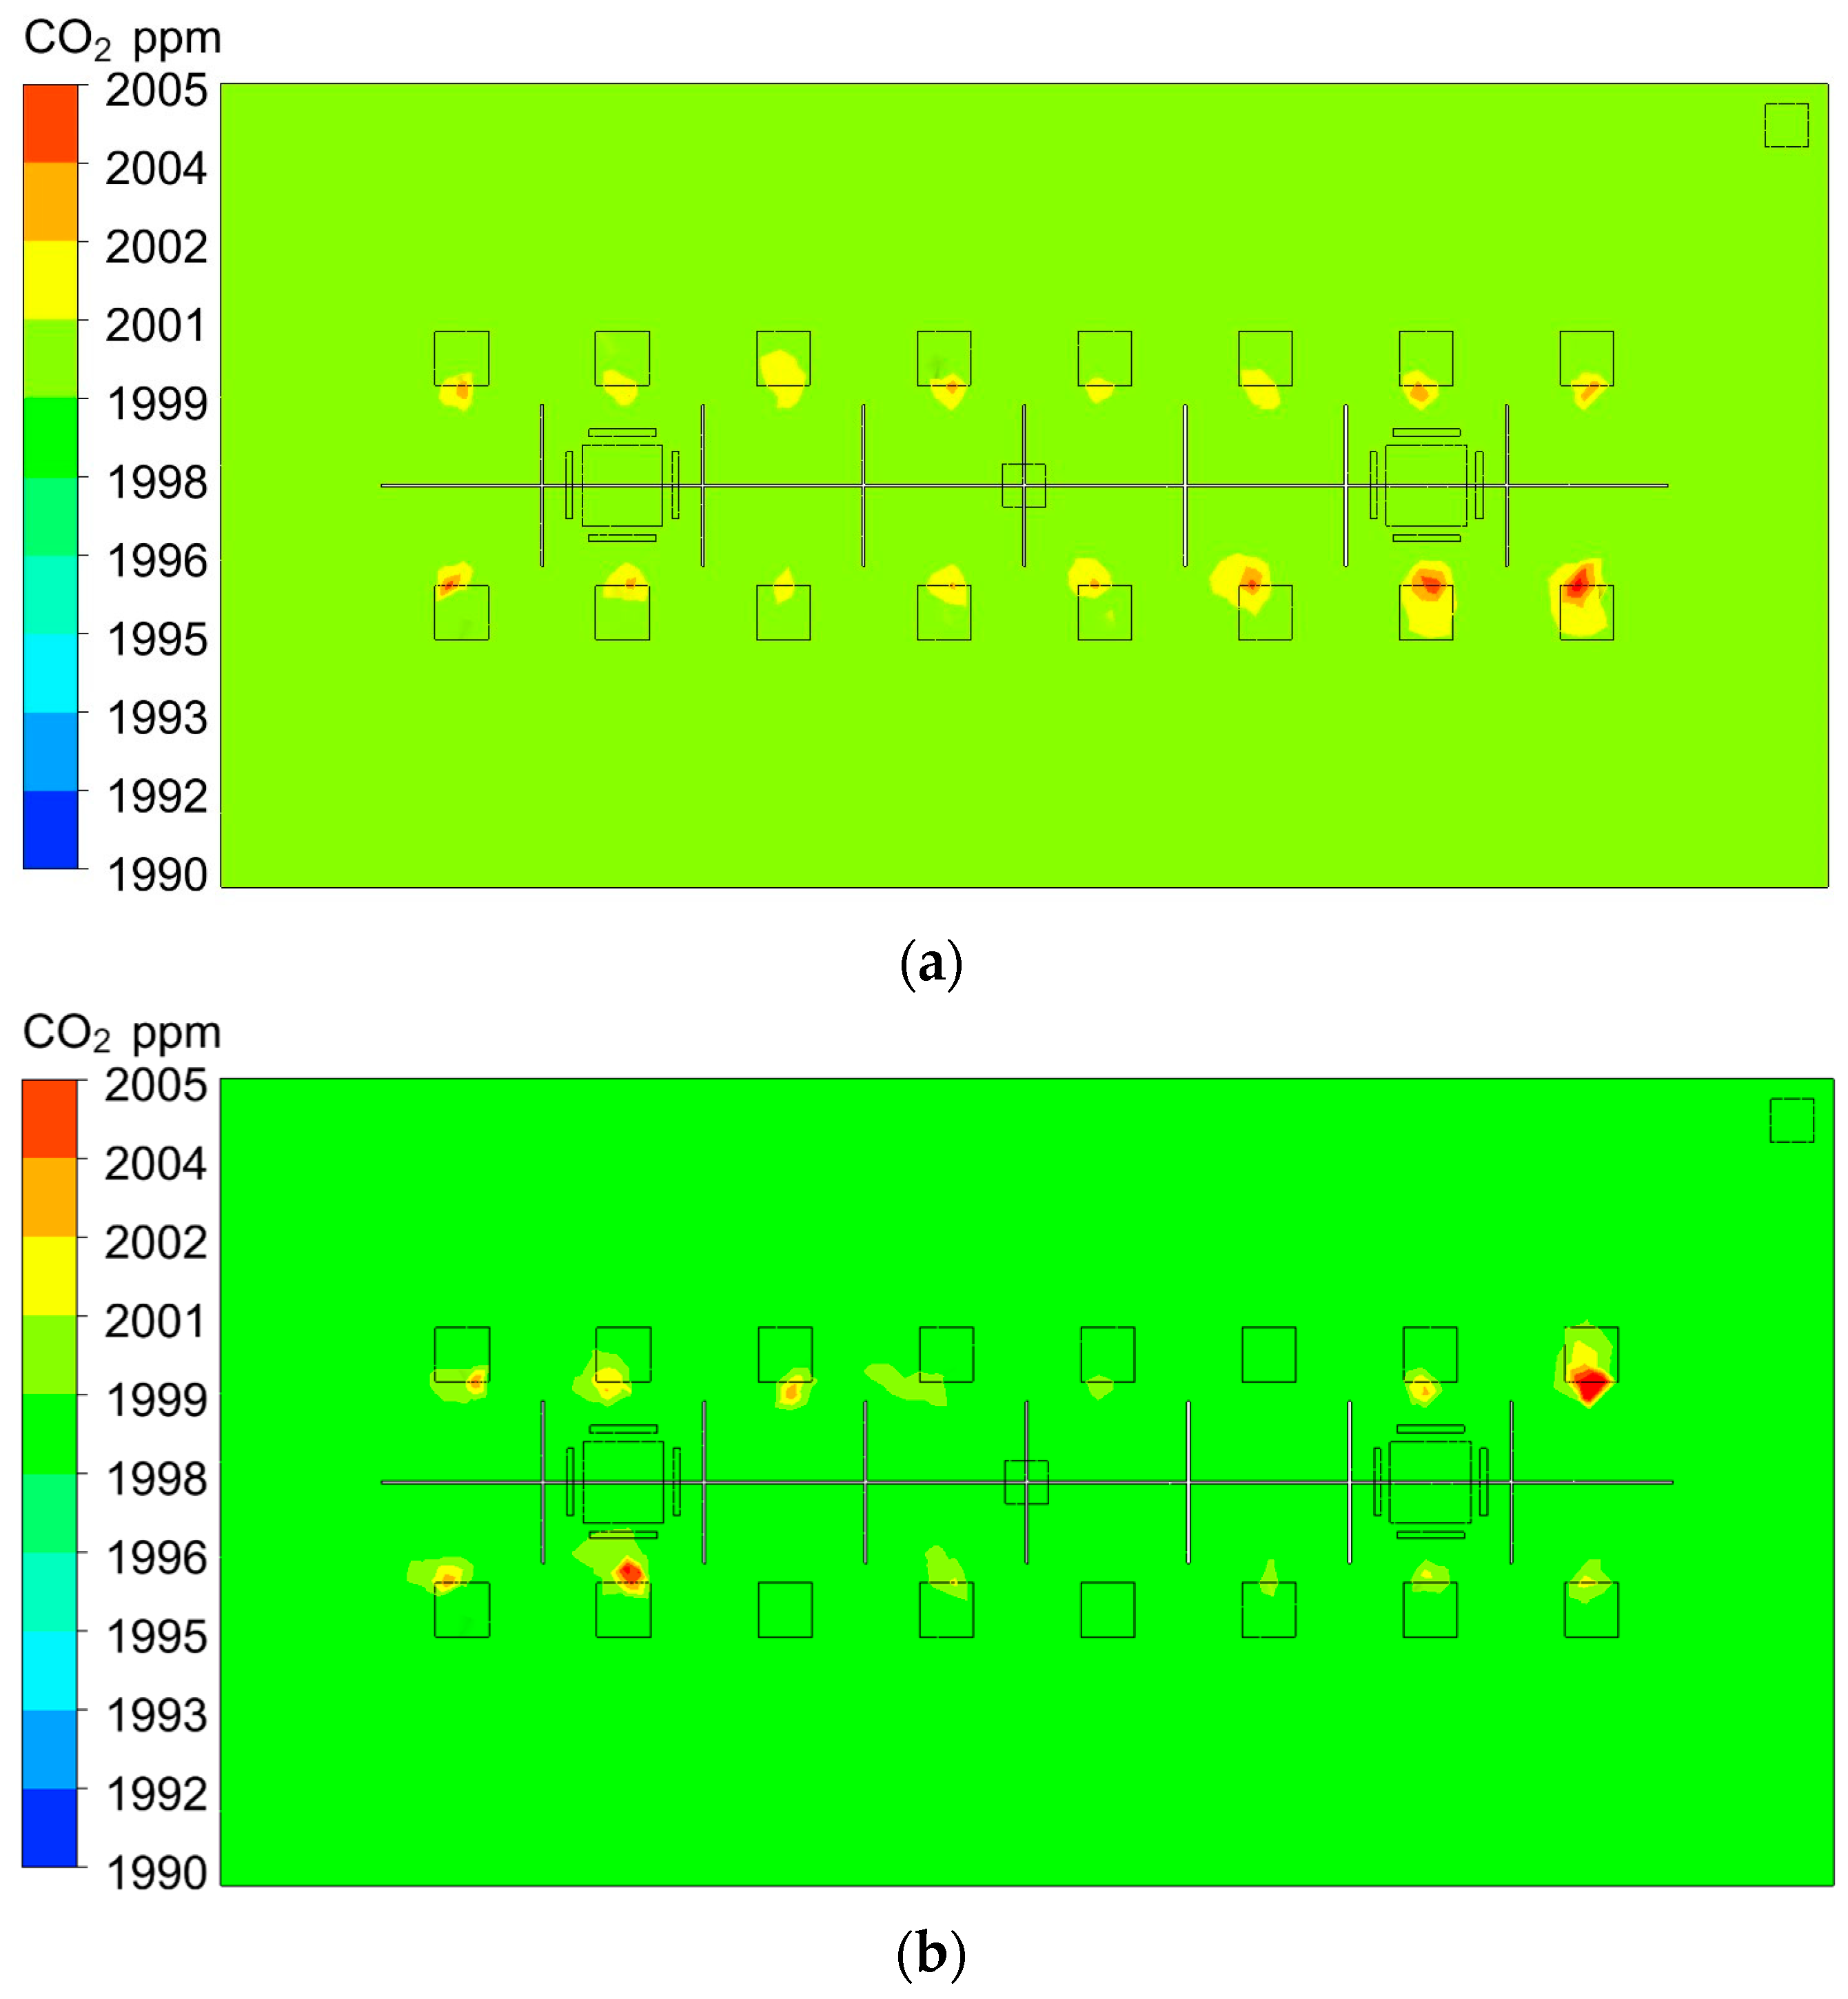
Figure 11 shows the CO2 concentration distributions under K1 and K2 without the fresh air system. In the absence of a fresh air system, the indoor CO2 concentration is high, and the CO2 concentration under the K1 operating condition when the purifier is operated alone is approximately 2000 ppm. When the purifier and the air conditioner operate at the same time, the CO2 concentration is approximately 1998 ppm. Under these conditions, the CO2 concentration distribution is relatively uniform since the airflow organization of the purifier and the air conditioner has fully developed. The concentration of CO2 around the human body is the highest due to the respiration of occupants.

Figure 11.
CO2 concentration distribution under K1 and K2 conditions. (a) CO2 concentration diagram under the K1 condition; (b) CO2 concentration distribution under the K2 condition.
4.3.2. With a Fresh Air System
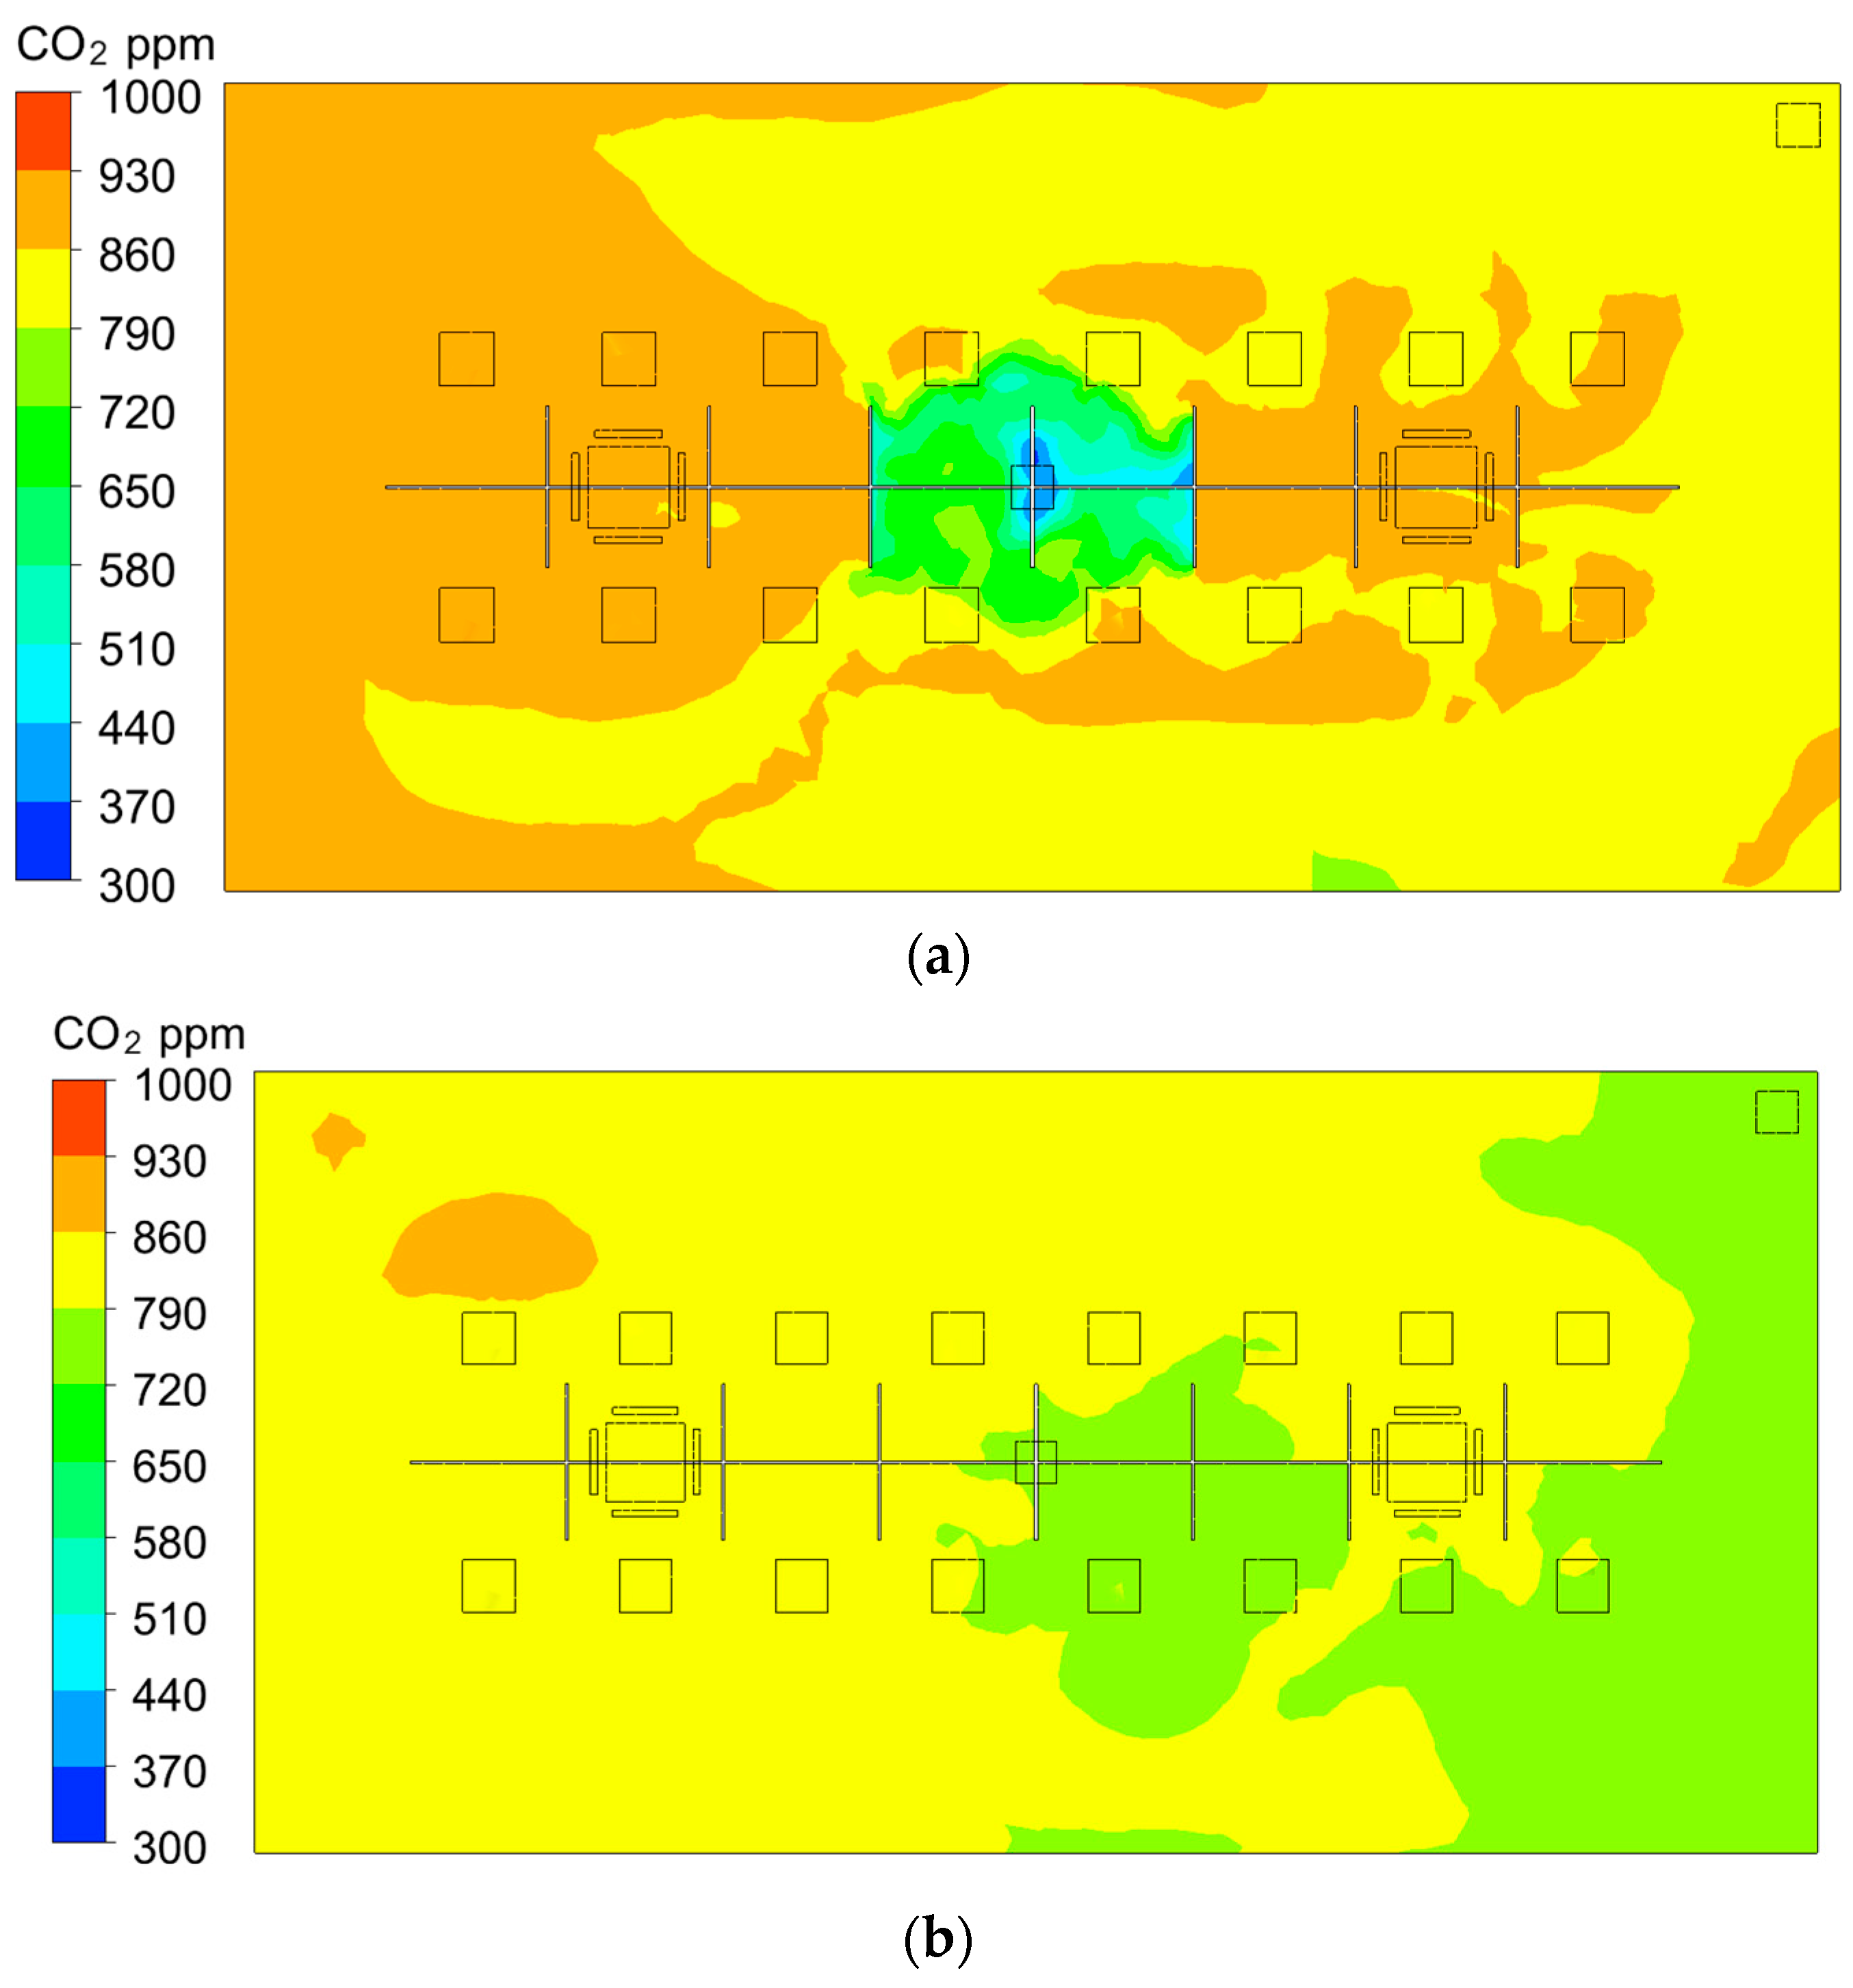
The fresh air system introduces fresh air from the outside into the room, which can effectively dilute and remove indoor CO2. Table 8 shows the dilution times for K3 and K4. The dilution time can be defined as the time used for diluting the CO2 below 1000 ppm [22]. It can be seen that the indoor CO2 can be diluted below 1000 ppm in 30 min with an initial concentration of 2000 ppm. To further illustrate the distribution of indoor CO2, the concentration distribution of CO2 at Z = 1.2 m after the system was operated for 30 min is shown in Figure 12.
Table 8.
CO2 dilution time of different zones.
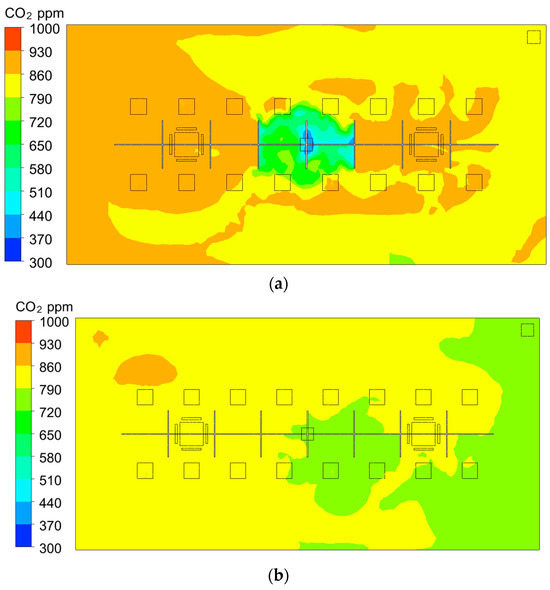
Figure 12.
CO2 concentration distribution under K3 and K4conditions.(a) CO2 concentration distribution under K3 condition; (b) CO2 concentration distribution under K4 condition.
Figure 12a shows the CO2 concentration diagram under the K3 condition, in which the fresh air system and the purifier are operated at the same time. With the fresh air system, the indoor CO2 concentration was approximately 846 ppm on average, which was 57.7% lower than that under the K1 and K2 conditions. Although the CO2 level is much lower, the indoor CO2 concentration distribution is not uniform under this condition. The area immediately below the fresh air outlet has the lowest CO2 concentration, approximately 621 ppm. The CO2 concentration in the left part of the room is slightly higher than that in the right part of the room. It was approximately 860 ppm for the left part and 785 ppm for the right part of the room. This is because the airflow from the fresh air system intersects with that from the purifier in the left side of room, and the fresh air cannot reach the left side of the room directly. Another reason is that the outlet of the fresh air system is located at the right top ceiling. Thus, the inlet and outlet of the fresh air system should be well designed according to the airflow distribution calculation.
Figure 12b shows the CO2 concentration distribution under the joint operation of the fresh air system, purifier, and air conditioners. The indoor CO2 concentration distribution under the joint operation condition is lower, and the average value is 811 ppm, which is approximately 59.5% lower than that under the K1 and K2 conditions without a fresh air system. This is because the fresh air system introduces fresh air to dilute CO2. Under the joint operation condition (K4), the indoor CO2 concentration distribution is relatively uniform. This is because the air conditioners help the fresh air mix well with the indoor air. In addition, the average CO2 concentration under the K4 condition is 4.1% lower than that under the K3 condition. Thus, the joint operation of the three systems has the most significant dilution effect on CO2. Although the CO2 distribution is much uniform with the help of the ACs, the CO2 level in the left part is slightly higher than that in the right part due to the arrangement of fresh air inlet and outlet.
In summary, to maintain fresh indoor air and high work efficiency of the occupants, the fresh air system is necessary. The collision of the fresh air and air purifier may cause slight nonuniform distribution of the CO2. Thus, the relative position of the fresh air inlet and the air purifier should be well arranged.
5. Discussion
This study explores the synergistic impact of the combined use of an air purifier, air conditioning unit, and fresh air system on indoor air quality. The constraints of our measurement capabilities, we have elected to focus on PM2.5 and CO2 as indicators for IAQ, acknowledging that the exclusion of VOCs represents a limitation of our research. To analysis the synergistic effects of the integrated system, we have employed a hybrid approach combining experimental and computational methods. It is acknowledged that computational simulations are inherently subject to errors, which may arise from model simplifications and deviation from real case in boundary and initial conditions. For instance, the RANS (Reynolds-Averaged Navier-Stokes) model and the species transport models, while foundational to our approach, are not exempt from such limitations. In regard of boundary condition, the velocity of the outlet normally assumed to be uniform, which is also the potential error of the simulation method. The simulation models utilized in this study have been validated against experimental data, demonstrating that the associated errors are within acceptable thresholds. Base on the validated model, we have expanded our simulations to a large office room using the same governing equations for heat, mass, and multi-species transfer. It is recognized that this expansion may introduce additional deviations from absolute accuracy. The findings from this study are intended to offer strategic insights into the optimal operation and positioning of the integrated system. Furthermore, our work lays the groundwork for the development of an intelligent control system designed to sustain superior indoor air quality with high efficiency. It is important to note that the current study does not investigate the long-term operational performance and maintenance requirements of the combined system. In an integrated system where the air purifier, air conditioning units, and fresh air systems operate in concert, the interplay between airflow patterns and species transport dynamics is complex. Consequently, the operational dynamics and long-term performance of the combined system are of significant consequence to its practical application. Therefore, a comprehensive investigation into the long-term performance and maintenance requirements is one of the critical areas for future research.
6. Conclusions
This paper employs experimental and numerical simulation methods to investigate the impact of different operating conditions on the velocity fields, concentration fields, and purification times in various indoor regions. Based on the analysis above, the following conclusions can be obtained:
- (1)
- When the air purifier runs alone, the purifying air is attached to the ceiling and sent forward, which can reduce the PM2.5 concentration to 15 μg/m3 in 46 min. The purifier is recommended to located near the occupants to achieve better purification performance for the active zone of the occupants. The concentration of CO2 remains constant.
- (2)
- The combined operation of a purifier and air conditioners increases the indoor airflow disturbance and shortens the purification time. The PM2.5 are more quickly returned to the purifier for purification, reducing the purification time by 15.2%. Under this condition, the concentration of CO2 remains constant since the air purifier and air conditioner do not have the capability to remove CO2. However, the airflow for air conditioner prevents the air flow form purifier to the farther zones, causing an increase in the uneven distribution of pollutant concentrations in the room. The concentration of pollutants in the right part of the room is approximately 10 μg/m3 higher than that in the left part of the room. Thus, it is recommended to arrange the air purifier and air conditioner in opposite position, and the occupant area should be set between the air conditioner outlet and the purifier.
- (3)
- A fresh air system has a dilution effect on indoor pollutants and can reduce the concentration of pollutants and shorten the purification time. Compared with the single operation of a purifier, a fresh air system can significantly improve the purification of indoor PM2.5, and the purification time can be shortened by 32.6%. The CO2 concentration in K3 and K4 with fresh air system was approximately 59.5% lower than that in the system without fresh air. This is because the fresh air system can dilute indoor CO2. Thus, the fresh air system plays an important role in reducing the indoor CO2 concentration. Therefore, the fresh air systems play an important role in improving the indoor air quality due to dilution and discharge of pollutants. To obtain a much uniform distribution of PM2.5 and CO2, the arrangement of air purifier and fresh air system inlet and outlet should be well designed.
When the three systems run together, they can achieve the best indoor air quality. the air purifier mainly used for PM2.5 premovement. The fresh air system introduces fresh air to dilute indoor pollutant including PM2.5 and CO2. The air conditioner is mainly for indoor temperature control and it also enhances indoor air circulation which can make the concentration distribution of pollutant more uniform. The result of this study would provide guidance for the operation and placement of the combined system, and it would also serve as the basis for an intelligent control system to maintain high indoor air quality efficiently.
Author Contributions
Methodology, L.J.; software, C.W. (Congcong Wang) and Z.D.; validation, W.J. and C.W. (Cheng Wang); formal analysis, L.J.; investigation, J.G.; data curation, J.G. and R.W.; writing—original draft preparation, J.G.; writing—review and editing, L.J., W.J., C.W. (Congcong Wang) and C.W. (Cheng Wang); visualization, R.W.; supervision, Z.W.; funding acquisition, Z.W. All authors have read and agreed to the published version of the manuscript.
Funding
This research was funded by the National Natural Science Foundation of China (General Program, grant number 52278121).
Data Availability Statement
The data present in this study are available on request from the authors.
Conflicts of Interest
Author Ren Wang was employed by the company Beiyanglan (Tianjin) Environmental Technology Co., Ltd. The remaining authors declare that the research was conducted in the absence of any commercial or financial relationships that could be construed as a potential conflict of interest.
References
- Cheek, E.; Guercio, V.; Shrubsole, C.; Dimitroulopoulou, S. Portable air purification: Review of impacts on indoor air quality and health. Sci. Total Environ. 2021, 766, 142585. [Google Scholar] [CrossRef]
- Abu Mansor, A.; Abdullah, S.; Ahmad, A.N.; Ahmed, A.N.; Zulkifli, M.F.R.; Jusoh, S.M.; Ismail, M. Indoor air quality and sick building syndrome symptoms in administrative office at public university. Dialog. Health 2024, 4, 100178. [Google Scholar] [CrossRef] [PubMed]
- Chi, R.; Chen, C.; Li, H.; Pan, L.; Zhao, B.; Deng, F.; Guo, X. Different health effects of indoor- and outdoor-originated PM2.5 on cardiopulmonary function in COPD patients and healthy elderly adults. Indoor Air 2018, 29, 192–201. [Google Scholar] [CrossRef]
- Pourkiaei, M.; Romain, A.-C. Scoping review of indoor air quality indexes: Characterization and applications. J. Build. Eng. 2023, 75, 106703. [Google Scholar] [CrossRef]
- Li, L.; Yao, C.; Liu, W.; Yin, Z.; Huang, W.; Yao, Y.; Luo, Y.; Huang, Y. Impact of displacement ventilation and underfloor air distribution systems on concentrations of indoor particle in different seasons. J. Build. Eng. 2024, 84, 108466. [Google Scholar] [CrossRef]
- Shi, Y.; Li, X. Purifier or fresh air unit? A study on indoor particulate matter purification strategies for buildings with split air-conditioners. J. Affect. Disord. 2018, 131, 1–11. [Google Scholar] [CrossRef]
- Oh, H.-J.; Nam, I.-S.; Yun, H.; Kim, J.; Yang, J.; Sohn, J.-R. Characterization of indoor air quality and efficiency of air purifier in childcare centers, Korea. J. Affect. Disord. 2014, 82, 203–214. [Google Scholar] [CrossRef]
- Swamy, G. Development of an indoor air purification system to improve ventilation and air quality. Heliyon 2021, 7, e08153. [Google Scholar] [CrossRef]
- Sekhar, S.; Willem, H. Impact of airflow profile on indoor air quality—A tropical study. J. Affect. Disord. 2004, 39, 255–266. [Google Scholar] [CrossRef]
- Jurelionis, A.; Gagytė, L.; Prasauskas, T.; Čiužas, D.; Krugly, E.; Šeduikytė, L.; Martuzevičius, D. The impact of the air distribution method in ventilated rooms on the aerosol particle dispersion and removal: The experimental approach. Energy Build. 2015, 86, 305–313. [Google Scholar] [CrossRef]
- Dai, H.; Zhao, B. Reducing airborne infection risk of COVID-19 by locating air cleaners at proper positions indoor: Analysis with a simple model. J. Affect. Disord. 2022, 213, 108864. [Google Scholar] [CrossRef]
- Bertolín, L.S.; Oro JM, F.; Díaz, K.A.; Vega, M.G.; Velarde-Suárez, S.; Del Valle, M.E.; Fernández, L.J. Optimal position of air purifiers in elevator cabins for the improvement of their ventilation effectiveness. J. Build. Eng. 2023, 63, 105466. [Google Scholar] [CrossRef]
- Zhang, T.; Wang, S.; Sun, G.; Xu, L.; Takaoka, D. Flow impact of an air conditioner to portable air cleaning. J. Affect. Disord. 2010, 45, 2047–2056. [Google Scholar] [CrossRef]
- Shang, W.; Liu, J.; Wang, C.; Li, J.; Dai, X. Developing smart air purifier control strategies for better IAQ and energy efficiency using reinforcement learning. J. Affect. Disord. 2023, 242, 110556. [Google Scholar] [CrossRef]
- Zhang, S.; Stamp, S.; Cooper, E.; Curran, K.; Mumovic, D. Evaluating the impact of air purifiers and window operation upon indoor air quality—UK nurseries during Covid-19. J. Affect. Disord. 2023, 243, 110636. [Google Scholar] [CrossRef]
- Karam, J.; Katramiz, E.; Ghali, K.; Ghaddar, N. Effective mitigation of cross-contamination in classroom conditioned by intermittent air jet cooling with use of portable air cleaners. J. Affect. Disord. 2022, 219, 109220. [Google Scholar] [CrossRef]
- Li, T.; Hu, R.; Chen, Z.; Li, Q.; Huang, S.; Zhu, Z.; Zhou, L. Fine particulate matter (PM2.5): The culprit for chronic lung diseases in China. Chronic Dis. Transl. Med. 2018, 4, 176–186. [Google Scholar] [CrossRef] [PubMed]
- Laden, F.; Schwartz, J.; Speizer, F.E.; Dockery, D.W. Reduction in Fine Particulate Air Pollution and Mortality. Am. J. Respir. Crit. Care Med. 2006, 173, 667–672. [Google Scholar] [CrossRef]
- Dai, X.; Liu, J.; Li, X.; Zhao, L. Long-term monitoring of indoor CO2 and PM2.5 in Chinese homes: Concentrations and their relationships with outdoor environments. J. Affect. Disord. 2018, 144, 238–247. [Google Scholar] [CrossRef]
- Cheng, P.L.; Li, X. Air infiltration rates in the bedrooms of 202 residences and estimated parametric infiltration rate distribution in Guangzhou, China. Energy Build. 2018, 164, 219–225. [Google Scholar] [CrossRef]
- GB/T 18801-2022; Air Cleaner. State Administration for Market Regulation (SAMR) and National Standardization Management Committee (NSMC): Beijing, China, 2023.
- GB/T 18883-2022; Standards for Indoor Air Quality. State Administration for Market Regulation (SAMR) and National Standardization Management Committee (NSMC): Beijing, China, 2022.
- Chen, Q. Comparison of different k-ε models for indoor air flow computations. Numer. Heat Transf. Part B Fundam. 1995, 28, 353–369. [Google Scholar] [CrossRef]
- ANSI/ASHRAE Standard 62.1-2022; Ventilation and Acceptable Indoor Air Quality. American Society of Heating, Refrigerating and Air-Conditioning Engineers: Atlanta, GA, USA, 2022.
Disclaimer/Publisher’s Note: The statements, opinions and data contained in all publications are solely those of the individual author(s) and contributor(s) and not of MDPI and/or the editor(s). MDPI and/or the editor(s) disclaim responsibility for any injury to people or property resulting from any ideas, methods, instructions or products referred to in the content. |
© 2024 by the authors. Licensee MDPI, Basel, Switzerland. This article is an open access article distributed under the terms and conditions of the Creative Commons Attribution (CC BY) license (https://creativecommons.org/licenses/by/4.0/).