
Wind-Induced Dynamic Response of Inter-Story Isolated Tall Buildings with Friction Pendulum Bearing Based on an Enhanced Simplified Model


Abstract
1. Introduction
2. Theoretical Framework
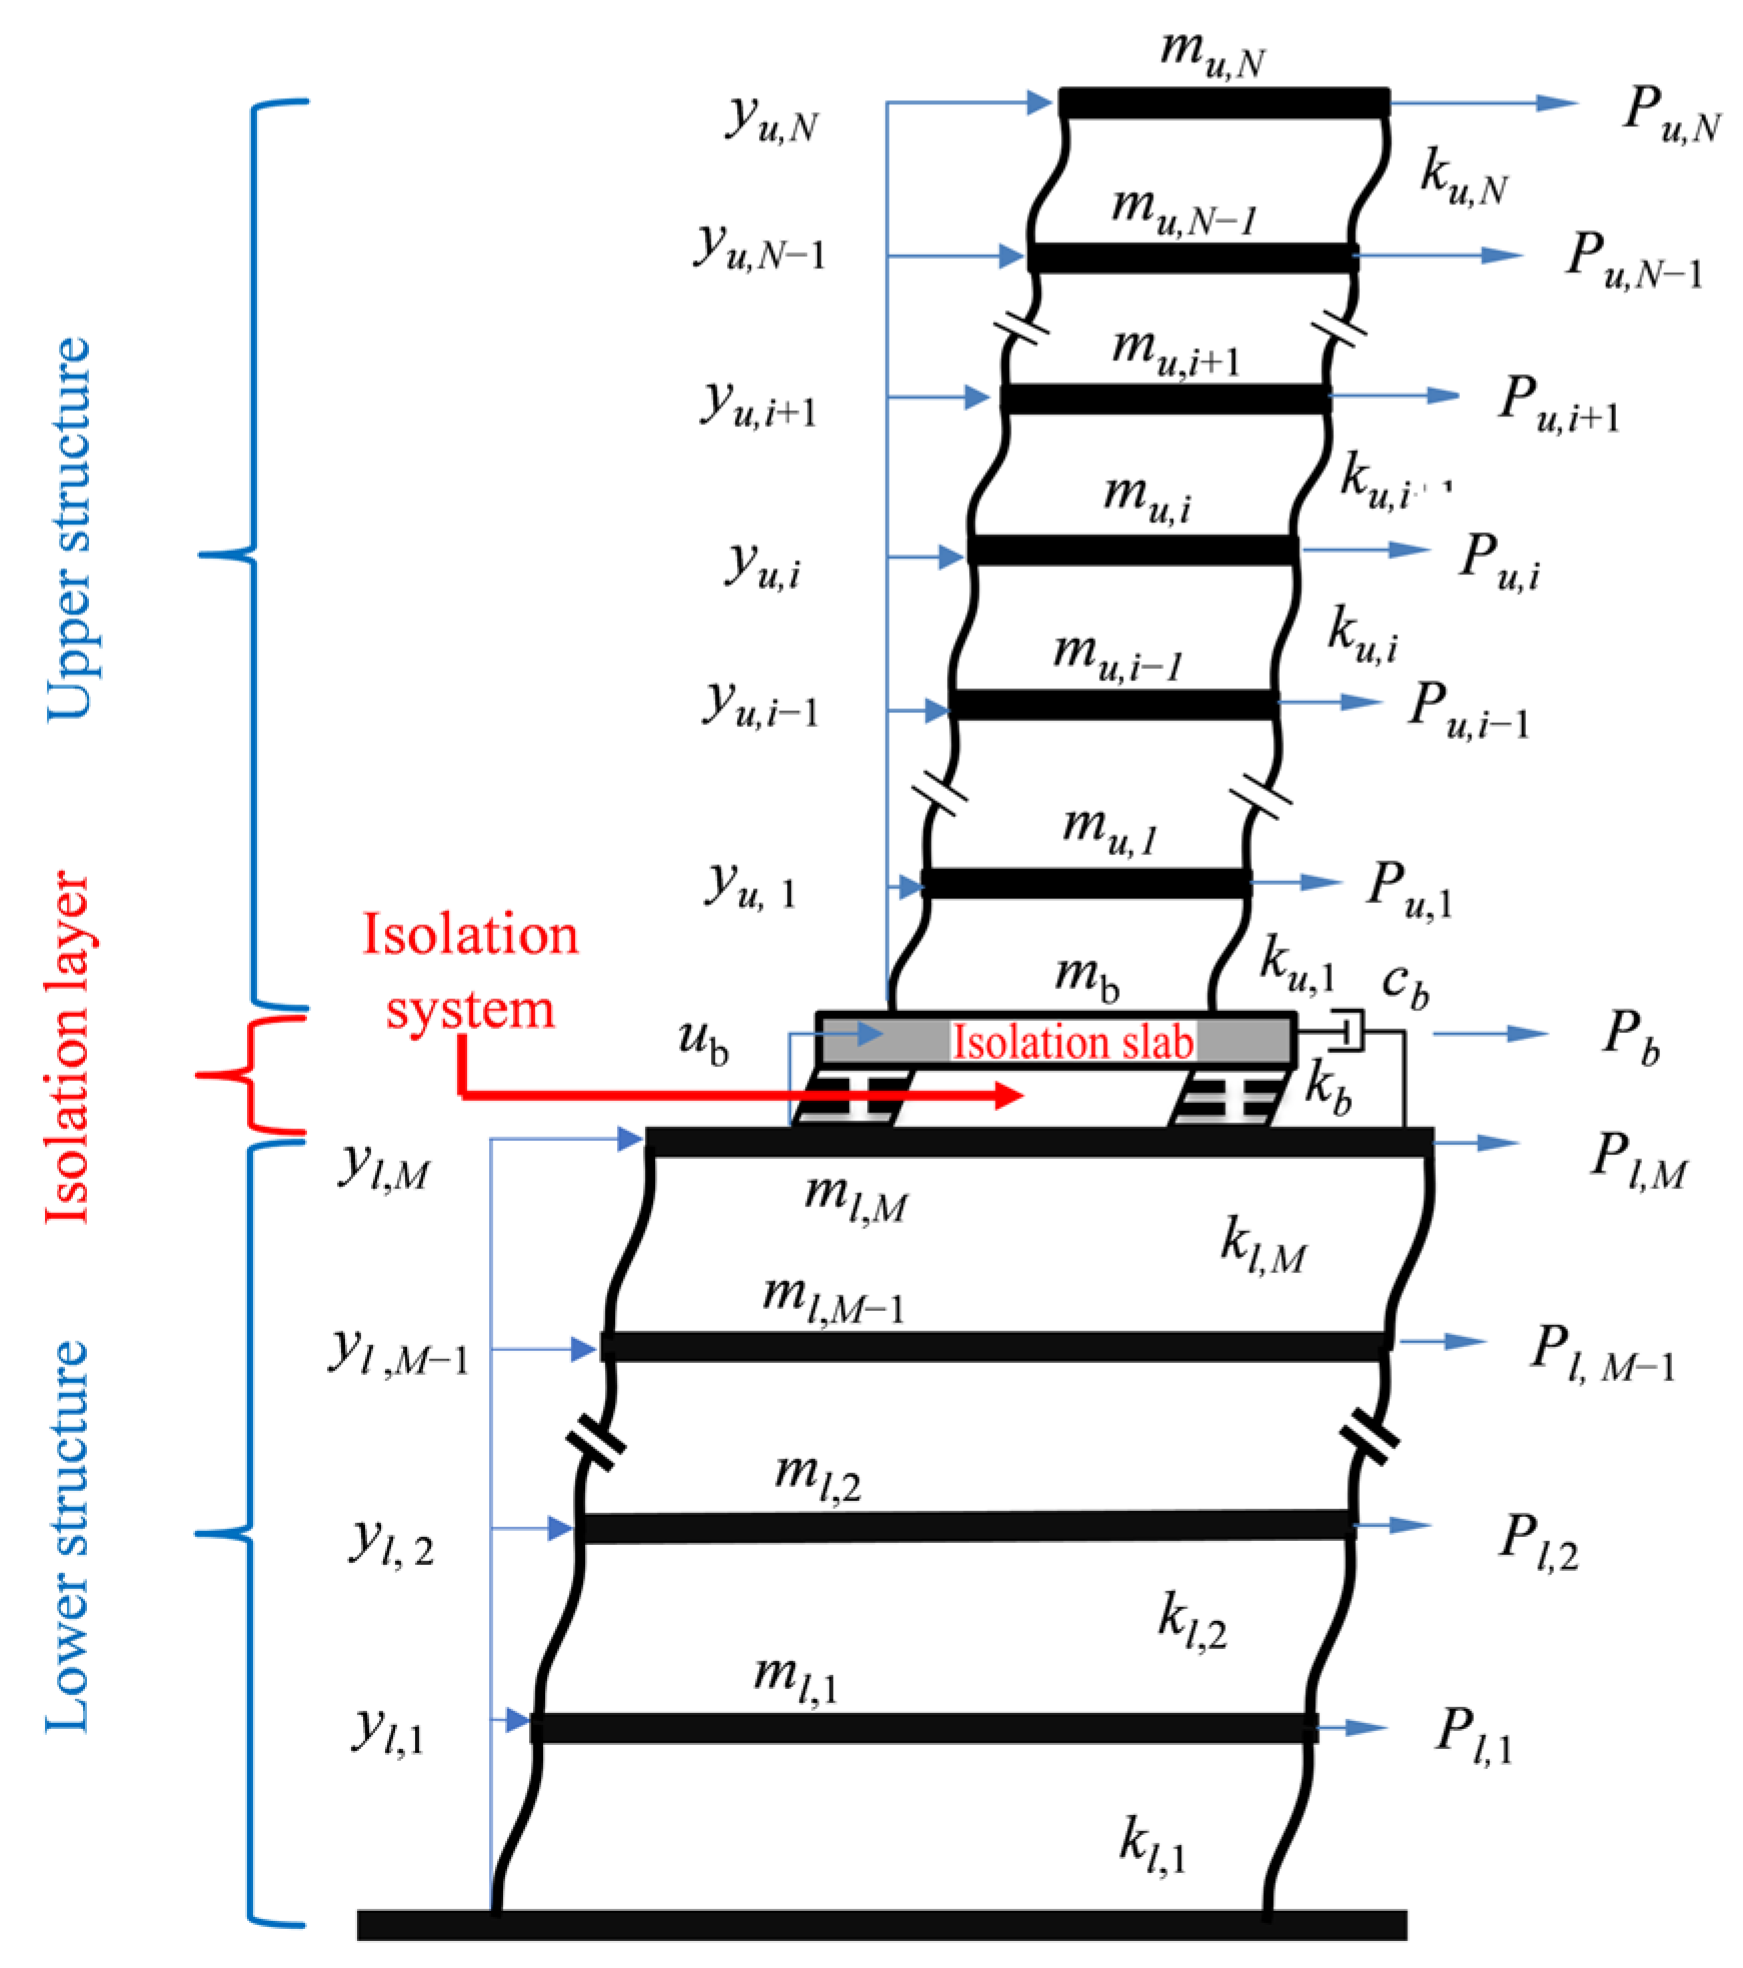
2.1. Equations of Motion
2.1.1. Physical Coordinates
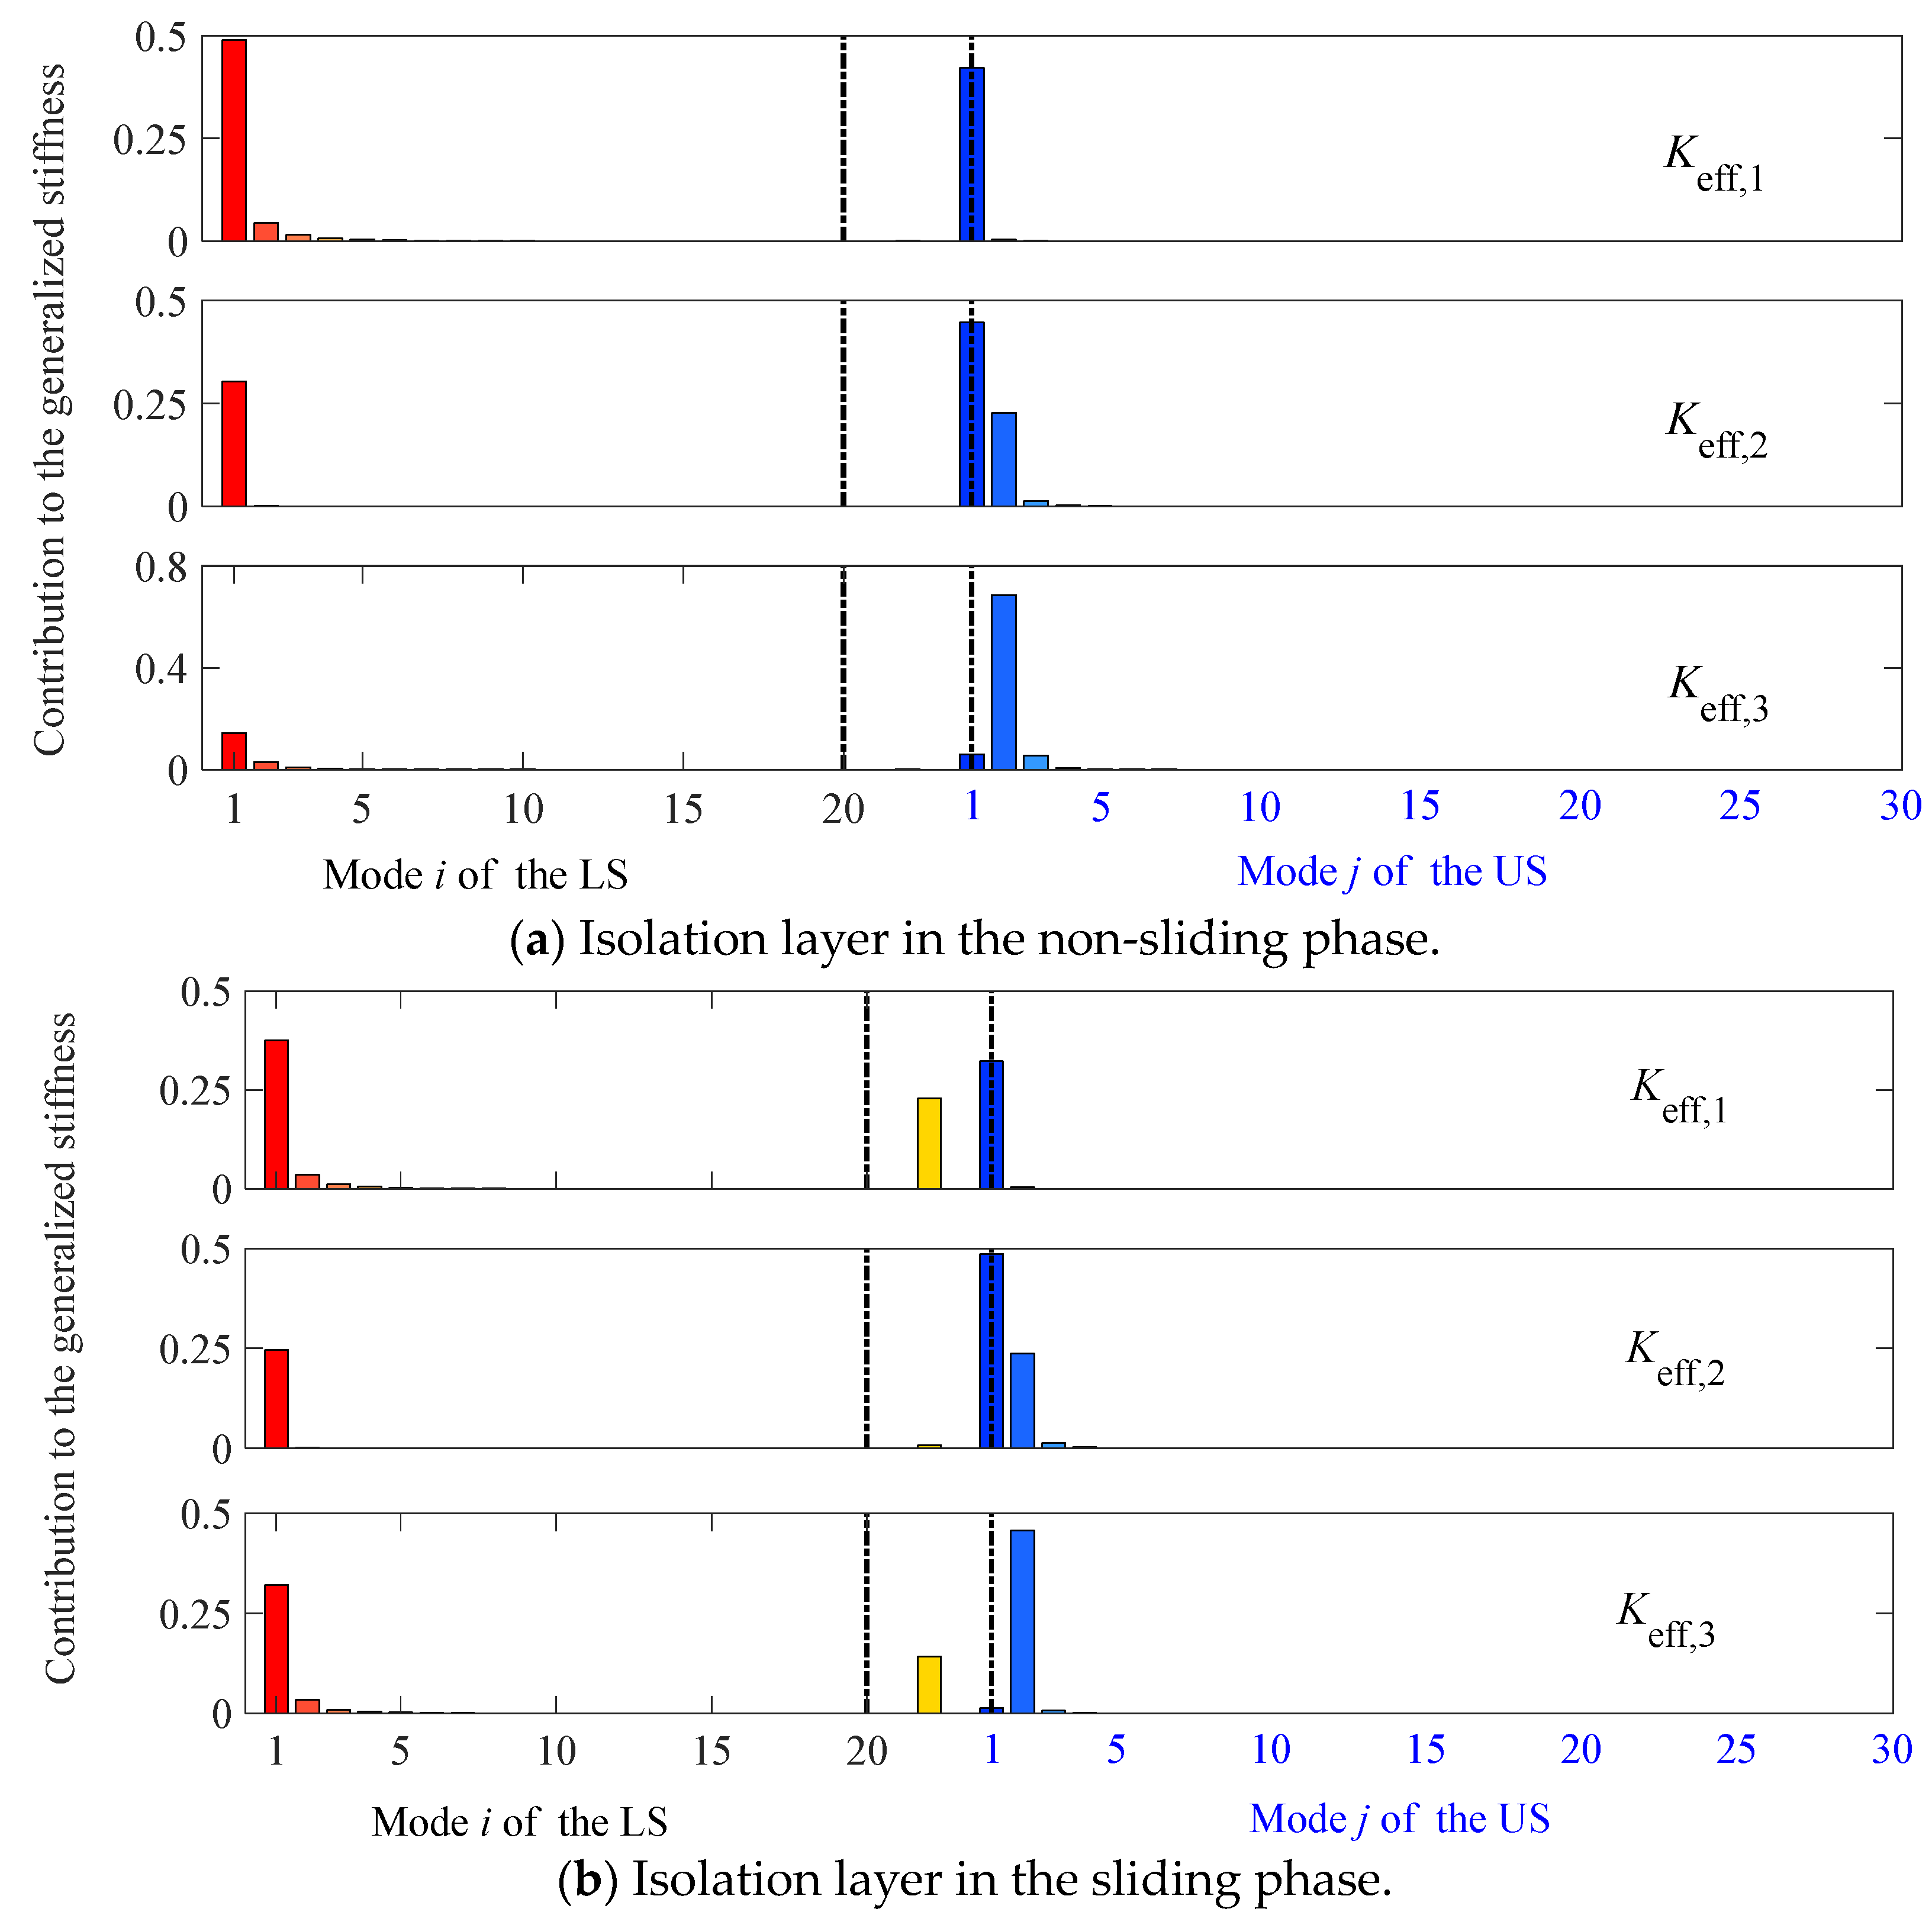
2.1.2. Modal Coordinates
2.2. Enhanced Simplified Model with Reduced DOFs
2.3. Statistical Linearization Method
3. Building Example
3.1. Building Description
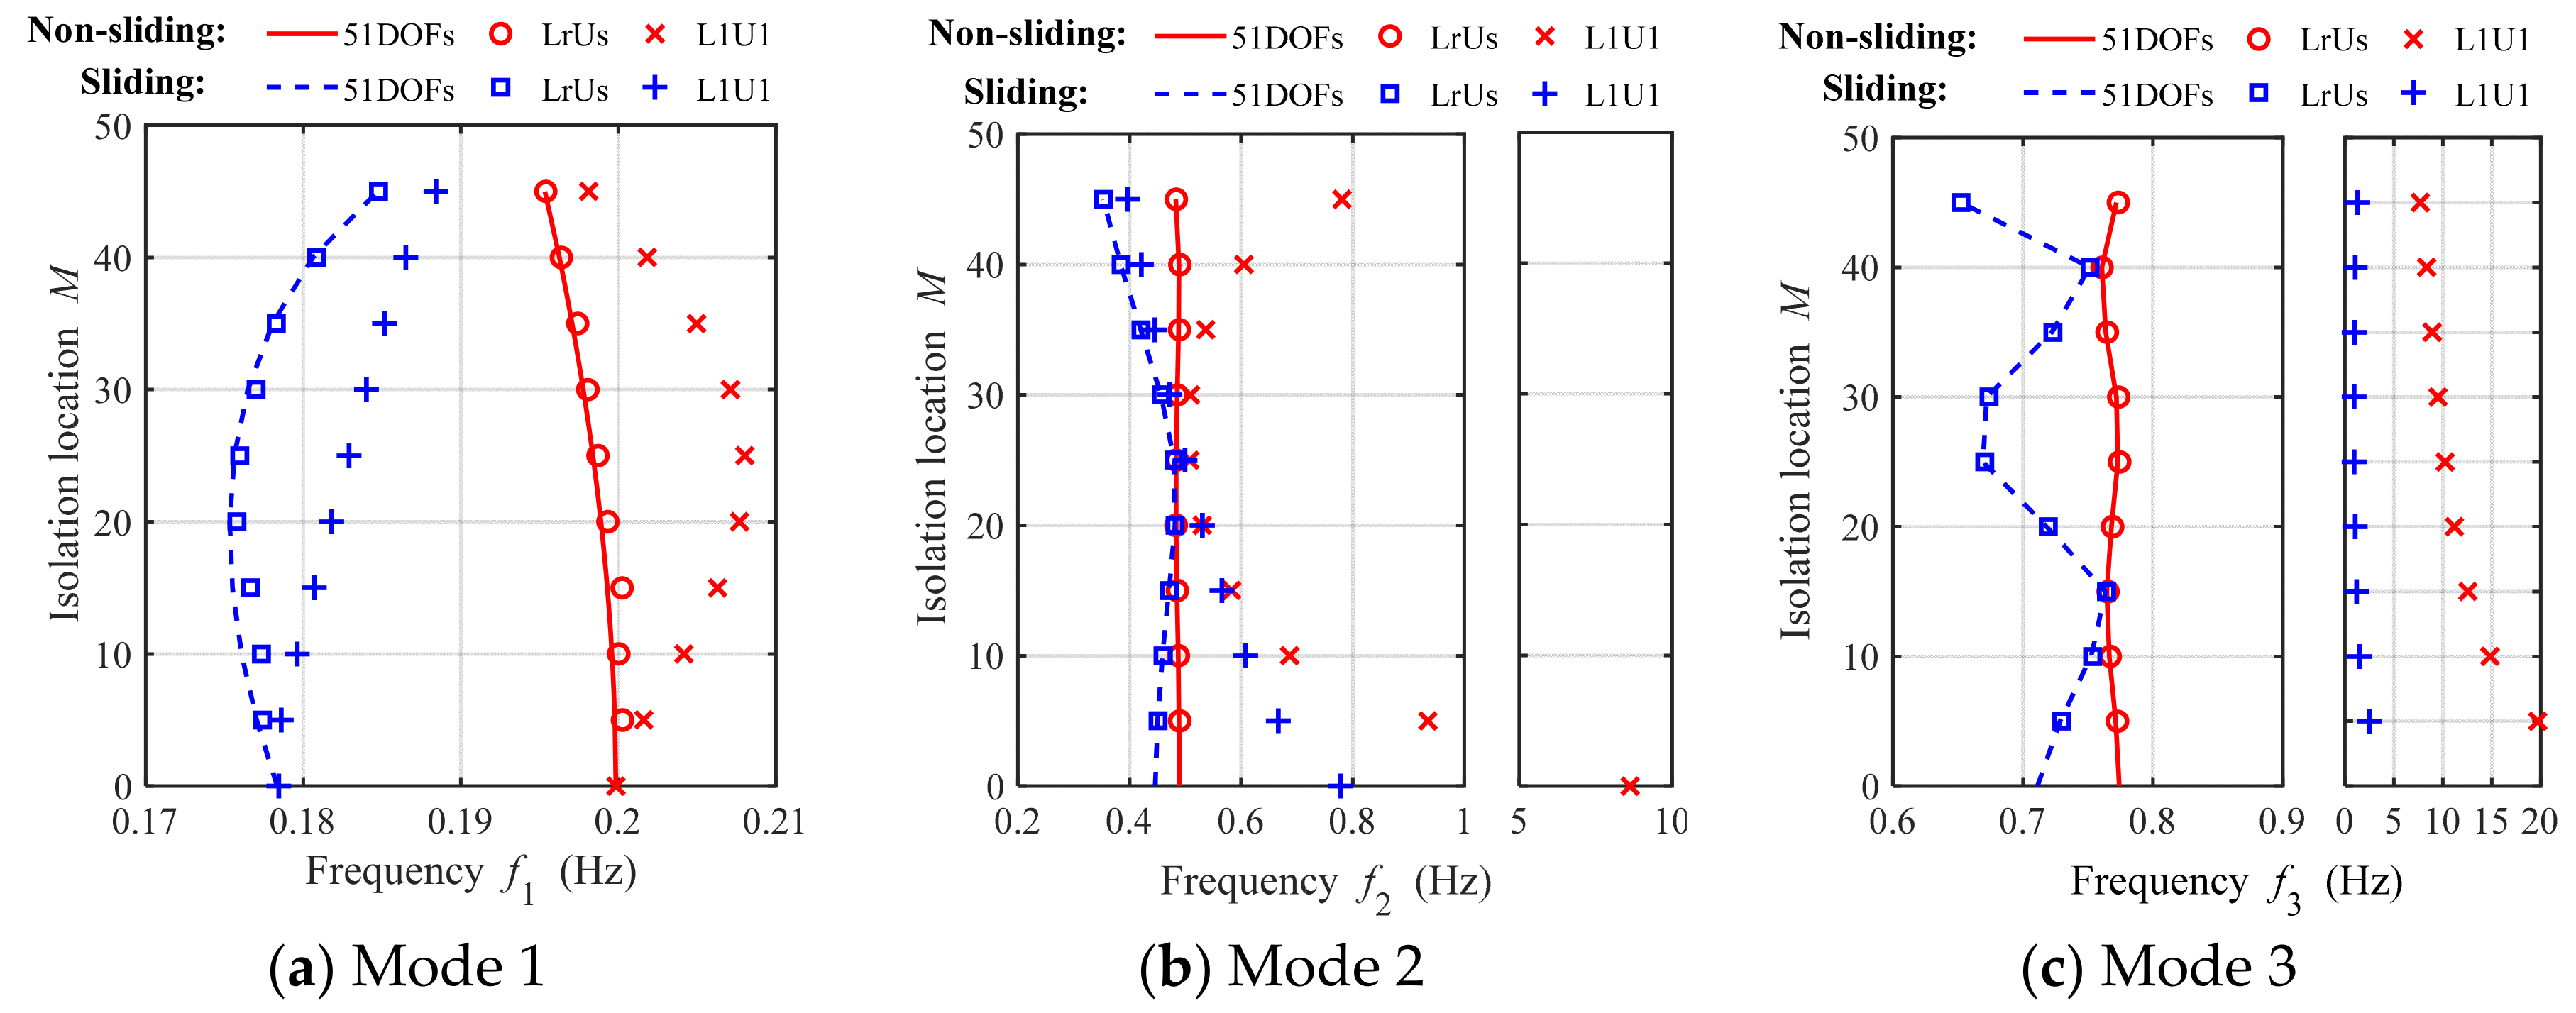
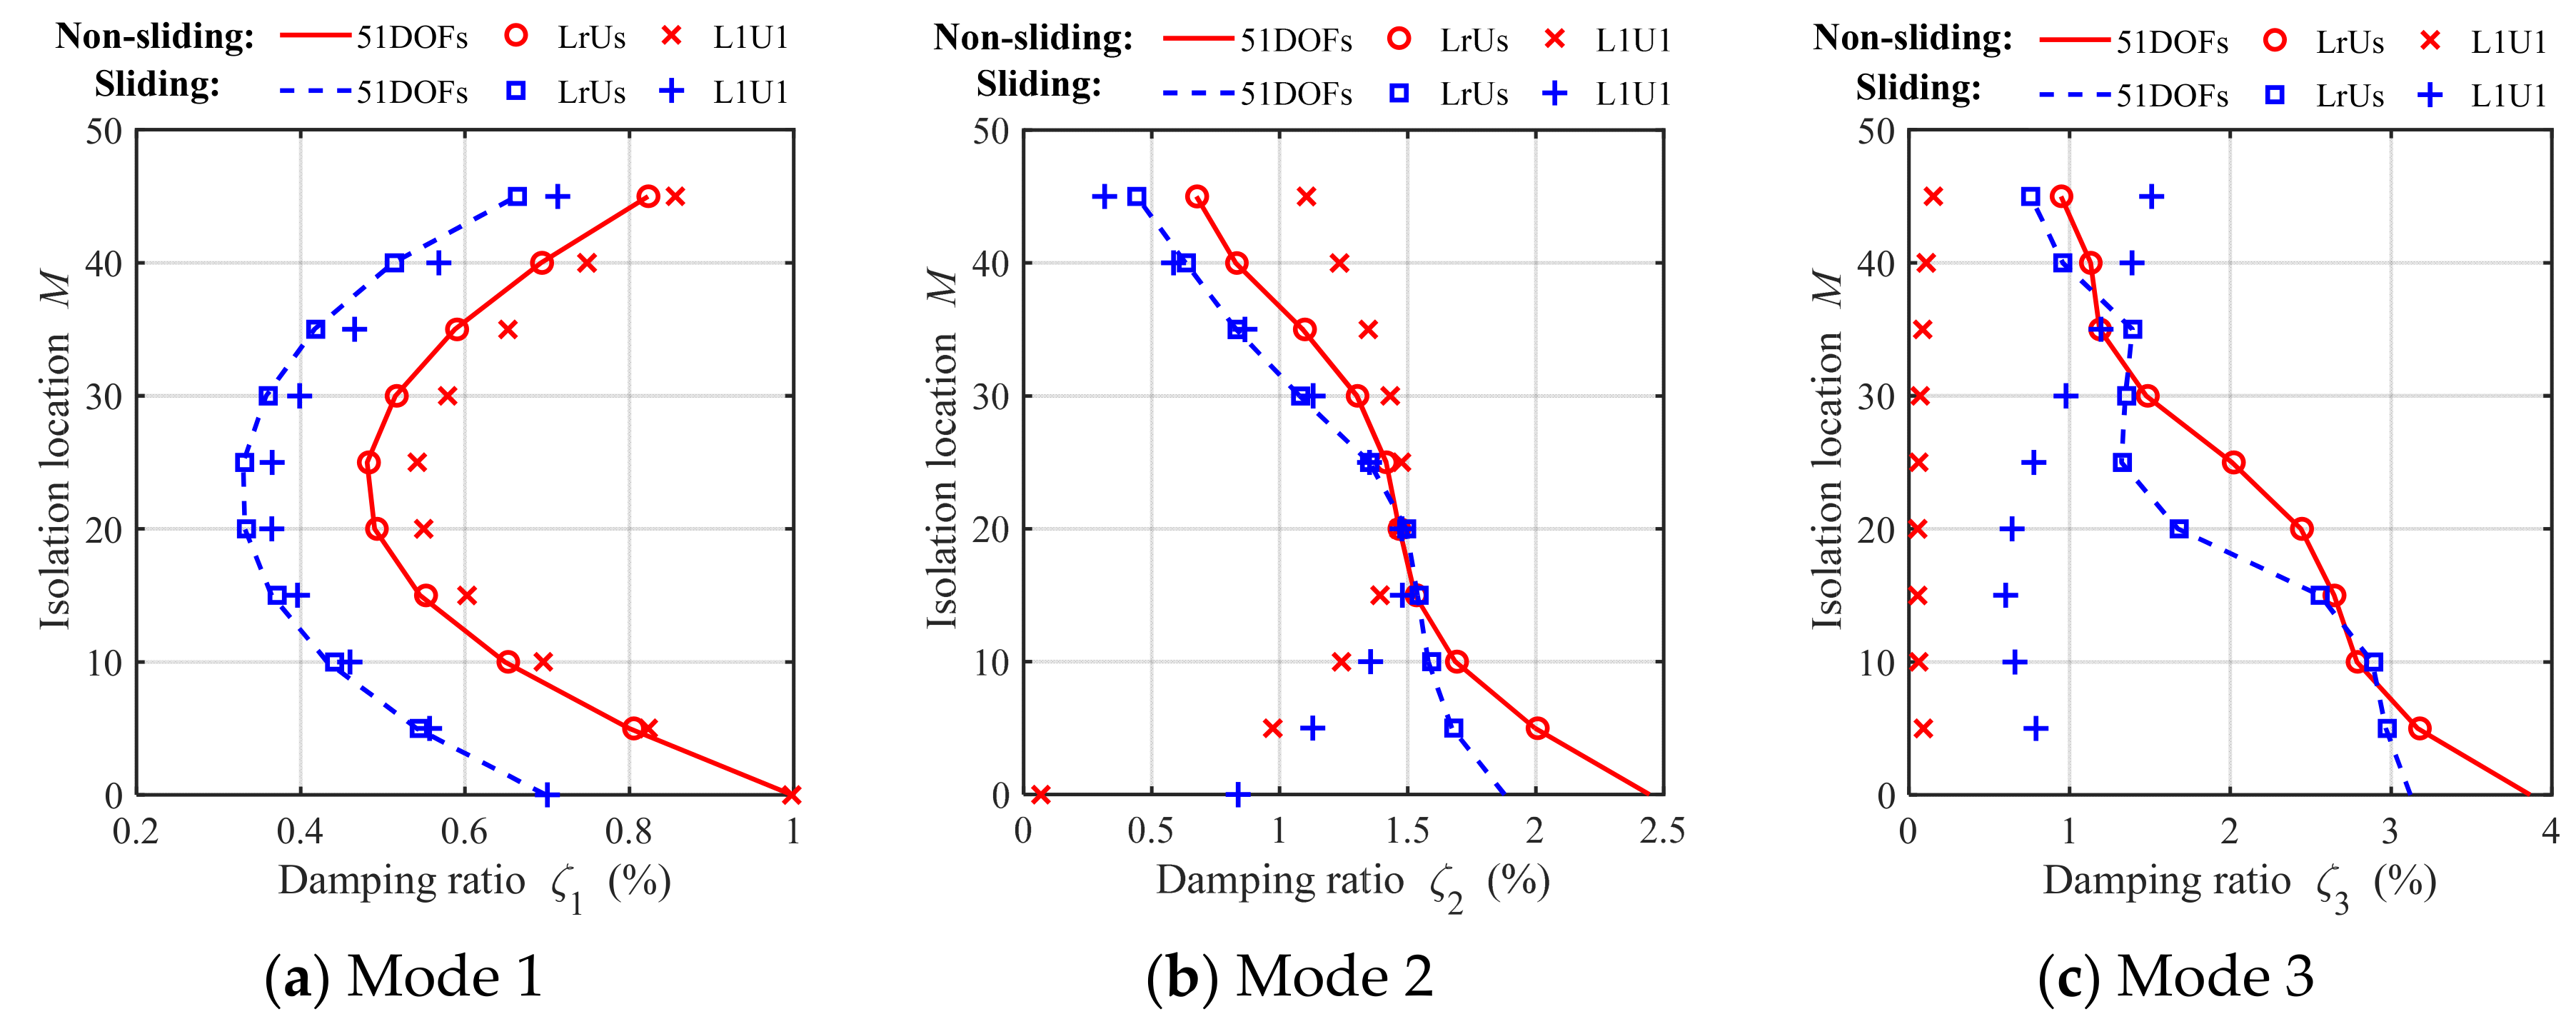
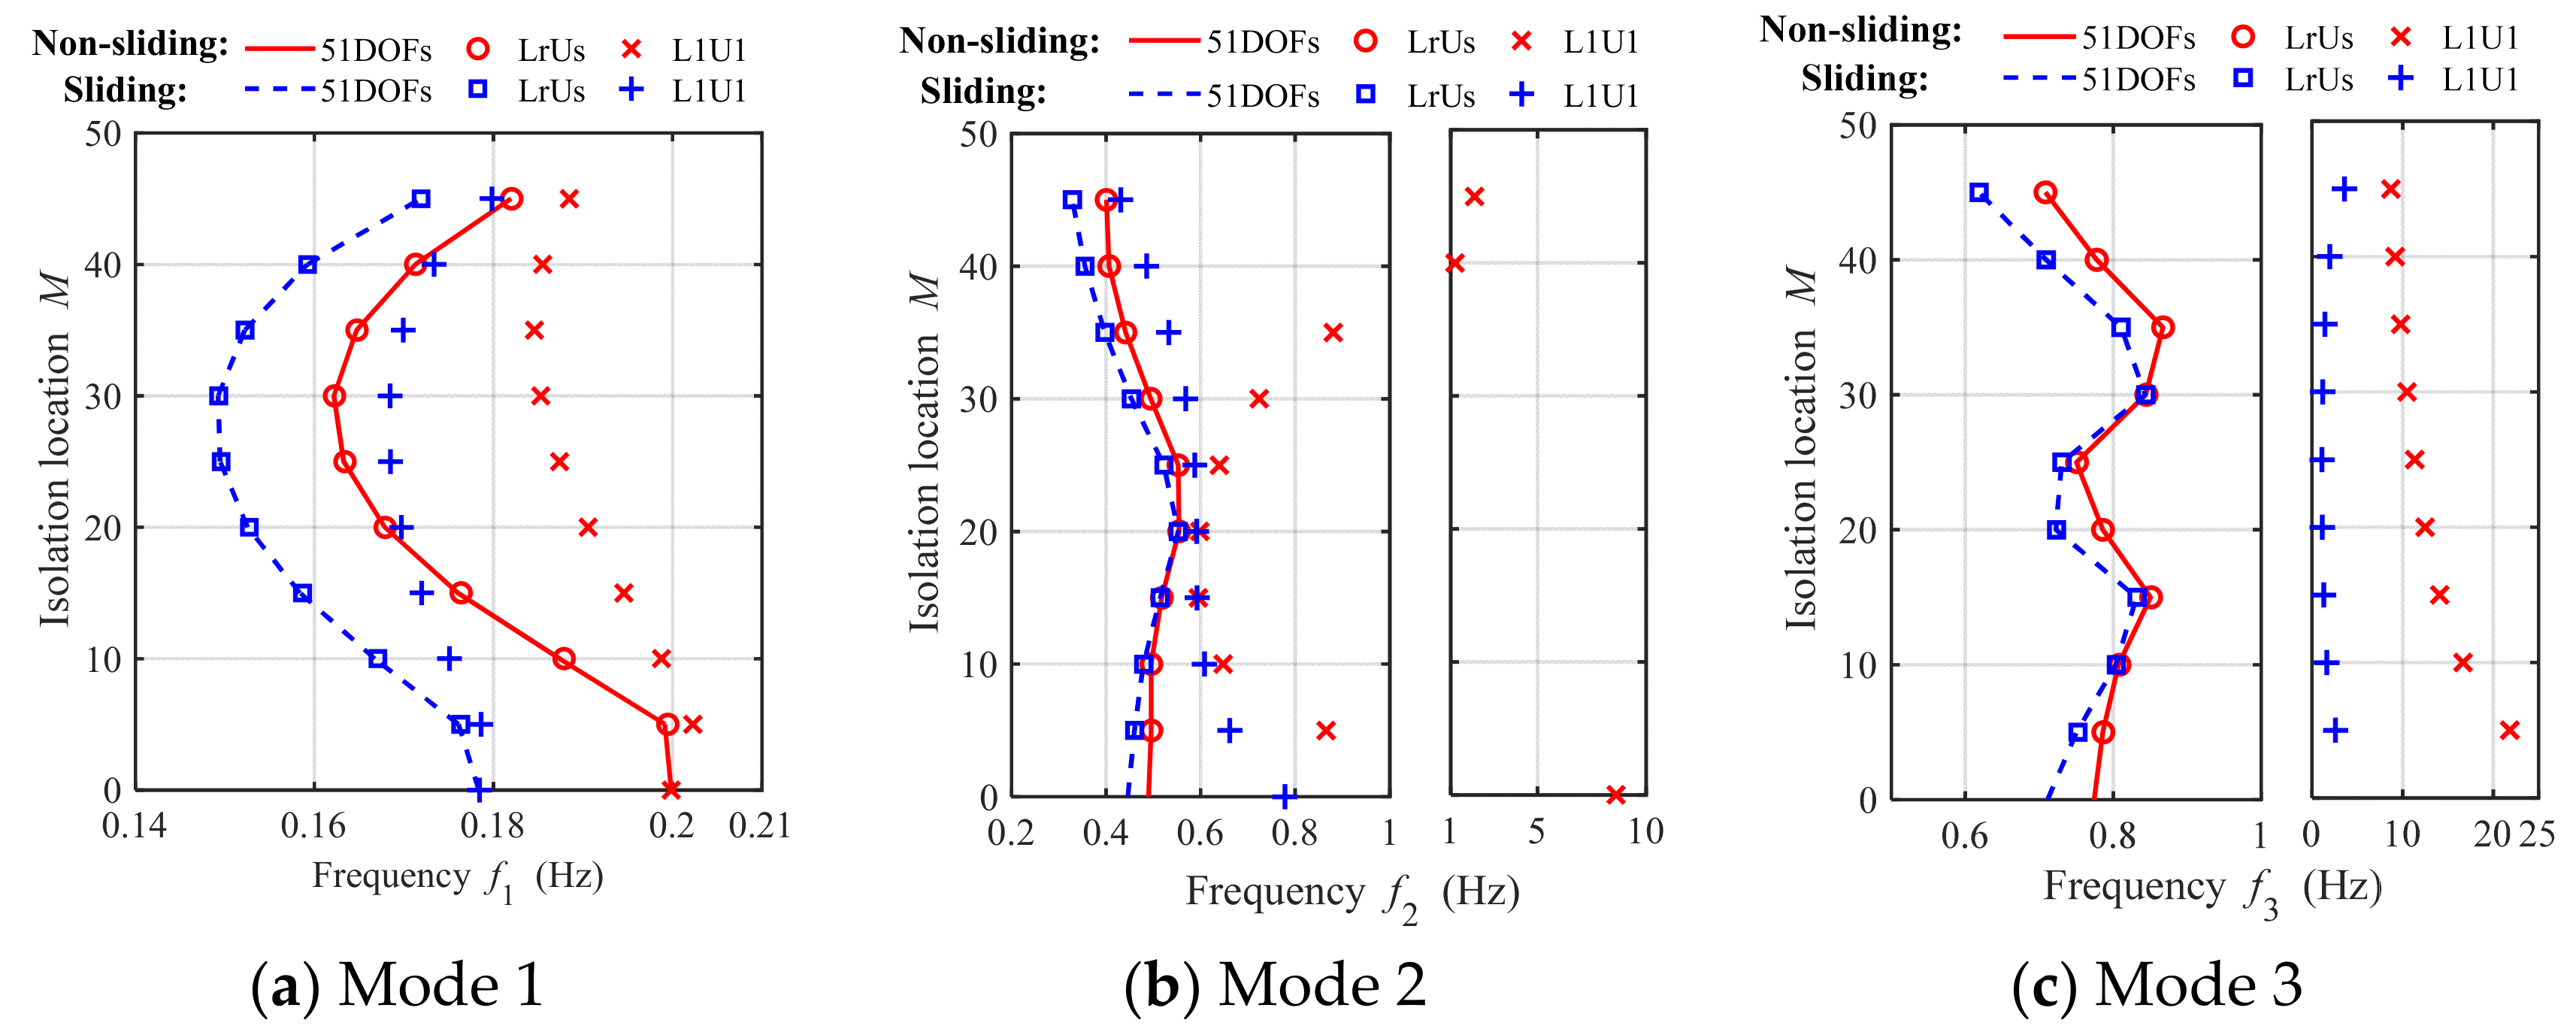
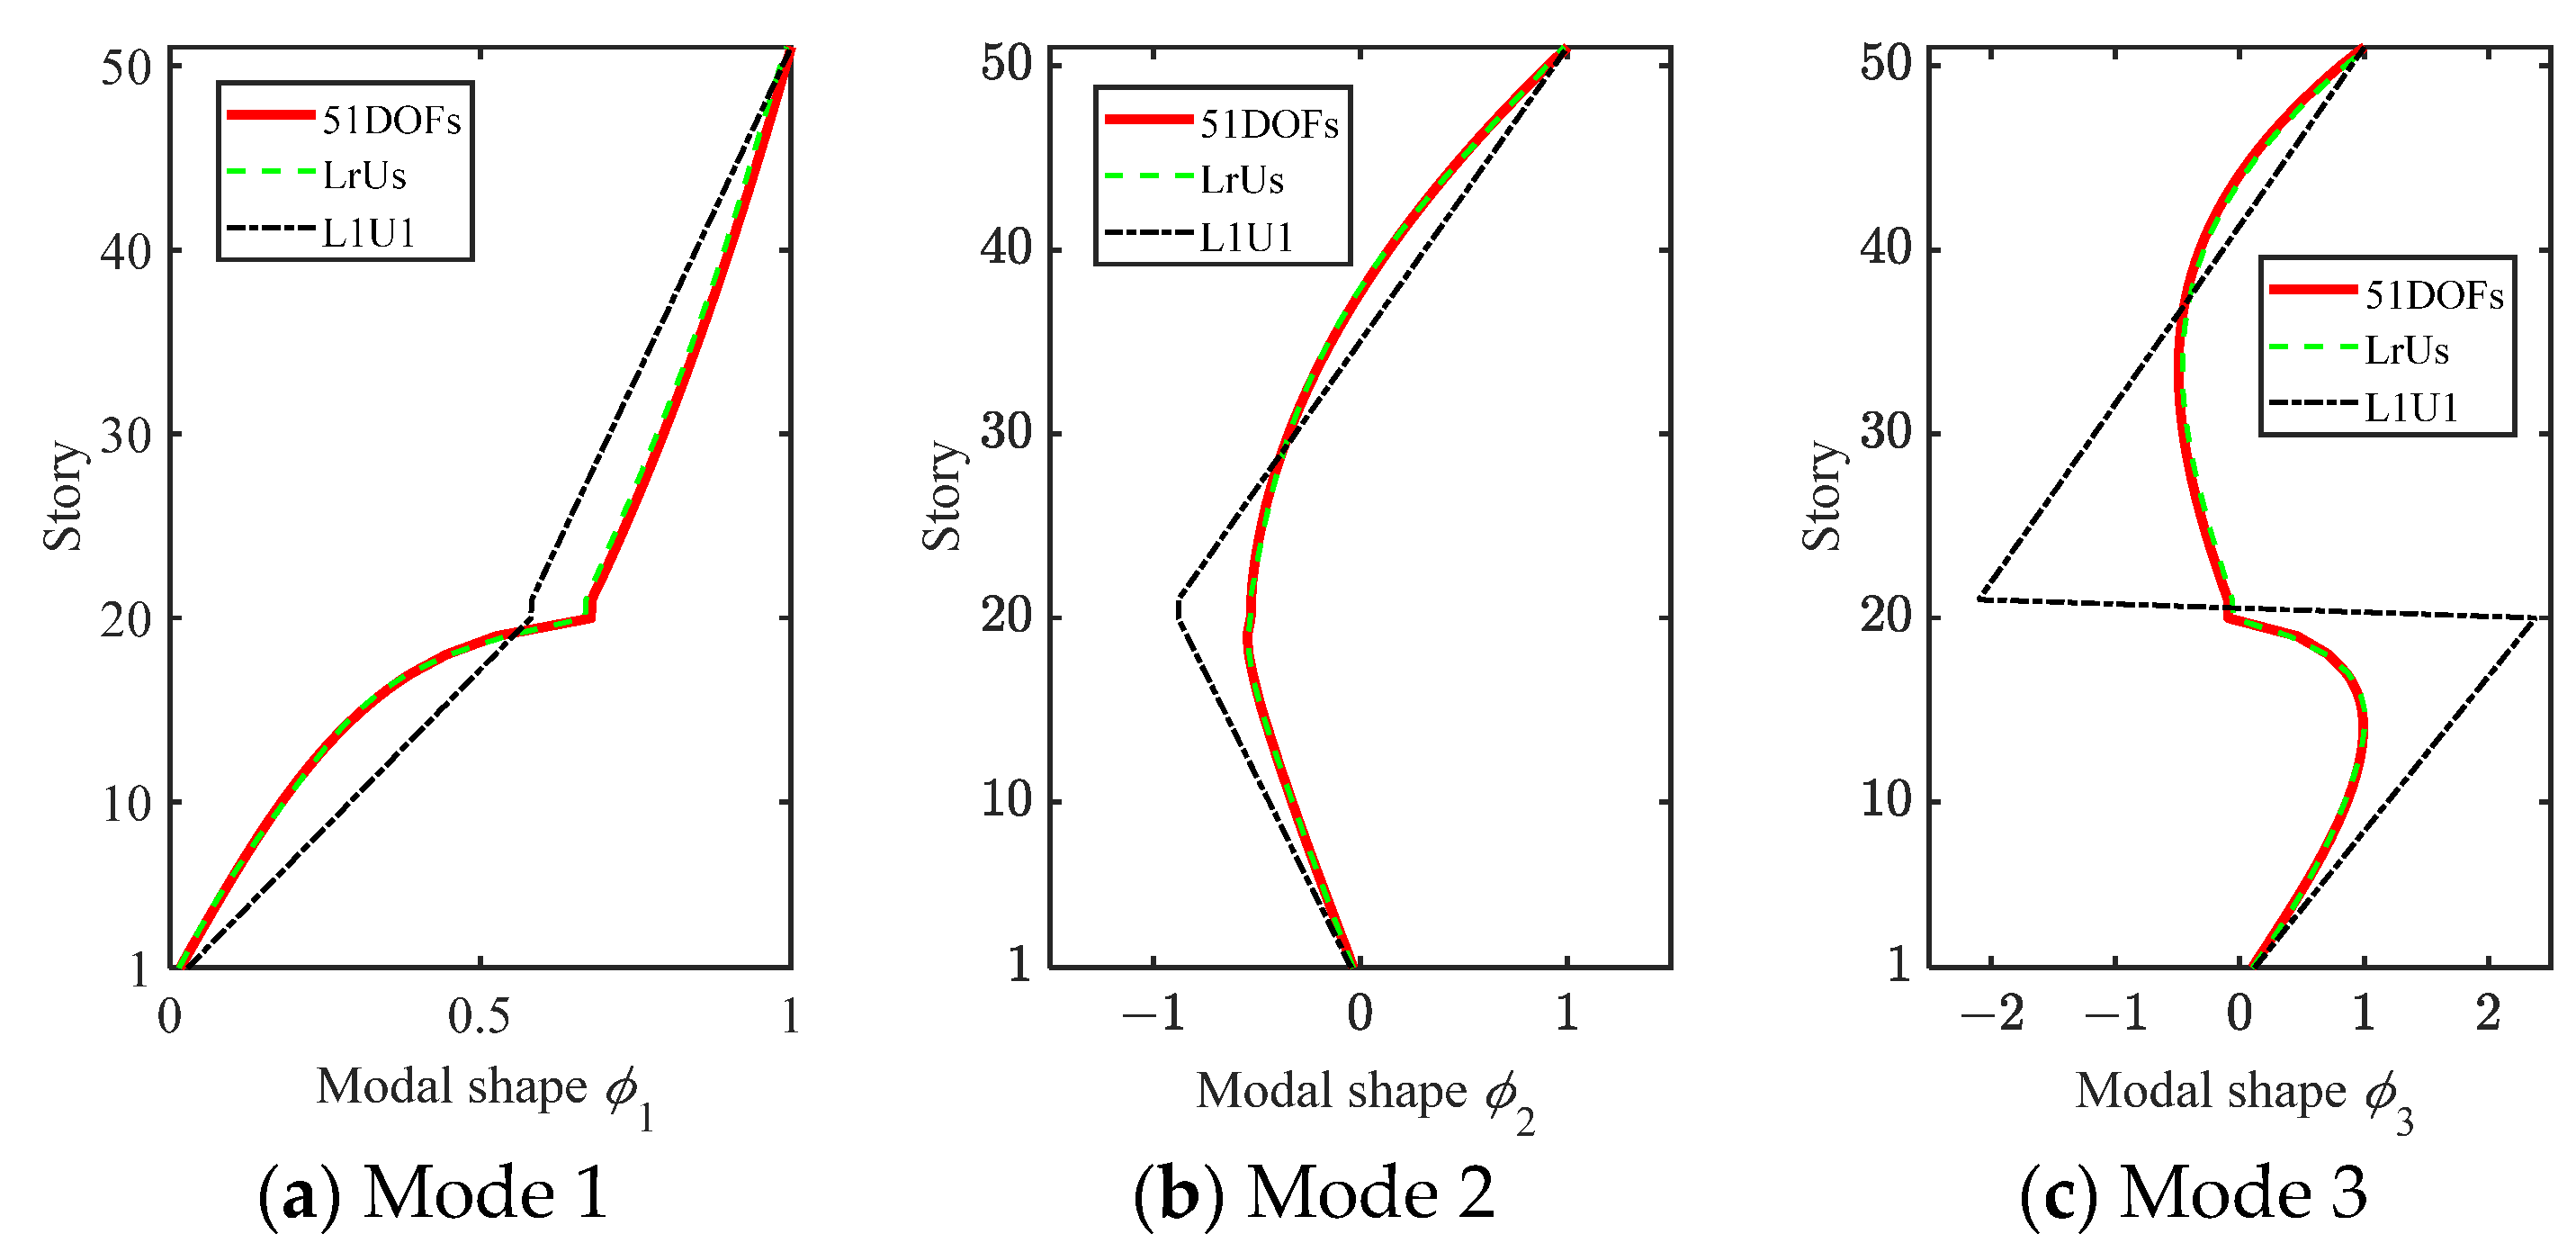
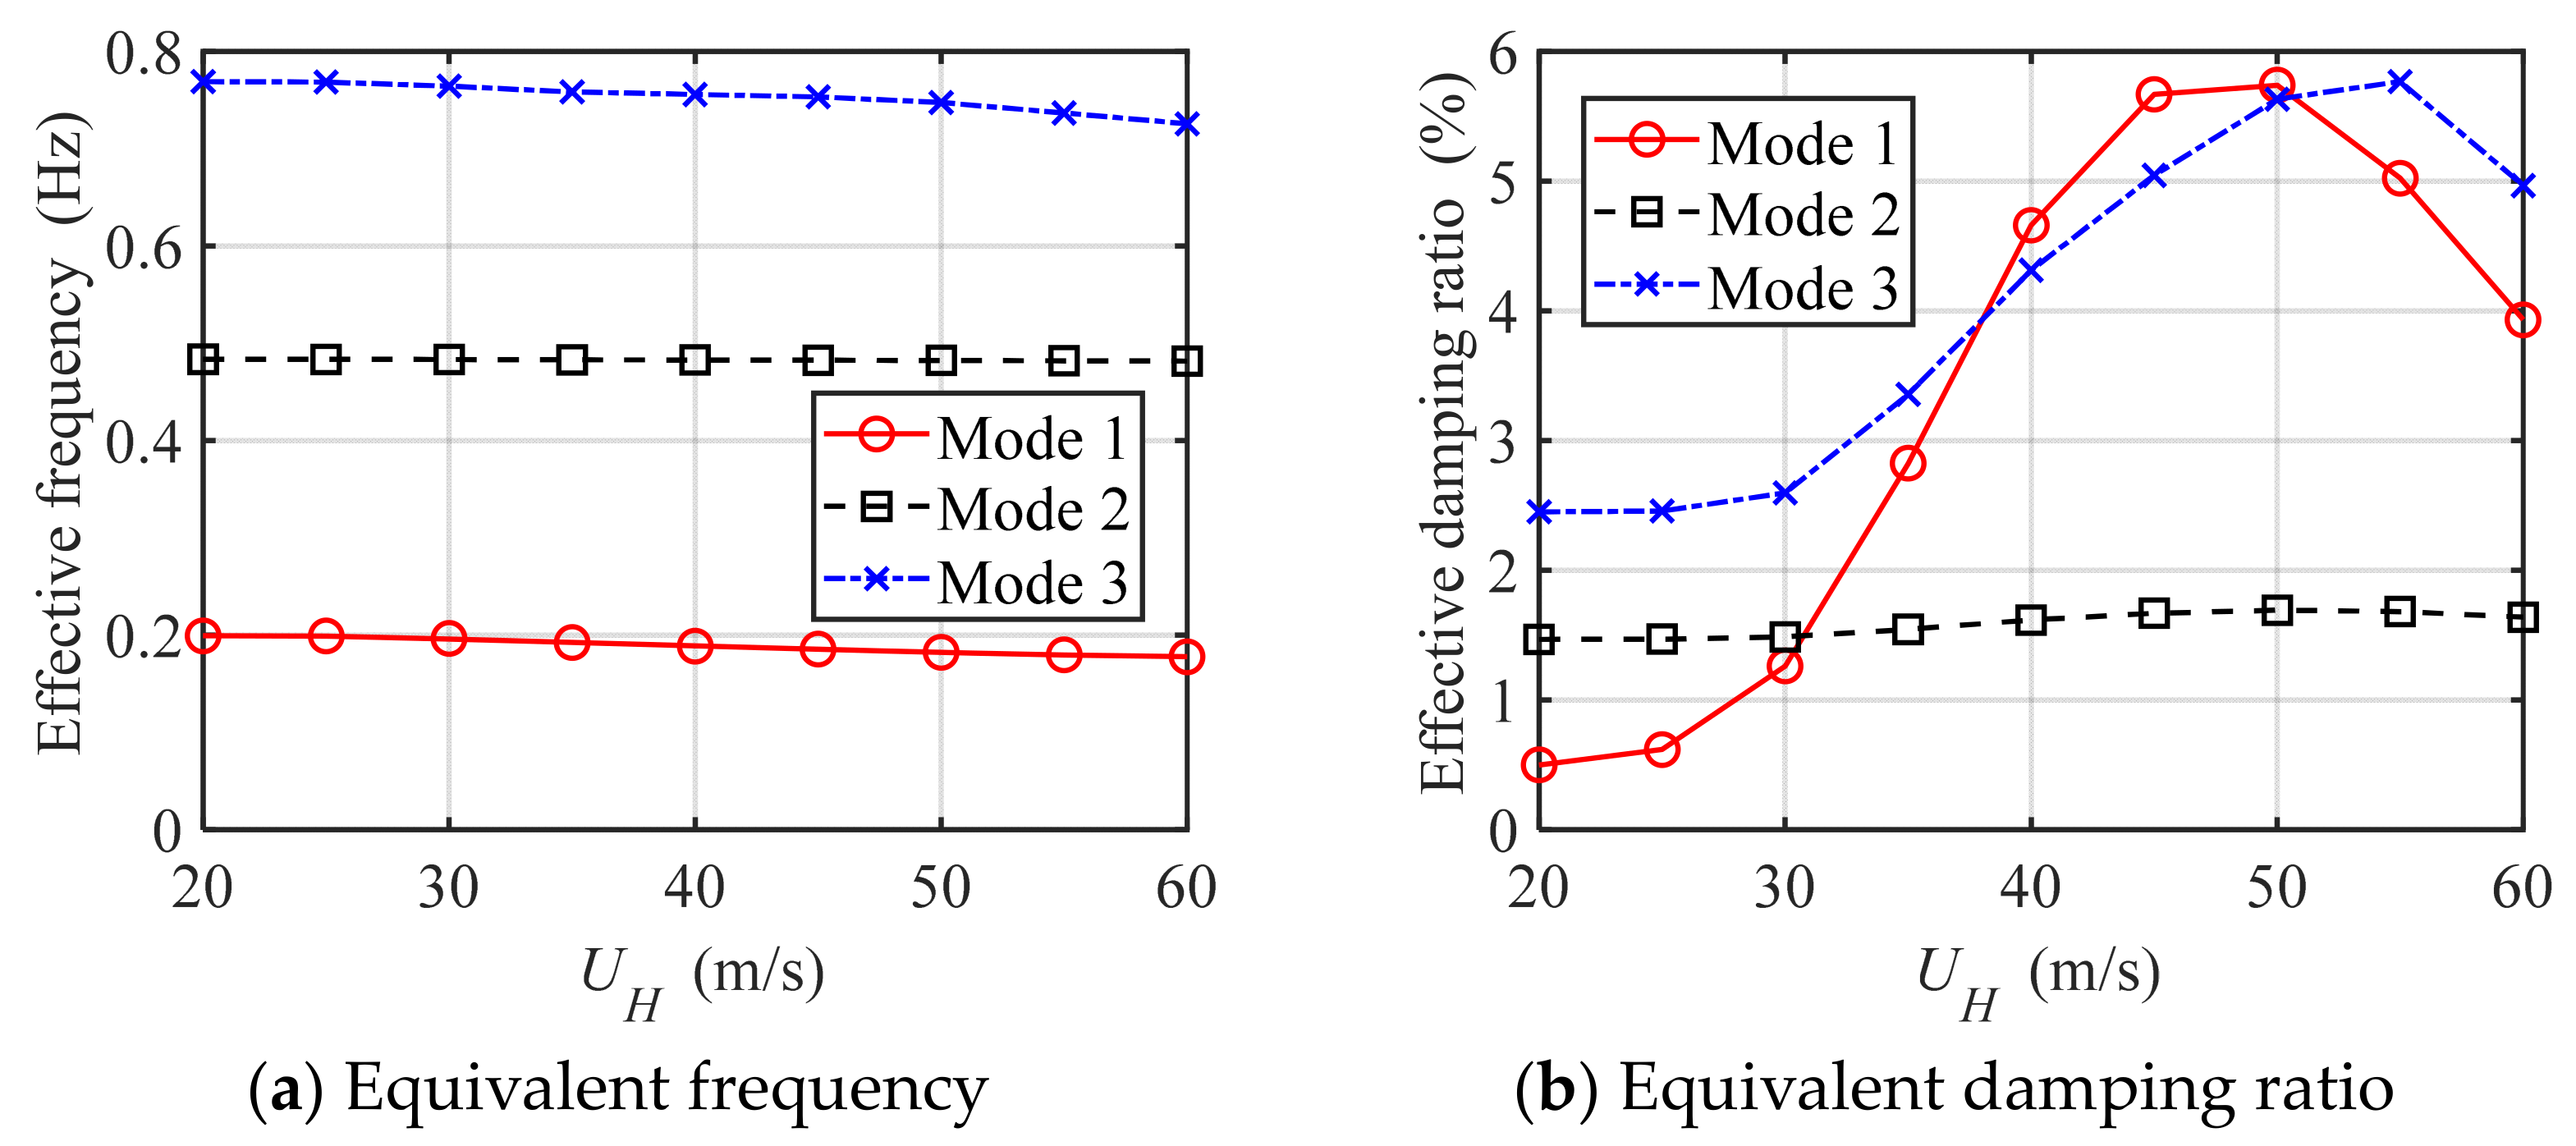
3.2. Modal Characteristics
3.2.1. Scheme A
3.2.2. Scheme B
4. Wind-Induced Response
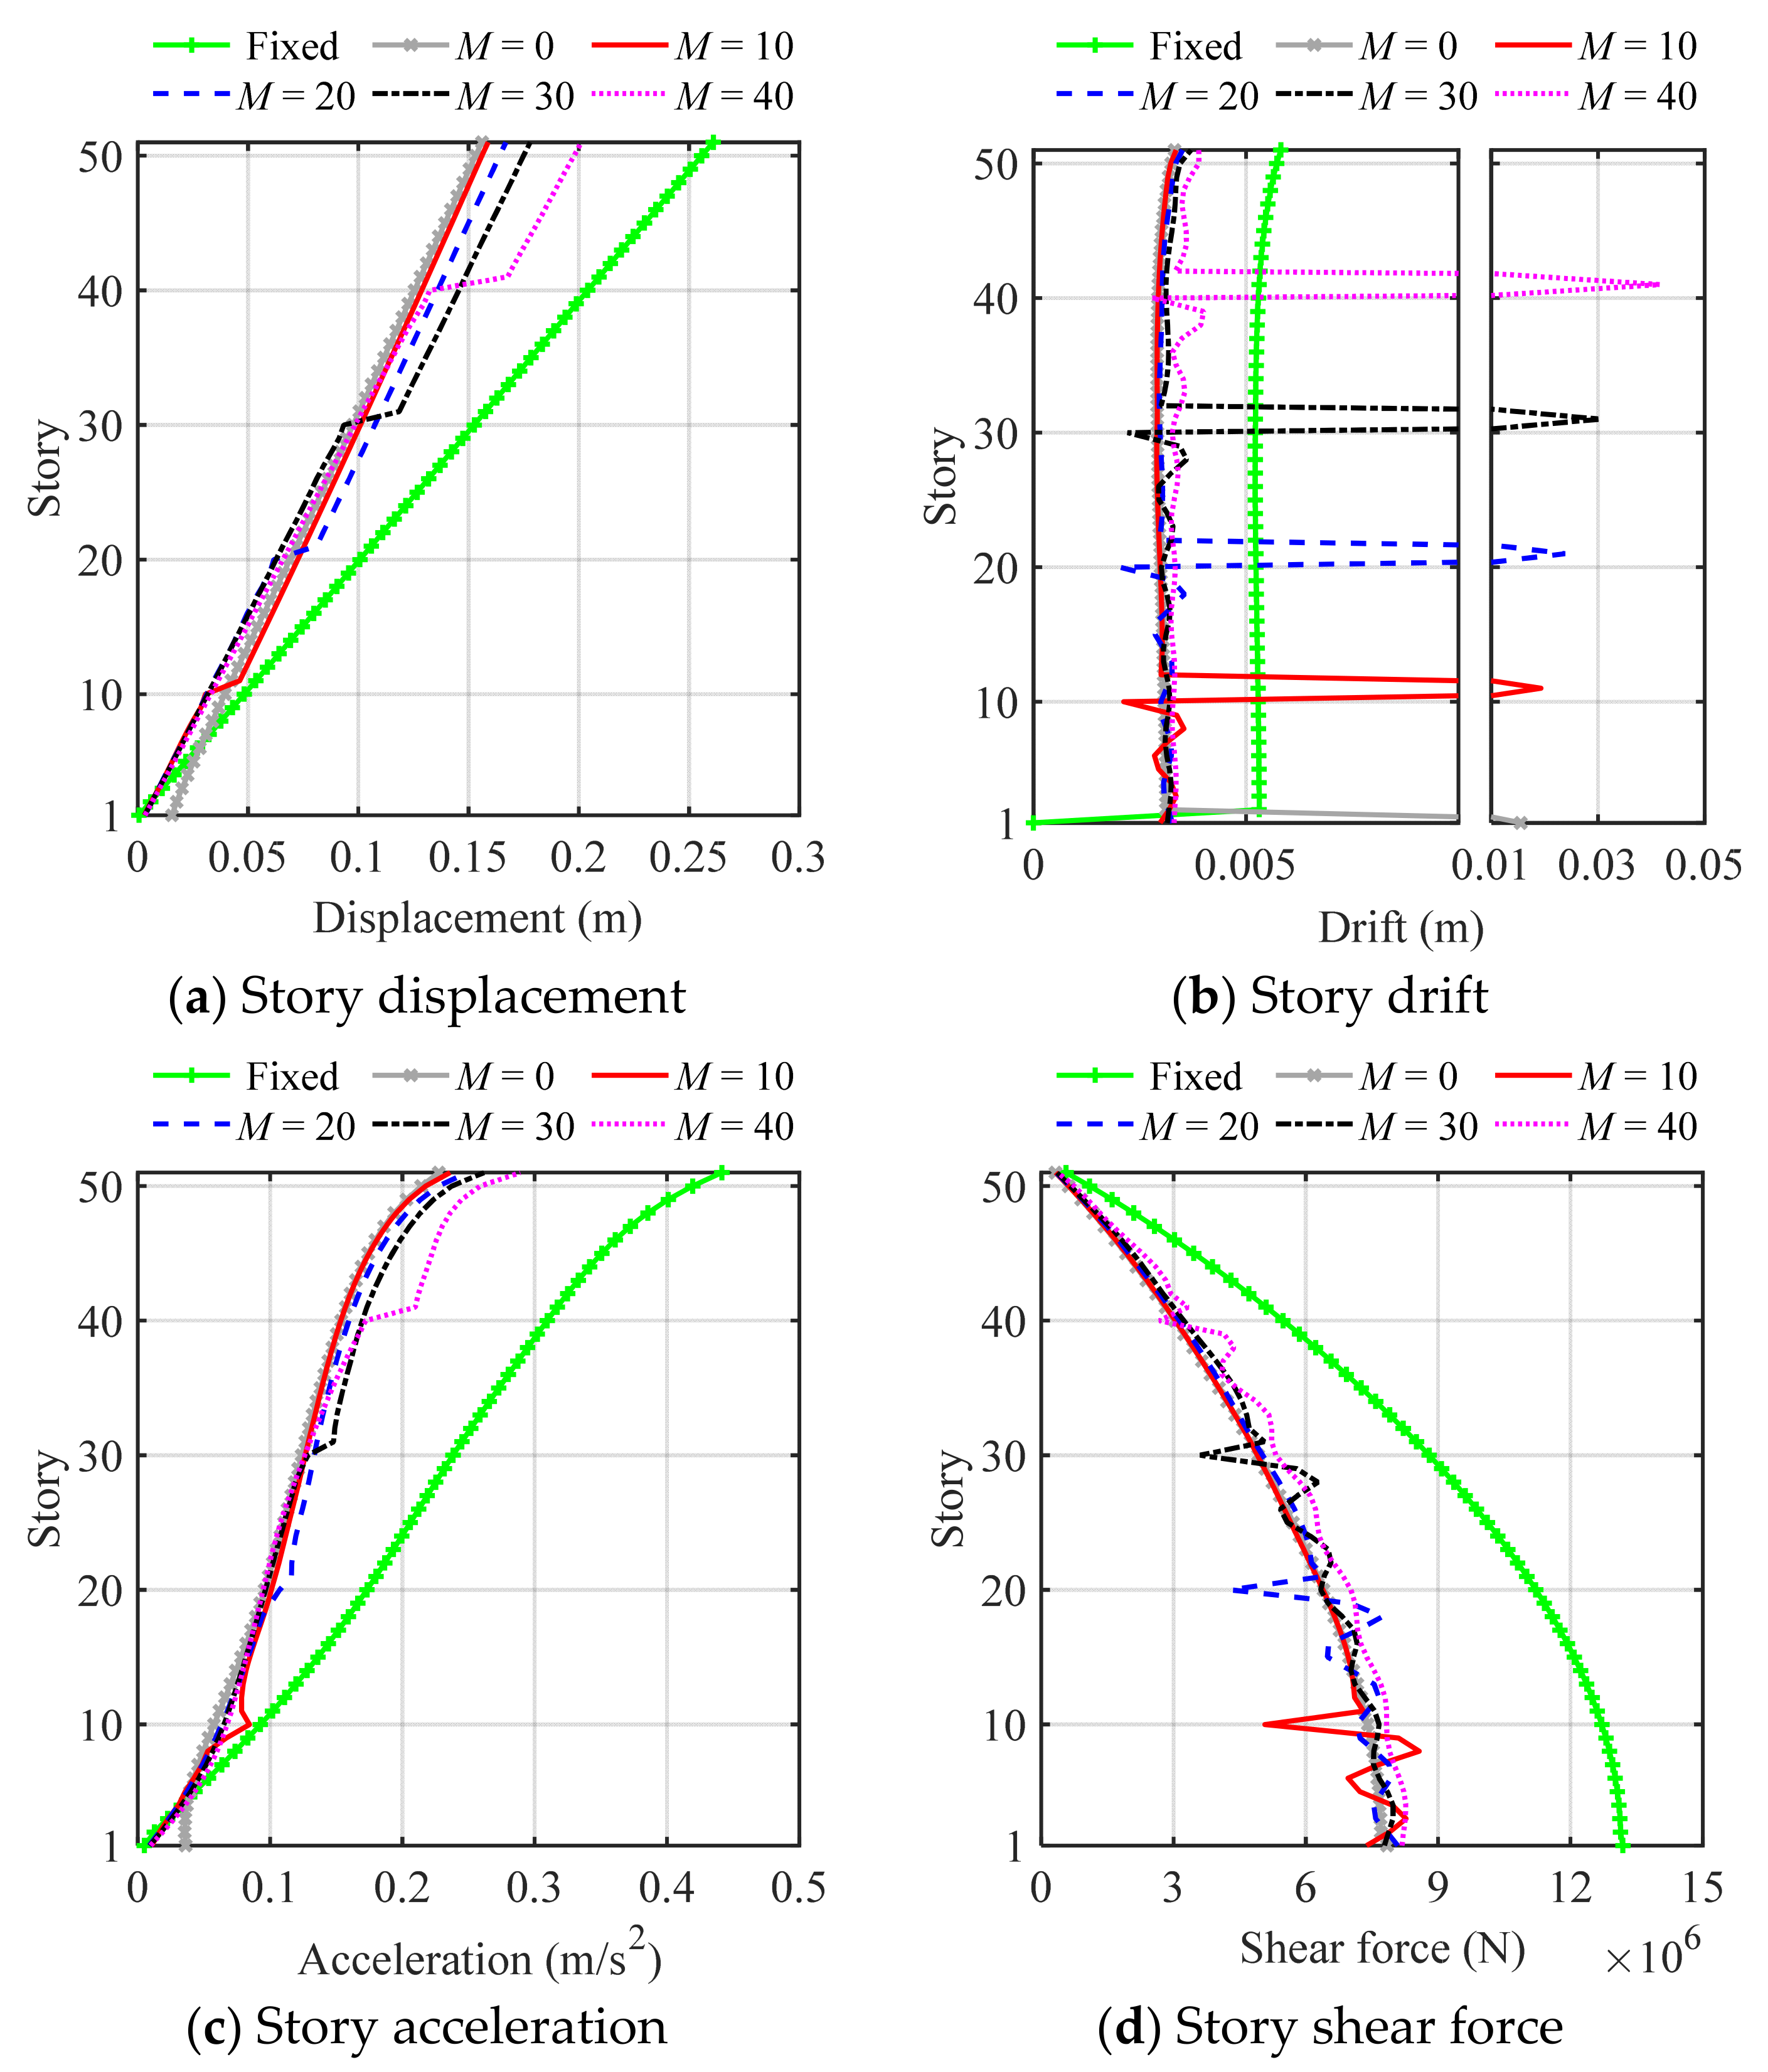
4.1. Dynamic Response of Buildings
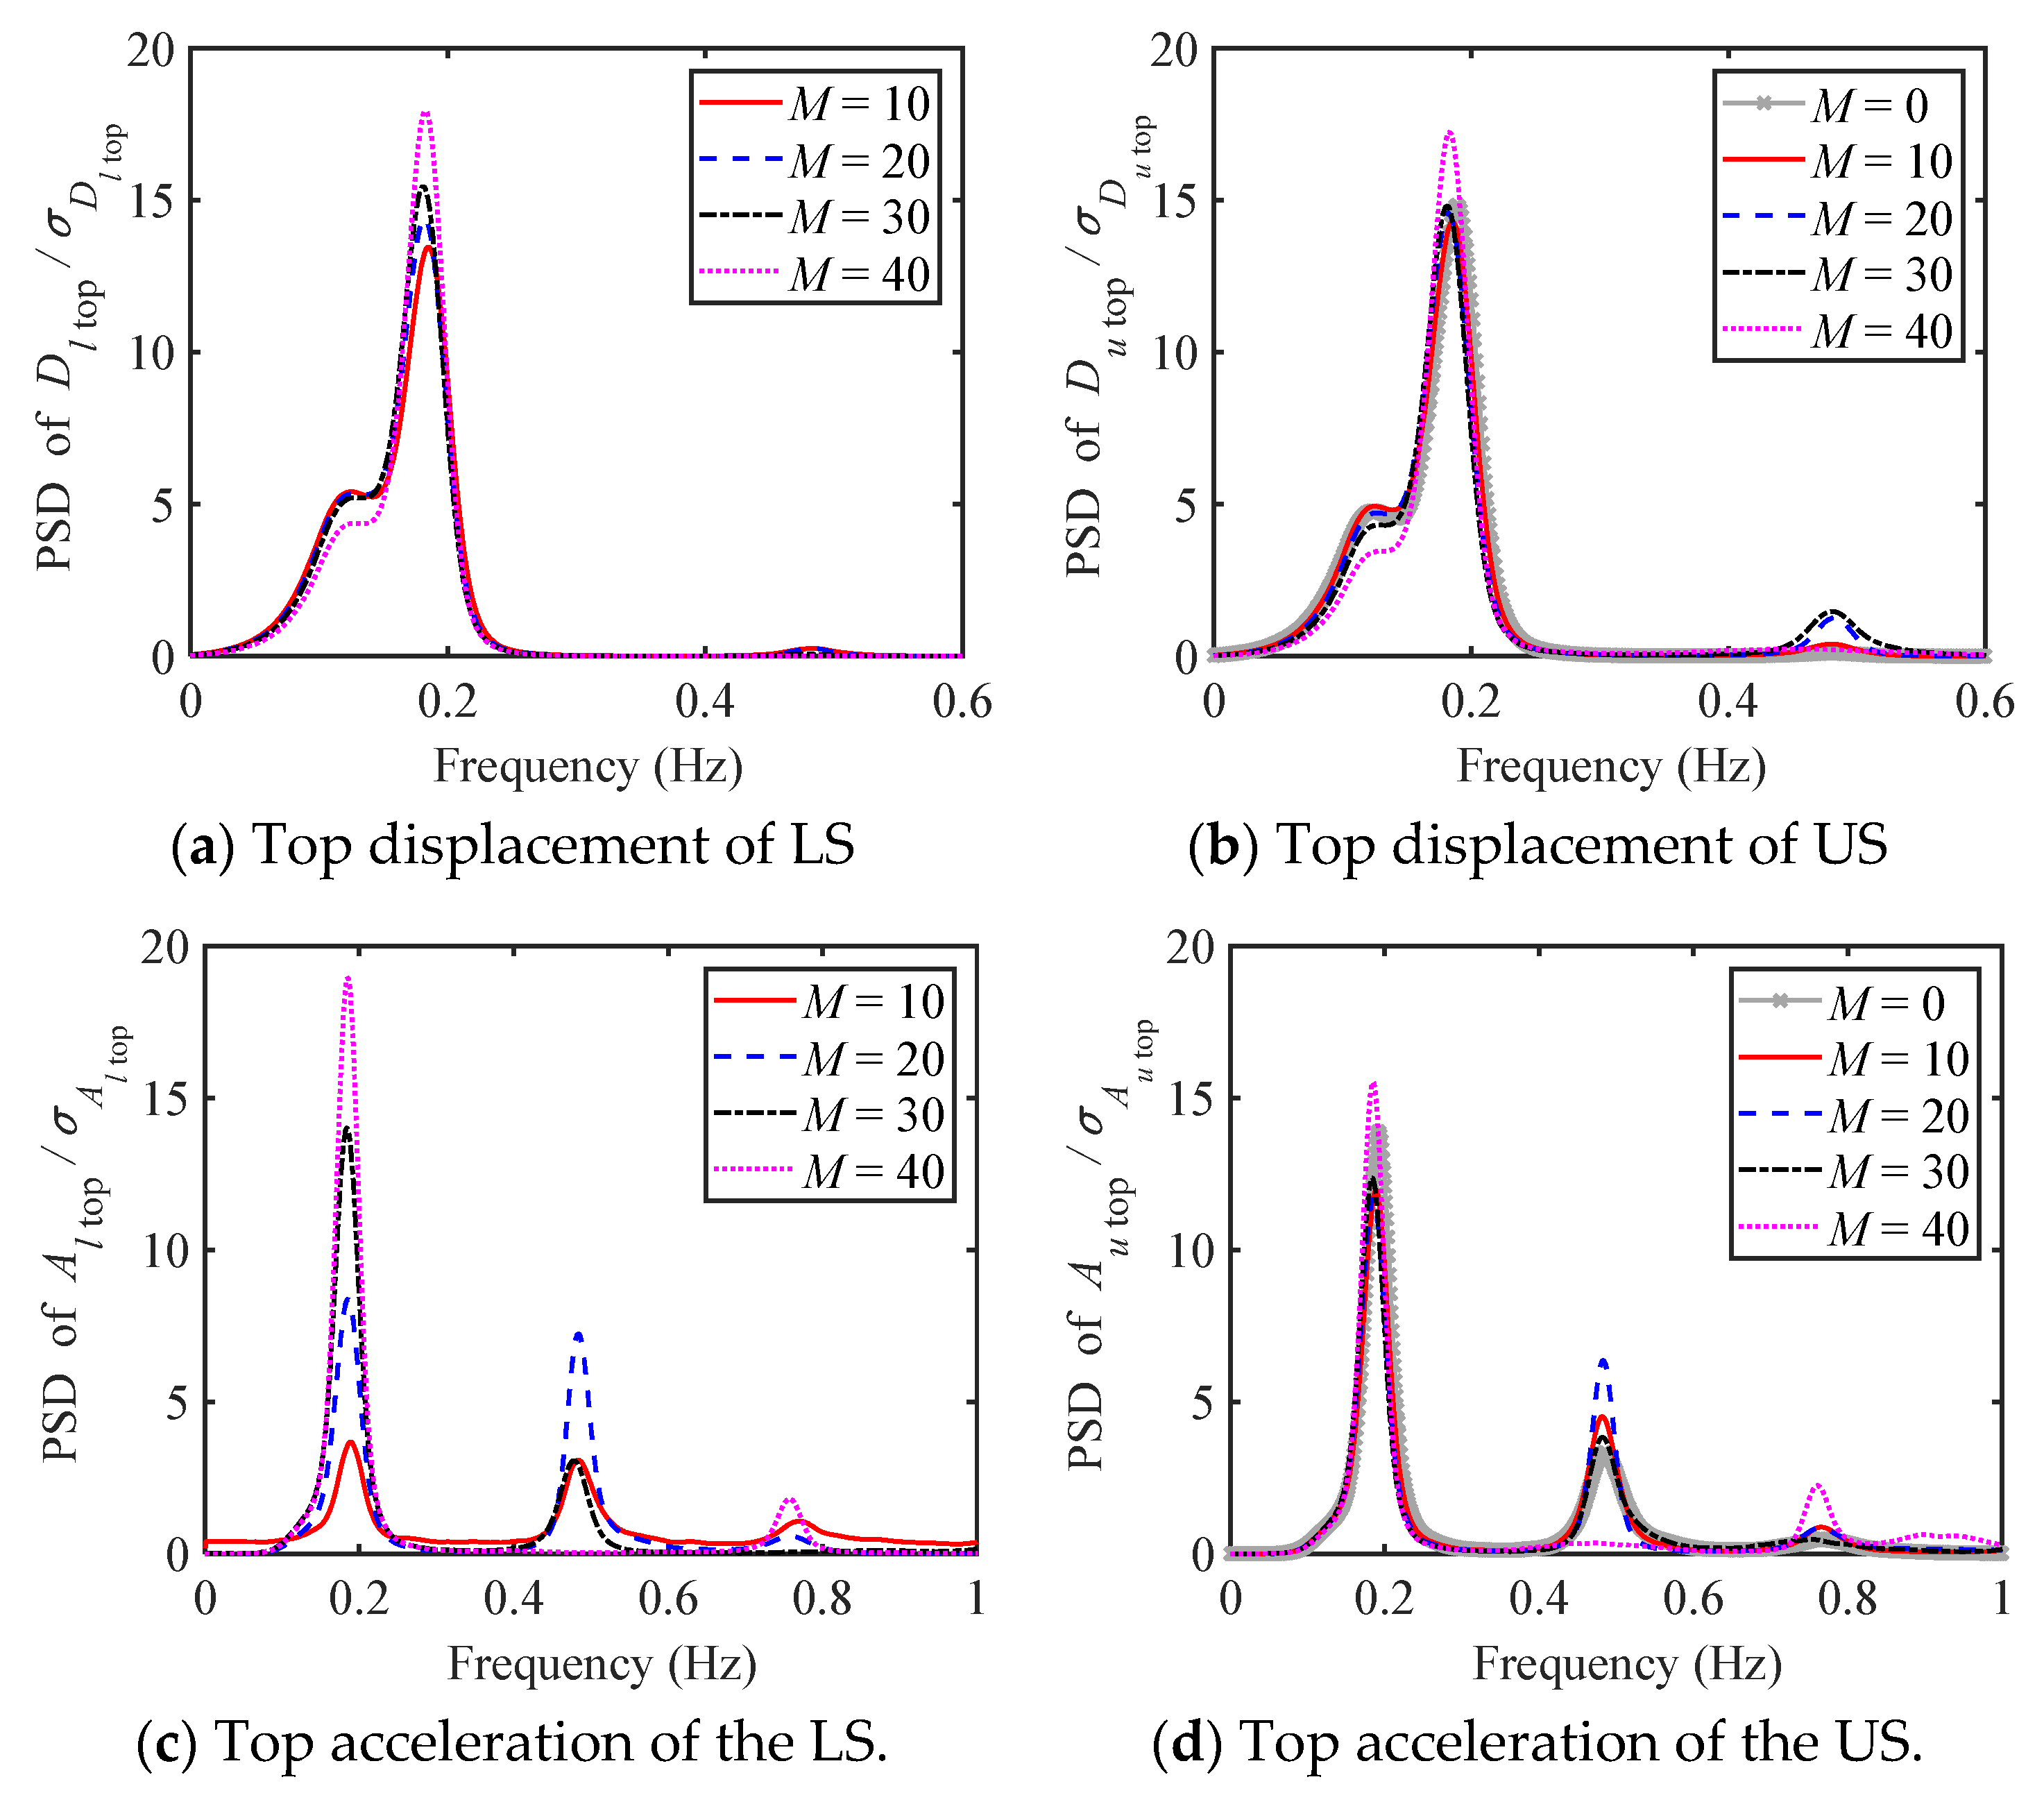
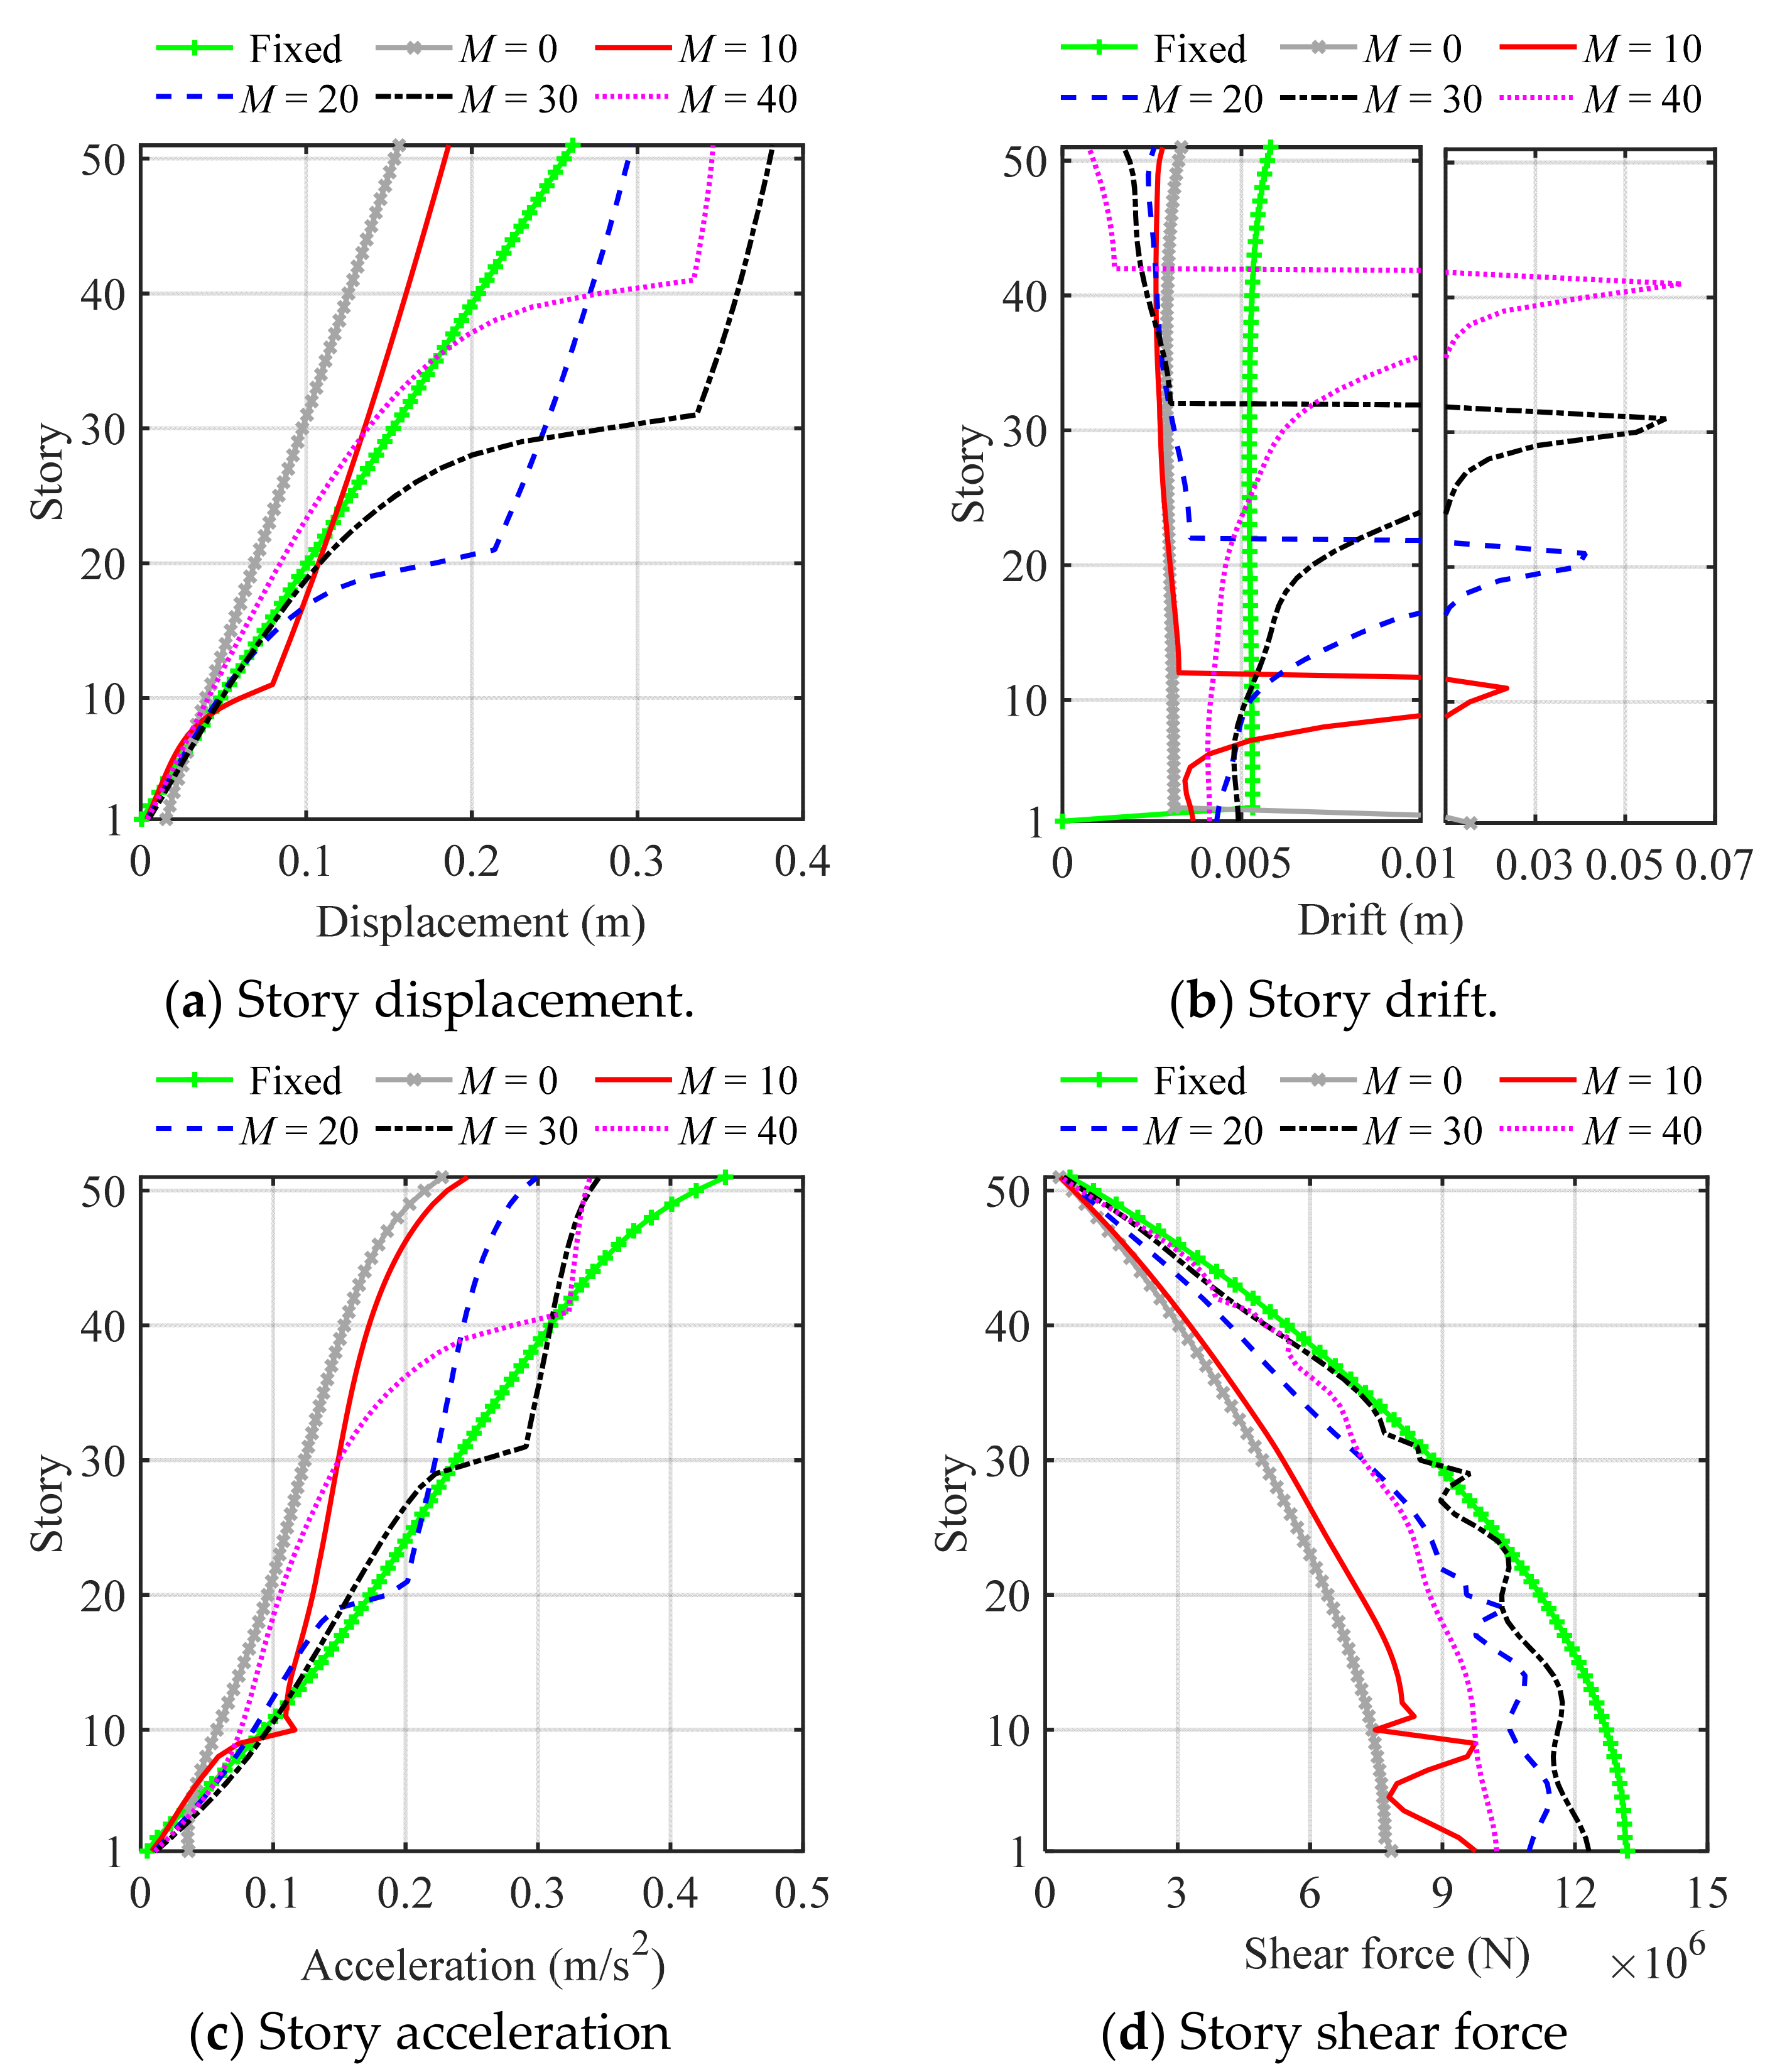
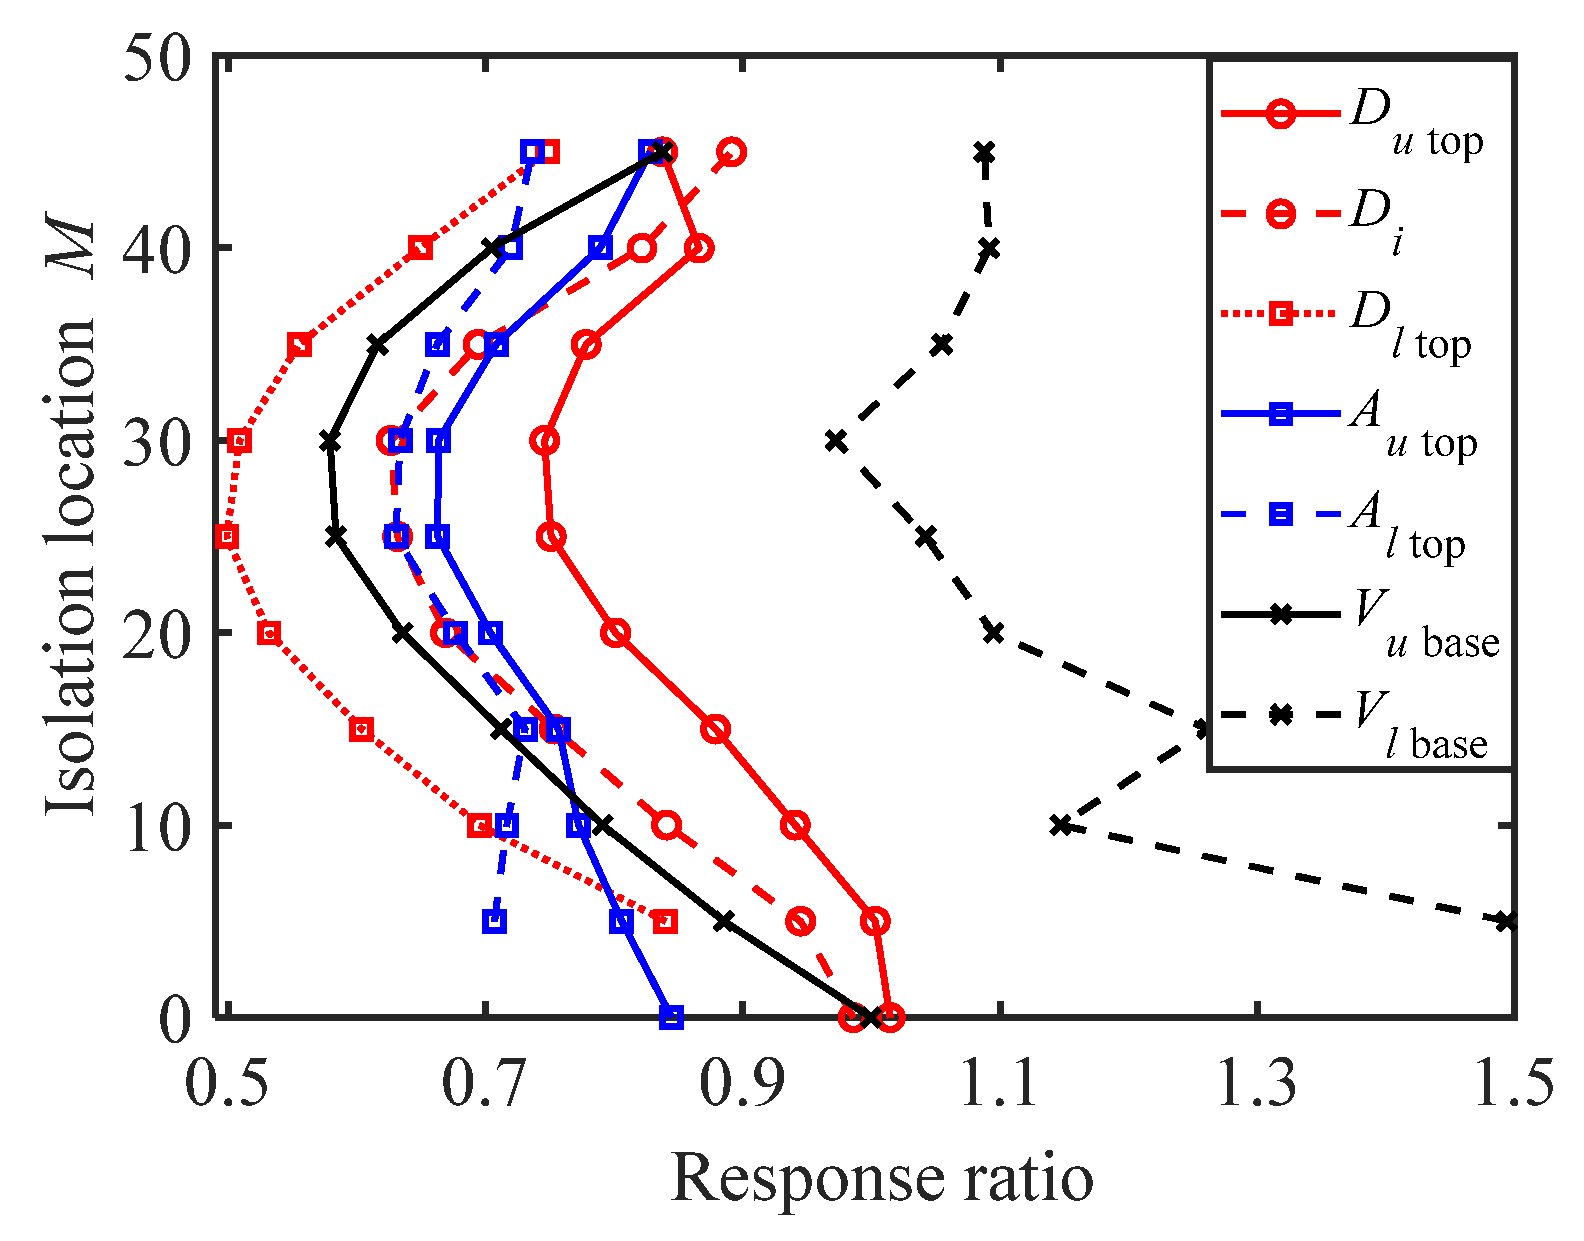
4.1.1. Scheme A
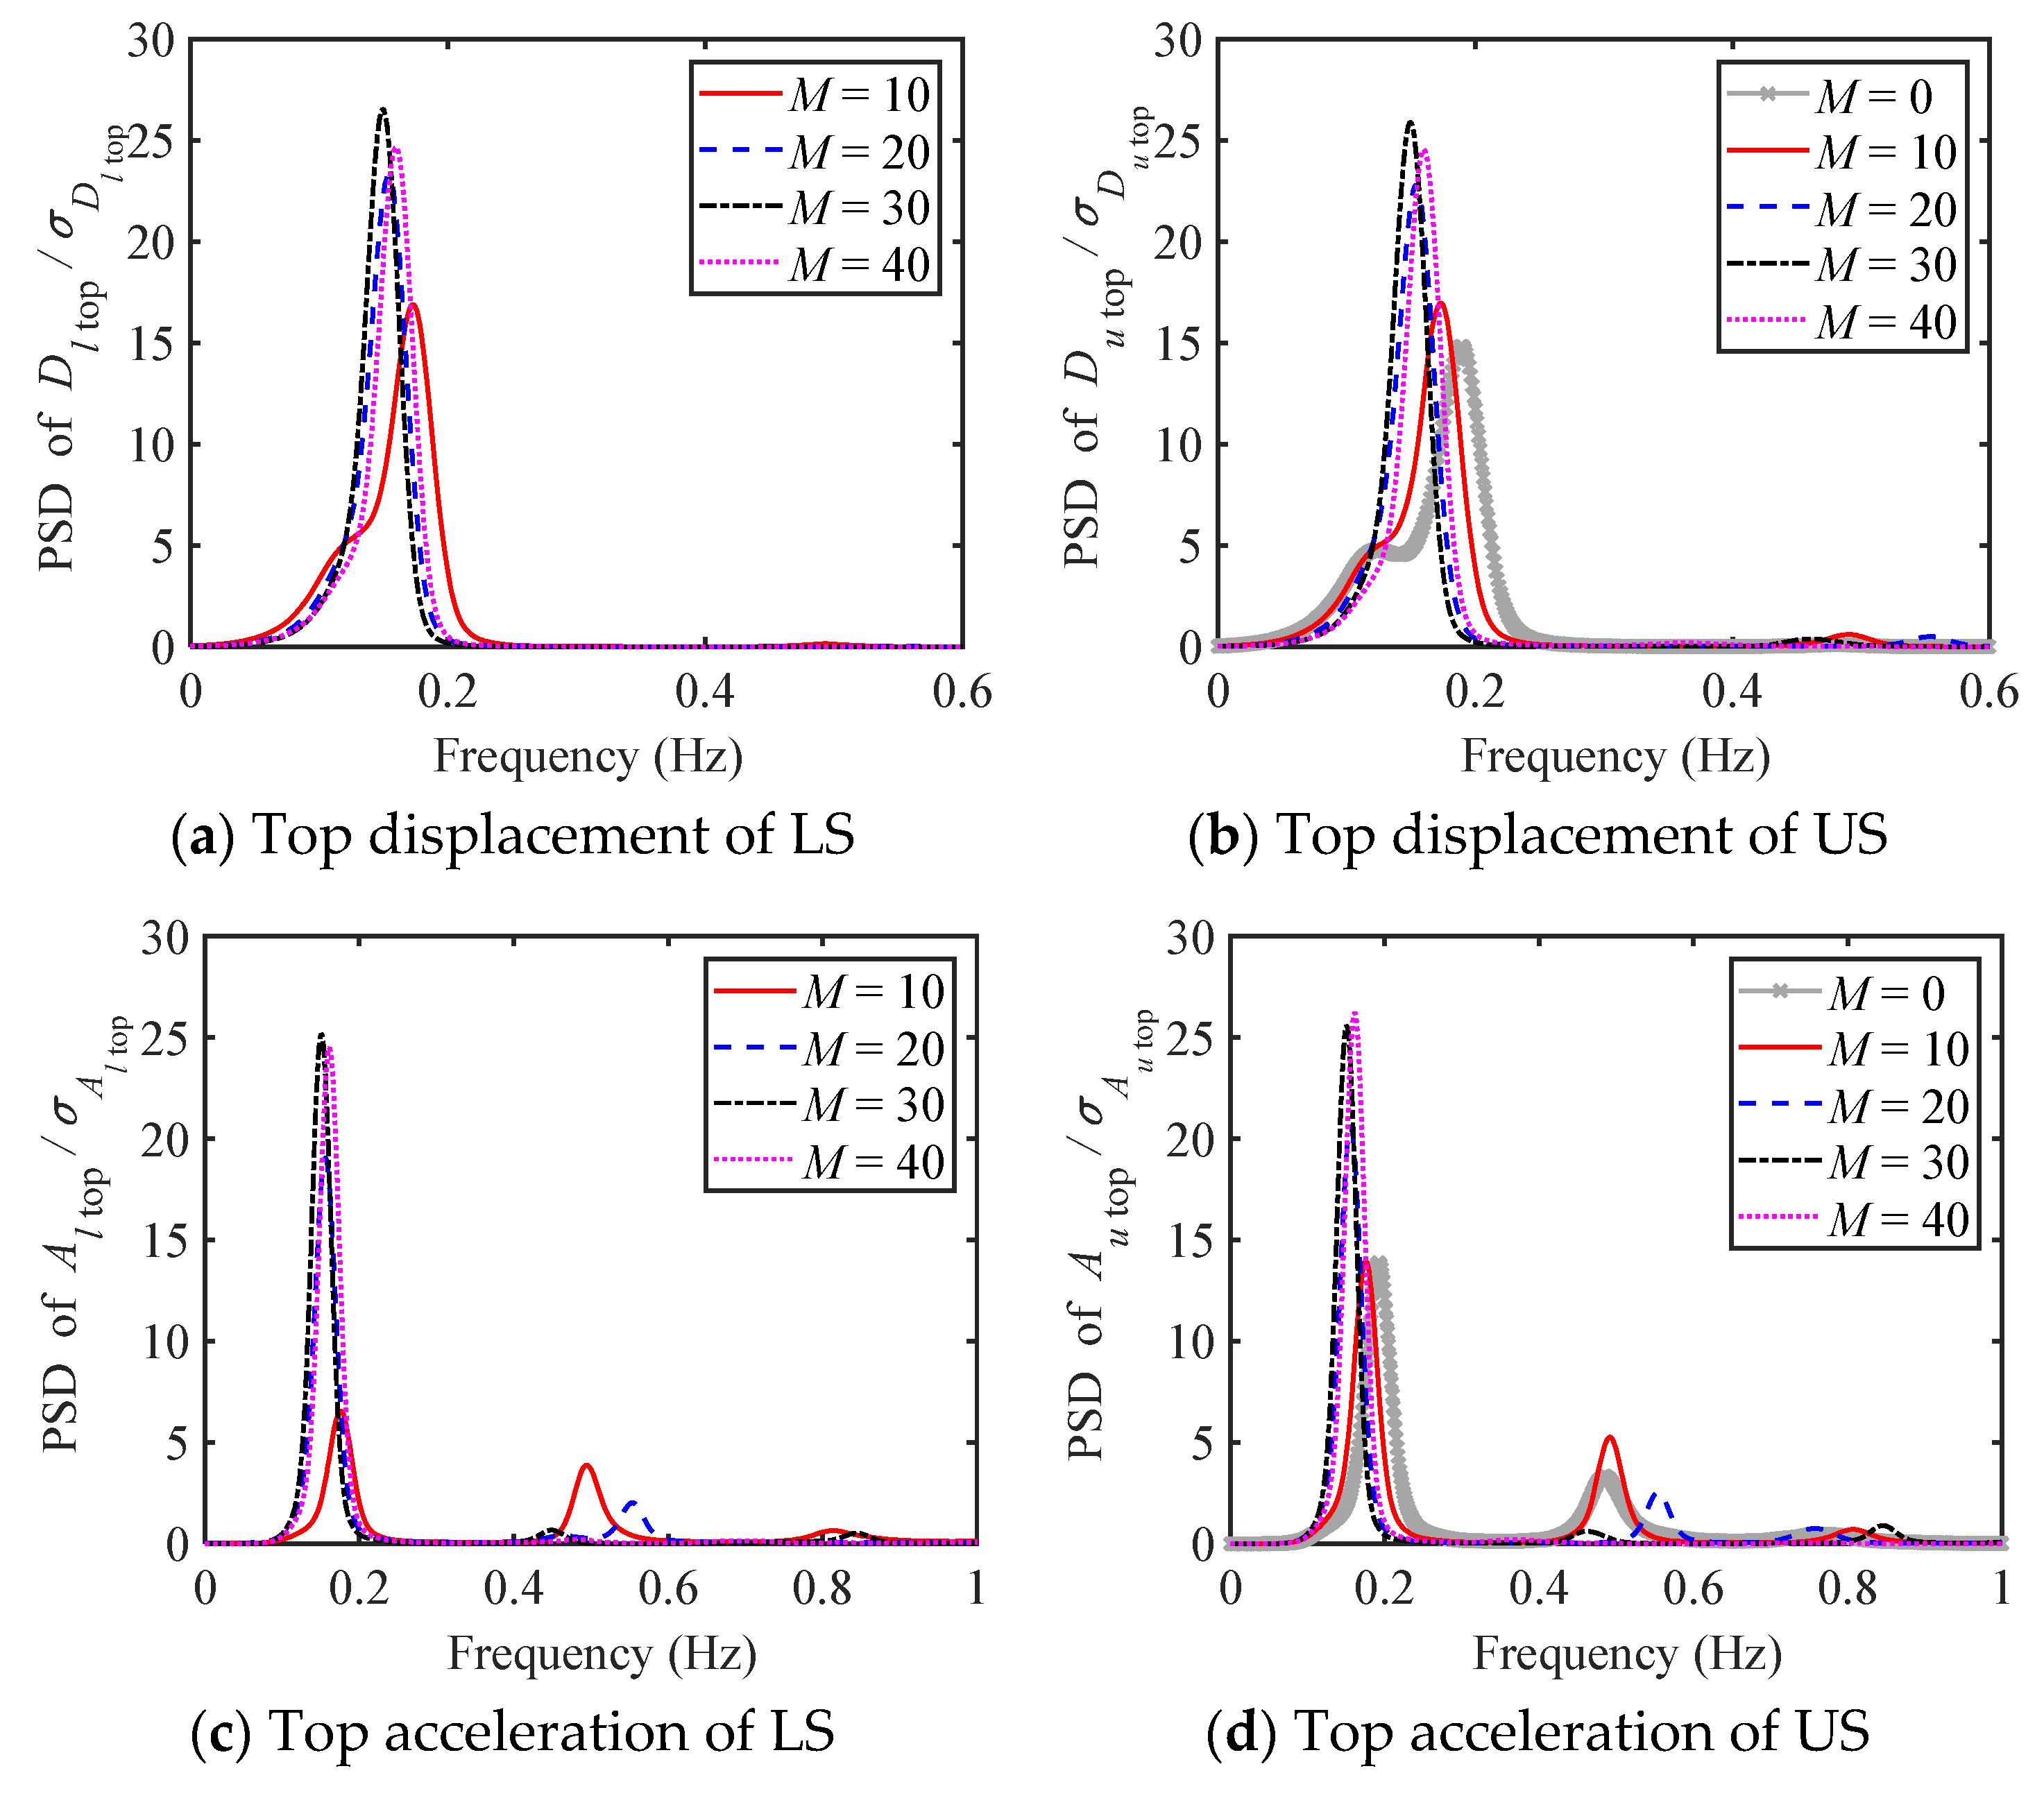
4.1.2. Scheme B
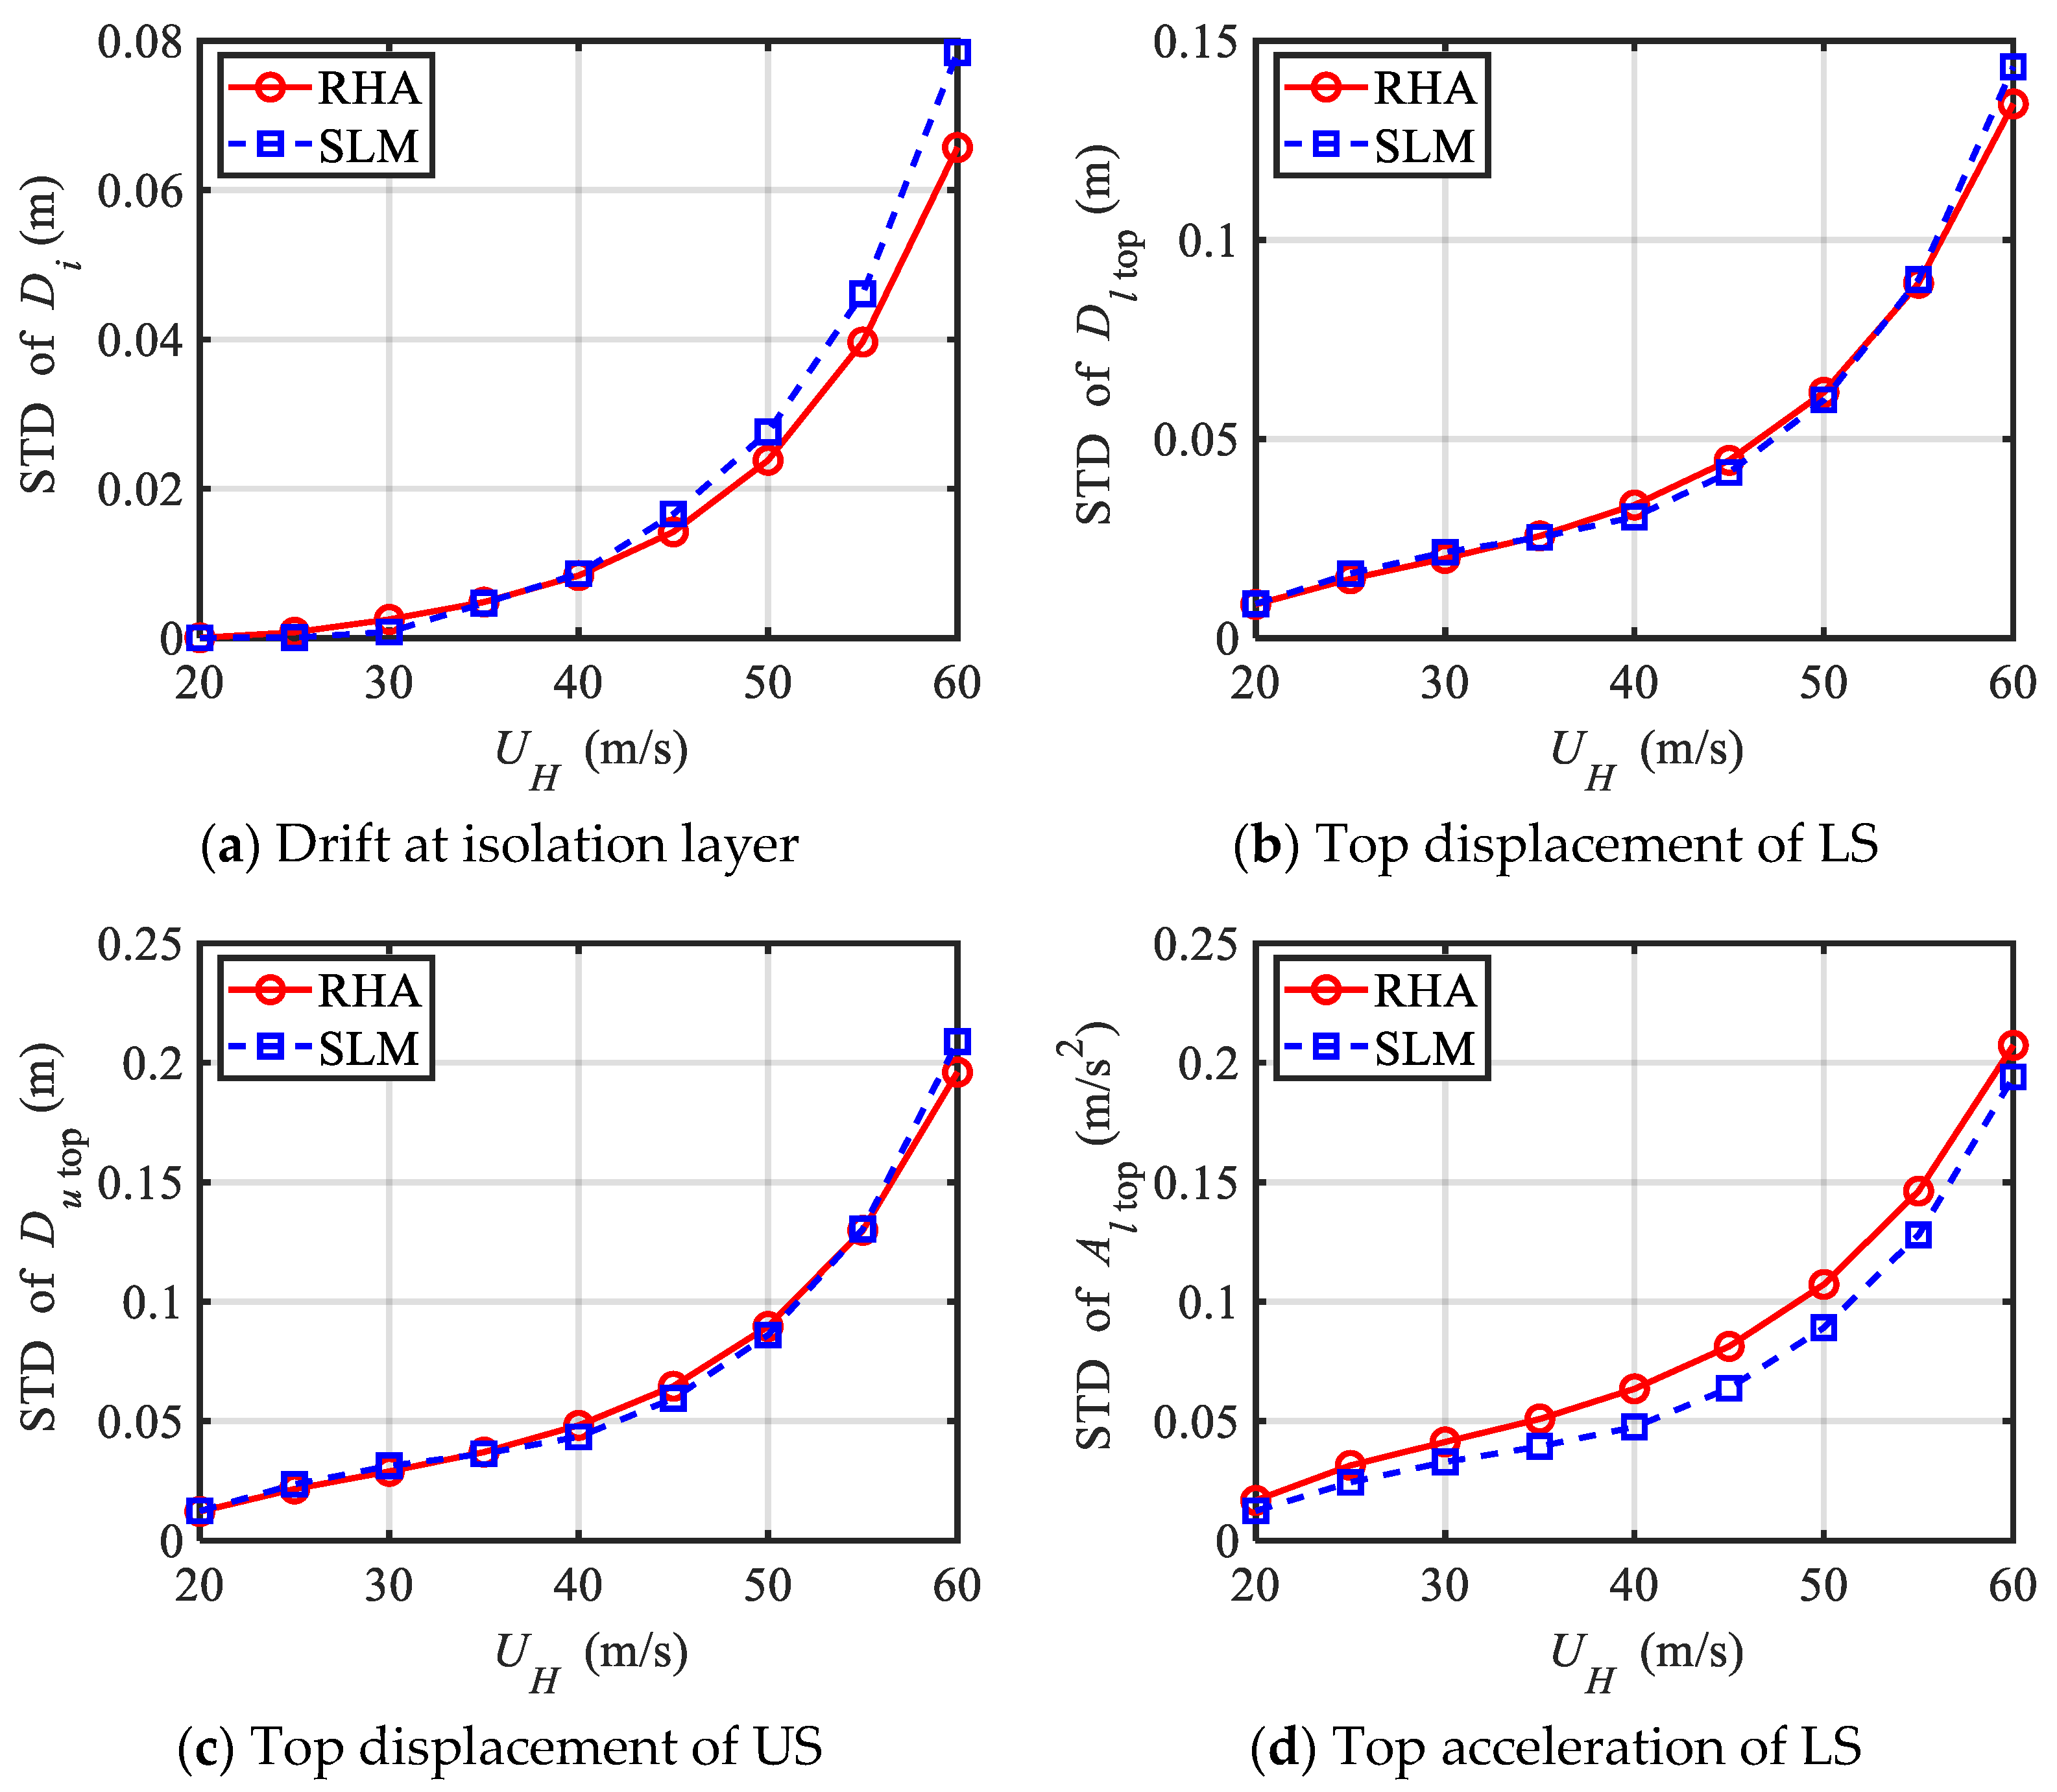
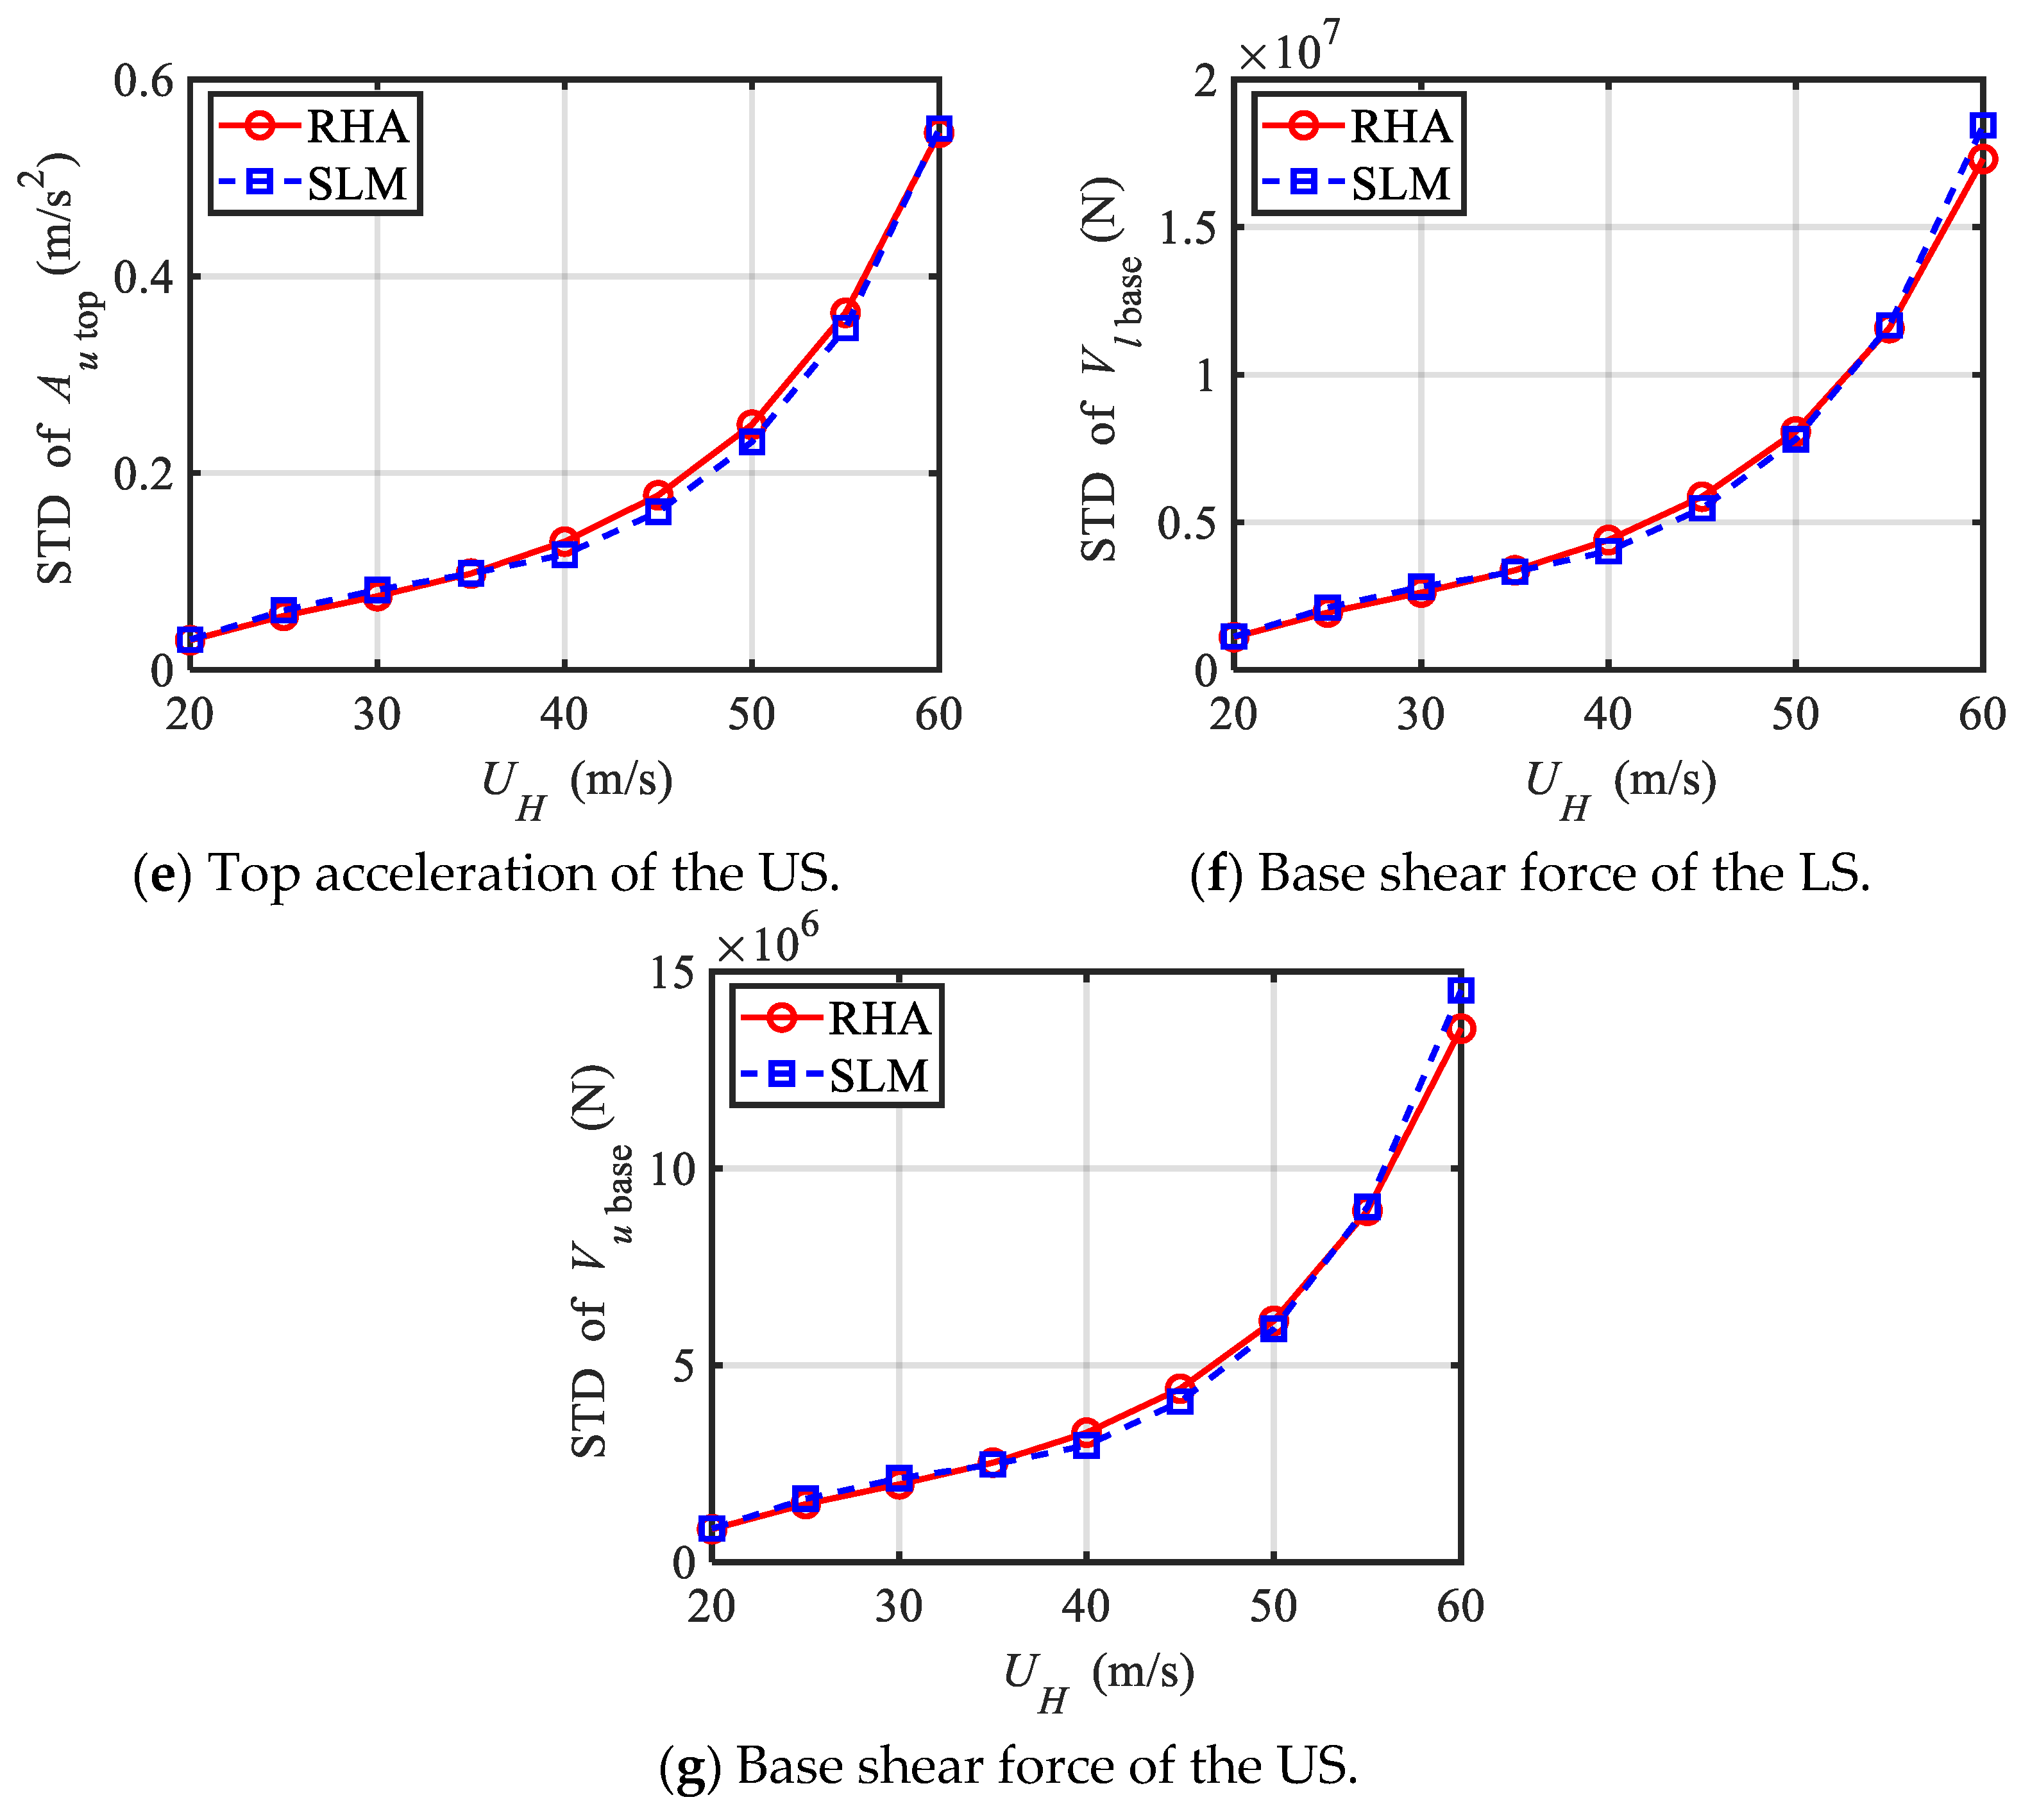
4.2. Accuracy of the Statistical Linearization Method
5. Conclusions
Author Contributions
Funding
Data Availability Statement
Conflicts of Interest
References
- Skinner, R.; Robinson, W.; Mcverry, G. An Introduction to Seismic Isolation; Wiley: Chichester, UK, 1993. [Google Scholar]
- Makris, N. Seismic Isolation: Early History. Earthq. Eng. Struct. Dyn. 2019, 48, 269–283. [Google Scholar] [CrossRef]
- Ali, A.; Zhang, C.W.; Bibi, T.; Sun, L. Experimental Investigation of Sliding-Based Isolation System with Re-Centering Functions for Seismic Protection of Masonry Structures. Structures 2024, 60, 105871. [Google Scholar] [CrossRef]
- Faiella, D.; Mele, E. Vibration Characteristics and Higher Mode Coupling in Intermediate Isolation Systems (IIS): A Parametric Analysis. Bull. Earthq. Eng. 2019, 17, 4347–4387. [Google Scholar] [CrossRef]
- Ziyaeifar, M.; Noguchi, H. Partial Mass Isolation in Tall Buildings. Earthq. Eng. Struct. Dyn. 1998, 27, 49–65. [Google Scholar] [CrossRef]
- Villaverde, R. Aseismic Roof Isolation System: Feasibility Study With 13-Story Building. J. Struct. Eng. 2002, 128, 188–196. [Google Scholar] [CrossRef]
- Chey, M.; Chase, J.G.; Mander, J.B.; Carr, A.J. Innovative Seismic Retrofitting Strategy of Added Stories Isolation System. Front. Struct. Civ. Eng. 2013, 7, 13–23. [Google Scholar] [CrossRef]
- Tamari, M.; Yoshihara, T.; Miyashita, M.; Ariyama, N.; Nonoyama, M. Structural Design and Performance Evaluation of A Mid-Story Seismic Isolated High-Rise Building. Int. J. High-Rise Build. 2017, 6, 227–235. [Google Scholar] [CrossRef]
- Nakamizo, D.; Koitabashi, Y. Structural Design of Mid-Story Isolated High-Rise Building-Roppongi Grand Tower. Int. J. High-Rise Build. 2018, 7, 233–242. [Google Scholar]
- Wang, S.J.; Chang, K.C.; Hwang, J.S.; Hsiao, J.Y.; Lee, B.H.; Hung, Y.C. Dynamic Behavior of A Building Structure Tested With Base and Mid-Story Isolation Systems. Eng. Struct. 2012, 42, 420–433. [Google Scholar] [CrossRef]
- Wang, S.J.; Chang, K.C.; Hwang, J.S.; Lee, B.H. Simplified Analysis of Mid-Story Seismically Isolated Buildings. Earthq. Eng. Struct. Dyn. 2011, 40, 119–133. [Google Scholar] [CrossRef]
- Wang, S.J.; Hwang, J.S.; Chang, K.C.; Lin, M.H.; Lee, B.H. Analytical and Experimental Studies on Midstory Isolated Buildings with Modal Coupling Effect. Earthq. Eng. Struct. Dyn. 2013, 42, 201–219. [Google Scholar] [CrossRef]
- Zhou, Q.; Singh, M.P.; Huang, X.Y. Model Reduction and Optimal Parameters of Mid-Story Isolation Systems. Eng. Struct. 2016, 124, 36–48. [Google Scholar] [CrossRef]
- Faiella, D.; Mele, E. Insights into Inter-Story Isolation Design Through the Analysis of Two Case Studies. Eng. Struct. 2020, 215, 110660. [Google Scholar] [CrossRef]
- Li, Z.H.; Huang, G.Q.; Chen, X.Z.; Zhou, X.H. Seismic Response and Parametric Analysis of Inter-Story Isolated Tall Buildings Based on Enhanced Simplified Dynamic Model. Int. J. Struct. Stab. Dyn. 2022, 22, 2240008. [Google Scholar] [CrossRef]
- Zhou, Y.; Chen, P.; Wang, C.Y.; Zhang, L.X.; Lu, L. Seismic Performance Evaluation of Tall, Multitower Reinforced Concrete Buildings with Large Bottom Podiums. Struct. Concr. 2018, 19, 1591–1607. [Google Scholar] [CrossRef]
- Zhou, Y.; Chen, P.; Zhang, L.X.; Wang, C.Y.; Lu, Z. Shaking Table Tests and Numerical Analysis of An Over-Track Multi-Tower Building. Struct. Infrastruct. Eng. 2019, 15, 230–243. [Google Scholar] [CrossRef]
- Xu, G.S.; Lin, Q.; Ding, Y. Shake Table Test of Existing Structure with External Structure Reinforced and Mid-story Isolation Rehabilitation. J. China Civ. Eng. 2014, 47, 19–25. [Google Scholar]
- Kohiyama, M.; Takano, K. Optimal Stiffness Distribution of Mid-Storey Isolated Buildings Considering Storey Drift and Floor Acceleration Response. In Proceedings of the 9th World Conference on Earthquake Resistant Engineering Structures, ERES 2013, A Coruña, Spain, 8–10 July 2013; pp. 191–202. [Google Scholar]
- Reggio, A.; Angelis, M.D. Optimal Energy-Based Seismic Design of Non-Conventional Tuned Mass Damper (TMD) Implemented Via Inter-Story Isolation. Earthq. Eng. Struct. Dyn. 2015, 44, 1623–1642. [Google Scholar] [CrossRef]
- Charmpis, D.C.; Phocas, M.C.; Komodromos, P. Optimized Retrofit of Multi-Storey Buildings Using Seismic Isolation at Various Elevations: Assessment for Several Earthquake Excitations. Bull. Earthq. Eng. 2015, 13, 2745–2768. [Google Scholar] [CrossRef]
- Skandalos, K.; Afshari, H.; Hare, W.; Tesfamariam, S. Multi-Objective Optimization of Inter-Story Isolated Buildings Using Metaheuristic and Derivative-Free Algorithms. Soil Dyn. Earthq. Eng. 2020, 132, 106058. [Google Scholar] [CrossRef]
- Chen, X.Z.; Kareem, A. Coupled Dynamic Analysis and Equivalent Static Wind Loads on Buildings with Three-Dimensional Modes. J. Struct. Eng. 2005, 131, 1071–1082. [Google Scholar] [CrossRef]
- Cui, W.; Caracoglia, L.; Zhao, L.; Ge, Y.J. Examination of Occurrence Probability of Vortex-Induced Vibration of Long-Span Bridge Decks by Fokker-Planck-Kolmogorov Equation. Struct. Saf. 2023, 105, 102369. [Google Scholar] [CrossRef]
- Cui, W.; Zhao, L.; Ge, Y.J. Wind-Induced Buffeting Vibration of Long-Span Bridge Considering Geometric and Aerodynamic Nonlinearity Based on Reduced-Order Modeling. J. Struct. Eng. 2023, 149, 04023160. [Google Scholar] [CrossRef]
- Siringoringo, D.M.; Fujino, Y. Wind-Induced Responses and Dynamics Characteristics of An Asymmetrical Base-Isolated Building Observed During Typhoons. J. Wind Eng. Ind. Aerodyn. 2017, 167, 183–197. [Google Scholar] [CrossRef]
- Feng, C.D.; Chen, X.Z. Estimation of Inelastic Crosswind Response of Base-Isolated Tall Buildings: Performance of Statistical Linearization Approaches. J. Struct. Eng. 2019, 145, 04019161. [Google Scholar] [CrossRef]
- Feng, C.D.; Chen, X.Z. Evaluation and Characterization of Probabilistic Alongwind and Crosswind Responses of Base-Isolated Tall Buildings. J. Eng. Mech. 2019, 145, 04019097. [Google Scholar] [CrossRef]
- Li, Z.H.; Huang, G.Q.; Chen, X.Z.; Zhou, Y.; Yang, Q.S. Wind-Resistant Design and Equivalent Static Wind Load of Base-Isolated Tall Building: A Case Study. Eng. Struct. 2020, 212, 110533. [Google Scholar] [CrossRef]
- Li, Z.H.; Chen, X.Z.; Huang, G.Q.; Kareem, A.; Zhou, X.H. Alongwind and Crosswind Response of Friction-Pendulum Base-Isolated High-Rise Buildings. Eng. Struct. 2023, 293, 116564. [Google Scholar] [CrossRef]
- Li, Z.H.; Chen, X.Z.; Huang, G.Q.; Yang, Q.S.; Zhou, X.H.; Pang, H.W. Coupled Dynamic Analysis of Tall Buildings Isolated with Friction Pendulum Bearings Under Three-Dimensional Wind Loads. J. Wind Eng. Ind. Aerodyn. 2023, 234, 105332. [Google Scholar] [CrossRef]
- Constantinou, M.C.; Papageorgiou, A.S. Stochastic Response of Practical Sliding Isolation Systems. Probabilistic Eng. Mech. 1990, 5, 27–34. [Google Scholar] [CrossRef]
- Liu, Y.H.; Wu, J.B.; Donà, M. Effectiveness of Fluid-Viscous Dampers for Improved Seismic Performance of Inter-Storey Isolated Buildings. Eng. Struct. 2018, 169, 276–292. [Google Scholar] [CrossRef]
- Ryan, K.L.; Polanco, J. Problems with Rayleigh Damping in Base-Isolated Buildings. J. Struct. Eng. 2008, 134, 1780–1784. [Google Scholar] [CrossRef]
- Architectural Institute of Japan (AIJ). AIJ Recommendations for Load on Buildings; AIJ: Tokyo, Japan, 2015. [Google Scholar]
- Shinozuka, M.; Deodatis, G. Simulation of Stochastic Processes by Spectral Representation. Appl. Mech. Rev. 1991, 44, 191–204. [Google Scholar] [CrossRef]
- Jiang, Y.; Zhao, N.; Peng, L.L.; Xin, J.Z.; Liu, S.Y. Fast Simulation of Fully Non-Stationary Wind Fields Using A New Matrix Factorization Assisted Interpolation Method. Mech. Syst. Signal Process. 2022, 172, 108973. [Google Scholar] [CrossRef]
- Wang, H.F.; Wu, T. Knowledge-Enhanced Deep Learning for Wind-Induced Nonlinear Structural Dynamic Analysis. J. Struct. Eng. 2020, 146, 04020235. [Google Scholar] [CrossRef]
- Baber, T.T.; Wen, Y.K. Random Vibration of Hysteretic, Degrading Systems. J. Eng. Mech. Div. 1981, 107, 1069–1087. [Google Scholar] [CrossRef]
- JGJ 3-2010; Technical Specification for Concrete Structures of Tall Buildings. China Architecture & Building Press: Beijing, China, 2010.


| Isolation Location M | 0 | 5 | 10 | 15 | 20 | 25 | 30 | 35 | 40 | 45 | |
|---|---|---|---|---|---|---|---|---|---|---|---|
| Non-sliding | -- | 2 | 3 | 4 | 4 | 6 | 6 | 6 | 8 | 8 | |
| 3 | 4 | 4 | 4 | 4 | 2 | 3 | 3 | 2 | 1 | ||
| Sliding | -- | 1 | 2 | 3 | 4 | 4 | 4 | 4 | 6 | 6 | |
| 4 | 4 | 4 | 4 | 3 | 3 | 3 | 3 | 2 | 1 | ||
| LrUs | r = max (, ) | 0 | 2 | 3 | 4 | 4 | 6 | 6 | 6 | 8 | 8 |
| s = max (, ) | 4 | 4 | 4 | 4 | 4 | 3 | 3 | 3 | 2 | 1 | |
| Isolation Location M | 0 | 5 | 10 | 15 | 20 | 25 | 30 | 35 | 40 | 45 | |
|---|---|---|---|---|---|---|---|---|---|---|---|
| Non-sliding | -- | 2 | 3 | 4 | 4 | 5 | 5 | 6 | 6 | 6 | |
| 3 | 4 | 4 | 4 | 3 | 3 | 2 | 1 | 1 | 1 | ||
| Sliding | rp | -- | 2 | 3 | 3 | 4 | 4 | 5 | 5 | 5 | 6 |
| 4 | 4 | 4 | 3 | 3 | 3 | 2 | 1 | 1 | 1 | ||
| LrUs | r = max (, ) | 0 | 2 | 3 | 4 | 4 | 5 | 5 | 6 | 6 | 6 |
| s = max (, ) | 4 | 4 | 4 | 4 | 3 | 3 | 2 | 1 | 1 | 1 | |
| M | 0 | 5 | 10 | 15 | 20 | 25 | 30 | 35 | 40 | 45 | |
|---|---|---|---|---|---|---|---|---|---|---|---|
| Du top (10−2 m) | LrUs | 14.63 | 13.01 | 11.58 | 10.19 | 8.95 | 7.68 | 6.32 | 4.90 | 3.55 | 2.08 |
| L1U1 | 14.84 | 13.16 | 11.48 | 10.04 | 8.72 | 7.40 | 6.08 | 4.77 | 3.45 | 2.04 | |
| Di (10−2 m) | LrUs | 1.55 | 1.73 | 1.93 | 2.13 | 2.38 | 2.67 | 3.04 | 3.49 | 4.16 | 5.41 |
| L1U1 | 1.53 | 1.67 | 1.80 | 1.94 | 2.11 | 2.35 | 2.68 | 3.13 | 3.82 | 5.21 | |
| Dl top (10−2 m) | LrUs | -- | 1.51 | 3.07 | 4.54 | 6.18 | 7.76 | 9.34 | 11.08 | 13.24 | 16.66 |
| L1U1 | -- | 1.35 | 2.53 | 3.71 | 4.92 | 6.14 | 7.47 | 9.07 | 11.19 | 14.63 | |
| Au top (m·s−2) | LrUs | 0.23 | 0.23 | 0.24 | 0.24 | 0.25 | 0.26 | 0.26 | 0.26 | 0.29 | 0.33 |
| L1U1 | 0.19 | 0.19 | 0.19 | 0.20 | 0.20 | 0.21 | 0.22 | 0.22 | 0.25 | 0.29 | |
| Al top (m·s−2) | LrUs | -- | 0.07 | 0.08 | 0.09 | 0.11 | 0.12 | 0.13 | 0.14 | 0.17 | 0.22 |
| L1U1 | -- | 0.06 | 0.06 | 0.09 | 0.10 | 0.10 | 0.11 | 0.12 | 0.14 | 0.19 | |
| Vu base (106 N) | LrUs | 7.84 | 7.47 | 7.10 | 6.59 | 6.13 | 5.43 | 4.71 | 3.90 | 2.94 | 1.75 |
| L1U1 | 7.79 | 6.71 | 6.03 | 5.42 | 4.83 | 4.22 | 3.56 | 2.88 | 2.17 | 1.39 | |
| Vl base (106 N) | LrUs | -- | 6.94 | 7.37 | 7.30 | 8.08 | 8.05 | 7.78 | 7.88 | 8.18 | 9.09 |
| L1U1 | -- | 9.48 | 9.27 | 9.12 | 8.98 | 8.81 | 8.70 | 8.71 | 8.92 | 9.56 | |
| M | 0 | 5 | 10 | 15 | 20 | 25 | 30 | 35 | 40 | 45 | |
|---|---|---|---|---|---|---|---|---|---|---|---|
| Du top (10−2 m) | LrUs | 14.63 | 12.16 | 10.94 | 9.74 | 8.48 | 6.76 | 4.68 | 2.72 | 1.18 | 0.33 |
| L1U1 | 14.84 | 12.20 | 10.29 | 8.56 | 6.80 | 5.08 | 3.50 | 2.12 | 1.02 | 0.28 | |
| Di (10−2 m) | LrUs | 1.55 | 1.78 | 2.36 | 3.11 | 4.11 | 5.06 | 5.90 | 6.22 | 6.27 | 7.01 |
| L1U1 | 1.53 | 1.68 | 1.99 | 2.35 | 2.75 | 3.20 | 3.70 | 4.32 | 5.15 | 6.25 | |
| Dl top (10−2 m) | LrUs | -- | 2.12 | 6.03 | 11.25 | 17.73 | 23.99 | 28.16 | 29.44 | 27.68 | 25.76 |
| L1U1 | -- | 1.78 | 4.19 | 6.79 | 9.42 | 11.97 | 14.33 | 16.34 | 17.96 | 19.26 | |
| Au top (m·s−2) | LrUs | 0.23 | 0.23 | 0.25 | 0.27 | 0.30 | 0.33 | 0.35 | 0.35 | 0.34 | 0.37 |
| L1U1 | 0.19 | 0.18 | 0.19 | 0.20 | 0.21 | 0.22 | 0.23 | 0.25 | 0.27 | 0.30 | |
| Al top (m·s−2) | LrUs | -- | 0.10 | 0.12 | 0.15 | 0.19 | 0.23 | 0.26 | 0.28 | 0.28 | 0.31 |
| L1U1 | -- | 0.07 | 0.08 | 0.11 | 0.13 | 0.14 | 0.16 | 0.18 | 0.20 | 0.23 | |
| Vu base (106 N) | LrUs | 7.84 | 7.59 | 8.09 | 8.56 | 8.94 | 8.77 | 7.69 | 5.93 | 3.88 | 1.94 |
| L1U1 | 7.79 | 6.72 | 6.40 | 6.10 | 5.68 | 5.12 | 4.45 | 3.66 | 2.73 | 1.62 | |
| Vl base (106 N) | LrUs | -- | 6.95 | 9.75 | 9.29 | 10.96 | 11.59 | 12.31 | 11.04 | 10.23 | 9.76 |
| L1U1 | -- | 10.39 | 11.18 | 11.71 | 12.00 | 12.08 | 11.97 | 11.65 | 11.16 | 10.61 | |
Disclaimer/Publisher’s Note: The statements, opinions and data contained in all publications are solely those of the individual author(s) and contributor(s) and not of MDPI and/or the editor(s). MDPI and/or the editor(s) disclaim responsibility for any injury to people or property resulting from any ideas, methods, instructions or products referred to in the content. |
© 2024 by the authors. Licensee MDPI, Basel, Switzerland. This article is an open access article distributed under the terms and conditions of the Creative Commons Attribution (CC BY) license (https://creativecommons.org/licenses/by/4.0/).
Share and Cite
Li, Z.; Xu, Z.; Huang, G.; Liu, Z. Wind-Induced Dynamic Response of Inter-Story Isolated Tall Buildings with Friction Pendulum Bearing Based on an Enhanced Simplified Model. Buildings 2024, 14, 1568. https://doi.org/10.3390/buildings14061568
Li Z, Xu Z, Huang G, Liu Z. Wind-Induced Dynamic Response of Inter-Story Isolated Tall Buildings with Friction Pendulum Bearing Based on an Enhanced Simplified Model. Buildings. 2024; 14(6):1568. https://doi.org/10.3390/buildings14061568
Chicago/Turabian StyleLi, Zhihao, Zhiran Xu, Guoqing Huang, and Zhanfang Liu. 2024. "Wind-Induced Dynamic Response of Inter-Story Isolated Tall Buildings with Friction Pendulum Bearing Based on an Enhanced Simplified Model" Buildings 14, no. 6: 1568. https://doi.org/10.3390/buildings14061568
APA StyleLi, Z., Xu, Z., Huang, G., & Liu, Z. (2024). Wind-Induced Dynamic Response of Inter-Story Isolated Tall Buildings with Friction Pendulum Bearing Based on an Enhanced Simplified Model. Buildings, 14(6), 1568. https://doi.org/10.3390/buildings14061568