

A Method for Measuring the Visual Coherence of Buildings in Residential Historic Areas: A Case Study of the Xiaoxihu Historic Area in Nanjing, China


Abstract
:1. Introduction
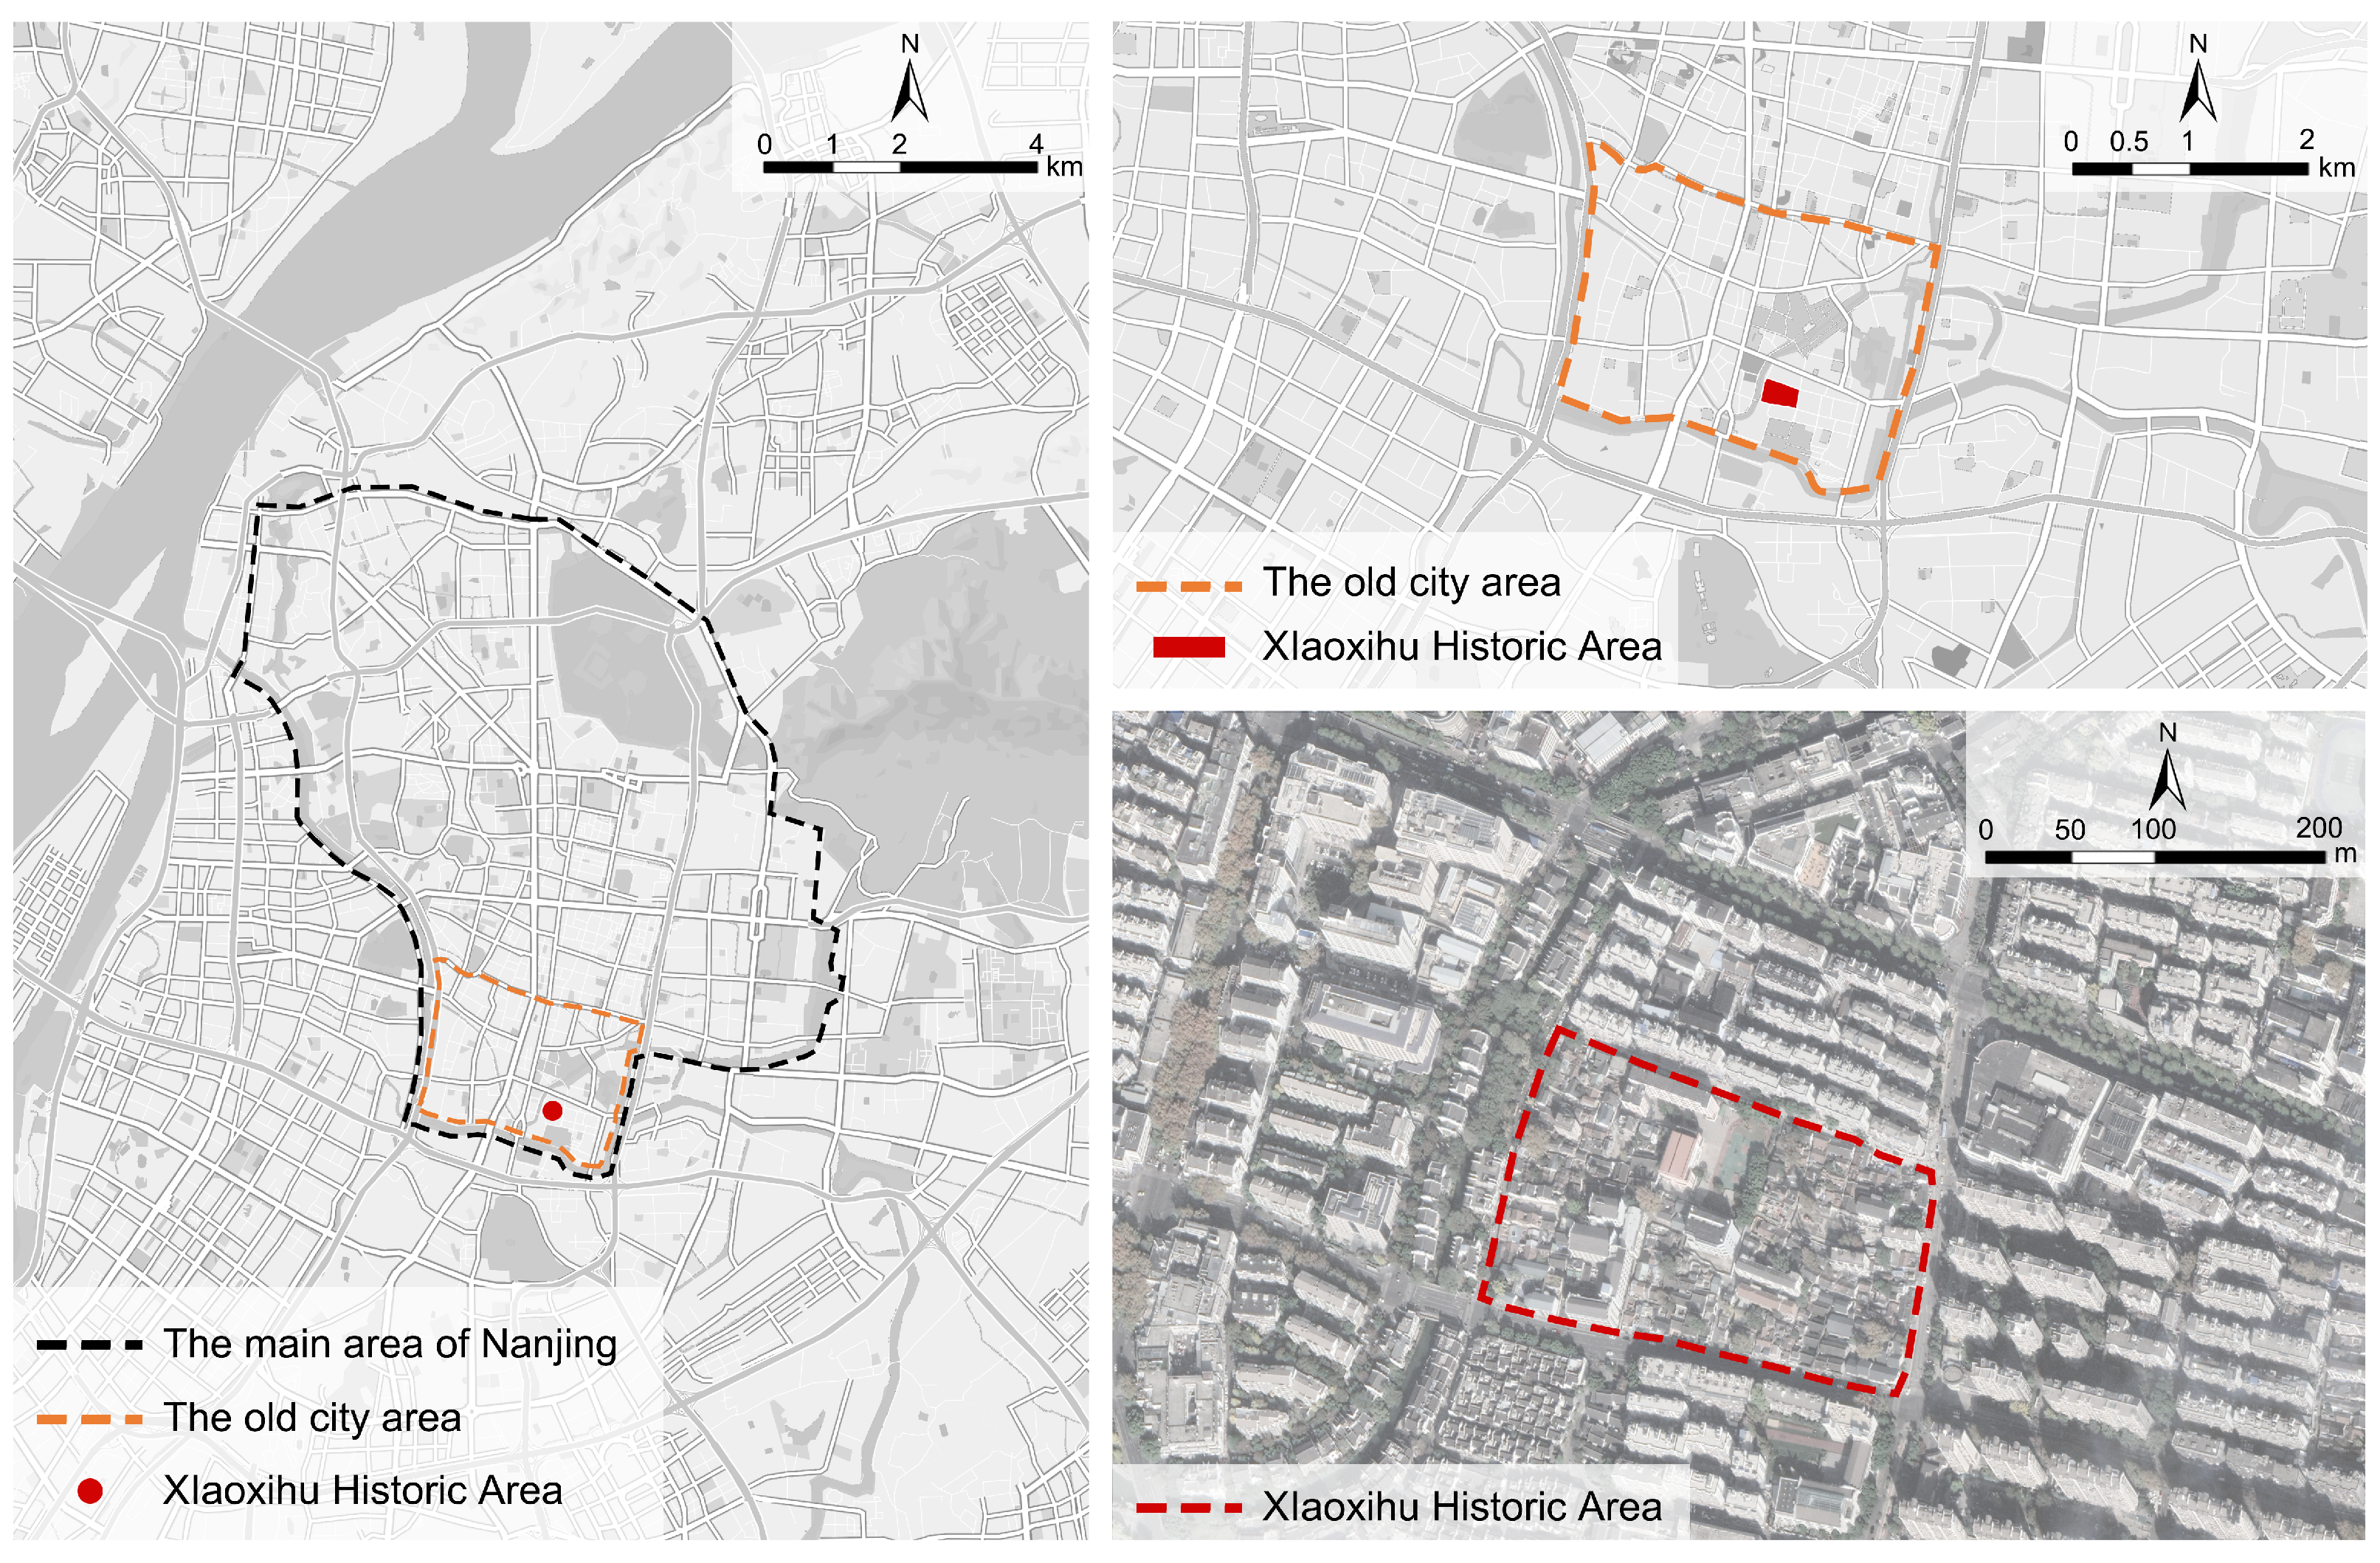
2. Study Area
3. Materials and Methods
3.1. The Perspective and Visual Elements of Measurement
3.2. Material Collection and Processing
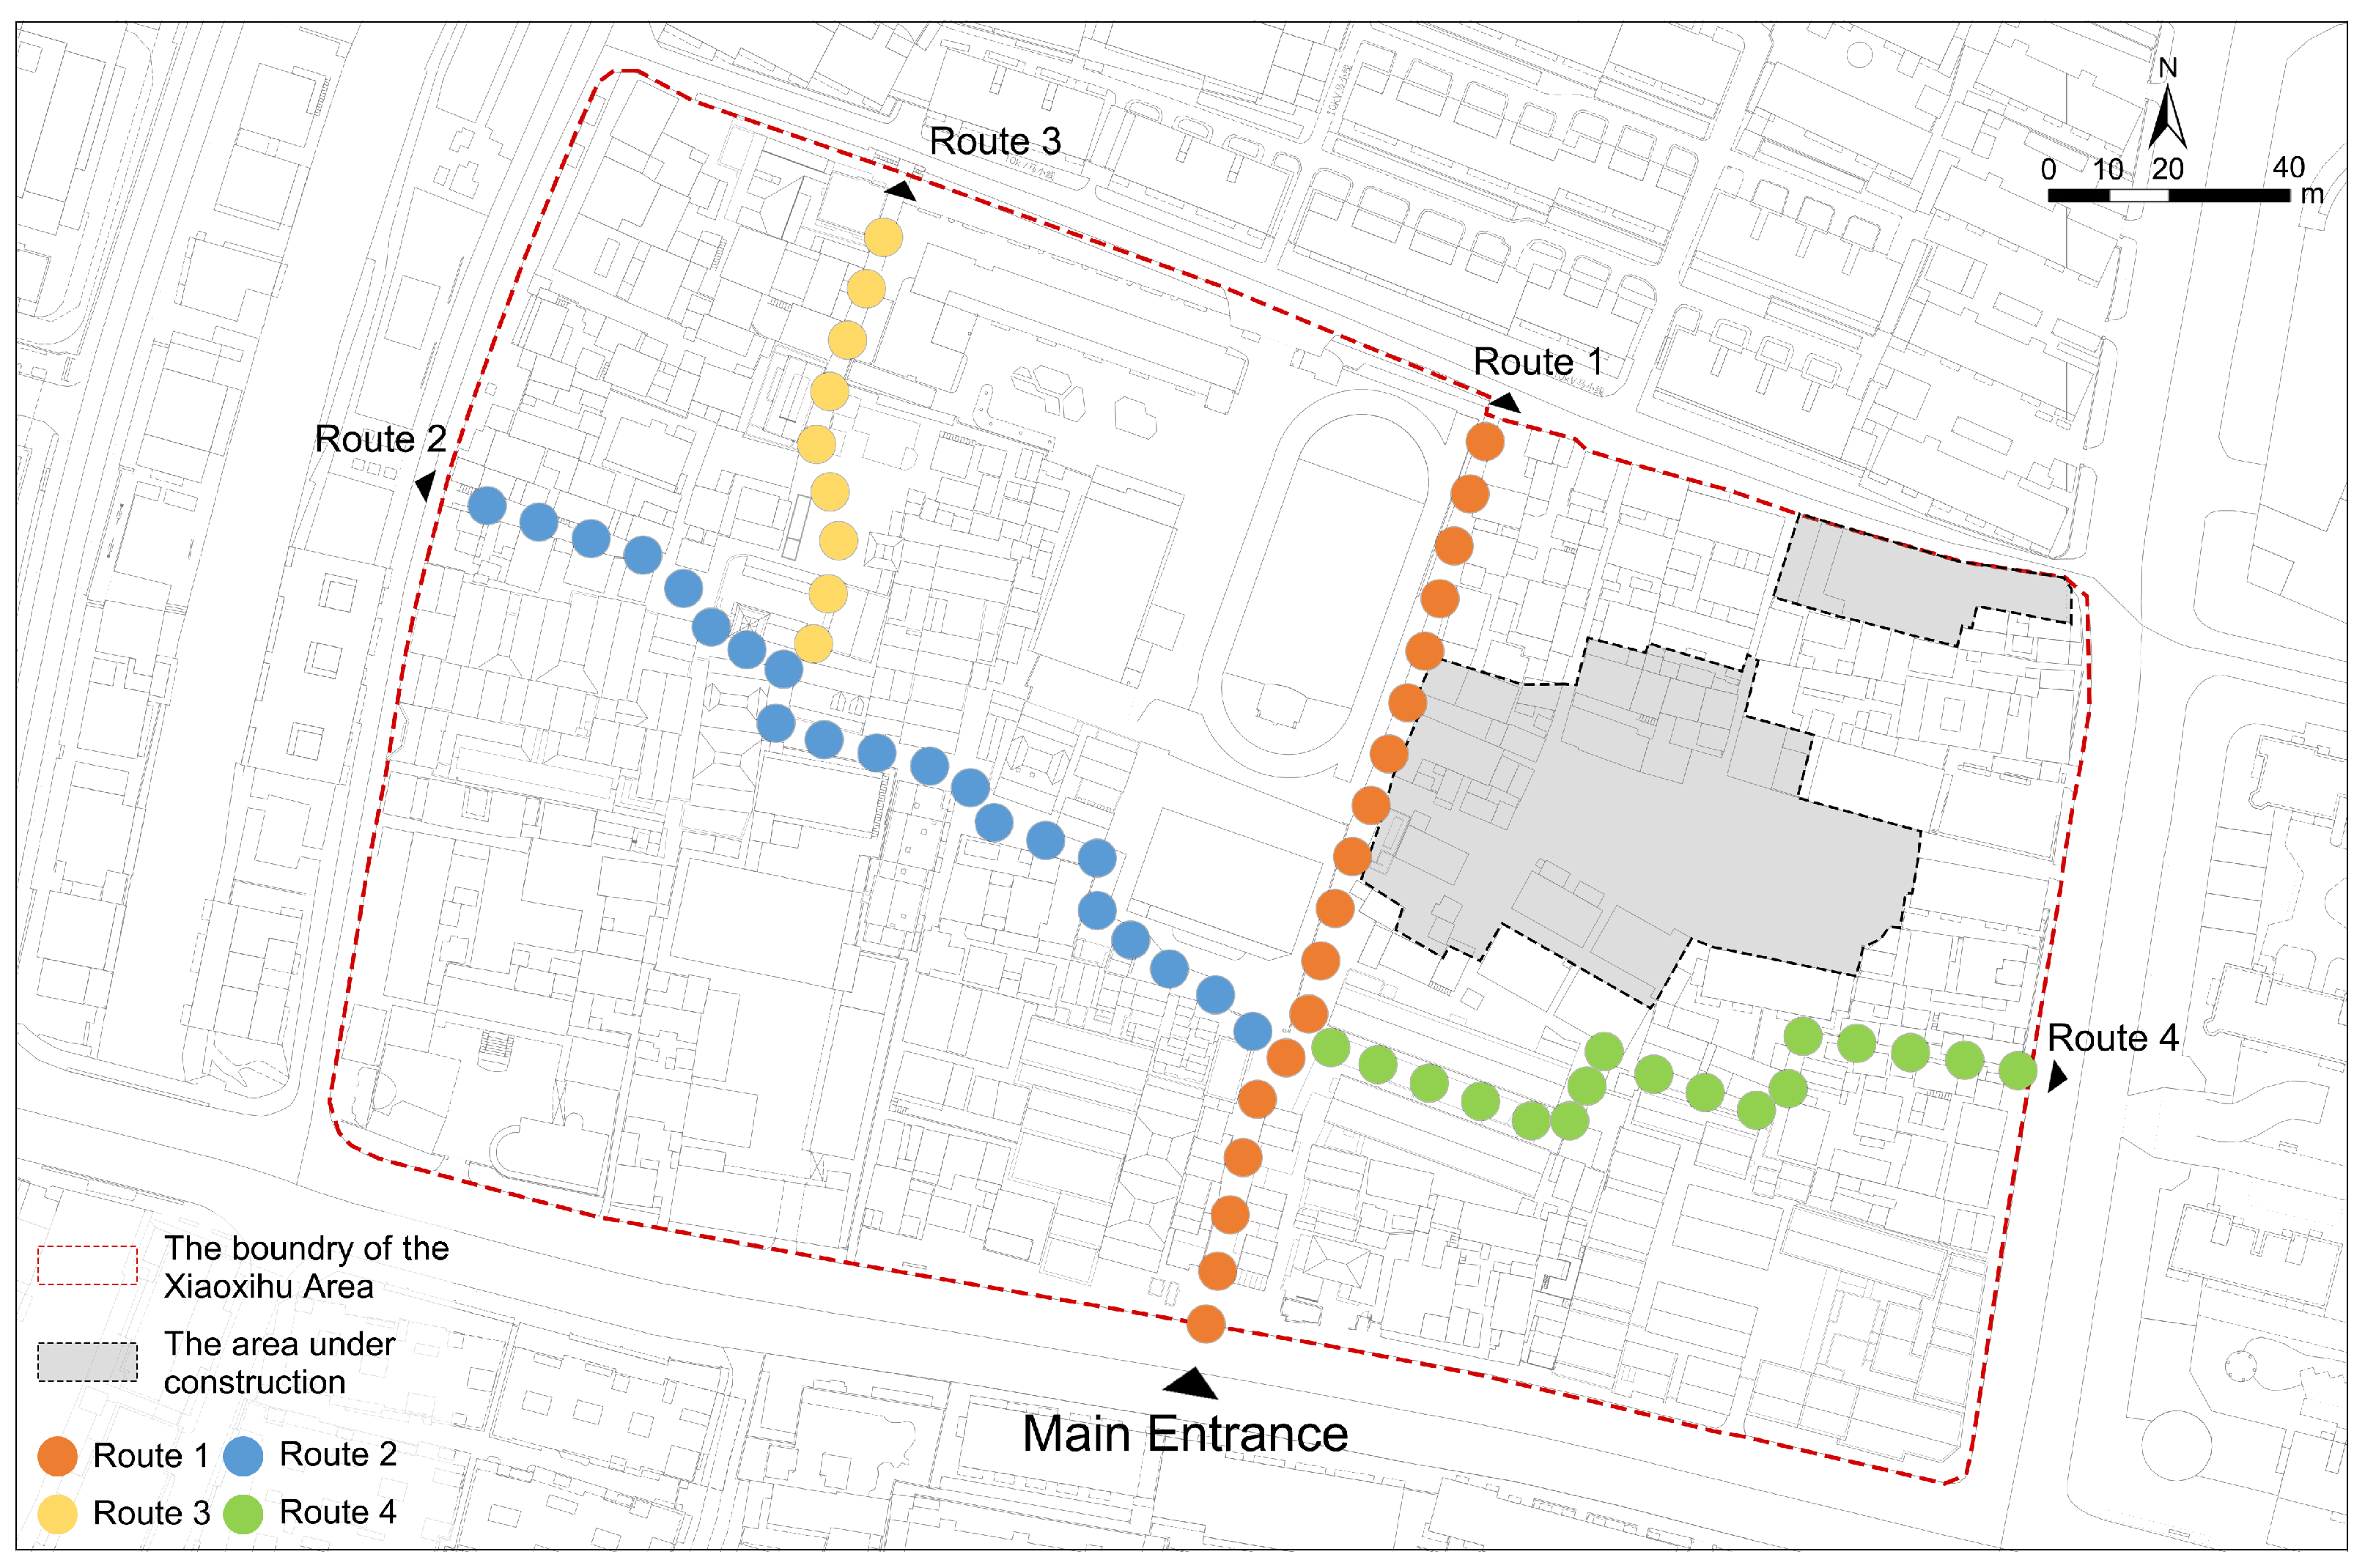
3.2.1. Photography
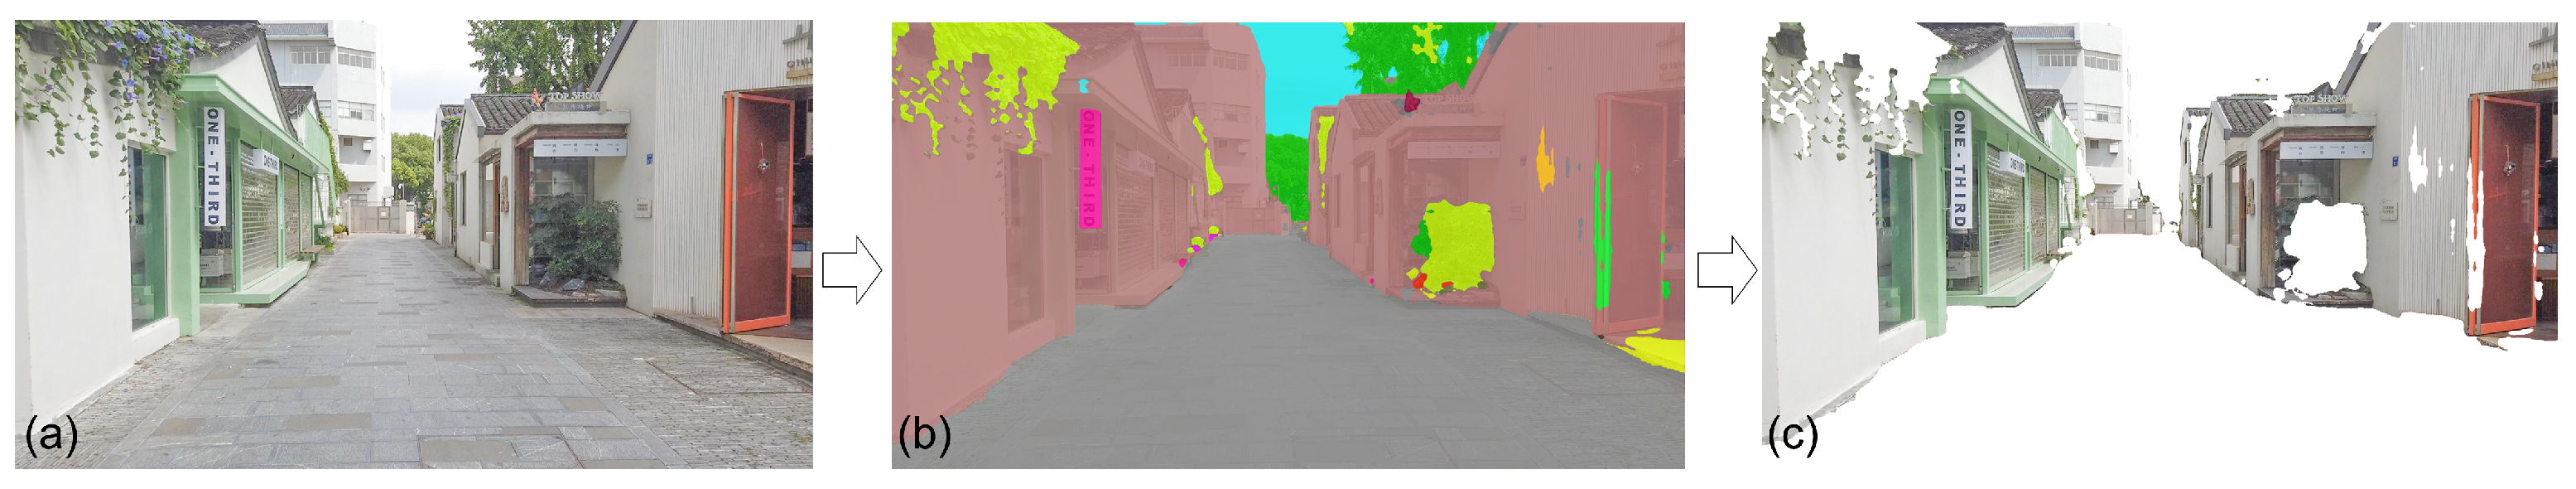
3.2.2. Image Processing
3.3. Measuring the VCoB
3.3.1. Color
3.3.2. Height
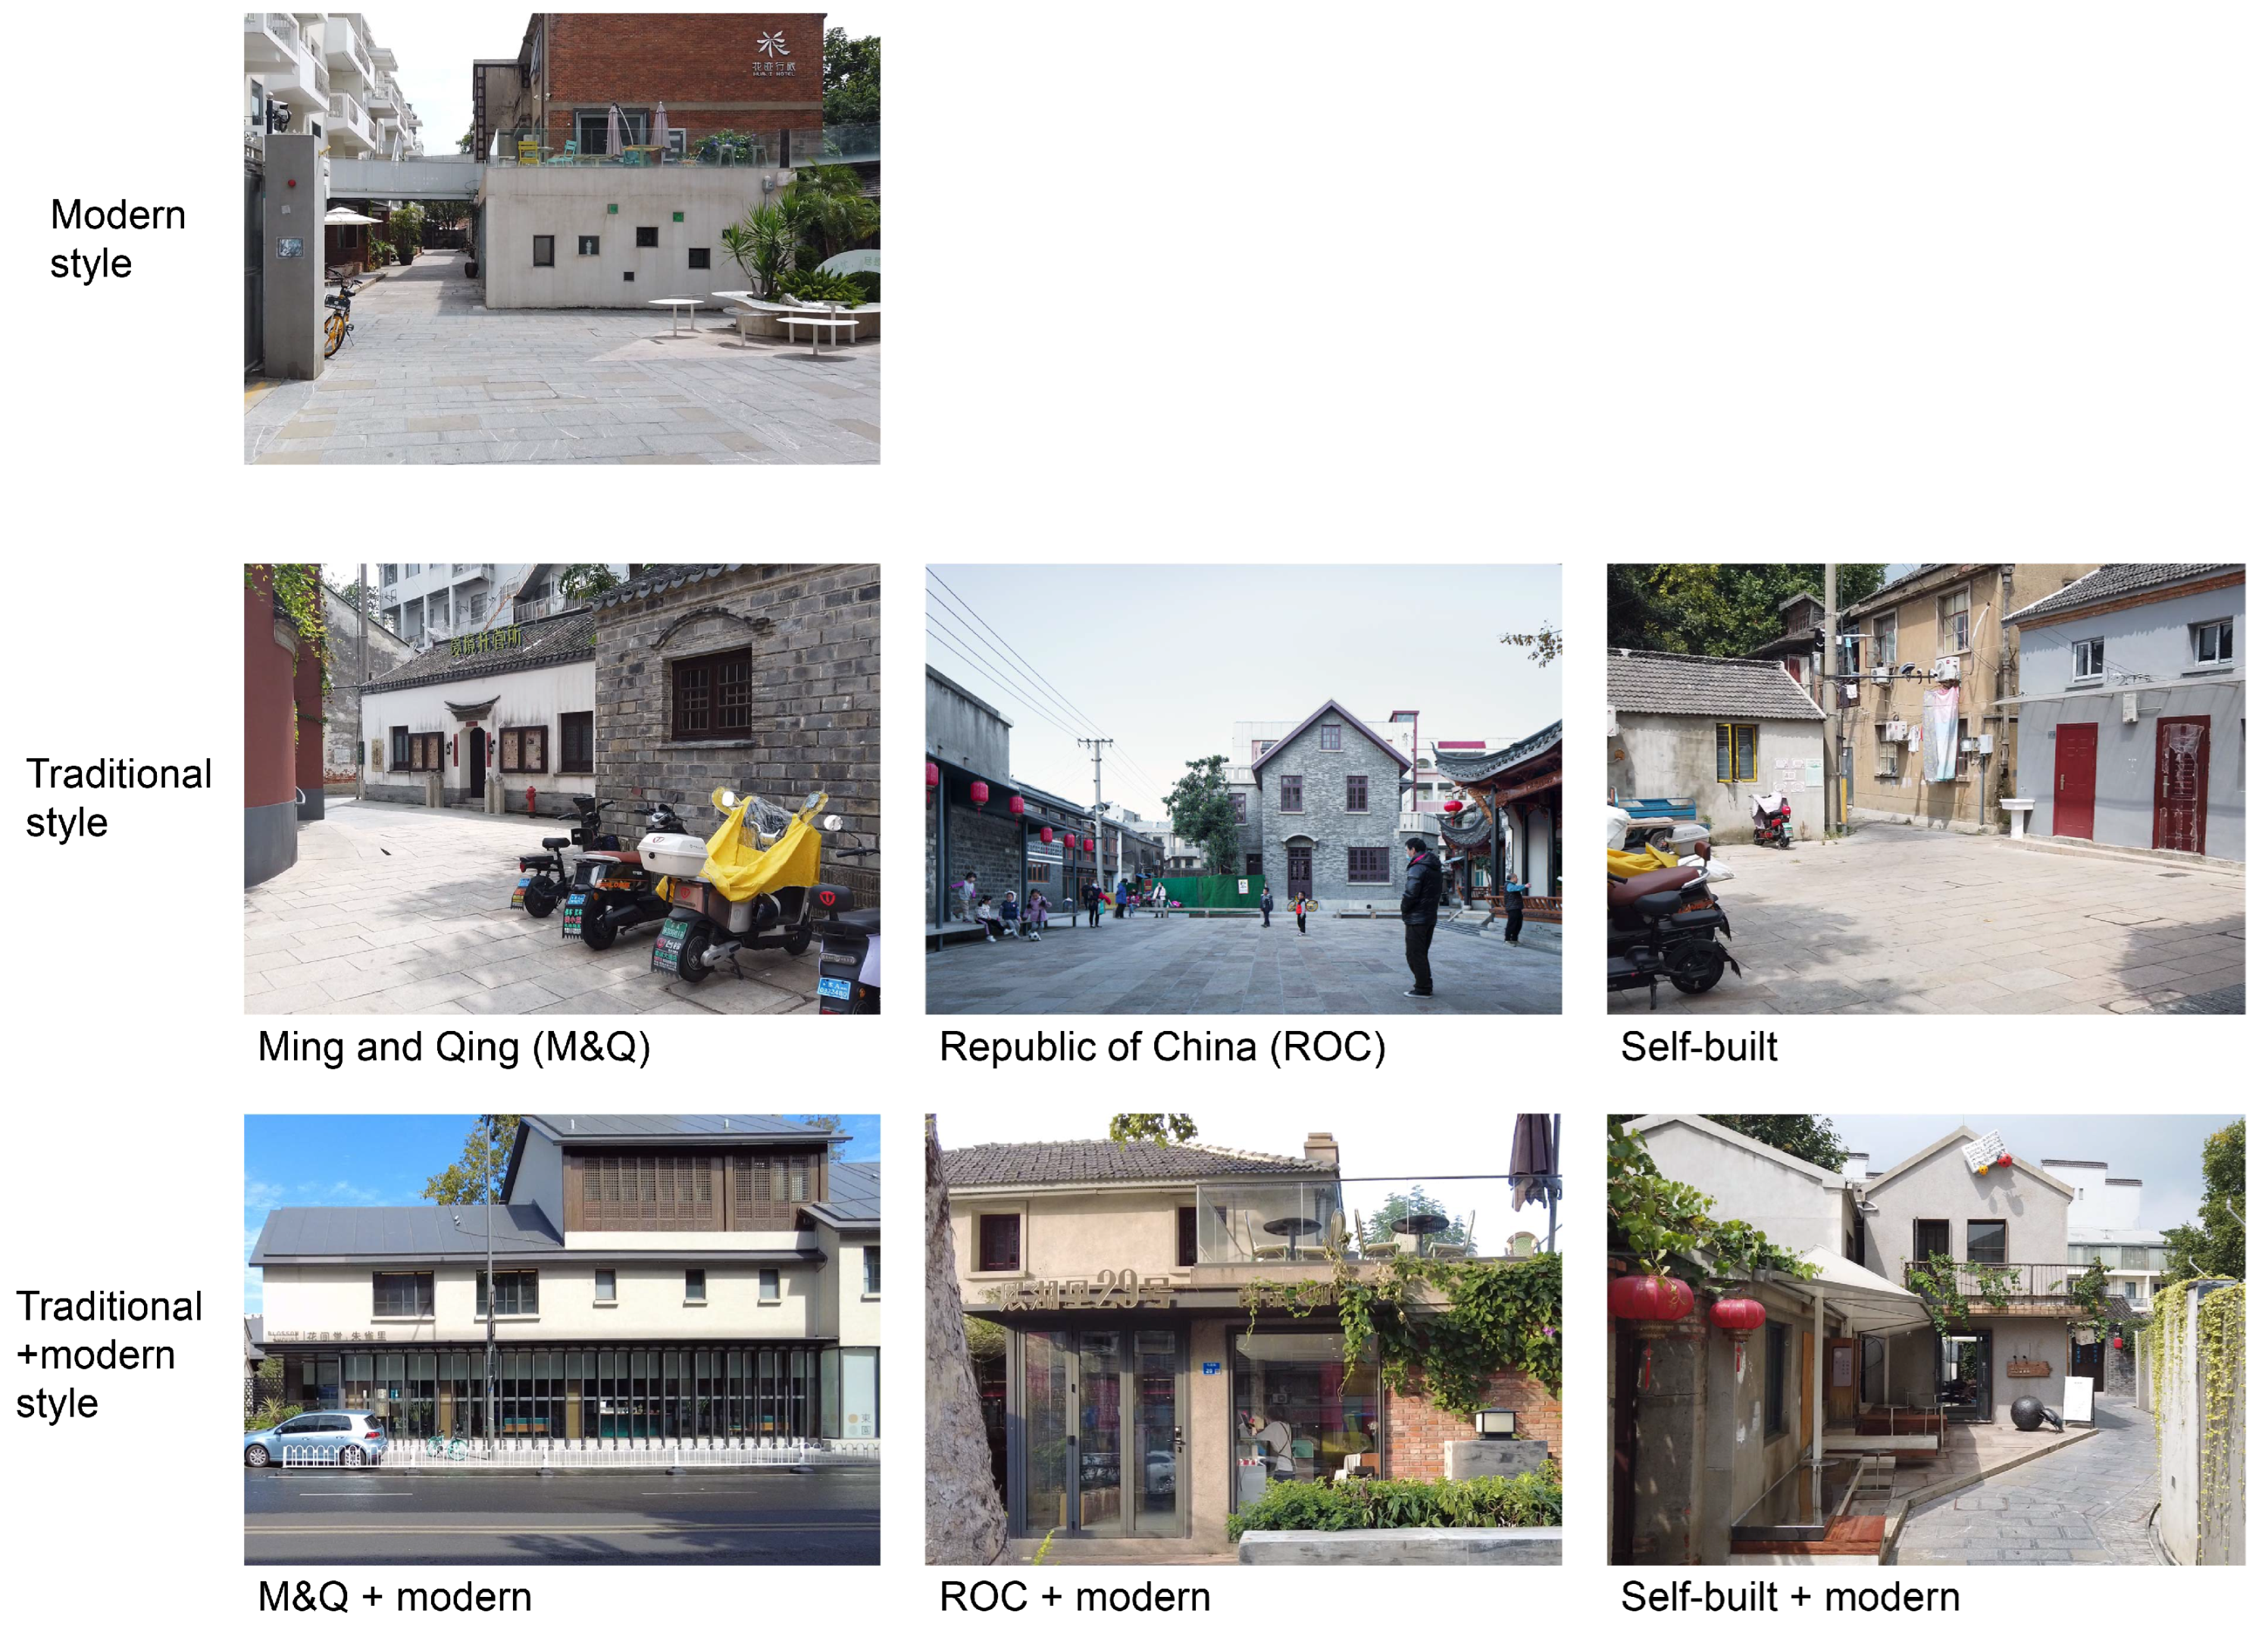
3.3.3. Style
- (1)
- Modern style. Characterized by construction under the modern system, these buildings typically feature simple exteriors without historic symbolic decorations.
- (2)
- Traditional style. This category encompasses buildings constructed with historic features according to traditional construction systems. It is subdivided into the following:
- Ming and Qing (M&Q) style. This primarily refers to the building style that formed during the Ming and Qing dynasties (from the mid-14th century to the early 20th century). In the Xiaoxihu Area, buildings of this style represent significant historic heritage, necessitating restoration or reconstruction to their original historic condition. Their characteristics include dark grey brick walls (partially with white mortar finishes) and dark grey tiled sloping roofs.
- Republic of China (ROC) style. This style developed from the 1910s to the 1940s as a result of the integration of Chinese and Western construction techniques at that time. Buildings of this style are also important historic resources, primarily featuring dark grey bricks and tiles;
- Self-built style. This style was developed by the residents of Xiaoxihu between the 1950s and 1970s. Local residents evolved the style based on traditional M&Q construction techniques, building with more affordable materials (such as red bricks and tiles) and simple decorations.
- (3)
- Modern combined with traditional style. In the process of renewing the Xiaoxihu Area, the renovation of traditional-style buildings that are not classified as significant historic heritage often incorporates modern technology and introduces new design languages, to satisfy contemporary usage needs and aesthetic preferences. Meanwhile, some modern buildings constructed after the 1970s incorporated traditional symbols during their renewal, to harmonize them with the area’s predominant M&Q style. This resulted in a blend of modern and traditional styles: M&Q + modern, ROC + modern, and self-built + modern. Buildings of the ROC + modern style, although they exist in Xiaoxihu, are not visible on the main routes identified in this study.
4. Results
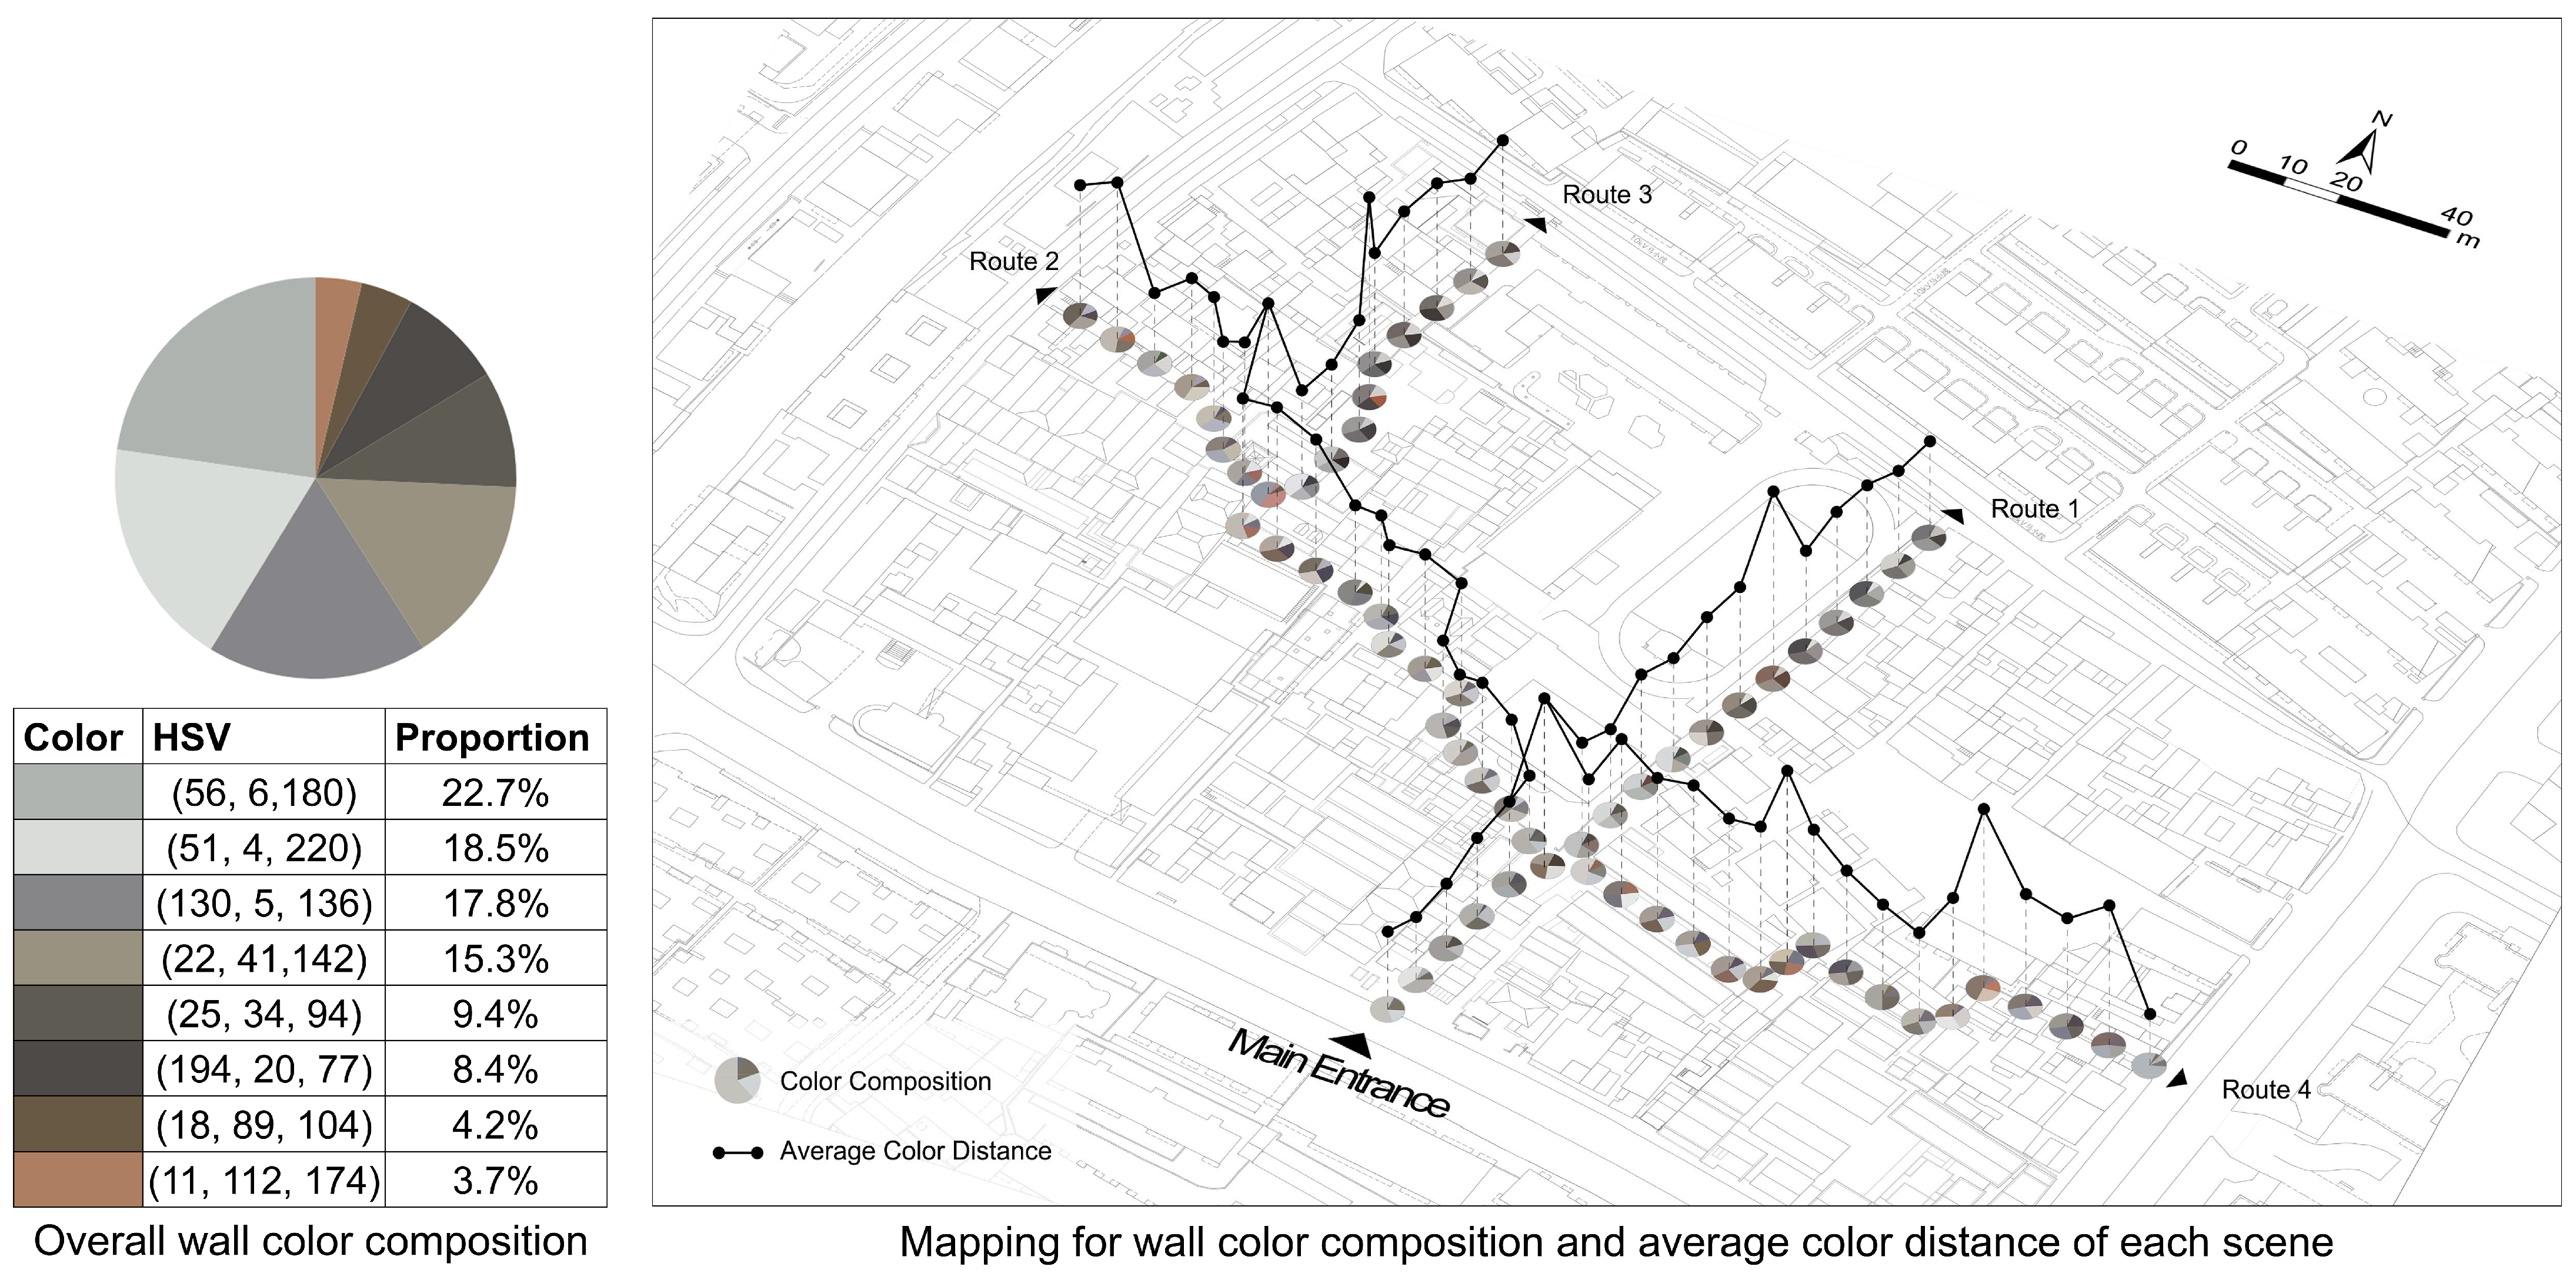
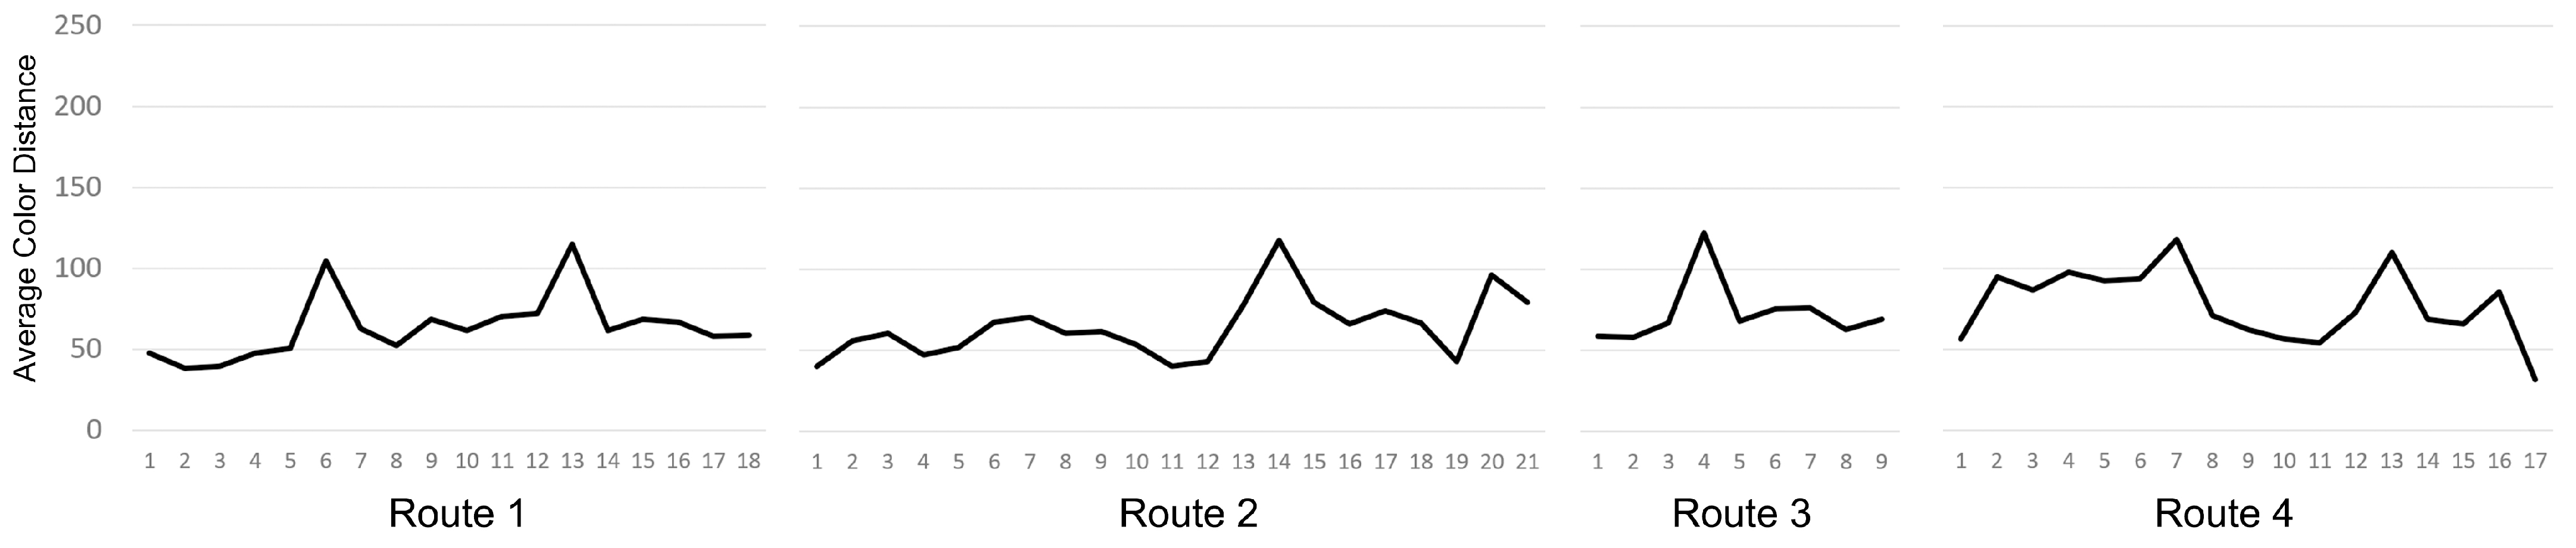
4.1. Color
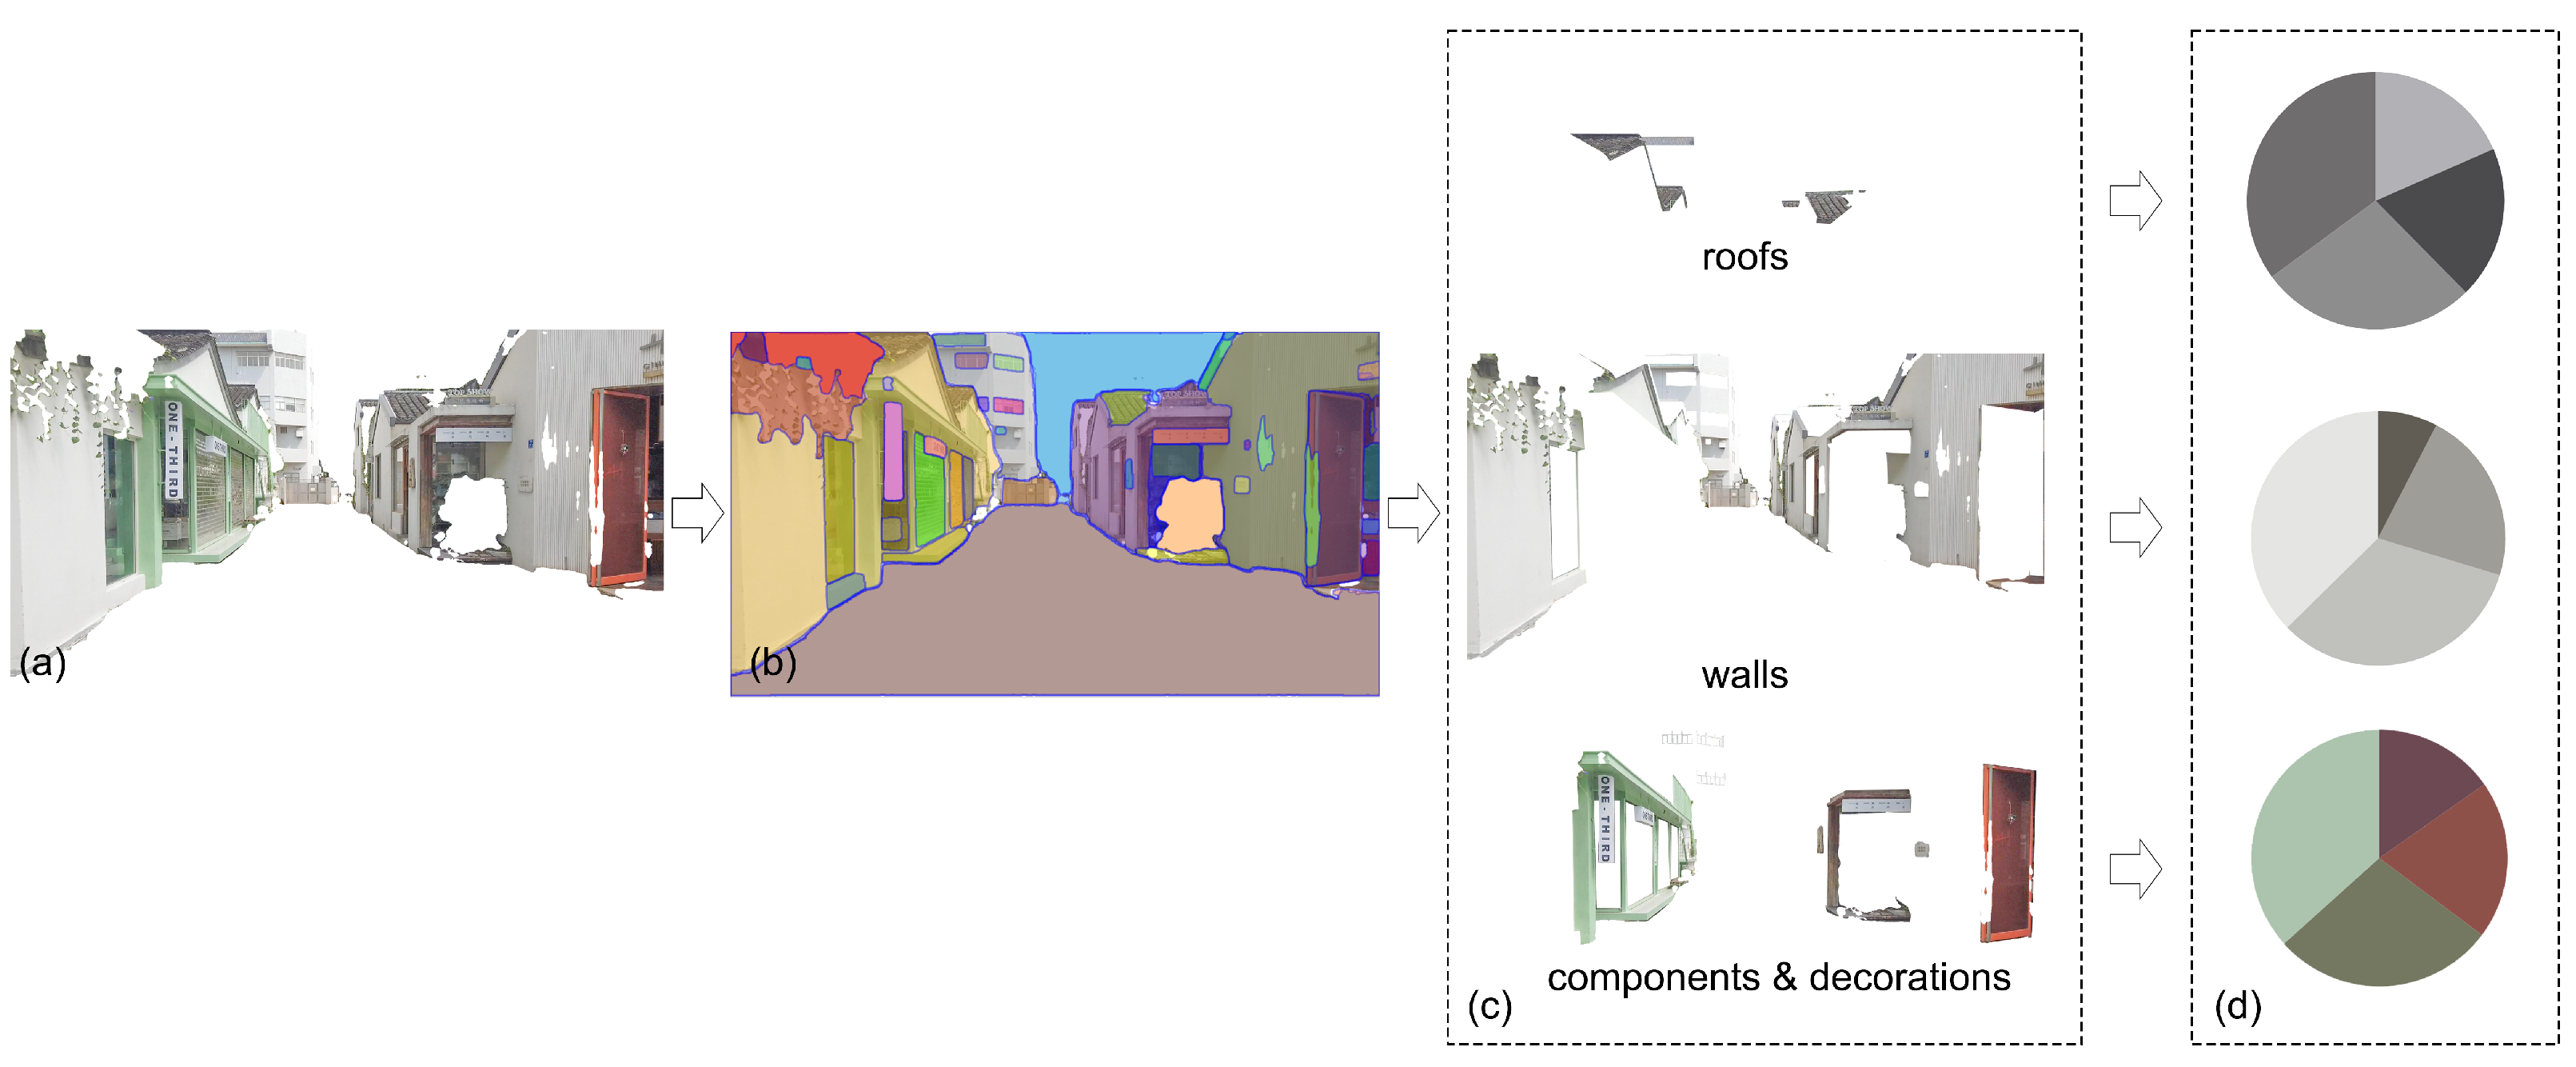
- (1)
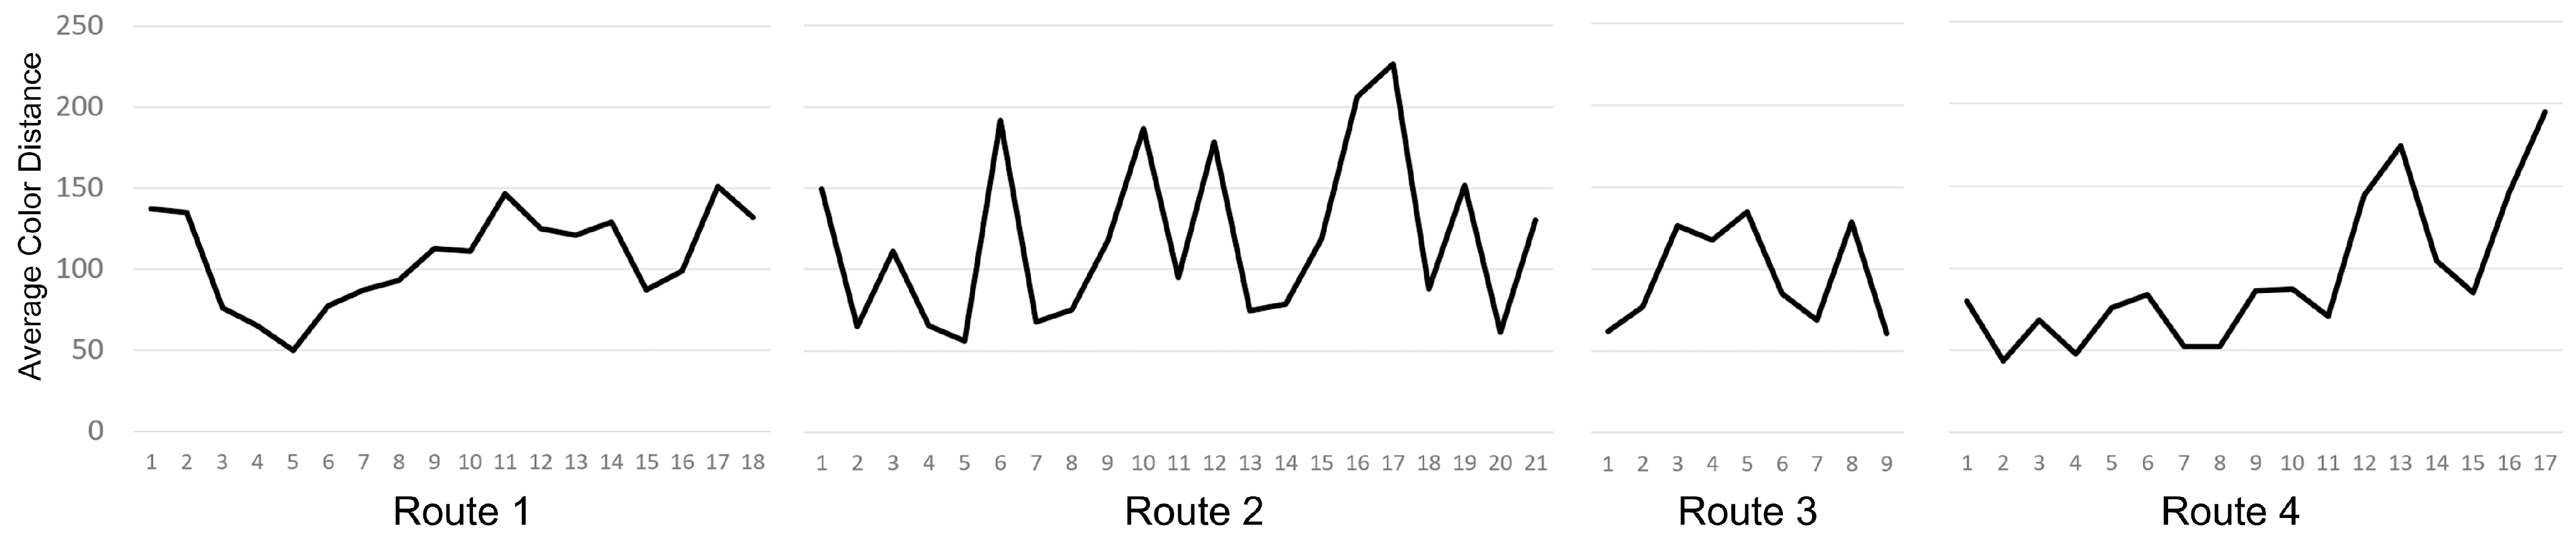
- Wall. As shown in Figure 9 and Figure 10, gray occupies a major proportion of the wall colors throughout the Xiaoxihu Area. This primarily arises from the use of gray bricks and plaster finishes, which are common in local traditional residences. In order to harmonize with these, newly constructed buildings also predominantly employ materials of similar colors. The warm gray originates from the mortar finishes of self-built style houses. Red, on the other hand, appears in a limited number of buildings with exposed red brick walls; moreover, at the intersection of Routes 2 and 3, there stands a temple with red painting. Scenes that mix temples or red-brick buildings with other gray-walled structures tended to have a exceeding 100, presenting lower color coherence (Figure 11).
- (2)
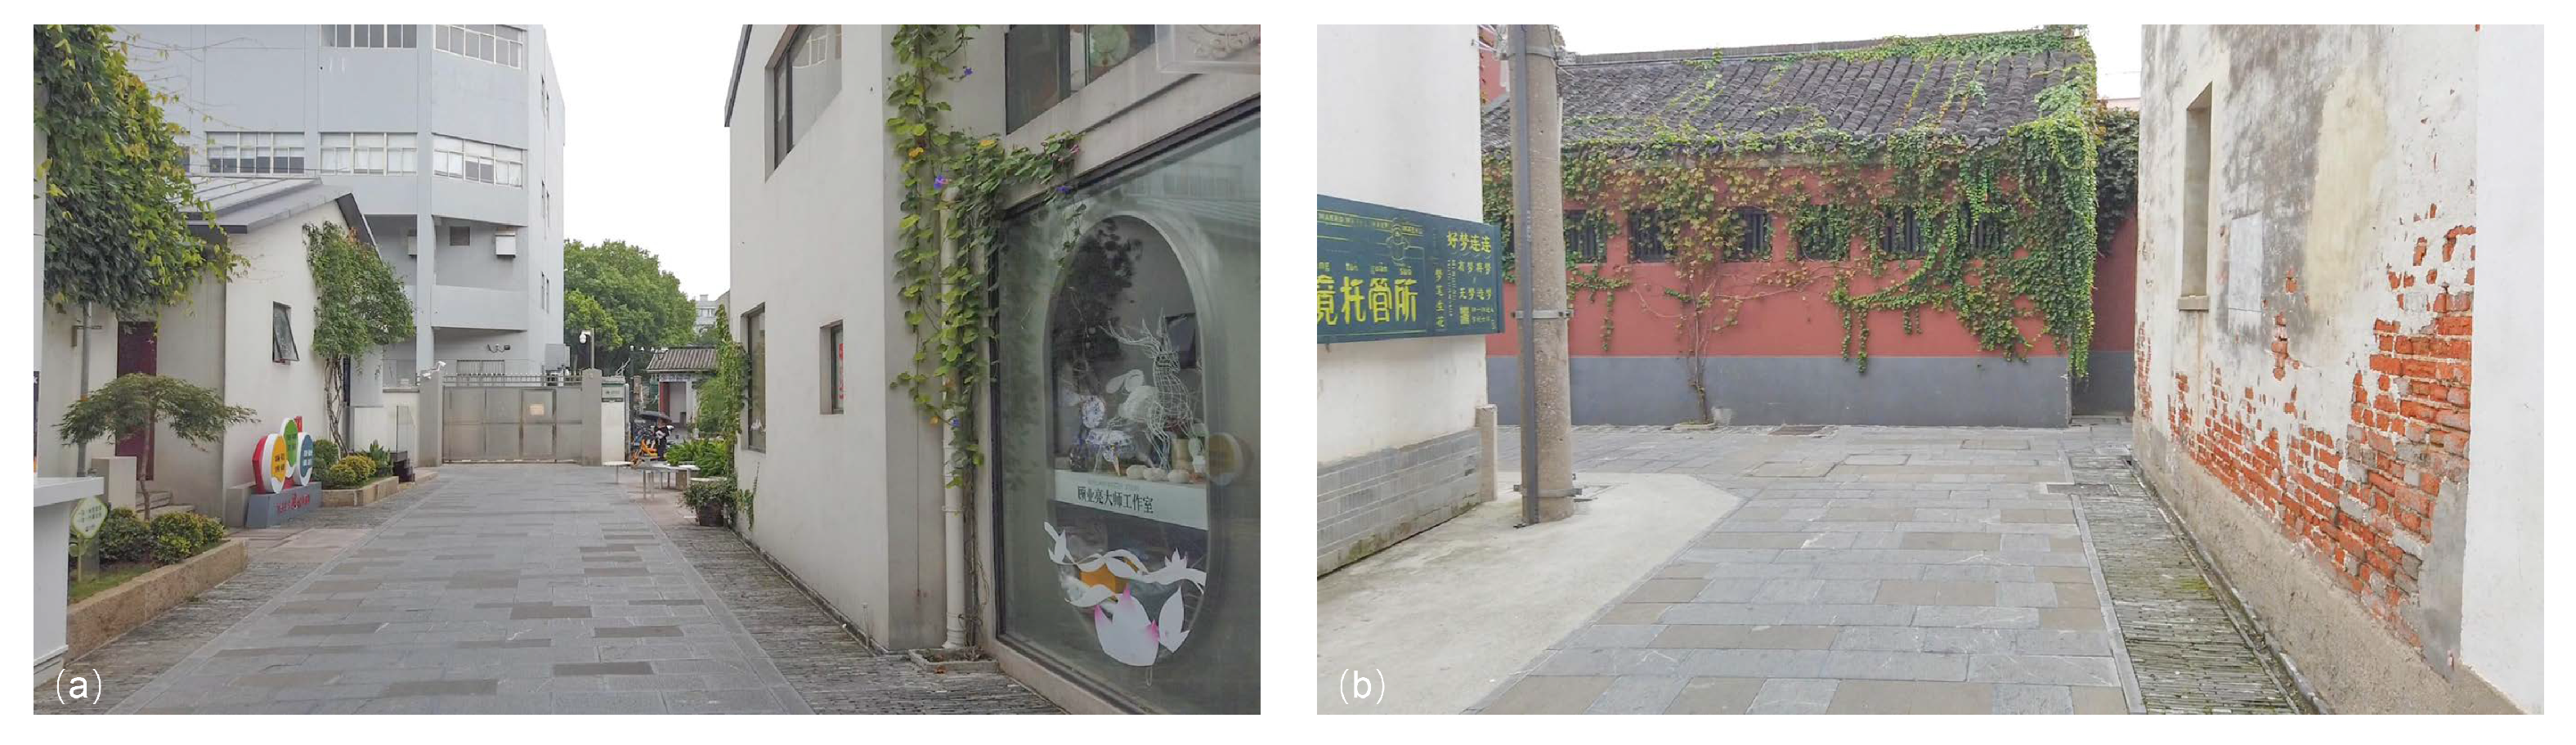
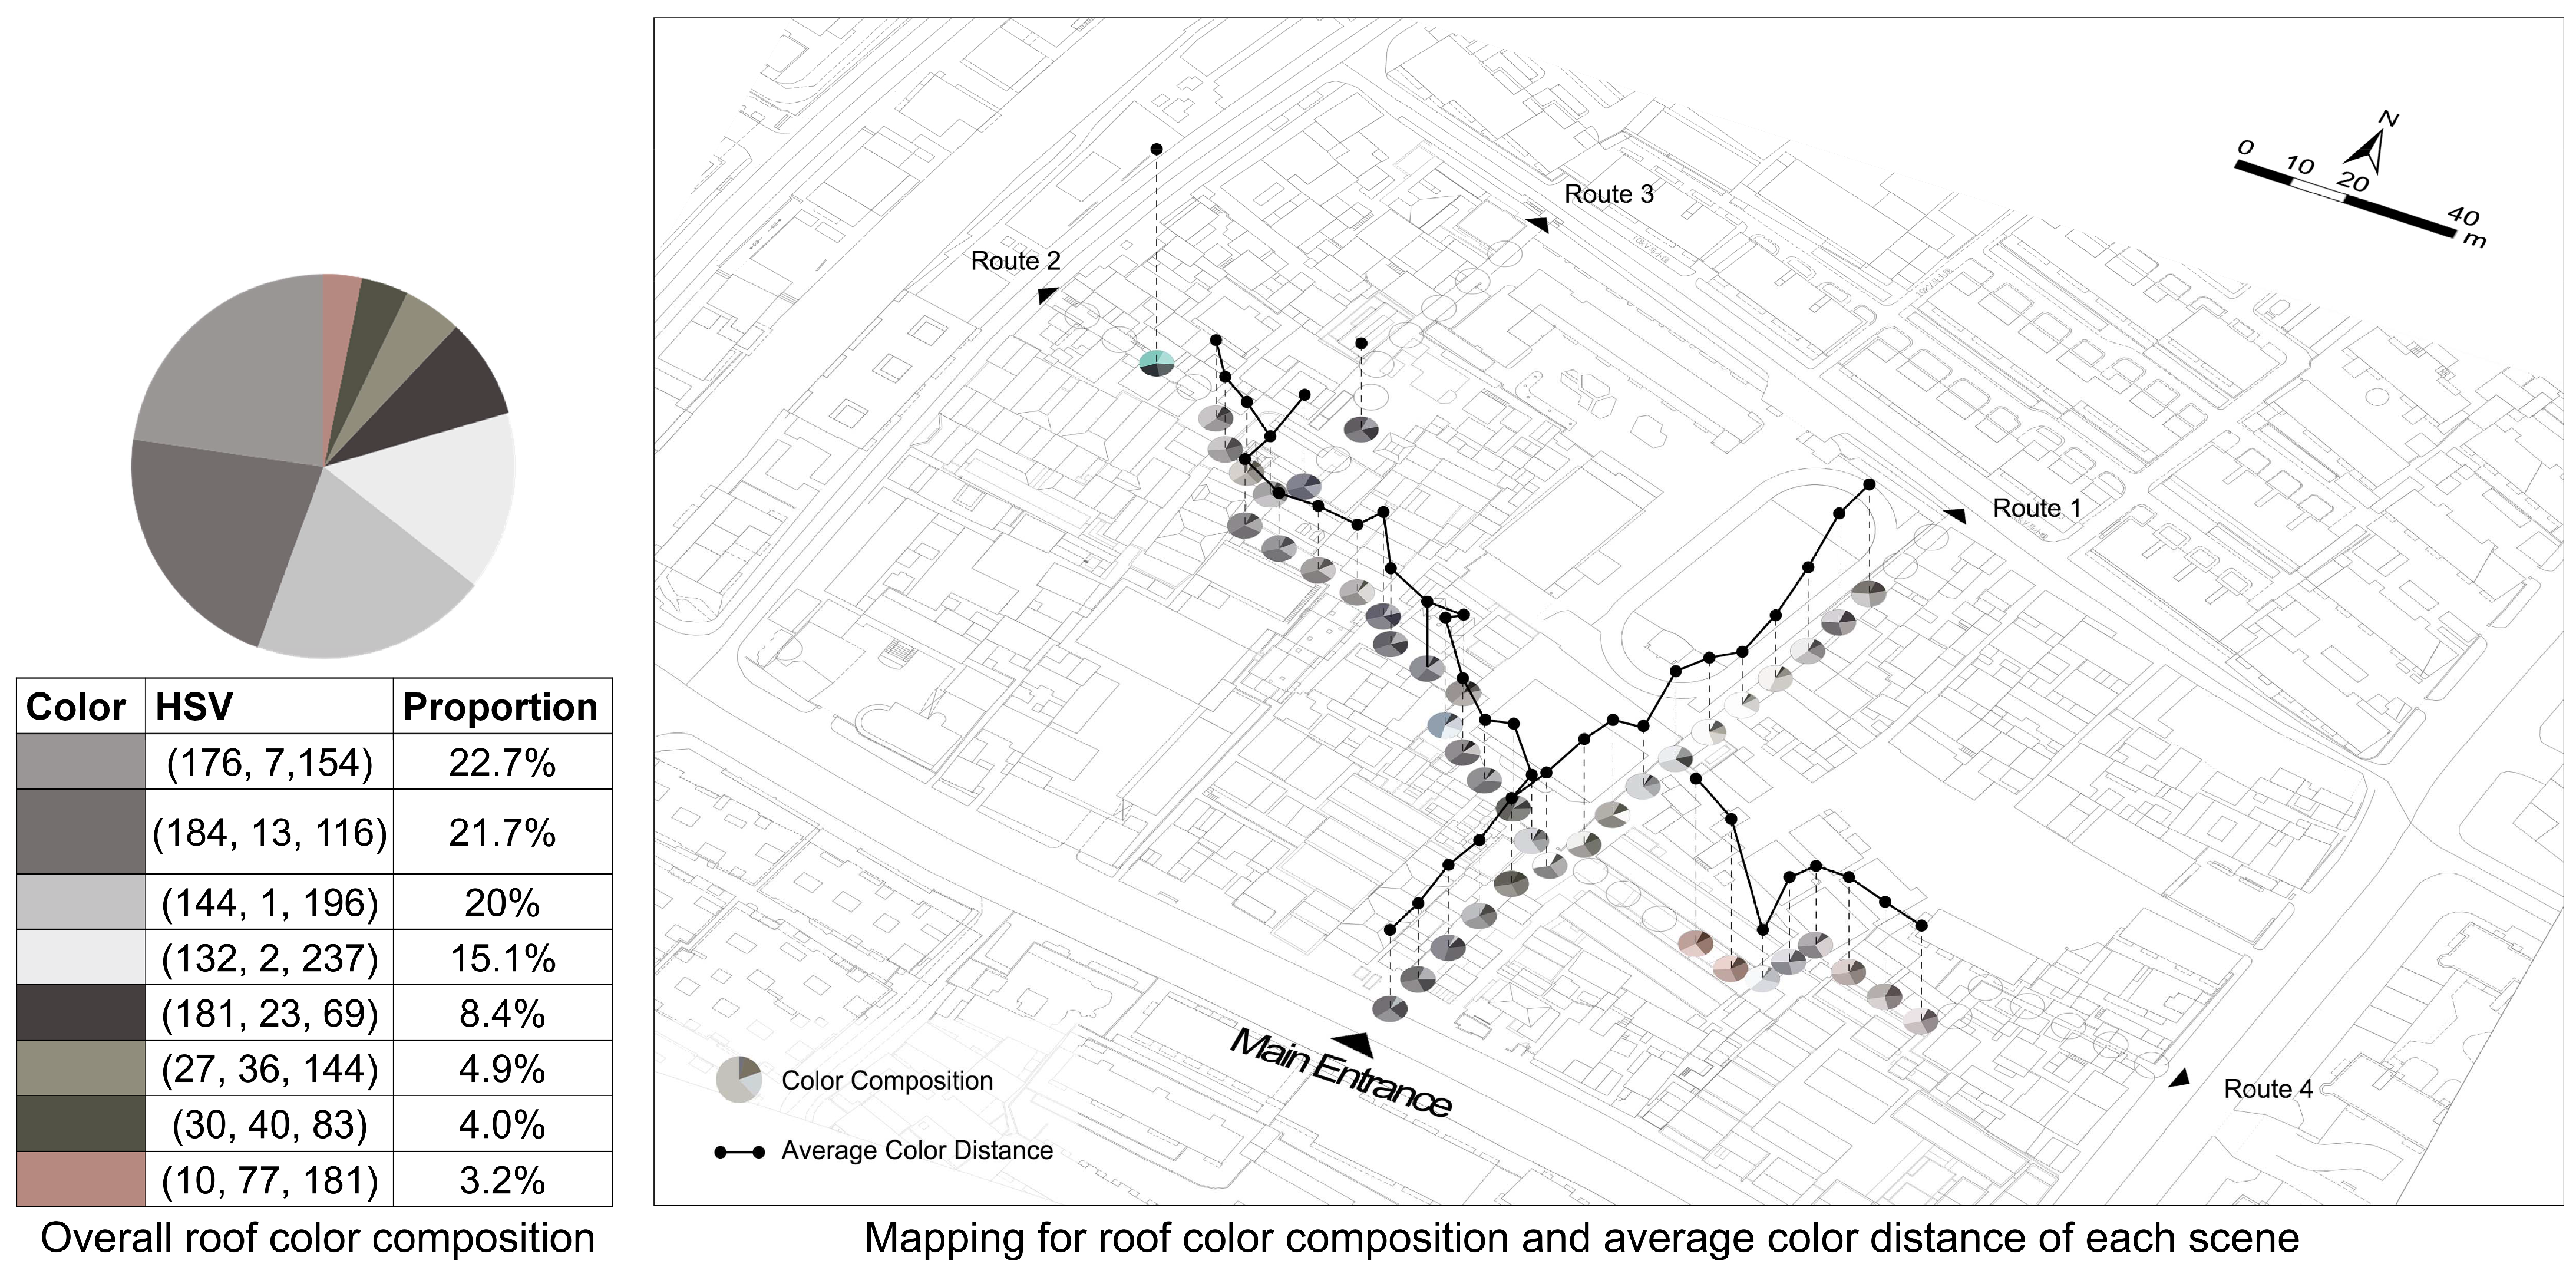
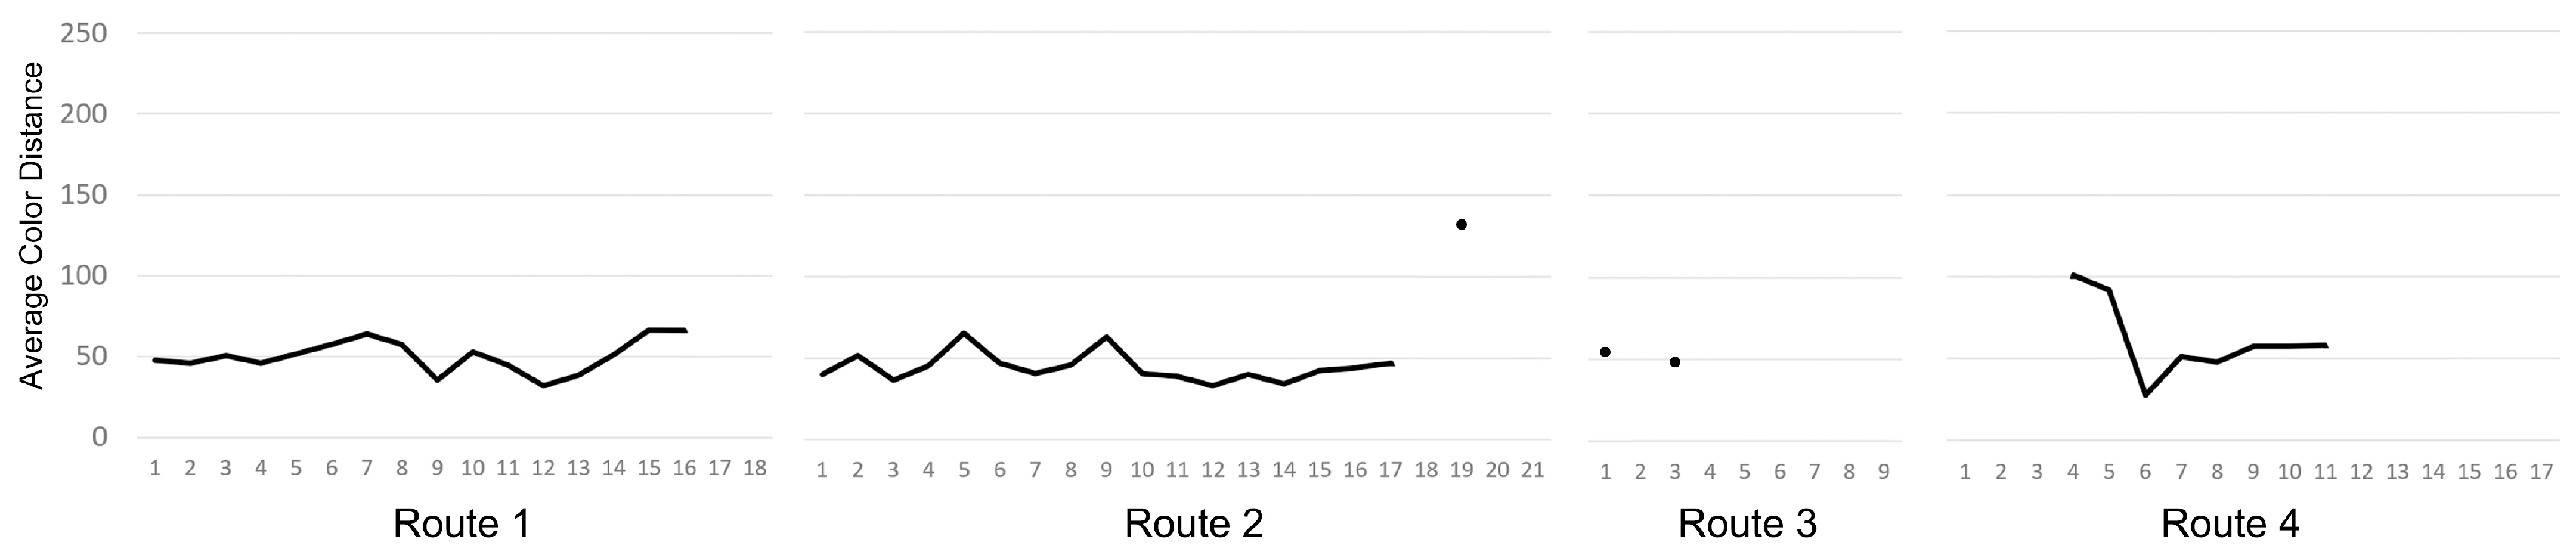
- Roof. On the main routes identified in this study, a portion of the sloping roofs are not visible from the street space, due to variations in the building height and orientation. In most scenes, gray dominates, encompassing both dark gray tiles and light gray steel roofs, contributing to the generally high roof color coherence. Red-tiled roofs, observable in certain scenes along Route 4, when mixed with gray tiles resulted in high values, thereby reducing the color coherence. Additionally, at the end of Route 2, the color coherence is further compromised by a house where part of the roof is covered with a green waterproof cloth (Figure 12 and Figure 13).
- (3)
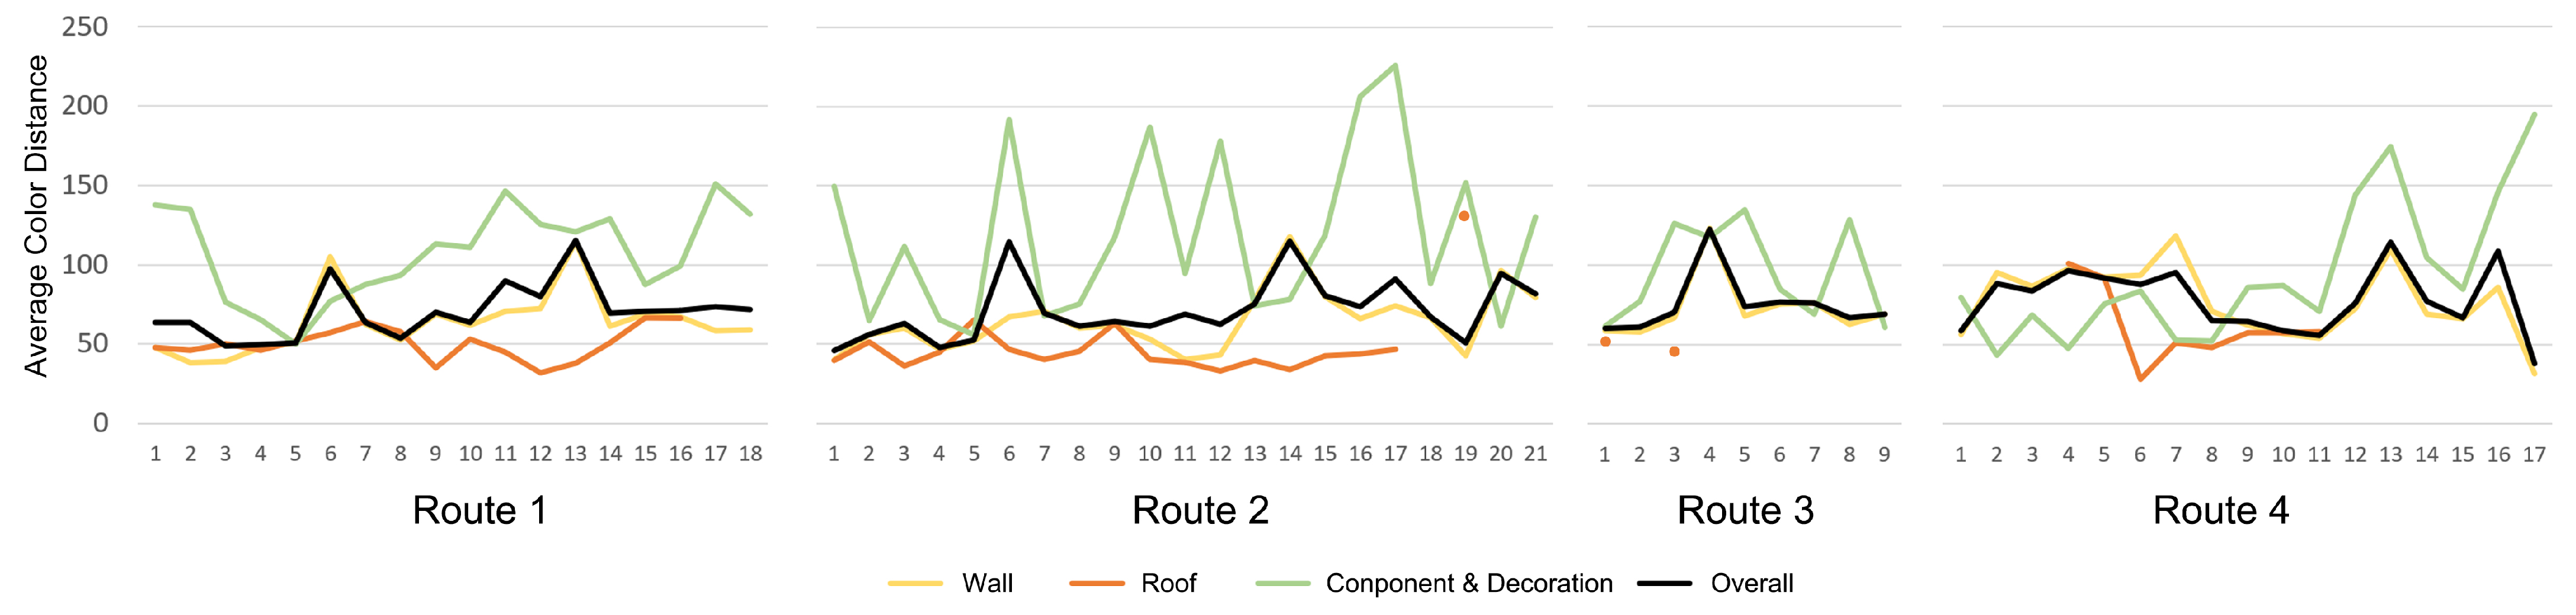
- Components and decoration. As presented in Figure 14 and Figure 15, most buildings feature metal components with gray coatings, or wooden components with dark red coatings. However, buildings renewed for commercial purposes often adopt vibrant colors such as green or orange to increase their attractiveness. Additionally, some residences, when replacing damaged doors and windows, choose colors without consideration of matching with other houses. These practices resulted in a greater number of scenes within the Xiaoxihu Area exhibiting lower color coherence among their components and decorations, and the regularity of the coherence variations was not strong.
- (4)
- Overall characteristics. We integrated the values of the overall buildings and individual parts into a single line graph (Figure 16). It can be observed that the overall of the buildings was roughly similar to the of the walls. This is primarily because the walls generally constituted the largest proportion in the scenes, and they had the most critical impact on the color coherence of the buildings.Comparing the colors across different building parts, the value of roof colors was the lowest, indicating the highest coherence, and it showed the most gradual fluctuation along the routes. The wall colors followed, while the coherence of component and decoration colors was significantly lower, with greater fluctuations and no regularity.
4.2. Height
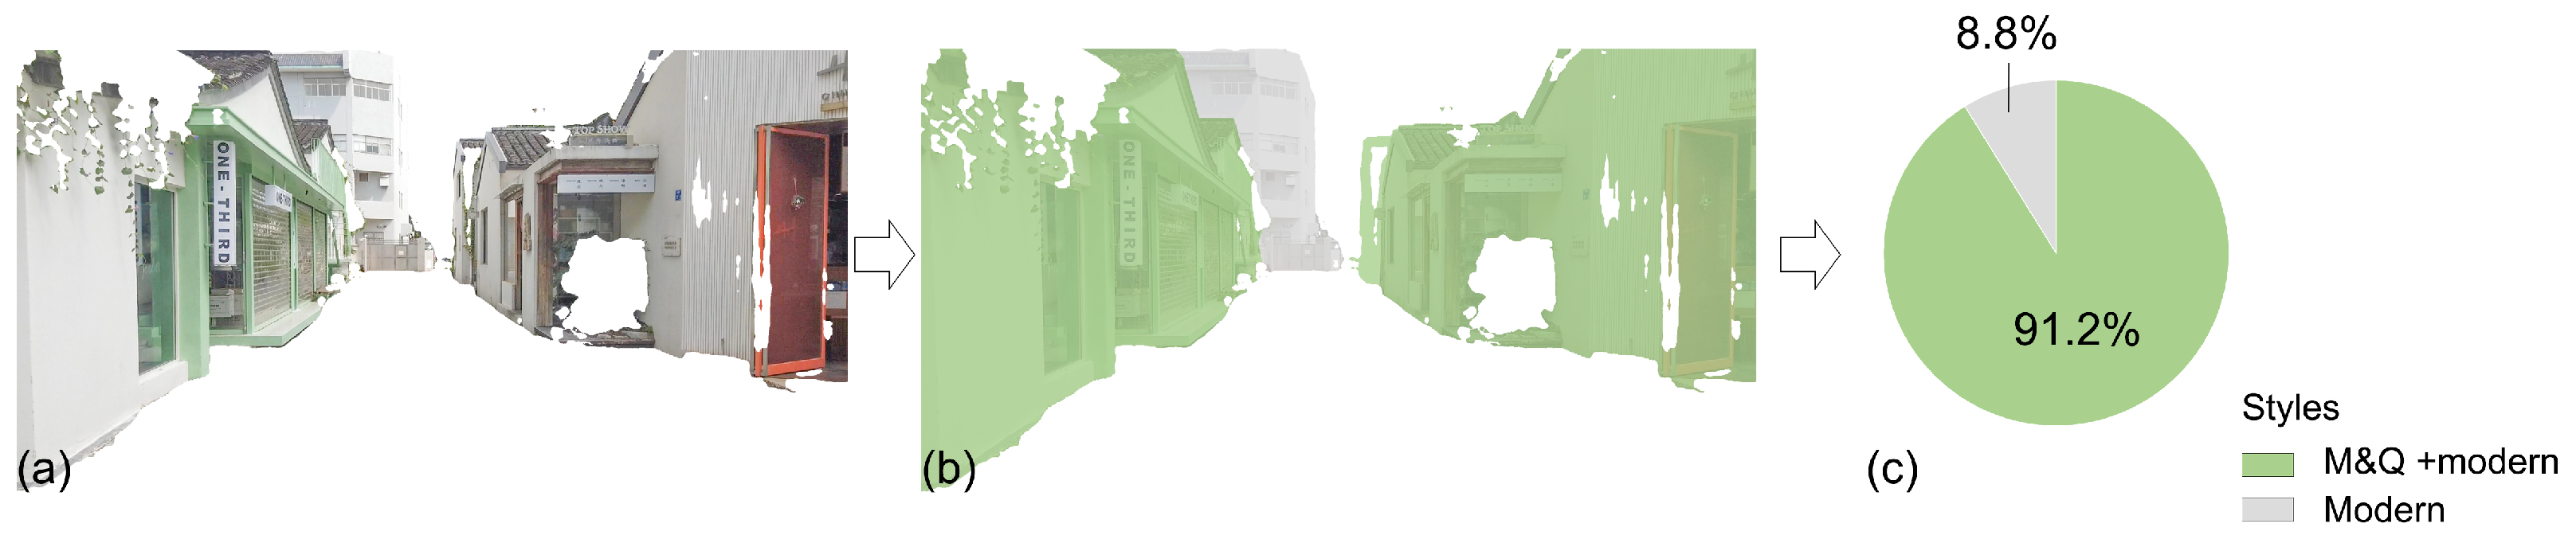
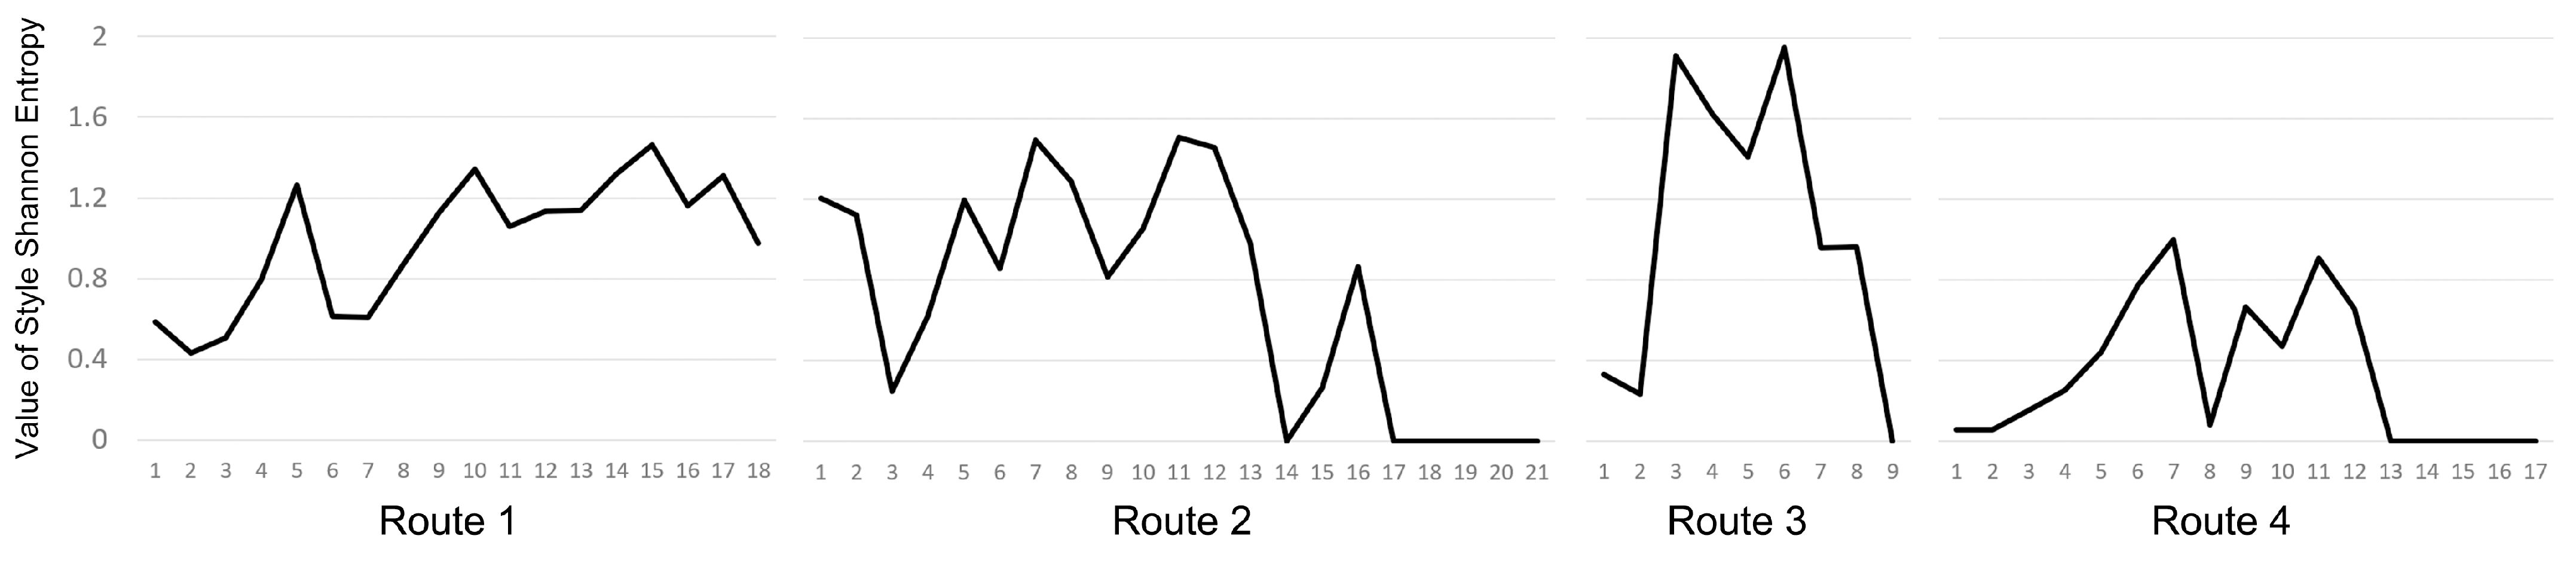
4.3. Style
4.4. Result Validation
5. Discussion
5.1. A Comprehensive and Refined Method for Measuring the VCoB
5.2. Implications and Applications
5.3. Factors Affecting the VCoB
5.4. Methods to Enhance the VCoB
5.5. The Required Degree of VCoB
5.6. Limitations and Future Research
6. Conclusions
Author Contributions
Funding
Data Availability Statement
Acknowledgments
Conflicts of Interest
Appendix A. Results of Professional Evaluation

| Voting Object | Scene No. | Vote Count |
|---|---|---|
| Scenes with the highest color coherence | 1–4 | 13 |
| 4–17 | 11 | |
| 1–5 | 11 | |
| 2–4 | 5 | |
| 2–5 | 2 | |
| 2–1 | 2 | |
| 2–18 | 1 | |
| Scenes with the lowest color coherence | 1–13 | 8 |
| 2–13 | 8 | |
| 2–14 | 6 | |
| 4–7 | 5 | |
| 4–13 | 4 | |
| 2–20 | 4 | |
| 2–15 | 3 | |
| 1–6 | 3 | |
| 3–4 | 2 | |
| 4–2 | 1 | |
| 3–1 | 1 | |
| Scenes with the highest height coherence | 4–17 | 6 |
| 3–2 | 5 | |
| 4–11 | 5 | |
| 2–21 | 5 | |
| 2–5 | 4 | |
| 4–8 | 4 | |
| 2–12 | 2 | |
| 4–9 | 2 | |
| 1–9 | 1 | |
| 3–1 | 2 | |
| Scenes with the lowest height coherence | 3–8 | 10 |
| 3–9 | 9 | |
| 1–5 | 7 | |
| 1–8 | 6 | |
| 2–8 | 6 | |
| 2–6 | 3 | |
| 4–7 | 2 | |
| 3–7 | 2 | |
| Scenes with the highest style coherence | All experts pointed out that Scenes 2–14, 2–17 to 2–21, and 4–13 to 4–17 possessed the highest building style coherence. | |
| Scenes with the lowest style coherence | 3–3 | 12 |
| 3–4 | 9 | |
| 2–8 | 7 | |
| 3–6 | 6 | |
| 2–7 | 5 | |
| 4–7 | 3 | |
| 4–12 | 3 | |
References
- Carmon, N. Three generations of urban renewal policies: Analysis and policy implications. Geoforum 1999, 30, 145–158. [Google Scholar] [CrossRef]
- Zheng, H.W.; Shen, G.Q.; Wang, H. A review of recent studies on sustainable urban renewal. Habitat Int. 2014, 41, 272–279. [Google Scholar] [CrossRef]
- Wang, H.; Liu, N.; Chen, J.; Guo, S. The relationship between urban renewal and the built environment: A systematic review and bibliometric analysis. J. Plan. Lit. 2022, 37, 293–308. [Google Scholar] [CrossRef]
- Couch, C.; Sykes, O.; Börstinghaus, W. Thirty years of urban regeneration in Britain, Germany and France: The importance of context and path dependency. Prog. Plan. 2011, 75, 1–52. [Google Scholar] [CrossRef]
- Veldpaus, L.; Pereira Roders, A.R.; Colenbrander, B.J. Urban heritage: Putting the past into the future. Hist. Environ. Policy Pract. 2013, 4, 3–18. [Google Scholar] [CrossRef]
- Versaci, A. The evolution of urban heritage concept in France, between conservation and rehabilitation programs. Procedia-Soc. Behav. Sci. 2016, 225, 3–14. [Google Scholar] [CrossRef]
- Spennemann, D.H. What actually is a heritage conservation area? A management critique based on a systematic review of New South Wales (Australia) planning documents. Heritage 2023, 6, 5270–5304. [Google Scholar] [CrossRef]
- Janssen, J. Modernising Dutch Heritage Conservation: Current Progress and Ongoing Challenges for Heritage-Based Planning and Management. Tijdschr. Voor Econ. Soc. Geogr. 2014, 105, 622–629. [Google Scholar] [CrossRef]
- Conference, U.G. Recommendation Concerning the Safeguarding and Contemporary Role of Historic Areas: Adopted by the General Conference at Its Nineteenth Session, Nairobi, 26 November 1976; Unesco: Paris, France, 1976. [Google Scholar]
- Song, Z.; Tang, P.; Wang, X.; Song, Y. Construction and application of analytic model for multi-Scale hierarchical structure in historic residential areas: A case study of hehuatang historical and cultural block in Nanjing. Archit. J. 2023, 659, 55–61. [Google Scholar]
- Mageean, A. Urban conservation policy development: Character appraisal and analysis. J. Archit. Conserv. 1998, 4, 59–77. [Google Scholar] [CrossRef]
- Pendlebury, J. The conservation of historic areas in the UK: A case study of “Grainger Town”, Newcastle upon Tyne. Cities 1999, 16, 423–433. [Google Scholar] [CrossRef]
- Shipley, R.; Snyder, M. The role of heritage conservation districts in achieving community economic development goals. Int. J. Herit. Stud. 2013, 19, 304–321. [Google Scholar] [CrossRef]
- Zahirovic-Herbert, V.; Chatterjee, S. Historic preservation and residential property values: Evidence from quantile regression. Urban Stud. 2012, 49, 369–382. [Google Scholar] [CrossRef]
- Martínez, P.G. Authenticity as a challenge in the transformation of Beijing’s urban heritage: The commercial gentrification of the Guozijian historic area. Cities 2016, 59, 48–56. [Google Scholar] [CrossRef]
- Yıldırım, M.; Turan, G. Sustainable development in historic areas: Adaptive re-use challenges in traditional houses in Sanliurfa, Turkey. Habitat Int. 2012, 36, 493–503. [Google Scholar] [CrossRef]
- Tweed, C.; Sutherland, M. Built cultural heritage and sustainable urban development. Landsc. Urban Plan. 2007, 83, 62–69. [Google Scholar] [CrossRef]
- Taherkhani, R.; Hashempour, N.; Lotfi, M. Sustainable-resilient urban revitalization framework: Residential buildings renovation in a historic district. J. Clean. Prod. 2021, 286, 124952. [Google Scholar] [CrossRef]
- Said, S.Y.; Aksah, H.; Ismail, E.D. Heritage conservation and regeneration of historic areas in Malaysia. Procedia-Soc. Behav. Sci. 2013, 105, 418–428. [Google Scholar] [CrossRef]
- Aloshan, M.; Elghonaimy, I.; Mesbah, E.; Gharieb, M.; Heba, K.M.; Alhumaid, M.H. Strategies for the Preservation of Historic Areas within Existing Middle Eastern Cities: The Case of Historic Jeddah. Buildings 2024, 14, 717. [Google Scholar] [CrossRef]
- Han, D. Progresses of interaction and inclusion: The practice of conservation and regeneration of Xiaoxihu Block in Nanjing. Archit. J. 2022, 638, 1–8. [Google Scholar]
- Zhang, J.; Pang, J.; Dong, W. On the property rights institution and historic building protection in the paradox. Mod. Urban Res. 2006, 6, 10–15. [Google Scholar]
- Dong, Y.; Han, D.; Trisciuoglio, M. A graphical method of presenting property rights, building types, and residential behaviors: A case study of Xiaoxihu historic area, Nanjing. Front. Archit. Res. 2022, 11, 1077–1091. [Google Scholar] [CrossRef]
- Nasar, J.L. Adult viewers’ preferences in residential scenes: A study of the relationship of environmental attributes to preference. Environ. Behav. 1983, 15, 589–614. [Google Scholar] [CrossRef]
- Bruce, V.; Georgeson, M.A.; Green, P.R. Visual Perception: Physiology, Psychology and Ecology; Psychology Press: London, UK, 2014. [Google Scholar]
- Liu, B.; Fan, R. Research on visual attraction elements and mechanism of landscape space. Chin. Landsc. Archit. 2013, 29, 5–10. [Google Scholar]
- Alexander, C. The Luminous Ground: The Nature of Order (Book 4); Center for Environmental Structure: Berkeley, CA, USA, 2004. [Google Scholar]
- Zube, E.H.; Sell, J.L.; Taylor, J.G. Landscape perception: Research, application and theory. Landsc. Plan. 1982, 9, 1–33. [Google Scholar] [CrossRef]
- Kaplan, R.; Kaplan, S. The Experience of Nature: A Psychological Perspective; Cambridge University Press: Cambridge, UK, 1989; pp. 50–57. [Google Scholar]
- Tveit, M.; Ode, Å.; Fry, G. Key concepts in a framework for analysing visual landscape character. Landsc. Res. 2006, 31, 229–255. [Google Scholar] [CrossRef]
- Bell, S. Landscape: Pattern, Perception and Process; Routledge: London, UK, 2012; p. 104. [Google Scholar]
- Sevenant, M.; Antrop, M. Cognitive attributes and aesthetic preferences in assessment and differentiation of landscapes. J. Environ. Manag. 2009, 90, 2889–2899. [Google Scholar] [CrossRef] [PubMed]
- Kuper, R. Evaluations of landscape preference, complexity, and coherence for designed digital landscape models. Landsc. Urban Plan. 2017, 157, 407–421. [Google Scholar] [CrossRef]
- Wang, J. Conservation, improvement, integrity, and construction of urban feature. Planners 2007, 23, 5–9. [Google Scholar]
- Van Mansvelt, J.; Kuiper, J. Criteria for the humanity realm: Psychology and physiognomy and cultural heritage. In Checklist for Sustainable Landscape Management; Elsevier: Amsterdam, The Netherlands, 1999; pp. 116–134. [Google Scholar]
- Lynch, K. The Image of the City; MIT Press: Boston, MA, USA, 1964; pp. 105–106. [Google Scholar]
- Nasar, J.L. Urban Design Aesthetics: The Evaluative Qualities of Building Exterion. In Proceedings of the International Symposium on Design Review (Routledge Revivals); Routledge: London, UK, 2017; pp. 67–78. [Google Scholar]
- Tang, Z.; Liu, B. Progress in visual landscape evaluation. Landsc. Archit. 2015, 122, 113–120. [Google Scholar]
- Wang, Y.; Zlatanova, S.; Yan, J.; Huang, Z.; Cheng, Y. Exploring the relationship between spatial morphology characteristics and scenic beauty preference of landscape open space unit by using point cloud data. Environ. Plan. Urban Anal. City Sci. 2021, 48, 1822–1840. [Google Scholar] [CrossRef]
- Qi, J.; Lin, E.S.; Tan, P.Y.; Ho, R.C.M.; Sia, A.; Olszewska-Guizzo, A.; Zhang, X.; Waykool, R. Development and application of 3D spatial metrics using point clouds for landscape visual quality assessment. Landsc. Urban Plan. 2022, 228, 104585. [Google Scholar] [CrossRef]
- Lothian, A. Landscape and the philosophy of aesthetics: Is landscape quality inherent in the landscape or in the eye of the beholder? Landsc. Urban Plan. 1999, 44, 177–198. [Google Scholar] [CrossRef]
- Herzog, T.R.; Kaplan, S.; Kaplan, R. The prediction of preference for unfamiliar urban places. Popul. Environ. 1982, 5, 43–59. [Google Scholar] [CrossRef]
- Herzog, T.R. A cognitive analysis of preference for waterscapes. J. Environ. Psychol. 1985, 5, 225–241. [Google Scholar] [CrossRef]
- Nasar, J.L. The effect of sign complexity and coherence on the perceived quality of retail scenes. J. Am. Plan. Assoc. 1987, 53, 499–509. [Google Scholar] [CrossRef]
- Alpak, E.M.; Özkan, D.G.; Mumcu, S.; Özbilen, A. Complexity, historicity and coherence: Preference and quality of the changes in the urban scene. Anthropologist 2016, 24, 762–777. [Google Scholar] [CrossRef]
- Morgan, R. Some factors affecting coastal landscape aesthetic quality assessment. Landsc. Res. 1999, 24, 167–184. [Google Scholar] [CrossRef]
- Stamps, A.E., III. Mystery, complexity, legibility and coherence: A meta-analysis. J. Environ. Psychol. 2004, 24, 1–16. [Google Scholar] [CrossRef]
- Palmer, J.F. Reliability of rating visible landscape qualities. Landsc. J. 2000, 19, 166–178. [Google Scholar] [CrossRef]
- Stamps, A.E., III. Entropy, visual diversity, and preference. J. Gen. Psychol. 2002, 129, 300–320. [Google Scholar] [CrossRef] [PubMed]
- Stamps, A.E., III. Advances in visual diversity and entropy. Environ. Plan. B Plan. Des. 2003, 30, 449–463. [Google Scholar] [CrossRef]
- Malewczyk, M.; Taraszkiewicz, A.; Czyż, P. Preferences of the Facade Composition in the Context of Its Regularity and Irregularity. Buildings 2022, 12, 169. [Google Scholar] [CrossRef]
- Ewing, R.; Handy, S. Measuring the unmeasurable: Urban design qualities related to walkability. J. Urban Des. 2009, 14, 65–84. [Google Scholar] [CrossRef]
- Wu, B.; Yu, B.; Shu, S.; Liang, H.; Zhao, Y.; Wu, J. Mapping fine-scale visual quality distribution inside urban streets using mobile LiDAR data. Build. Environ. 2021, 206, 108323. [Google Scholar] [CrossRef]
- Qiu, W.; Li, W.; Liu, X.; Zhang, Z.; Li, X.; Huang, X. Subjective and objective measures of streetscape perceptions: Relationships with property value in Shanghai. Cities 2023, 132, 104037. [Google Scholar] [CrossRef]
- Jin, X.; Wang, J. Assessing Linear Urban Landscape from dynamic visual perception based on urban morphology. Front. Archit. Res. 2021, 10, 202–219. [Google Scholar] [CrossRef]
- Ode, Å.; Tveit, M.S.; Fry, G. Capturing landscape visual character using indicators: Touching base with landscape aesthetic theory. Landsc. Res. 2008, 33, 89–117. [Google Scholar] [CrossRef]
- Karasov, O.; Vieira, A.A.B.; Külvik, M.; Chervanyov, I. Landscape coherence revisited: GIS-based mapping in relation to scenic values and preferences estimated with geolocated social media data. Ecol. Indic. 2020, 111, 105973. [Google Scholar] [CrossRef]
- Chen, N.; Xu, X.; Tan, M.; Wang, X. A Spatial Analysis of Urban Color Harmony in Five Global Metropolises. J. Resour. Ecol. 2022, 13, 238–246. [Google Scholar]
- Li, K.R.; Yang, Y.Q.; Zheng, Z.Q. Research on color harmony of building facades. Color Res. Appl. 2020, 45, 105–119. [Google Scholar] [CrossRef]
- Dong, Y. The Typo-Morphology Approach to the Conservation and Regeneration of the Xiaoxihu Historical Area, Nanjing. Ph.D. Thesis, Southeast University, Nanjing, China, 2019. [Google Scholar]
- Dong, Y.; Han, D.; Shen, Y.; Bao, Y. The making and application of typological map adaptive to conservation and regeneration of historic districts in China a case study of the Xiaoxihu Area in Nanjing. Archit. J. 2019, 655, 81–87. [Google Scholar]
- Misthos, L.M.; Krassanakis, V.; Merlemis, N.; Kesidis, A.L. Modeling the Visual Landscape: A Review on Approaches, Methods and Techniques. Sensors 2023, 23, 8135. [Google Scholar] [CrossRef] [PubMed]
- Wilber, D.N. The role of color in architecture. J. Am. Soc. Archit. Hist. 1942, 2, 17–22. [Google Scholar] [CrossRef]
- Zhong, T.; Ye, C.; Wang, Z.; Tang, G.; Zhang, W.; Ye, Y. City-scale mapping of urban façade color using street-view imagery. Remote Sens. 2021, 13, 1591. [Google Scholar] [CrossRef]
- Serra, J.; García, Á.; Torres, A.; Llopis, J. Color composition features in modern architecture. Color Res. Appl. 2012, 37, 126–133. [Google Scholar] [CrossRef]
- Caivano, J.L. Research on color in architecture and environmental design: Brief history, current developments, and possible future. Color Res. Appl. 2006, 31, 350–363. [Google Scholar] [CrossRef]
- Melo, R.H.R.Q.; Falcão, J.R.; Bersch, J.D.; Baptista, D.T.; Masuero, A.B. Performance and Durability of Paints for the Conservation of Historic Façades. Buildings 2024, 14, 1016. [Google Scholar] [CrossRef]
- Stamps, A.E., III. A study in scale and character: Contextual effects on environmental preferences. J. Environ. Manag. 1994, 42, 223–245. [Google Scholar] [CrossRef]
- Tang, J.; Long, Y. Measuring visual quality of street space and its temporal variation: Methodology and its application in the Hutong area in Beijing. Landsc. Urban Plan. 2019, 191, 103436. [Google Scholar] [CrossRef]
- Cullen, G. Townscape; Reinhold Publishing Corporation: New York, NY, USA, 1961. [Google Scholar]
- Rui, J. Measuring streetscape perceptions from driveways and sidewalks to inform pedestrian-oriented street renewal in Düsseldorf. Cities 2023, 141, 104472. [Google Scholar] [CrossRef]
- Liang, X.; Zhao, T.; Biljecki, F. Revealing spatio-temporal evolution of urban visual environments with street view imagery. Landsc. Urban Plan. 2023, 237, 104802. [Google Scholar] [CrossRef]
- Badrinarayanan, V.; Kendall, A.; Cipolla, R. Segnet: A deep convolutional encoder-decoder architecture for image segmentation. IEEE Trans. Pattern Anal. Mach. Intell. 2017, 39, 2481–2495. [Google Scholar] [CrossRef]
- Chen, L.C.; Papandreou, G.; Kokkinos, I.; Murphy, K.; Yuille, A.L. Deeplab: Semantic image segmentation with deep convolutional nets, atrous convolution, and fully connected crfs. IEEE Trans. Pattern Anal. Mach. Intell. 2017, 40, 834–848. [Google Scholar] [CrossRef]
- Ibrahim, M.R.; Haworth, J.; Cheng, T. Understanding cities with machine eyes: A review of deep computer vision in urban analytics. Cities 2020, 96, 102481. [Google Scholar] [CrossRef]
- Zhou, B.; Zhao, H.; Puig, X.; Fidler, S.; Barriuso, A.; Torralba, A. Scene parsing through ade20k dataset. In Proceedings of the IEEE Conference on Computer Vision and Pattern Recognition, Honolulu, HI, USA, 21–26 July 2017; pp. 633–641. [Google Scholar]
- Kirillov, A.; Mintun, E.; Ravi, N.; Mao, H.; Rolland, C.; Gustafson, L.; Xiao, T.; Whitehead, S.; Berg, A.C.; Lo, W.Y.; et al. Segment anything. In Proceedings of the IEEE/CVF International Conference on Computer Vision, Paris, France, 2–6 October 2023; pp. 4015–4026. [Google Scholar]
- Nguyen, L.; Embrechts, J.J.; Teller, J. Colour in the city: A chromatic typology for the quantitative analysis of spatial coherence. Landsc. Res. 2019, 45, 44–62. [Google Scholar] [CrossRef]
- Yan, Y.; Huang, B. Estimation of building height using a single street view image via deep neural networks. ISPRS J. Photogramm. Remote Sens. 2022, 192, 83–98. [Google Scholar] [CrossRef]
- Sun, M.; Zhang, F.; Duarte, F.; Ratti, C. Understanding architecture age and style through deep learning. Cities 2022, 128, 103787. [Google Scholar] [CrossRef]
- Chen, Z.; Xu, B. Enhancing urban landscape configurations by integrating 3D landscape pattern analysis with people’s landscape preferences. Environ. Earth Sci. 2016, 75, 1018. [Google Scholar] [CrossRef]
- Shannon, C.E. A mathematical theory of communication. Bell Syst. Tech. J. 1948, 27, 379–423. [Google Scholar] [CrossRef]
- Tokyo Metropolitan Bureau of Urban Development. Tokyo Urban Landscape Planning; Tokyo Metropolitan Bureau of Urban Development: Tokyo, Japan, 2018. [Google Scholar]
- Wright, W.C.; Eppink, F.V. Drivers of heritage value: A meta-analysis of monetary valuation studies of cultural heritage. Ecol. Econ. 2016, 130, 277–284. [Google Scholar] [CrossRef]
- Fredheim, L.H.; Khalaf, M. The significance of values: Heritage value typologies re-examined. Int. J. Herit. Stud. 2016, 22, 466–481. [Google Scholar] [CrossRef]
- Fitri, I.; Ahmad, Y.; Ahmad, F. Conservation of tangible cultural heritage in Indonesia: A review current national criteria for assessing heritage value. Procedia-Soc. Behav. Sci. 2015, 184, 71–78. [Google Scholar] [CrossRef]
- Ashihara, Y. External Space Design; China Architecture & Building: Beijing, China, 1985. [Google Scholar]
- Martín, B.; Ortega, E.; Otero, I.; Arce, R.M. Landscape character assessment with GIS using map-based indicators and photographs in the relationship between landscape and roads. J. Environ. Manag. 2016, 180, 324–334. [Google Scholar] [CrossRef] [PubMed]


Disclaimer/Publisher’s Note: The statements, opinions and data contained in all publications are solely those of the individual author(s) and contributor(s) and not of MDPI and/or the editor(s). MDPI and/or the editor(s) disclaim responsibility for any injury to people or property resulting from any ideas, methods, instructions or products referred to in the content. |
© 2024 by the authors. Licensee MDPI, Basel, Switzerland. This article is an open access article distributed under the terms and conditions of the Creative Commons Attribution (CC BY) license (https://creativecommons.org/licenses/by/4.0/).
Share and Cite
Xu, Y.; Pan, Z. A Method for Measuring the Visual Coherence of Buildings in Residential Historic Areas: A Case Study of the Xiaoxihu Historic Area in Nanjing, China. Buildings 2024, 14, 1595. https://doi.org/10.3390/buildings14061595
Xu Y, Pan Z. A Method for Measuring the Visual Coherence of Buildings in Residential Historic Areas: A Case Study of the Xiaoxihu Historic Area in Nanjing, China. Buildings. 2024; 14(6):1595. https://doi.org/10.3390/buildings14061595
Chicago/Turabian StyleXu, Yipin, and Zejia Pan. 2024. "A Method for Measuring the Visual Coherence of Buildings in Residential Historic Areas: A Case Study of the Xiaoxihu Historic Area in Nanjing, China" Buildings 14, no. 6: 1595. https://doi.org/10.3390/buildings14061595