Article

Impact Toughness Analysis and Numerical Simulation of Coral Aggregate Concrete at Various Strength Grades: Experimental and Data Investigations

1
Department of Civil and Airport Engineering, Nanjing University of Aeronautics and Astronautics, Nanjing 210016, China
2
Department of Civil and Environmental Engineering, Imperial College London, London SW7 2AZ, UK
*
Authors to whom correspondence should be addressed.
Buildings 2024, 14(6), 1605; https://doi.org/10.3390/buildings14061605
Submission received: 18 April 2024 / Revised: 16 May 2024 / Accepted: 27 May 2024 / Published: 1 June 2024
(This article belongs to the Special Issue Recent Advances in Technology and Properties of Composite Materials)

Abstract

:
This paper comprehensively investigates the dynamic mechanical properties of concrete by employing a 75 mm diameter Split Hopkinson Pressure Bar (SHPB). To be detailed further, dynamic compression experiments are conducted on coral aggregate seawater concrete (CASC) to unveil the relationship between the toughness ratio, strain rate, and different strength grades. A three-dimensional random convex polyhedral aggregate mesoscopic model is also utilized to simulate the damage modes of concrete and its components under varying strain rates. Additionally, the impact of different aggregate volume rates on the damage modes of CASC is also studied. The results show that strain rate has a significant effect on CASC, and the strength grade influences both the damage mode and toughness index of the concrete. The growth rate of the toughness index exhibits a distinct change when the 28-day compressive strength of CASC ranges between 60 and 80 MPa, with three times an increment in the toughness index of high-strength CASC comparing to low-strength CASC undergoing high strain. The introduction of pre-peak and post-peak toughness highlights the lowest pre-to-post-peak toughness ratio at a strain rate of approximately 80 s−1, which indicates a shift in the concrete’s damage mode. Various damage modes of CASC are under dynamic impact and are consequently defined based on these findings. The LS-DYNA finite element software is employed to analyze the damage morphology of CASC at different strain rates, and the numerical simulation results align with the experimental observations. By comparing the numerical simulation results of different models with varying aggregate volume rates, it is reported that CASC’s failure mode is minimized at an aggregate volume rate of 20%.

1. Introduction

Marine resource reservation and development are regarded as being of importance in both natural and economic society. In this way, dead marine coral reefs serving as coarse and fine aggregates in coral aggregate concrete (CAC) working under marine environment bring benefits which minimize impact to the ocean. On the other hand, properly using abundant coral reef resources locally is also beneficial in lowering construction costs and shortening construction periods. Therefore, the application of CAC in marine infrastructure projects provides satisfying performance in island projects such as roads, piers, berms, and other infrastructure [1].
The United States has led the pioneering research and utilization of coral aggregate concrete, especially in the construction of airfields and roads, and in military defense usage on islands in the Western Pacific. Mrema and Bungara [2] succeeded in producing high-strength coral aggregate concrete by incorporating mineral admixtures into the mix. Yu et al. [3] developed high-strength coral aggregate concrete with compressive strengths ranging from 55 MPa to 85 MPa. They employed the pre-wetting technique in the laboratory and field, based on the slurry-rich theory. Besides studies on improving CAC’s strength, Da et al. [4] studied the static mechanical properties of CAC and observed that it exhibited greater brittleness compared to light aggregate concrete (LAC), with a steeper rising section and a falling section of the full stress–strain curve, similar to LAC. They ranked the brittleness of different concrete types at the same strength grade as follows: CAC > LAC > ordinary Portland cement (OPC). Cai et al. [5] compared the mechanical properties of CAC and OPC through SHPB experiments and found that the impact toughness of CAC was significantly lower than that of OPC. At the same strain rate, the dynamic increase factor (DIF) of CAC was higher than that of OPC as found by Ma et al. Although limited research has been carried out on the dynamic mechanical properties of CAC, it is reported that the mainstream methods of enhancing impact toughness are to incorporate fibers [6] and high-tenacity cement or mineral admixtures [7,8,9]. Regarding the importance of CAC in island projects and national defense, this paper advances the understanding of high-speed dynamic mechanical properties in CAC by investigating the behavior of two different compressive strength grades (C55 to C70) using a SHPB. This paper also summarizes most of the current data on the dynamic impact of coral CAC and discusses in depth the relationship between the toughness index and strain rate. A definition of the pre-peak to post-peak toughness ratio was proposed to visually compare the energy dissipation patterns of concrete under impact.
To consummate this study, besides experimental methods, robust finite element modeling was conducted to simulate the dynamic behavior of CAC under a high-speed impact. To express the physical nature of CAC, the constituents are defined into three phases: aggregate, mortar, and the interface transition zone (ITZ) between the two [10,11,12]. This model performs highly accurately once the sizes of aggregate are fine. To find a balance in simulation cost and accuracy, different aggregate models were studied, including the planar circular model [13], the planar polygon model, the spherical model [14], the 3D ellipsoid model [15], the 3D random convex polyhedron model [16,17], and the non-convex polyhedron model [18]. Although each model has its own pros and cons, the most realistic model, the random polygon convex aggregate model, which considers the random shape and distribution of aggregates more comprehensively, was chosen in this paper in order to exhibit the most accurate dynamic properties of CAC. By optimizing the model, a 3D random mesoscale model was developed, and numerical simulations were carried out with LS-DYNA software [19] to investigate the mechanical destructive properties of CASC under dynamic load. Furthermore, the effect of aggregate volume rate on the dynamic impact of CASC was discussed to expand the application scope of different CACs.

2. Experiment Study

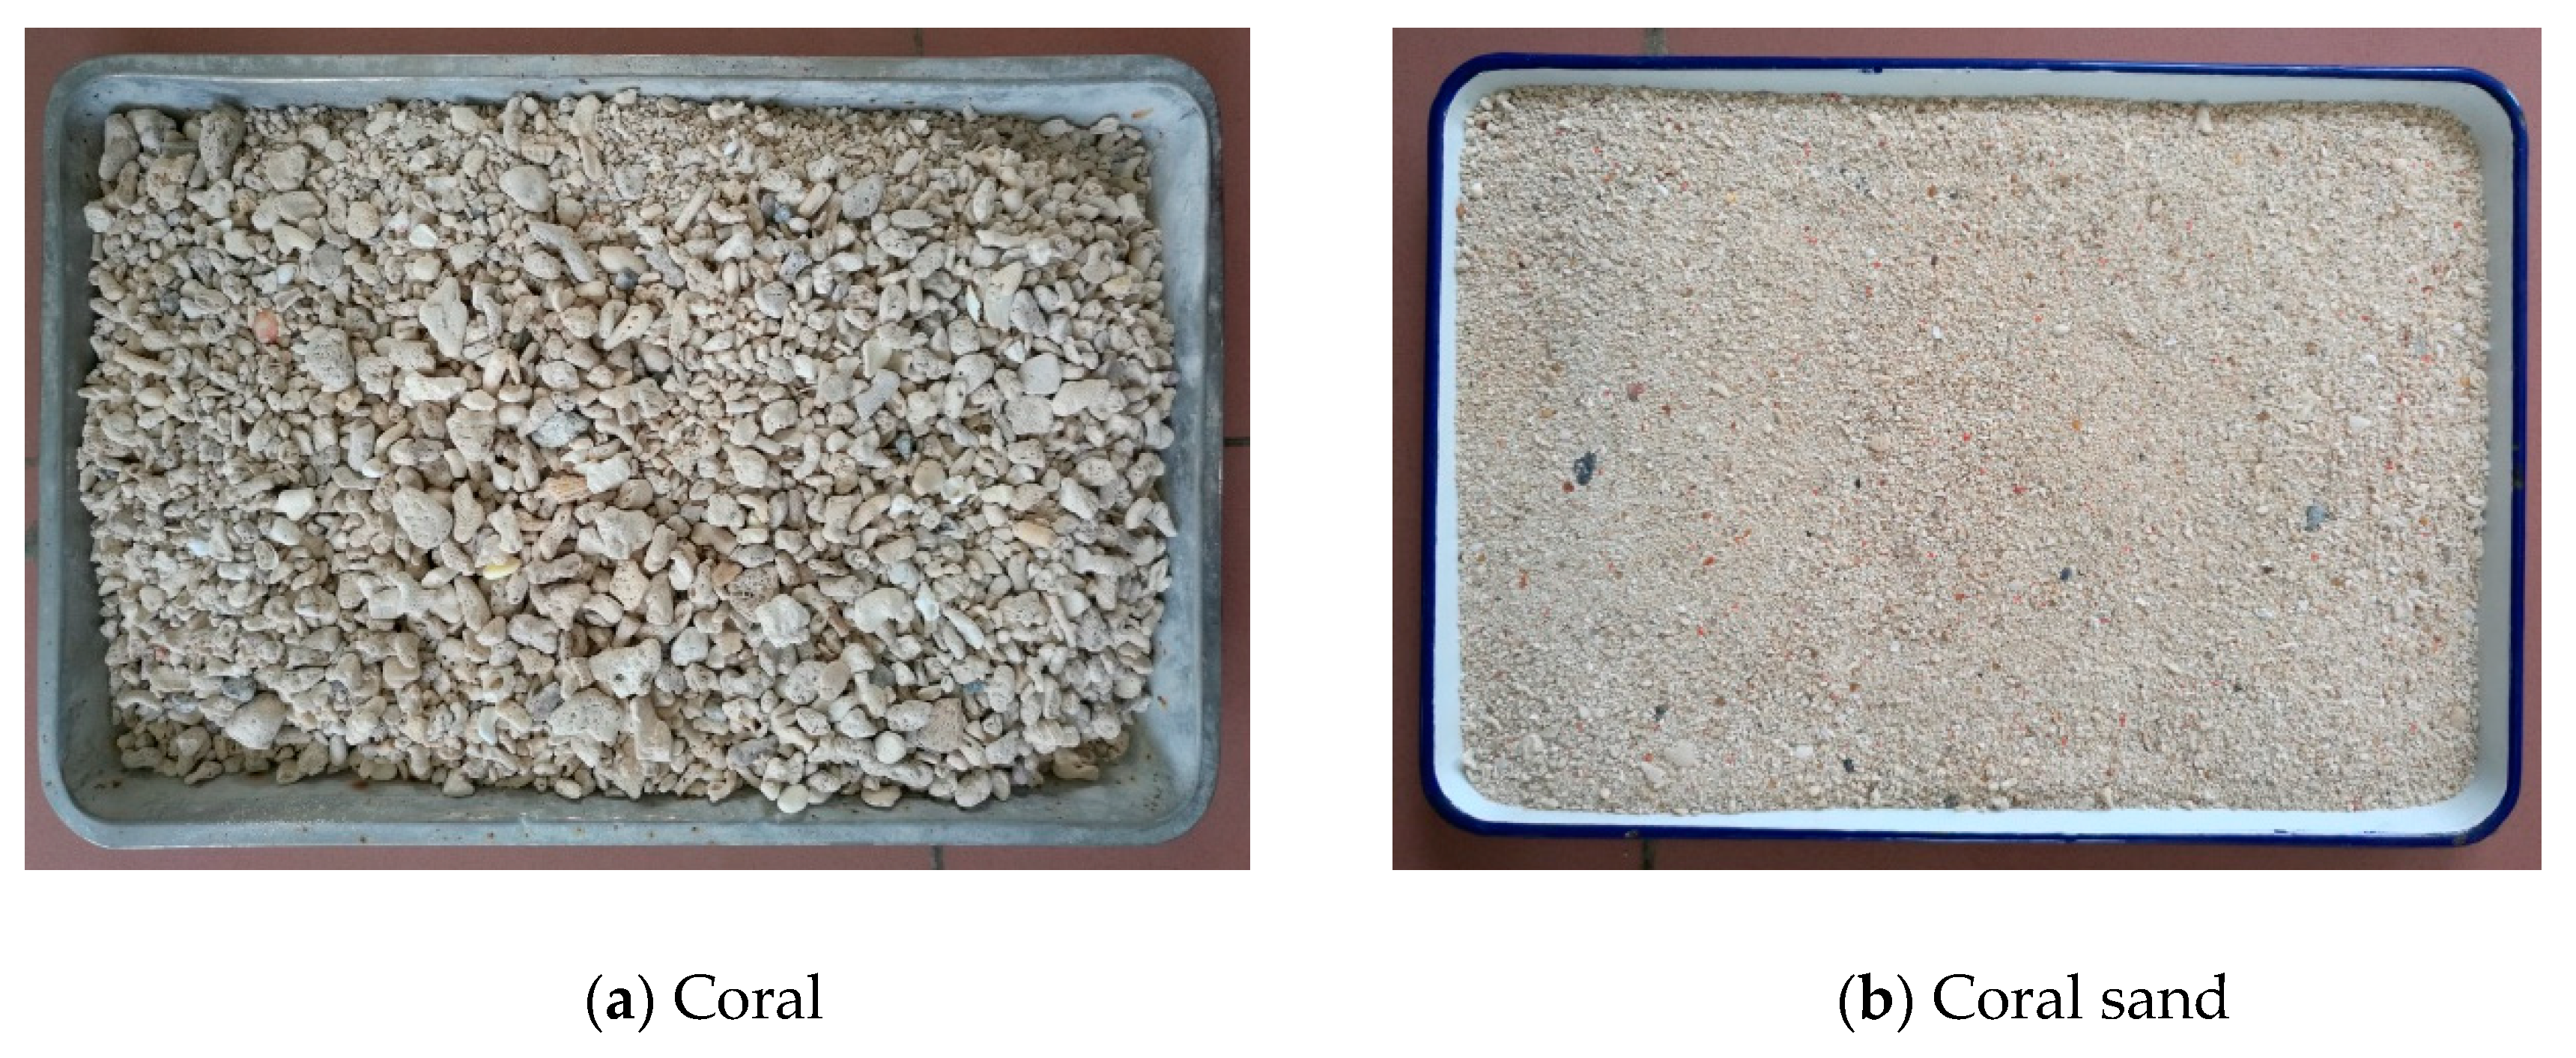
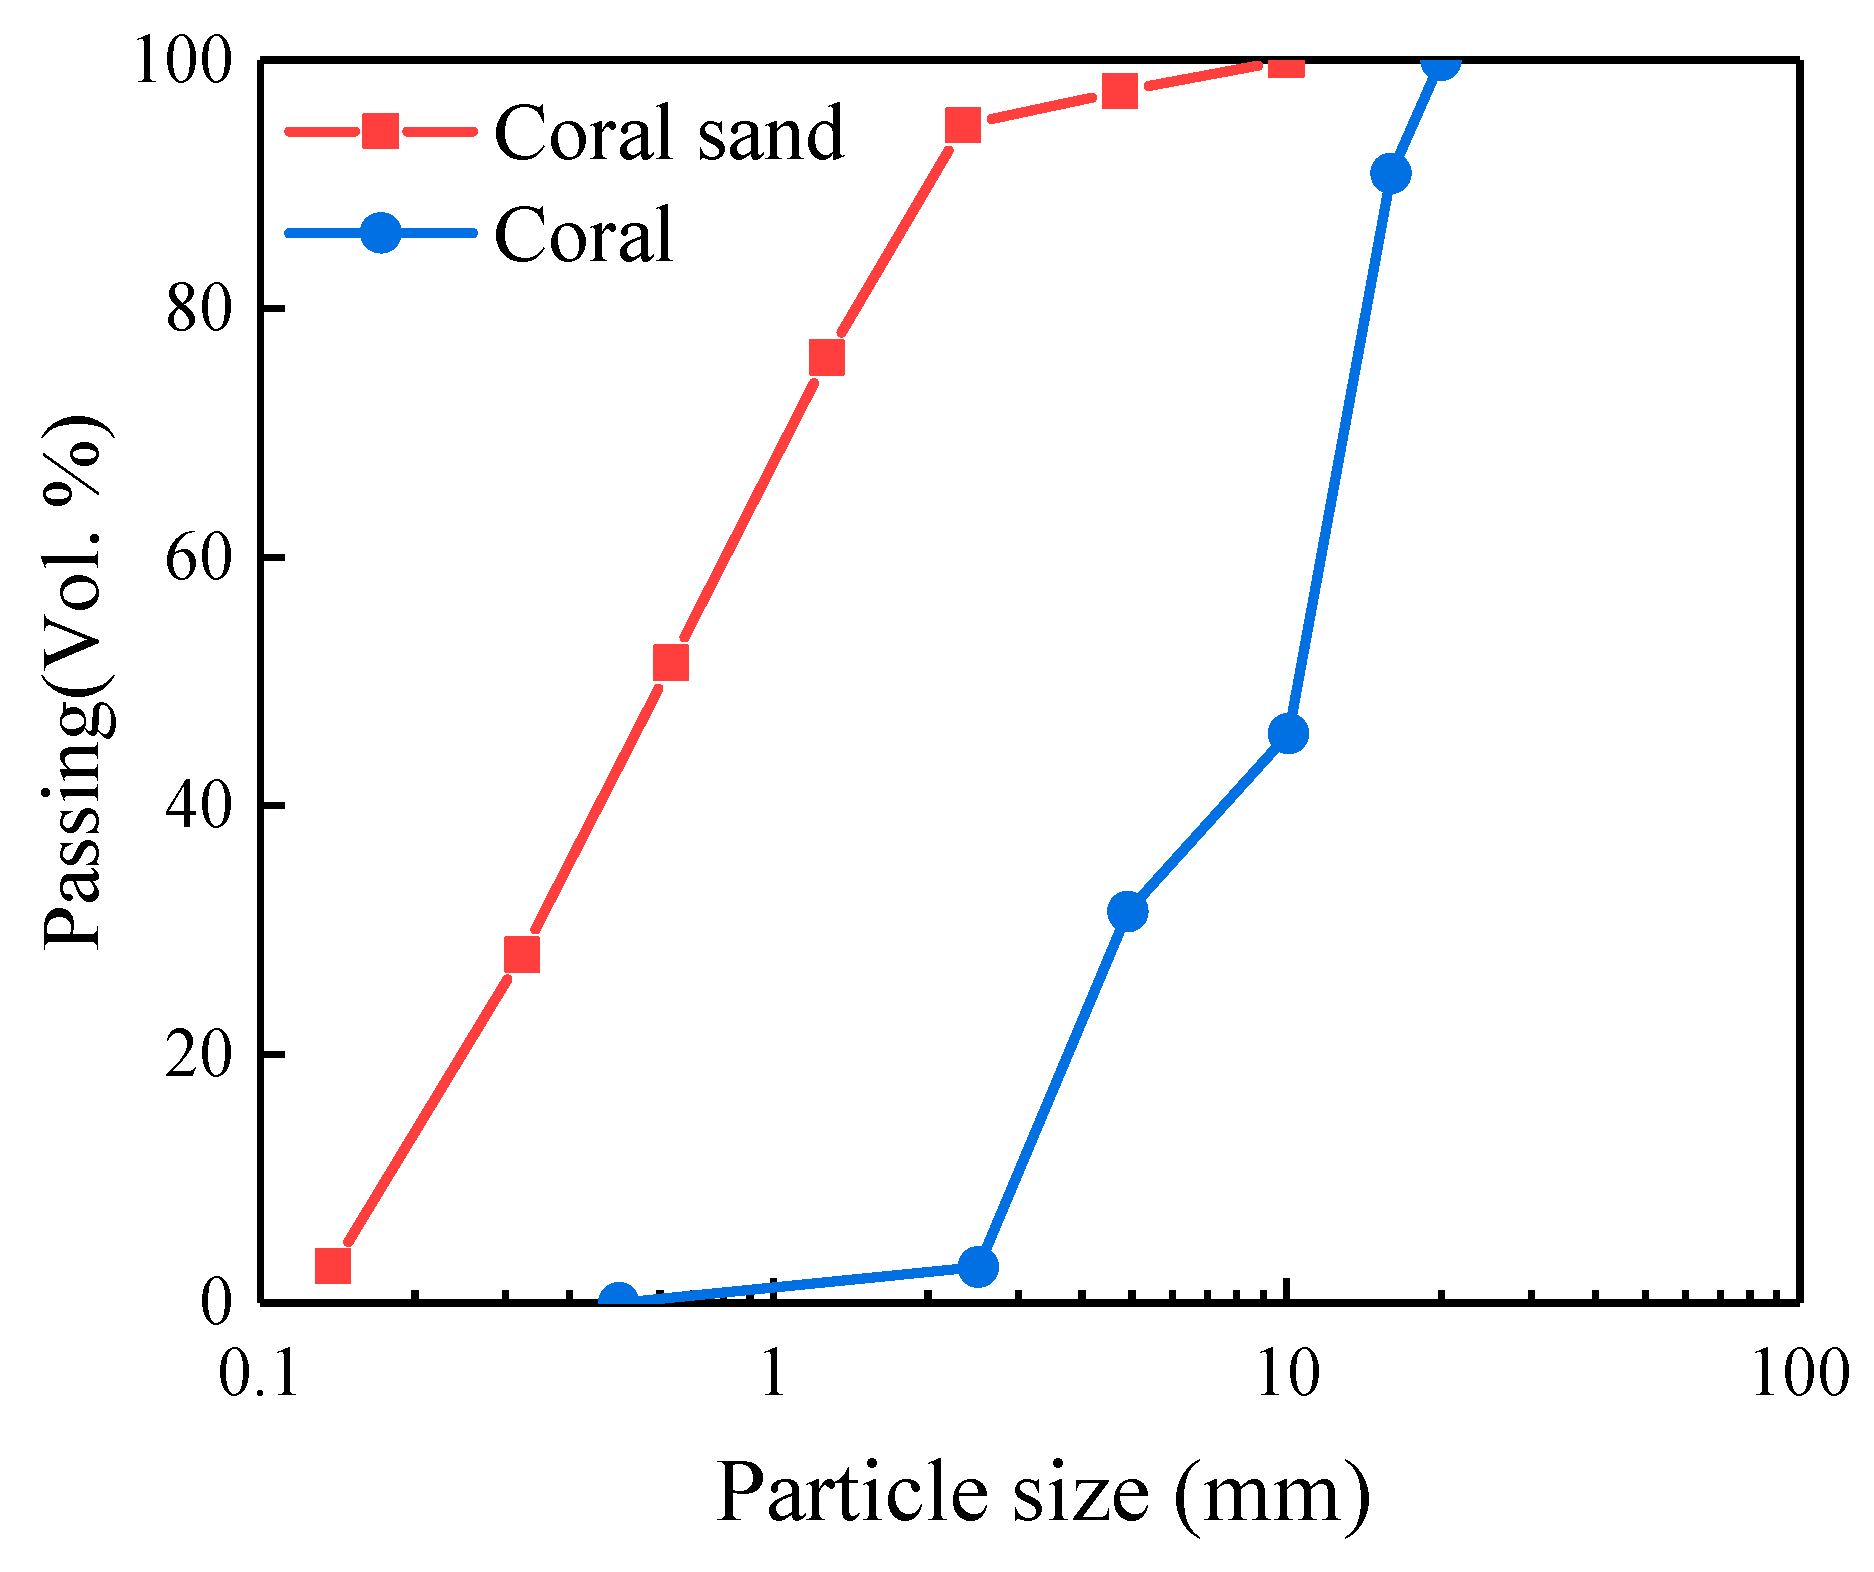
2.1. Raw Material and Basic Properties

In this paper, coral (Figure 1a) and coral sand (Figure 1b) from the beach of an island reef in the South China Sea were used as coarse and fine aggregates, respectively. The coral was processed to continuous gradations ranging from 5 mm to 20 mm (Figure 2) by crushing until the coral sand had a Zone II grading (Figure 2). The physical and mechanical characterization of coral and coral sand is shown in Table 1. The cement used was 42.5R ordinary silicate cement and the FA was Class I fly ash produced by Guangxi Qinzhou Power Plant; the specific chemical composition is shown in Table 2 and the basic physical and mechanical properties of the cement are shown in Table 3. Seawater from an island harbor was selected as the mixing water, the chemical composition of which is shown in Table 4.

2.2. Preparation of Specimen
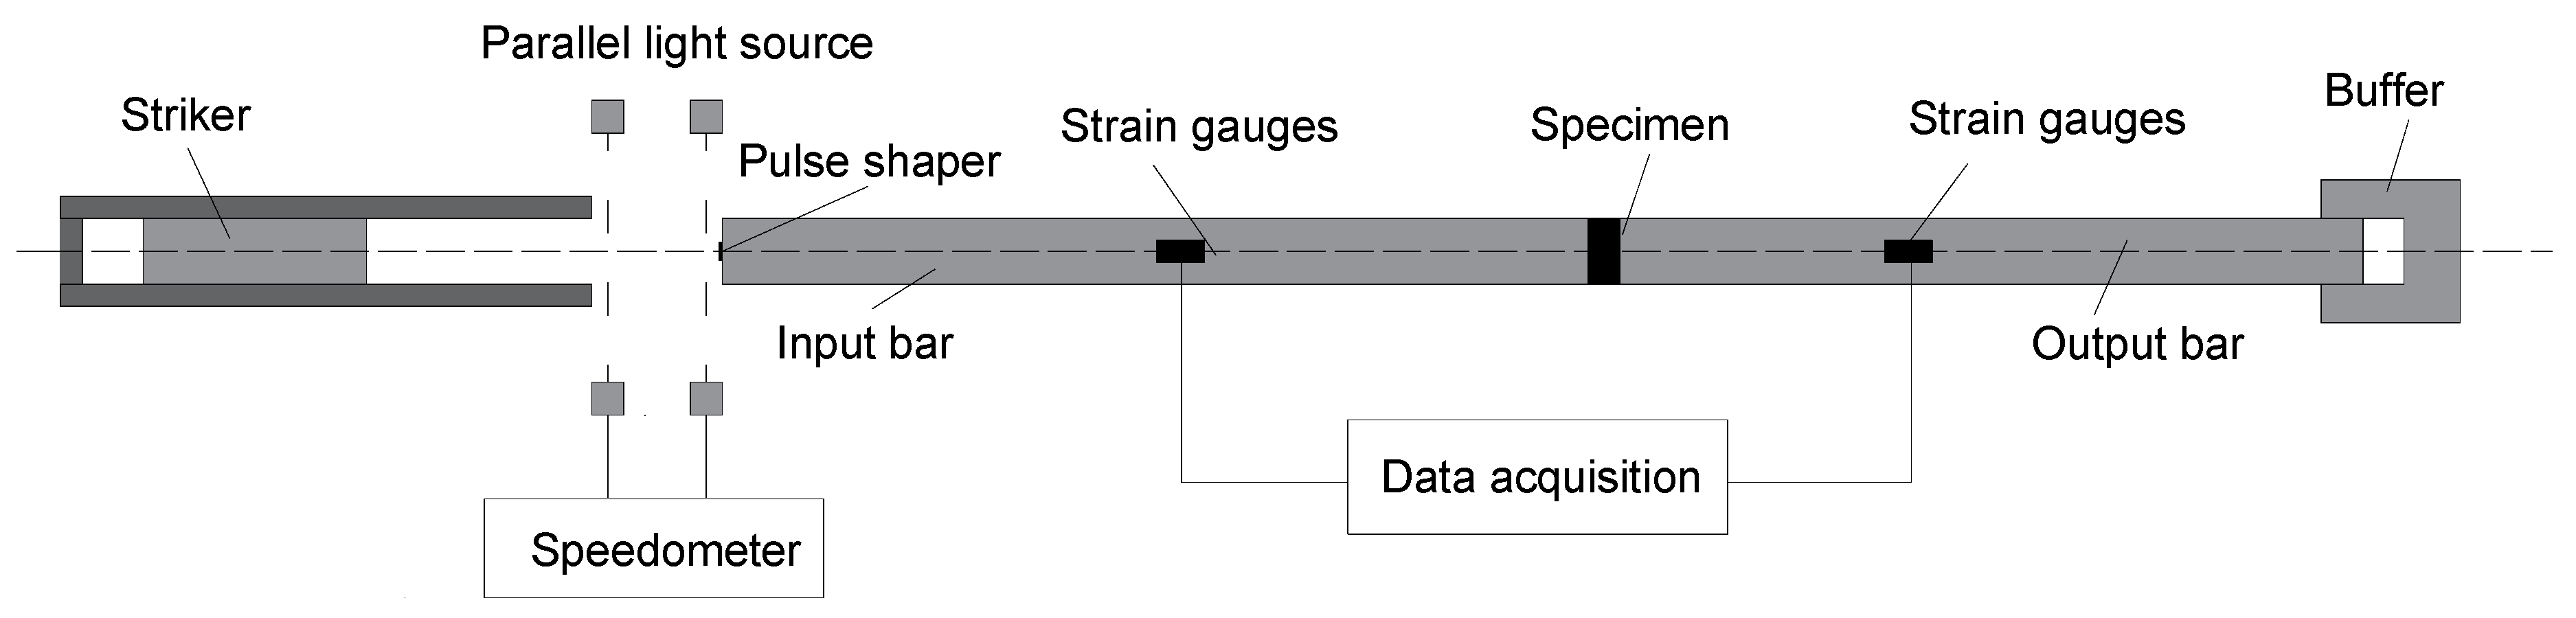
The mixing process was carried out in a forced mixer which was well moistened by seawater and highly water-proofed with a mixing ratio as shown in Table 5. Coral and coral sand were mixed dry for 3 to 5 min, then cement, fly ash, the water reducer, and the remaining seawater were added and mixed wet for 2 min, and the mixture was finally discharged to determine the slumps. The mixture was put into the mold and placed on a vibration table for vibration compaction. The mold was removed after 1d curing, and the sample was placed indoors at a temperature of 20 ± 2 °C for 28 days to cure naturally. The cubic concrete was cut and polished to obtain a cylindrical specimen with a diameter of 70 mm and a height of 35 mm. The parallelism tolerance of the specimen’ surface was kept under 0.02 mm to mitigate the influence of size effects on the test results. To calculate the dynamic increase factor (DIF), a corresponding compression test was conducted on a Ø70 × 70 mm cylinder specimen.

2.3. Test Method

A 75 mm diameter Split Hopkinson Pressure Bar (SHPB) apparatus was used to perform dynamic impact experiments on CASC, as shown in Figure 3. The complete apparatus consisted of a bar system, a power drive system, and a test system. Constituents of the bar system were a striker bar, an incident bar, a transmission bar, and the buffer bar. The bar system is constructed from stainless steel, featuring an elastic modulus of 210 GPa and a density of 7850 kg/m3. The length of the incident bar, transmission bar, and buffer bar were 3450 mm, 1950 mm, and 600 mm, respectively. The power drive system included a bullet launcher and a high-pressure nitrogen cylinder. The test system consisted of strain gauges attached to the incident and transmission bars, a dynamic data measurement and acquisition system, and a laser velocimeter.
The velocity of the bullet was determined by air pressure, which was controlled by adjusting the valve of the nitrogen cylinder. The strain gauges attached to the incident bar recorded the incident wave ε i t . When the stress wave reached the end face of the incident bar in contact with the specimen, part of it reflected back to form a reflected wave ε r t , which was still recorded by the strain gauges attached to the incident bar. The other part propagated through the specimen to the transmission bar, where the transmitted wave ε t t was recorded by the strain gauges attached to the transmission bar. The strains recorded by the strain gauges were collected by the DH3802-1 Dynamic Signal Analysis System and stored in a computer. Vaseline was applied to both the specimen and the end face of the bars to reduce the end friction effect.
The bars used in the bar system in the SHPB were of the same material and cross-sectional area. In accordance with the one-dimensional elastic wave theory [21] and the assumption of axial stress uniformity [22], the equations for strain, strain rate, and stress are as follows:
σ s = E A A 0 ε t
ε s = - 2 C 0 l 0 0 t 0 ε r d t
ε ˙ s = - 2 C 0 l 0 ε r
where E represents the elastic modulus (GPa); A represents the cross-sectional area (mm2); C0 represents the 1D longitudinal stress wave velocity (m/s); and ε i , ε r , and ε t are the incident, reflected, and transmitted pulse signals, respectively.

3. Experiment Results and Discussion

3.1. Validation of Data

Prior to data processing, it is essential to conduct a stress balance verification for each data set to guarantee the reliability of experimental data. In this paper, the stress uniformity assumption is satisfied by pasting a rubber wave shaper at the loading end of the incident rod, allowing the stress waves to propagate through the specimen for more than four cycles [23]. Figure 4 presents a waveform diagram illustrating the three waves: the incident wave εi(t), the reflected wave εr(t), and the comparison waves. During the rising section, the primary focus lies in observing the overlap between εi(t) and εr(t). If these two waves coincide well during the ascending section, it indicates that the data are dynamically stressed. On the other hand, in the falling section, the damage within the specimen becomes more severe and non-uniform, thereby deviating from dynamic equilibrium. Consequently, matching the comparison and transmission waves becomes challenging. Considering the cost and precision, some studies [24] are compromised when examining the rising section to meet the validation requirements during data verification.

3.2. Quasi-Static Compressive Strength

The damage patterns of CASC with varying strength grades under quasi-static loading conditions are shown in Figure 5. Despite the difference in strength grades, the CASC specimens exhibited similar failure modes. Upon experiencing damage, the specimens exhibited the formation of multiple oblique cracks oriented at an angle to the longitudinal loading direction, indicating shear fracture mode.
It can be obtained from Figure 5 that the lower the strength grade of CASC, the more severe the damage pattern. The cracks propagated directly through the coral aggregate, and this can be attributed to several reasons. One of the contributing factors is the unique properties of the coral aggregate, including its lower strength, high porosity, and good water storage capacity.
During the subsequent hydration of the cementitious material, the water absorbed by the coral aggregate is continuously released, resulting in a continuous hydration of the cementitious material surrounding the coral aggregate. Both the mortar and the ITZ consequently become stronger than the coral aggregate itself. Additionally, the porous and rough surface of the coral aggregate enhances the mechanical interlocking between the aggregate and the mortar. This mechanical bite between the two materials further promotes crack propagation directly through the coral aggregate. In contrast, when ordinary Portland concrete is subjected to pressure loading, the cracks tend to propagate along the weaker zones surrounding the aggregate, rather than directly through the aggregate itself.

3.3. Stress–Strain Curve of Dynamic Impact

The stress–strain curves of the CASC with varying strength grades are given in Figure 6. The strain rates range from 34.0 s−1 to 109.0 s−1. It is observed that the shape of the dynamic stress–strain curve for CASC exhibits similar variations with strain rates across different strength grades. The dynamic compressive strength along with the peak strain (the strain value corresponding to the peak stress) and the toughness index (the area under the curve), increase as the strain rate increases. These trends are documented and quantified in Table 6, which provides the relevant mechanical parameters for CASC.
In the impact experiments conducted using the SHPB apparatus, it is noted that the strain rate varied among specimens under the same air pressure. However, the difference in strain rates was relatively small, so this paper will not discuss the relationship between air pressure and strain rate. Figure 6 clearly demonstrates that the strain rate has a greater influence on the rising section of the stress–strain curve. As the strain rate increases, the rate of stress reduction after reaching the peak stress on the dynamic stress–strain curve gradually decreases. This indicates that the material exhibits more pronounced ductile deformation characteristics at higher strain rates.

3.4. Effect of Strain Rate

It is presented in Section 3.3 that CASC has a significant strain rate effect, with the peak stress increasing as the strain rate increases. Numerous studies have proposed different explanations for the strain rate effect. The crack propagation effect [25] refers that under high strain rate conditions, deformation occurs rapidly and a single macrocrack in CASC lacks adequate time to propagate, and the energy created by external loading is purely dissipated through the formation of more tiny cracks. Furthermore, the energy used to generate cracks is much greater than that used to propagate cracks. The lateral inertia effect [26] refers to the fact that as the strain rate increases, the CASC is subjected to a limiting pressure due to the limitation of transverse deformation, resulting in an increase in the dynamic stress and the DIF of the CASC. This study argues that the primary reason for the strain rate effect in concrete specimens is the presence of numerous micro-cracks. Under impact load, these cracks undergo damage evolution. As the strain rate increases, the cracks inside the concrete specimen do not have time to fully expand, resulting in its internal energy not being dissipated in a short period of time, and the energy accumulated within the specimen at the moment of impact increases, resulting in a higher stress state.
The DIF is commonly used to characterize the strain rate effect on the dynamic mechanical properties of cementitious materials [27]. Figure 7 summarizes the DIF versus strain rate for varying strength grades of CASC. The growth rate of the DIF is essentially equal for all CASCs, with the value of the DIF becoming smaller with the increased strength grade at the same strain rate. The dynamic stress of CASC with a high strength grade is slightly larger than the quasi-static stress of CASC under a high-velocity impact due to the high brittleness of mortar and a lower volume rate of aggregates. In contrast, lower strength grades of CASC, with higher volume rates of aggregates in the specimens, lead to higher porosity within the concrete and higher energy aggregation within the specimens, which exhibit high dynamic stresses at high strain rates and a higher DIF.
The equation widely recognized for DIF calculation internationally was proposed by the European Committee for Concrete (CEB) [29] and is presented below:
CEB :   D I F = ( ε ˙ / ε ˙ s a t ) α ε ˙ s a t < ε ˙ 30 s 1   β ( ε ˙ / ε ˙ s a t ) 1 / 3 ε ˙ > 30 s 1
Many scholars have given a number of representative models, as shown in Figure 8, such as C. A. Ross et al. [30], J.W. Tedesco et al. [31], Fujikake et al. [32], and Al-Salloum [33]
Tedesco :   D I F = 0 . 009651 lg ε ˙ + 1.058 ε ˙ 63.1 s 1   0.7581 lg ε ˙ 0.289 ε ˙ > 63.1 s 1
Fujikake :   D I F = exp ( 0.00126 × lg ( ε ˙ / ε ˙ s a t ) 3.373 )
Al - Salloum :   D I F = 3 . 248 ε ˙ + 77 . 946 ε ˙ + 75 . 763
where ε ˙ is dynamic strain rate, ε ˙ s a t is static strain rate, and α and β are the fitted parameters, respectively, ε ˙ sat = 3 × 10 5 s 1 .
One can discern that the experimental data in this paper have a large error compared to the models of Fujikake and Al-Salloum, while the data points are among the CEB and Tedesco model curves. This research re-evaluates the relationships between the DIF and strain rates for CASC using both experimental data and literature sources, with the most recent fitting results presented in Table 7.
D I F = α ( ε ˙ / ε ˙ s a t ) β  
where α   and β are the fitted parameters.

3.5. Toughness Index

The toughness and fracture energy are calculated from the area beneath the complete dynamic stress–strain curve. This measure provides quantitative information about the energy absorption characteristics of CASC during impact events, as seen in Table 6.
From the results, the strength grade significantly influences the toughness index. This effect is evident when examining the connection between toughness and strain rate for different strength grades of CASC, as shown in Figure 9. It is observed that as the strain rate increases, the toughness index of CASC also exhibits an increase. Additionally, the increment of the strength grade influences the increasing rate of the toughness index. Higher strength grades correspond to a more marked enhancement in the toughness index.
The graph effectively illustrates the correlation between the toughness index and the strain rate across different compressive strength ranges (30–80 MPa). There is a relatively sharp increment in the toughness index between strength grades 50 MPa and 60 MPa. However, the toughness index is not sensitive to higher strength grades under a strain rate of 70 s−1. The change in strength grades only contributes to the increase in the toughness index, as a magnitude from 0.1 to 0.6. Using a threshold value, when the strain rate exceeds 70 s−1, the strength grade of CASC significantly impacts the increase in the toughness index. This effect is notably more distinct for high-strength CASC. At a strain rate of 140 s−1, the toughness index of high-strength CASC increases two times faster compared to that of normal-strength CASC. This is due to the fact that according to the slurry-rich principle, high-strength CASC can be obtained by increasing the amount of cement per unit volume of concrete. The fine aggregate fraction of high-strength CASC is mixed with coral fine sand of different gradations. High-strength CASC has a low aggregate volume rate and most of its composition is mortar, which has a higher compression strength compared to coral aggregate. The mortar part can absorb more energy than the aggregate part and exhibits higher toughness at high strain rates where more energy is required for the propagation of internal cracks.
The figure demonstrates that the data on the toughness index of CASC, gathered from this study and other researchers, fit accurately with an exponential function.
Experimental data points are fitted using Equation (7) as described below:
η = e α + β x  
The specific fitting parameters and results are shown in Table 8.
The stress–strain curve of high-strength CASC can be treated as two phases based on the zenith point of stress. The integration of these two sections represents the overall toughness of the CASC specimen under impact loading. To evaluate the distribution of energy absorption during impact, the peak toughness ratio is established as the proportion of the toughness value prior to peak stress relative to the total toughness value of the CASC. Similarly, the post-peak toughness ratio is the proportion of the toughness value following peak stress relative to the total toughness value.
A high pre-peak toughness ratio indicates that a significant portion of the absorbed energy is primarily utilized to enhance the material’s strength. Conversely, a high post-peak toughness ratio implies that the energy is primarily expended on crack propagation, thus escalating the level of failure in the CASC specimen.
The relationship between the pre-peak and post-peak toughness ratio and strain rate is shown in Figure 10. The results clearly illustrate that the CASC with a strength grade of 40 MPa exhibits a toughness ratio above 1, indicating a higher pre-peak toughness. Conversely, for the CASC with a strength grade of 50 MPa, the toughness ratio falls below 1, demonstrating a higher post-peak toughness. This observation indicates that brittleness in CASC escalates with higher strength grades, where the energy to achieve peak stress is less than the energy needed for initiating and propagating subsequent cracks. The higher-strength CASC possesses a higher amount of mortar per unit volume, resulting in increased energy consumption for crack expansion. Consequently, the higher mortar strength of CASC with higher strength grades leads to a higher expenditure of energy during crack propagation.
The ratio of pre-peak to post-peak toughness in CASC demonstrates non-monotonic behavior as the strain rate increases. Specifically, as the strain rate increases, the pre-peak to post-peak toughness ratio initially decreases and then increases. To emphasize, when the strain rates vary between 70 s−1 and 80 s−1, the pre-peak to post-peak toughness ratio reaches its lowest value. This observation suggests a transition exists in the damage mode of CASC, with an increased tendency for failure within the specimen.

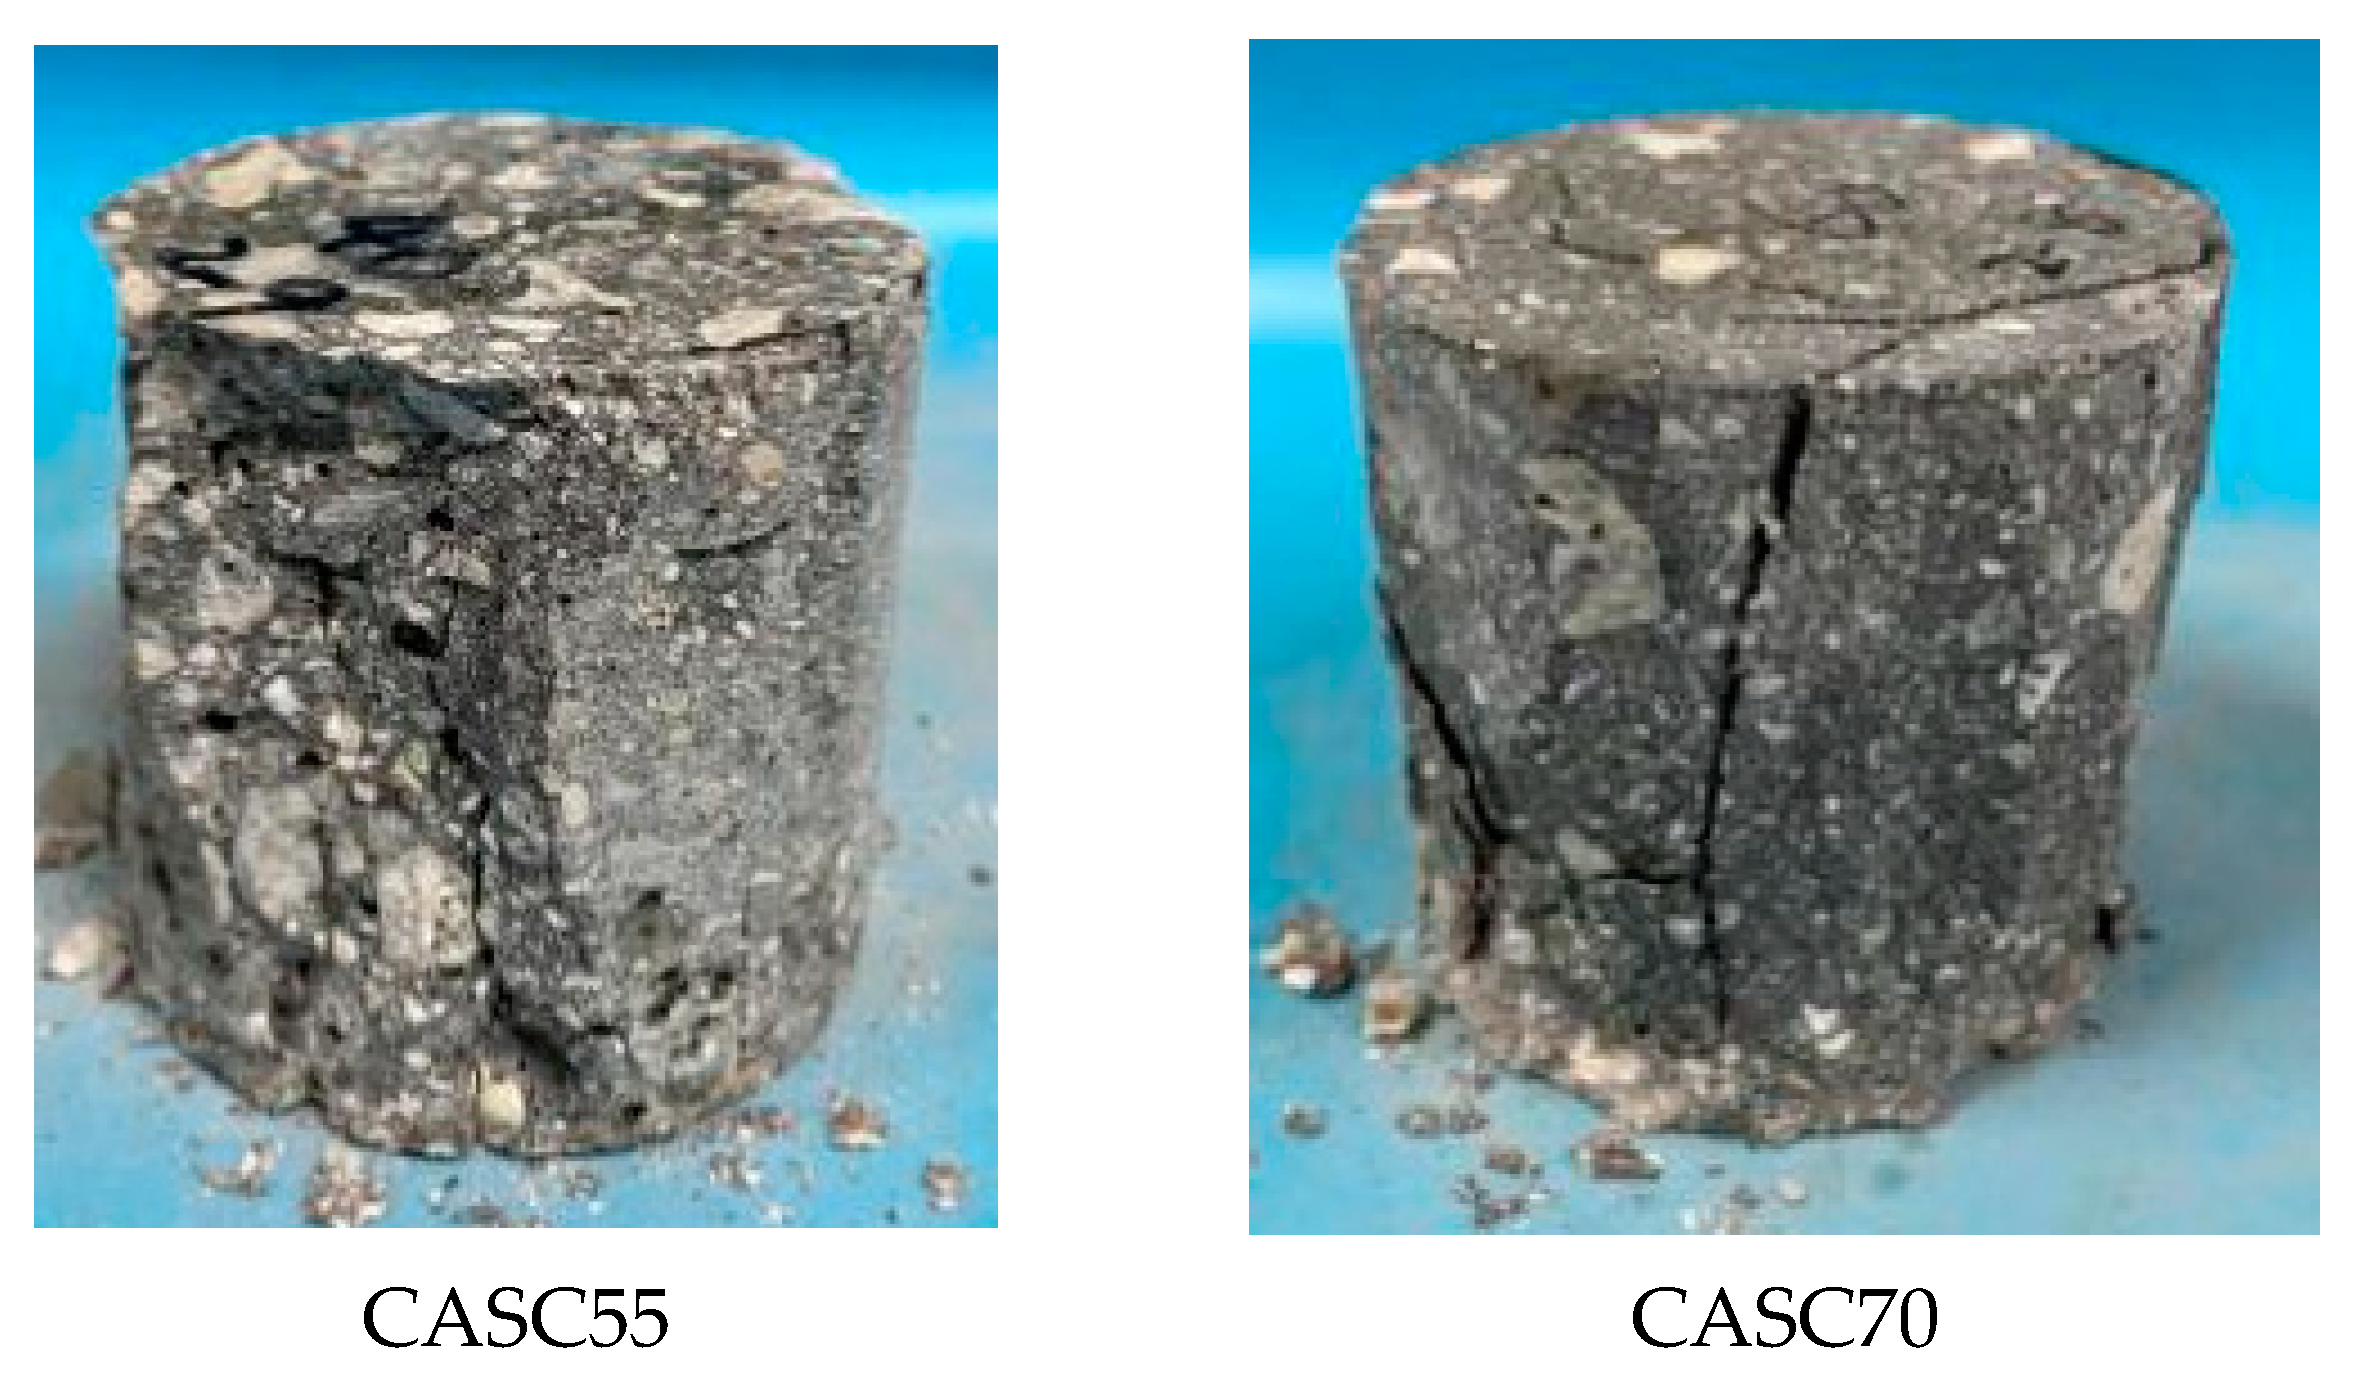
3.6. Failure Pattern

Figure 11 shows the damage pattern of CASC at different air pressures with different strength grades. The destructiveness of the specimen, as observed in Figure 11, escalates with an increase in impact air pressure.
These patterns resemble those observed in OPC. The summary of the analysis in the diagram shows that there are four damage patterns in concrete, which are described as follows. (a) Unbroken state. At lower strain rates, the tensile stresses in the concrete do not reach the levels needed for the growth of internal micro-cracks. Consequently, the specimens remain complete and display no surface cracks at this stage. (b) Initial cracked failure state. With an increase in strain rate, surface cracks begin to form and a slight amount of debris detaches from the specimen’s edges. (c) Cracked failure state. With higher strain rates, the quantity of cracks and fragments escalates, with axial penetration through the specimen creating numerous columnar fragments. By this stage, the specimen is significantly damaged, exhibiting a multitude of cracks. (d) Crush damage state. When the strain rate reaches a certain threshold, the specimen under impact divides into columnar fragments, which are then compressed into smaller pieces by the substantial impact load.
The higher the strength grade, the lower the degree of damage to the specimens. At high strain rates, the CASC with a compressive strength of 80 MPa only broke into large fragments, resulting from the large amount of cementitious material per unit volume of high-strength CASC and the high strength of the mortar, leading to the greater energy required for crack expansion in the mortar part. High-strength CASC specimens require a higher strain rate than low-strength CASC under impact compression to achieve the fourth damage pattern.

4. Numerical Study

A three-dimensional mesoscopic model of CASC was developed, which incorporated the random geometry, size, and layout of aggregates. The validity of the model was confirmed by comparing experimental results with numerical analyses conducted on cylindrical specimens subjected to dynamic impact.

4.1. Modeling of Geometry

In engineering applications, concrete is a complex multiphase material, but when mesoscopic modeling is carried out, it is a common assumption among scholars to consider concrete as composed solely of coarse aggregate, cement mortar, and the interfacial transition zone (ITZ) between them, as shown in Figure 12.
The size, shape, and position distribution of the coarse aggregates in the model were randomized in order to correspond to the realistic aggregates. The hybrid isomorphism algorithm [34] and the random octahedron generation algorithm [35] were used to model the 3D random convex polyhedra in the concrete model. The specific process is a stochastic placement of aggregate models in a unit space, with each aggregate center saved as a 3D coordinate, and the generation of aggregates is described in the literature [36]. The algorithm determines the overlap between adjacent aggregates to ensure that there is no overlap between the aggregates and also determines the boundary between the aggregates and the unit space to make sure that the generated aggregates do not exceed the spatial boundary.

4.2. Material Properties

After the finite element model is generated, the properties of elements are identified by the material identification algorithm [37], to determine the mortar, aggregate, and ITZ elements in the mesoscopic model. The aggregate’s material behavior was replicated using the JHC material model (MAT_111 in LS-DYNA) [38]. Additionally, the material properties of mortar and ITZ were simulated using the K&C material model (MAT_72 in LS-DYNA) [39]. Holmquist and Johnson proposed the HJC model, which took into account various factors such as pressure, strain rate, material failure index, etc., and was suitable for describing material response under high-speed dynamic loads.
The simulation parameters used to calculate the coral aggregate [30] were determined as follows: compressive strength fc = 10 MPa, tensile strength ft = 1.2 MPa, Young’s modulus E = 5.7 GPa, and Poisson’s ratio μ = 0.15, and mass density ρ = 2557 kg/m3.
The K&C model was utilized to investigate the response of complex concrete structures subject to large deformations and blast loading. Three new fixed surfaces were implemented [39], each characterized by three new parameters, as shown below.
Yield   failure   surface   Δ σ y = a 0 y + P a 1 y + a 2 y P
Maximum   failure   surface   Δ σ m = a 0 + P a 1 + a 2 P
Residual   failure   surface   Δ σ r = P a 1 f + a 2 f P
The mortar exhibited varying parameter values based on different proportions [30]: a compressive strength of 70.4 MPa, Young’s modulus of 36 GPa, tensile strength of 5.5 MPa, a Poisson’s ratio of 0.25, and a mass density of 2350 kg/m³. The material properties of the ITZ were obtained through mortar microscopic experiments [40]: a compressive strength of 55.1 MPa, a Poisson’s ratio of 0.25, Young’s modulus of 22.6 GPa, and a mass density of 2350 kg/m3.

4.3. Finite Element Meshing

Fang and Zhang [41] suggested in their work that the element size should be determined according to the smallest aggregate size (Aggmin). They proposed selecting 1/4 to 1/8 of Aggmin as the element size to enhance computational efficiency, as illustrated in Figure 13. According to other studies on element size [42], was found that the size of the element has a significant effect on the computational time and computational accuracy. Finer mesh improves the damage pattern to be more detailed and realistic. Meanwhile, the computational cost substantially exploded. Weighing pros and cons, in this paper, the thickness of ITZ was set to 2 mm as a choice after considering the computational efficiency as well as the model accuracy, which is a suitable size for the numerical simulation under impact compression.

4.4. Boundary Conditions

To describe the interactions between various components in a mesoscopic model, the contact keywords in LS-DYNA can be employed to define the contact behaviors at different interfaces. The interface contact relationships involved in this study included the interactions among various mesoscopic components within concrete, such as coarse aggregate, mortar, and the interfacial transition zone (ITZ). The *CONTACT_AUTOMATIC_SURFACE_TO_SURFACE keyword in LS-DYNA is a bidirectional contact model capable of simultaneously performing penetration checks between the master node-to-slave surface and slave node-to-master surface. This model is suitable for describing the contact relationships between two components under conditions of high-velocity impact and large deformations. Based on existing research results and experience, it is known that this model can effectively describe surface-to-surface contact between different material components. Therefore, this study utilized this model to simulate the following contact relationships.
The formula for its friction coefficient μ c is as follows:
μ c = μ k + ( μ s μ k ) e D C v r e l
where μ s and μ k are the static and dynamic friction coefficients, respectively; DC is the exponential decay coefficient; and v r e l is the relative velocity of the contact surfaces. The static and dynamic friction coefficients for all mesoscopic components are μ s = 0.7 and μ k = 0.9 , respectively.

4.5. Mesoscopic Results

We performed impact simulations on CASC at different strains, and our analysis focused on the stress–strain curve relationship, types of failure observed, failure process of different parts, and the effect of aggregate volume fractions.

4.5.1. Stress–Strain Curve of the CASC

Table 9 lists the peak stress and strain values obtained from both numerical simulation and experimentation. Figure 13 shows the stress–strain curves corresponding to Table 9.
Figure 14 and Table 9 show that the simulation and experimental results are in good consistency. The error in peak stress ranges from 0.3% to 3.5%. On the other hand, the error in peak strain is relatively large, spanning from 2.3% to 46.2%, and can be attributed to the following reasons: (1) System errors that occurred during testing may have influenced the experimental results. (2) The discrepancy between the failure mode of the simulation and the test setup may have contributed to strain errors.
The simulation outcomes showcase how the strain rate influences CASC, affirming the mesoscopic model’s capability to precisely replicate the dynamic impact behavior of CASC under different strain rates.

4.5.2. Failure Pattern and Failure Process

Figure 15 shows the failure process of the CASC at different conditions. The range of effective plastic strain is from 0 to 0.02 and the range of simulated strain rate is from 51.8 s−1 to 102.9 s−1.
The basic characteristics of the simulated failure pattern of the specimen are consistent with those of the test results described in Section 3. The strain rate exerts a significant influence on the failure pattern. With an increase in strain rate, there was a notable escalation in both the specimen’s damage degree and the number of cracks and small fragments. The specimen was still intact with small cracks generated on the surface at 51.8 s−1. However, when the strain rate rose to 72.2 s−1, the specimen broke into rough-shaped chunks. When the strain rate increased to 102.9 s−1, the specimen fragmented into a large amount of pieces, with cracks visible on the aggregate and fractures occurring along the loading axis. The failure pattern observed in coral is consistent with findings reported in the literature [27]. Compared to the edge of the specimen, the effective strain near the center was notably higher, while the effective strain and degree of damage of the aggregate at the edge were lower than those at the center. This occurs because the horizontal effect limits the deformation of the central part. Some aggregates remained undamaged at the conclusion of the test, with cracks forming at the edge of the aggregate and failure transpiring in the weaker areas of the mortar.

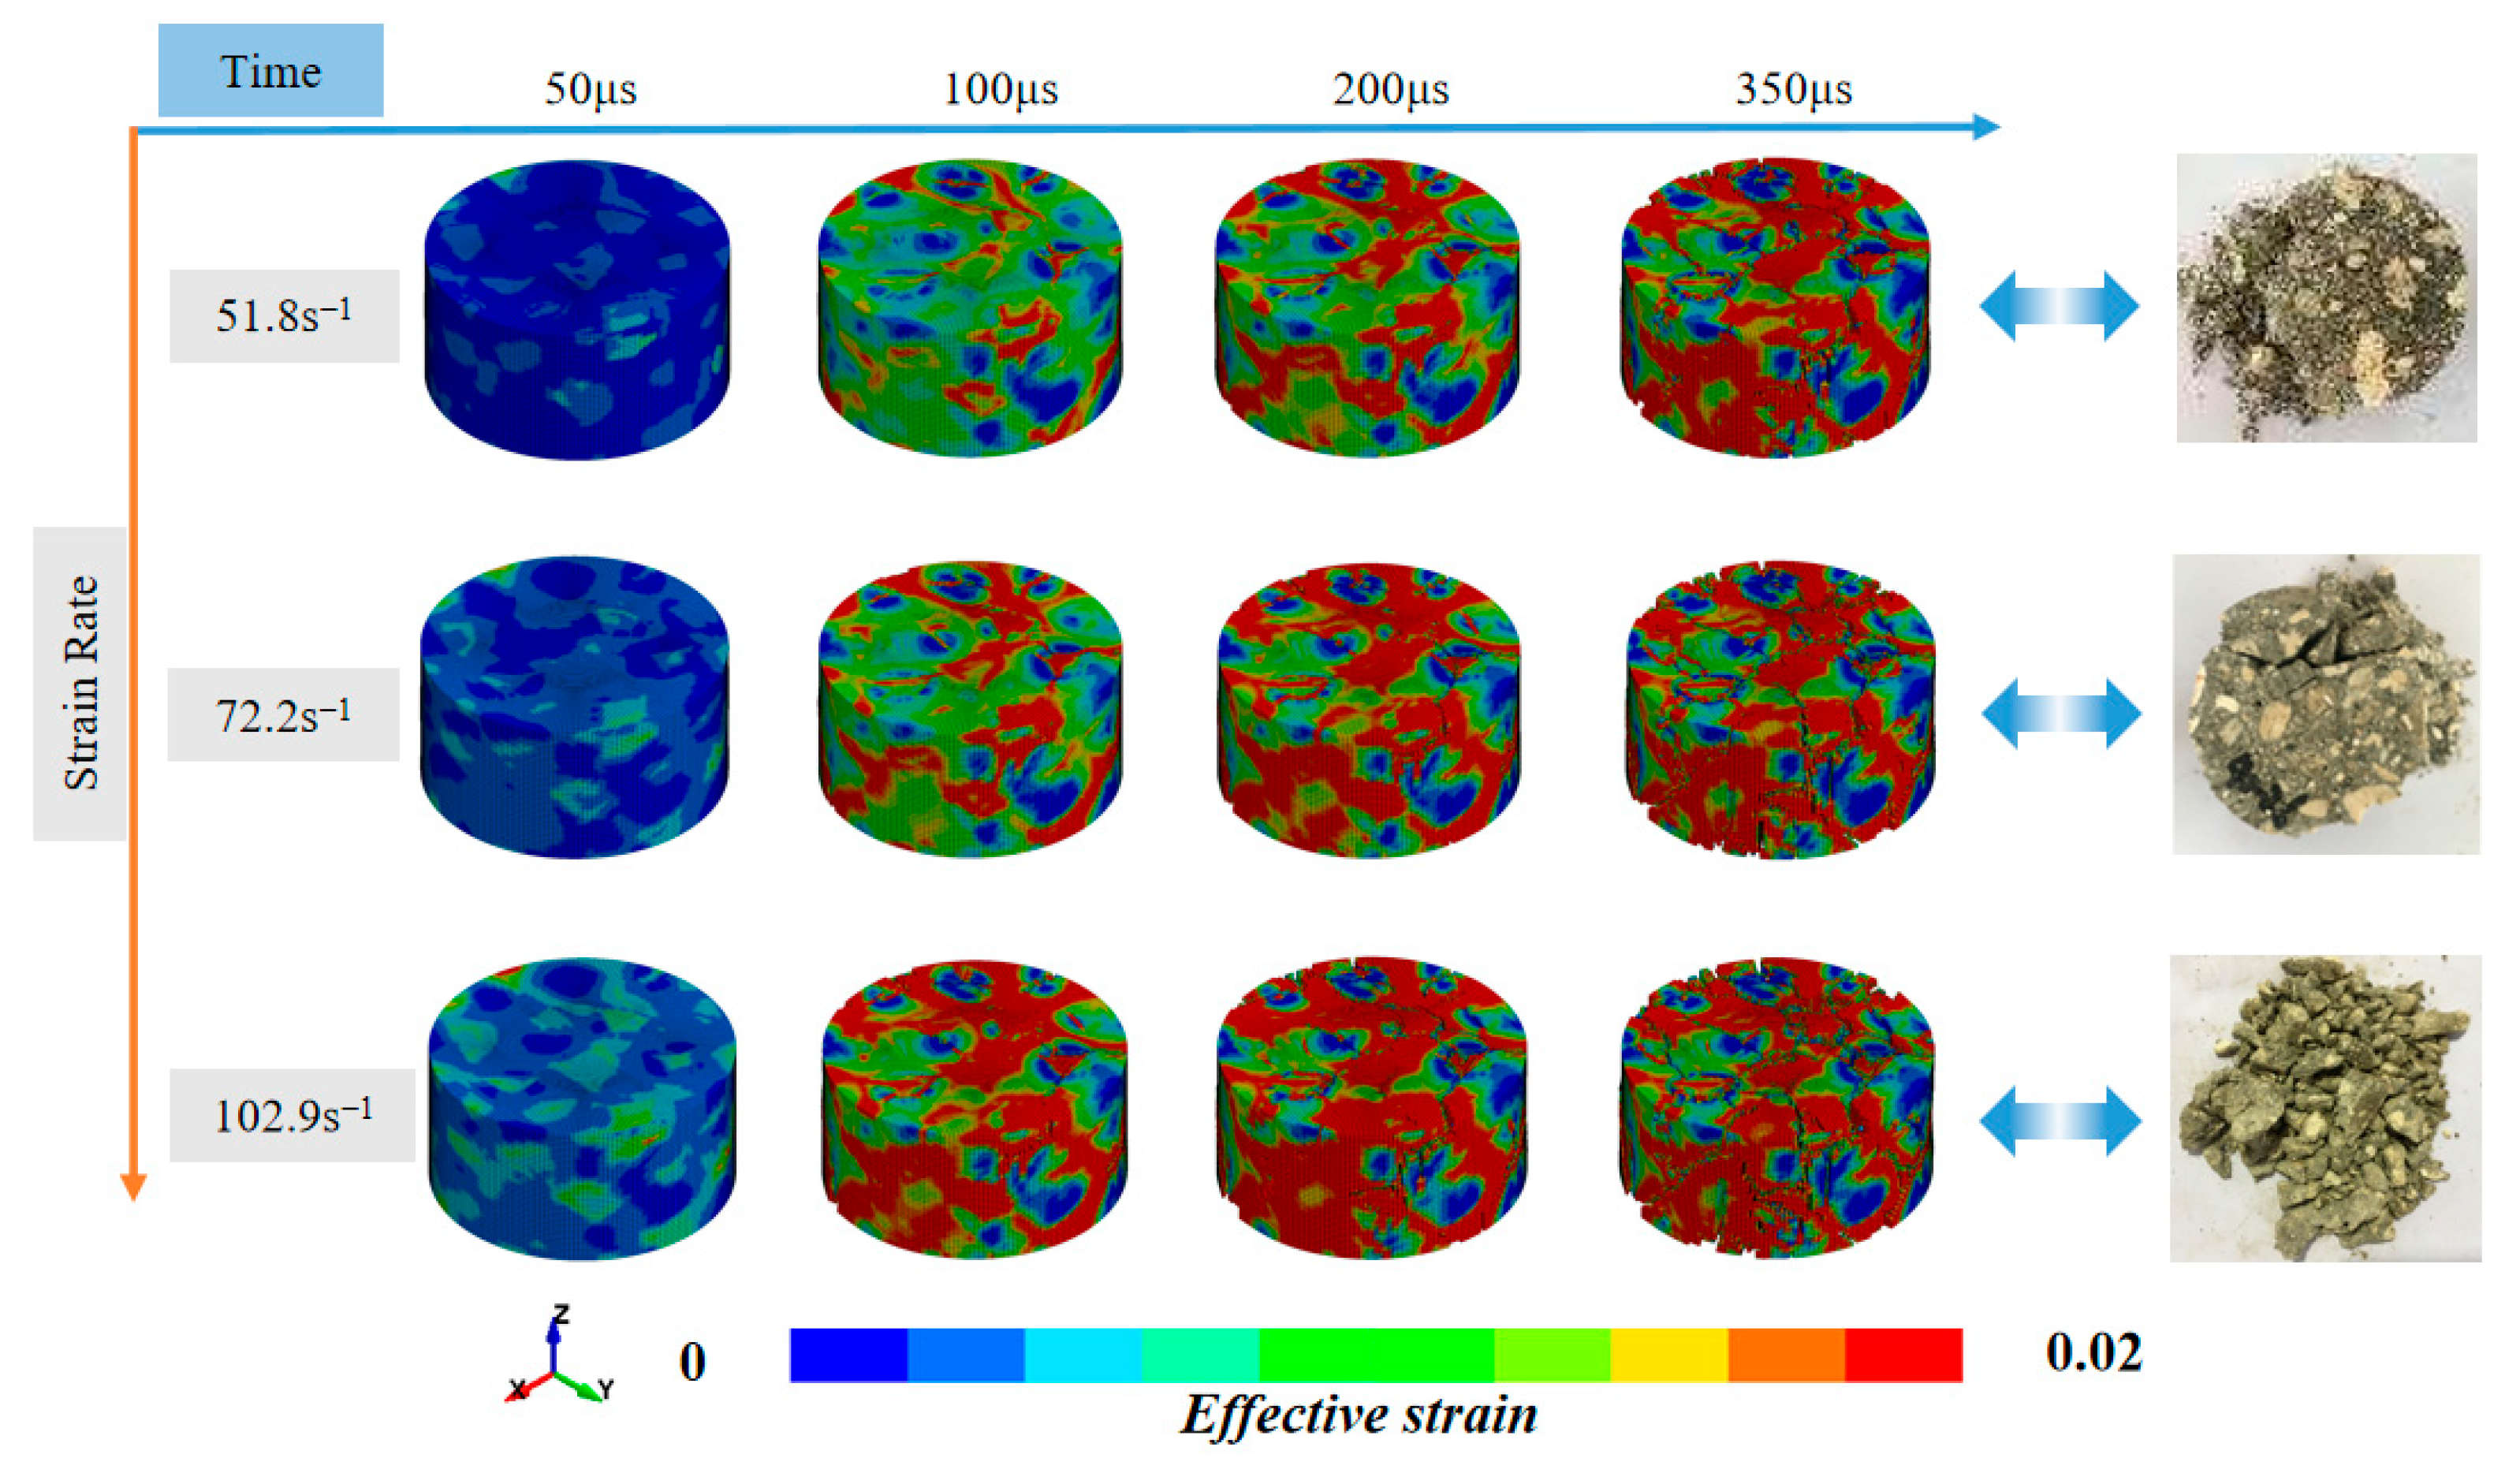
4.5.3. Failure Process of CASC

Figure 16 illustrates the failure process of different components under dynamic impacts at high strain rates. Crack development is observed on the surface.
The red and blue segments represent large and small effective strain, respectively. Figure at 50 μs shows the damage in the mortar part is less than that of the aggregate and ITZ. The color of the aggregate unit near the periphery of the aggregate part is greenish, which is due to the low strength of the coral aggregate and the large number of micro-pores inside the aggregate that are not plugged. During high-speed impact, the peripheral aggregates were the first to be damaged under the effect of lateral restraint, while the ITZ between aggregate and mortar was also damaged due to the low strength. With the increase in time, at 100 µs, the damage had occurred at the edge of the aggregate, and the cracks went directly through the aggregate, which, as mentioned earlier, is caused by the porous and low-strength properties of the coral. In contrast, only a portion of the ITZ and mortar parts had higher strain and did not produce obvious cracks. At 350 μs, most of the aggregates had been destroyed and a large number of surface primary cracks were produced in the mortar section, and the specimen broke into many fragments. The damage of ITZ exceeded that of aggregate at this point, which is due to the fact that the strength of ITZ is much lower than that of the mortar and the thickness of the ITZ is thin. Either internal micro-cracks or main cracks on the surface cause damage to the ITZ part. The damage pattern of the numerical simulation at a high strain rate is similar to that in the experimental part of the previous paper, which proves that the mesoscopic model developed in this paper can well describe the damage process of different components of coral aggregate concrete under the dynamic impact.

4.5.4. Cracking Process of Different Aggregate Volume Fraction of CASC

Figure 17 compares the damage pattern of CASC in terms of a combination of 3 factors: strain rate (50 s−1, 100 s−1, 150 s−1), aggregate volume rate (15%, 20%, 25%, 30%), and damage time. The range of plastic strain is from 0 to 0.02. While the strain rate increases, the damage pattern of CASC is more severe at 250 microseconds, from a single micro-crack to a macro-crack, with an increase in crack width and number of cracks. This is similar to the results obtained from our previous experiments, in that at higher strain rates, the cracks within the concrete specimen do not have time to fully expand. This is explained as the high energy concentration in the specimen under the effect of instantaneous high-speed impact, which cannot be dissipated in a short time, making the damage pattern of the specimen more serious. At 50 microseconds, the higher the strain rate, the more obvious the stress concentration within the specimen and some micro-cracking had already occurred, with the ITZ around the aggregate being the weak link and showing damage before the rest. As the time increased, the CASC at low strain rates gradually developed some micro-cracks in smaller numbers, in contrast to the CASC at high strain rates where more main cracks of large width and length running through the whole specimen had already appeared. Unlike normal concrete, where the strength of the coarse aggregate used is high density, the coral in CASC has a lower strength and some of the main cracks ran directly through the whole aggregate, with the coral forming a complete section and the specimen showing overall crushing damage, consistent with the experimental results. With the increase in the aggregate volume rate, CASC suffered from more severe damage; the lower the aggregate volume rate, the more significant strain in the mortar part, but with relatively few surface cracks. Concrete with high aggregate volume rates, on the other hand, had similar damage patterns with wider main cracks and diagonal cracks following through the specimen, mainly due to the special brittleness of the coral, resulting in higher porosity throughout the interior of the specimen, with cracks more likely to develop along the weak link between the aggregate and mortar and along the pores.

5. Conclusions

(1)
The strength grade of CASC has a significant effect on the damage pattern under static and dynamic compression. The higher the strength grade of concrete, the less the damage degree of the specimens, unlike ordinary Portland concrete, where the cracks of CASC will be directly through the aggregate.
(2)
Coral concrete has a significant strain rate effect, and the DIF of CASC decreases with the increase in strength grade.
(3)
The toughness index of CASC grows with the increase in strain rate, and the trend of the toughness index with the strain rate can be obtained by fitting the exponential function. The growth rate of the toughness index changes significantly between the strength grade of 50 and 60 MPa.
(4)
In this paper, we propose to describe the energy absorption use of concrete in terms of the pre-peak and post-peak toughness ratios. The pre-peak to post-peak toughness ratio of CASC varies significantly in strain rates ranging from 70s-1 to 80s-1, indicating a change in the CASC damage mode and increased failure to the specimen.
(5)
A 3D random mesoscopic model which is composed of mortar, aggregate, and the ITZ is established to study the dynamic compression loading behavior of CASC. The feasibility of the proposed modeling method and model parameters is verified by comparing the failure mode, peak stress, and strain obtained in tests and numerical simulations.
(6)
Through the analysis of the numerical simulation analysis, it can be seen that the impact damage pattern of CASC at different strain rates is similar to the experimental results. The damage mode of CASC is investigated by varying the aggregate volume rate, and it can be obtained that the aggregate volume ratio has a greater influence on the failure mode of concrete. A percentage of 20% is a relatively reasonable aggregate volume ratio through numerical calculation.
Investigating the dynamic impact failure properties of CASC at different strain rates offers critical data support for island reef engineering projects. Future studies should broaden the range of examined strain rates and explore the degradation of CASC under varied external conditions, including elevated temperatures and chloride ion corrosion. Further research could also focus on the dynamic failure mechanisms of structures and connections subject to impact loading.

Author Contributions

Conceptualization, T.L.; Methodology, J.G., H.Y., H.M. and S.Q.; Software, J.G. and H.M.; Formal analysis, J.G.; Investigation, Resources, J.G., H.Y. and T.L.; Data curation, J.G., S.Q., T.L. and X.D.; Writing—original draft, J.G.; Writing—review & editing, H.Y., H.M., S.Q. and X.D.; Visualization, X.D.; Supervision, H.Y.; Project administration, H.Y.; Funding acquisition, J.G., H.Y. and H.M. All authors have read and agreed to the published version of the manuscript.

Funding

This research was funded by the National Nature Science Foundation of China (Grant No. 52078250, 52178190, 11832013, 51878350) and the Interdisciplinary Innovation Fund for Doctoral Students of Nanjing University of Aeronautics and Astronautics (Grant No. KXKCXJJ202302).

Data Availability Statement

The data presented in this study are available on request from the corresponding author (ethical reasons).

Conflicts of Interest

The authors declare that they have no conflicts of interest.

References

  1. Zhang, Y. Research on Dynamic and Static Mechanical Properties of Coral Aggregate Concrete; Nanjing University of Aeronautics and Astronautics: Nanjing, China, 2016. (In Chinese) [Google Scholar]
  2. Mrema, A.L.; Bungara, S.H. Achieving high strength high performance concrete from coral-limestone aggregates using ordinary Portland cement, fly ash and superplasticizer. In Proceedings of the 6th International Conference on Structural Engineering, Cape Town, South Africa, 5–7 September 2016; pp. 1380–1385. [Google Scholar]
  3. Yu, H.; Da, B.; Ma, H.; Zhu, H.; Yu, Q.; Ye, H.; Jing, X. Durability of concrete structures in tropical atoll environment. Ocean Eng. 2017, 135, 1–10. [Google Scholar] [CrossRef]
  4. Da, B.; Yu, H.F.; Ma, H.Y.; Tan, Y.S.; Mi, R.J.; Dou, X.M. Experimental investigation of whole stress-strain curves of coral concrete. Construct. Build Mater. 2016, 122, 81–89. [Google Scholar] [CrossRef]
  5. Cai, Y.; Ren, H.Q.; Long, Z.L.; Guo, R.Q.; Du, K.M.; Chen, S.S.; Zheng, Z.H. Comparison study on the impact compression mechanical properties of coral aggregate concrete and ordinary Portland concrete. Structures 2022, 44, 1403–1415. [Google Scholar] [CrossRef]
  6. Ma, H.; Yue, C.; Yu, H.; Mei, Q.; Chen, L.; Zhang, J.; Zhang, Y.; Jiang, X. Experimental study and numerical simulation of impact compression mechanical properties of high strength coral aggregate seawater concrete. Int. J. Impact Eng. 2020, 137, 103466. [Google Scholar] [CrossRef]
  7. Sivakumar, N.; Ananthi, G.B.G. Characterisation of domestically discarded vegetable waste biomass ash and silica sand mixed with ordinary Portland cement concrete. Biomass Convers. Biorefinery 2024, 1–15. [Google Scholar] [CrossRef]
  8. Kanagaraj, B.; Nammalvar, A.; Andrushia, A.D.; Gurupatham, B.G.A.; Roy, K. Influence of nano composites on the impact resistance of concrete at elevated temperatures. Fire 2023, 6, 135. [Google Scholar] [CrossRef]
  9. Philip, R.E.; Andrushia, A.D.; Nammalvar, A.; Gurupatham BG, A.; Roy, K. A comparative study on crack detection in concrete walls using transfer learning techniques. J. Compos. Sci. 2023, 7, 169. [Google Scholar] [CrossRef]
  10. Mazzucco, G.; Majorana, C.E.; Salomoni, V.A. Numerical simulation of polypropylene fibres in concrete materials under fire conditions. Comput.Struct. 2015, 154, 17–28. [Google Scholar] [CrossRef]
  11. Fang, Q.; Zhang, J.; Zhang, Y.; Wu, H.; Gong, Z. A 3D mesoscopic model for the closedcell metallic foams subjected to static and dynamic loadings. Int. J. Impact Eng. 2015, 82, 103–112. [Google Scholar] [CrossRef]
  12. Guo, J.; Zhang, J.; Yu, H.; Ma, H. Dynamic compressive behaviour of basic magnesium sulfate cement-coral aggregate concrete (BMSC-CAC) after exposure to elevated temperatures: Experimental and analytical studies. Constr. Build. Mater. 2023, 383, 131336. [Google Scholar] [CrossRef]
  13. Saksala, T. Numerical modelling of concrete fracture processes under dynamic loading: Meso-mechanical approach based on embedded discontinuity finite elements. Eng. Fract. Mech. 2018, 201, 282–297. [Google Scholar] [CrossRef]
  14. Potapov, S.; Masurel, A.; Marin, P.; Daudeville, L. Mixed DEM/FEM Modeling of Advanced Damage in Reinforced Concrete Structures. J. Eng. Mech. 2016, 143, 04016110. [Google Scholar] [CrossRef]
  15. Fang, Q.; Zhang, J.; Zhang, Y.; Gong, Z.; Chen, L.; Liu, J. 3D Numerical Investigation of Cement Mortar with Microscopic Defects at High Strain Rates. J. Mater. Civ. Eng. 2015, 28, 04015155. [Google Scholar] [CrossRef]
  16. Dai, L.Z.; Long, D.X.; Wang, L. Meso-scale modeling of concrete cracking induced by 3D corrosion expansion of helical strands. Comput. Struct. 2021, 254, 106615. [Google Scholar] [CrossRef]
  17. Ma, H.; Wu, Z.; Yu, H.; Zhang, J.; Yue, C. Experimental and three-dimensional mesoscopic investigation of coral aggregate concrete under dynamic splitting-tensile loading. Mater. Struct. 2020, 53, 12. [Google Scholar] [CrossRef]
  18. Jia, M.K.; Xu, W.X.; Zhu, Z.G. Numerical study on the excluded volumes of realistic 3D non convex particles. Powder Technol. 2019, 349, 52–58. [Google Scholar] [CrossRef]
  19. LS-DYNA 2006. In Keyword User’s Manual; Livermore Software Technology Corporation: Livermore, CA, USA, 2006.
  20. Yuan, Y.F. Mix Design and Property of Coral Aggregate Concrete; Nanjing University of Aeronautics and Astronautics: Nanjing, China, 2015. (In Chinese) [Google Scholar]
  21. Song, B.; Chen, W. Dynamic Stress Equilibration in Split Hopkinson Pressure Bar Tests on Soft Materials. Exp. Mech. 2004, 44, 300–312. [Google Scholar] [CrossRef]
  22. Davies ED, H.; Hunter, S.C. The dynamic compression testing of solids by the method of the split Hopkinson pressure bar. J. Mech. Phys. Solids 1963, 11, 155–179. [Google Scholar] [CrossRef]
  23. Lindholm, U.S. Some experiments with the split Hopkinson pressure bar. J. Mech. Phys. Solids 1964, 12, 317–335. [Google Scholar] [CrossRef]
  24. Gray, G.; Blumenthal, W.R. Split-Hopkinson Pressure Bar Testing of Soft Materials; ASM international: Materials Park, OH, USA, 2000; pp. 488–496. [Google Scholar]
  25. Fu, Q.; Zhang, Z.; Zhao, X.; Hong, M.; Guo, B.; Yuan, Q.; Niu, D. Water saturation effect on the dynamic mechanical behaviour and scaling law effect on the dynamic strength of coral aggregate concrete. Cem. Concr. Compos. 2021, 120, 104034. [Google Scholar] [CrossRef]
  26. Field, J.E.; Walley, S.M.; Proud, W.G.; Goldrein, H.T. Review of experimental techniques for high rate deformation shock studies. Int. J. Impact Eng. 2004, 30, 725–775. [Google Scholar] [CrossRef]
  27. Guo, J.; Zhang, J.; Ma, H.; Yu, H.; Wu, Z.; Han, W.; Liu, T. Forthcoming. Dynamic behavior of a new type of coral aggregate concrete: Experimental and numerical investigation. J. Mater. Civ. Eng. 2023, 35, 04023124. [Google Scholar] [CrossRef]
  28. Ma, L.; Li, Z.; Liu, J.; Duan, L.; Wu, J. Mechanical properties of coral concrete subjected to uniaxial dynamic compression. Constr. Build. Mater. 2019, 199, 244–255. [Google Scholar] [CrossRef]
  29. CEB, CEB-FIP Model Code 1990, Committee Euro-International Du Beton; Redwood Books: Trowbridge, Wilshire, UK, 1993.
  30. Ross, C.A.; Jerome, D.M.; Tedesco, J.W.; Hughes, M.L. Moisture and strain rate effffects on concrete strength. ACI Mater. J. 1996, 93, 293–300. [Google Scholar]
  31. Tedesco, J.; Powell, J.; Ross, C.; Hughes, M. A strain-rate-dependent concrete material model for adina. Comput. Struct. 1997, 64, 1053–1067. [Google Scholar] [CrossRef]
  32. Fujikake, K.; Mori, K.; Uebayashi, K.; Ohno, T. Dynamic properties of concrete materials with high rates of tri-axial compressive loads. Struct. Mater. 2000, 8, 511–522. [Google Scholar]
  33. Al-Salloum, Y.; Almusallam, T.; Ibrahim, S.; Abbas, H.; Alsayed, S. Rate dependent behavior and modeling of concrete based on SHPB experiments. Cem. Concr. Compos. 2015, 55, 34–44. [Google Scholar] [CrossRef]
  34. Choi, H.; Kim, J.; Yoon, Y.; Moon, B.-R. Investigation of incremental hybrid genetic algorithm with subgraph isomorphism problem. Swarm Evol. Comput. 2019, 49, 75–86. [Google Scholar] [CrossRef]
  35. Yan, P.; Zhang, J.; Fang, Q.; Zhang, Y.; Fan, J. 3D numerical modelling of solid particles with randomness in shape considering convexity and concavity. Powder Technol. 2016, 301, 131–140. [Google Scholar] [CrossRef]
  36. Wu, Z.Y.; Zhang, J.H.; Yu, H.F.; Ma, H. 3D mesoscopic investigation of the specimen aspect-ratio effect on the compressive behavior of coral aggregate concrete. Compos. Part B Eng. 2020, 198, 108025. [Google Scholar] [CrossRef]
  37. Fang, Q.; Zhang, J.; Zhang, Y.; Liu, J.; Gong, Z. Mesoscopic investigation of closed-cell aluminum foams on energy absorption capability under impact. Compos. Struct. 2015, 124, 409–420. [Google Scholar] [CrossRef]
  38. Holmquist, T.J.; Johnson, G.R. A computational constitutive model for concrete subjected to large strains, high strain rates, and high pressures. ASME J. Appl. Mech. 2011, 78, 051003. [Google Scholar] [CrossRef]
  39. Malvar, L.J.; Crawford, J.E.; Wesevich, J.W.; Simons, D.A. APlasticity Concrete Material Model for, DYNA3D. Int. J. Impact Eng. 1997, 19, 847–873. [Google Scholar] [CrossRef]
  40. Hua, S. Research on the Microstructure and the Mechanical Property of Interface Transition Zone of Coral Concrete. Master’s Thesis, Nanjing University of Aeronautics and Astronautics, Nanjing, China, 2019. [Google Scholar]
  41. Fang, Q.; Zhang, J.H. Three-dimensional numerical modelling of concrete-like materials subjected to dynamic loadings. In Advances in Protective Structures; CRC Press: Boca Raton, FL, USA, 2012; pp. 33–64. [Google Scholar]
  42. Yang, X.; You, Z.; Wang, Z.; Dai, Q. Review on heterogeneous model reconstruction of stone-based composites in numerical simulation. Constr. Build. Mater. 2016, 117, 229–243. [Google Scholar] [CrossRef]
  43. Wu, Z.Y.; Zhang, J.H.; Yu, H.F.; Ma, H.; Chen, L.; Dong, Y.; Zhang, Y. Coupling effect of strain rate specimen size on the compressive properties of coral aggregate concrete: A 3D mesoscopic study. Compos. Part B Eng. 2020, 200, 108299. [Google Scholar] [CrossRef]
Figure 1. The raw materials.
Buildings 14 01605 g001
Figure 2. Particle size distributions of coral and coral sand.
Buildings 14 01605 g002
Figure 3. The SHPB equipment.
Buildings 14 01605 g003
Figure 4. Three-wave contrast waveform diagram.
Buildings 14 01605 g004
Figure 5. Static axial compression failure.
Buildings 14 01605 g005
Figure 6. Stress−strain curve for CASC (a) C55 and (b) C70.
Buildings 14 01605 g006
Figure 7. DIF analysis for CASC with varying strength levels [1,17,25,28].
Buildings 14 01605 g007
Figure 8. Comparison of different fitting models [31,32,33].
Buildings 14 01605 g008
Figure 9. Changes in CASC toughness with strain rates across various strength grades [1,19,27].
Buildings 14 01605 g009
Figure 10. Behavior of pre to post toughness ratio in CASC across varying strain rates and strength grades.
Buildings 14 01605 g010
Figure 11. CASC impact damage mode with different strength levels (a) CASC-70 and (b) CASC-55.
Buildings 14 01605 g011
Figure 12. Generation and meshing process of the 3D mesoscopic model of CASC.
Buildings 14 01605 g012
Figure 13. Effect of mesh size on the compressive properties of cube mortar specimen [43].
Buildings 14 01605 g013
Figure 14. Comparison of simulated and experimental stress–strain curves.
Buildings 14 01605 g014
Figure 15. The failure modes of the CASC at different strain rates.
Buildings 14 01605 g015
Figure 16. Cracking process of different components of CASC at a strain rate of 147.8 s−1.
Buildings 14 01605 g016
Figure 17. Cracking process with different aggregate volume ratios of CASC.
Buildings 14 01605 g017
Table 1. Physical and mechanical properties of coral and coral sand [20].
Raw MaterialsFineness
Modulus
Apparent Density (kg/m3)Bulk Density (kg/m3)Porosity (%)Water Absorption (%)
Coral-255710587.710.9
Coral sand2.44250011154511
Table 2. Chemical composition of cementitious materials (%).
Raw MaterialsSiO2Al2O3CaOSO3MgOFe2O3I.L
FA54.8826.894.771.161.316.493.1
Cement21.354.6762.602.253.083.310.95
Table 3. Physical and mechanical properties of ordinary silicate cement.
CementSpecific Surface Area (m2/kg)Burning Loss (%)Normal
Consistency (%)
Coagulation
Time (h)
Compressive Strength (MPa)Flexural
Strength (MPa)
InitialFinal3d28d3d28d
42.5R3801.828.02.53.325.6544.724.97.8
Table 4. The chemical composition of seawater on an island in the South China Sea (mg·L−1).
K+Na+Ca+Mg2+Fe3+Al3+B2O3 C O 3 2 H C O 3 2 S O 4 2 Cl
391.4104,34402.412495.73840.8527.2492.3250318,800
Table 5. Compounding and mixing properties of CASC.
NoRaw Materials (kg·m−3)W/BSand Ratio (%)Slump (mm)28d Compressive Strength (MPa)
Cementitious MaterialsCementFACoralCoral SandPre-
Absorption
Total
Water
Water Reducer
CASC55550429121680102085193330.355624260.8
CASC708006201803698606122422.40.286627472.0
Table 6. Mechanical parameters of dynamic impact test of CASC.
CASCfcy (Mpa)Strain Rate (s−1)Peak Stress (MPa)Peak Strain (%)DIFToughness
C5556.751.872.10.501.270.418
54.977.00.361.360.434
72.284.70.451.500.628
102.989.80.501.581.02
C7069.234.079.20.381.150.273
51.293.50.381.350.455
77.099.20.311.430.617
95.9101.10.441.460.925
109.0116.00.471.681.217
Table 7. Fitted parameters of Equation (8).
No. α β R2
CASC 500.021630.286160.899
CASC 700.025030.275330.886
CASC 800.000420.540020.809
Ma-2020 [17]0.001330.473340.978
Zhang-2016 [1]0.0008140.51560.924
Zhang-2016 [1]0.013850.336570.871
Ma-2019 [28]0.056280.24640.812
Fu-2021 [25]0.007730.372180.988
Table 8. Fitting parameters of Equation (9).
No. α β R2
CASC-50−1.74970.017250.996
CASC-70−1.88880.019020.991
CASC-80−1.98480.021560.967
Zhang 2016 [1]−1.36990.016110.847
Fu 2021 [19]−1.393440.009890.988
Ma 2019 [27]−2.134540.012170.808
Ma 2019 [27]−1.46070.011330.632
Ma 2019 [27]−1.07280.013460.766
Table 9. Comparison of the test results and simulation results.
NoStrain Rate (s−1)Static Compressive Strength (MPa)Dynamic Impact Strength (MPa)Dynamic Peak Strain (10−2)
TestNumericalError (%)TestNumericalError (%)
CASC-5551.8 56.772.1 69.93.10.50 0.2746.2
54.9 77.0 77.81.10.36 0.345.6
72.2 84.7 85.20.50.45 0.418.9
102.9 89.8 90.10.30.50 0.468.1
CASC-7034.0 69.279.2 76.53.40.38 0.3118.4
51.2 93.5 92.70.80.38 0.357.9
77.0 99.2 97.22.10.31 0.3822.6
95.9 101.1 103.52.40.44 0.432.3
109.0 116.0 120.13.50.47 0.494.3
Disclaimer/Publisher’s Note: The statements, opinions and data contained in all publications are solely those of the individual author(s) and contributor(s) and not of MDPI and/or the editor(s). MDPI and/or the editor(s) disclaim responsibility for any injury to people or property resulting from any ideas, methods, instructions or products referred to in the content.

