
Agglomeration Characteristics and Influencing Factors of Urban Innovation Spaces Based on the Distribution Data of High-Tech Enterprises in Harbin


Abstract
1. Introduction
2. Materials and Methods
2.1. Data Sources
2.2. Research Method
2.2.1. Kernel Density Estimation Method
2.2.2. Spatial Autocorrelation Analysis
2.2.3. Ordinary Least Squares (OLS)
2.2.4. Geographical Weighted Regression Analysis (GWR)
3. Results
3.1. Spatial Distribution Pattern and Agglomeration Characteristics
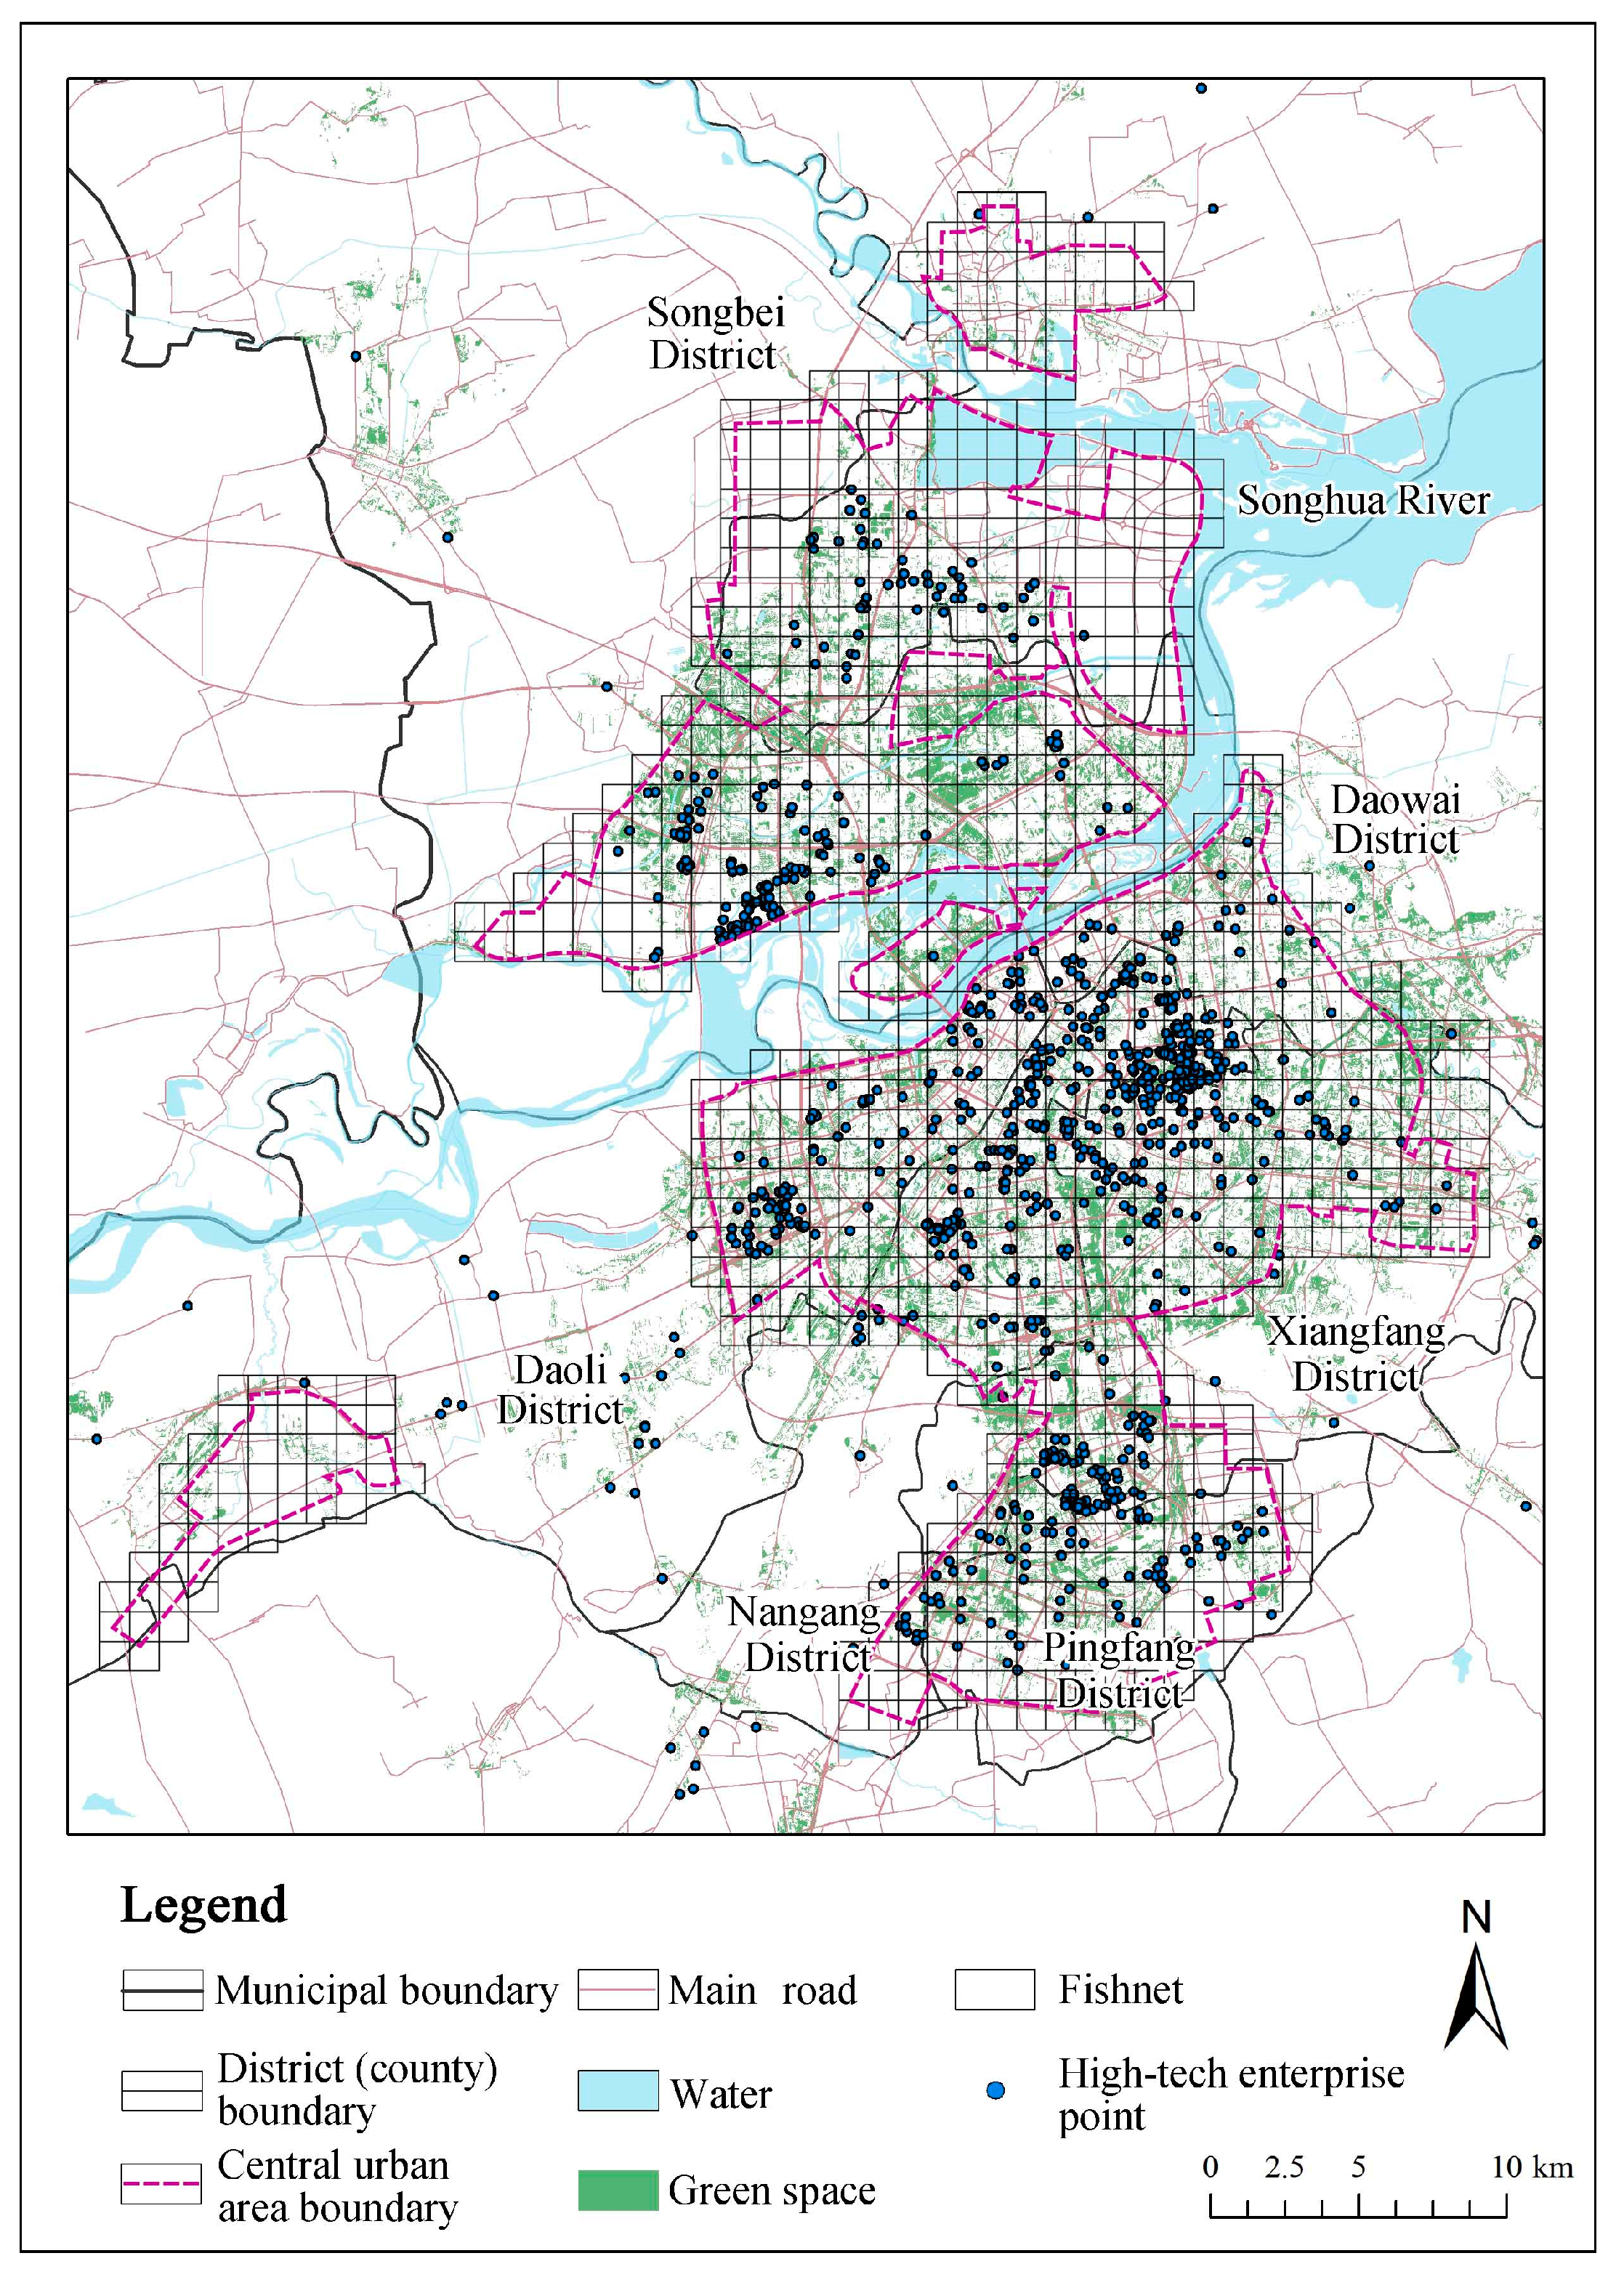
3.1.1. Characteristics of Overall Distribution Pattern
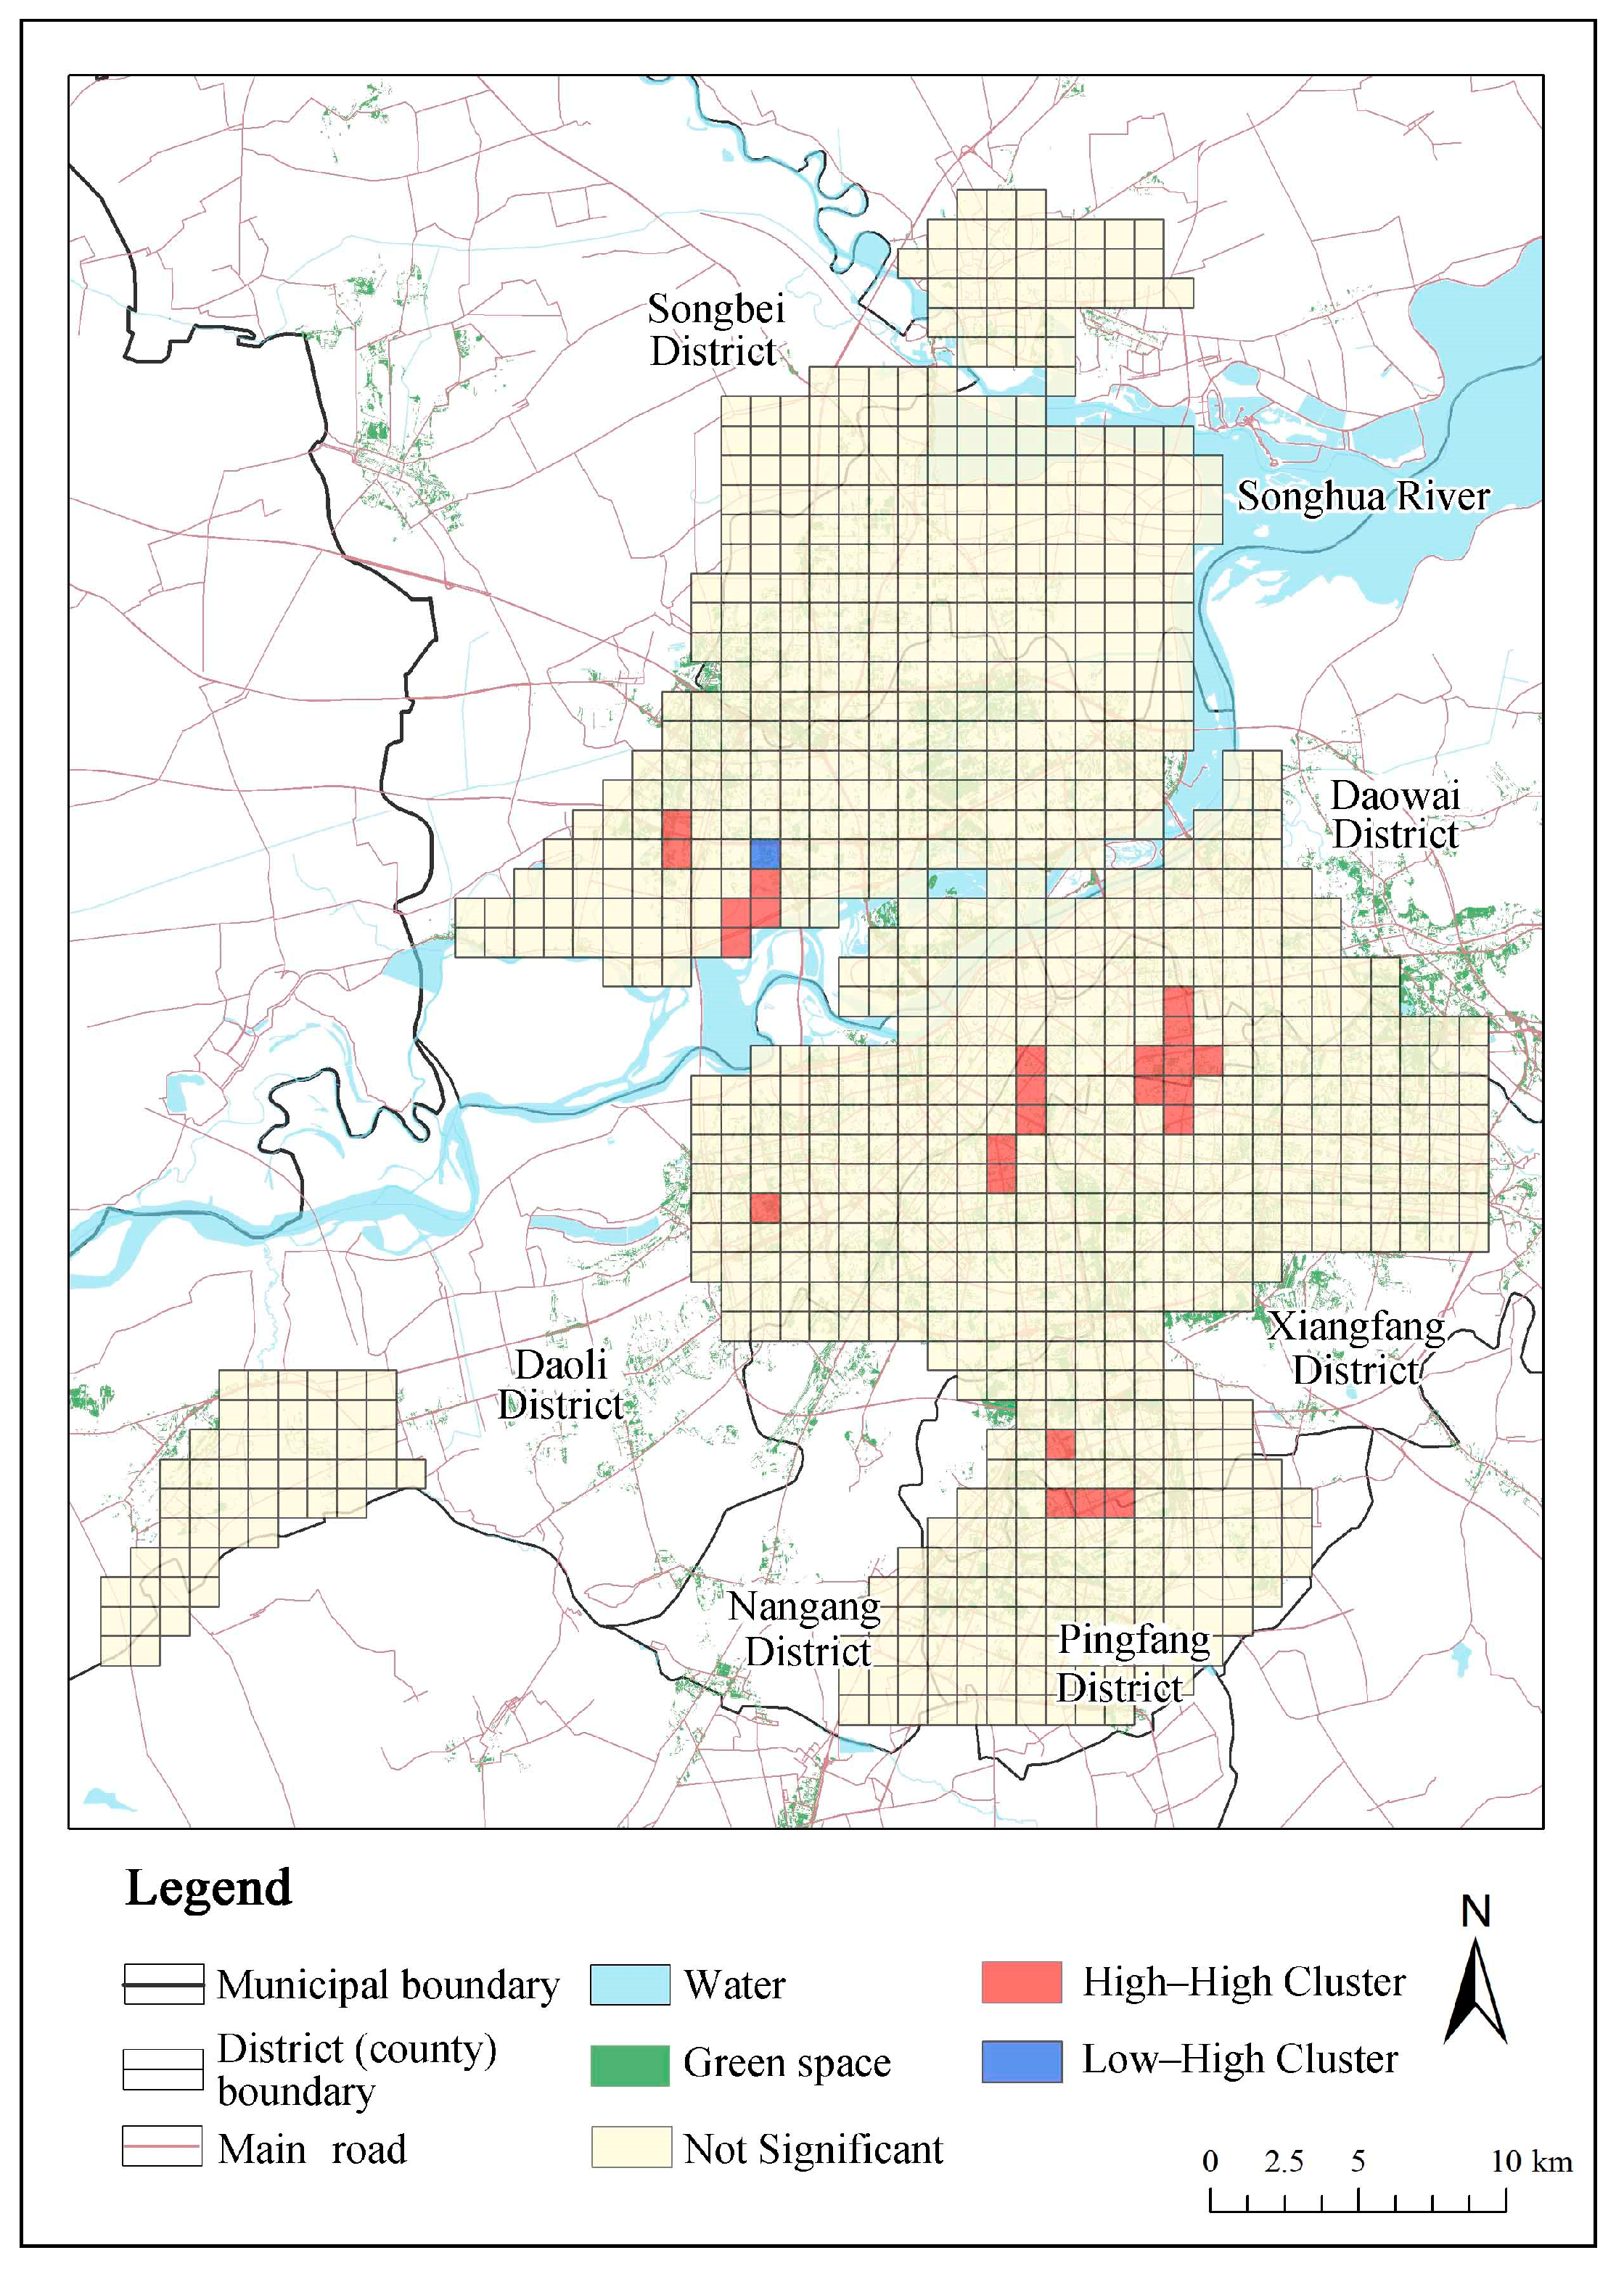
3.1.2. Spatial Autocorrelation Analysis
3.2. Analysis of Influencing Factors
3.2.1. OLS Analysis
3.2.2. GWR Analysis
- The efficacy of the influencing factors
- 2.
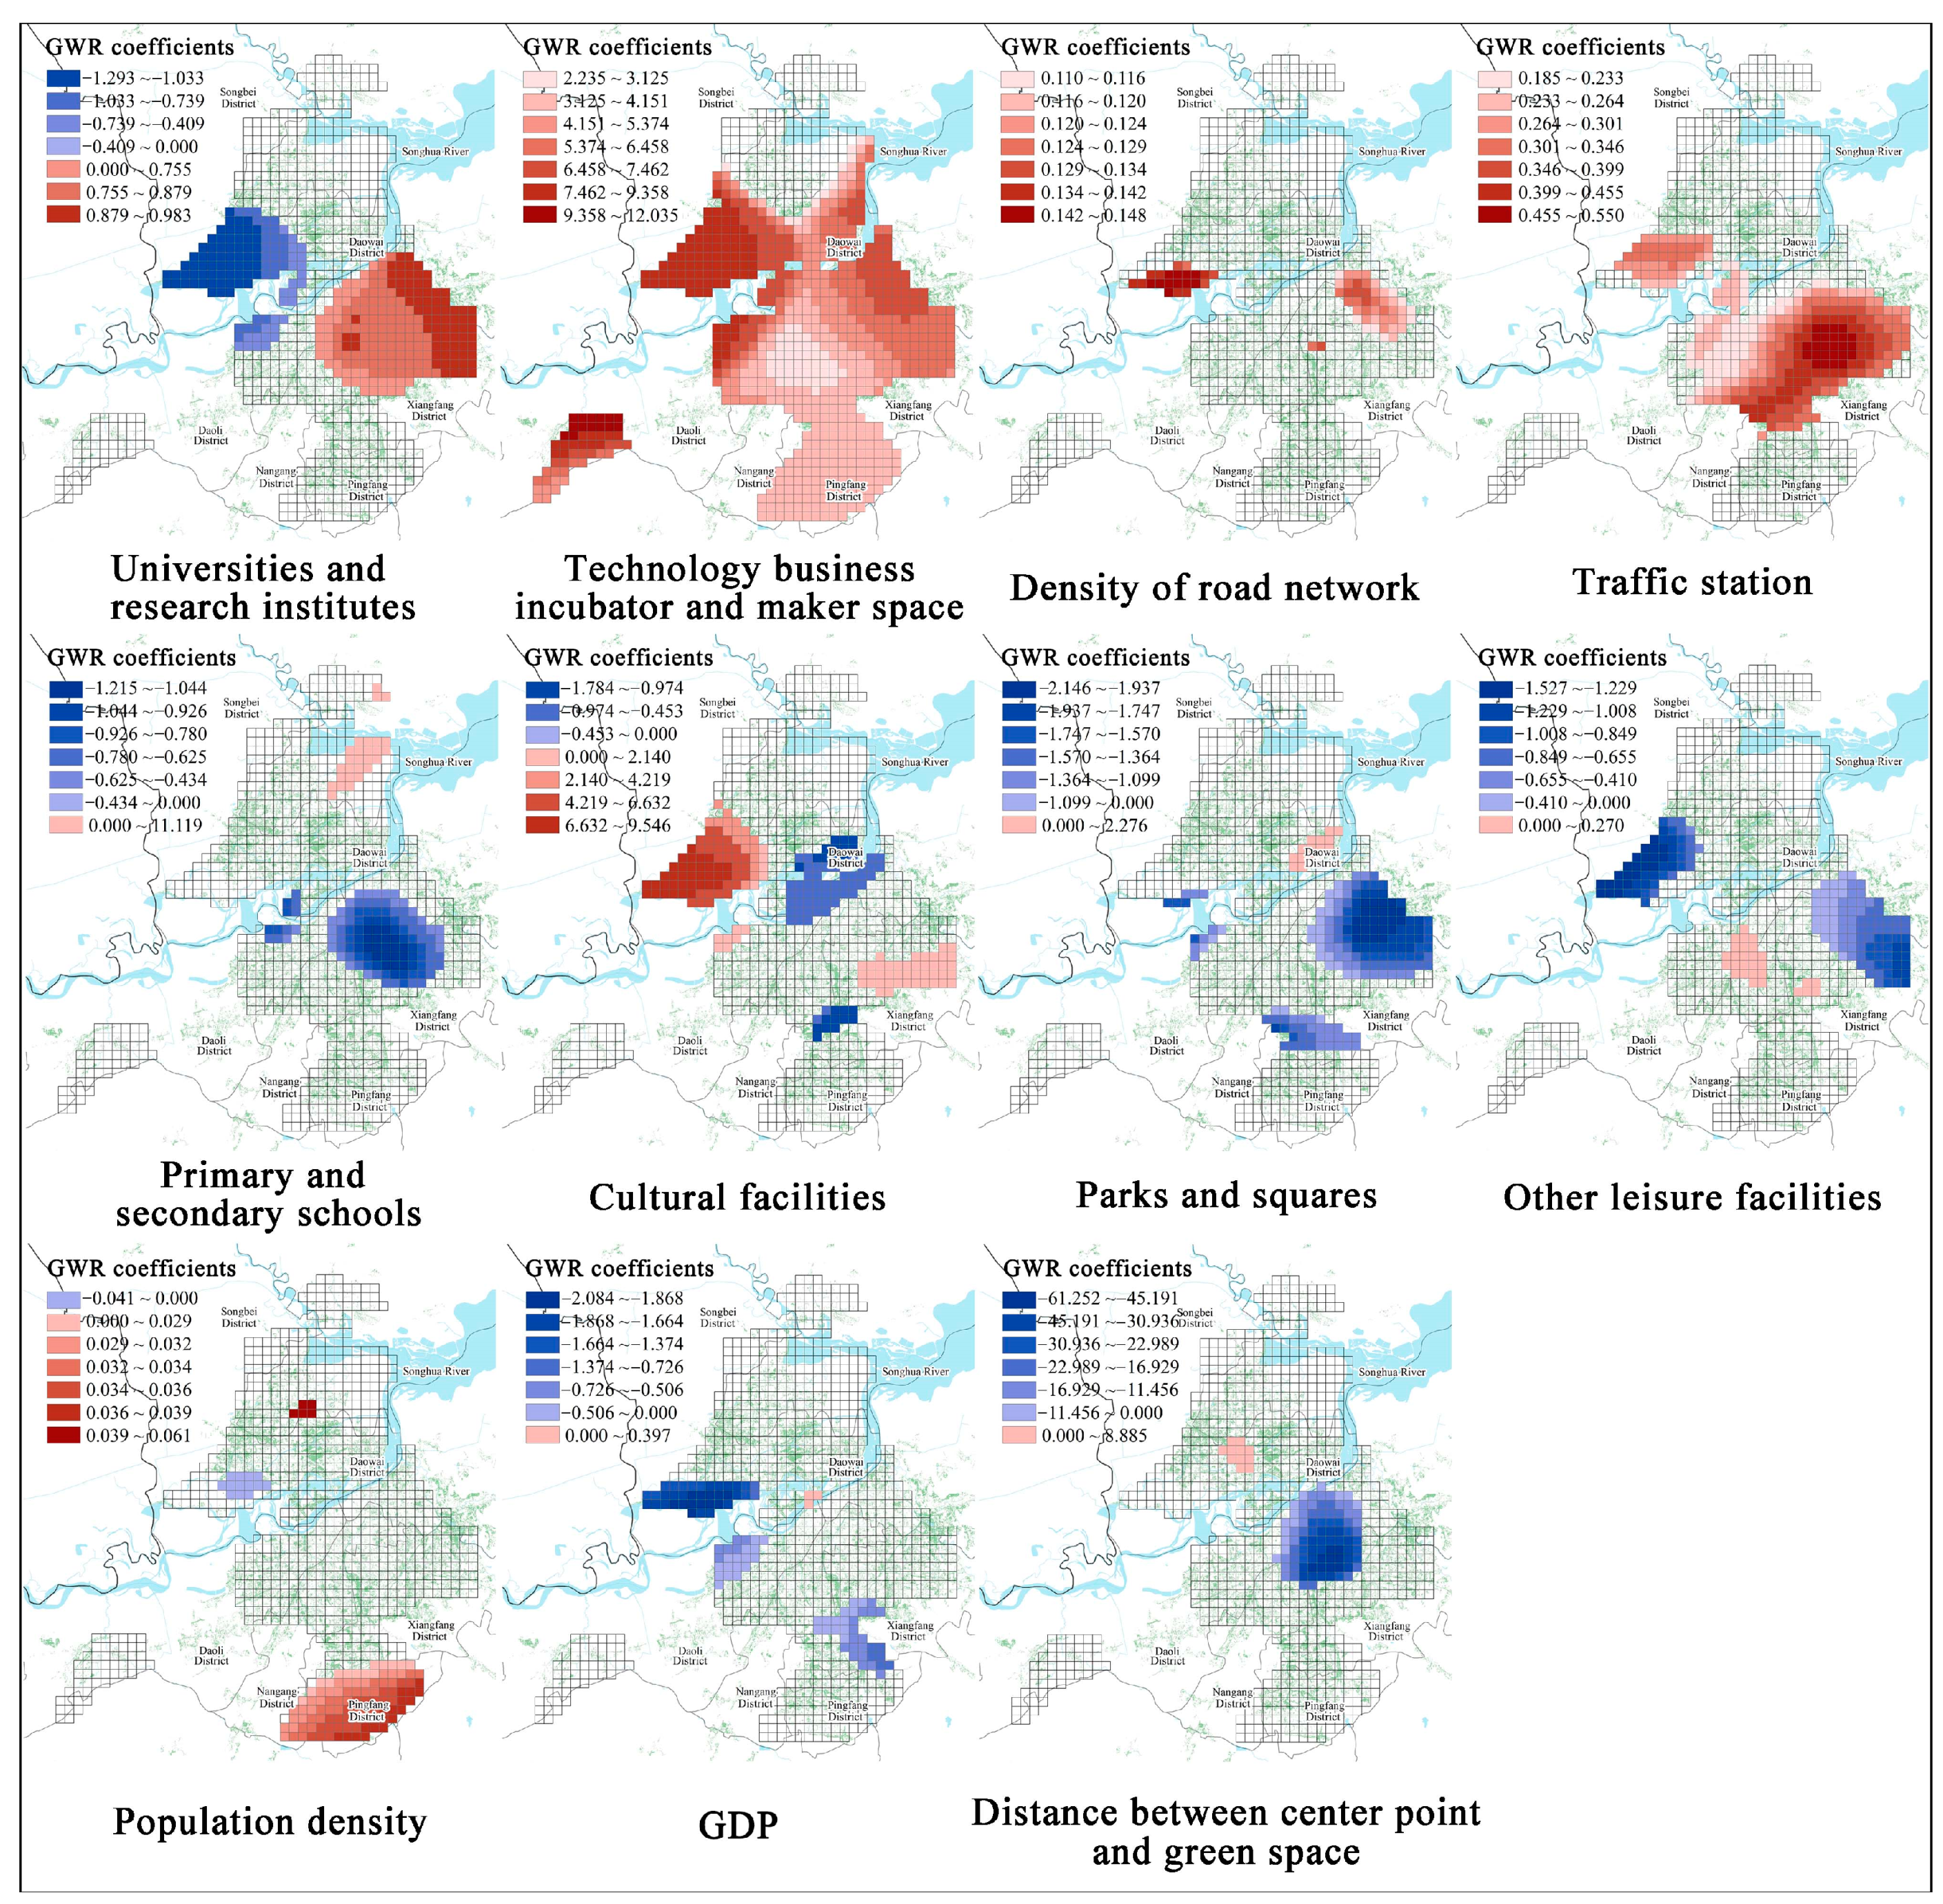
- Spatial distribution of influencing factors
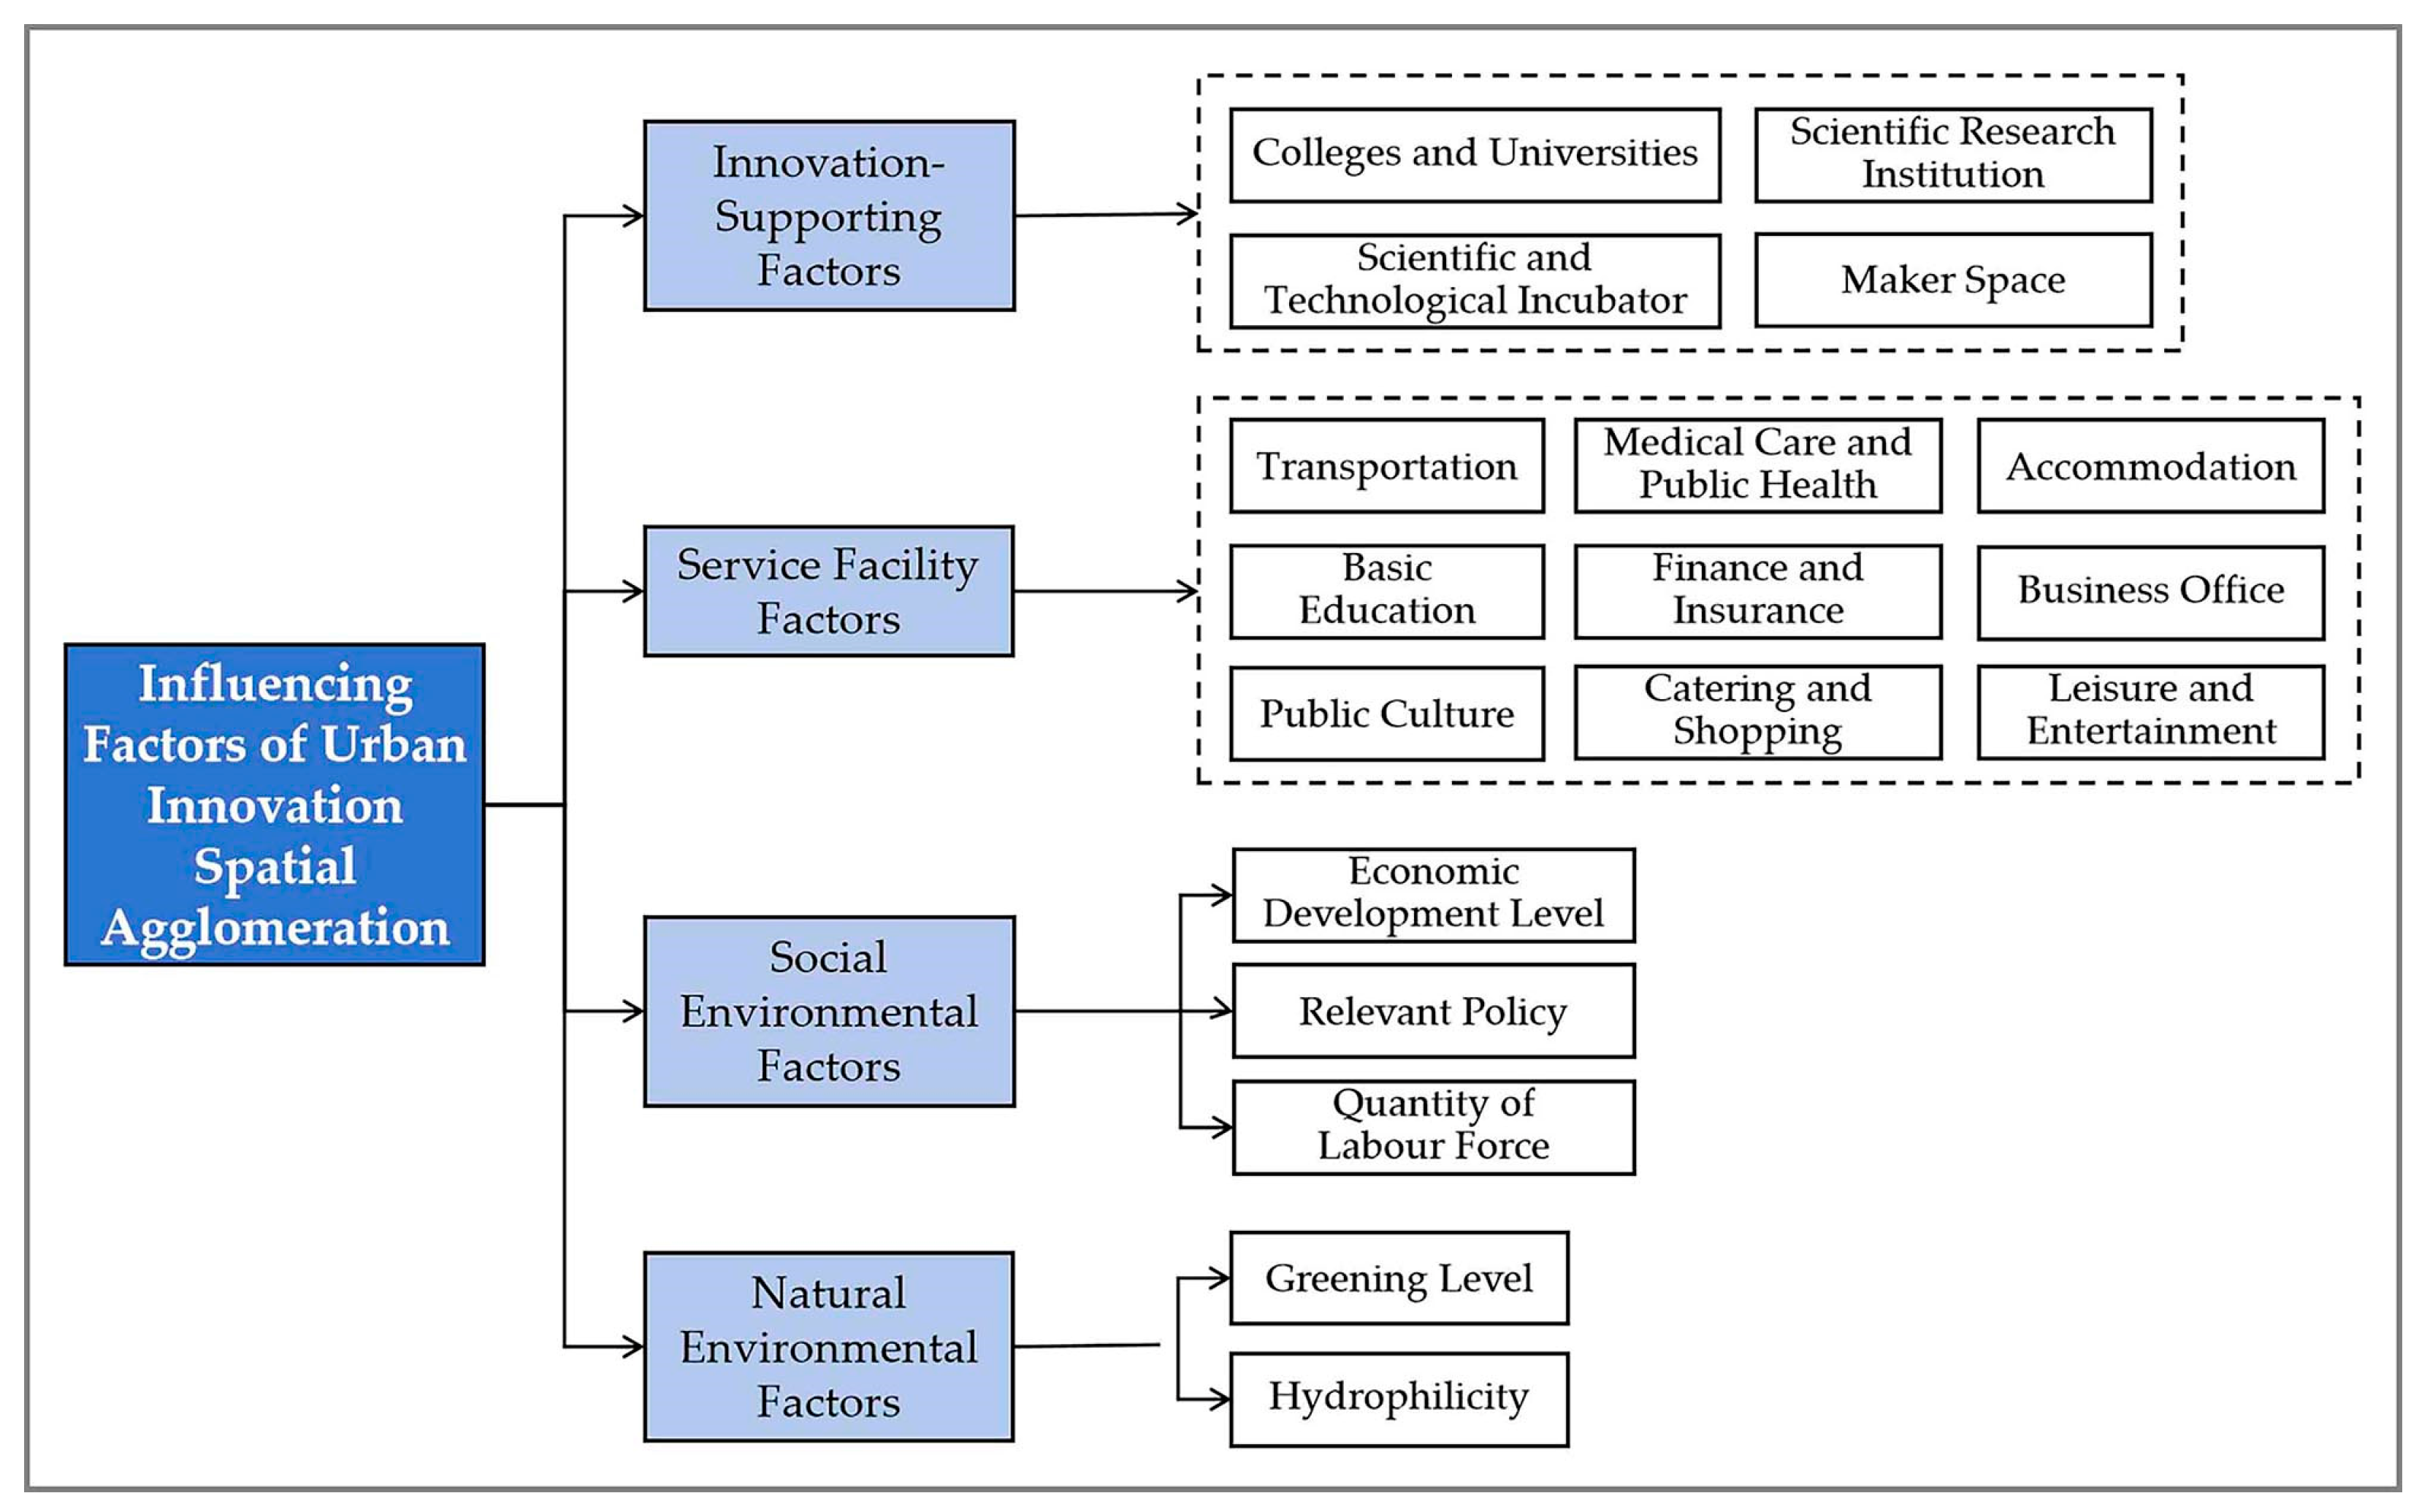
- Factors supporting innovation
- Service Facility Factors
- Social Environmental Factors
- Natural Environmental Factors
- 3.
- Summary of influencing factors
4. Discussion
5. Conclusions
5.1. Summary and Recommendations
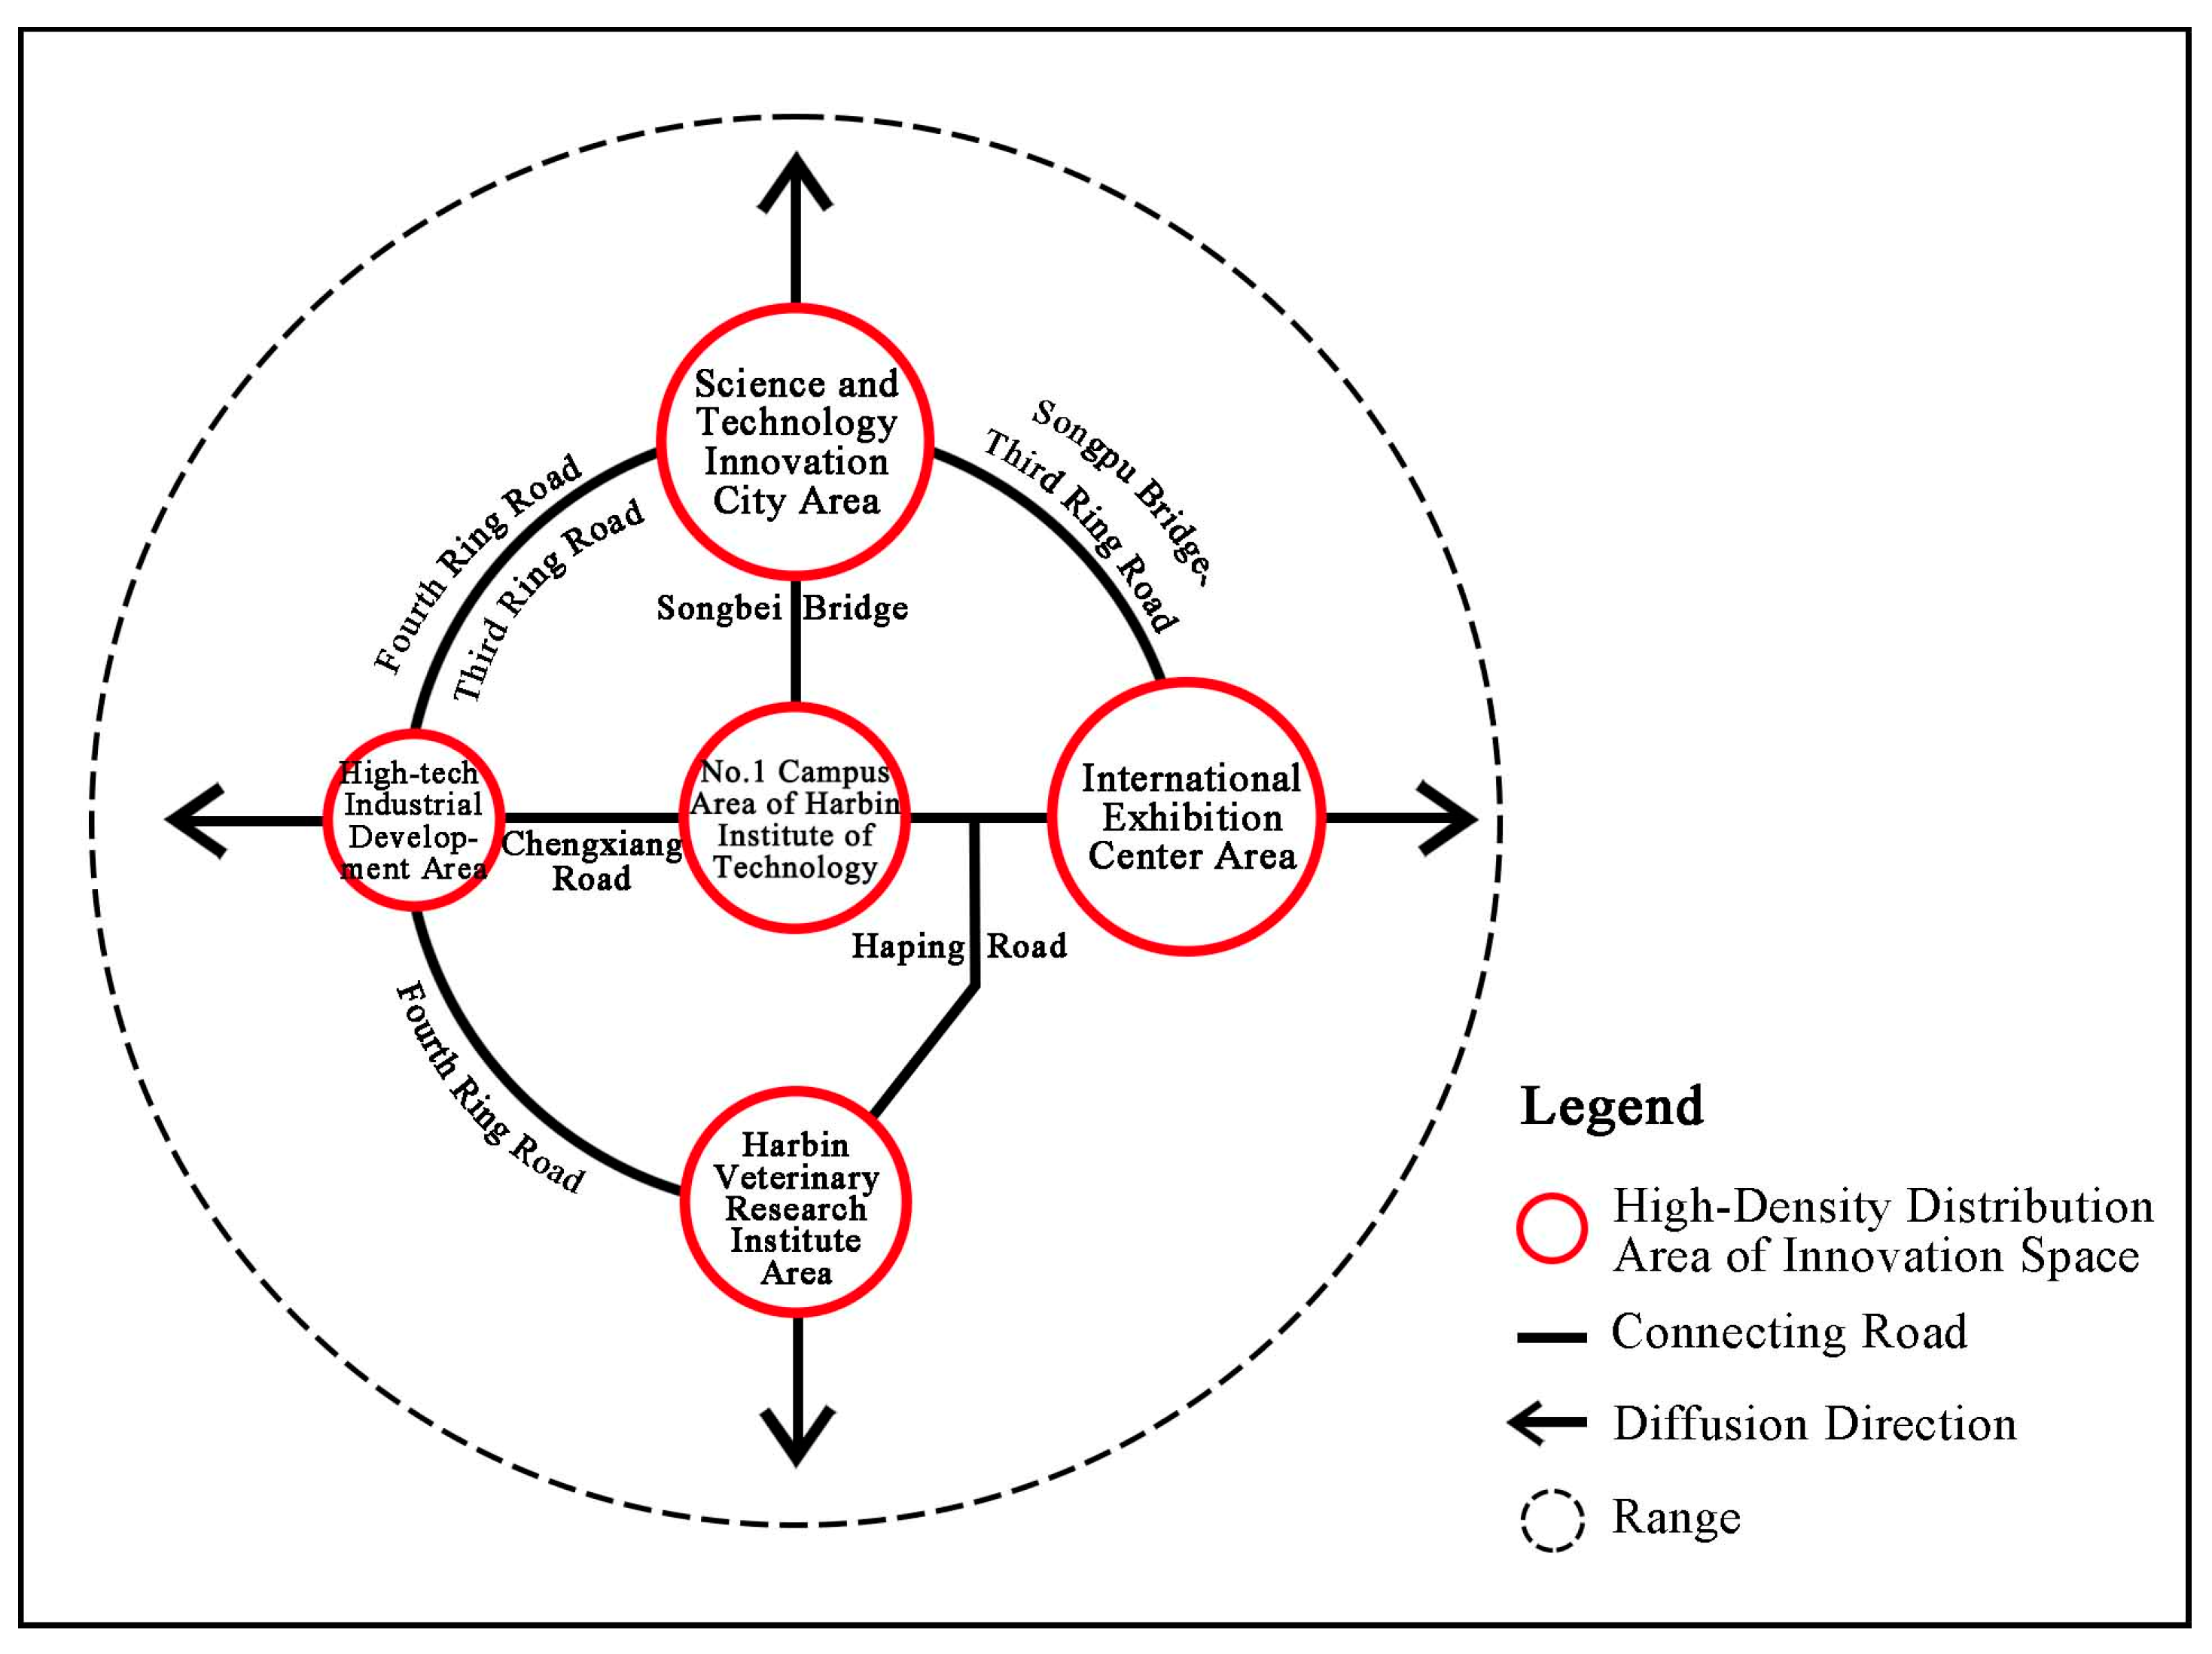
- The innovation space in Harbin is organized into five clusters. These clusters are closely connected with each other, and there is a development trend of outward expansion. The leading industry categories of each area are roughly similar. There are two distribution modes of innovation spaces: high–high agglomeration and high–low agglomeration.
- The development of innovation spaces in Harbin is not balanced, and the five clusters that have been formed play a leading role in the overall development of innovation spaces. Therefore, relevant interest groups such as urban planners and policy makers need to pay attention to these clusters and prioritize the allocation of resources into these areas with dense distributions of innovation spaces to improve resource utilization efficiency and output performance.
- Using the OLS model, it is initially identified that the incubator density and the transportation facilities in the service facilities of innovation support factors have significant positive promoting effects on the agglomeration of innovation space, while the social and natural environment factors have no significant effects. The agglomeration of urban innovation space is affected by various service facilities and the external environment. For example, the service level of a city will affect the settlement intention of innovative talents and thus indirectly affect the spatial distribution of innovation.
- The GWR model was selected for further analysis thanks to its better fitting effect. In general, factors supporting innovation and transportation station factors had a positive effect on the agglomeration of innovation spaces, while natural environment factors had a weak effect. In terms of the spatial distribution of influencing factors, the spatial agglomeration of innovation in the downtown area is slightly or negatively affected by service facilities, the Harbin New District has greater policy support, innovation spaces are mostly distributed in the Science and Technology Innovation City area with a high degree of concentration, and Pingfang District is mainly positively affected by the size of the labor force. Urban planners and policy makers should aim to further improve the level of service facility construction of innovation spaces in the downtown area while establishing a diversified public transportation system and innovation support factors. In Harbin New District, the influence of innovation policies and comprehensive service carriers of innovation spaces should be strengthened. As for the innovation space in Pingfang District, which is dominated by manufacturing industrial parks, it is necessary to enhance the area’s competitiveness in terms of labor force training and the introduction of innovative talents. By giving full play to local advantages and making up for shortcomings using other strategies, a diversified urban innovation space system can be built to promote innovation, leading to the sustainable economic and social development of cities.
5.2. Research Limitations and Future Works
Author Contributions
Funding
Data Availability Statement
Acknowledgments
Conflicts of Interest
References
- Fritsch, M. The theory of economic development: An inquiry into profits, capital, credit, interest, and the business cycle. Reg. Stud. 2017, 51, 654–655. [Google Scholar] [CrossRef]
- Perroux, F. Note sur la notion de pole de croissance. Econ. Appl. 1955, 8, 307–320. [Google Scholar] [CrossRef]
- Cooke, P. Regional Innovation System: Competitive Regulation in the New Europe. Geoforum 1992, 23, 365–382. [Google Scholar] [CrossRef]
- Landry, C. The Creative City: A Toolkit for Urban Innovators; Earthscan Publication Ltd.: London, UK, 2000. [Google Scholar]
- Feldman, M.P.; Audretsch, D.B. Innovation in cities: Science-based diversity, specialization and localized competition. Eur. Econ. Rev. 1999, 43, 409–429. [Google Scholar] [CrossRef]
- Packalen, M.; Bhattacharya, J. Cities and ideas. Natl. Bur. Econ. Res. 2015. [Google Scholar] [CrossRef]
- Chatzkel, J. Greater Phoenix as a knowledge capital. J. Knowl. Manag. 2004, 8, 61–72. [Google Scholar] [CrossRef]
- Pancholi, S.; Yigitcanlar, T.; Guaralda, M. Urban knowledge and innovation spaces: Concepts, conditions, and contexts. Asia Pac. J. Innov. Entrep. 2014, 8, 15–38. [Google Scholar]
- Zheng, P.; Li, J.X. The New Development and Generative Mechanism of Urban Innovation Space. J. Tianjin Univ. 2018, 20, 253–260. (In Chinese) [Google Scholar]
- Porter, M.E. The Competitive Advonioge of Notions. Harv. Bus. Rev. 1990, 73, 896. [Google Scholar]
- Lim, U. The spatial distribution of innovative activity in U.S. metropolitan areas: Evidence from patent data. J. Reg. Anal. Policy 2003, 33. [Google Scholar] [CrossRef]
- Liu, F.; Sun, Y. A comparison of the spatial distribution of innovative activities in China and the US. Technol. Forecast. Soc. Chang. 2009, 76, 797–805. [Google Scholar] [CrossRef]
- Choi, H.S.; Sohn, S.Y.; Yeom, H.J. Technological composition of US metropolitan statistical areas with high-impact patents. Technol. Forecast. Soc. Chang. 2018, 134, 72–83. [Google Scholar] [CrossRef]
- Ženka, J.; Slach, O.; Ivan, I. Spatial patterns of knowledge-intensive business services in cities of various sizes, morphologies and economies. Sustainability 2020, 12, 1845. [Google Scholar] [CrossRef]
- Wang, Z.; Hu, Y.; Guo, X.; He, X.; Kek, H.Y.; Ku, T.; Goh, S.H.; Leung, C.F. Predicting geological interfaces using stacking ensemble learning with multi-scale features. Can. Geotech. J. 2023, 60, 1036–1054. [Google Scholar] [CrossRef]
- Liu, S.; Wang, L.; Zhang, W.; Sun, W.; Fu, J.; Xiao, T.; Dai, Z. A physics-informed data-driven model for landslide susceptibility assessment in the Three Gorges Reservoir Area. Geosci. Front. 2023, 14, 101621. [Google Scholar] [CrossRef]
- Han, L.; Wang, L.; Zhang, W.; Geng, B.; Li, S. Rockhead profile simulation using an improved generation method of conditional random field. J. Rock Mech. Geotech. Eng. 2022, 14, 896–908. [Google Scholar] [CrossRef]
- Zhao, T.; Hu, Y.; Wang, Y. Statistical interpretation of spatially varying 2D geo-data from sparse measurements using Bayesian compressive sampling. Eng. Geol. 2018, 246, 162–175. [Google Scholar] [CrossRef]
- Belkhiri, L.; Tiri, A.; Mouni, L. Spatial distribution of the groundwater quality using kriging and Co-kriging interpolations. Groundw. Sustain. Dev. 2020, 11, 100473. [Google Scholar] [CrossRef]
- Sun, Y.; Tian, D.; Zhang, M.; Hou, Y. Spatial Green Space Accessibility in Hongkou District of Shanghai Based on Gaussian Two-Step Floating Catchment Area Method. Buildings 2023, 13, 2477. [Google Scholar] [CrossRef]
- Andersson, R.; Quigley, J.M.; Wilhelmsson, M. Agglomeration and the spatial distribution of creativity. Pap. Reg. Sci. 2005, 84, 445–464. [Google Scholar] [CrossRef]
- Bade, F.J.; Nerlinger, E.A. The spatial distribution of new technology-based firms: Empirical results for West-Germany. Pap. Reg. Sci. 2000, 79, 155–176. [Google Scholar]
- Méndez, R.; Moral, S.S. Spanish cities in the knowledge economy: Theoretical debates and empirical evidence. Eur. Urban Reg. Stud. 2011, 18, 136–155. [Google Scholar] [CrossRef]
- Zou, L.; Cao, X.; Zhu, Y. Research on regional high-tech innovation efficiency and influencing factors: Evidence from Yangtze River economic belt in China. Complexity 2021, 2021, 9946098. [Google Scholar] [CrossRef]
- Su, Y.; Cao, Z. Evolution of the Beijing-Tianjin-Hebei regional collaborative innovation network and its influencing factors. Sci. Res. Manag. 2023, 44, 43–55. (In Chinese) [Google Scholar]
- Esmaeilpoorarabi, N.; Yigitcanlar, T.; Guaralda, M.; Kamruzzaman, M. Does place quality matter for innovation districts? Determining the essential place characteristics from Brisbane’s knowledge precincts. Land Use Policy 2018, 79, 734–747. [Google Scholar] [CrossRef]
- Habibi, S.S.; Tousi, S.N.; Aram, F.; Mosavi, A. Spatial preferences of small and medium knowledge-based enterprises in Tehran new business area. J. Urban Manag. 2024, 13, 16–32. [Google Scholar] [CrossRef]
- Li, L.; Zhang, X. Spatial evolution and critical factors of urban innovation: Evidence from Shanghai, China. Sustainability 2020, 12, 938. [Google Scholar] [CrossRef]
- Esmaeilpoorarabi, N.; Yigitcanlar, T. User-Centric Innovation District Planning: Lessons from Brisbane’s Leading Innovation Districts. Buildings 2023, 13, 883. [Google Scholar] [CrossRef]
- Guan, M.; Sun, S. Agglomeration characteristics and influencing factors of urban innovation space: A case study of Nanjing main city. City Plan. Rev. 2023, 47, 21–31. (In Chinese) [Google Scholar]
- Available online: https://www.harbin.gov.cn (accessed on 14 September 2023).
- Available online: www.openstreetmap.org (accessed on 10 December 2022).
- Available online: https://www.resdc.cn/DOI/DOI.aspx?DOIID=33 (accessed on 17 March 2023).
- Fotheringham, A.S.; Brunsdon, C.; Charlton, M. Geographically Weighted Regression: The Analysis of Spatially Varying Relationships; New Jersey Wiley: Hoboken, NJ, USA, 2002. [Google Scholar]
- Boschma, R. Proximity and innovation: A critical assessment. Reg. Stud. 2005, 39, 61–74. [Google Scholar] [CrossRef]
- Petruzzelli, A.M. Balancing knowledge exploration and exploitation within and across technological and geographical domains. Knowl. Manag. Res. Pract. 2014, 12, 123–132. [Google Scholar] [CrossRef]
- Leonard, D.; Sensiper, S. The role of tacit knowledge in group innovation. Calif. Manag. Rev. 1998, 40, 112–132. [Google Scholar] [CrossRef]
- Zhang, Y. The Theory and Practice of Tacit Knowledge in the Innovation and Development of Enterprises. Innov. Sci. Technol. 2015, 12, 65–67. (In Chinese) [Google Scholar]
- Chen, H. Influencing Factors of Spatial Structure Evolution of Producer Services in Beijing. Econ. Geogr. 2019, 39, 128–135. (In Chinese) [Google Scholar]
- Lu, L.; Huang, R. Urban hierarchy of innovation capability and inter-city linkages of knowledge in post-reform China. Chin. Geogr. Sci. 2012, 22, 602–616. [Google Scholar] [CrossRef]
- Guo, S. Spatial-temporal characteristics and determinants of innovation output in China. Mod. Econ. 2019, 10, 12–28. [Google Scholar] [CrossRef]
- Zuo, W. International practice and inspiration of innovation institutions in manufacturing labor education and training. Educ. Vocat. 2021, 20, 97–102. (In Chinese) [Google Scholar]
- Audretsch, B. Agglomeration and the location of innovative activity. Oxf. Rev. Econ. Policy 1998, 14, 18–29. [Google Scholar] [CrossRef]
- Weterings, A. Spatial evolution of the Dutch software and computer services industry: First results and a research agenda. Rep. Neth. Inst. Spat. Res. 2003. [Google Scholar]
- Arai, Y.; Nakamura, H.; Sato, H.; Nakazawa, T.; Musha, T.; Sugizaki, K. Multimedia and internet business clusters in central Tokyo. Urban Geogr. 2004, 25, 483–500. [Google Scholar] [CrossRef]


| Type | Influencing Factor | Variable Interpretation | Unit | Data Source |
|---|---|---|---|---|
| Innovation-Supporting Factor | Universities and Research Institutes | Density of Universities and Research Institutions in the Grid | per km2 | Harbin POI Data for 2022 |
| Technology Enterprise Incubators and Maker Space (hereinafter referred to as incubators) | Density of Technology Enterprise Incubators and Maker Space in the Grid | per km2 | Harbin POI Data for 2022 | |
| Service Facility Factor | Transport Facilities | Density of the Road Network in the Grid | km per km2 | OSM dataset |
| Density of Transportations Stations such as Trains, Subways, and Bus Stations in the Grid | per km2 | Harbin POI Data for 2022 | ||
| Basic Education | Density of Primary and Secondary Schools in the Grid | per km2 | Harbin POI Data for 2022 | |
| Cultural Facilities | Density of Libraries, Bookstores, Museums, Exhibition Halls, and Art Galleries in the Grid | per km2 | Harbin POI Data for 2022 | |
| Recreation Facilities | Density of Parks and Squares in the Grid | per km2 | Harbin POI Data for 2022 | |
| Density of Cinemas, Theaters, Bars, and KTVs in the Grid | per km2 | Harbin POI Data for 2022 | ||
| Dining and Shopping Facilities | Density of Restaurants in the Grid | per km2 | Harbin POI Data for 2022 | |
| Density of Supermarkets and Convenience Stores in the Grid | per km2 | Harbin POI Data for 2022 | ||
| Social Environmental Factor | Population | Population Density in the Grid | one hundred people per km2 | Harbin 2020 Population Data from Worldpop Website |
| Economic Development Level | GDP value in the Grid | 100 million yuan per km2 | Data of Harbin in 2019 in the China GDP Spatial Distribution Km Grid Dataset | |
| Natural Environmental Factor | Greening Level | Distance between the Center Point in the Grid and the Nearest Green Space (hereafter referred to as the distance from green space) | km | OSM dataset |
| Density of Green Space in the Grid | % | OSM dataset | ||
| Hydrophilicity | Distance between the Center Point in the Grid and the Nearest Water Body (hereafter referred to as the distance from water) | km | OSM dataset |
| Sequence Number | Location | Number of Enterprises | Proportion of Total (%) | Area of Region (km2) | Number of Enterprises per km2 | Top Three Enterprises in the Professional Field |
|---|---|---|---|---|---|---|
| 1 | Science and Technology Innovation City Area | 378 | 21.59 | 33 | 11 | Electronic information, high-tech services, advanced machinery manufacturing and automation |
| 2 | International Exhibition Center Area | 303 | 17.30 | 24 | 13 | Electronic information, high-tech services, advanced machinery manufacturing and automation |
| 3 | No.1 Campus Area of the Harbin Institute of Technology | 147 | 8.39 | 19 | 8 | Electronic information, high-tech services, advanced machinery manufacturing and automation |
| 4 | High-tech Industrial Development Area | 70 | 4.00 | 22 | 3 | Advanced machinery manufacturing and automation, electronic information, new materials |
| 5 | Harbin Veterinary Research Institute Area | 143 | 8.17 | 23 | 6 | Advanced machinery manufacturing and automation, electronic information, biology and medicine |
| 6 | Other Areas | 710 | 40.55 | - | - | - |
| Factor | Regression Coefficient | Standard Error |
|---|---|---|
| Density of Universities and Research Institutions | 0.132 | 0.128 |
| Density of Incubators | 6.396 ** | 0.189 |
| Density of Road Network | 0.046 * | 0.025 |
| Density of Transportation Stations | 0.133 ** | 0.052 |
| Density of Primary and Secondary Schools | −0.317 * | 0.170 |
| Density of Cultural Facilities | −0.253 | 0.197 |
| Density of Parks and Squares | −0.187 | 0.249 |
| Density of Other Leisure Facilities | −0.094 | 0.069 |
| Population Density | 0.006 | 0.005 |
| GDP Value | −0.129 | 0.090 |
| Distance from Green Space | −0.081 | 0.221 |
| Density of Green Space | −0.070 | 0.362 |
| Distance from Water | 0.059 | 0.086 |
| Model | Residual Sum of Squares | −2 Log-likelihood | AICc | R2 | Adjusted R2 |
|---|---|---|---|---|---|
| OLS | 14,441.921544 | 5056.648316 | 5087.190689 | 0.612415 | 0.606290 |
| GWR | 9051.796919 | 4635.726432 | 4885.872460 | 0.757072 | 0.712793 |
| Factor | Coefficient Statistics | Proportion of Significance Coefficient (%) | |||||
|---|---|---|---|---|---|---|---|
| Avg | Min | Median | Max | p < 0.05 | + * | − * | |
| Density of Universities and Research Institutions | −0.053 | −2.123 | −0.061 | 0.983 | 36.07 | 63.69 | 36.31 |
| Density of Incubators | 4.613 | 0.392 | 4.195 | 12.035 | 81.69 | 100 | 0 |
| Density of Road Network | 0.033 | −0.103 | 0.040 | 0.148 | 7.55 | 100 | 0 |
| Density of Transportation Stations | 0.156 | −0.127 | 0.168 | 0.550 | 36.85 | 100 | 0 |
| Density of Primary and Secondary Schools | 0.461 | −1.215 | 0.076 | 11.119 | 16.17 | 18.49 | 81.51 |
| Density of Cultural Facilities | 0.395 | −2.230 | −0.061 | 9.546 | 23.31 | 64.76 | 35.24 |
| Density of Parks and Squares | −0.652 | −2.889 | −0.731 | 2.276 | 20.42 | 7.61 | 92.39 |
| Density of Other Leisure Facilities | −0.282 | −1.527 | −0.242 | 1.516 | 19.64 | 15.82 | 84.18 |
| Population Density | 0.012 | −0.041 | 0.011 | 0.062 | 13.10 | 88.99 | 11.01 |
| GDP Value | −0.101 | −2.084 | −0.060 | 1.373 | 10.77 | 3.09 | 96.91 |
| Distance from Green Space | −3.176 | −61.252 | −0.207 | 8.885 | 10.99 | 11.11 | 88.89 |
| Density of Green Space | −0.026 | −3.236 | −0.016 | 2.854 | 1.66 | 0 | 100 |
| Distance from Water | −0.005 | −2.480 | 0.041 | 0.685 | 2.33 | 0 | 100 |
Disclaimer/Publisher’s Note: The statements, opinions and data contained in all publications are solely those of the individual author(s) and contributor(s) and not of MDPI and/or the editor(s). MDPI and/or the editor(s) disclaim responsibility for any injury to people or property resulting from any ideas, methods, instructions or products referred to in the content. |
© 2024 by the authors. Licensee MDPI, Basel, Switzerland. This article is an open access article distributed under the terms and conditions of the Creative Commons Attribution (CC BY) license (https://creativecommons.org/licenses/by/4.0/).
Share and Cite
Wu, S.; Li, B.; Xu, D. Agglomeration Characteristics and Influencing Factors of Urban Innovation Spaces Based on the Distribution Data of High-Tech Enterprises in Harbin. Buildings 2024, 14, 1615. https://doi.org/10.3390/buildings14061615
Wu S, Li B, Xu D. Agglomeration Characteristics and Influencing Factors of Urban Innovation Spaces Based on the Distribution Data of High-Tech Enterprises in Harbin. Buildings. 2024; 14(6):1615. https://doi.org/10.3390/buildings14061615
Chicago/Turabian StyleWu, Songtao, Bowen Li, and Daming Xu. 2024. "Agglomeration Characteristics and Influencing Factors of Urban Innovation Spaces Based on the Distribution Data of High-Tech Enterprises in Harbin" Buildings 14, no. 6: 1615. https://doi.org/10.3390/buildings14061615
APA StyleWu, S., Li, B., & Xu, D. (2024). Agglomeration Characteristics and Influencing Factors of Urban Innovation Spaces Based on the Distribution Data of High-Tech Enterprises in Harbin. Buildings, 14(6), 1615. https://doi.org/10.3390/buildings14061615