Article

Airflow and Pressure Design Review of Modular Negative Pressure Wards

1
Department of Architectural Engineering, Graduate School, Gyeongsang National University, Jinju 52828, Republic of Korea
2
Department of Architectural Engineering, ERI (Engineering Research Institute), Gyeongsang National University, Jinju 52828, Republic of Korea
*
Author to whom correspondence should be addressed.
Buildings 2024, 14(6), 1623; https://doi.org/10.3390/buildings14061623
Submission received: 24 April 2024 / Revised: 18 May 2024 / Accepted: 29 May 2024 / Published: 1 June 2024
(This article belongs to the Special Issue Research on the Airtightness of Buildings)

Abstract

:
In the aftermath of the COVID-19 pandemic, the urgent need for the rapid deployment of healthcare facilities propelled the rise of modular construction using an infill approach. In these modular, negative-pressure wards, the design of indoor airflow and pressure plays a crucial role in meeting the ventilation strategies required for isolation facilities. Accordingly, this paper focuses on modular negative-pressure wards employing an infill construction method and proposes an appropriate spatial pressure distribution to address the problem of air tightness degradation due to leakage. This study analyzed the indoor airflow and pressure distribution of a unit module corresponding to an infill. It aimed to examine whether the pressure difference with the adjacent room is maintained and to assess its effectiveness in isolating contaminated air. First, the airflow rate of the heating, ventilation, and air conditioning system in the unit module was calculated to ensure that it would meet the performance criteria of the negative-pressure ward. Afterward, based on the calculated rate, the study assessed the airflow and room-specific pressure within a typical floor, encompassing both the unit module and associated nursing support facilities. Here, the airflow in the external corridor of the typical floor was divided into two cases according to the pressure distribution: negative pressure and atmospheric pressure. The calculation results were compared using a computational fluid dynamics tool. The analysis results confirm that the air isolation performance is adequate as the pressure difference between adjacent rooms in the unit module and the typical floor was maintained at 2.5 Pa. Additionally, the indoor airflow in the negative-pressure isolation room formed a stable flow at a slow speed of 0.1–0.2 m/s, minimizing the possibility of air contamination from outside the isolation room. In particular, Case B of the typical floor design proposes a method to optimize the pressure distribution in the modular negative-pressure ward by designing the ventilation flow rate at atmospheric pressure level. Thus, this study emphasizes that atmospheric pressure design is appropriate when designing pressure in areas where negative-pressure control is difficult and can contribute to the design and improvement of similar medical facilities in the future.

1. Introduction

During the COVID-19 pandemic, the rapid increase in the number of confirmed cases led to a shortage of specialized medical facilities, complicating efforts to control the spread of the virus. In response, modular negative-pressure wards, which can be rapidly deployed, gained significant attention as a solution to the lack of hospital rooms. Negative-pressure wards house patients in isolation rooms and use pressure differences between adjacent rooms to prevent the spread of airborne viruses. Airborne infection isolation rooms (AIIR) are a key feature of these wards and typically consist of an anteroom, the main isolation room, and an attached toilet, aimed at completely containing contaminants. AIIRs require maintaining negative pressure and adequate ventilation to prevent the mixing of indoor air with contaminants and ensure that air, potentially containing viral particles, is exhausted outdoors [1]. In addition, since the air inside the AIIR contains viral particles, the negative-pressure level should be adjusted to ensure a pressure difference of at least 2.5 Pa between different zones [2]. The required air change per hour (ACH) is much higher than standard buildings [3], highlighting the critical role of the exhaust system in maintaining the necessary pressure differences. As interest in constructing these modular negative-pressure wards grows, it becomes essential to evaluate whether such approaches can fulfill the stringent ventilation needs required for effective operation.
In studies on AIIR’s heating, ventilation, and air conditioning system (HVAC), AIIR’s HVAC was designed through airflow analysis using computational fluid dynamics (CFD) [4], and an AIIR’s ventilation system was developed by selecting the location of supply and exhaust vents using SF6 tracer gas experiments and CFD analysis [5]. Additionally, the ventilation performance of the negative-pressure isolation room was also verified depending on the operation of the exhaust fan in the attached toilet [6], and the extent of air pollution spread was investigated according to the negative-pressure control in the outpatient area of the hospital [7]. Previous studies have proposed design methods for AIIR ventilation systems and highlighted key considerations for both the design [8] and the operation [9] of HVAC systems. However, the scope of previous studies is limited to isolated patient rooms in conventional buildings, and few studies have evaluated airflow analysis and ventilation performance in modular buildings.
Modular buildings typically seal joints with polyurethane or silicone sealants. However, due to the inherent characteristics of modular construction, including corner joints and the on-site assembly of exterior panels, achieving airtightness can be challenging [10]. This degradation of airtightness performance can reduce the building’s energy efficiency [11]. To address the issue of airtightness, one proposed solution involves minimizing the length of these joints [12], and a study was conducted to suggest airtightness standards for future modular construction [13]. As stated above, previous studies have mentioned the importance of airtightness in modular construction and have proposed solutions from a design perspective to address leakage. However, few studies have been conducted considering the effects of leakage from the HVAC system perspective. Furthermore, while existing analyses have been limited to AIIR, there is a lack of cases that identify and examine the airflow and pressure across the entire floor, including other areas like nursing support stations [14].
The modular negative-pressure ward presented in this paper utilizes an infill construction method, a technique that is currently under development in Korea [15]. This method offers significant flexibility in floor plan design by allowing the structural and infill components to be designed separately. This flexibility enables the creation of various modular configurations, distinguishing these wards from traditional negative-pressure facilities. To accommodate the insertion of infill modules, a holding door is installed on the outer wall of the external corridor. Additionally, paneling is used for the exterior finishing of the modular negative-pressure ward, allowing for on-site installation. However, there are concerns regarding the airtightness of the holding door and the paneling joints. If airtightness cannot be guaranteed, negative-pressure control will fail, leading to the risk of contaminant dispersion. As a result, careful design of the HVAC system is essential. Furthermore, in scenarios where multiple rooms are adjacent on a single floor, the negative-pressure requirement increases incrementally in stages, necessitating a progressively higher level of negative pressure. This setup can lead to complications if a leak occurs in the external corridor, which is a high negative-pressure area, and potentially causing the calculations for exhaust airflow rate control to become excessive.
Moreover, modular negative-pressure wards are more often built in response to special circumstances, such as disasters, making them more susceptible to issues like power supply interruptions compared to regular buildings. Furthermore, there are a lack of data on HVAC system design that take into account leakage as there has been no research on modular negative-pressure wards, which are different from isolation wards in general buildings.
To mitigate issues in areas where negative-pressure control is challenging, such as external corridors, this paper explores two scenarios: maintaining negative pressure or atmospheric pressure. The study reviews the effectiveness of contaminated air isolation under both conditions and proposes a suitable negative-pressure design. Overall, this research investigates the indoor airflow and pressure distribution in a modular negative-pressure ward, both at the level of individual unit modules and typical floors, with the aim of proposing optimal negative-pressure levels and providing basic data for the design of ventilation systems according to specific floor plans.

2. Research Method

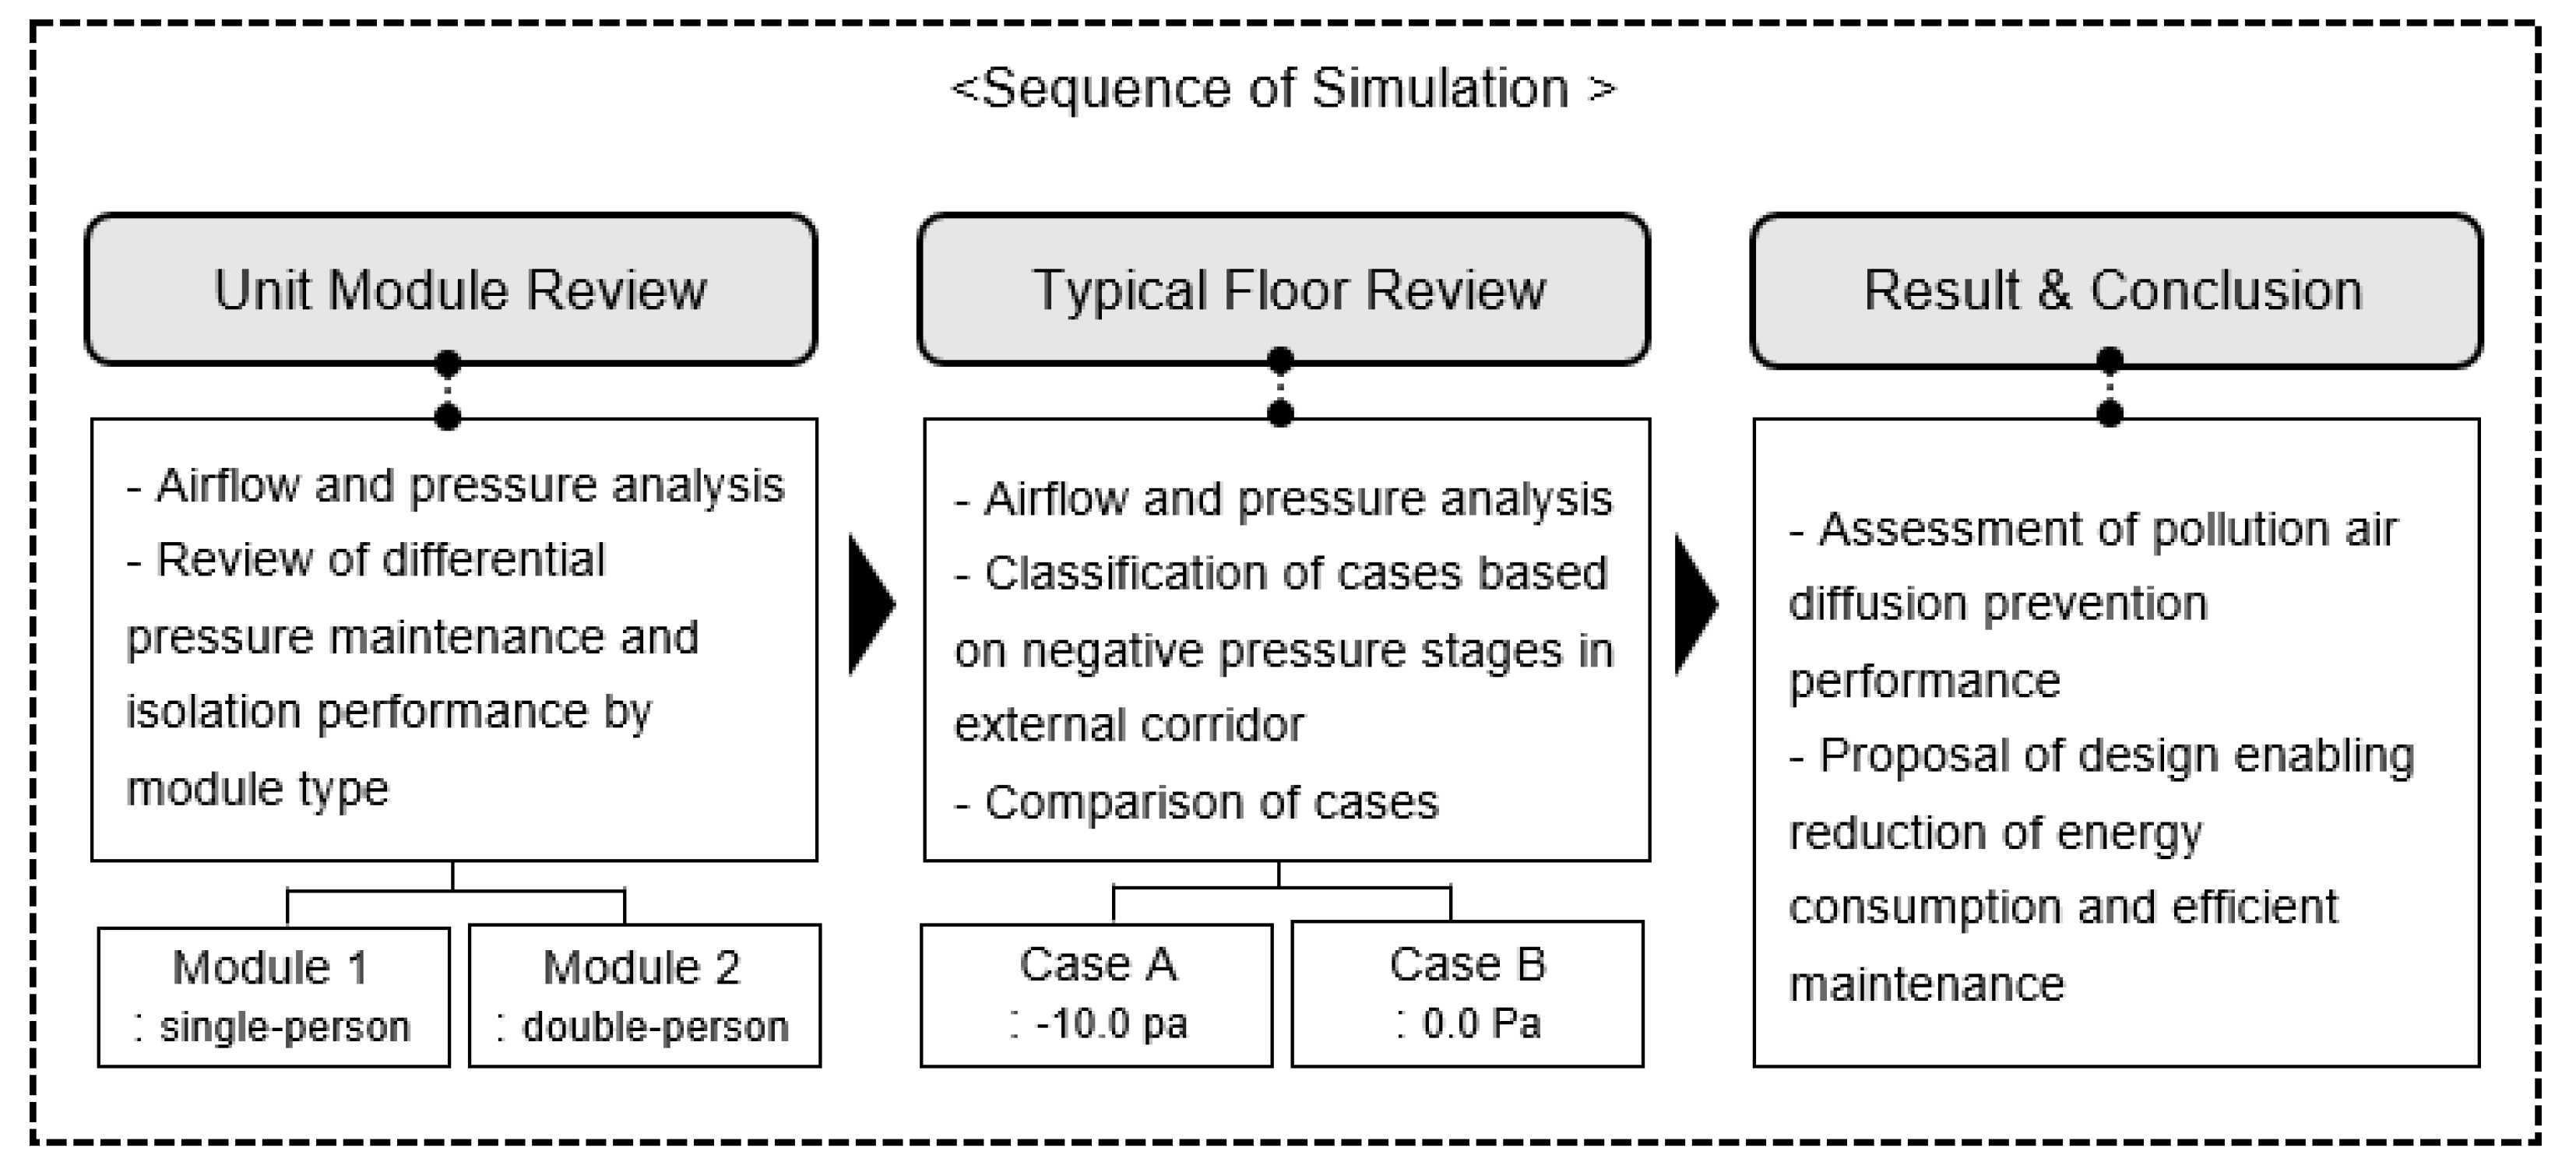
2.1. Study Scope and Process

The target building of this study is a modular negative-pressure ward that utilizes an infill construction method. This ward is comprised of unit modules categorized into single-person and double-person types, AIIRs, and a nursing support station, among others. The study aimed to evaluate the ward’s ability to maintain pressure differentials and isolate contaminated air between adjacent rooms by analyzing indoor airflow and pressure distribution across both the unit module and the floor. The analysis scope included the unit module and the typical floor. Computational fluid dynamics (CFD) tools, specifically SIEMENS (Berlin, Germany) STAR-CCM+, were utilized to assess pressure, convection, and heat transfer within the ward [16]. Simcenter STAR-CCM+ is a comprehensive computational aided engineering solution for solving multidisciplinary problems in fluid and solid continuum mechanics. This is one of the most comprehensive and widely used physics engines for solving fluid flow and heat transfer problems.
Figure 1 shows the process of the study. First, an airflow and pressure analysis of two unit modules is conducted according to the room type to review the performance of maintaining pressure difference and isolating contaminated air. Subsequently, the ventilation airflow rate of the supply and exhaust air vents is calculated to ensure that all areas of the typical floor, except for the unit modules, form the designed negative pressure. This approach allows for an evaluation of the isolation performance across the entire floor of the negative-pressure ward. To ensure the typical floor has a suitable negative-pressure design, the indoor airflow velocity and room pressure distribution are examined for two cases: Case A, where the external corridor negative pressure is −10 Pa, and Case B, where it is 0 Pa.

2.2. Cases of Reviewing a Negative-Pressure Level

Figure 2 illustrates the set negative-pressure levels across various zones of the typical floor in the target modular negative-pressure ward. The negative pressure is stratified into five levels: Level 1 at 0.0 Pa, Level 2 at −2.5 Pa, Level 3 at −5.0 Pa, Level 4 at −7.5 Pa, and Level 5 at −10.0 Pa. The external corridor of the target building is a space that is in contact with the external wall, and the pressure is set to the lowest level of −10 Pa according to the negative-pressure level. Since the external corridor is a contaminated zone, negative-pressure control is generally applied. Note that reducing the number of components needed to maintain negative pressure, as well as expanding the space at atmospheric-pressure levels, helps decrease the possibility of fan malfunction. Accordingly, simulations were conducted by dividing the cases to reduce the load on the exhaust system and enhance maintenance efficiency.
Case A assumes that the pressure in the external corridor was set to −10.0 Pa. The pressure in the nursing support station and the internal corridor was set to level 1, the clean corridor was set to level 2, the anteroom of the patient room was set to level 3, the patient room was set to level 4, and the toilet in the patient room was set to level 5. Case B considered the airtightness degradation caused by the leakage and set the pressure of the external corridor to the atmospheric-pressure level. The pressure conditions in other rooms were the same as in Case A. In addition, personal protective equipment (PPE) changing rooms, public toilets, and medical waste disposal rooms, as well as other zones, are designated as separate exhaust zones and maintained at −2.5 Pa. The simulation only calculates the leakage between adjacent rooms and does not consider factors such as the opening of doors or the movement of medical staff.

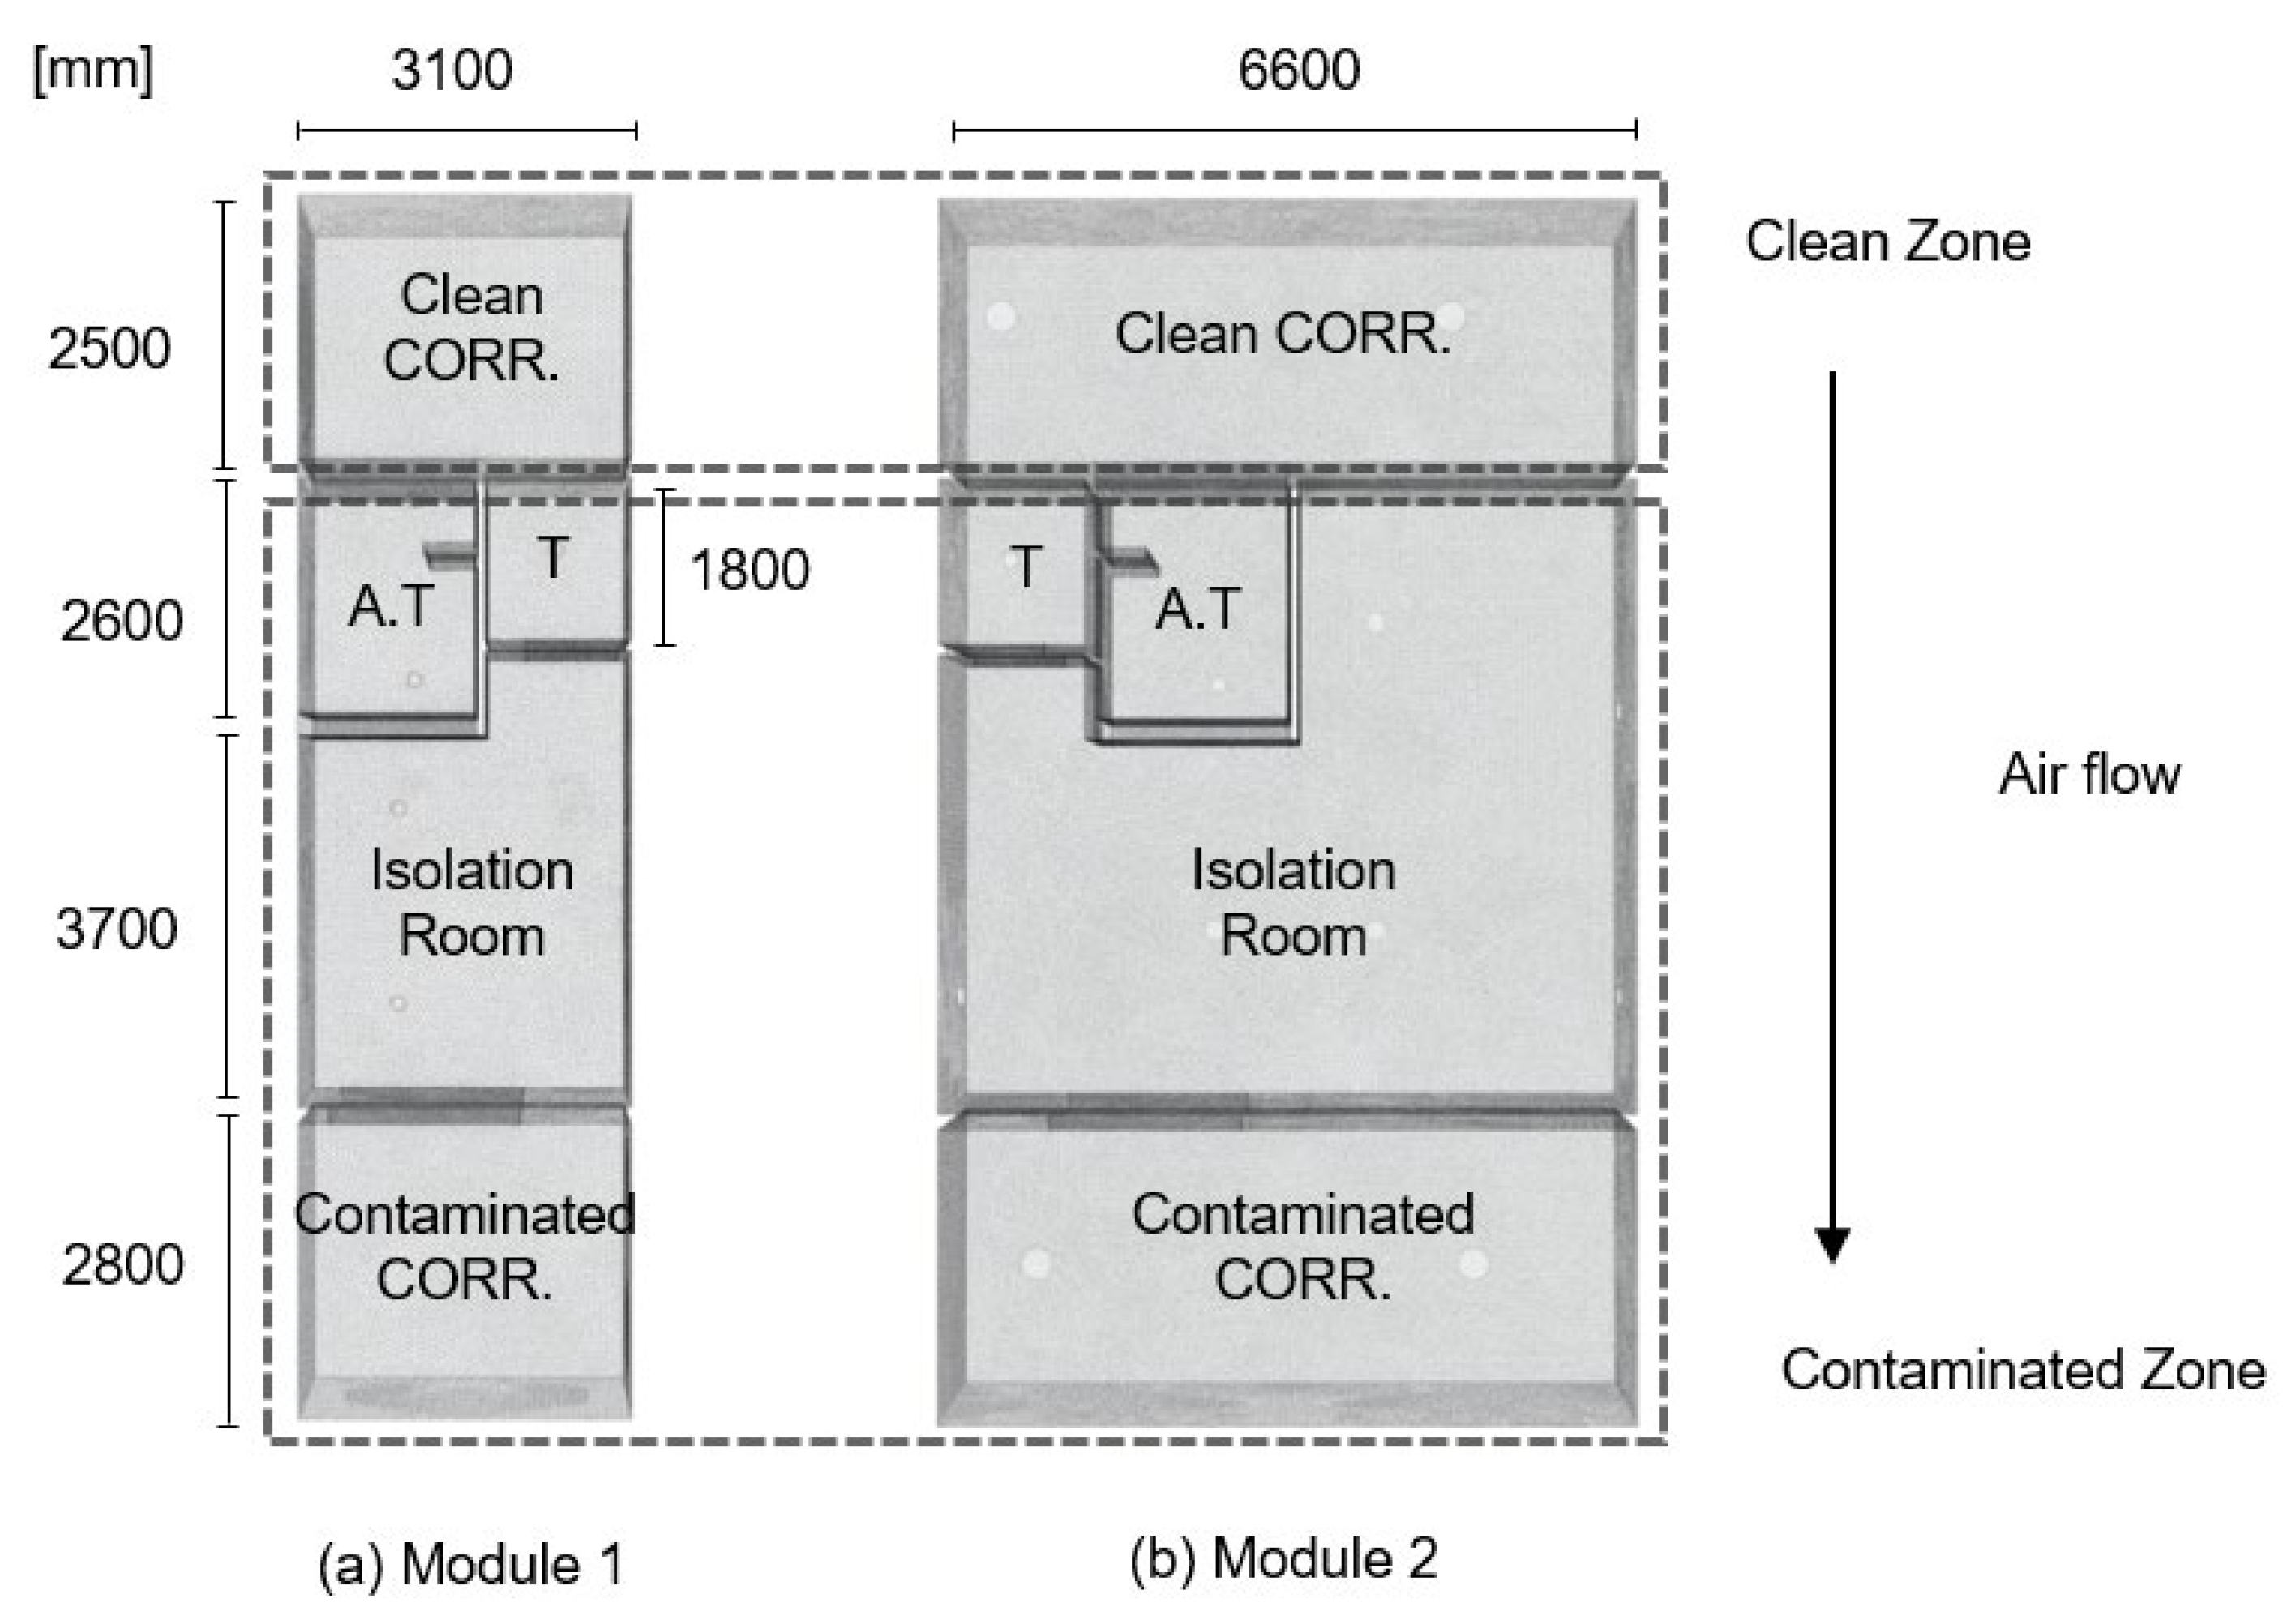
2.3. Unit Module Design and Performance Identification

2.3.1. Unit Module Simulation Configuration

The unit module comprises physical models of the clean corridor, anteroom, toilet, patient room, and external corridor. The size of Module 1, a single-person room, was 11,600 × 3100 × 2400 mm3 (L × W × H). It comprised a 3.6 m2 anteroom and a 12.5 m2 patient room. The size of Module 2, a double-person room, was 11,600 × 6600 × 2400 mm3 (L × W × H). The size of the anteroom was the same as Module 1, and the area of the patient room was 34 m2. Considering the leakage through the door gaps, a 5 mm cut was left at the top and bottom of all doors. To prevent medical staff from becoming infected, the exhaust vent in the patient room was located on the wall near the patient’s head, while all other supply and exhaust vents were located on the ceiling. The size of the supply and exhaust vents in the anteroom and toilet was ø150 mm, ø200 mm in the patient room, and ø300 mm in the corridor. Considering the narrow corridor area of Module 1, the supply and exhaust vents in the corridor zone were omitted.
The boundary conditions in the simulation are outlined in Table 1. According to the World Health Organization’s ventilation guidelines, the minimum ACH for healthcare isolation facilities is 6 times per hour. Twelve times per hour is recommended when aerosol-generating procedures (AGPs) are performed [17]. Similarly, the ASHRAE (American Society of Heating, Refrigerating and Air-conditioning Engineers) and CDC (Centers for Disease Control and Prevention) AIIR ventilation requirements also recommend 6 to 12 ACH [18,19]. In addition, to maintain negative pressure, a pressure difference of at least 2.5 Pa is recommended between adjacent rooms. Based on these guidelines, this paper calculated the supply airflow rate of the isolation room, considering both the cooling and heating loads and baseline of 6 ACH. The exhaust airflow rate was determined using the formula provided by the CDC [20], with the design airflow rate subsequently adjusted to align with the results from the simulation calculations.
Furthermore, the airflow was designed to be unidirectional, from the clean zone to the contaminated zone. Specifically, the ventilation airflow was designed to flow from the clean corridor (−2.5 Pa) to the anteroom (−5.0 Pa) to the patient room (−7.5 Pa) to the toilet and the external corridor (−10.0 Pa). As such, the HVAC airflow rate was calculated to maintain a room pressure difference of 2.5 Pa. Figure 3 illustrates the layouts of Module 1 and Module 2.
For the turbulence model, the Reynolds-averaged Navier–Stokes equations were used. The mean mass, momentum, and energy transport equations are given by Equations (1)–(3), respectively [21].
ρ t + ( ρ ν ¯ ) = 0
t ( ρ ν ¯ ) + ( ρ ν ¯ ν ¯ ) = ρ ¯ m o d Ι + ( Τ ¯ + Τ R A N S ) + f b
t ( ρ Ε ¯ ) + ( ρ Ε ¯ ν ¯ ) = ρ ¯ m o d ν ¯ + ( Τ ¯ + Τ R A N S ) ν ¯ q ¯ + f b ν ¯
Here, ρ refers to the density (kg/m3), ν ¯ refers to the average velocity (m/s), and p ¯ m o d = p ¯ + 2 3 ρ k represents the modified average pressure. In addition, p ¯ refers to the mean pressure (Pa) and k refers to the turbulent kinetic energy (m2/s2). Ι is an ID tensor, which can be defined as a linear operator. Τ ¯ is the average viscous stress tensor, f b is the result of the body force, Ε ¯ is the average total energy per unit mass, and q ¯ is the average heat flux. Furthermore, a realizable K-epsilon two-layer model (RKE 2L) that considers eddy viscosity was used to enable better interpretation than the standard K-epsilon model. RKE 2L is a model that solves the transport equations for turbulent kinetic energy and turbulent dissipation rate, as given by Equations (4) and (5).
t ( ρ k ) + ( ρ k v ¯ ) = [ ( μ + μ t σ k ) k ] + p k ρ ( ɛ ɛ 0 ) + S k
t ( ρ ɛ ) + ( ρ ɛ v ¯ ) = [ ( μ + μ t σ ɛ ) ɛ ] + 1 T e C ɛ 1 P ɛ C ɛ 2 f 2 ρ ( ɛ T e ɛ 0 T 0 ) + S ɛ
μ is the dynamic viscosity (kg/m/s), and σ k , σ ε , C ε 1 , C ε 2 are model coefficients. For the RKE 2L model, σ k is calculated as 1, σ ε is calculated as 1.2, C ε 1 is calculated as the maximum value of 0.43, and η 5 + η , and C ε 2 is calculated as 1.9. Here, the shape factor η can be obtained from S k / ε . P k and P ε are generated terms that vary depending on the k-epsilon model variables. They can be expressed as f c G k + G b γ M and f c S k + C ε 3 G b , respectively. f 2 is a decay function that decreases as k / ( k + ν ε ) and represents the decrease in turbulence mixing near the wall. S k , S ε is a user-defined term.

2.3.2. Review of the Isolation Performance of Contaminated Air in the Unit Modules

Table 2 shows the pressure distribution by unit module, while Figure 4 visualizes the average pressure at the cross-section where the patient’s respirator is located (0.85 m height). The calculation results showed that for Module 1, the anteroom’s average pressure was −4.9 Pa, and the patient room’s pressure was −7.5 Pa, resulting in a pressure difference of around 2.5 Pa being maintained between the rooms. The toilet pressure was recorded at −9.7 Pa, and the corridor, lacking supply and exhaust vents, was excluded from the analysis. For Module 2, the pressure in the anteroom was −4.7 Pa, and in the patient room, it remained at −7.5 Pa, leading to a pressure difference of 2.8 Pa between the two rooms. The pressure in the toilet was −10.1 Pa, aligning with planned levels, while the clean corridor was at −2.4 Pa and the external corridor at −9.5 Pa. The pressure distribution in the rooms was found to be in the following order from highest to lowest: clean corridor > anteroom > patient room > contaminated corridor > toilet. This pattern was also observed in Module 1, except for the corridors. Modules 1 and 2 did not produce exactly the same pressure between the rooms, but the difference was no greater than 0.3 Pa, which showed a similar pressure value. While a pressure difference of 0.3 Pa in actual construction may seem significant, it was determined that this difference had minimal impact on evaluating isolation performance during the design phase. Due to this pressure difference between the rooms, the airflow in both modules was observed flowing from clean to contaminated zones, indicating that the calculated supply and exhaust ventilation amount is estimated to be appropriate. This suggests that the isolation performance of the unit modules has been adequately validated. Figure 4 displays the calculated pressure distribution for each unit module. Module 1’s corridors, for which analysis could not be performed, was reviewed using the typical floor modeling.

2.4. Typical Floor Modeling and HVAC Design

Figure 5 depicts the layout of the supply and exhaust vents and the medical staff’s travel path on the typical floor of the modular negative-pressure ward, including the unit modules. The typical floor accommodates isolation rooms, a nurse station, a personal protective equipment (PPE) changing room with a shower, a locker room, medical waste disposal rooms (MWDRs), offices, and mechanical rooms. The layout comprises 8 beds across 5 rooms, including 2 single rooms and 3 double rooms.
In the physical model, the stairwell was omitted, and the medical staff’s travel path was designed to be separated from the patient’s travel path to prevent cross-infection [22]. Medical staff access the patient rooms via the nursing station, then pass through the PPE changing room and the clean corridor. They exit through the door on the opposite side and proceed to the external corridor. To minimize the spread of contaminants, the exhaust vents in the patient room were positioned on the lower wall near the patient’s head [23], and all other supply and exhaust vents were placed on the ceiling. The elevator and machine rooms were not air-conditioned and did not have separate supply and exhaust vents. The physical model measures 18 m long, 46 m wide, and 2.4 m high. Meshing was performed using a surface remesher, polyhedral mesher, and prism layer mesher. The grid size was 0.4 m, resulting in a total of approximately 48 × 105 cells.
Table 3 presents the calculation boundary conditions for Case A. Case A, assuming an external corridor pressure of −10.0 Pa, and Case B, with a pressure of 0.0 Pa, both had a supply air temperature of 26 °C. Gravity was set to 9.81 m/s2, and the calculation method was the same as for the unit module. The boundary conditions for the supply and exhaust vents were set as velocity inlet and pressure outlet, respectively. The supply air flow rate for all spaces excluding the shower room and public toilets, which did not have their own air vents, was calculated based on a minimum of 6 ACH. For the nursing station, the ACH for the room was calculated as 13 times per hour. The anteroom of the isolation room had an air change rate of 11 ACH, the single-patient room had an air change rate of 10 ACH, the double-patient room had an air change rate of 8 ACH, and the contaminated corridor (external corridor) had an air change rate of 7 ACH. Other rooms necessary for operations and management had a minimum ACH of 6.
The exhaust airflow rate varied depending on the negative-pressure level. The main difference between Case A and Case B was in the external corridor and MWDR 3. The exhaust of Case A was 1800 cubic meters per hour (CMH), while that of Case B was 1500 CMH. In addition, MWDR 3 was also adjacent to the external corridor, so the pressure values were different depending on the scenario. In Case A, negative-pressure control was efficiently maintained, but in Case B, the pressure value was higher than planned, so the exhaust air volume was increased from 400 CMH to 500 CMH.

3. CFD Calculation Results

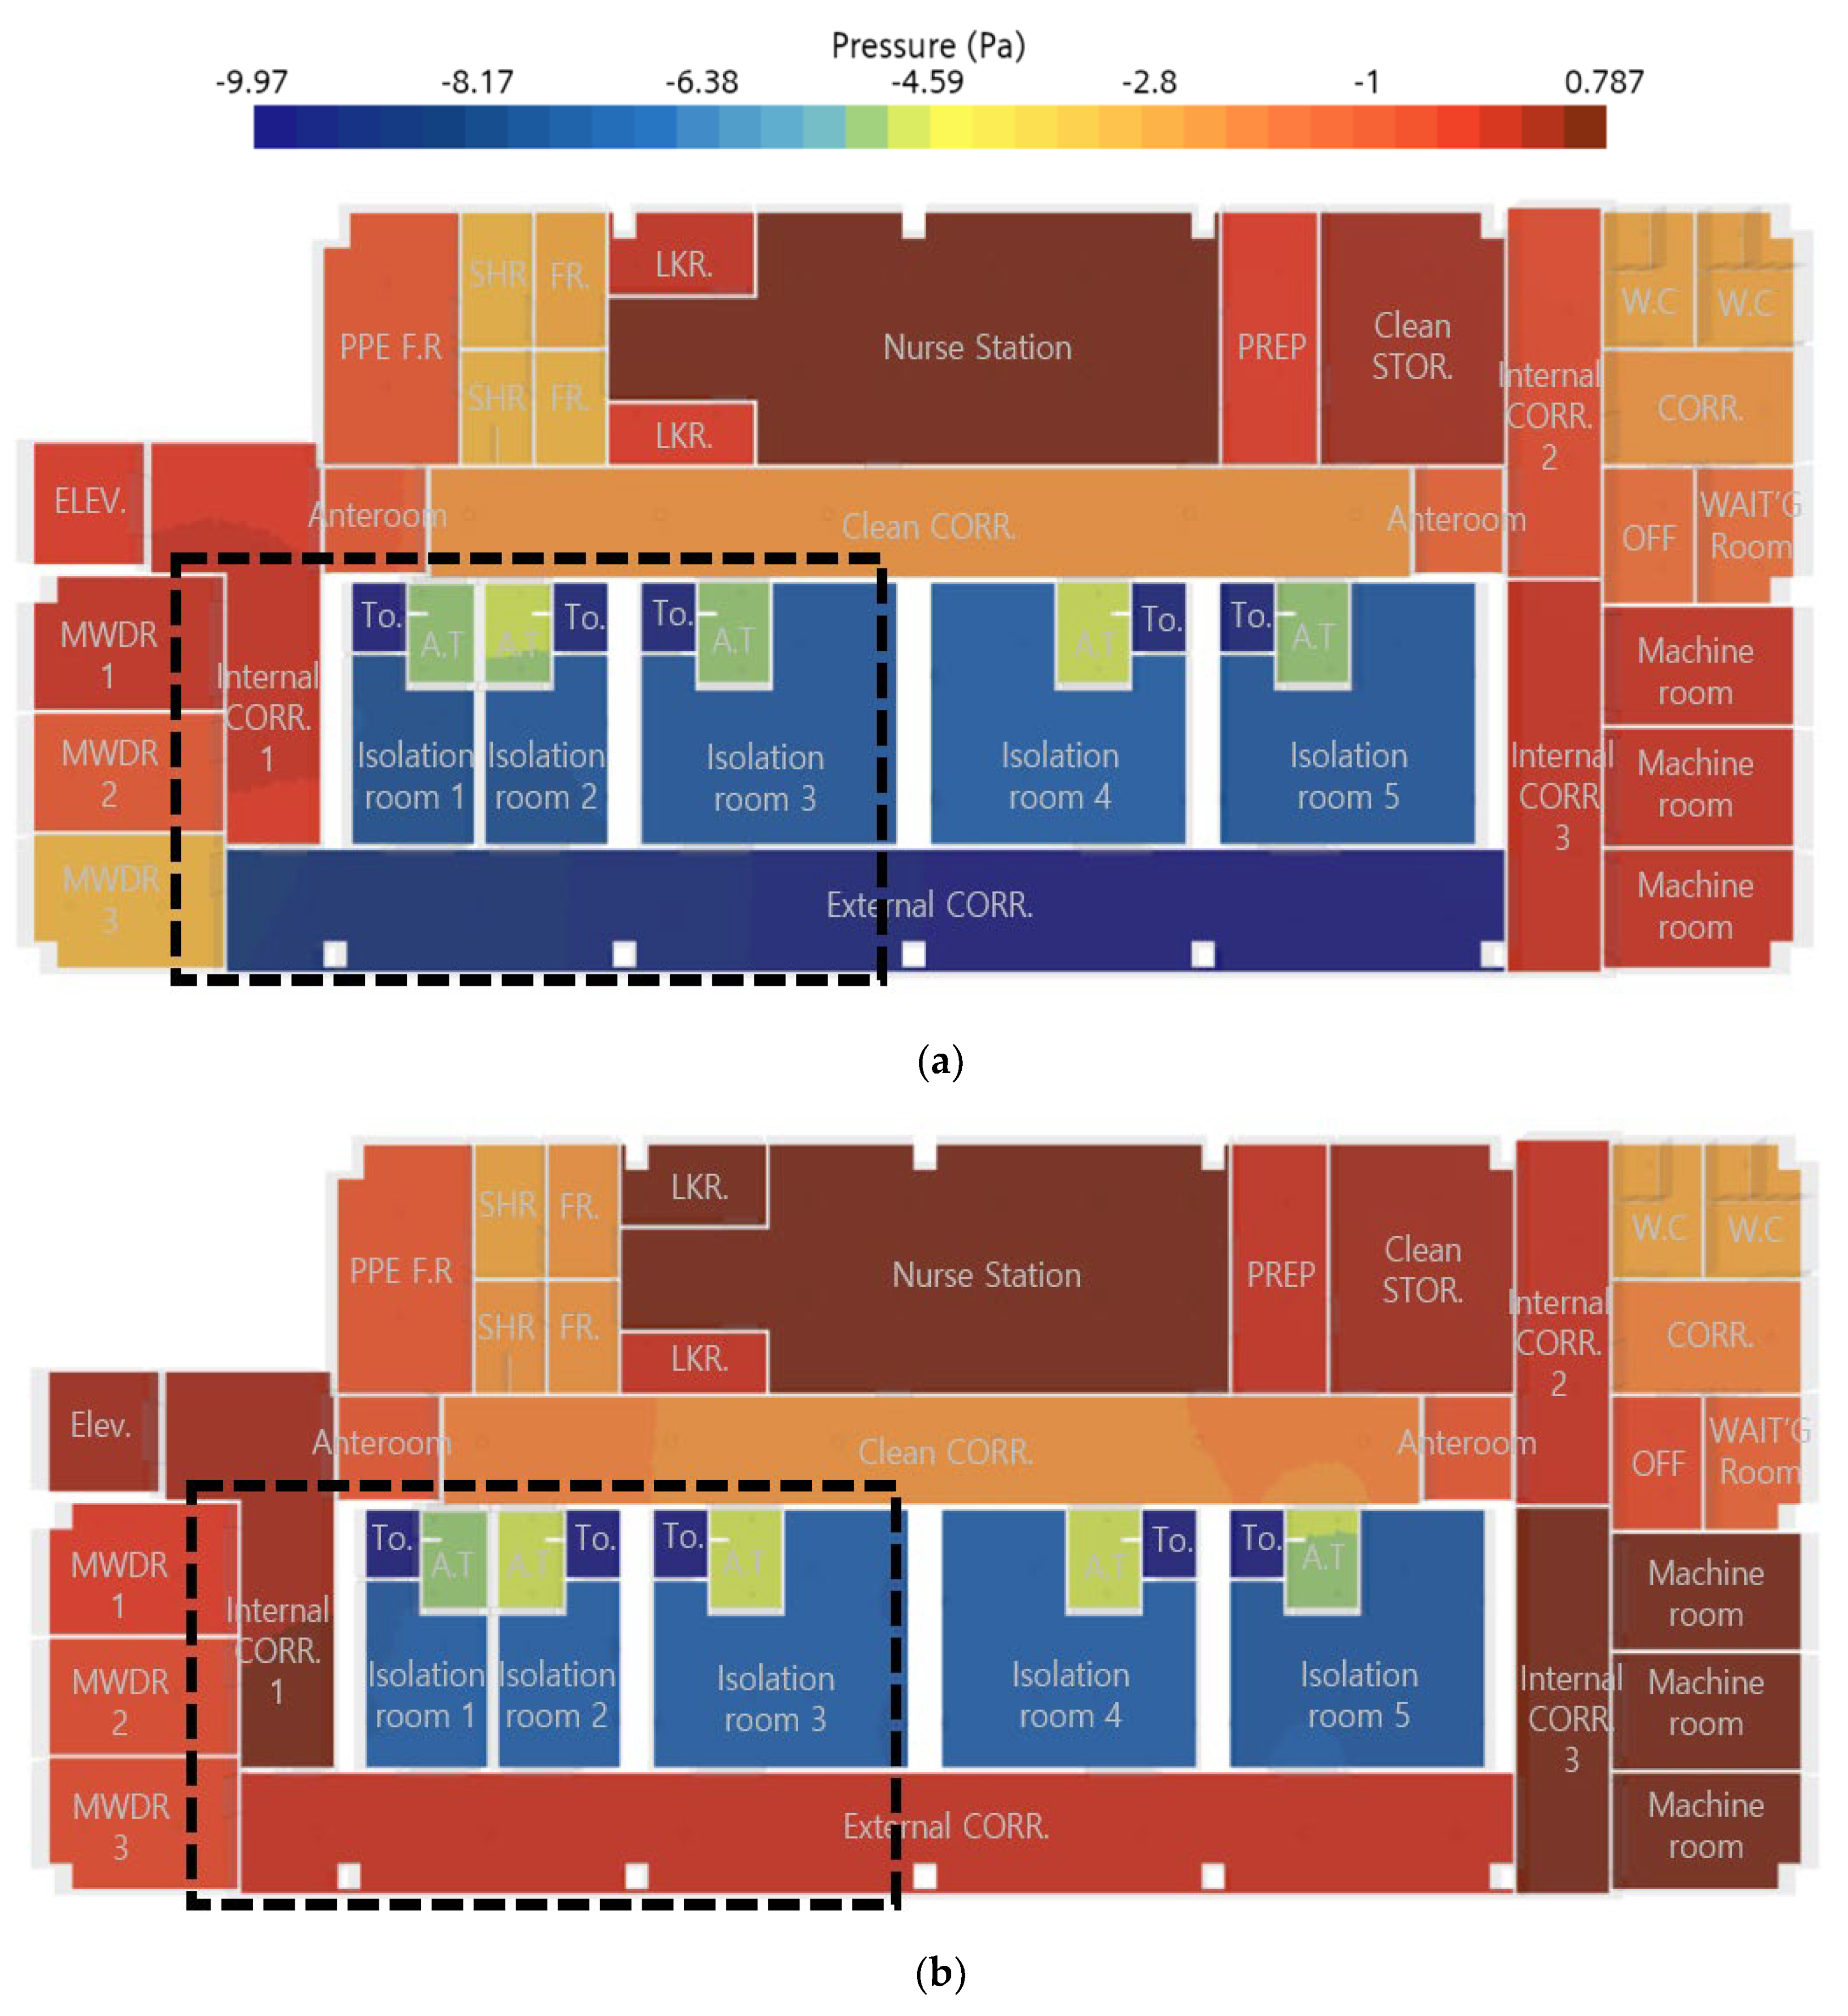
3.1. Evaluating the Actual Pressure Difference and Airflow Blockage Performance Using Pressure Distribution Analysis

The simulation results were analyzed on three criteria: pressure distribution, airflow path, and indoor airflow velocity. The performance of inter-room pressure difference and airflow blocking were evaluated using pressure distribution and airflow patterns, while airflow velocity was used to assess occupant comfort.
Figure 6 shows the calculation results of the pressure distribution by cases on the typical floor. Table 4 shows the average pressure value for each case. Atmospheric pressure was consistently maintained in clean zones, comprising the nurse station, preparation room, storage room, and internal corridors, for both cases. The PPE changing room was not able to achieve the intended pressure of −2.5 Pa as a result of the supply of air coming from the adjoining corridor anteroom. The pressure in the PPE changing room was found to be higher than the planned, at −1.9 Pa, while the pressure in the shower room, changing room, and public toilet was similar to the planned −2.5 Pa. Due to the negative pressure in the zone, the pressure difference between the nurse station and the room was maintained at approximately −2.5 Pa, which confirmed that the isolation performance was met. The contaminated zone, including the patient rooms, anterooms, and attached toilets, maintained the planned pressure levels, with a gradual increase in negative pressure observed from the clean zone. More specifically, the average pressure for each room was found to be −2.3 to −2.4 Pa for the clean corridor, −4.9 to −5.1 Pa for the anteroom, −7.5 to −7.6 Pa for the patient room, and −9.9 to −10 Pa for the attached toilet. Furthermore, there was a potential for contaminated air to be released when medical staff exited the patient rooms into the external corridor upon opening the doors. Most contaminants were effectively eliminated through the corridor’s exhaust vents, with no air diffusion detected. The maintenance of this differential pressure between the rooms indicates that the HVAC design airflow for the typical floor is appropriate. The differential pressure also creates an airflow pattern from the clean zone to the contaminated zone.
In Case A, the pressure in the external corridor was maintained at −9.5 Pa, creating a pressure difference of 2.0 Pa with the patient room. However, the pressure in the separate exhaust zone, MWDR 1 and 2, was found to be higher than the planned pressure due to the influence of the adjacent room, the internal corridor. The pressure distribution by rooms in Case A was found to be as follows: nurse station (clean zone) > PPE changing room > clean corridor > anteroom > patient room > external corridor and attached toilet.
Conversely, in Case B, the pressure in the external corridor was equal to atmospheric pressure, aligning the pressure level with the clean zone (nurse station and the internal corridor). Thus, the pressure distribution by rooms was as follows: nurse station > internal and external corridors > PPE changing room > clean corridor > patient rooms > attached toilet. Furthermore, it was found that the pressure in the patient rooms, excluding the toilets, was the lowest on the floor, ensuring that contaminants near patients were confined within the rooms and adequately ventilated.

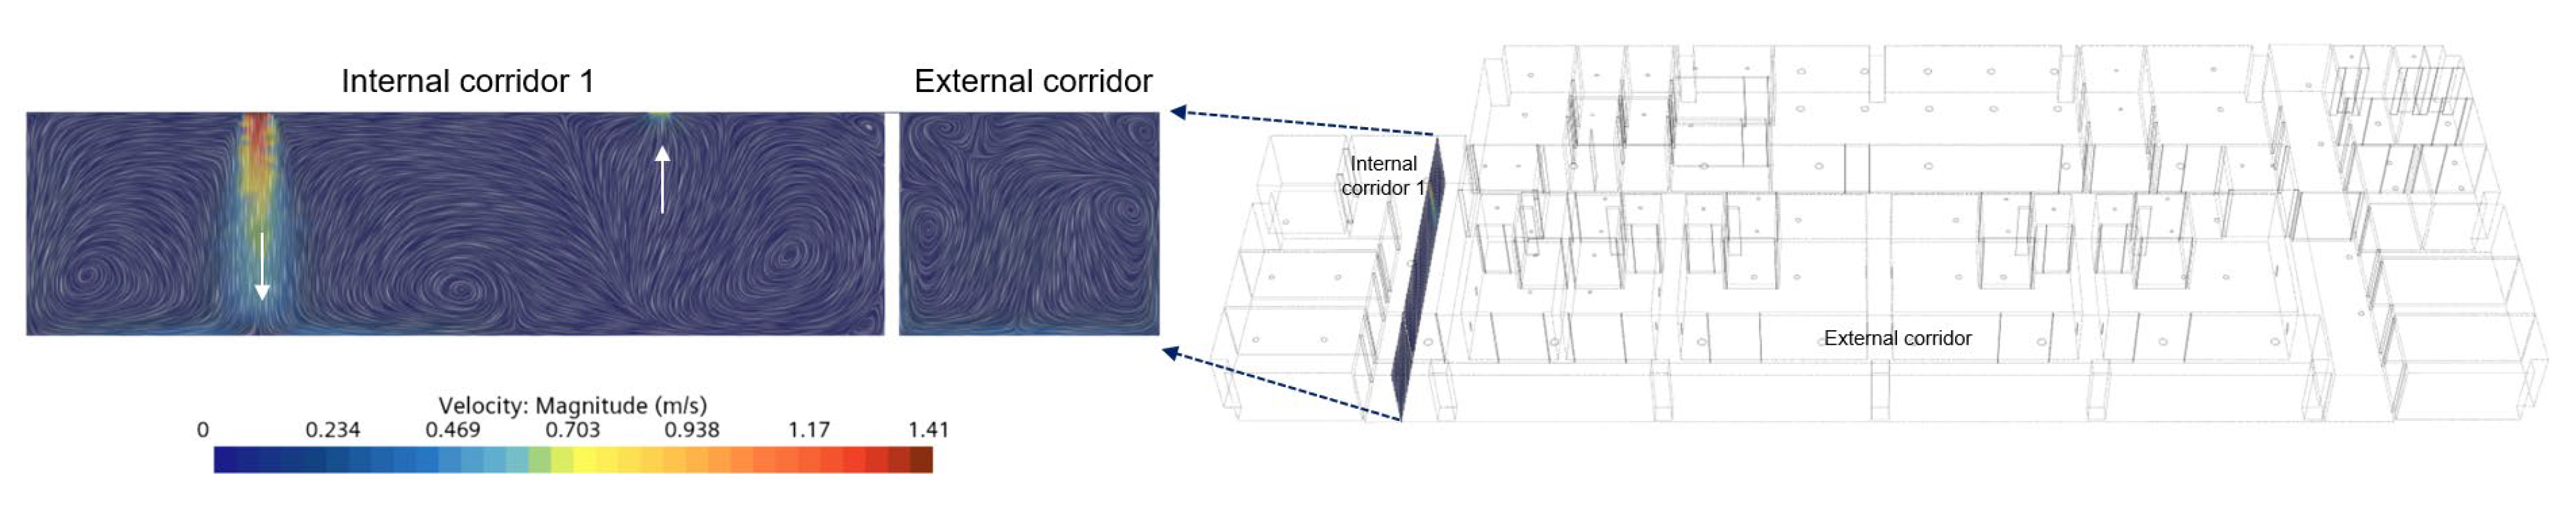
3.2. Evaluating the Indoor Airflow Rate and the Spread of Airborne Contaminants

The airflow velocity and contaminant spread within the dotted rectangular area outlined in Figure 6 was investigated. Figure 7 illustrates the airflow pattern in the patient rooms and corridors. Panel (a) shows the airflow pattern at a height of 0.85 m, while panel (b) shows the airflow pattern in the undercut at a height of 0–5 mm. Table 5 presents the average indoor airflow velocity for each case in Figure 7. For Case A, the analysis revealed that some of the supply air intended for each room was not being completely exhausted from those rooms and was instead leaking into the exterior corridor. However, although air from the internal corridor was drawn into the external corridor, the contaminated air could not move to the internal corridor and nurse station due to the pressure difference between the rooms. As shown in Figure 7a, the average airflow velocity was 0.188 m/s in the internal corridors, and 0.649 m/s in the external corridor, while the airflow in the patient rooms was slower at 0.197 m/s. The supplied air was exhausted from the medical staff positions towards the direction of patient respiration. Eddies were observed near the supply and exhaust vents, but they were typically confined to specific areas. As shown in Figure 7b, the air velocity around the entrance door increased to a maximum of 3 m/s. This is attributed to the small leakage area of the undercuts.
In Case B, air was exhausted in the patient room and the attached toilet without any leakage into the exterior corridor. The airflow pattern in Case B panel (a) was similar to that in Case A panel (a). In contrast, Case B panel (b) exhibited a different airflow pattern compared to Case A panel (b). The average air velocity was 0.946 m/s in the patient room and 0.938 m/s in the external corridor, showing the leakage towards the patient room. The analysis revealed that the leakage air reached a maximum velocity of 3.5 m/s, formed rapid airflow, and was observed only in the cross-section at the undercut height. A minimal amount of leakage from the exterior corridor to the interior corridor was detected; however, due to the proximity of the exhaust vent, the impact of contaminated air on the clean zone is considered negligible. Figure 8 illustrates the airflow between the clean-zone nursing support station and the contaminated-zone exterior corridor in the y-axis cross-section of the internal corridor for the Case B design. In Case B, due to the pressure difference between the interior and exterior corridors, leakage occurred at the top and bottom cuts of all doors. However, the careful placement of supply and exhaust vents in the interior corridor ensured that all of the incoming air from the exterior corridor was exhausted without diffusing into the clean zone. Furthermore, with the doors closed, the air remained stagnant within each corridor zone, preventing any movement between them.

4. Discussion

To propose an appropriate HVAC system design for modular negative-pressure wards, this study employed CFD simulations by distinguishing cases where the external zone was maintained at negative and atmospheric-pressure levels. Excluding the exhaust airflow rates in the external corridor and medical waste disposal room 3 (MWDR 3), the input conditions for Cases A and B were consistent. As a result, the analysis indicated that in both scenarios, the contaminated air originating from the patient rooms did not affect the clean zones. The airflow and pressure difference between the room and the adjacent room were found to change depending on the pressure in the external corridor.
The pressure in the external corridor of Case A was the lowest at −9.5 Pa, causing some air from the patient rooms, internal corridors, and MWDRs to flow into the external corridor and be vented out. As a result, contaminated air did not spread to other adjacent rooms and clean zones, and the internal corridor was found to play a role in preventing contamination. However, Zahad’s study highlights the challenge of achieving energy conservation targets in buildings with poor airtightness [24]. In this regard, there are concerns that increasing the power of the exhaust fans to maintain a low pressure in the external corridors could lead to higher energy consumption. Additionally, should the exhaust fans malfunction, there is a risk of contaminated air spreading due to a collapse in pressure difference.
In contrast, in Case B, contaminated air in the patient rooms and toilets was exhausted, and the external corridor maintained atmospheric pressure, resulting in the same pressure level as the clean zone. According to Lee’s study, airflow plays the most crucial role in determining isolation performance [25]. Case B does not represent the airflow in a typical negative-pressure isolation room. However, by designing the ventilation rate to be at atmospheric pressure, the number of elements and devices required to maintain negative pressure can be reduced, thereby saving energy. Moreover, in the event of a supply or exhaust fan malfunction, this design is unlikely to cause issues with pressure maintenance, preventing the spread of contamination. Here, the internal corridor located between the clean zone and the external corridor is expected to act as a buffer space against the spread of contaminated air. In other words, an appropriate ventilation system may be designed according to whether the buffer space is present along the entry path of the contaminated zone, thereby enabling energy conservation and efficient maintenance.
Given these findings, this paper proposes a pressure design for Case B that reduces fan energy consumption and simplifies ventilation system management by setting the pressure in the external corridor to atmospheric pressure. Due to challenges associated with conducting comprehensive CFD simulations for all performance evaluations, this study has prioritized minimizing cross-infection among medical staff and efficient system validation. The isolation performance for contaminated air was indirectly assessed by evaluating the maintenance of negative pressure and airflow patterns. This study lacks the ability to measure contaminant concentrations and movement patterns, which is a limitation compared to previous research on negative-pressure isolation rooms. Additionally, this study did not provide quantitative energy consumption data for each case, making it impossible to compare them. However, this study breaks new ground by investigating the system design and sound insulation performance of modular facilities, as opposed to conventional buildings. It proposes a pressure design that considers the modular nature of these facilities, thus making it a valuable contribution to the field. The insights gained from this study can act as a valuable reference in informing future designs of modular negative-pressure wards, helping to structure the floor plan based on varying levels of negative pressure.

5. Conclusions

This paper utilized CFD simulations to assess the isolation performance of individual modules in a modular negative-pressure ward, using the infill construction method to determine the system airflow rates. A comparative analysis of inter-room pressure distribution and airflow was performed across the typical floor for each case, leading to the proposal of an appropriate negative-pressure distribution.
A review of the airflow rate design of the supply and exhaust vents in the unit modules showed that both Modules 1 and 2 maintained a pressure difference of at least 2.5 Pa between the rooms, ensuring consistent airflow from the clean zone to the contaminated zone. Based on the calculated airflow rate, CFD simulations were conducted for the entire typical floor, confirming that the pressure difference between the rooms for both Case A and Case B was 2.5 Pa or higher, with airflow occurring at a slow velocity of 0.1 to 0.2 m/s. In particular, operating the ward based on the negative-pressure level of Case B could prevent the spread of contaminated air and reduce energy consumption in the exhaust system. Furthermore, establishing a separate room between the exterior corridor and the clean zone effectively blocked air movement. This indicates that isolation can be achieved without the need for negative-pressure control. Thus, in situations where negative-pressure control is challenging due to leakage issues, maintaining atmospheric pressure within the enclosed space is considered an effective approach, irrespective of whether the area is contaminated.
This study can serve as a preliminary investigation for future research and real-world applications of modular negative-pressure ward HVAC design. These insights provide guidance for establishing pressure design directions based on the ward’s layout, thereby facilitating a rapid design process. Ultimately, this will contribute to the rapid provision of medical facilities in the event of a disaster situation, such as the COVID-19 pandemic.
This study did not compare energy consumption across different cases. We plan to present quantitative values based on different scenarios in future research. Furthermore, it appears that additional research is necessary on the design methods for maintaining atmospheric-pressure-level pressure.

Author Contributions

Conceptualization, H.-E.P. and Y.-H.S.; Methodology, Y.-H.S.; Software, H.-E.P.; Investigation, H.-E.P. and Y.-H.S.; Resources, S.G.; Data curation, S.G.; Writing—original draft, H.-E.P.; Funding acquisition, Y.-H.S. All authors have read and agreed to the published version of the manuscript.

Funding

This research was funded by a grant of the project for Infectious Disease Medical Safety, funded by the Ministry of Health and Welfare, Republic of Korea (grant number: RS-2022-KH125519 (HG22C0044)).

Data Availability Statement

The original contributions presented in the study are included in the article, further inquiries can be directed to the corresponding author.

Conflicts of Interest

The authors declare no conflict of interest.

References

  1. ANSI/ASHRAE/ASHE Standard 170-2017; Ventilation of Health Care Facilities. ASHRAE (American Society of Heating, Refrigerating and Air-Conditioning Engineers): Peachtree Corners, GA, USA, 2017.
  2. Selvan, P.T.; Abhiram, K.; Raghava, C.A.; Sai, V.N. CFD analysis of the fluid motion in the isolation rooms. IOP Conf. Ser. Earth Environ. Sci. 2021, 850, 012025. [Google Scholar] [CrossRef]
  3. Noh, S.; Park, M.; Sim, W.; Choi, C.; Ha, M. Application of virtual product design to the development of HVAC solution for Incheon International Airport Modular COVID-19 testing center. Case Stud. Chem. Environ. Eng. 2022, 6, 100257. [Google Scholar] [CrossRef] [PubMed]
  4. Lind, M.C.; Koskela, H.; Venås, B.; Vikan, A.W.; Kalliomäki, P.; Harsem, T.T. Designing Simplified Airborne Infection Isolation Rooms to Reduce Infection Rate in Future Pandemics. ASHRAE Trans. 2019, 125, 280–287. [Google Scholar]
  5. Cho, J.; Woo, K.; Kang, H. Experimental Study of an AIIR Ventilation System for Effective Removal of Airborne Contamination in Hospitals. J. Archit. Inst. Korea Struct. Constr. 2017, 33, 85–90. [Google Scholar] [CrossRef]
  6. Cho, J.; Kim, J. Evaluation of Ventilation Performance of a Mobile Negative Pressure Isolation Room for Infectious Disease Response to Prevent Infection. Korean J. Air-Cond. Refrig. Eng. 2023; 35, 253–264. [Google Scholar]
  7. Bang, J.; Sung, M. Study on the Prevention of the Spread of Airborne Pathogen with CFD Simulation and Experiments of Tracer Gas in Outpatient Departments of Medical Facility. J. Archit. Inst. Korea 2023, 39, 187–194. [Google Scholar]
  8. Le, T.-L.; Nguyen, T.T.; Kieu, T.T. A CFD Study on the Design Optimization of Airborne Infection Isolation Room. Math. Probl. Eng. 2022, 2022, e5419671. [Google Scholar] [CrossRef]
  9. Kong, X.; Guo, C.; Lin, Z.; Duan, S.; He, J.; Ren, Y.; Ren, J. Experimental study on the control effect of different ventilation systems on fine particles in a simulated hospital ward. Sustain. Cities Soc. 2021, 73, 103102. [Google Scholar] [CrossRef]
  10. Lee, J. Insulation and Airtight Plan of the Modular Construction System. Rev. Archit. Build. Sci. 2014, 58, 28–31. [Google Scholar]
  11. Tanyer, A.M.; Tavukcuoglu, A.; Bekboliev, M. Assessing the airtightness performance of container houses in relation to its effect on energy efficiency. Build. Environ. 2018, 134, 59–73. [Google Scholar] [CrossRef]
  12. Chung, J.; Lim, S.; Seol, W.; Lee, K. Improvement Plan of Airtight Performance in PC Modular House according to Passive House Standard. J. Korean Inst. Archit. Sustain. Environ. Build. Syst. 2023, 17, 1–14. [Google Scholar]
  13. Chung, J.; Lim, S.; Seol, W.; Yang, H.; Lee, K. Research on Improvement Measures based on Experimental Results of Airtightness Performance of Modular Negative-pressure wards. J. Korean Inst. Archit. Sustain. Environ. Build. Syst. 2023, 17, 422–433. [Google Scholar]
  14. Park, H.; Song, Y. A Study on the Isolation Performance of Modular Negative Pressure Room by Air Flow Analysis. J. Korean Inst. Archit. Sustain. Environ. Build. Syst. 2023, 17, 284–295. [Google Scholar]
  15. Choi, K.; Yun, H. A Study on Implications and Planning Directions for the Development of a Modular Airborne Infection Isolation Ward. J. Korea Inst. Healthc. Archit. 2022, 28, 7–16. [Google Scholar]
  16. Bhattacharyya, S.; Dey, K.; Paul, A.R.; Biswas, R. A novel CFD analysis to minimize the spread of COVID-19 virus in a hospital isolation room. Chaos Solitons Fractals 2020, 139, 110294. [Google Scholar] [CrossRef] [PubMed]
  17. WHO. Roadmap to Improve and Ensure Good Indoor Ventilation in the Context of COVID-19; WHO: Geneva, Switzerland, 2021. [Google Scholar]
  18. Ninomura, P.; Rousseau, C.; Bartley, J. Updated guidelines for the design and construction of hospitals and healthcare facilities. Ashrae J. 2006, 48, H33. [Google Scholar]
  19. CDC. Guidelines for Environmental Infection Control in Health-Care Facilities. Morb. Mortal. Wkly. Rep. Recomm. Rep. RR 2003, 52, 1–42. [Google Scholar]
  20. Jo, S.; Kim, G.; Sung, M. Analysis on contaminant Migration from Negative Pressure Isolation Ward during Door Opening and Human Movement using CFD Simulation. J. Archit. Inst. Korea Struct. Constr. 2017, 33, 61–68. [Google Scholar]
  21. Available online: https://docs.sw.siemens.com/en-US/doc/226870983/PL20220729105072148.starccmp_userguide_html (accessed on 30 March 2024).
  22. Cho, J. A Reference Model and HVAC Design Criteria of Mobile Negative Pressure Isolation Room for Responding to Infectious Disease Outbreaks. J. Archit. Inst. Korea 2022, 38, 195–205. [Google Scholar]
  23. Cho, J.; Jang, S.; Song, J. Onsite measurement and dilution-based infection risk assessment for a new mobile negative pressure isolation (MNPIR) as a solution to minimize cross-infection. Sustain. Cities Soc. 2023, 95, 104583. [Google Scholar] [CrossRef]
  24. Zahed, F.; Pardakhti, A.; Motlagh, M.S.; Kari, B.M.; Tavakoli, A. The effect of airtightness required in building energy conservation regulations on indoor and outdoor originated pollutants. Heliyon 2023, 9, e20378. [Google Scholar] [CrossRef]
  25. Lee, J.H.; Shim, J.W.; Lim, M.H.; Baek, C.; Jeon, B.; Cho, M.; Park, S.; Choi, D.H.; Kim, B.S.; Yoon, D.; et al. Towards optimal design of patient isolation units in emergency rooms to prevent airborne virus transmission: From computational fluid dynamics to data-driven modeling. Comput. Biol. Med. 2024, 173, 108309. [Google Scholar] [CrossRef] [PubMed]
Figure 1. Research process.
Buildings 14 01623 g001
Figure 2. Negative-pressure level setting for each case. (a) Case A (external corridor: −10.0 Pa); (b) Case B (external corridor: 0.0 Pa).
Buildings 14 01623 g002
Figure 3. Layouts of unit modules 1 and 2.
Buildings 14 01623 g003
Figure 4. Calculated pressure distribution for each unit module. (a) Module 1; (b) Module 2.
Buildings 14 01623 g004
Figure 5. Locations of the supply and exhaust vents and travel path of medical staff.
Buildings 14 01623 g005
Figure 6. Calculated results of the pressure distribution of two cases by rooms in the typical floor. (a) Module 1; (b) Module 2.
Buildings 14 01623 g006
Figure 7. Airflow pattern in the patient room and corridor. (a) h = 0.85 m; (b) undercut.
Buildings 14 01623 g007
Figure 8. The y-axis cross-section of the internal corridor for case design.
Buildings 14 01623 g008
Table 1. CFD simulation boundary conditions of the unit modules.
(m3/h)Module 1Module 2
SupplyExhaustSupplyExhaust
Clean corridor--300360
Anteroom100150100150
Isolation room3204806901020
Toilet-40-40
Contaminated corridor--375450
Table 2. Pressure magnitude by unit module.
Module 1Module 2
Clean corridor-−2.3931
Anteroom−4.937−4.6609
Isolation room−7.4866−7.4829
Toilet−9.721−10.1279
Contaminated corridor-−9.4684
Table 3. CFD simulation boundary conditions for Case A.
Pressure (pa)ZoneCMH (m3/h)Remark
SupplyExhaust
0Nurse station2500Clean zone
Medical staff’s prep room100
Medical staff’s storage room150
Internal corridor 1350
Internal corridor 2100
Internal corridor 3200
−1.0Internal corridor anteroom × 2190230
Office and waiting room200400
−2.5Clean corridor9001080
PPE changing room *250300Contaminated zone
Shower room × 2 *-100
Changing room × 2 *-100
Locker × 2100100
Public toilet × 2*-100
Office corridor *200400
MWDR 1 *300600
MWDR 2 *200500
MWDR 3 *200400
−5.0Anteroom of an isolation room × 55001900
−7.5Isolation room 1 and 2640960
Isolation room 3–520703060
−10.0Attached toilet × 5-200
External corridor15001800
Total10,65012,230
* Separate exhaust zone.
Table 4. Average pressure value (Pa) by case.
ZoneCase ACase B
Nurse station1.310.86
Medical staff’s prep room0.190.02
Medical staff’s storage room0.350.04
Internal corridor 10.590.47
Internal corridor 20.110.08
Internal corridor 30.590.57
Internal corridor anteroom L−1.13−0.99
Internal corridor anteroom R−1.07−10.9
Office and waiting room−1.57−1.59
Clean corridor−2.36−2.35
PPE changing room−1.88−1.89
Shower room−2.63−2.69
Changing room−2.50−2.53
Locker0.090.06
Public toilet−2.46−2.85
Office corridor−2.10−2.12
MWDR 1−0.78−0.43
MWDR 2−1.86−0.69
MWDR 3−2.45−0.68
Anteroom of an isolation room1−5.11−4.96
2−4.89−4.87
3−5.01−4.91
4−5.00−4.92
5−5.23−5.13
Isolation room1−7.66−7.49
2−7.64−7.47
3−7.60−7.53
4−7.61−7.52
5−7.63−7.56
Attached toilet 1~5−10.1−10.00
External corridor−9.520.45
Table 5. Indoor airflow velocity (magnitude) for each case in isolation rooms and internal/external corridors (h = 0.85 m).
Case ACase B
Clean corridor0.16020.5862
Anteroom 1 and 20.63910.3675
Isolation room 1 and 20.17950.1406
Toilet 1 and 20.16200.4030
Anteroom 30.39170.3846
Isolation room 30.19710.2839
Toilet 30.15530.3825
Internal corridor0.18720.2728
External corridor0.64950.5908
Disclaimer/Publisher’s Note: The statements, opinions and data contained in all publications are solely those of the individual author(s) and contributor(s) and not of MDPI and/or the editor(s). MDPI and/or the editor(s) disclaim responsibility for any injury to people or property resulting from any ideas, methods, instructions or products referred to in the content.

