Abstract
Rooftop solar modules are usually held in place by racks or frames that are mechanically attached to a roof structure and/or by heavyweight, ballasted footing mounts. These mounts ensure that the panel system remains in position against wind load. However, mechanical connectors create penetrations into the water-resistant layer of the roof, whereas ballasted footing mounts cause a significant additional load on the load-bearing structure of roof. For these reasons, adhesive connection seems to be a beneficial solution. Acrylic adhesive tapes, marked as VHBTM, may provide sufficient strength, and they have no need for mechanical fasteners or ballast. Acrylic adhesive tapes also provide a comfortable, fast, and efficient bonding process with no curing compared to liquid adhesives. On the other hand, resistance to water at load-bearing joints has not been sufficiently studied yet and could be critical for connections exposed to the outdoor environment. The present study aims at the determination of water resistance and durability of the VHBTM tapes from the GPH series, which are typically used to bond a variety of substrates including many metals. The mechanical properties and failure modes are compared for the specimens before and after a 21-day immersion in water. A significant reduction in strength was observed, depending on the substrate material. The study of chemical changes in the acrylic tape and in its leachate through infrared spectroscopy (FT-IR), X-ray fluorescence, and X-ray diffraction analyses clarified the reduction in mechanical properties. The selected VHBTM tape demonstrated strong resistance to the effects of water. However, the overall strength of the joint after immersion was significantly impacted by the decrease in adhesion to a specific substrate.
1. Introduction
The acrylic adhesive tapes are currently increasingly used as an assembly technology and are finding their way into unique applications, including the construction industry, e.g., as the attachment of architectural cladding, façade panels, or glazing for curtain wall systems. The acrylic adhesive tapes are a pressure-sensitive adhesive (PSA) which creates a bond when pressure is applied. PSA tapes thicker than 0.25 mm are made of a foam core coated with PSA on both sides. These foam tapes are generally suitable for bonding long joints, filling gaps, and materials with some geometric deviations [1]. They can replace conventional mechanical fasteners and liquid adhesives.
According to the producer’s bulletin [2], the closed-cell foam core structure of VHB™ provides excellent environmental durability, immediate handling strength due to pressure-sensitive adhesive bonds, and appropriateness for a variety of substrates depending on the series of the tape. In addition, the GPH series (general-purpose high-temperature) may have a good temperature and UV resistance. However, these superior properties have not been sufficiently proven by third-party studies yet. While many studies focused on the durability of various adhesives in metal joints, e.g., [3,4,5,6], only several of them were focused on the adhesive tapes and their specialties—for example, in a failure mode.
1.1. VHB Tapes in Metal Joints at Various Temperatures and Testing Rates
In [7,8,9,10], the strength of the VHBTM bonded aluminum specimens is studied at various temperatures. Čolo et al. [7] tested the VHBTM tape 4611F with an aluminum substrate with and without a primer coating at various temperatures up to 150 °C. They concluded that the application of a primer is not recommended at elevated temperatures because of the lower strength of primed specimens compared to specimens without a primer coating.
Townsend et al. [8,9] carried out a study focused on the comparison of three silicones and the VHBTM tape G23F applied to the anodized aluminum joints. The study contained ramp-to-fail tests carried out at three temperatures (23, 40, and 60 °C) and at three cross-head displacement rates (5, 50, 500 mm/min). Moreover, the creep tests and viscoelastic characterization were performed. The VHBTM tape had a lower strength than most structural silicones in the time ranges studied; however, the short-term strength on the VHBTM tape exceeded that of structural silicones, which could be advantageous in applications with wind loading or protective glazing. In these studies [8,9], the silicone sealants generally lasted longer than the VHBTM tape under the applied creep rupture stresses. However, the presence of a defect in a silicone specimen reduced the time to failure when compared to a VHBTM tape specimen under the same conditions.
Bull et al. [10] studied acrylic foam tape (AFT) and silicone sealants in anodized aluminum joints to cover their fundamental difference, and their viscoelastic versus elastic behaviors could be relevant for structural silicone glazing systems (SSGS). They found, as expected, that the AFT had greater sensitivity to the test rate and temperature than silicones. At the lowest test speed, the AFT showed an increase in strength with decreasing temperature; however, at higher test speeds, the strength was lower under both hot and cold conditions than at an ambient temperature, likely due to the adhesion failure under these extreme conditions.
Kremer [11] studied the acrylic adhesive tapes for the construction industry—in the façade cladding panel that was fixed with acrylic adhesive tapes and compared them to a silicone sealant. He concluded that the acrylic adhesive tapes had performance equivalent to a silicone sealant for a short-term loading, while long-term static strengths of these tapes were about 1/4 of the static strength of silicone sealants. Moreover, both tested acrylic adhesive tapes showed a clean adhesive failure on aluminum substrate.
1.2. Adhesion of the VHB Tapes to a Metal Substrate
The obvious gap in the currently available research literature for adhesive tapes is also in substrate (or adhesive) surface treatments and modifications to improve the interfacial adhesion in the field of structural applications. Čolo et al. [7] tested the primer coating on aluminum substrate; Townsand et al. [8,9] and Bull et al. [10] used the anodized aluminum for their specimens but did not focus on how surface treatments affected the ability to withstand water or moisture.
Qiao et al. [12] studied plasma treatments on both substrate and thermoset-based adhesive tape in dissimilar joints (aluminum and carbon fiber reinforced thermoplastic polymer) and found a significant improvement in single-lap shear strength, up to 315%, compared to joints without any plasma treatment of the bonded surfaces under room conditions.
1.3. Use of Photovoltaic Solar Panels on Building Rooftops
Although acrylic adhesive tapes are not broadly investigated, especially for the structural use in buildings, nowadays the use of photovoltaic (PV) solar panels on rooftops of buildings has increased aiming at reducing the carbon footprint. However, the mechanical fixing of the rails is related to the penetration of the weatherproof layer of roof, and therefore, the installation of PV solar panels could be problematic. Some research studies were conducted to support the determination of the location and height of the C-channel rail or the use of thin glass in photovoltaic modules [13,14,15]. The ballasted footing mounts are the other option for the installation of PV solar panels; however, they cause a significant additional loading on the load bearing structure of roof and are suitable for flat roofs only.
Given these disadvantages of the installation of PV solar modules, the use of adhesive connections seems to be reasonable in such a type of structural application. However, the application of any liquid or semi-liquid adhesive to create functional adhesive joints on a building site is a complicated task that requires not only skilled workmanship but also appropriate conditions (temperature, humidity, appropriate curing environment depending on the type of adhesive used, etc.); the application of acrylic adhesive tape can be a solution. Of course, since humidity can reduce the strength of any adhesive joint, resistance to water and moisture of acrylic adhesive tapes is an important limiting factor that should be carefully examined. Therefore, this study focuses on the effect of water on adhesive joints with VHBTM tapes and on several metal substrates and their treatments on bonded area.
2. Materials and Methods
The water resistance and durability of the VHBTM tapes in the load bearing joints with aluminum and galvanized steel substrates were determined by immersion of the joints in demineralized water according to ETAG 002 [16]. To study mechanical properties, tensile tests and double-lap joint (DLJ) shear tests were performed. The double-lap shear tests were performed for the reference and for the immersed set of specimens. In addition, infrared (FT-IR) spectroscopy and X-ray fluorescence were used to observe the chemical composition of the adhesive tape and its changes after immersion. The leachate that was found in the water after the immersion test was examined through X-ray diffraction analysis.
2.1. Materials
All VHBTM tape tests were performed using GPH-110GF tape (3M) that was 19 mm wide. The thickness of the tape ranged from 1.1 mm for the double-lap shear specimens to 1.6 mm for the tensile test specimens. The GPH series (general-purpose high-temperature) tapes are typically used to bond a variety of substrates, including many metal, plastic, and painted materials, and provide high strength and long-term durability [2]. The GPH-110GF tape is made up of closed cell foam that acts as a carrier for an acrylic adhesive. GPH-110GF tape has a tensile strength of 0.67 MPa on the aluminum substrate and a cross-head speed of 50 mm/min., and the overlap shear strength is 0.73 MPa on the stainless steel substrate at room temperature with a cross-head speed of 12.7 mm/min according to the manufacturer [2].
For the double-lap shear test specimens, aluminum and continuously galvanized steel (DX51D) were chosen as substrate materials for the load-bearing joints since both materials are typically used for mounting rails and for metal roof-decking. Both materials were applied in the joints with smooth or mechanically roughened (by 3M Scotch-Brite®) surfaces to observe the influence of surface roughening on bond strength. Both types of the bonded surfaces were also cleaned and degreased with 3M VHB Surface Cleaner and activated with 3M VHBTM Tape Universal Primer UV prior to bonding. A pressure roller was used to reduce bubbles and achieve the required handling adhesion.
The aluminum specimens were composed of two types of aluminum alloys, AlSi1MgMn (EN AW 6082) and AlMg1 (EN AW 5005), to compare the effect of aluminum alloys on adhesion and failure mode. Due to the relatively wide use of sulfuric acid anodizing (SAA) as a corrosive protection of aluminum parts in civil engineering, the experimental program was extended by the set of SAA aluminum specimens, too.
The thickness of the zinc and anodized coatings was measured using a Surfix® SX (PHYNIX Sensortechnik GmbH, Neuss, Germany)coating thickness gauge with external probes for ferrous and non-ferrous materials with an accuracy ± 0.7 μm prior to specimen bonding. The anodizing thickness of aluminum was measured at 15.4 ± 2.9 μm on average, and the zinc thickness of steel was 14.7 ± 1.9 μm on average.
For the tensile tests, the aluminum profile AlSiMg (EN AW 6005) and the trapezoidal metal sheet TR 35/207 with galvanized steel core and polyester coating were used. The metal sheet was chosen based on its application on roofs of larger areas of agricultural or industrial buildings and, similarly, the aluminum profile in roof mounting systems.
The aluminum profiles and trapezoidal sheets were cleaned and degreased with isopropyl alcohol (3M VHB™ Surface Cleaner) according to the manufacturer’s recommendation and treated with a primer coating (3M VHBTM Tape Universal primer UV), and a pressure roller was used to reach a proper handling strength.
The tensile tests were carried out in two batches of specimens: one batch had a longitudinal arrangement of the adhesive joint to the corrugations, while the other batch had a perpendicular arrangement of the bonding to the corrugations. For the tensile tests, each batch contained 3 specimens, while for the double-lap shear tests, each batch contained 5 specimens. The general summary of all materials tested, along with the batches of specimens is presented in Table 1.

Table 1.
Summary of all tested specimens.
2.2. Double-Lap Joint (DLJ) Shear Test
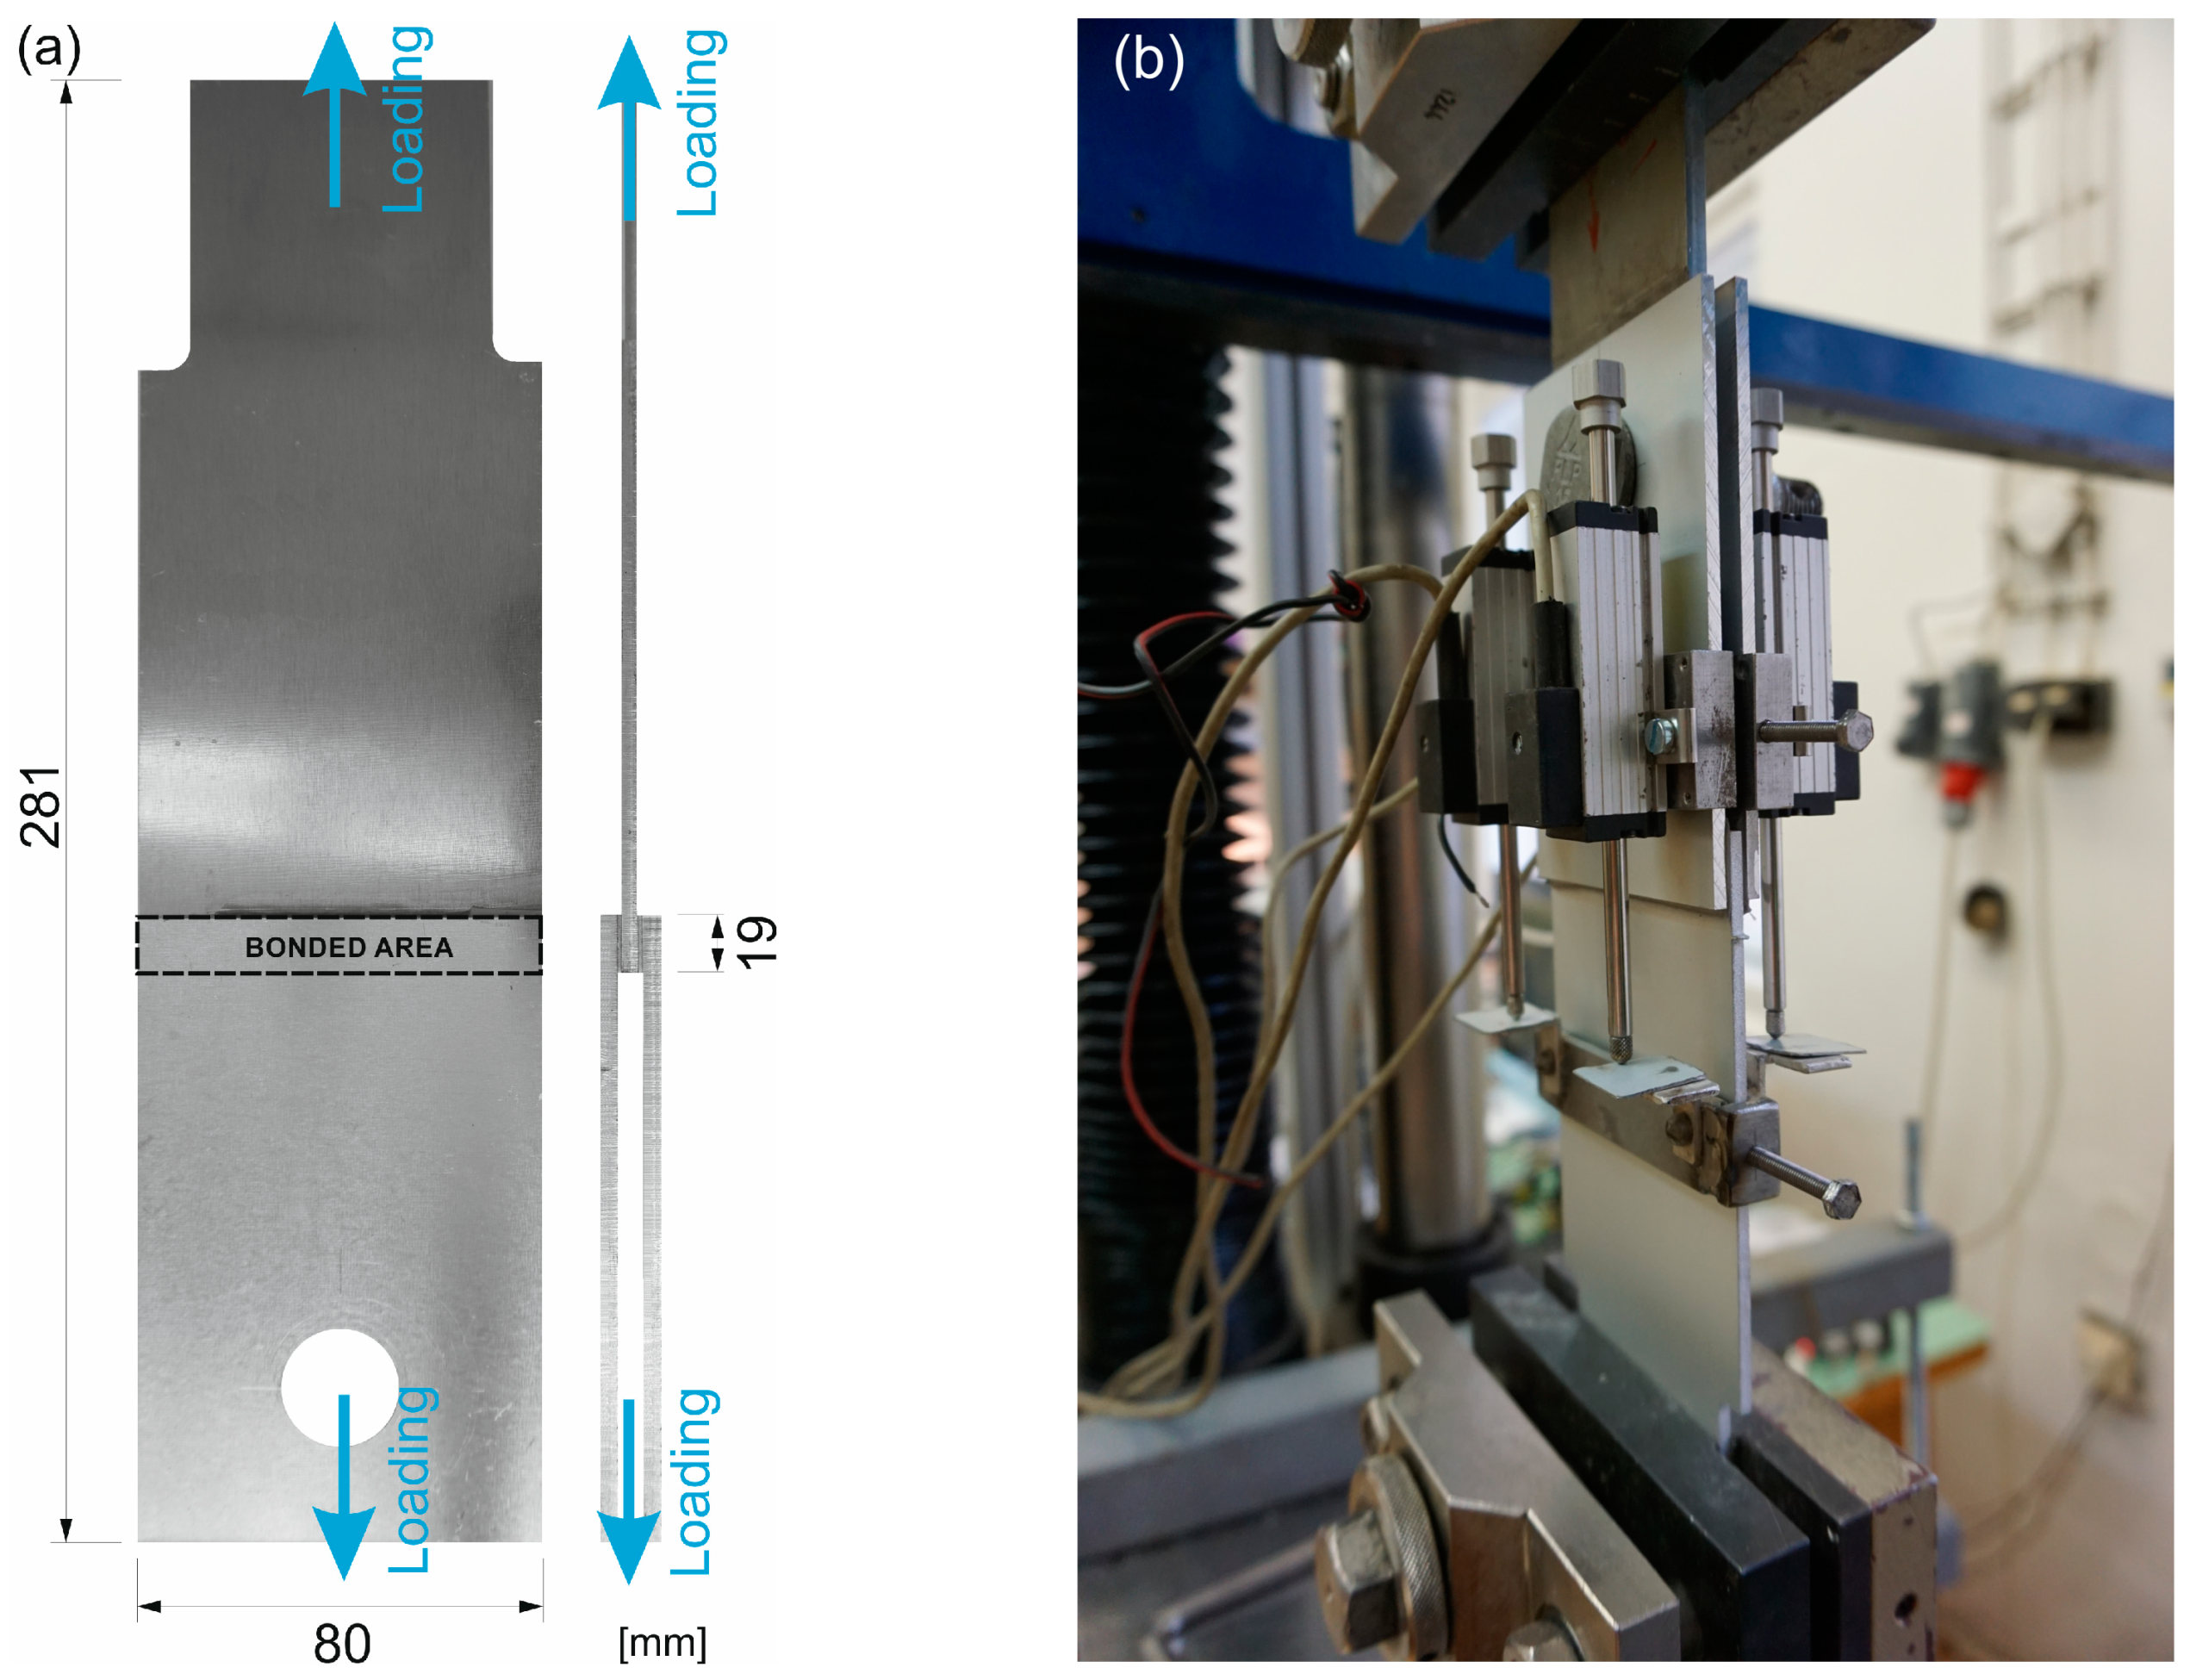
Shear stress–strain analysis was performed on double-lap specimens, where the adhesive was applied in two bonded areas of 19 × 80 mm with an overlap length of 19 mm, see Figure 1a. For the blank aluminum specimens, the middle sheet was made of AlMgSi0.5 alloy (EN AW 6082) and the sideways sheets of AlMg1 (EN AW 5005) to compare the adhesion to both alloys.
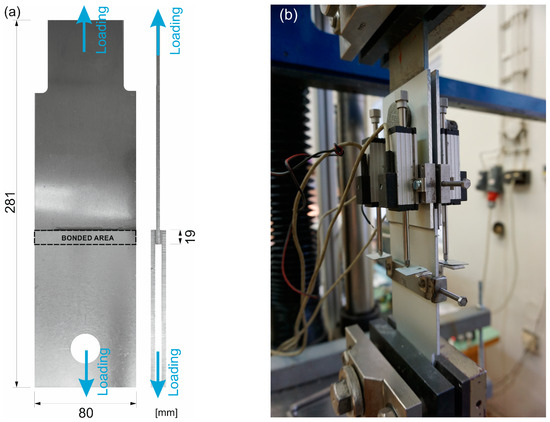
Figure 1.
The specimens: (a) the scheme with the depicted bonded area and (b) under the testing procedure.
The specimens were subjected to a displacement-controlled test on a TIRA TEST machine with the capacity of 100 kN, where the shear loading of the bonded area arose from the tensile loading of the whole specimen fixed to the jaws of the test machine; see Figure 1b. The specimens were loaded continuously at a cross-head speed of 1.5 mm/min until total failure of the joint.
The displacement was measured by two linear potentiometric transducers at both ends of an overlap joint. Therefore, four transducers per specimen were used. The average displacement value was calculated for the evaluation of the engineering shear strain.
2.3. Tensile Tests
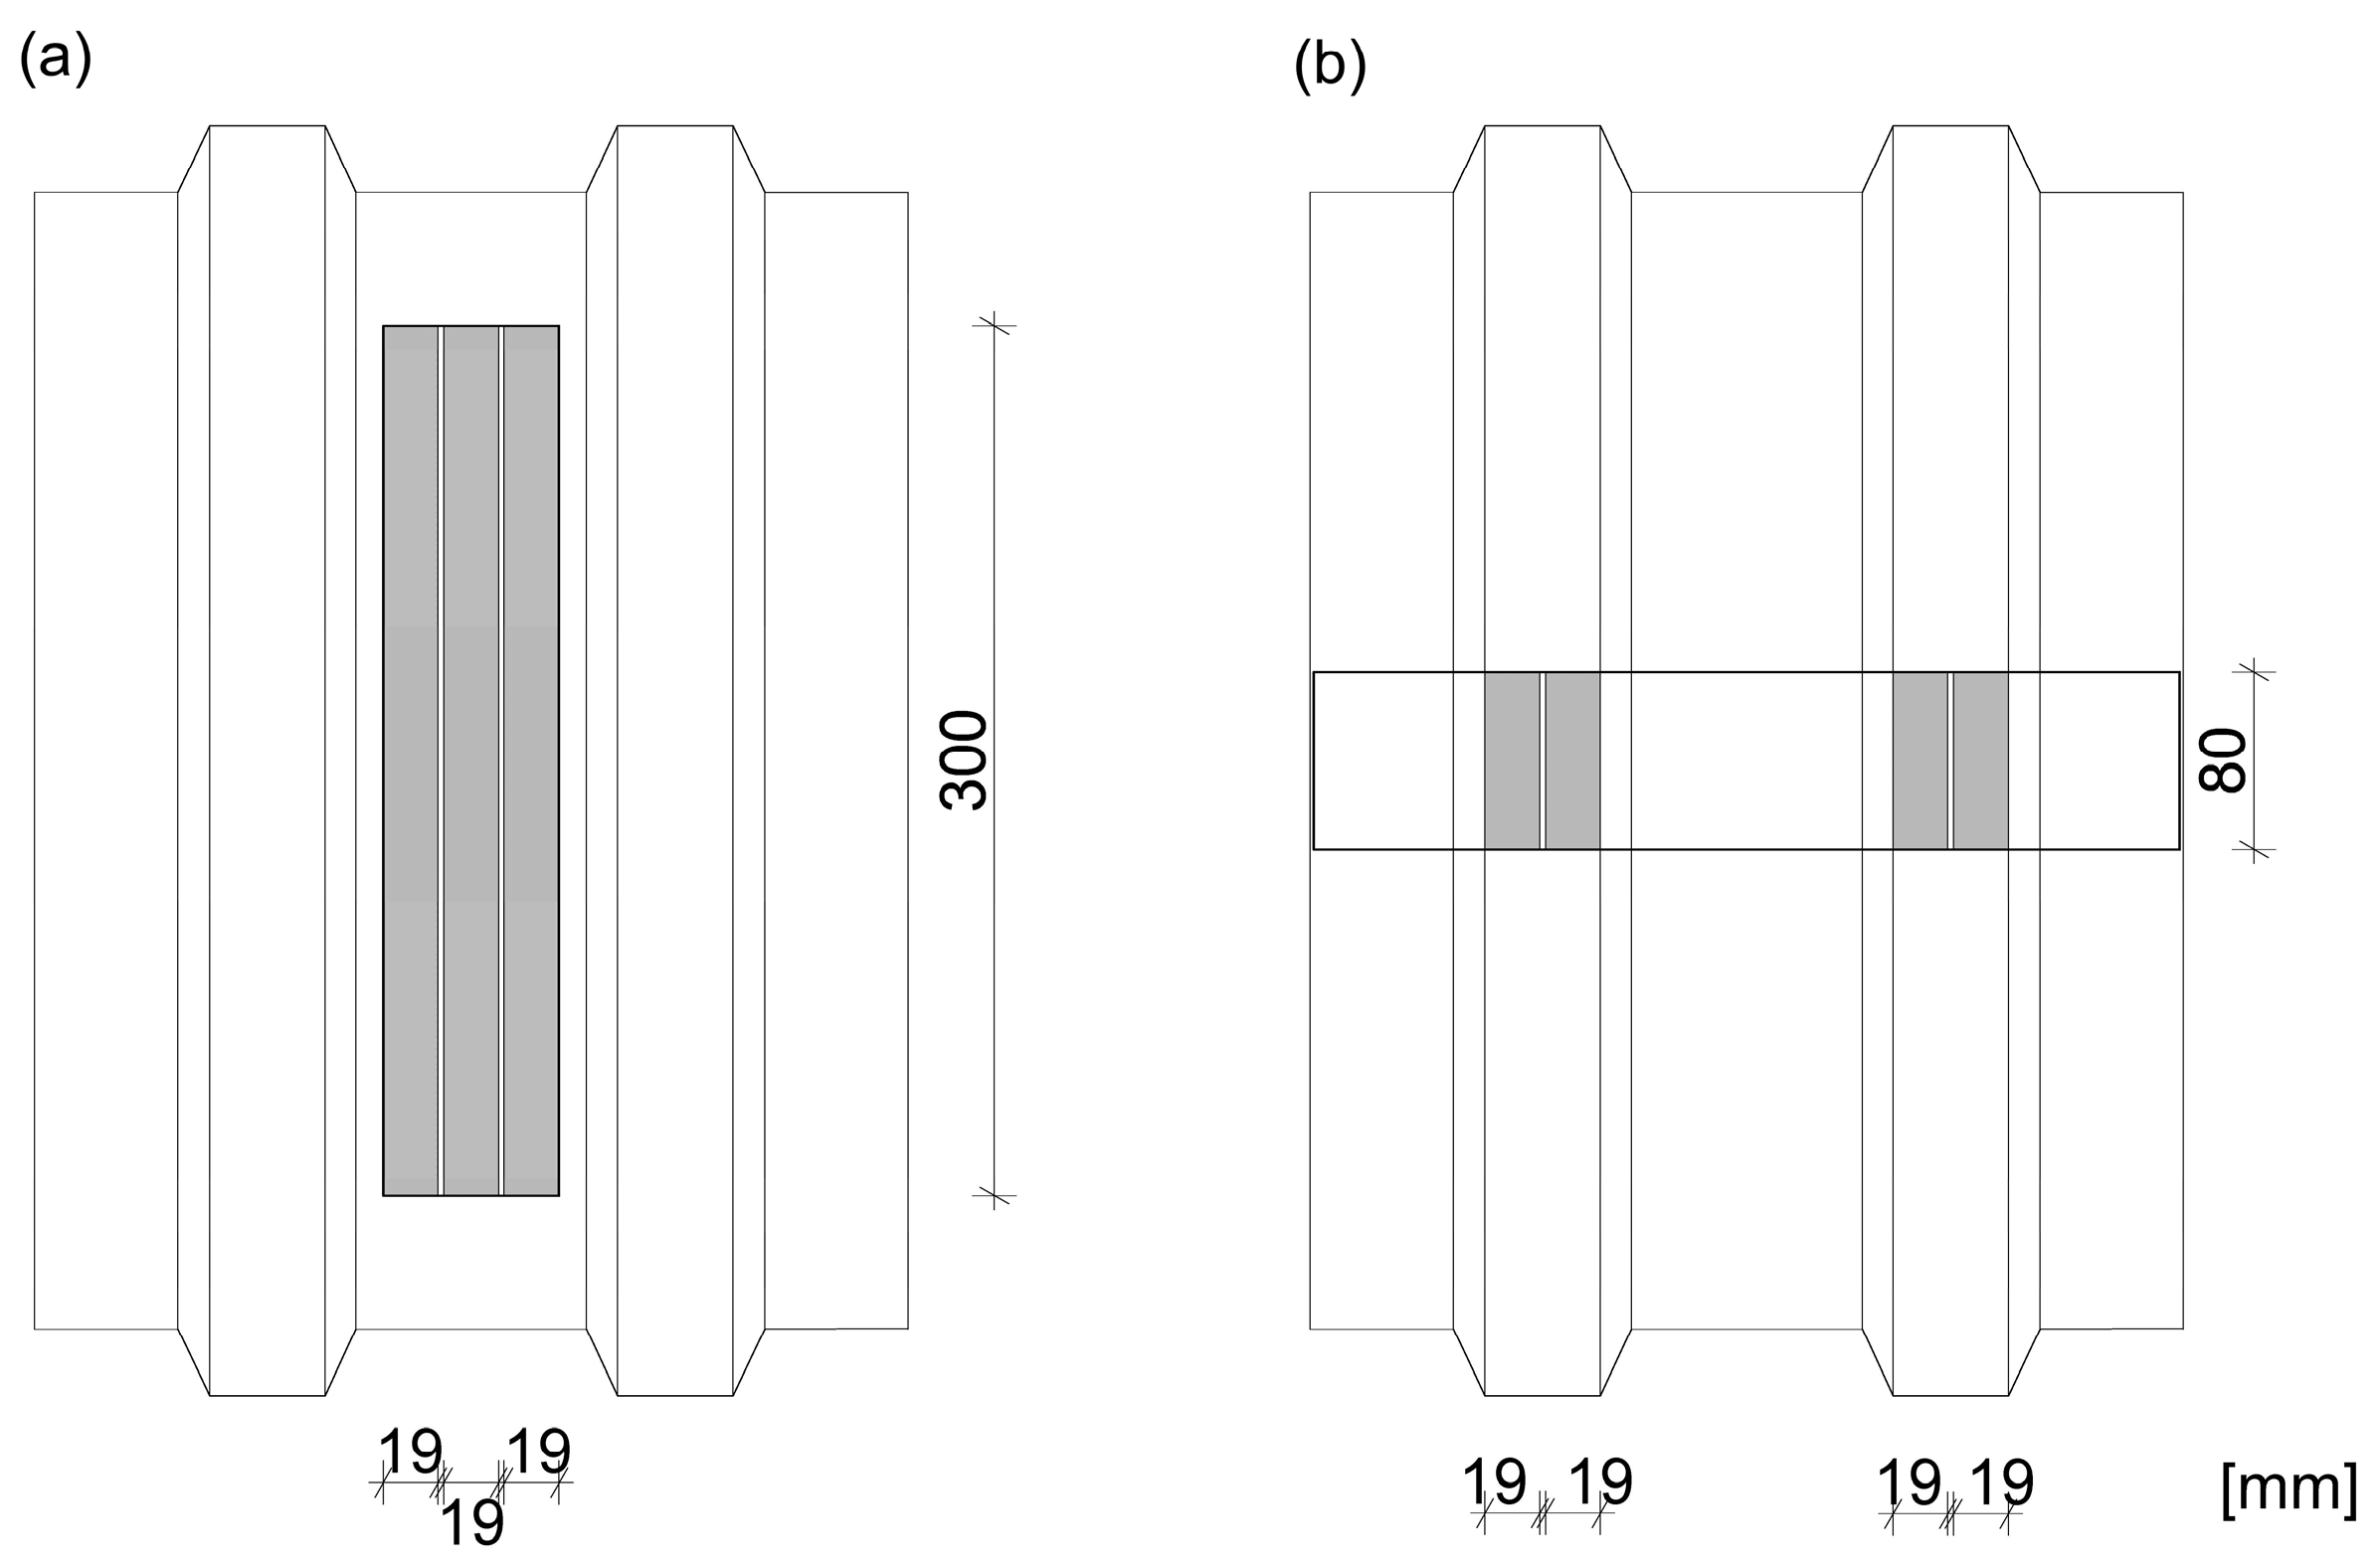
A total of 6 test specimens composed of the AlSiMg profile and the TR 35/207 trapezoidal metal sheet with galvanized steel core and polyester coating were prepared—see Table 1 and the scheme in Figure 2.

Figure 2.
The tensile test specimens: (a) the longitudinal joint in the bottom part of the trapezium, (b) the perpendicular joint to corrugations.
Three specimens were longitudinally bonded to corrugations in the bottom part of the trapezium, where 3 lines of the 300 mm long adhesive tape per joint were used, and therefore, the bonded surface area of one specimen was 17,100 mm2, see Figure 2.
Three specimens were bonded across the trapezoidal metal sheet corrugations (perpendicular to the corrugations), where two lines 80 mm long per one trapezium (2 trapeziums per joint) were applied, and therefore, the bonded surface area of one specimen was 6080 mm2, see Figure 2.
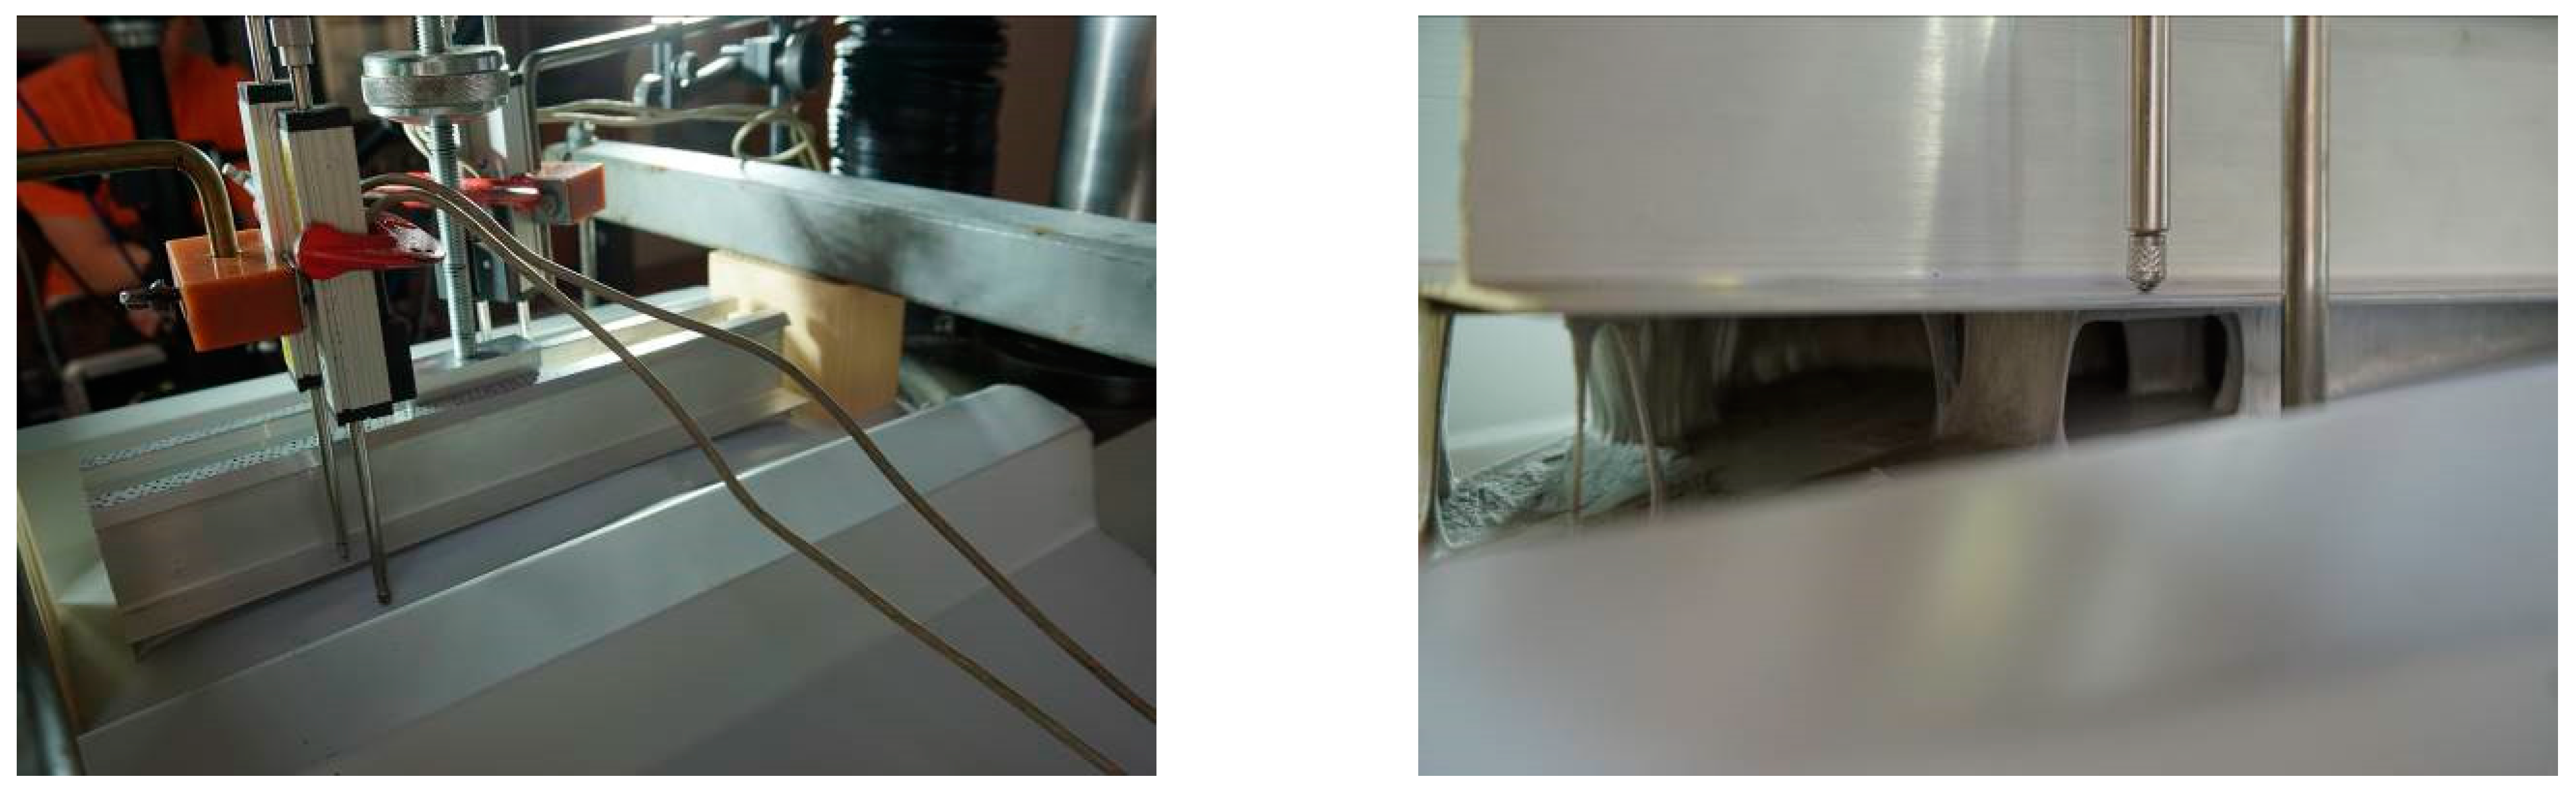
The specimens underwent a displacement-controlled test on the TIRA TEST machine with a capacity of 100 kN. The specimens were loaded at a cross-head speed of 1 mm/min continuously until the total failure of the joint.
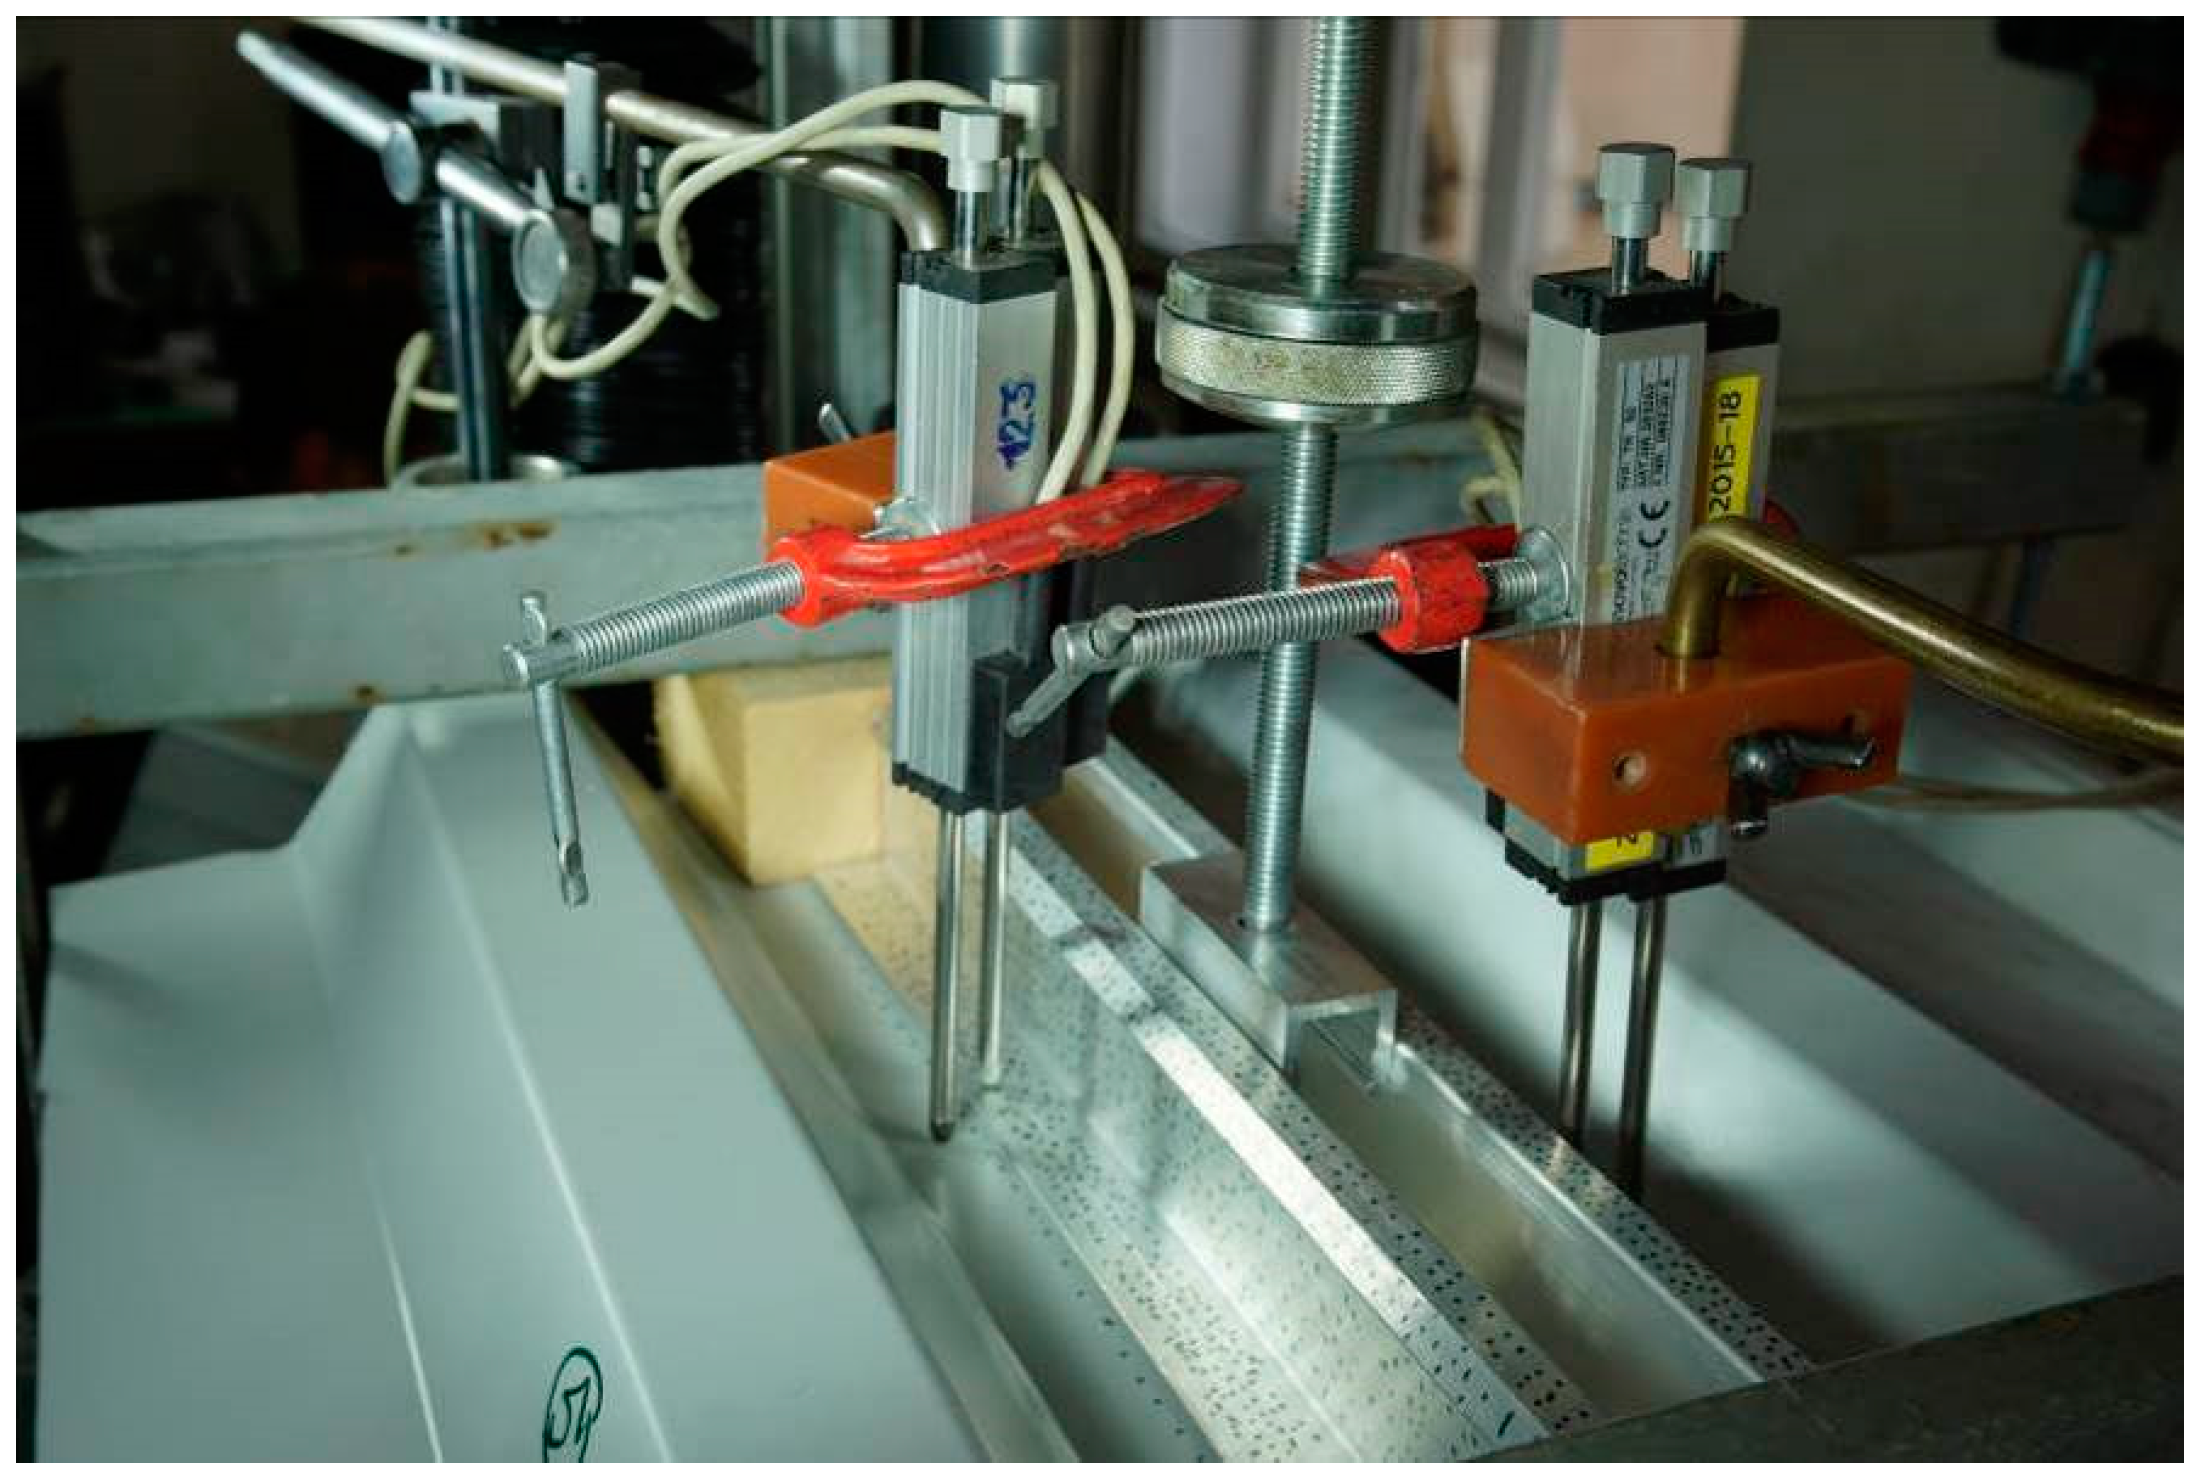
The displacement was measured by two linear potentiometric transducers at both edges of the Al profile and two linear potentiometric transducers on a metal sheet located near the Al profile’s transducers; therefore, four transducers per specimen were used, see Figure 3. The average displacement value was calculated for the evaluation of the engineering shear strain at both edges of the Al profile.

Figure 3.
The specimen subjected to the tensile testing.
2.4. Optical Measurements
The digital image correlation (DIC) method was used to study the displacement of several markers lying on the surface of the specimens subjected to the mechanical testing. Two tripod-fixed cameras were used to take the images during the testing. These cameras were calibrated by a grid to be able to relate the dimensions in images to the real ones. Mercury RT® v2.6 software from SOBRIETYTM company was used to post-process the acquired images and generate the displacement field on the surface of the deformed specimens.
2.5. Water Immersion Test
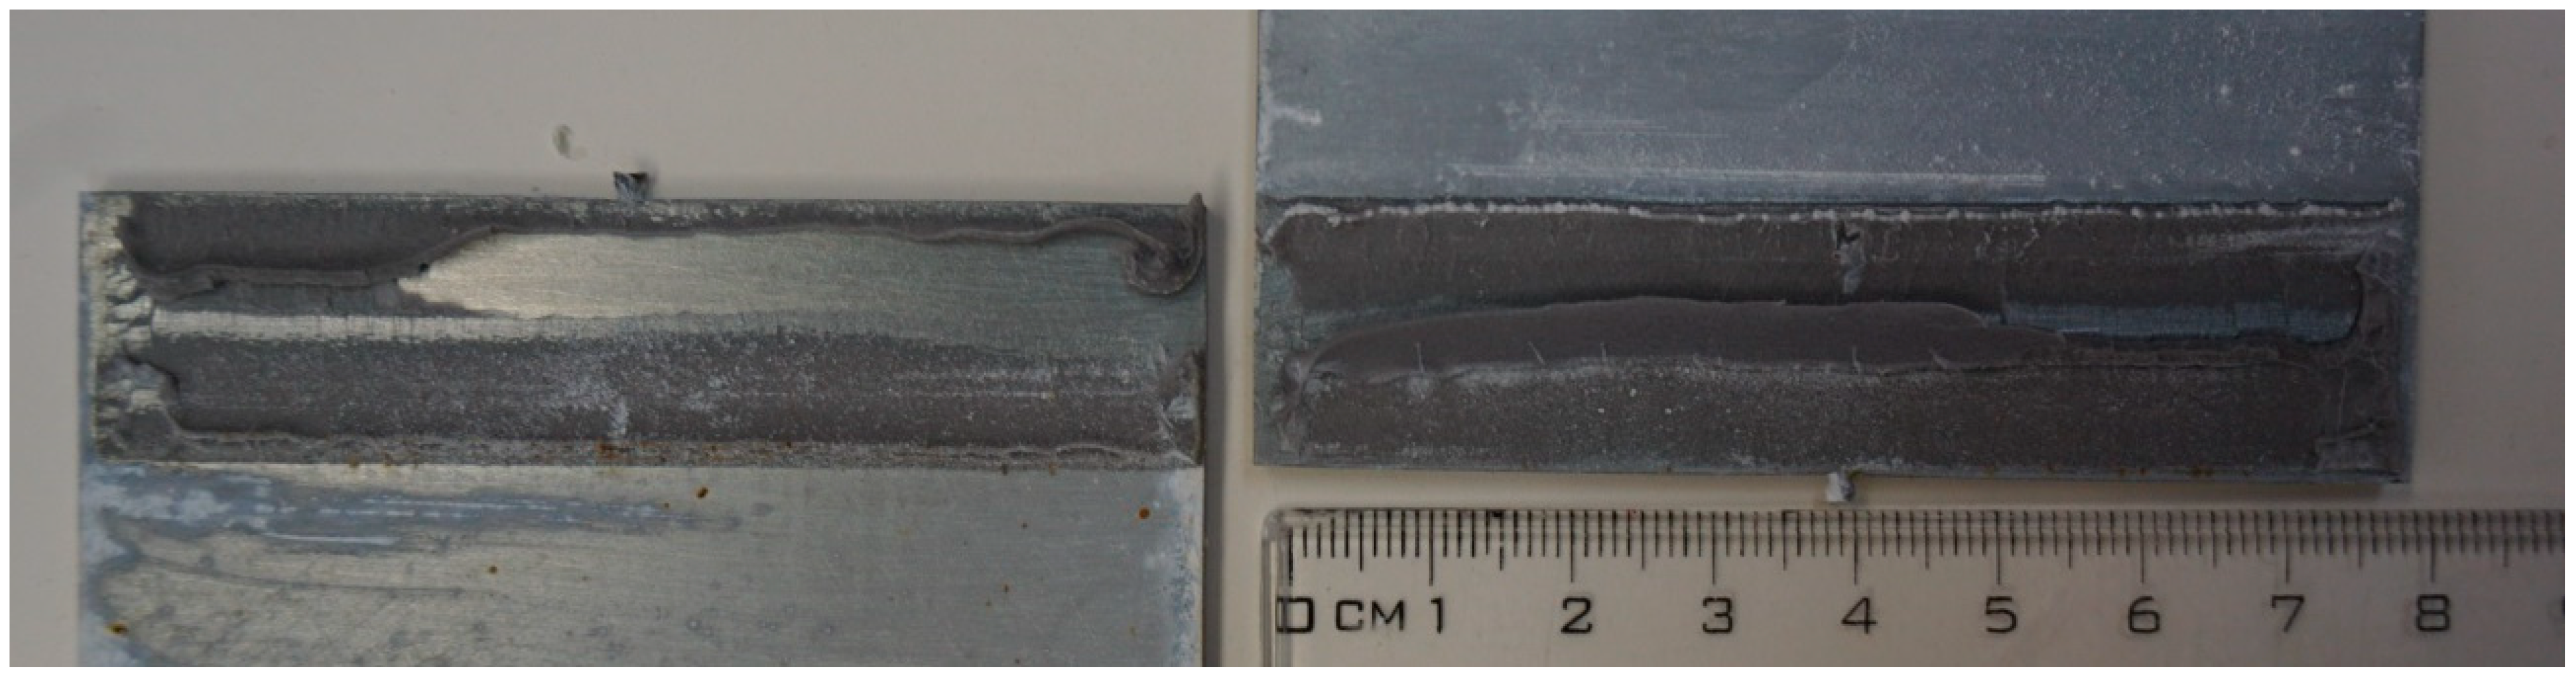
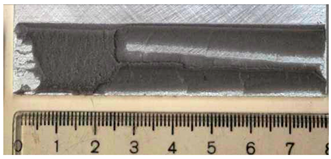
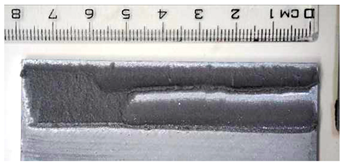
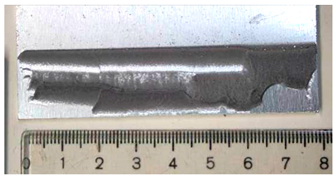
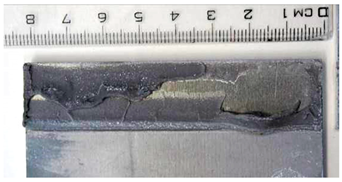
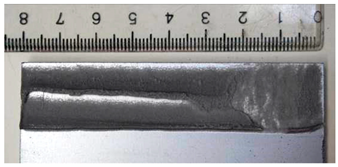
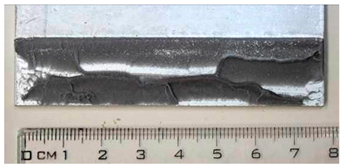
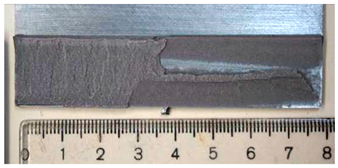
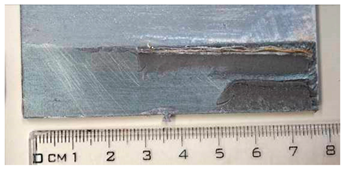
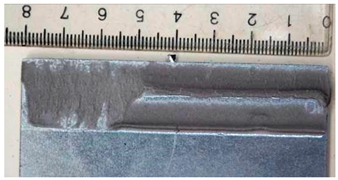
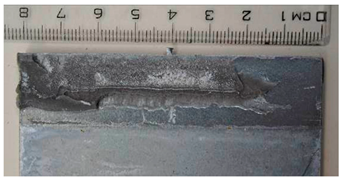
Part of the DLJ specimens, see Table 1, was exposed to demineralized water immersion according to the ETAG 002 guideline [16]. The specimens were immersed in a GFL 1008 water bath that maintained a constant 45 °C temperature for the demineralized water for 21 days. The immersion was followed by 24 h of conditioning at 23 °C and 50% relative humidity, and the shear tests were performed immediately after conditioning. After immersion, some leachate in the water bath was observed, and therefore, it was examined by X-ray diffraction analysis, see Section 2.6. The specimens after immersion are depicted in Figure 4, where the white patches of leachate are visible on the surface of the specimen together with some small bubbles on the adhesive surface.
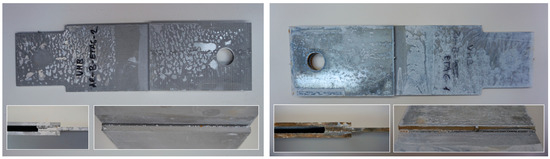
Figure 4.
The specimens after 21 days of immersion: (left) aluminum, (right) galvanized steel.
2.6. Chemical Analysis of Adhesive Tape
The changes in the chemical composition of the VHBTM tape were evaluated by comparing the reference sample and the sample after immersion according to ETAG 002 [16] by infrared spectroscopy (FT-IR) and X-ray fluorescence—the relative proportions of the detected elements. The reference sample was not treated prior to the X-ray fluorescence analysis, while the sample after immersion was conditioned for several days under laboratory conditions (23 °C, 50% RH).
The crystalline sediment desorbed from the adhesive tape during immersion was dried (80 °C, 5 h) and analyzed by the X-ray diffraction analysis—the detection of the solid crystalline phase of the powdered sample.
X-ray fluorescence analysis was performed using a Niton XL5 Plus Handheld XRF analyzer (Mining calibration, exposure time 60 s, ThermoFischer Scientific—Waltham, MA, USA), and the X-ray diffraction analysis was performed on a PANanalytical X’Pert PRO (PANalytical—Almelo, The Netherlands) with the Cu anodic material.
The infrared spectroscopy analysis of the organic component resin was performed on a Nicolet iZ10 (ThermoFisher Scientific—USA), and the spectra were collected in an absorbance mode using an attenuated total reflectance (ATR) diamond crystal.
3. Results
3.1. Shear Strength and Failure Modes of Joints
The measured load-displacement curves were converted into the engineering stress—the engineering strain relationships for the reference and the ETAG sets of specimens (the specimens after immersion according to ETAG 002 [16]), see Figure 5. The average shear strength was 0.47 MPa for the reference set and 0.3 MPa for the ETAG set of specimens. The summarized results of the shear tests are also presented in Table 2, where the average shear strength values and their standard deviations are presented together with the failure modes. The indication of failure modes is based on ISO 10365 [17].
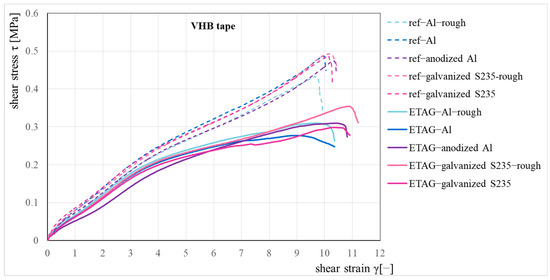
Figure 5.
Shear stress–strain relationship for the reference and immersion set.
Table 2.
The average shear strength values with standard deviations and prevailing modes of failure (in bold).
In the reference set of specimens, a combined failure mode was observed with a prevailing cohesive mode of failure (CF). In all material variants of specimens except smooth aluminum, the adhesive mode of failure (AF) was observed at 10–30% of the bonded area (mostly about 20%), and the rest of the bonded area was broken by the cohesive mode of failure (CF) or close to the substrate surface cohesive failure (SCF), which was visible at 5–15% of the bonded area. The smooth aluminum also showed a combined mode of failure, but the adhesively broken part of the bonded area was greater, approximately 50–60%. A significant increase in the adhesive mode of failure was observed only in the sideways sheets of AlMg1 (EN AW 5005). This difference in adhesion was not observed in the roughened aluminum set, where the adhesive mode of failure was approximately the same for both alloys.
Water immersion visibly impairs the adhesion of the VHBTM tape to the substrate. All immersed specimens failed by the combined mode of failure, but the adhesively failed part created 20–80% of the bonded area, depending on the substrate material and surface roughening; see Table 2 and Table 3. No differences in adhesion to both aluminum alloys were observed after immersion. Close to the substrate surface cohesive failures (SCF) were only observed in the anodized aluminum (max. 50% of the bonded area) and smooth galvanized steel (maximum 30% of the bonded area) sets of specimens; no SCF failure mode was observed in the other batches.
Table 3.
The failure modes after shear tests.
In this test setup, the visible surface at the edge of the test specimens was analyzed by the digital image correlation unit. The strain and deformation fields were plotted in color to observe their distribution over the surface of the bonding tape. Figure 6 shows an image of an aluminum specimen (with smooth surface) after immersion at the beginning of loading, when the load is around 15% of the measured load bearing capacity. It is a value that is expected to actually occur in possible real-world installations. The relative deformation is about 60% of the thickness of the tape. The deformation is illustrated by three purple marks connected by green lines that were vertical at the beginning of the loading.
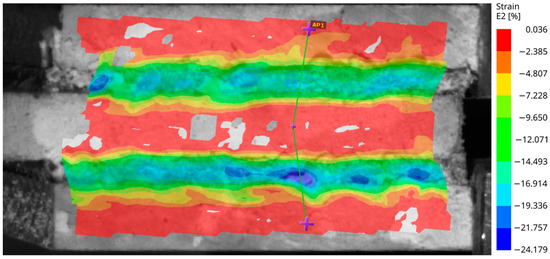
Figure 6.
The aluminum specimen with a smooth surface after immersion—the strain field over the specimen subjected to the shear test.
The non-uniform strain field in the horizontal direction indicates that the adhesion of the tape varies significantly over the bonded surface.
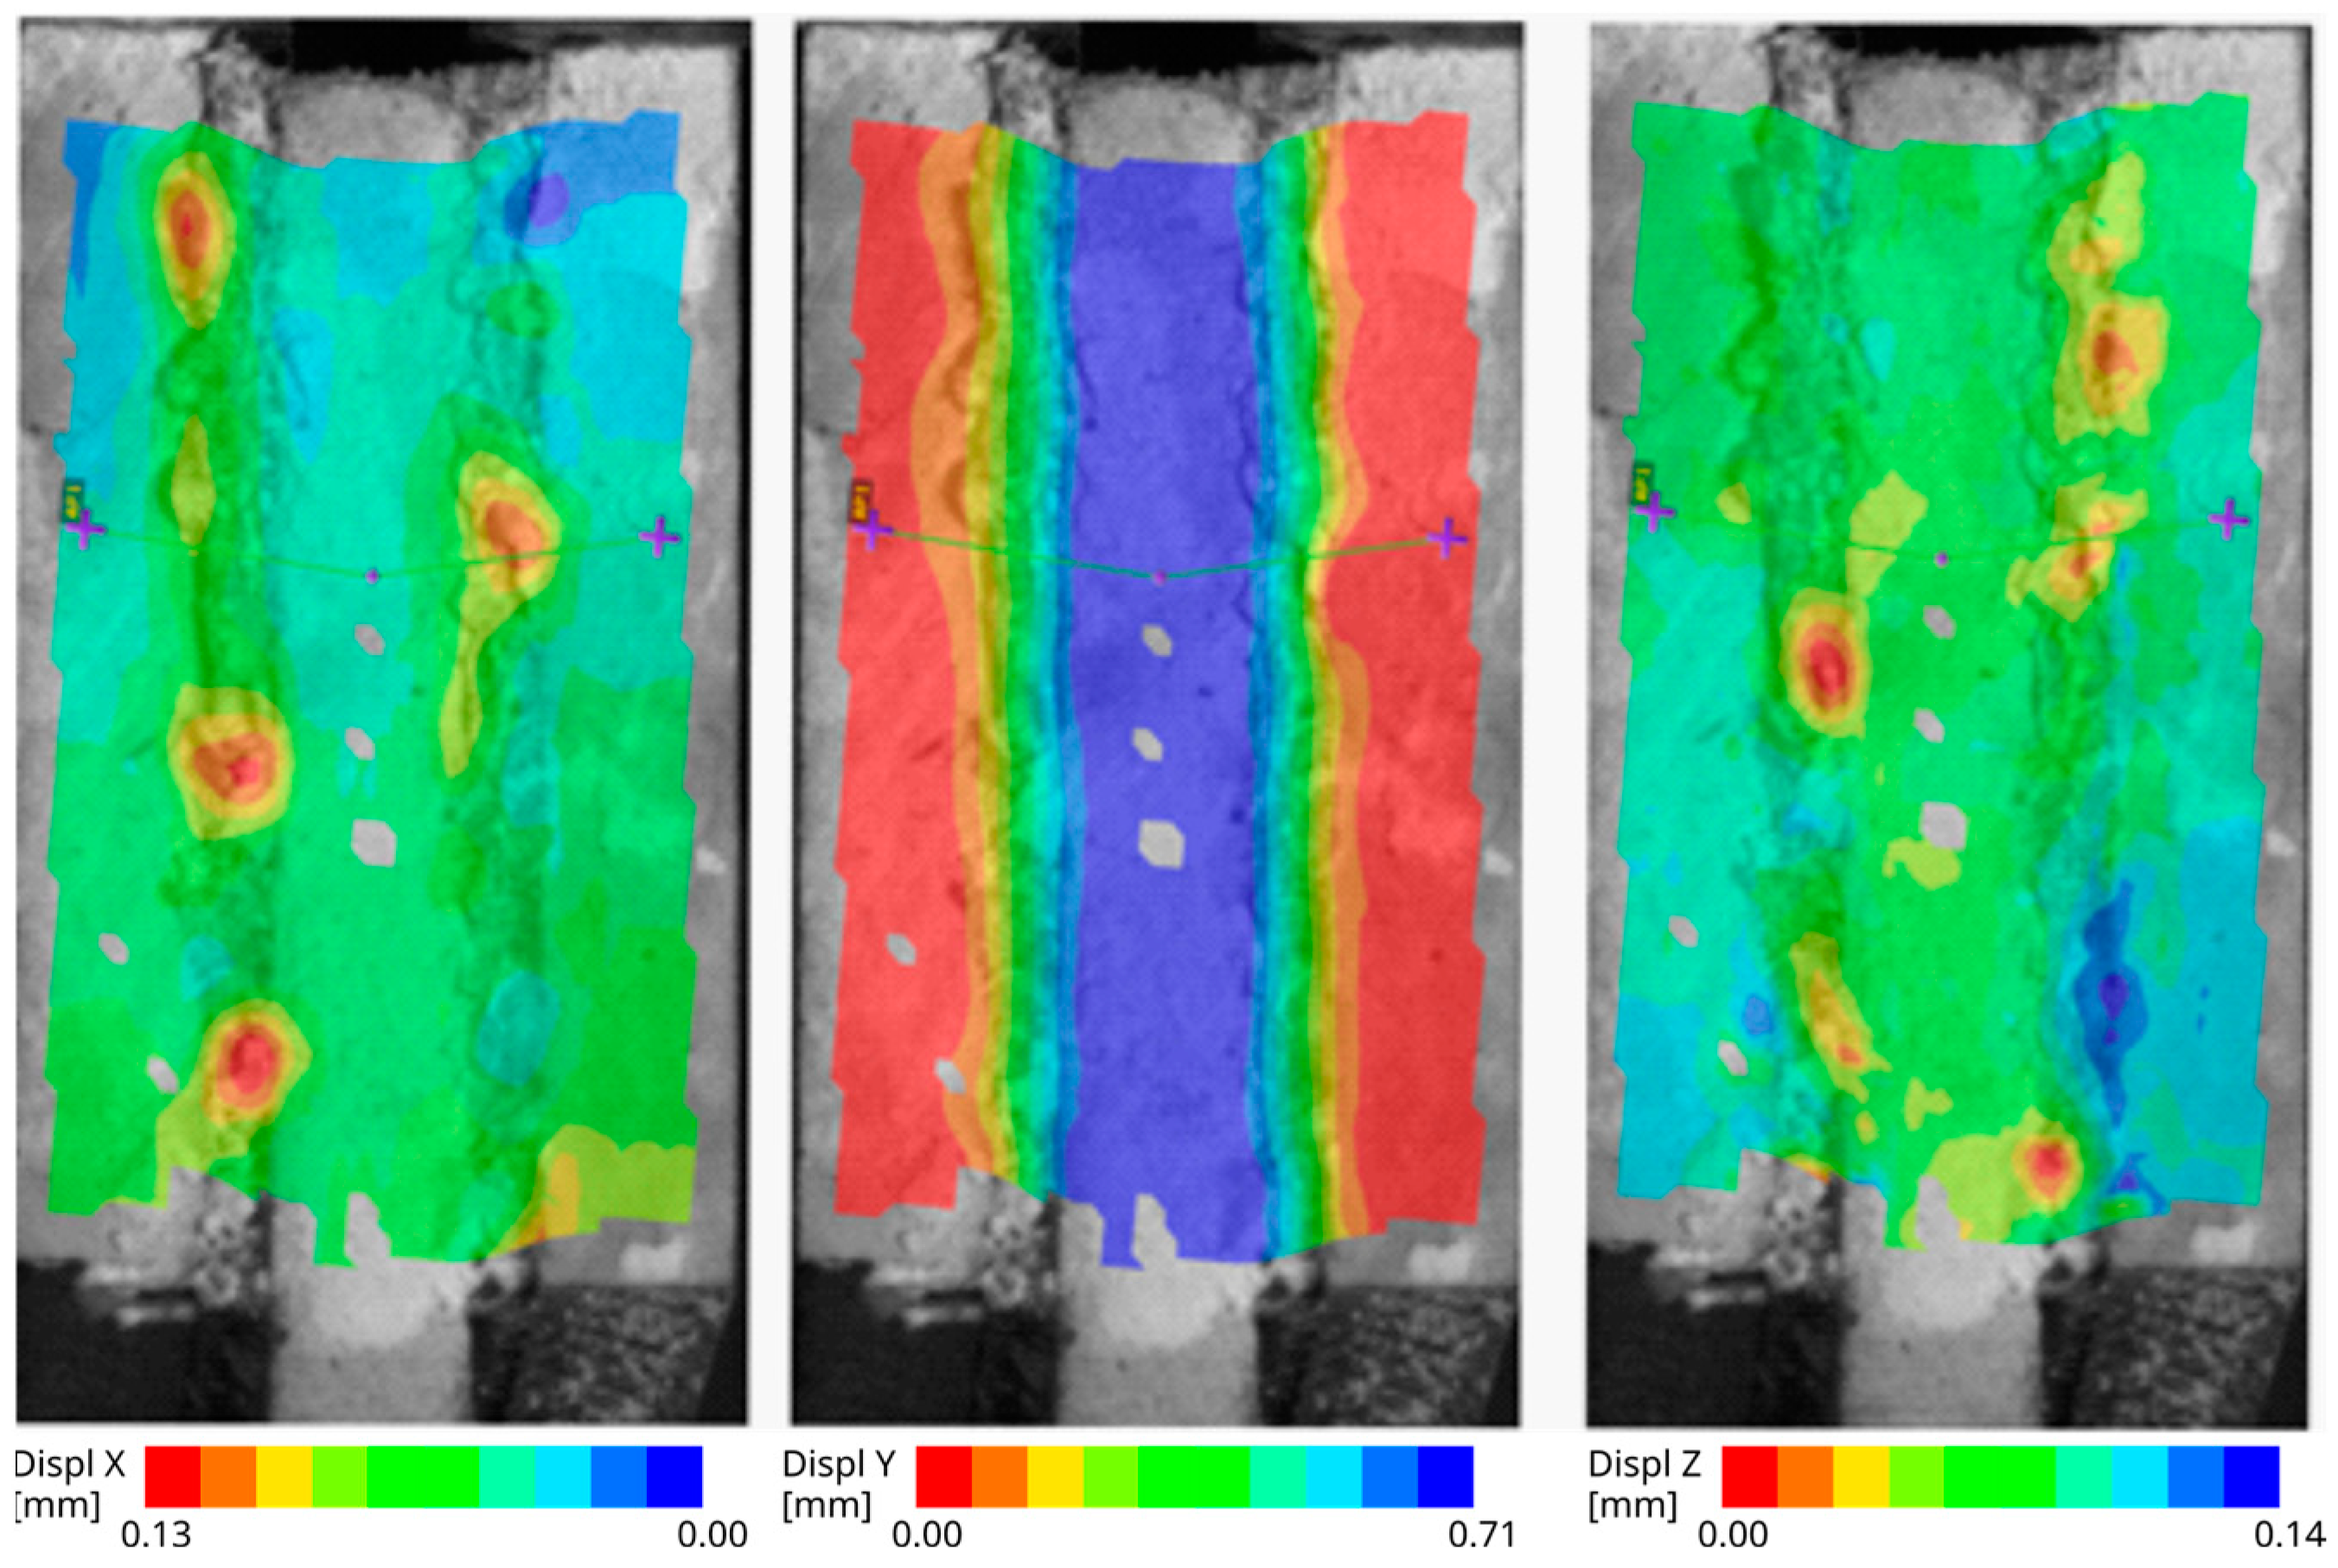
Figure 7 consists of three images showing the displacement field. Each image is related to one global axis (“X”: horizontal, “Y”: vertical, “Z”: out of plane). The Y displacement that is in the direction of the specimen loading is shown in the middle image. The outer parts with the red color were fixed and the inner part with the blue color was moving. The distribution nephograms on the tape with no significant difference in width of the colored stripes indicates that the displacement is linearly distributed over the tape. In the left image, there is an X-displacement. On the top part of this image, the difference in the color of the tape compared to the colors of the surfaces of the steel plates indicates that the thickness of the tape did not change negligibly. This trend is not so visible on the bottom part. One possible explanation is that some parts of the material have not shifted horizontally. In the right image, there is a plotted Z-displacement field. It clearly shows that some parts of the tape are sucked in during the specimen loading.
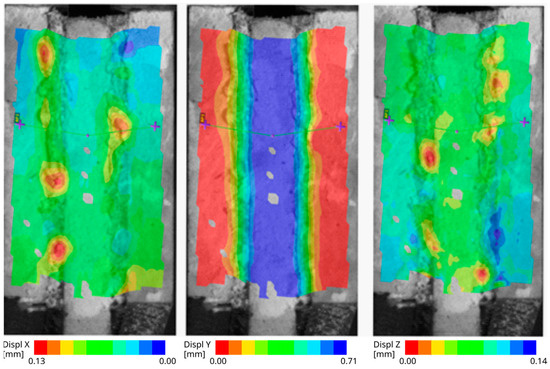
Figure 7.
The aluminum specimen with smooth surface after immersion—the displacement fields: 1st horizontal direction, 2nd vertical direction, 3rd out-of-plane direction.
3.2. Results of the Tensile Testing
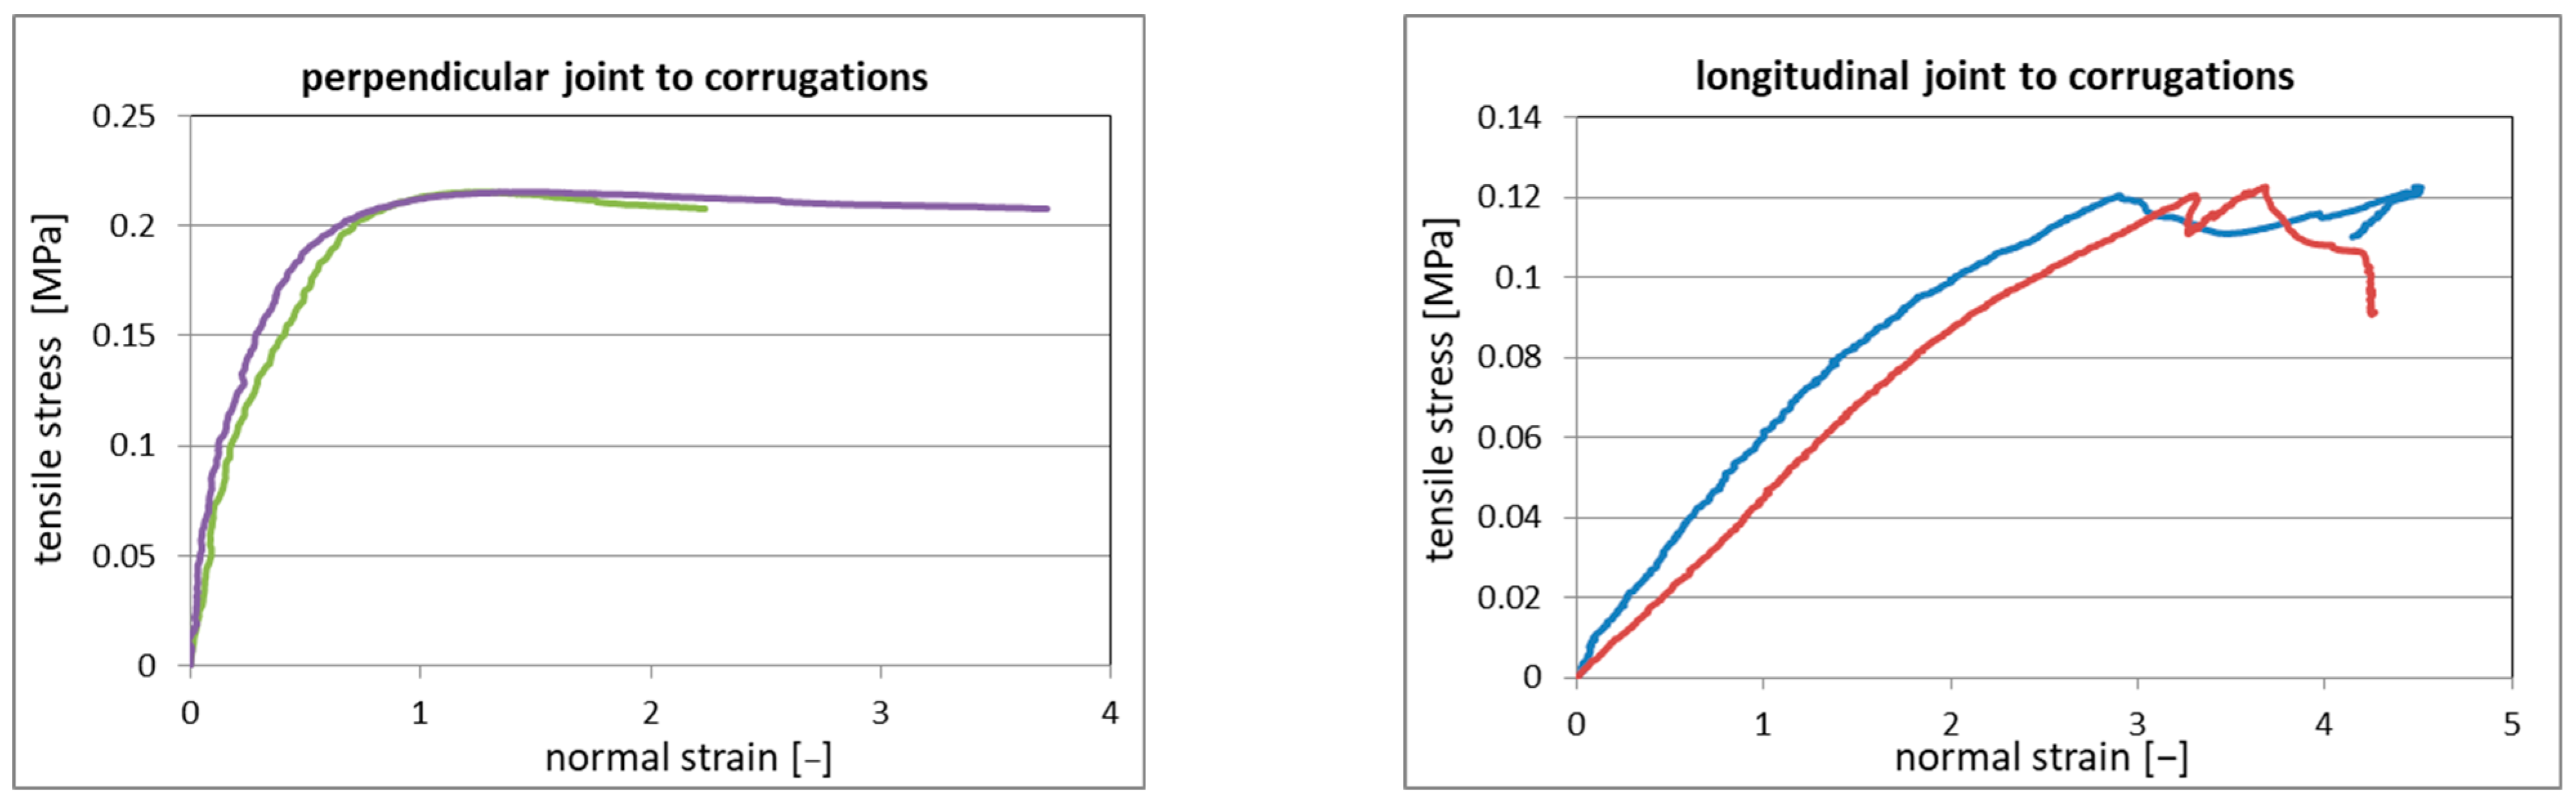
The measured load–displacement curves were converted into the engineering stress–engineering strain relationships, and the reference diagrams for both arrangements (longitudinal and perpendicular to the corrugations) are presented in Figure 8. Each diagram shows two curves because the strain was measured at both edges of the Al profile, as explained in Section 2.3. The average tensile strength was 0.13 ± 0.02 MPa for the longitudinal arrangement and 0.19 ± 0.02 MPa for the perpendicular arrangement.
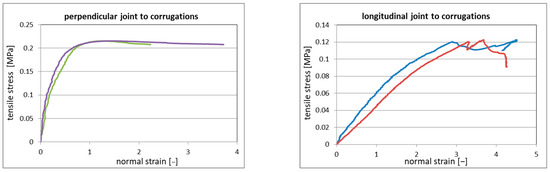
Figure 8.
The reference tensile stress-strain relationships for both types of arrangement.
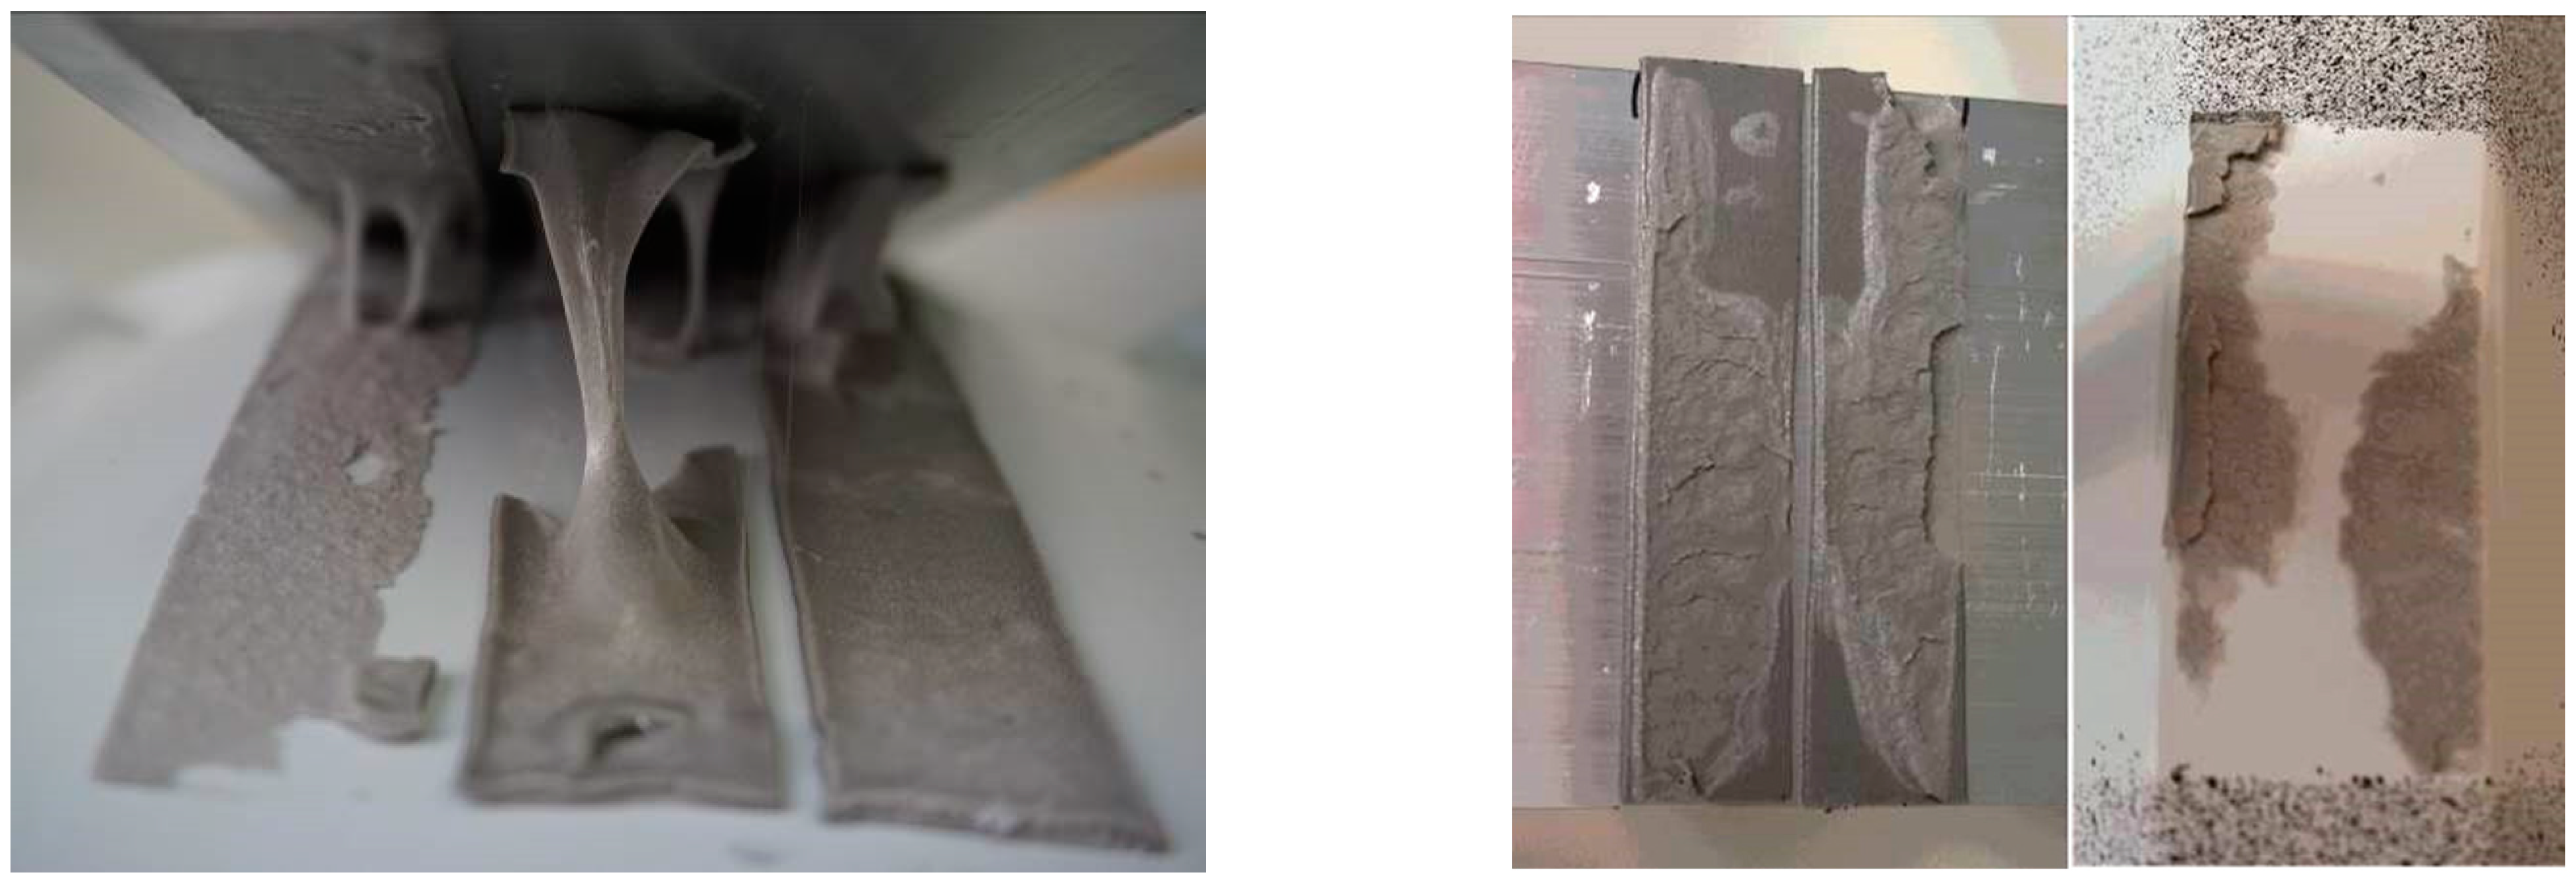
All tensile specimens were exposed to combinations of tensile load together with peeling because the tensile load was introduced in the middle of the Al profile, see Figure 9. Therefore, we can observe that the measured tensile strength was significantly lower than the shear strength. All tensile specimens were broken in a combined adhesive–cohesive failure mode, see Figure 10. No difference in adhesion to the Al profile or to the corrugated sheet was observed when we evaluated all of the specimens.
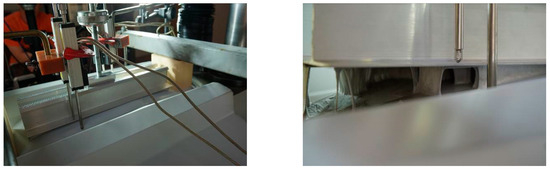
Figure 9.
Peeling of the edges of the tensile specimens.
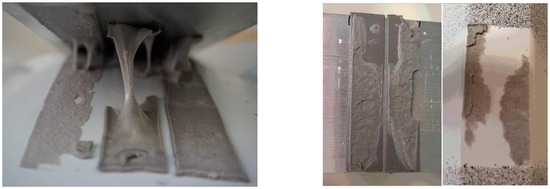
Figure 10.
The typical mode of failure of tensile specimens: longitudinal arrangement (left), perpendicular to corrugations (right).
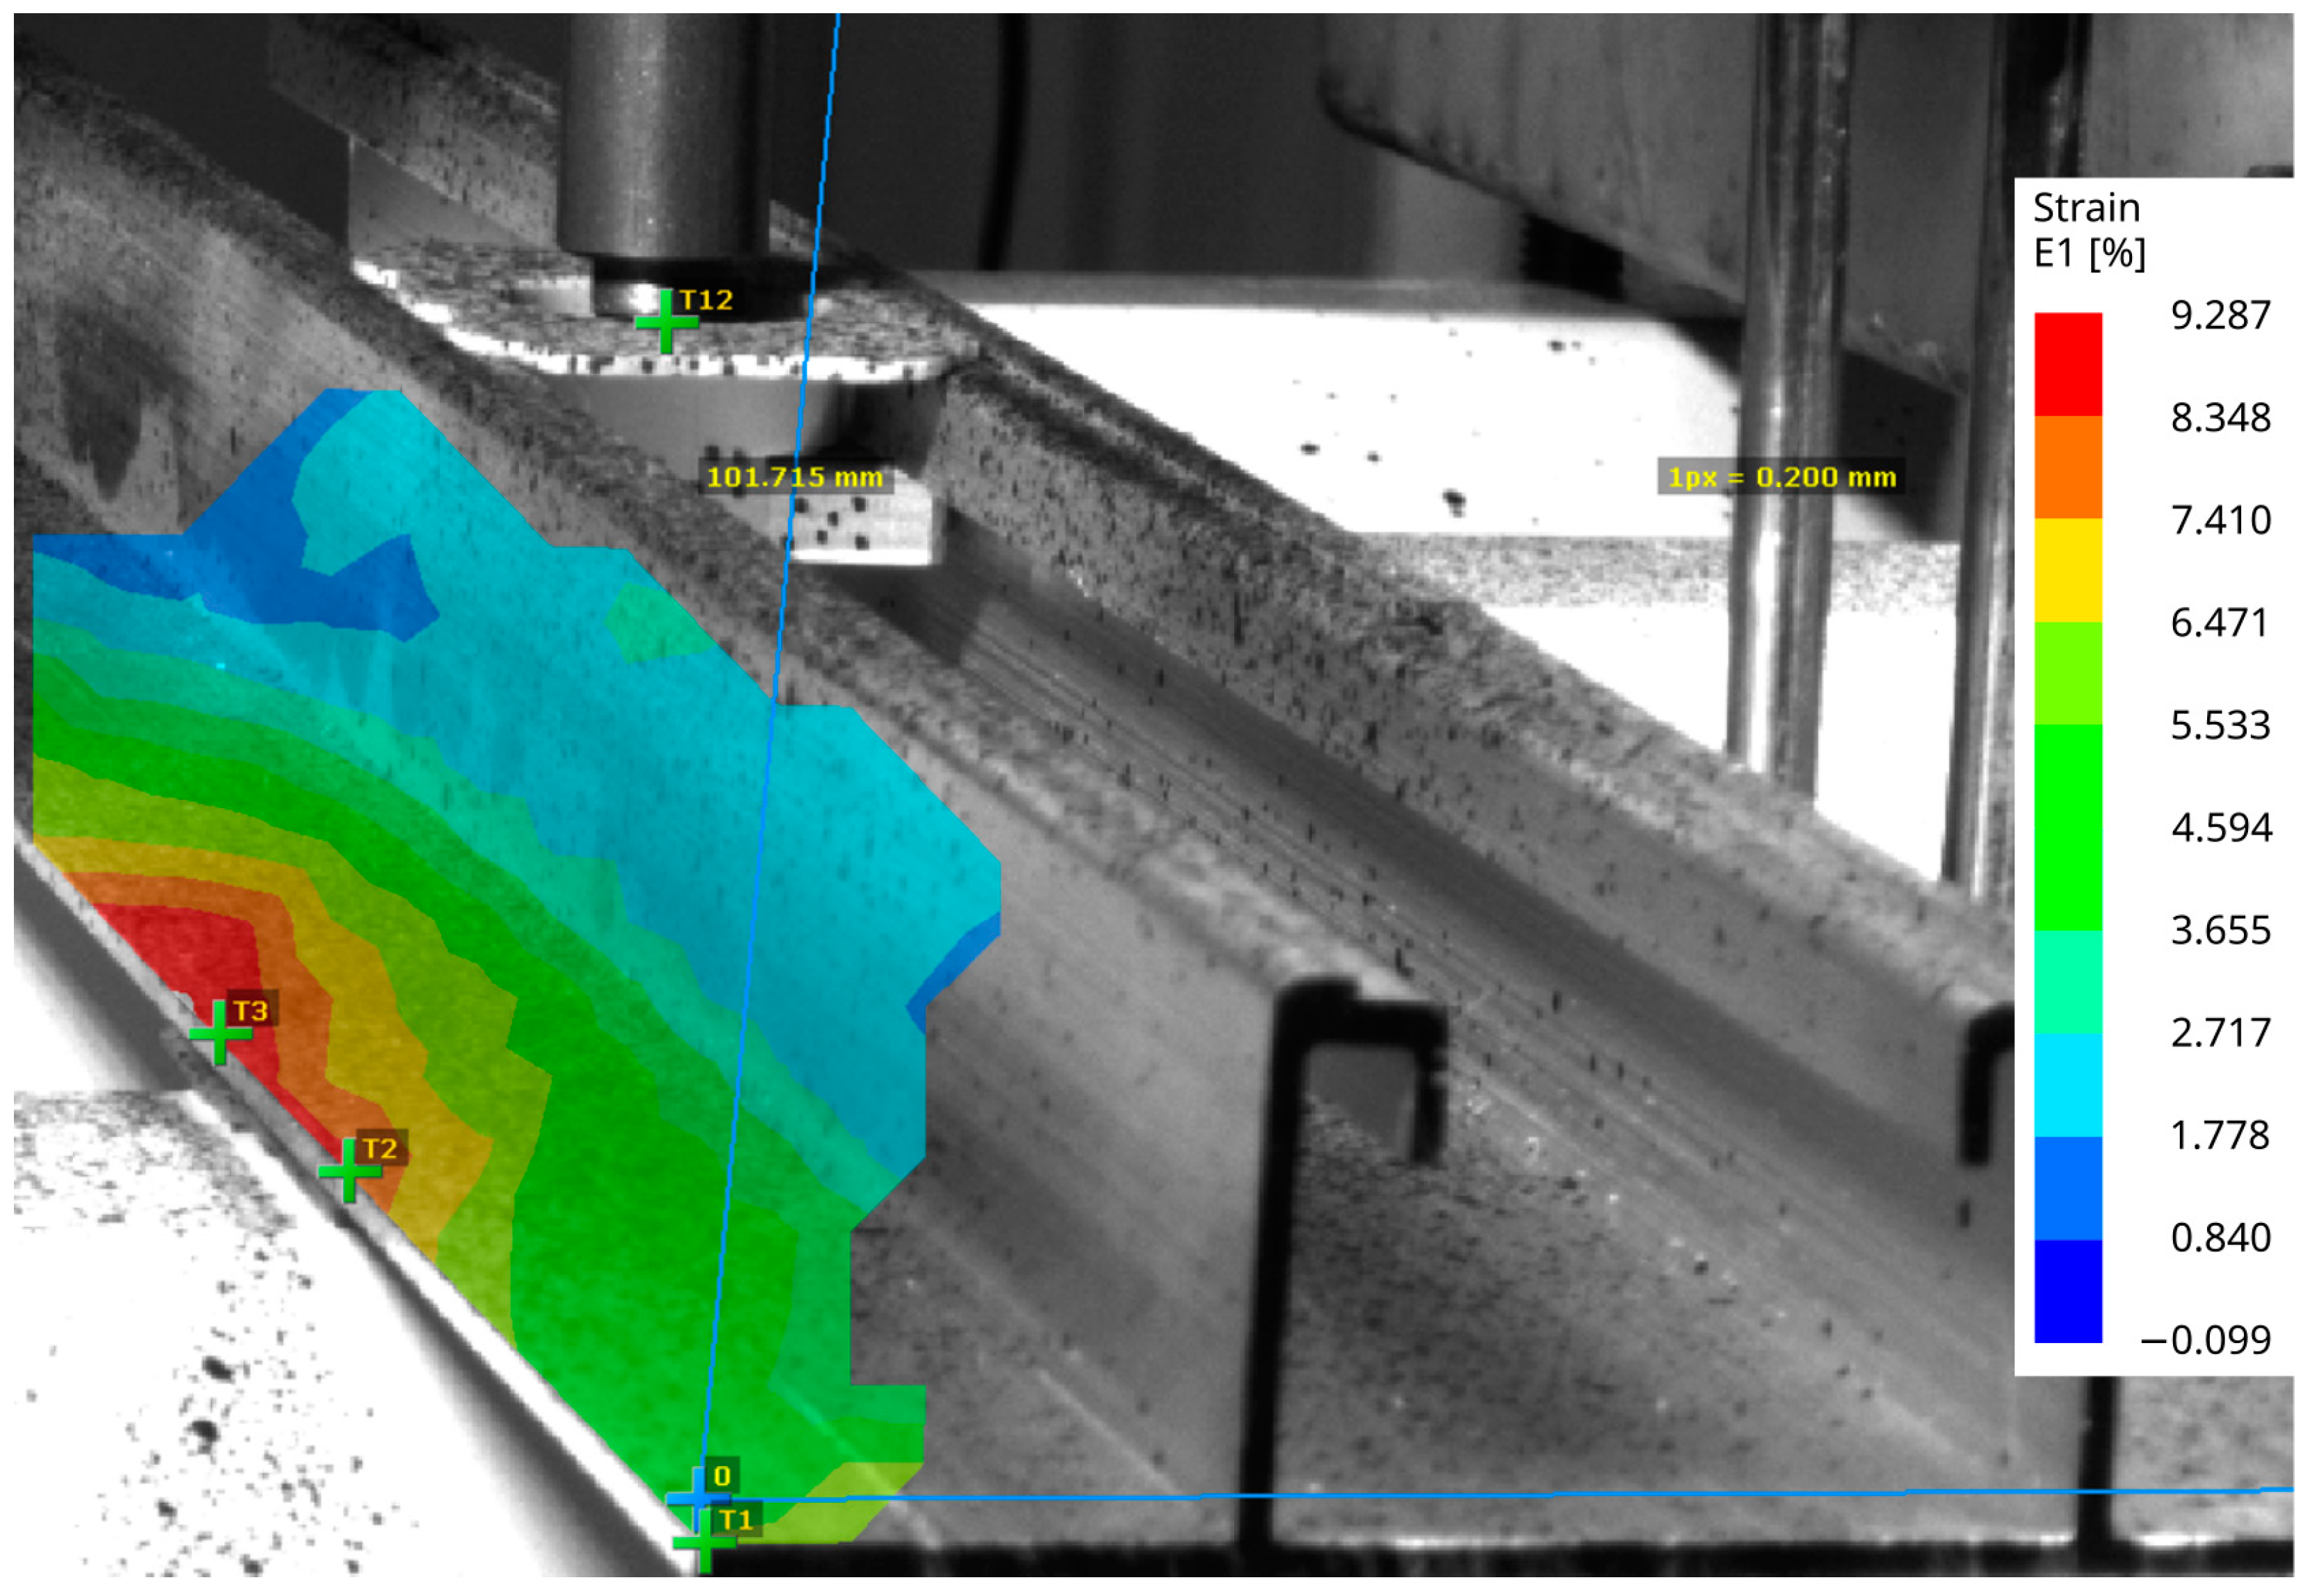
During the tensile testing, the experimental setup did not allow recording of the deformation of the VHBTM tape for DIC. Therefore, the deformation of the aluminum mounting profile was recorded instead. Figure 11 shows an elastic strain field E1 that is related to its principal axis. This strain field is not uniformly distributed over the bonded area, indicating that the aluminum profile does not uniformly distribute the stress.

Figure 11.
The E1 strain on the surface, captured by the DIC device.
3.3. Chemical Analysis Results
X-ray fluorescence analysis was performed at the reference sample and immersed sample of adhesive tape to find the presence of an inorganic phase. A comparison of detected elements and their content in weight% for both samples (reference and after exposure to ETAG 002 [16]) is shown in Table 4. The results of the X-ray fluorescence analysis of the reference adhesive sample indicate mainly the filler content. Most likely, the filler is formed mainly on an oxide base and contains mainly SiO2, ZnO, and Al2O3. The presence of calcium is probably related to CaSO4 (probably the salt dihydrate), which also explains the detected elevated sulfur content detected. It cannot be excluded that a certain part of sulfur is bound to organic compounds of the binder base in the form of peripheral substituents, -SH, or in the form of bridging bonds, -S- or -S-S-. The presence of sulfur-containing heterocyclic compounds (thiophene, isothiazole, thiazole, etc.) cannot be completely excluded either. The low iron content of the sample can be present on the base of the oxide—most likely Fe2O3 (pigment or impurity accompanying other oxides). The low phosphorus content may also be present as an oxide; however, the incorporation of phosphorus into the organic resin base as a peripheral substituent (e.g., PO(OH)2) is much less likely.
Table 4.
The presence and quantification of elements obtained by X-ray fluorescence analysis for the reference sample and the immersed sample of adhesive tape.
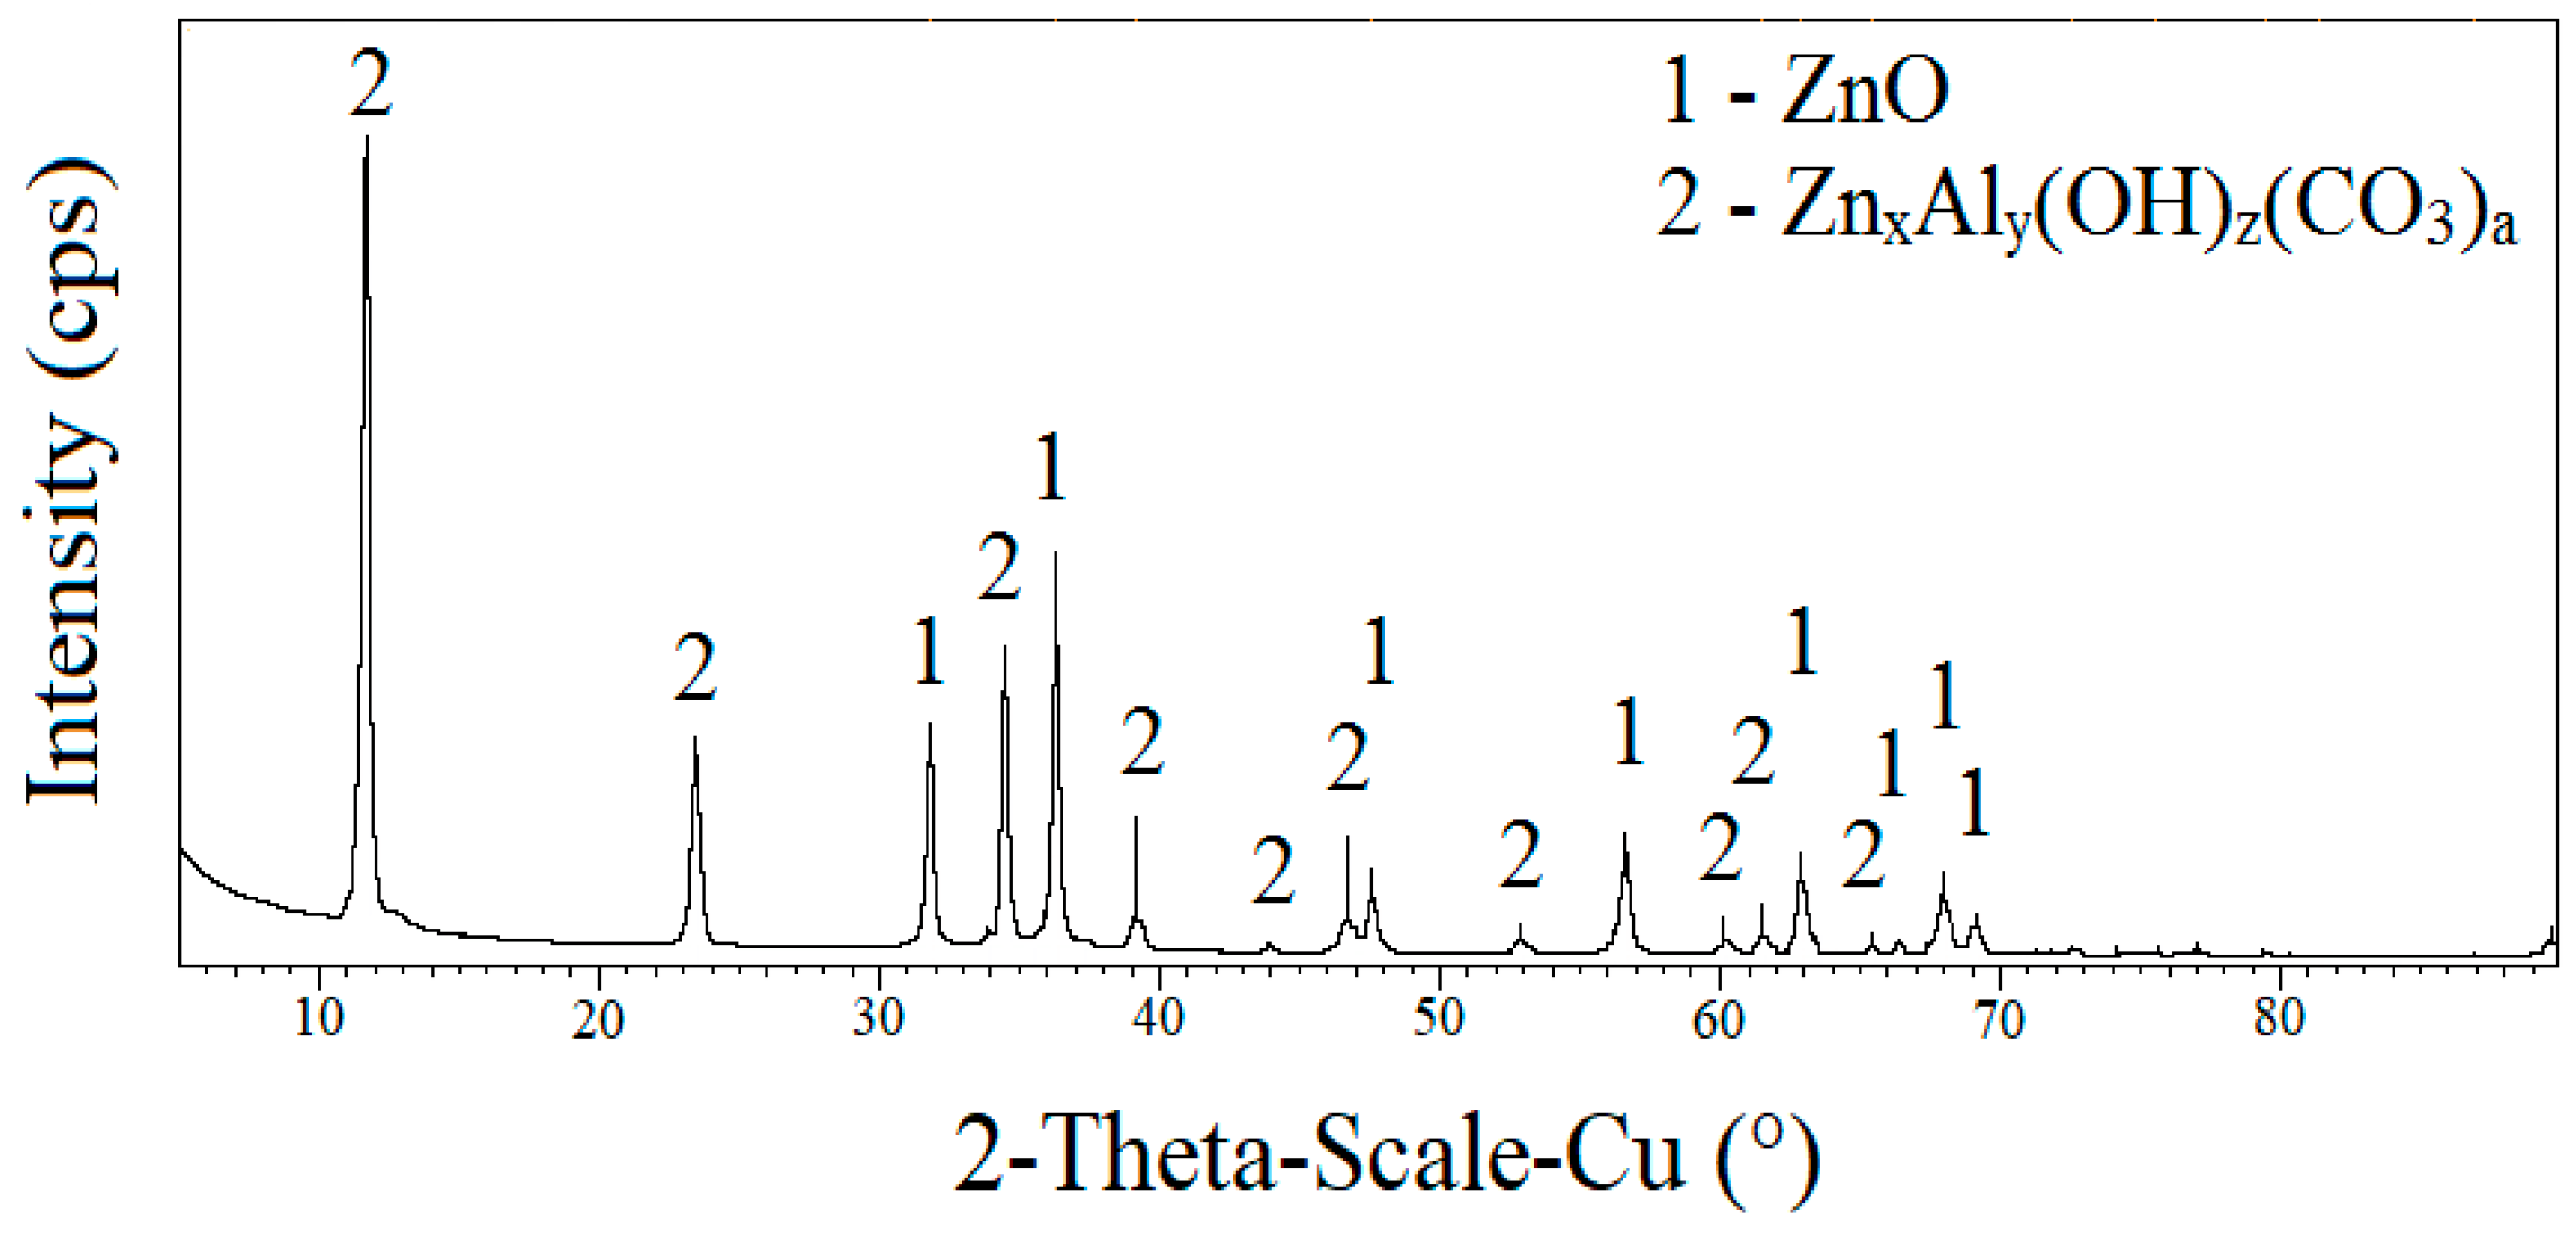
The results of the X-ray diffraction analysis, see the diffraction pattern in Figure 12, of the desorbed crystalline inorganic moiety indicate the presence of ZnO and a nonstoichiometric basic carbonate ZnxAly(OH)z(CO3)a, which was formed by the conversion of ZnO, Al2O3, H2O under the coaction of atmospheric CO2. This phase is very stable, and gradually, all unreacted ZnO would be converted to aqueous medium. The presence of other phases could not be detected, although it is evident that the sediment contains a small part of the amorphous phase. The apparent desorption of ZnO is also confirmed by the results of the X-ray fluorescence analysis (Table 4), that is, the apparent decrease in the zinc content of the sample after immersion in water (ETAG 002 [16] exposure) compared to the reference sample.
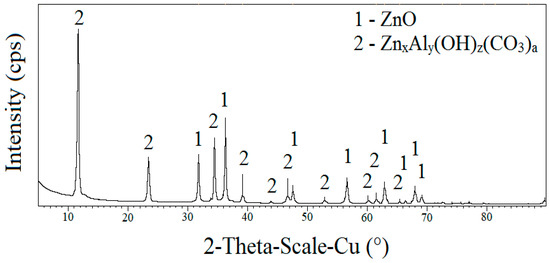
Figure 12.
The results of the X-ray diffraction analysis of the crystalline solid phase of adhesive tape after exposure to ETAG 002 [16].
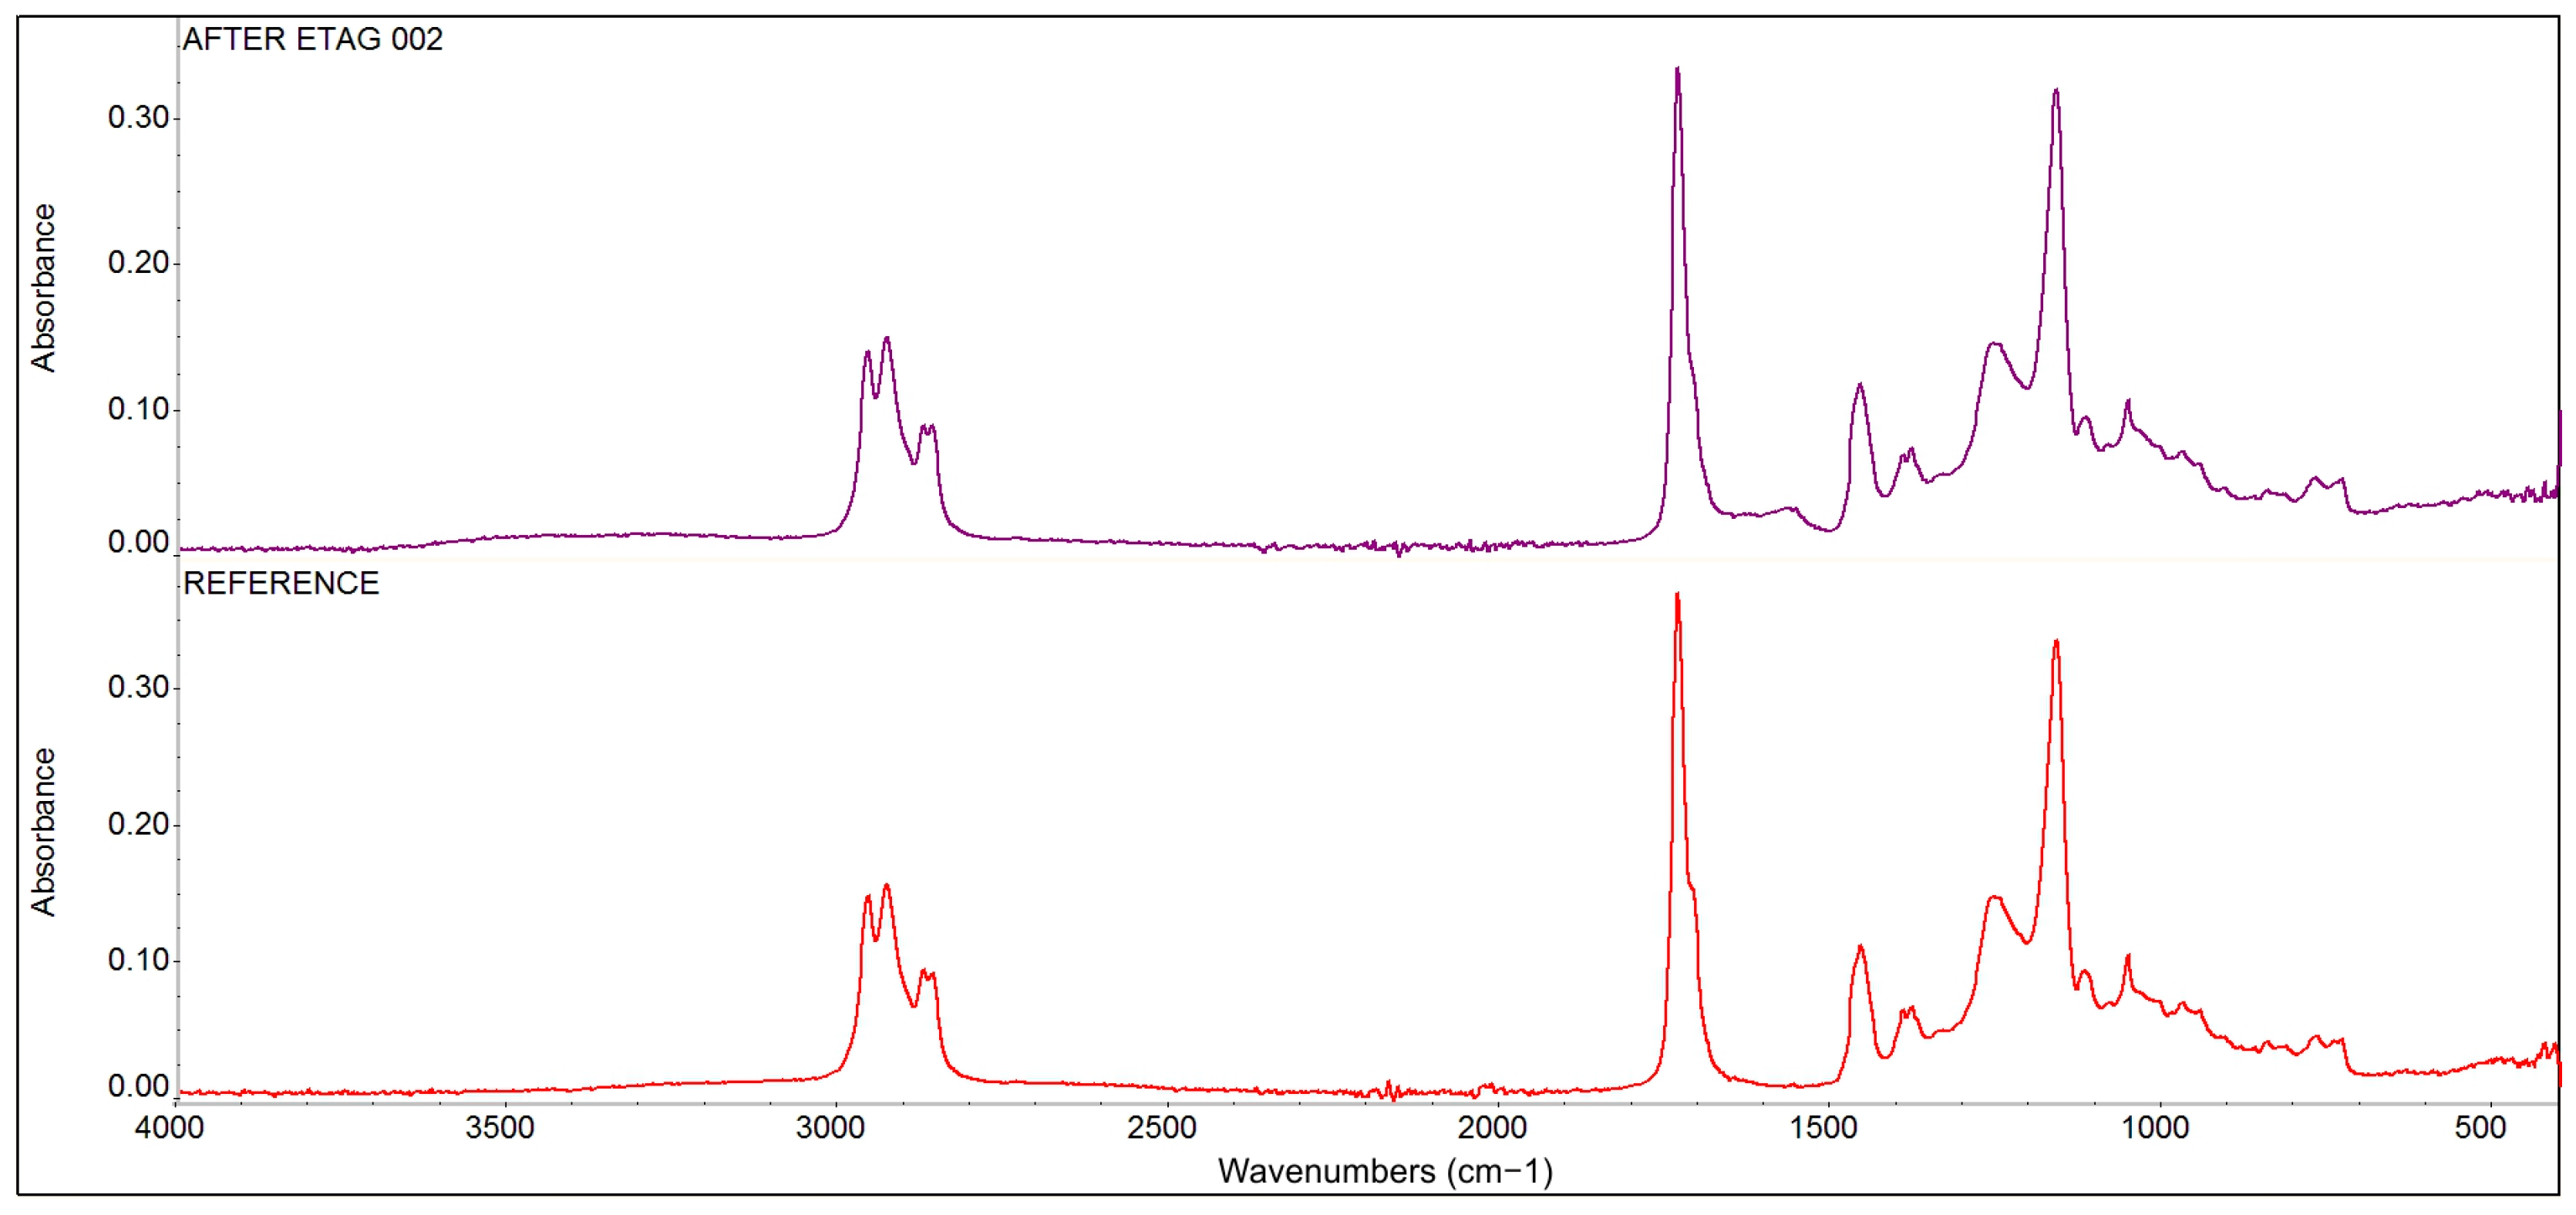
The results of the comparative infrared spectroscopy analysis, see Figure 13, demonstrate that the resin base of the adhesive is an acrylate-based copolymer: poly (acrylic acid)-(butyl acrylate)-(ethyl acrylate). No changes in the composition of this resin base were detected by the FT-IR analysis after its exposure to the ETAG 002 conditions [16]. Only partial and peripheral hydrolysis related to the formation of peripheral OH groups were found: the H2O molecules were detected in the structure of the adhesive, indicating that the adhesive tape sample was not completely dried after exposure to the ETAG 002 [16] conditions.
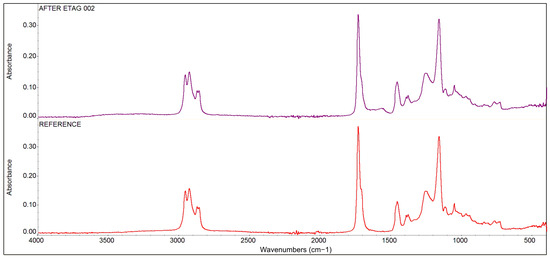
Figure 13.
The results of comparative infrared spectroscopy analysis of the bonding phase of the reference tape adhesive sample and the adhesive tape sample after immersion.
4. Discussion and Interpretation of Results
4.1. Mechanical Properties
To define the degradation effect of immersion in water in the DLJ specimens, strength reduction (SR) and the reduction of the initial shear modulus (GR) were calculated, using the following equations:
where τR is a mean value of the shear strength and GR is a mean value of the initial shear modulus of a particular batch of specimens of reference set; τETAG is a mean value of the shear strength and GETAG is a mean value of the initial shear modulus of the corresponding batch of specimens exposed to immersion in water according to ETAG 002 [16].
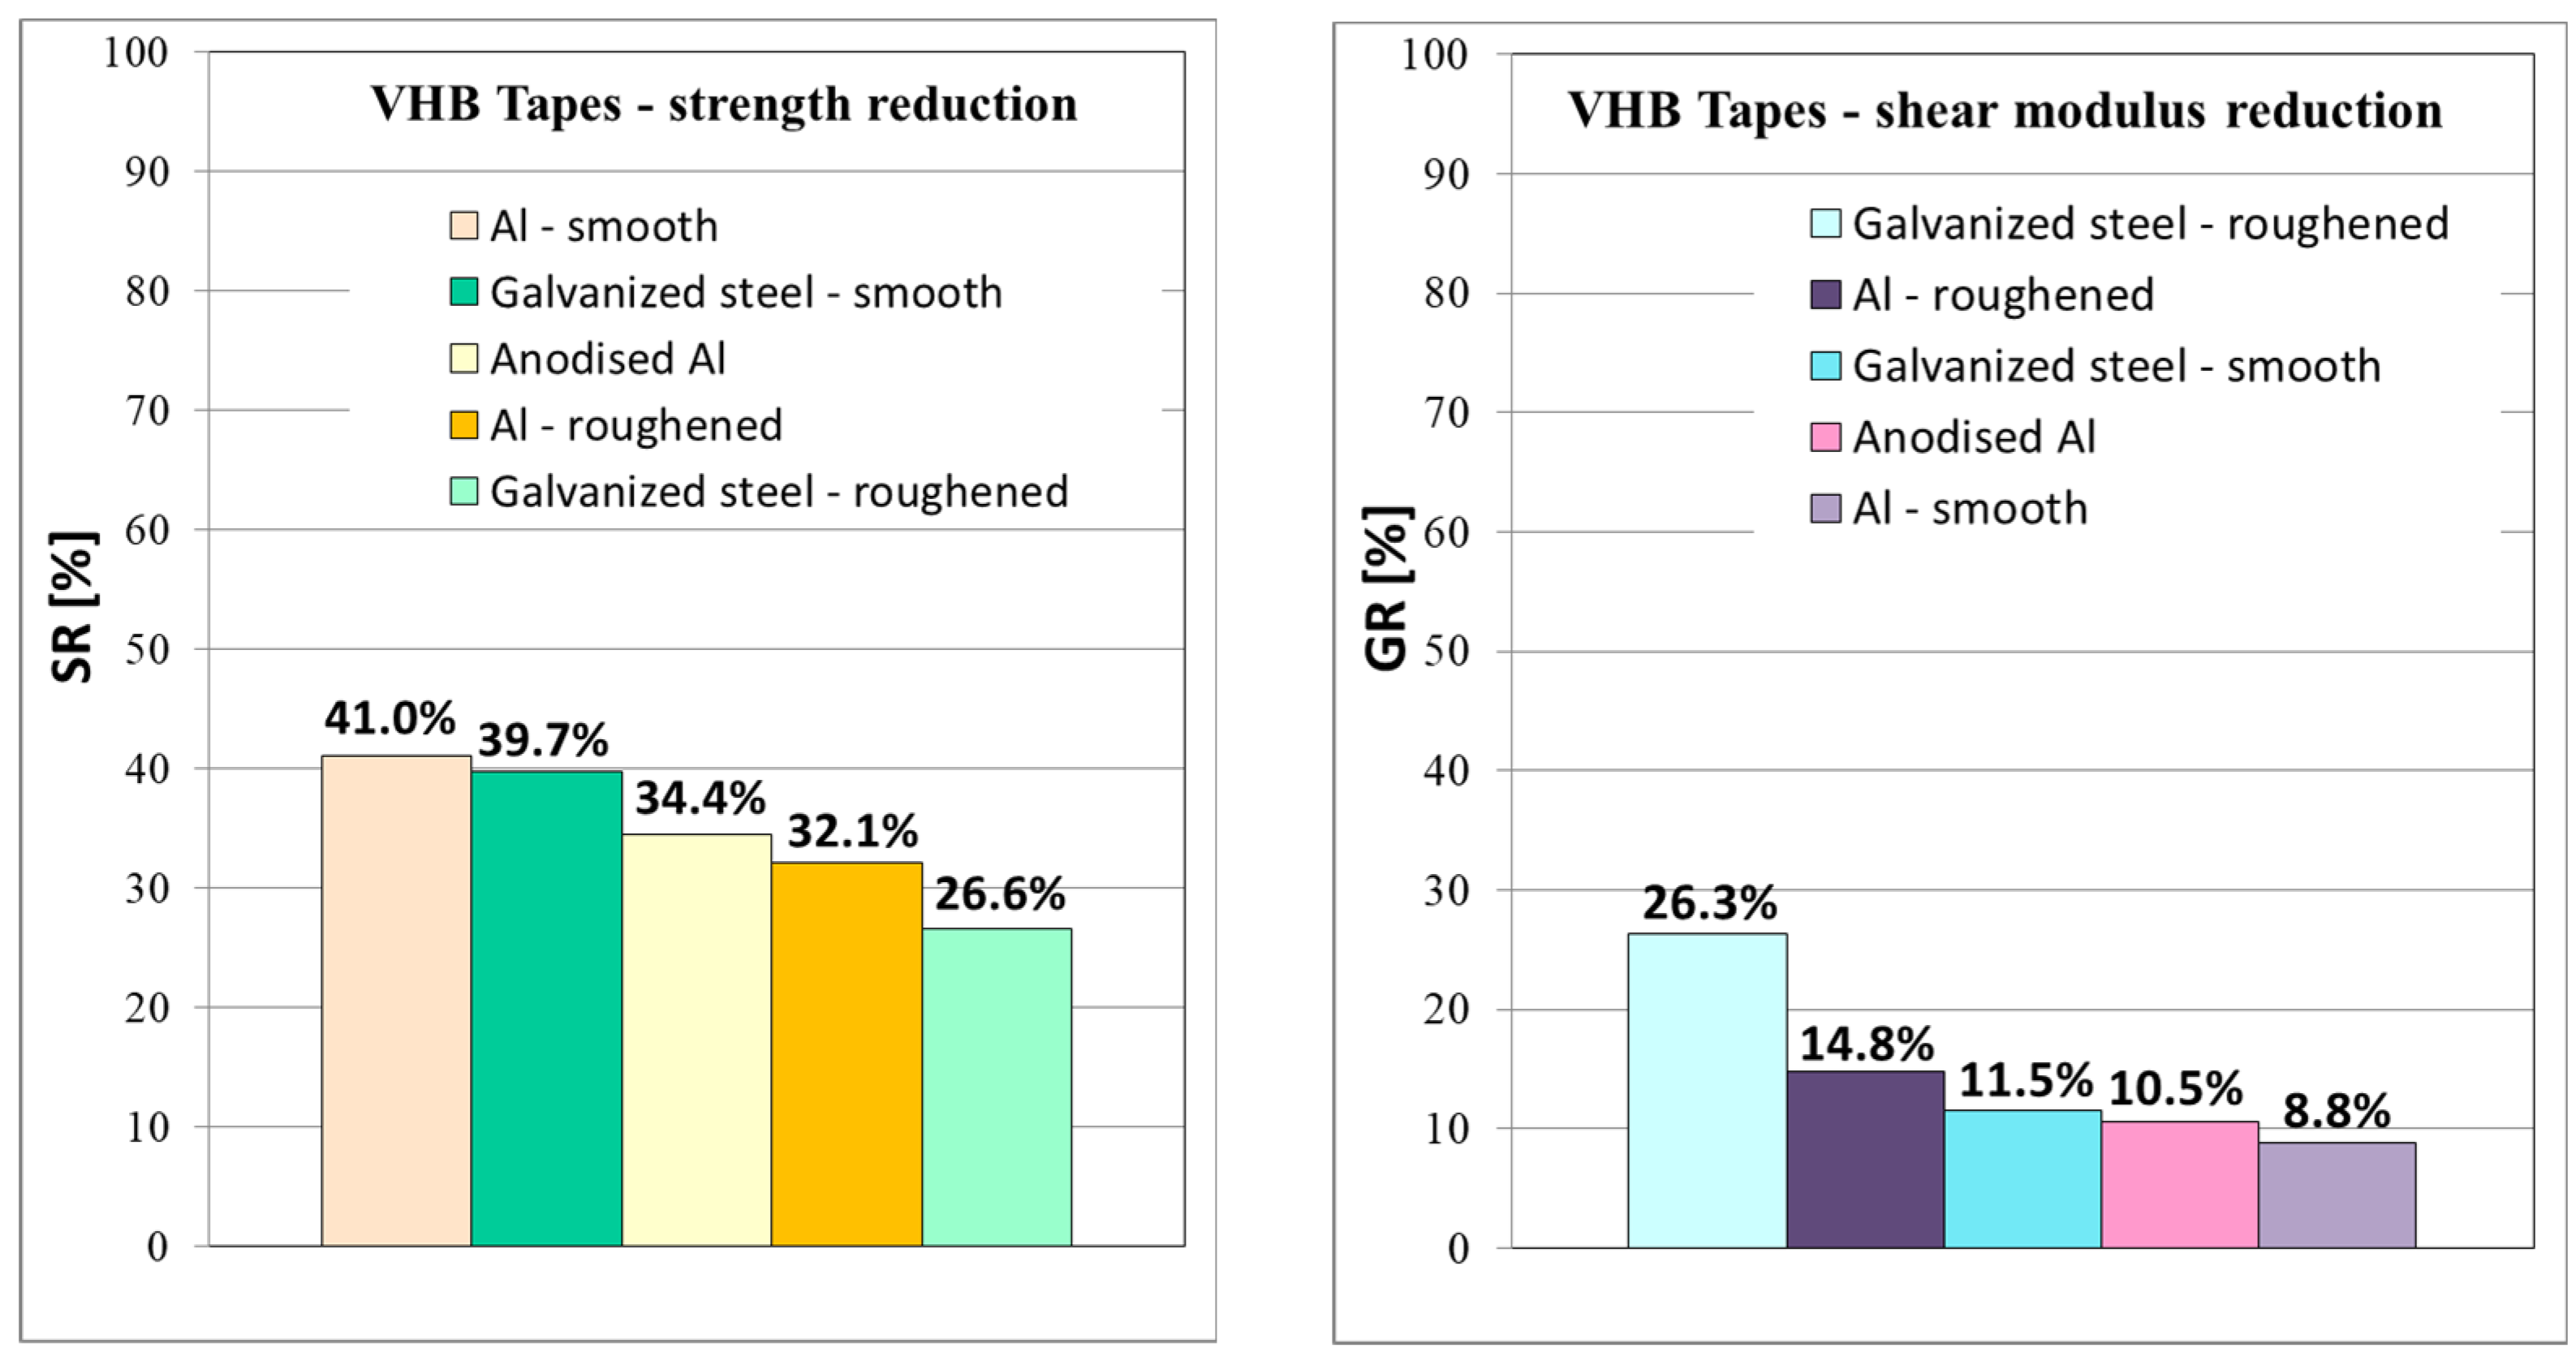
From the graphs in Figure 14, it is clearly visible that the most significant reduction in strength was observed in the specimens with smooth surface without roughening, where a decrease in shear strength was observed by 41% for smooth aluminum and 39.7% for smooth galvanized steel. On the other hand, the shear modulus of both smooth materials decreased by 8.8% and 11.5%, which was a lower reduction than in the case of roughened materials. It indicates a weaker interphase between the adhesive tape and the substrate without roughening. Strength decreasing by app. 30–40% and shear modulus by app. 10–20% for VHB™ tapes is a significantly better result than was observed for similar acrylate adhesive joints in [18], where the worsening of mechanical properties after immersion was by app. 70%.
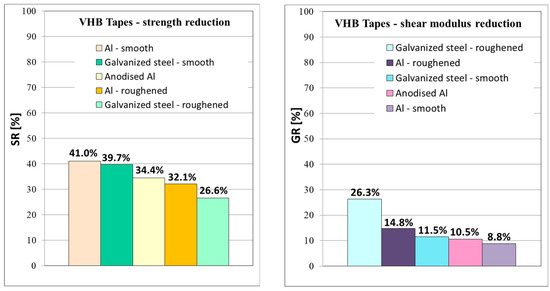
Figure 14.
The average shear strength reduction and shear modulus reduction after immersion for all batches of DLJ specimens.
4.2. Mode of Failure
4.2.1. Failure Mode of Reference Batches of DLJ and Tensile Specimens
As mentioned in the Results section, for the reference batch of specimens with smooth aluminum substrate adhesion, the failure mode was observed more frequently—at approximately 55% of the total bonded area, see Table 5—and a noticeable part of the adhesive failure was observed in the AlMg1 alloy (EN AW 5005) used for the side sheets. The adhesion of VHBTM tapes to the AlMgSi0.5 alloy (EN AW 6082) was significantly better; a prevailing cohesive failure was observed from the middle sheet of the DLJ specimens. When the aluminum specimens were roughened, no difference between alloys was observed. It could be explained by the action of other types of adhesion, such as the mechanical interlocking effect on the roughened surface and the increased bonded area due to the high roughness [19].
Table 5.
The adhesively broken part of the bonded area in the combined failure mode according to the ISO 10365 [17] classification.
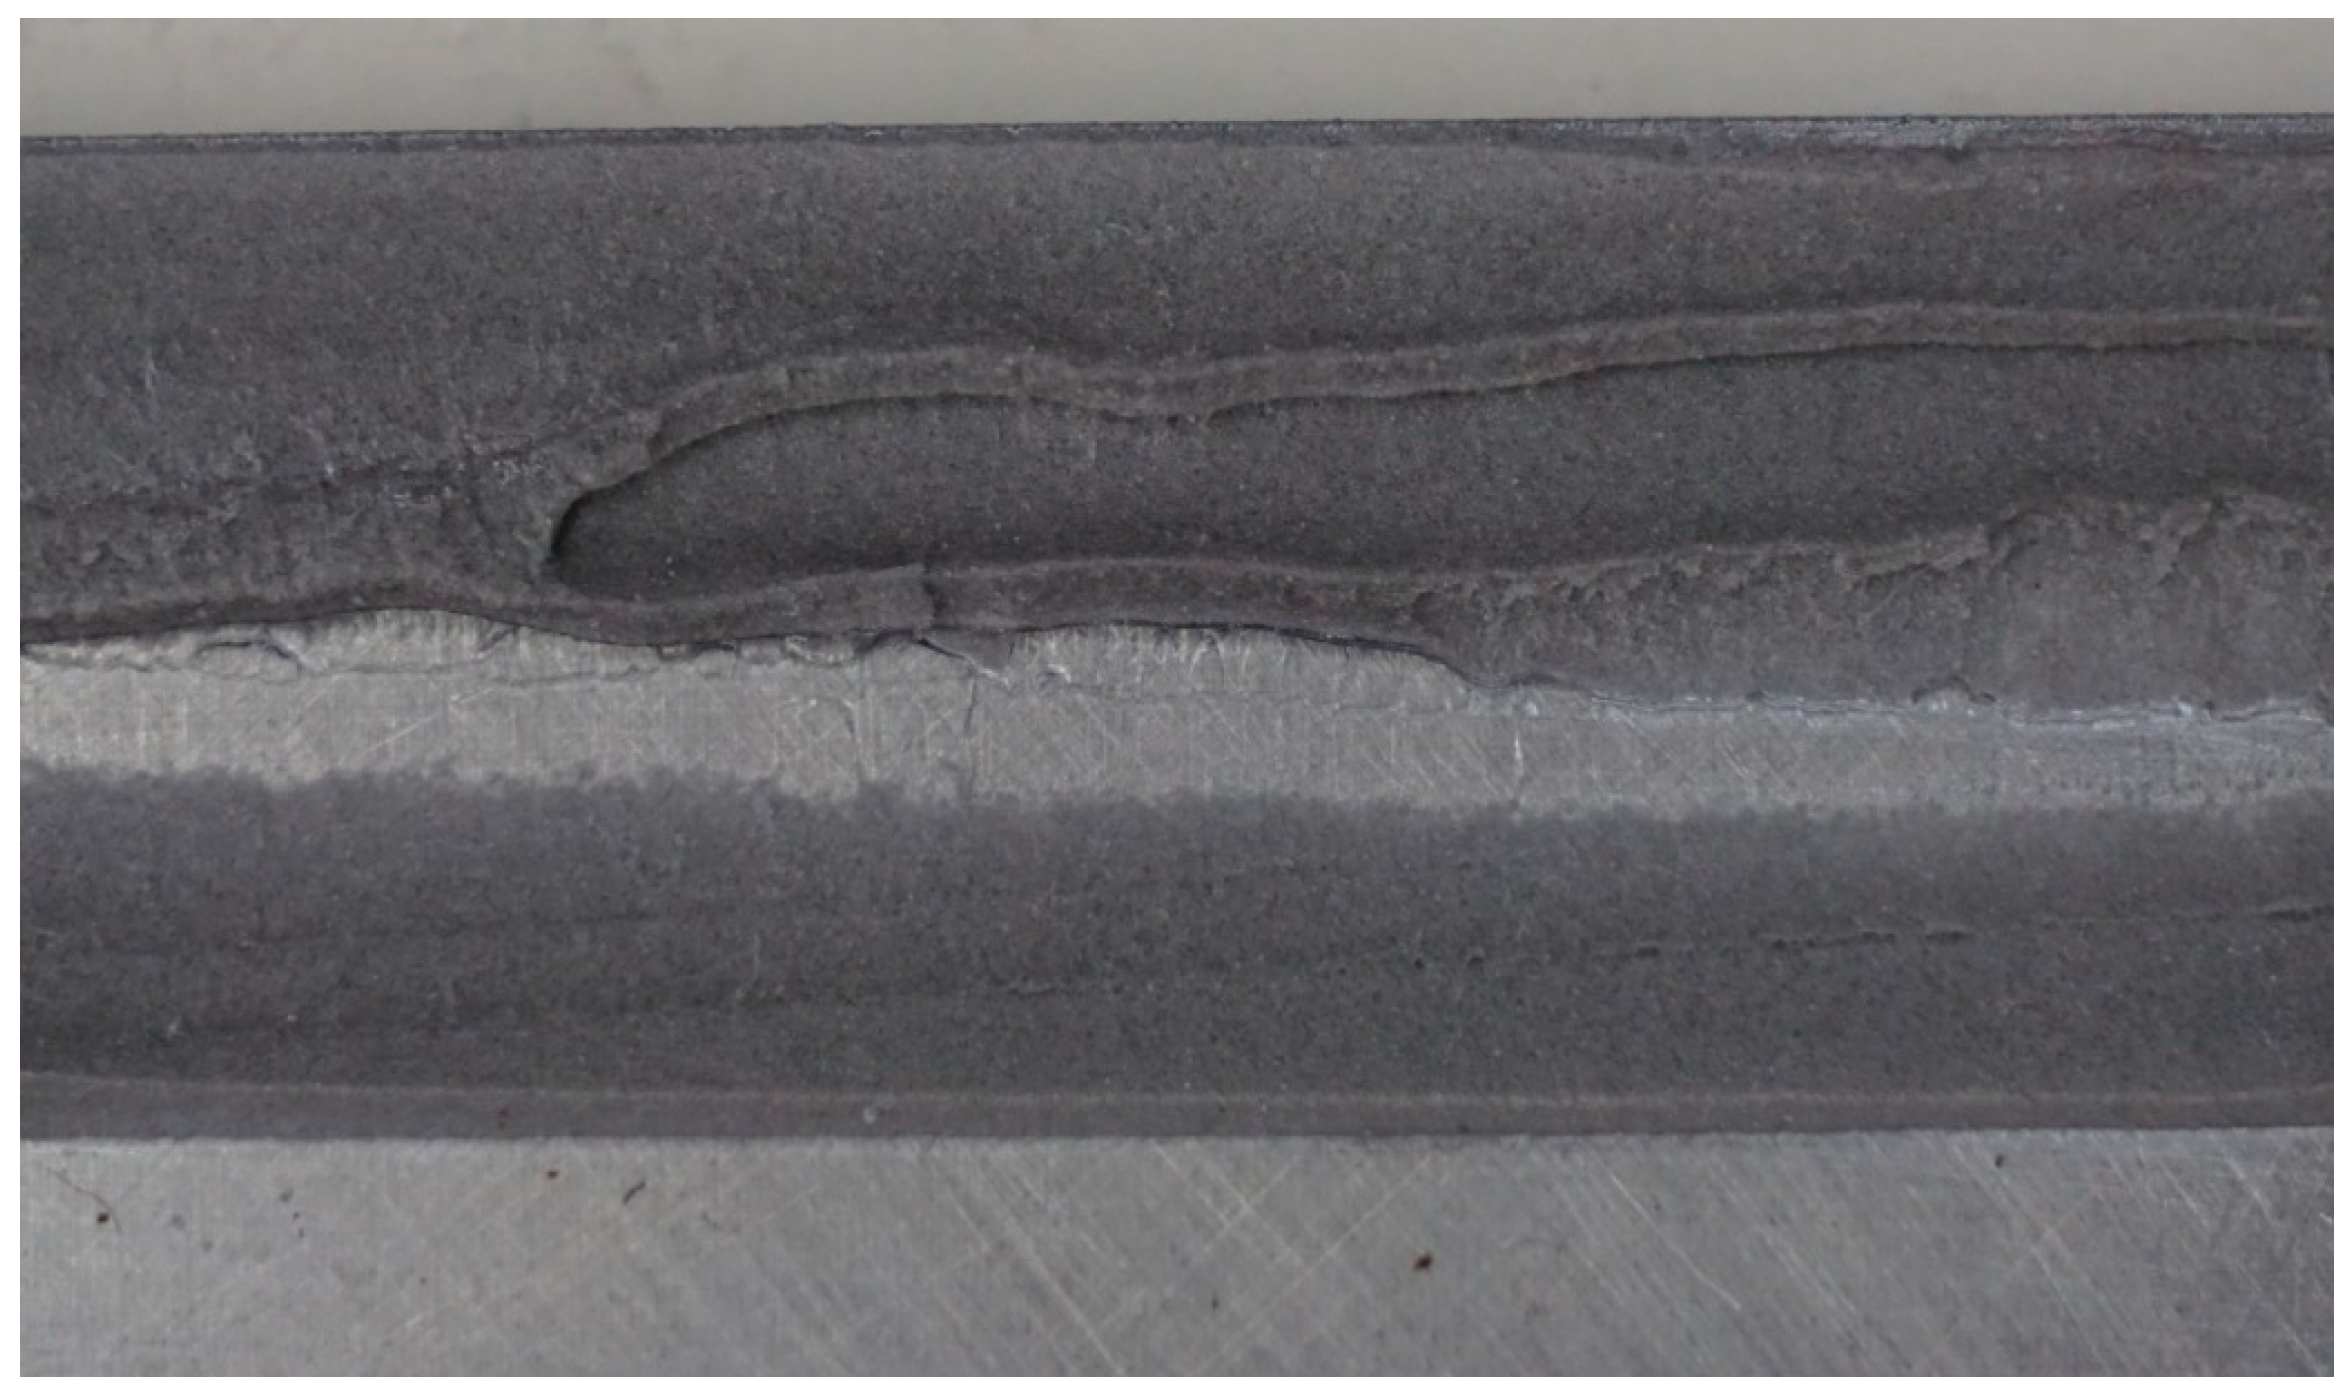
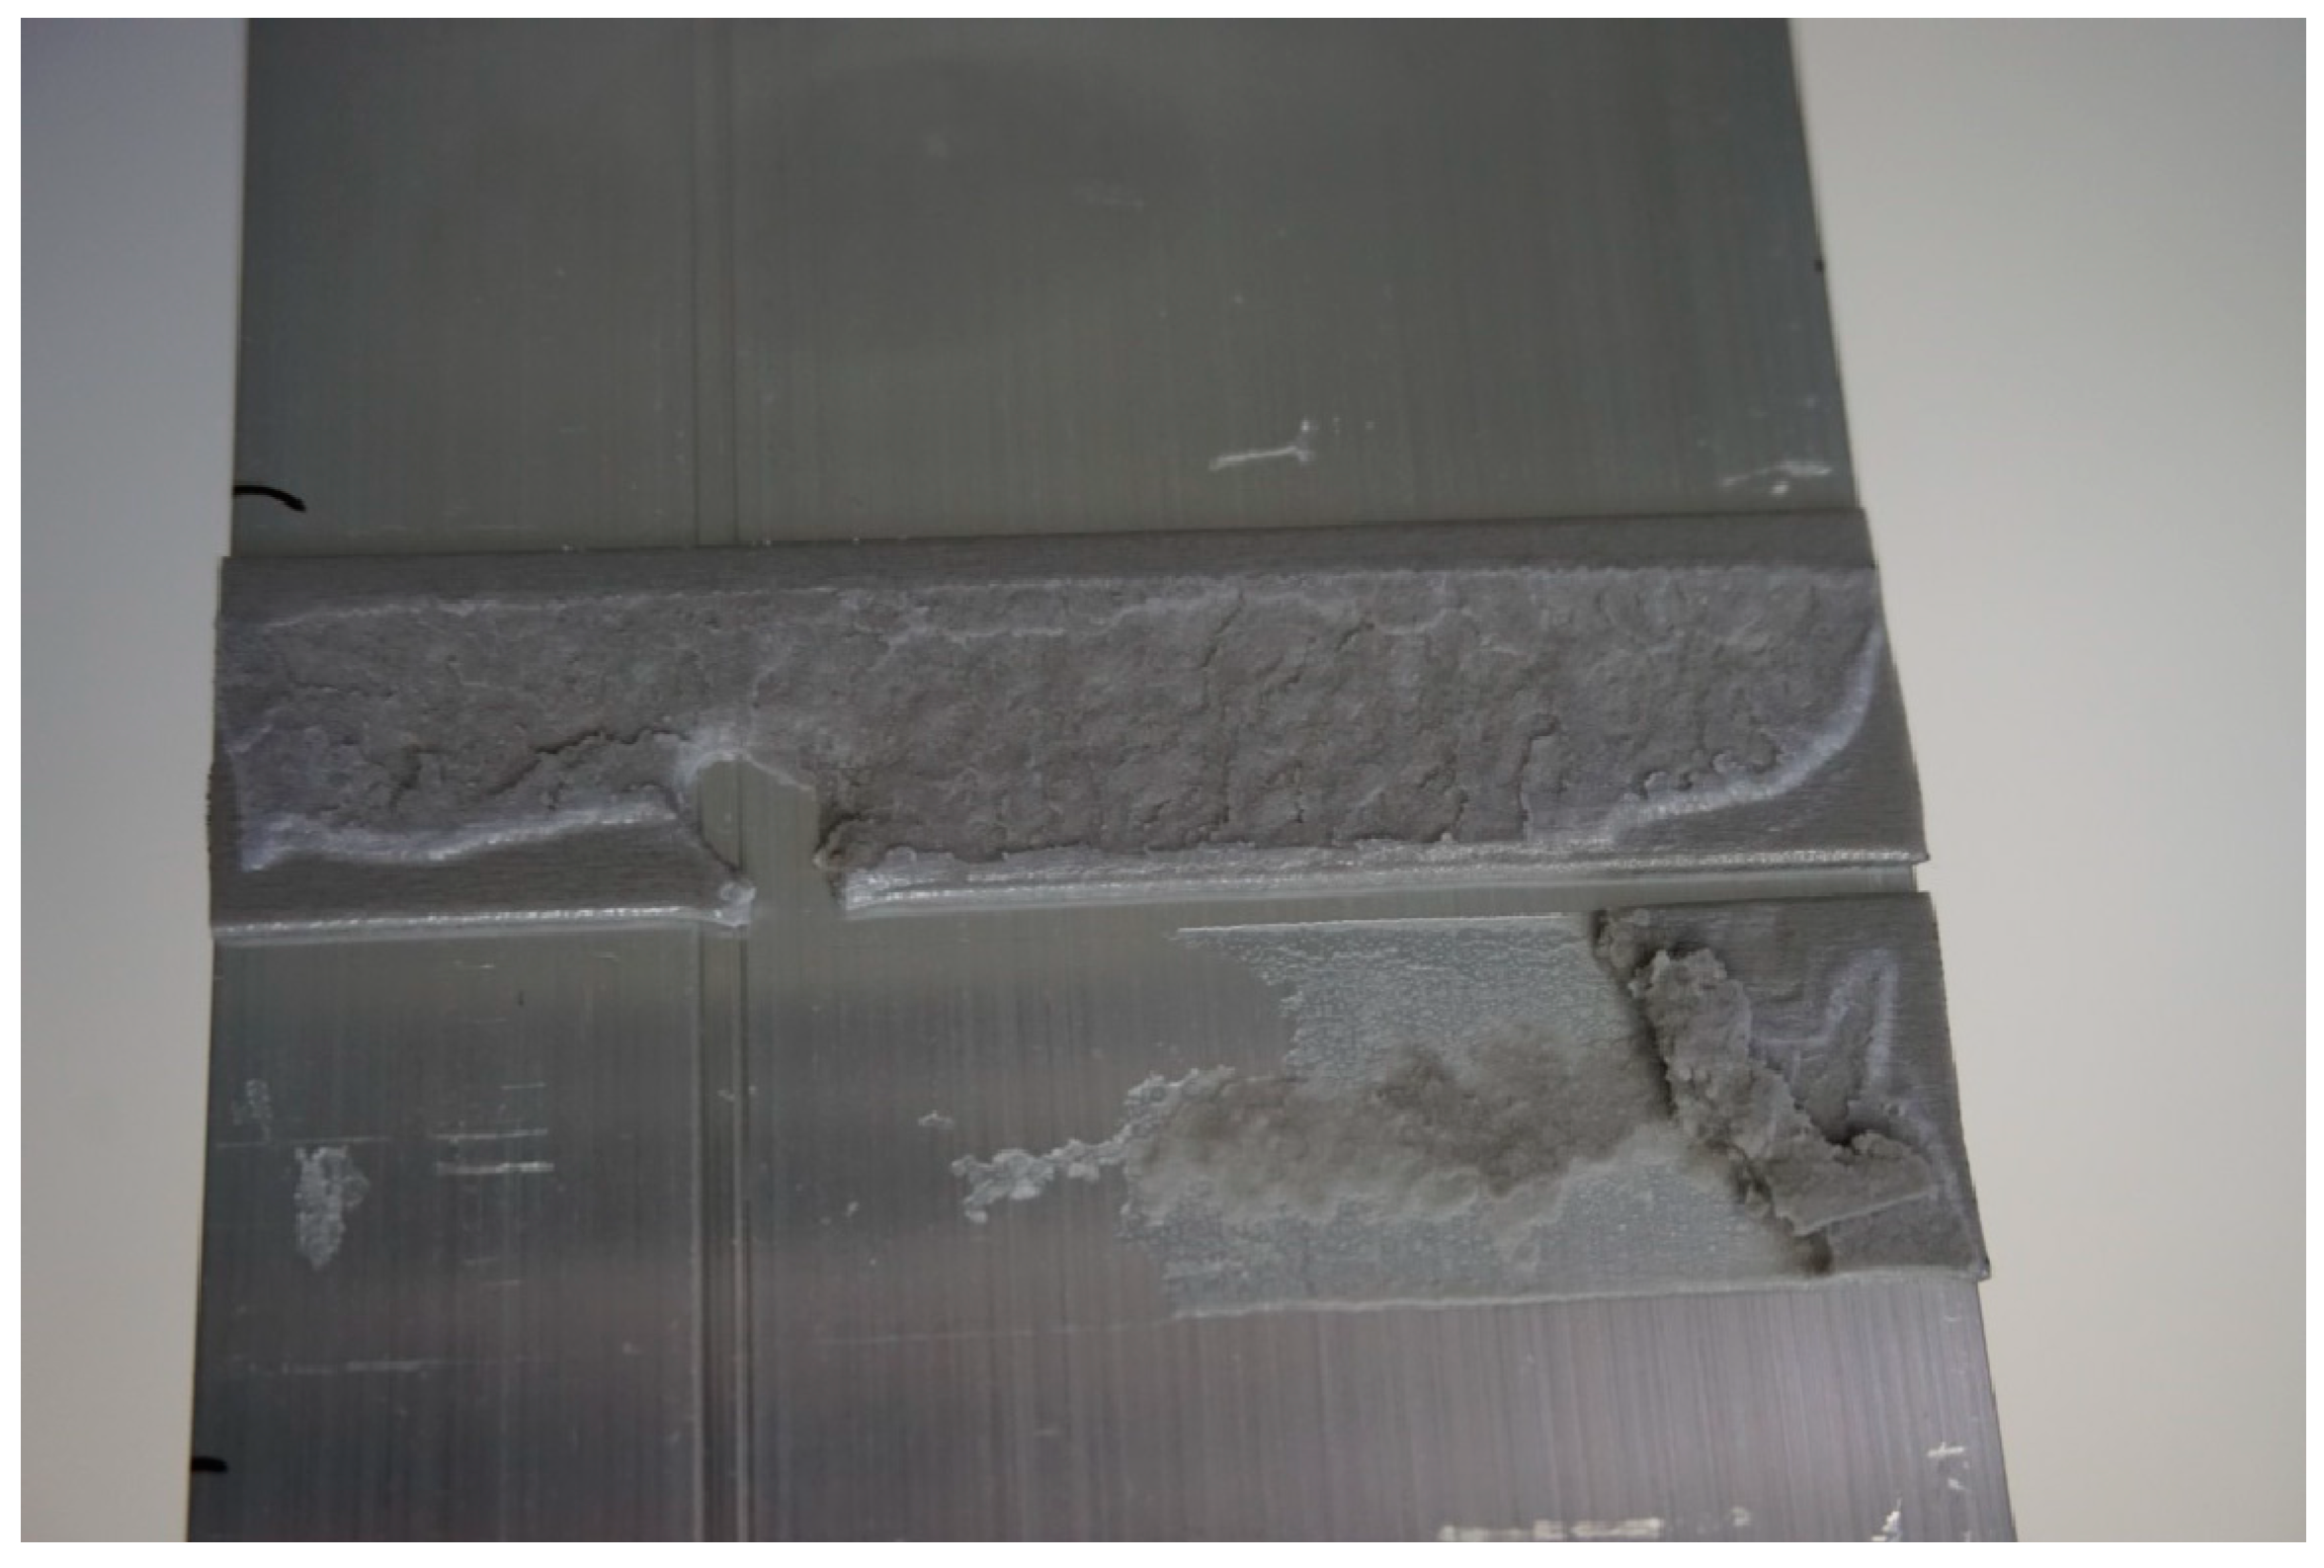
For the reference batch of specimens and also for the tensile test specimens, the failure mode of SCF (close to the substrate cohesive failure) was observed in about 10–20% depending on the substrate. The adhesive layer remained on the substrate while the foam core of the tape was separated. Bull et al. [10] observed a similar failure pattern with tacky transparent layer resisting on the substrate for the acrylic adhesive tapes. The limits in integrity of the tape were visible in the specimens that were not exposed to immersion, and therefore, a greater stress was obtained in the adhesive layer; see Figure 15 and Figure 16.
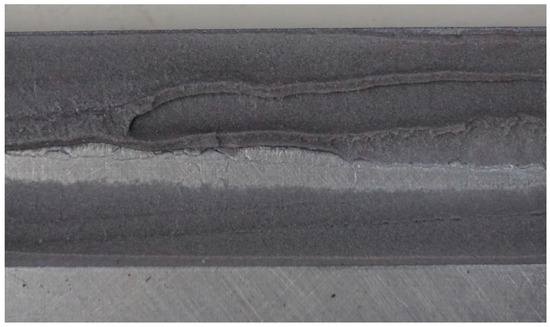
Figure 15.
Transparent tacky layer in the roughened aluminum DLJ specimen.
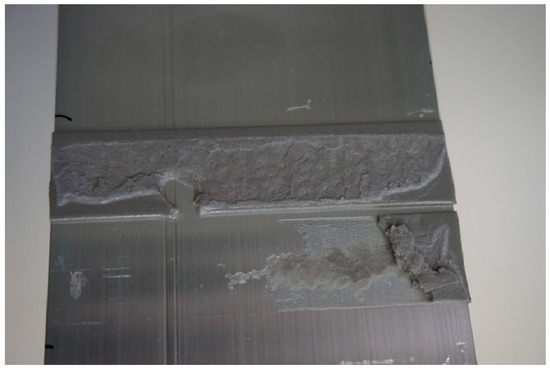
Figure 16.
The transparent tacky layer in the tensile test specimen.
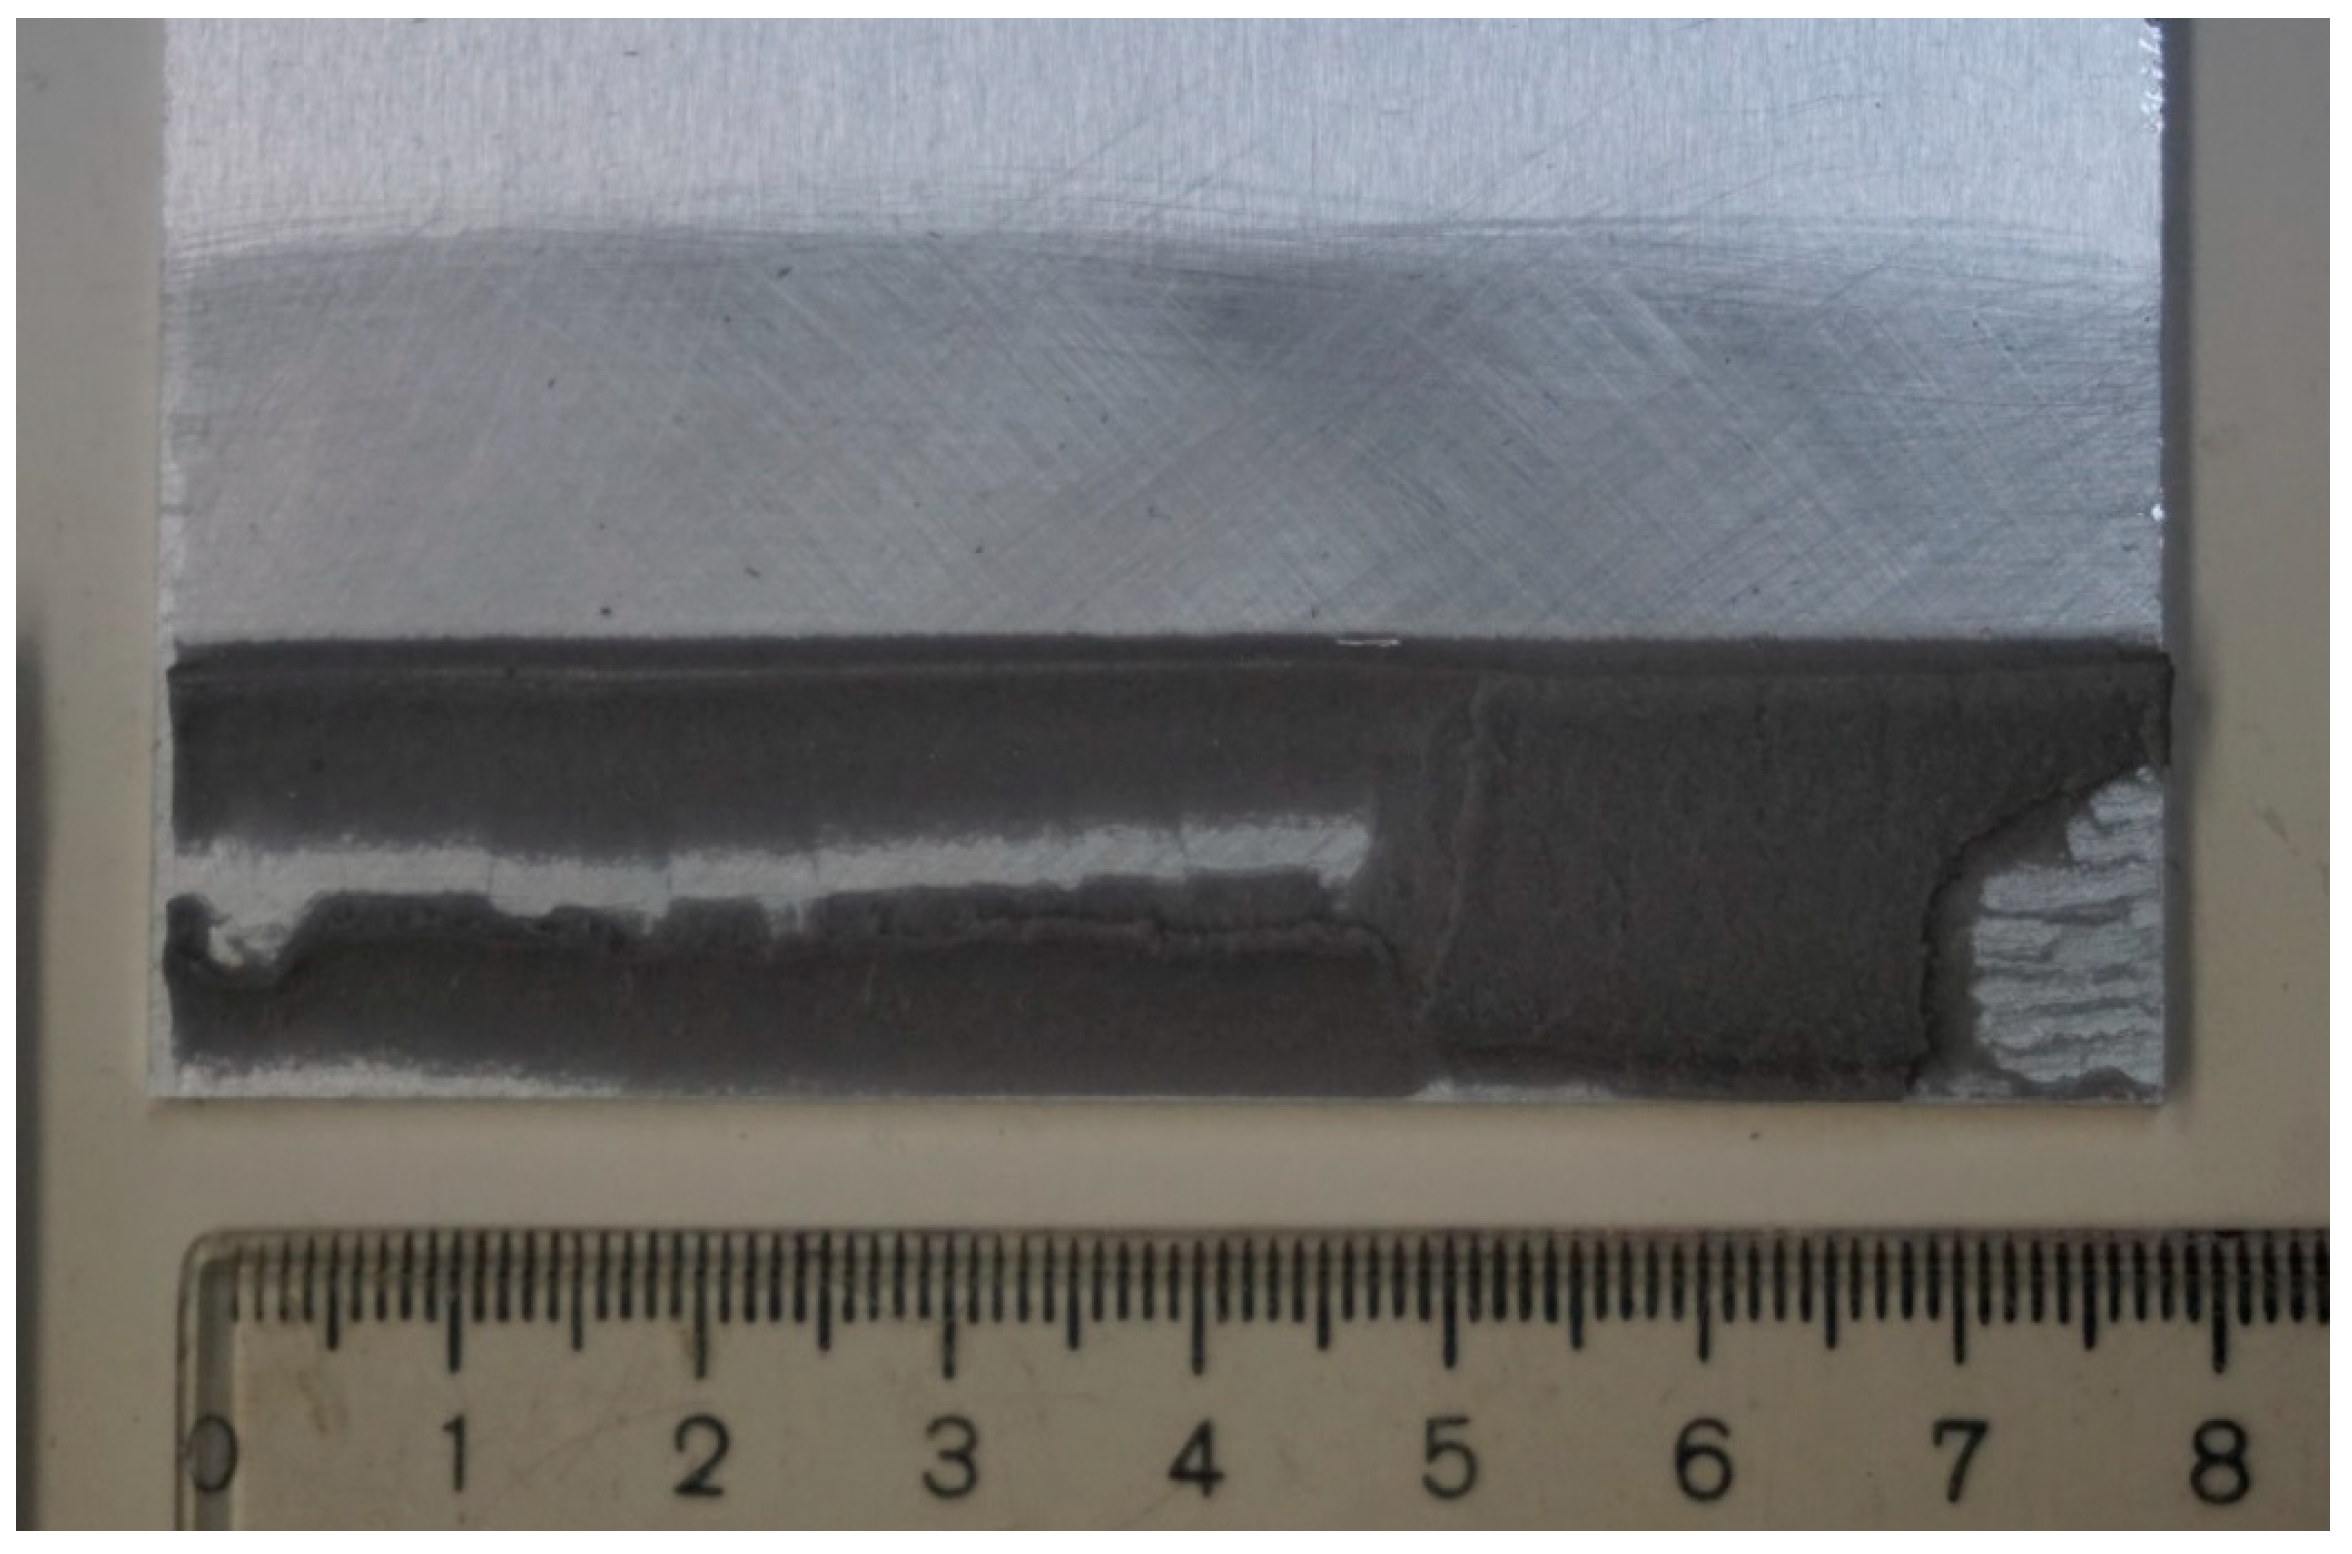
Townsend et al. [8], where the acrylic adhesive showed a “hackle pattern” at the shear specimens, also observed a close to substrate cohesive failure (in the acrylic adhesive layer). Similar wrinkling of the acrylic adhesive layer was also observed in the DLJ reference specimens, but only in the roughened aluminum batch, and the wrinkling was always on the sideways sheets made of AlMg1 alloy (EN AW 5005), see Figure 17.
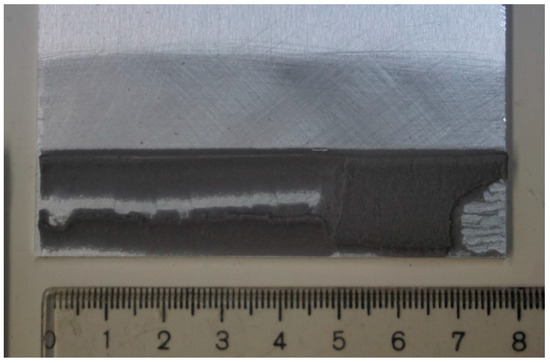
Figure 17.
The tacky layer with wrinkling on the aluminum substrate.
4.2.2. Failure Mode of the Immersed Batch of Specimens
A positive effect on adhesion was also observed in the roughened specimens after immersion compared to smooth immersed specimens. The specimens with roughened bonded areas showed a lower reduction in shear strength after immersion compared to reference batches, see the column chart in Figure 14.
In the case of the smooth aluminum specimens, no differences in adhesion to both alloys were shown after immersion. These specimens showed the predominant adhesive failure mode, which was approximately 75–80% of the bonded area, see Table 2 and Table 5.
The anodized aluminum specimens were broken by combined failure in a predominant cohesive manner after immersion. The increase in the adhesively broken bonded area was only approximately 5% after immersion, which is the lowest increase observed of all batches of specimens.
Both batches of galvanized steel showed a greater increase in the adhesively broken part of the bonded area after immersion. While the reference specimens showed a predominant cohesive failure in the combined failure mode, the specimens after immersion showed a predominant adhesive failure in the combined failure mode with about 60% of the adhesively broken bonded area. It was probably caused by the corrosive products that were created on the surface of the substrate.
The tacky layer due to disintegration of the tape was not observed in the immersed specimens at all. The immersed joints during a mechanical loading had lost their strength earlier due to worse adhesion, and therefore, lower stresses were achieved in the adhesive tape.
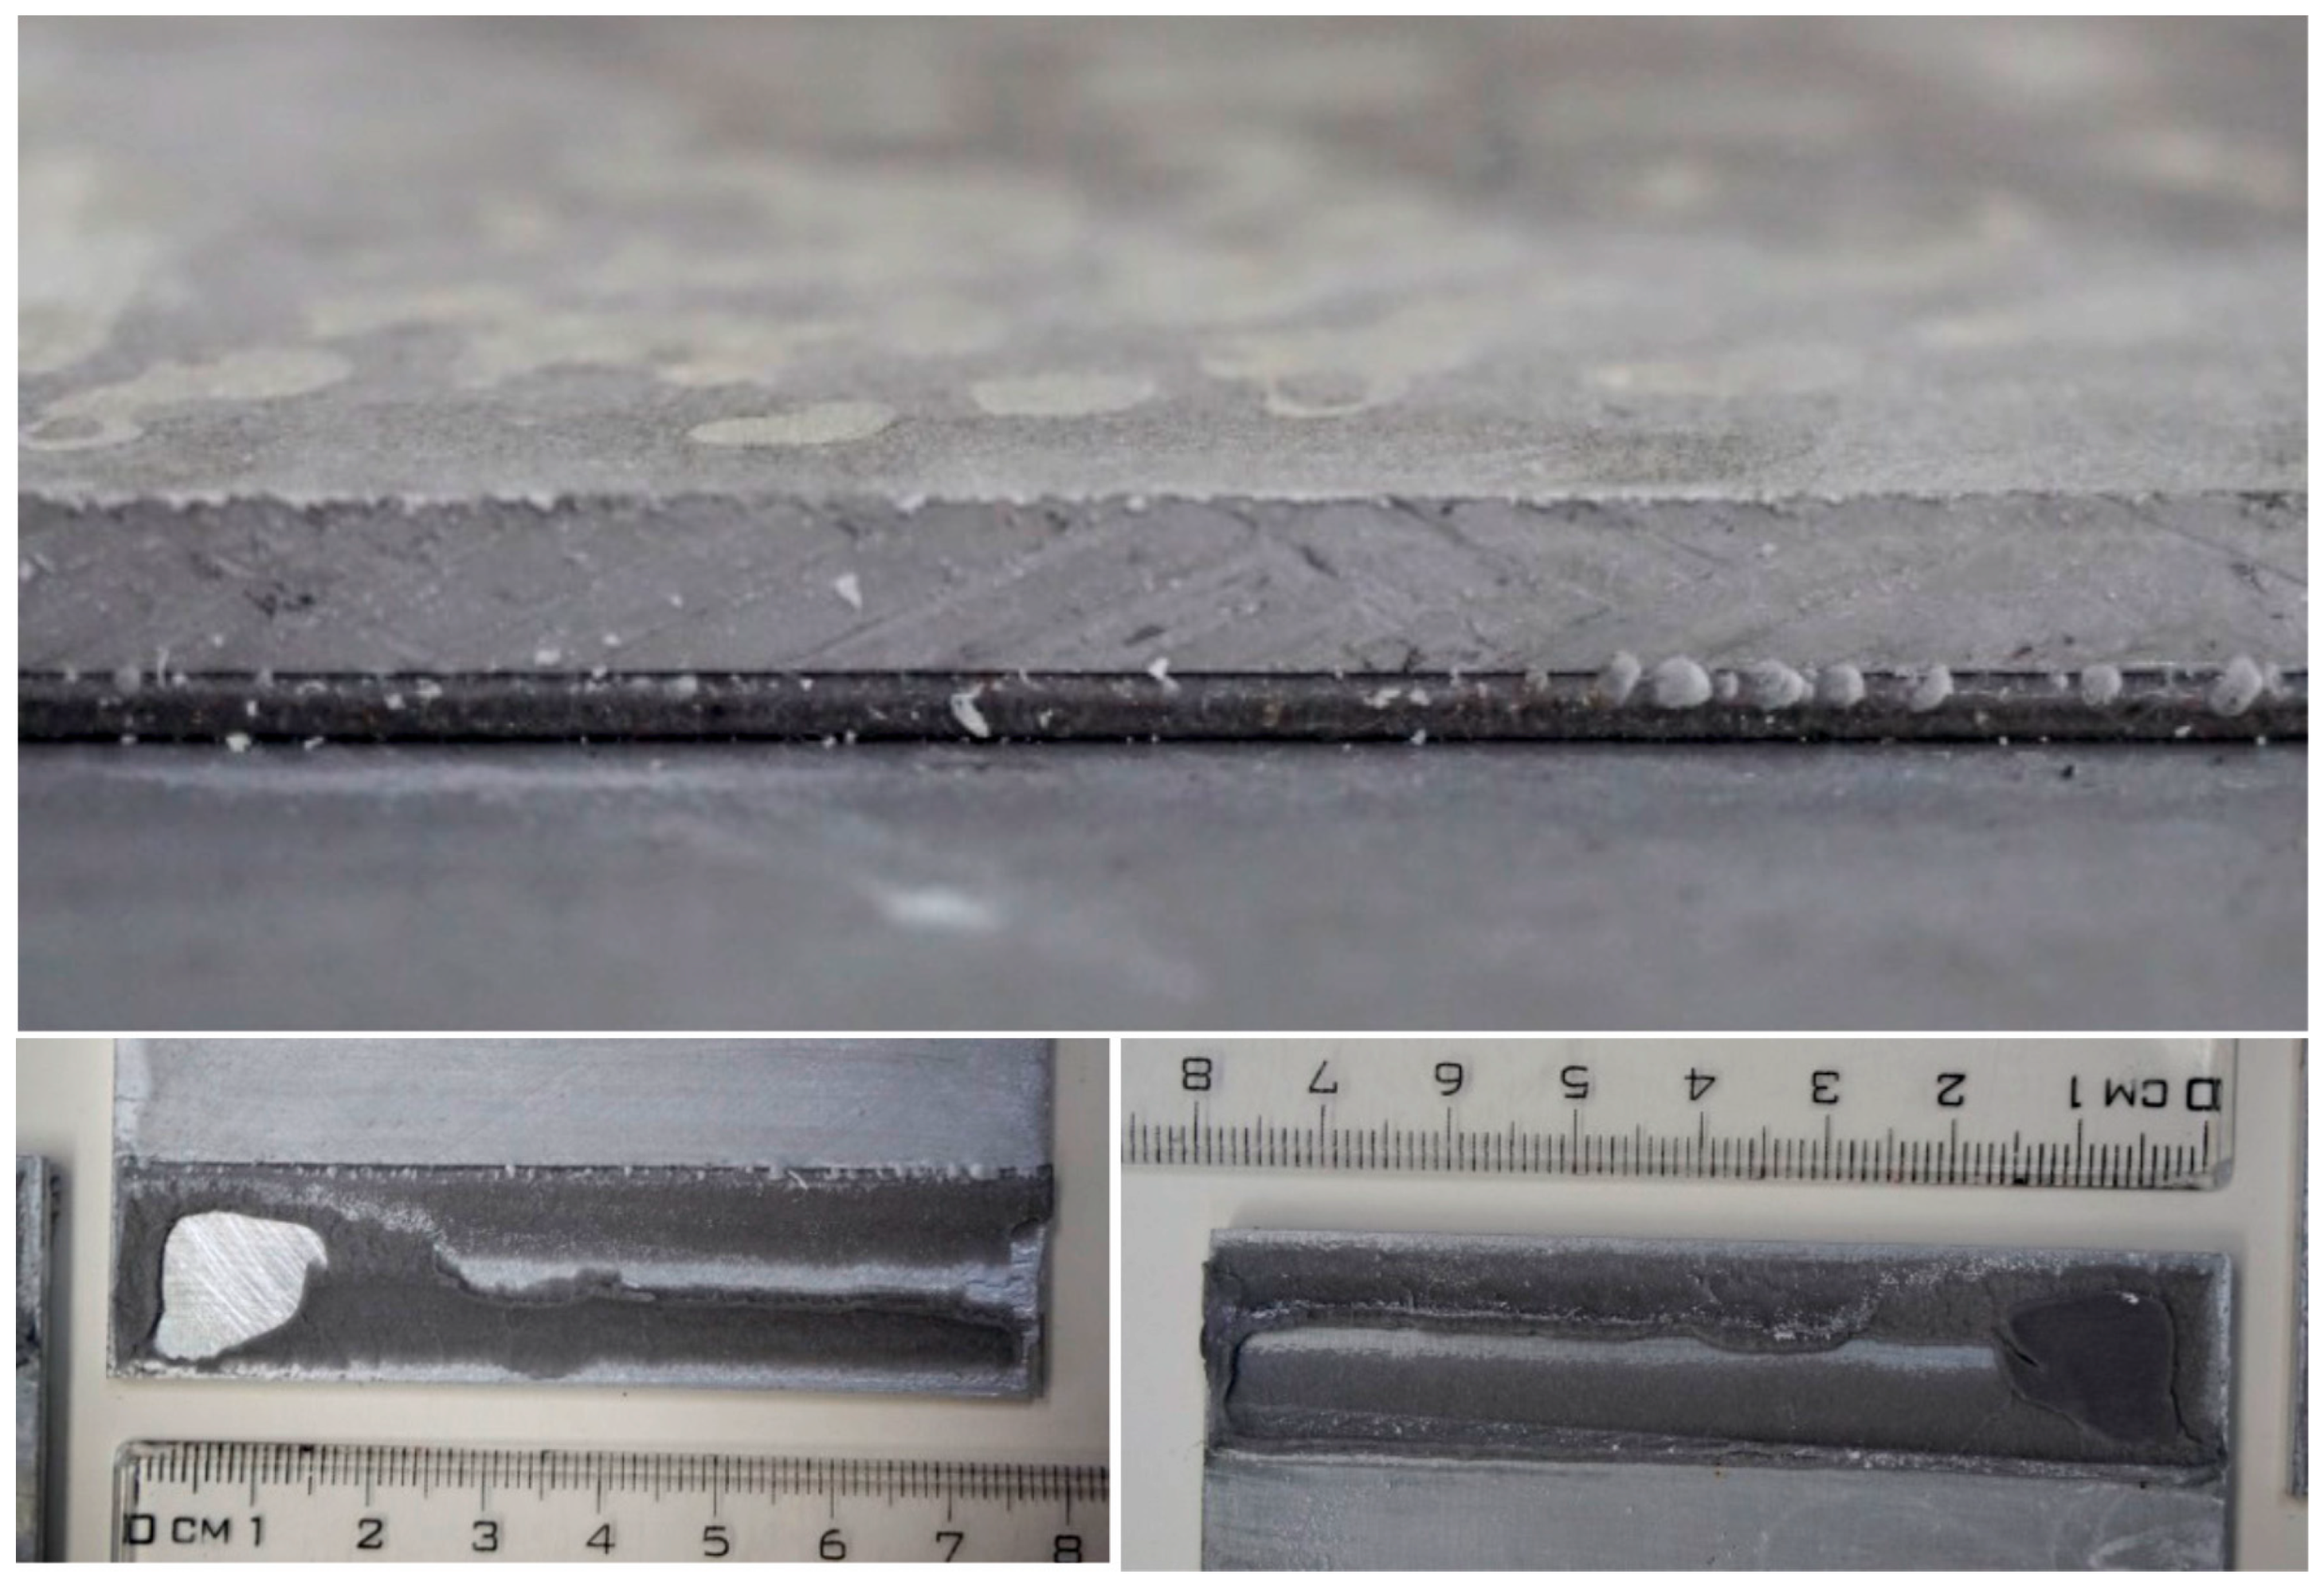
Immersion in water caused visible bubbles on the edges of the adhesive tape. Where bubbles were seen, the adhesive mode of failure was proved after the mechanical testing; see Figure 18 and Figure 19. The bubbles are probably related to the release of leachates or indicate the creation of corrosive products on the surface of the substrate. Most bubbles were observed in the galvanized steel specimens; however, the bubbles were also visible in the aluminum specimens, and there were almost no bubbles in the anodized aluminum. This observation is supported by the assumption that bubbles are related to the creation of corrosive products.
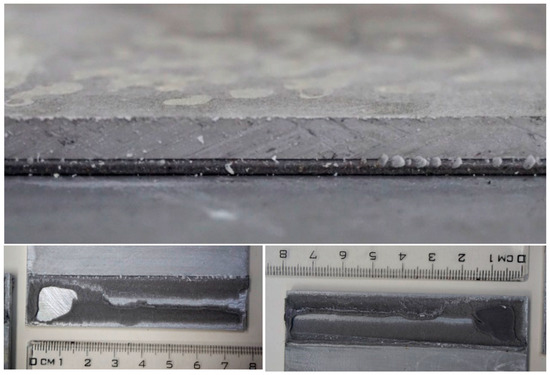
Figure 18.
The bubbles on the edge of the adhesive tape, aluminum specimen.
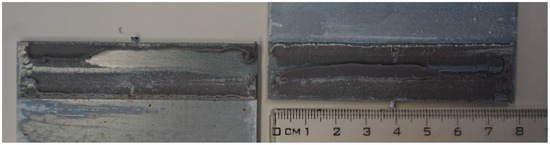
Figure 19.
The bubbles on the edge of the adhesive tape, galvanized steel specimen.
5. Conclusions
The water resistance of acrylic adhesive tape GPH-110GF was examined in order to quantify the reduction of joint strength in case of water action on the adhesive joint. These observations can be concluded as follows:
- The tensile specimens showed an average tensile strength of 0.13 MPa for the longitudinal arrangement and of 0.19 MPa for the perpendicular arrangement. A lower value than expected was achieved due to the combination of tensile load and peeling.
- The average shear strength of the reference joint was measured at 0.47 MPa for all tested substrates and 0.30 MPa for all tested substrates after immersion.
- The chemical analyses showed only minor changes in the chemical structure of the adhesive. The leachate contained ZnO, which is a filler.
- After the shear strength and shear modulus reduction analyses, it was shown that specimens with a smooth surface decreased shear strength by more than 39% due to a weak interphase between the adhesive tape and the substrate.
- The mode of failure analysis confirmed that a smooth substrate surface leads to a more probable adhesive mode of failure, even in the reference batch of specimens.
- For the reference specimens, a cohesive failure close to the substrate surface was observed, indicating limits in the integrity of the adhesive tape.
- After immersion, roughening of the surface improved the adhesion of the tape to the substrate in contrary to the specimens with smooth substrate. However, the anodized aluminum specimens exhibited the best resistance to immersion as they had the lowest increase in an adhesive mode of failure.
- The GPH-110GF tape itself showed resistance to water immersion for 21 days; however, its adhesion to the substrates was highly reduced.
Based on the research results, it can be recommended to use the GPH-110GF tape in anodized aluminum joints, in real-life conditions, where joints are exposed to moisture or water action. Moreover, the strength reduction of particular adhesive joints exposed to humid environment should always be experimentally verified before applying them at a building site.
Author Contributions
Conceptualization, K.V.M. and M.V.; formal analysis, K.V.M., P.P., P.S. and V.O.; methodology, K.V.M., M.V. and P.S.; investigation, K.V.M., P.S. and P.P.; writing—original draft preparation, K.V.M. and P.S.; writing—review and editing, V.O., P.S., P.P. and M.V. All authors have read and agreed to the published version of the manuscript.
Funding
This research was funded by the Czech Science Foundation, grant number GA22-14105S.
Data Availability Statement
Data are contained within this article.
Acknowledgments
This work was supported by the Ministry of Science, Technological Development and Innovation of the Republic of Serbia (Contract No. 451-03-66/2024-03/200287).
Conflicts of Interest
The authors declare no conflicts of interest.
References
- Hart, K.M. Held Together with Tape. Mech. Eng.-CIME 1999, 121, 30. Available online: https://link.gale.com/apps/doc/A57951031/AONE?u=anon~e154bfd9&sid=googleScholar&xid=447c0254 (accessed on 4 April 2024).
- 3M VHB Tape Durability Technical Bulletin. 2018. Available online: https://multimedia.3m.com/mws/media/98989O/3m-vhb-tape-durability-technical-bulletin.pdf (accessed on 15 March 2024).
- Nečasová, B.; Liška, P.; Šlanhof, J. Analysis of Temperature Effect on Deformation Behaviour and Bond Strength of Adhesive Joints with Steel and Composite Substrates. In Industrial Applications of Adhesives; da Silva, L.F.M., Adams, R.D., Sato, C., Dilger, K., Eds.; Springer: Singapore, 2021; pp. 107–125. [Google Scholar] [CrossRef]
- Katsivalis, I.; Feih, S. Prediction of moisture diffusion and failure in glass/steel adhesive joints. Glass Struct. Eng. 2022, 7, 381–397. [Google Scholar] [CrossRef]
- Van Lancker, B.; Dispersyn, J.; De Corte, W.; Belis, J. Durability of adhesive glass-metal connections for structural applications. Eng. Struct. 2016, 126, 237–251. [Google Scholar] [CrossRef]
- Borges, C.S.P.; Sousa, J.D.P.; Marques, E.A.S.; Carbas, R.J.C.; Chaleix, D.; Gilbert, F.; Pirart, J.; Rachiele, L.; Laffineur, F.; da Silva, L.F.M. Study on the influence of water ingress on the interface of high strength zinc coated steels and epoxy adhesives. Int. J. Adhes. Adhes. 2024, 129, 103595. [Google Scholar] [CrossRef]
- Čolo, A.; Tasić, P.; Hajro, I. Investigation of Primer Influence on Strength of Aluminium Specimens Bonded by VHB Tape. In New Technologies, Development and Application II; Karabegović, I., Ed.; Springer: Cham, Switzerland, 2020; pp. 130–135. [Google Scholar] [CrossRef]
- Townsend, B.W.; Ohanehi, D.C.; Dillard, D.A.; Austin, S.R.; Salmon, F.; Gagnon, D.R. Characterizing acrylic foam pressure sensitive adhesive tapes for structural glazing applications—Part I: DMA and ramp-to-fail results. Int. J. Adhes. Adhes. 2011, 31, 639–649. [Google Scholar] [CrossRef]
- Townsend, B.W.; Ohanehi, D.C.; Dillard, D.A.; Austin, S.R.; Salmon, F.; Gagnon, D.R. Characterizing acrylic foam pressure sensitive adhesive tapes for structural glazing applications—Part II: Creep rupture results. Int. J. Adhes. Adhes. 2011, 31, 650–659. [Google Scholar] [CrossRef]
- Bull, E.; Cholaky, J.; Kuhlman, S.J.H.; Carbary, L.; Wolf, A.T. A Comparative Evaluation of the Behavior of Structural Silicone vs. Acrylic Foam Tape Subjected to High Strain Rates. In Durability of Building and Construction Sealants and Adhesives: 5th Volume; ASTM International: West Conshohocken, PA, USA, 2015; pp. 297–327. [Google Scholar] [CrossRef]
- Kremer, T. Useful Design Criteria for Acrylic Foam Tapes in Demanding Industrial Applications. 2005. Available online: https://multimedia.3m.com/mws/media/940975O/3m-vhb-tapes-design-criteria-pstc-tech-28-paper-2005.pdf?fn=PSTC+Tech+28+Paper+2005+-+3M+VHB (accessed on 15 March 2024).
- Qiao, Y.; Shin, Y.; Ramos, J.L.; Engelhard, M.H.; Seffens, R.J.; Merkel, D.R.; Simmons, K.L. Plasma treatment on both adhesive tape and adherends for significantly enhanced CFRTP-related adhesive joints. Appl. Surf. Sci. 2024, 649, 159092. [Google Scholar] [CrossRef]
- Avci-Karatas, C. Design and Analysis of Steel Support Structures Used in Photovoltaic (PV) Solar Panels (SPs): A Case Study in Turkey. 2020. Available online: https://www.researchgate.net/publication/344517600_Design_and_Analysis_of_Steel_Support_Structures_Used_in_Photovoltaic_PV_Solar_Panels_SPs_A_Case_Study_in_Turkey (accessed on 15 March 2024).
- Joshi, D.; Webb, J.E. Mechanical Reliability Calculations for the Thin Specialty Glass PV Solar Panels. Int. J. Struct. Glass Adv. Mater. Res. 2019, 3, 87–97. [Google Scholar] [CrossRef]
- Schulze, S.-H.; Pander, M.; Naumenko, K.; Altenbach, H. Analysis of laminated glass beams for photovoltaic applications. Int. J. Solids Struct. 2012, 49, 2027–2036. [Google Scholar] [CrossRef]
- ETAG 002; Structural Sealant Glazing Systems Part 1: Supported and Unsupported Systems. European Organization for Technical Approvals: Brussels, Belgium, 2012. Available online: http://www.sgpstandard.cz/editor/files/stav_vyr/dok_es/eta/etag/002_1_en.pdf (accessed on 15 March 2024).
- ISO 10365:2022; Adhesives Designation of Main Failure Patterns. The International Organization for Standardization: Geneva, Switzerland, 2022.
- Machalická, K.V.; Vokáč, M.; Pokorný, P.; Pavlíková, M. Effect of various artificial ageing procedures on adhesive joints for civil engineering applications. Int. J. Adhes. Adhes. 2020, 97, 102476. [Google Scholar] [CrossRef]
- Packham, D.E. Theories of Fundamental Adhesion. In Handbook of Adhesion Technology; da Silva, L.F.M., Öchsner, A., Adams, R.D., Eds.; Springer: Berlin/Heidelberg, Germany, 2011; pp. 9–38. [Google Scholar] [CrossRef]


Disclaimer/Publisher’s Note: The statements, opinions and data contained in all publications are solely those of the individual author(s) and contributor(s) and not of MDPI and/or the editor(s). MDPI and/or the editor(s) disclaim responsibility for any injury to people or property resulting from any ideas, methods, instructions or products referred to in the content. |
© 2024 by the authors. Licensee MDPI, Basel, Switzerland. This article is an open access article distributed under the terms and conditions of the Creative Commons Attribution (CC BY) license (https://creativecommons.org/licenses/by/4.0/).