
Mechanical Properties and Chloride Salt Corrosion Resistance of All-Lightweight Shale Ceramsite Concrete


Abstract
:1. Introduction
2. Materials and Methods
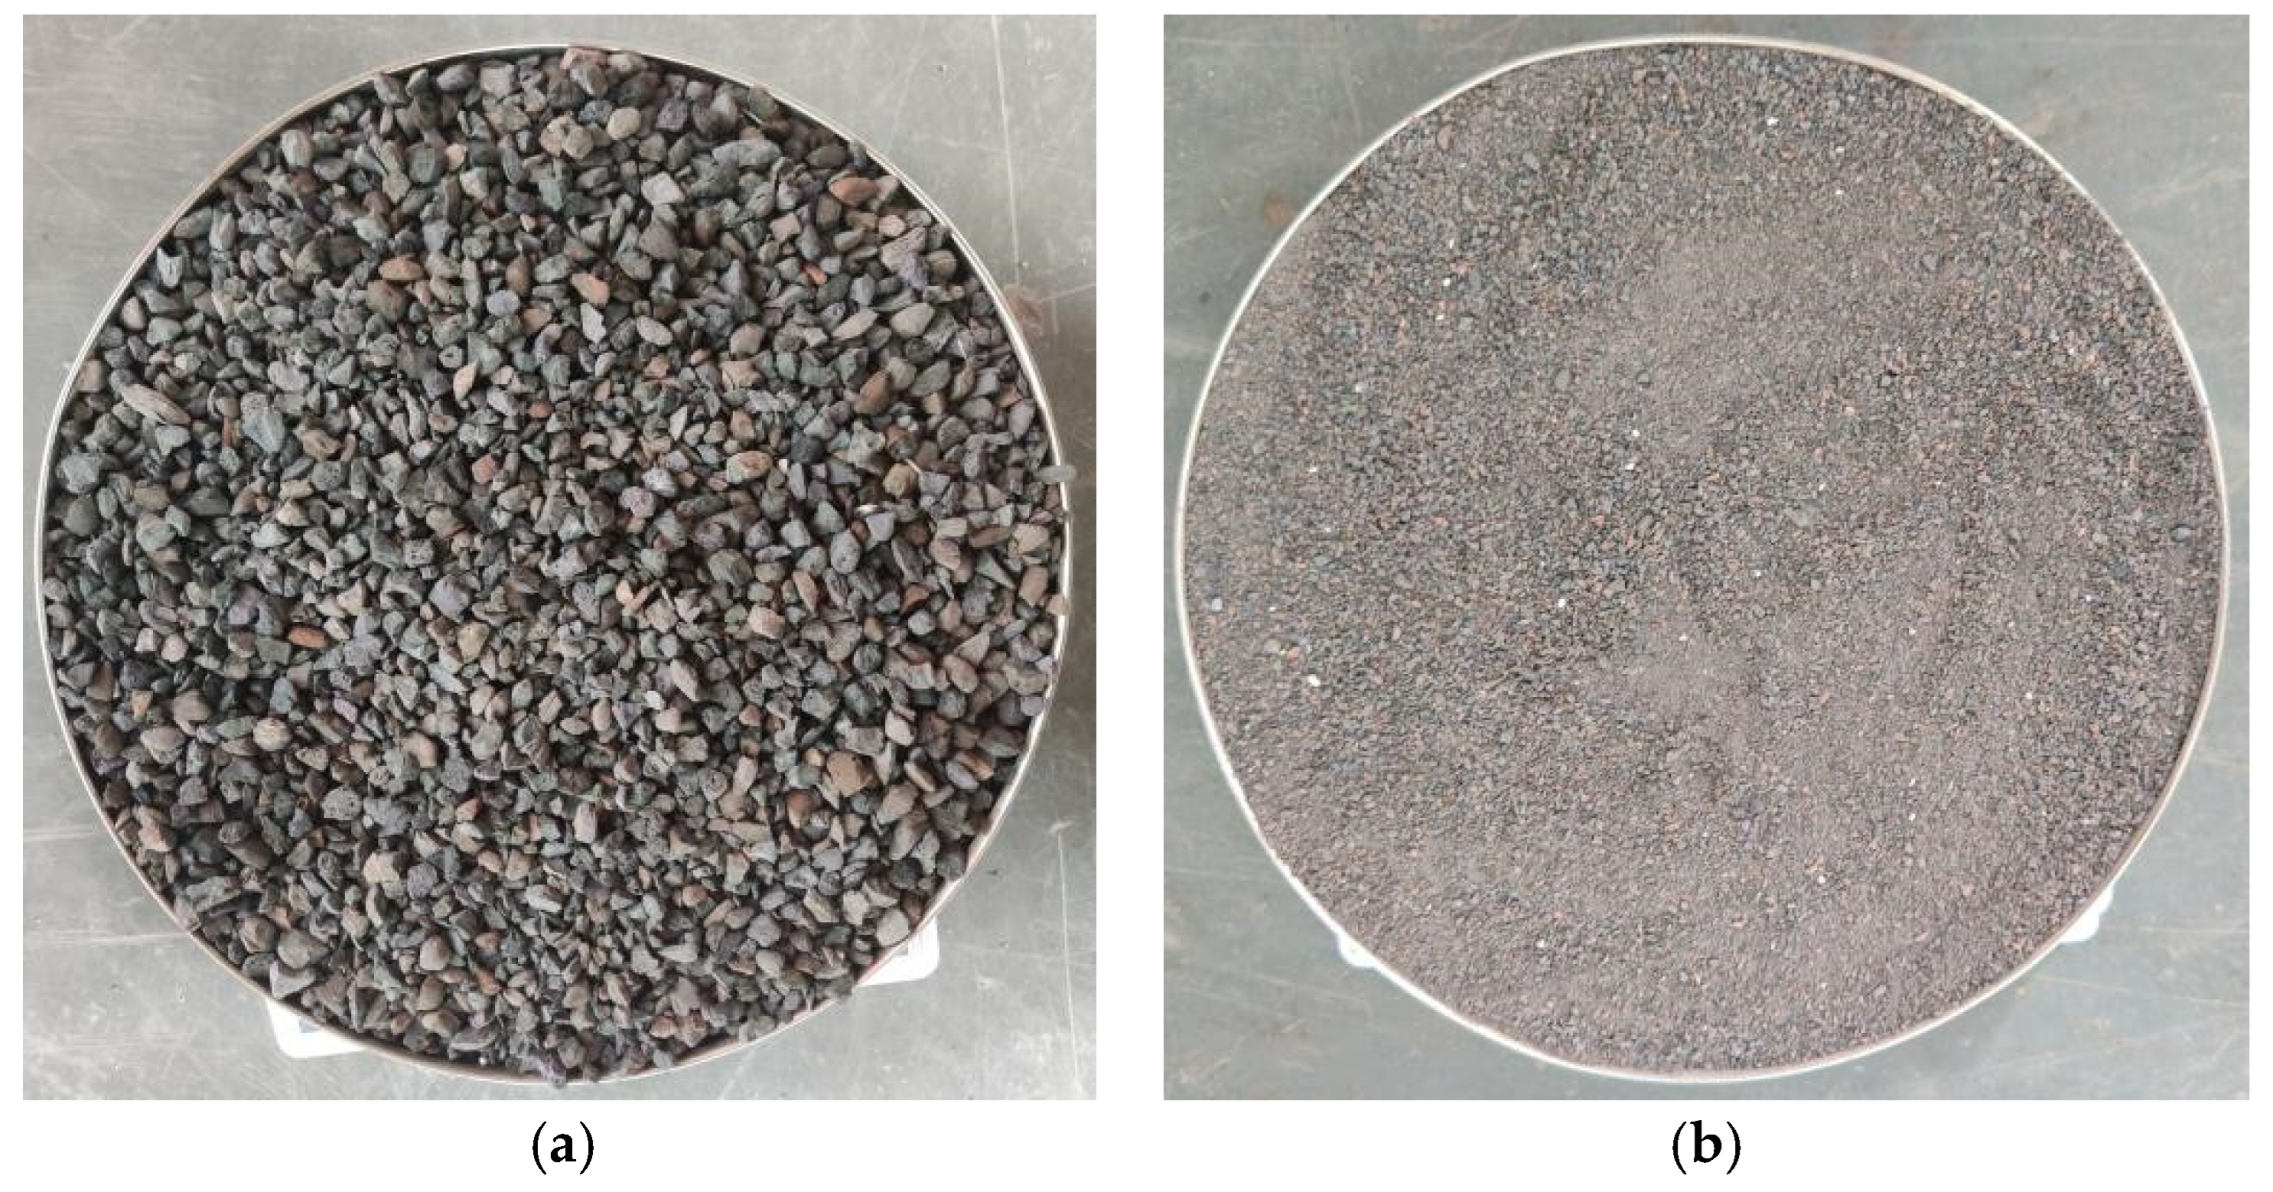
2.1. Raw Materials and Mix Proportions
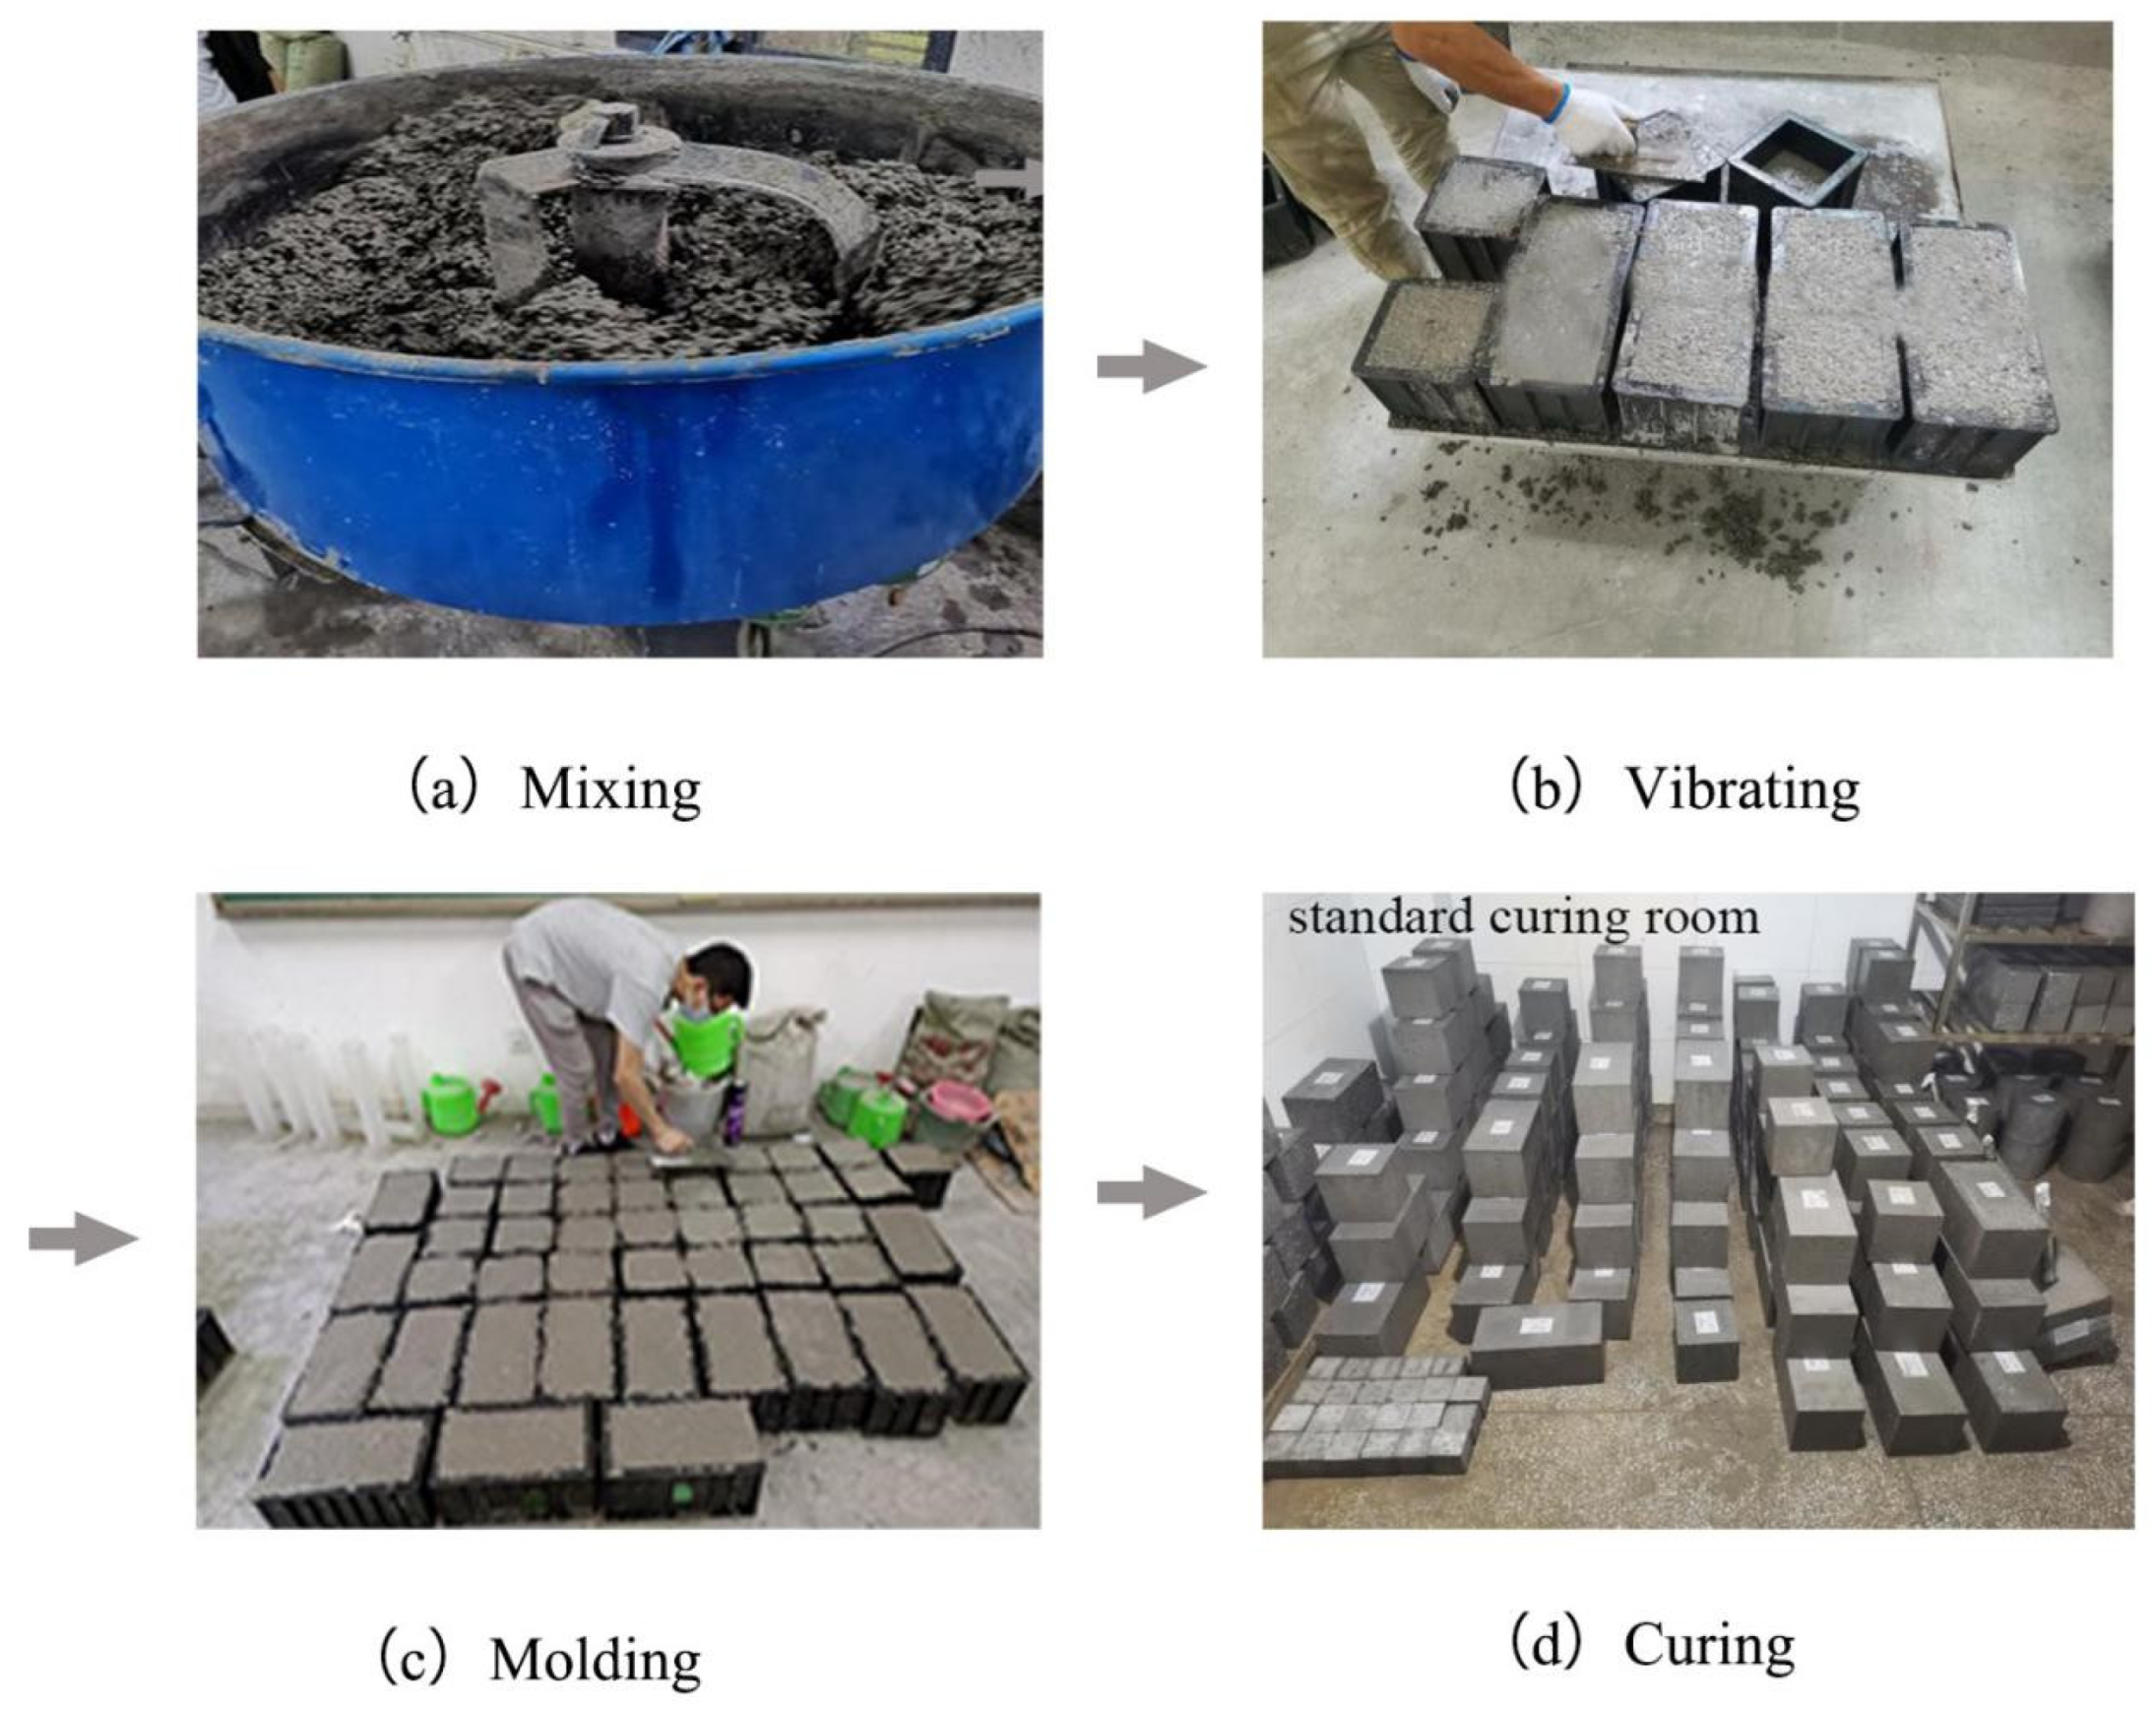
2.2. Sample Preparation
2.3. Mechanical Properties
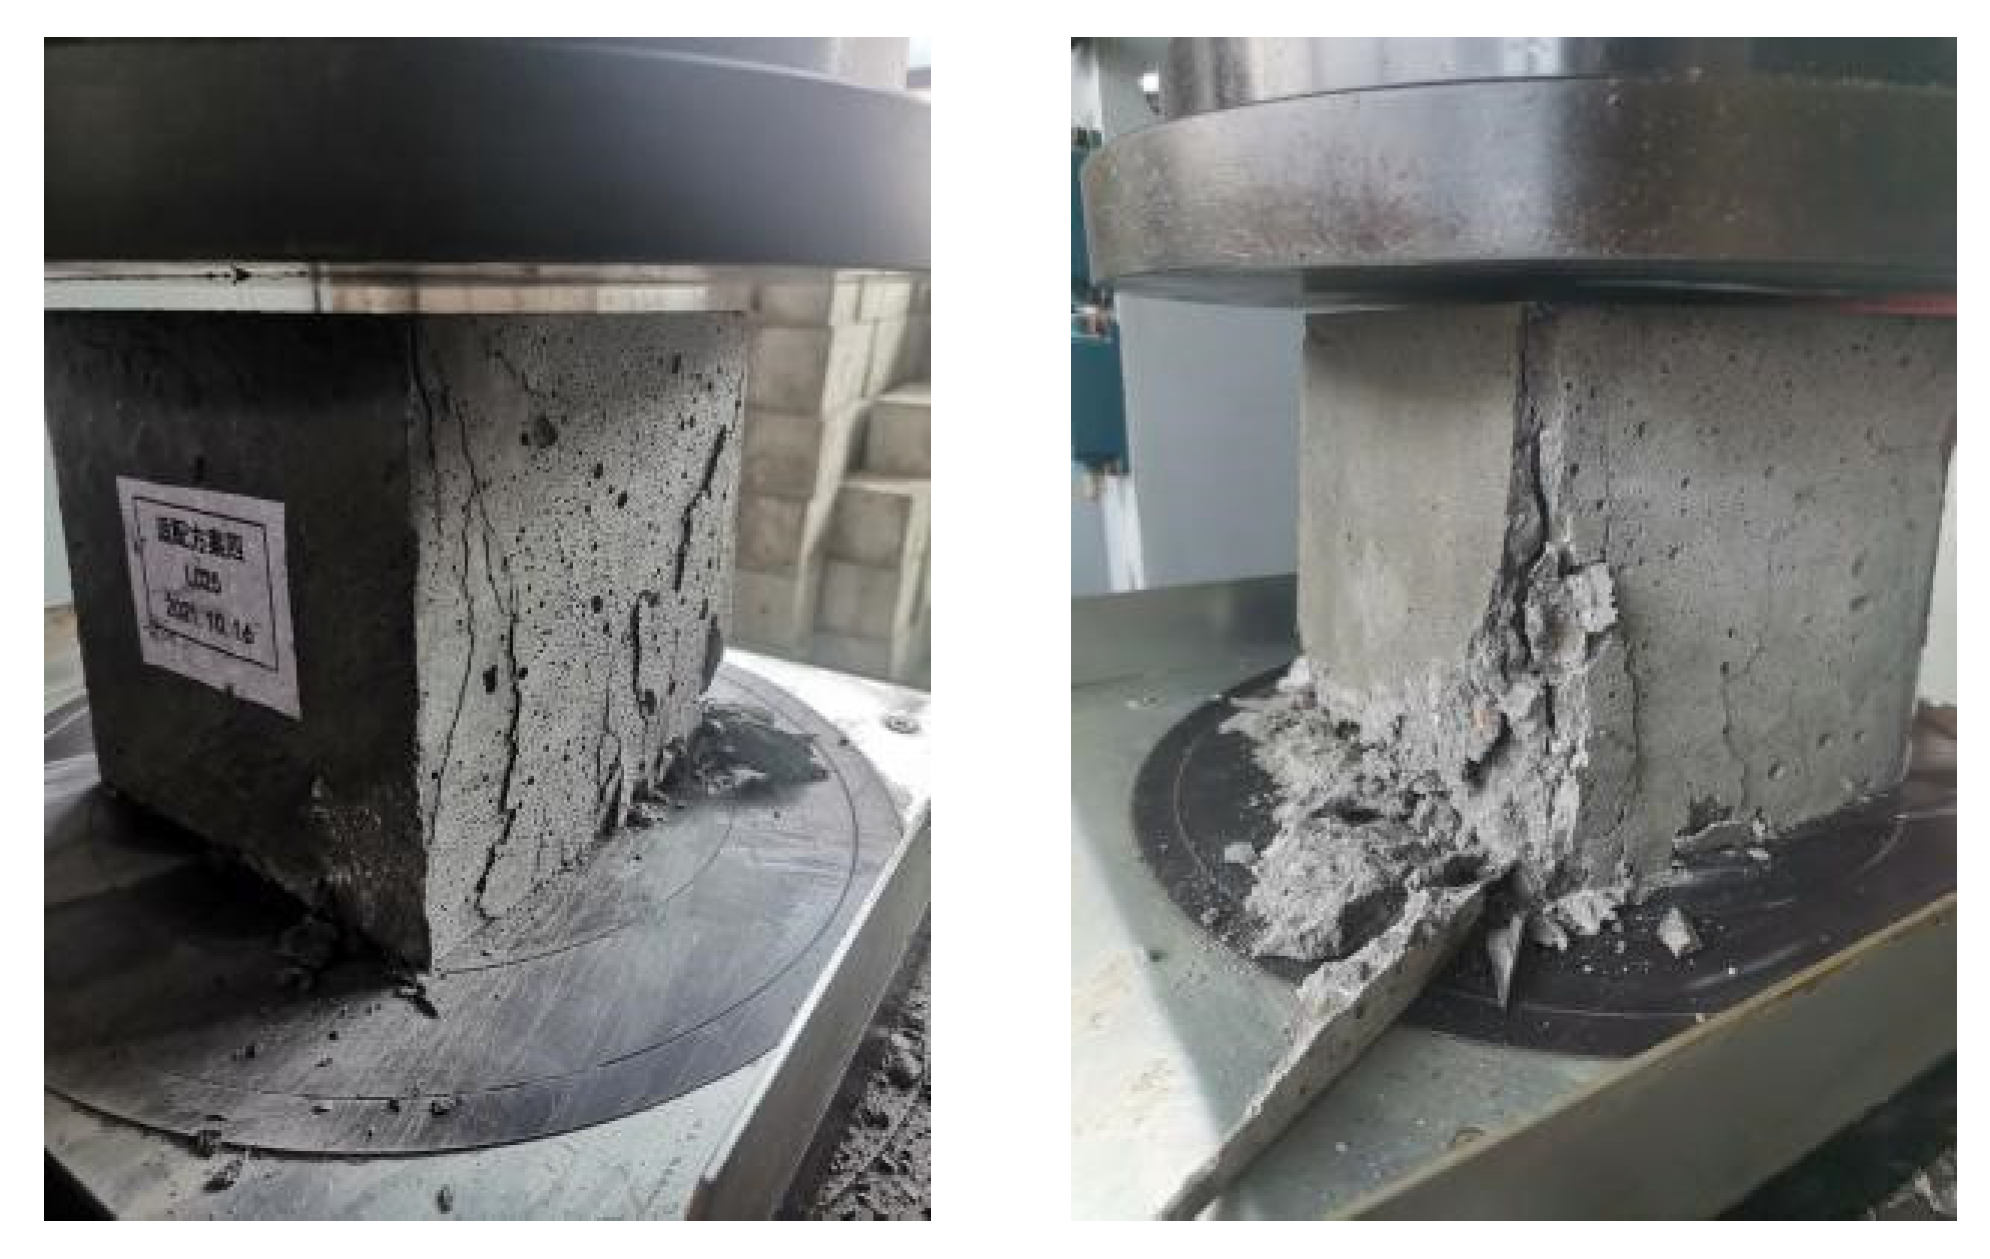
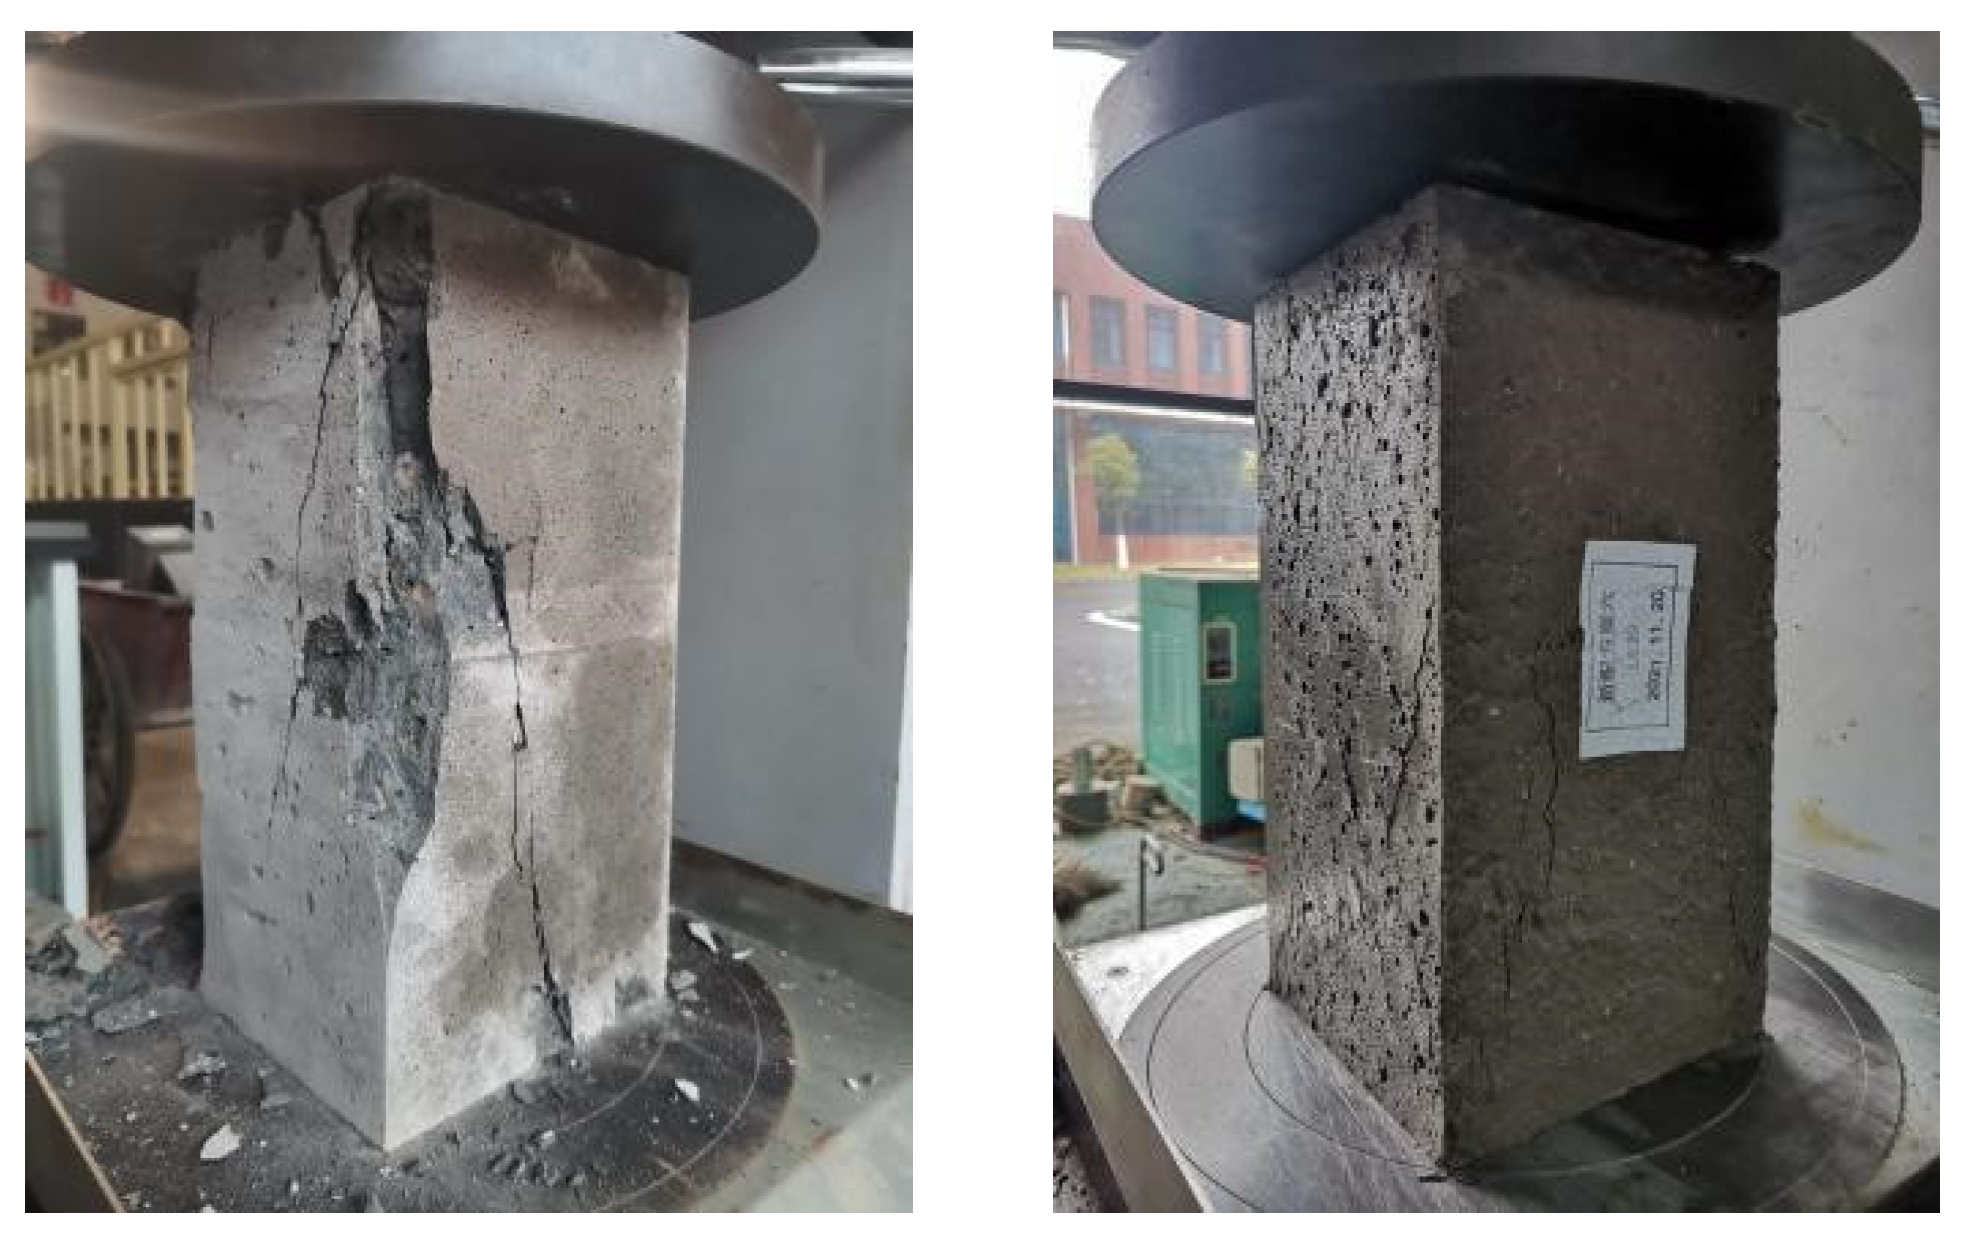
2.3.1. Compressive Strength
- (1)
- After reaching the test age, the sample was transferred from the standard curing room to the test chamber. The surface of the sample was dried and placed at the center of the press.
- (2)
- A specific loading speed was maintained during the test (6.75 kN/s for ALSCC20 and ALSCC30; 11.75 kN/s for ALSCC40 and ALSCC45). The load value was recorded at the point of sample failure. The cube compressive strength test setup is shown in Figure 5, and the axial compressive test setup is shown in Figure 6.
- (3)
- Compressive strength was calculated using Equation (1).where p is the compressive strength (in MPa) of ALSCC; F is the ultimate load (in N) from the test; A is the pressure-bearing area (in mm2) of ALSCC.
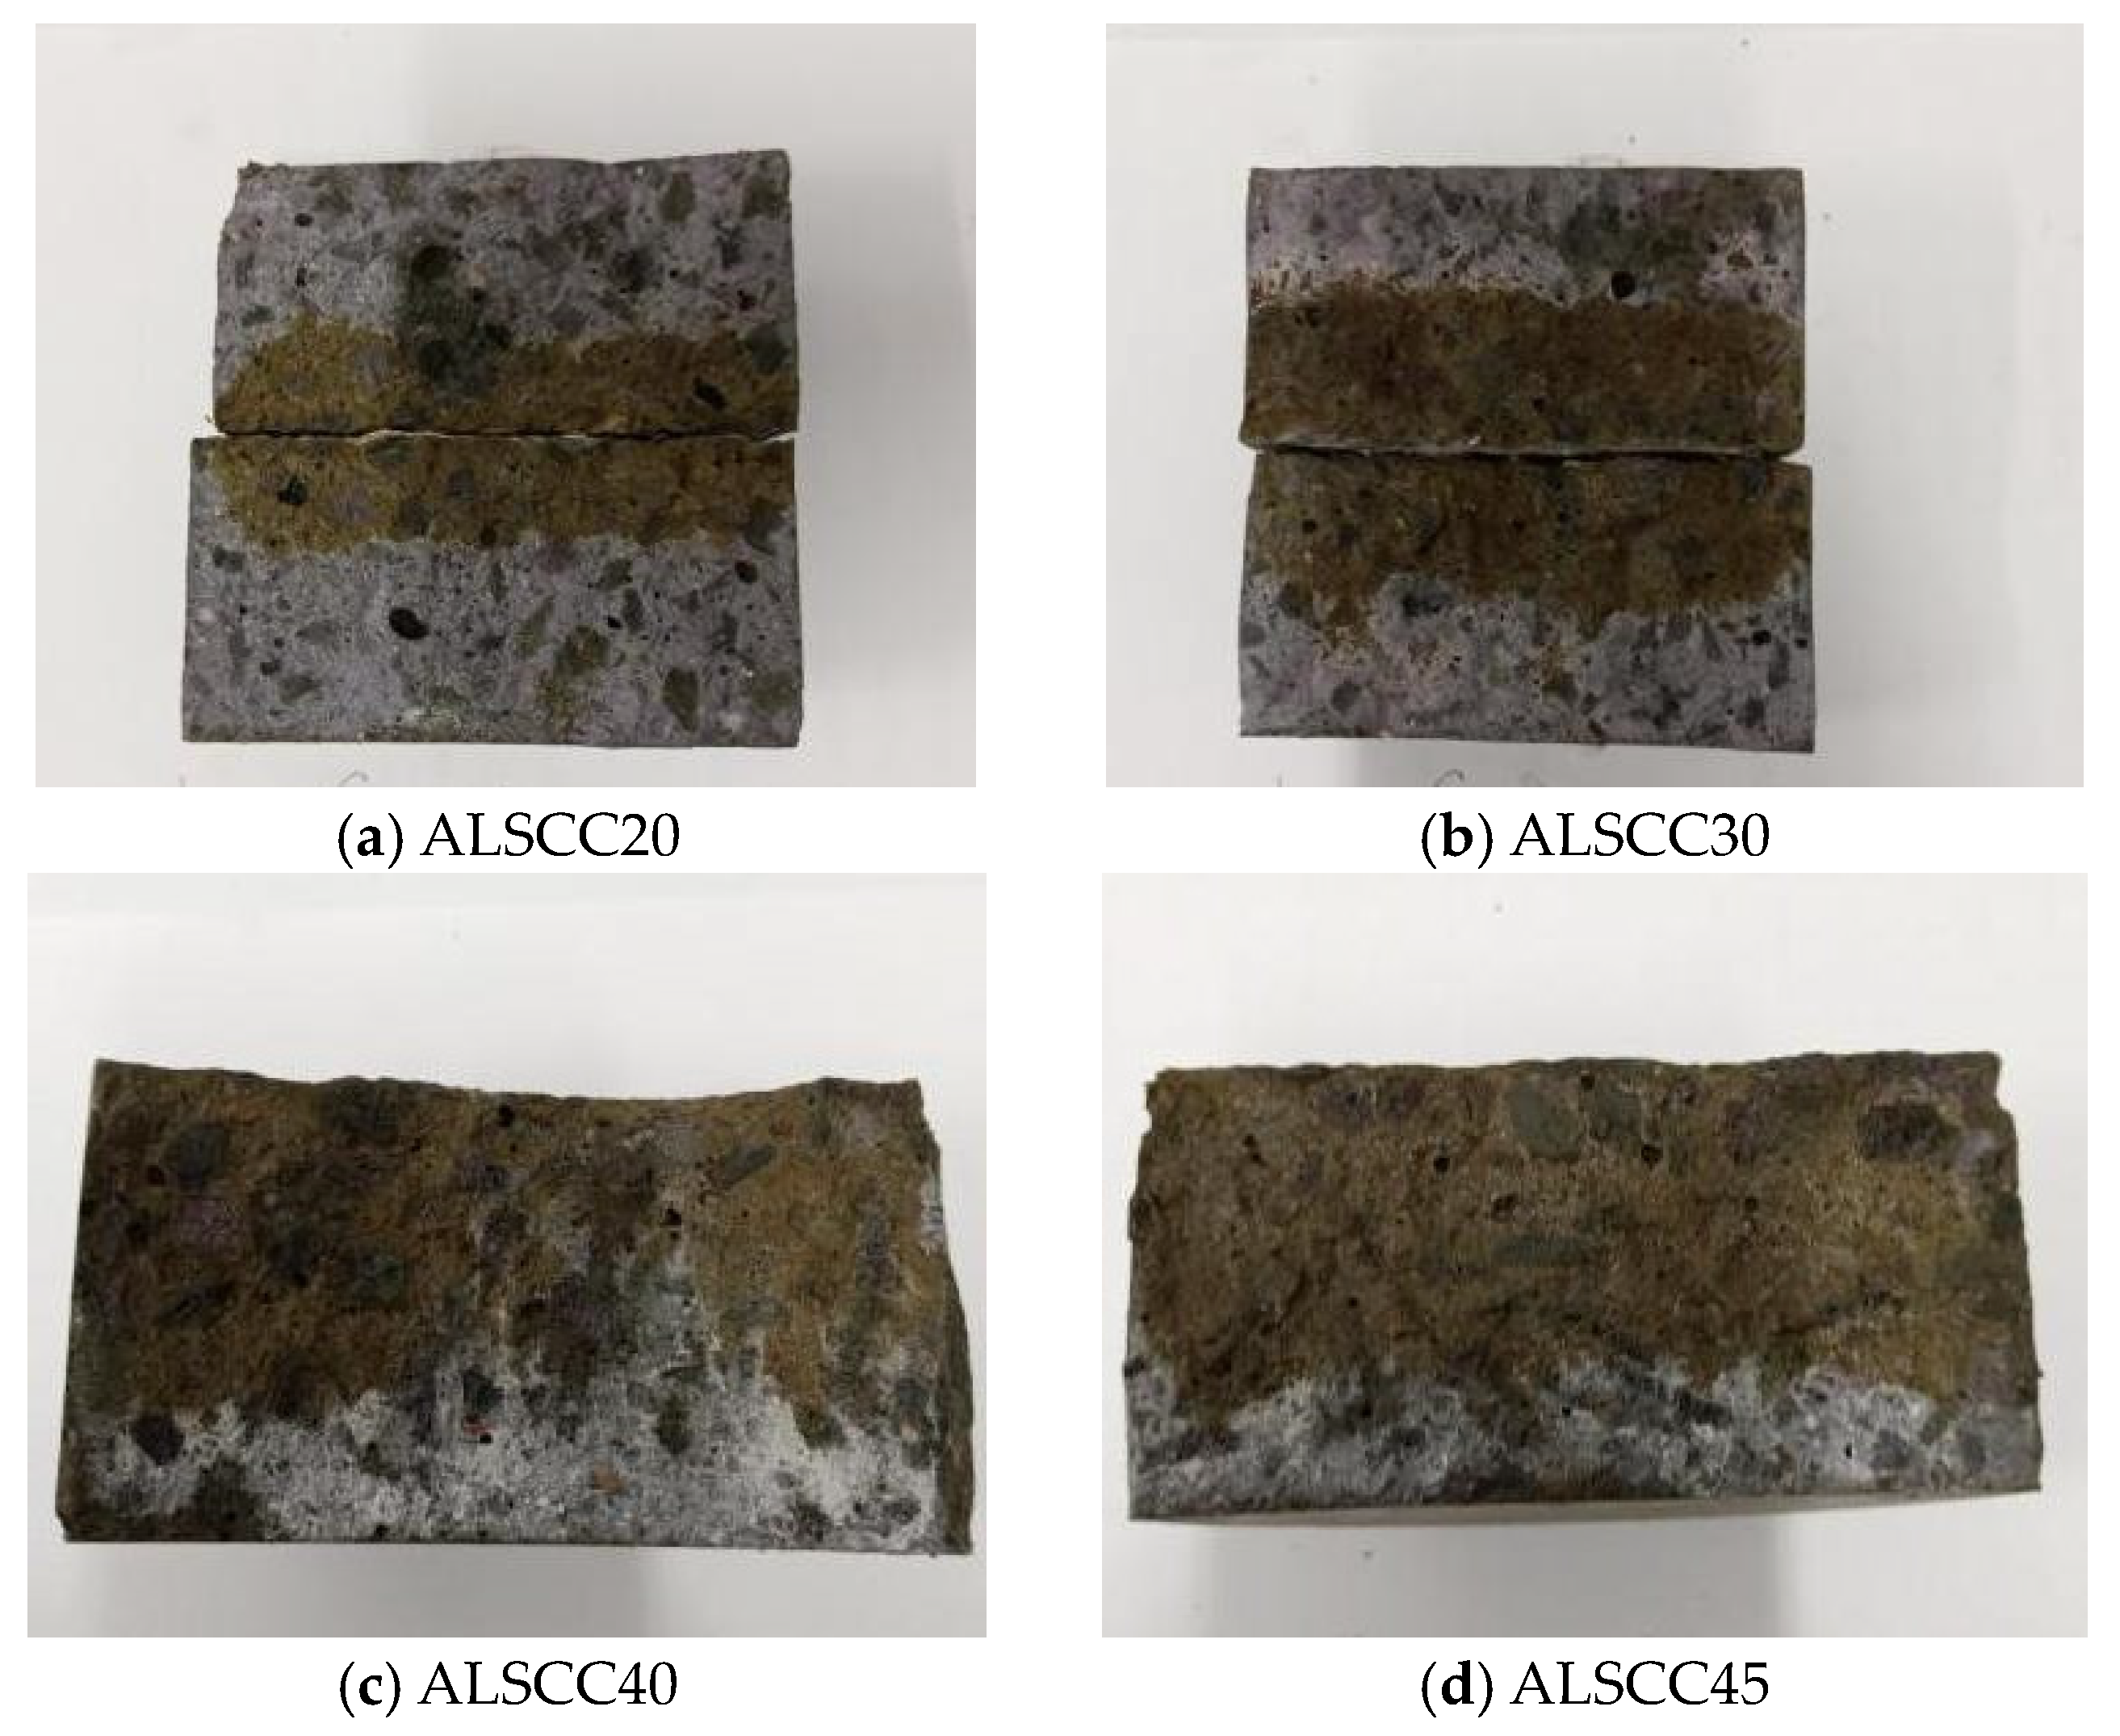
2.3.2. Split Tensile Strength
- (1)
- After reaching the test age, the samples were removed from the curing chamber. The centerline was then drawn, and the position of the mat strips was determined. The mat strips were positioned in the center of the positioning frame, and the sample was fixed. Finally, the mat strips were placed on top, and the steel plate was pressed (Figure 7).
- (2)
- The positioning frame was placed in the center of the lower pressure plate of the testing machine. The testing machine was then started, allowing the upper pressure plate to slowly descend and ensure uniform contact with the steel mat plate. Consequently, the split pressure surface was perpendicular to the top surface of the sample.
- (3)
- The fueling valve was loaded uniformly during the test, with a loading rate of 0.02 MPa/s for ALSCC20 and ALSCC30 samples and 0.08 MPa/s for ALSCC40 and ALSCC45 samples.
- (4)
- Split tensile strength was calculated using Equation (2).where fts is the split tensile strength (in MPa) of ALSCC; F is the damage load (in N) from the test; A is the split surface area (in mm2) of ALSCC.
2.3.3. Modulus of Elasticity
- (1)
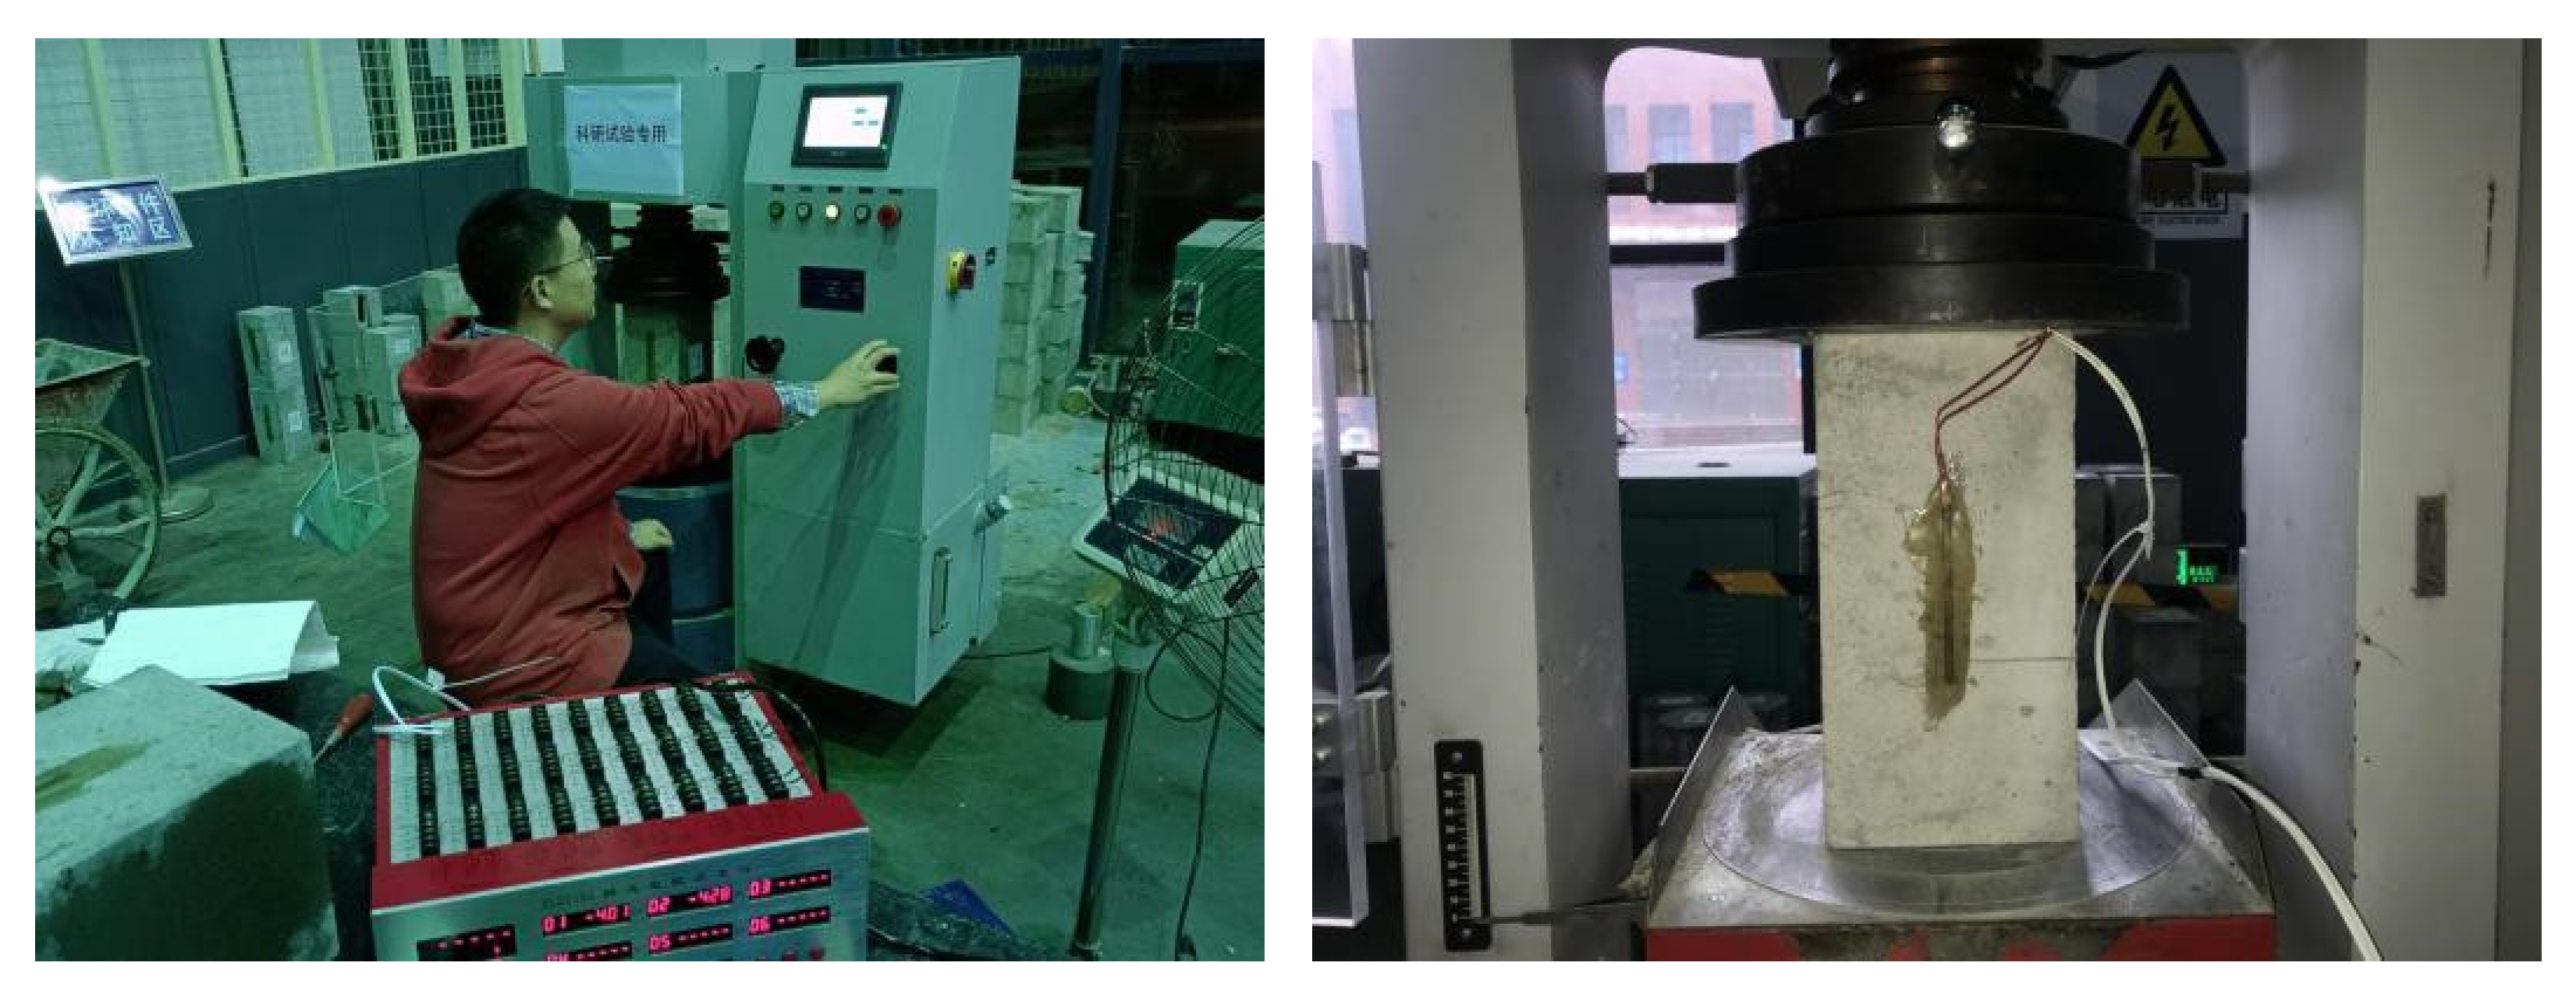
- When the sample reached the corresponding test age, it was removed from the standard curing room, and a center line was drawn on both sides of the sample using a pencil. Then, strain gauges were attached along the center line of the sample.
- (2)
- The sample was placed in the center of the press, and the strain gauges were connected. The upper bearing plate was then slowly lowered until it came into contact with the top surface of the sample.
- (3)
- The sample was pre-compressed three times to a load of 0.5 MPa (noted as F0) and held steady for 60 s. The deformation readings at the measuring points on both sides of the sample were recorded every 30 s. Then, the load was uniformly increased to one-third of the axial compressive strength fcp (noted as Fa) and held steady for 60 s, with deformation readings recorded every 30 s. The test procedure ensured that the load was increased continuously and uniformly, with a loading rate of 0.3 MPa/s for ALSCC20 and ALSCC30 samples, and 0.5 MPa/s for ALSCC40 and ALSCC45 samples. The elastic modulus test procedure is shown in Figure 8.
- (4)
- Elastic modulus was calculated using Equations (3) and (4).where is the average value (in mm) of deformation on both sides of the sample when loaded from F0 to Fa in the formal test; is the average value (in mm) of deformation on both sides of the sample when loaded to Fa; is the average value (in mm) of deformation on both sides of the sample when loaded to F0; Ec is the elastic modulus (in MPa) of concrete under hydrostatic stress; Fa is the load value (in N) for one-third axial compressive strength fcp; F0 is the initial load (in N) at a stress of 0.5 MPa; A is the pressure-bearing area (in mm2) of sample; L is the measuring distance (in mm).
2.4. Chlorine Salt Corrosion Resistance Test Methods
2.4.1. Chloride Permeation Resistance
- (1)
- According to the RCM method (Figure 9) of the Chinese standard “Standard for Test Methods of Long-term Performance and Durability of Ordinary Concrete” (GBT 50082-2009) [22], a test voltage of 30 V was used after the samples were saturated with water. In addition, the anode was injected with a 0.3 mol/L NaOH solution, and the cathode was injected with a 10% NaCl solution by mass concentration.
- (2)
- After the sample was split along the central axis, a 0.1 mol/L AgNO3 solution was dropped onto its surface. When the fracture surface of the sample showed a color change, it was divided into 10 equal portions along the diameter. The depth of effective chloride ion penetration was then measured and substituted into Equation (5) to calculate the chloride ion migration coefficient.where DRCM is the unsteady-state migration coefficient (in m2/s); T is the average of the initial and ending temperatures of the anode solution (in K); L is the thickness of the sample (in m); Xd is the average value of chloride ion penetration depth (in m); U is the absolute value of the voltage used (in V); t is the testing time (in s).
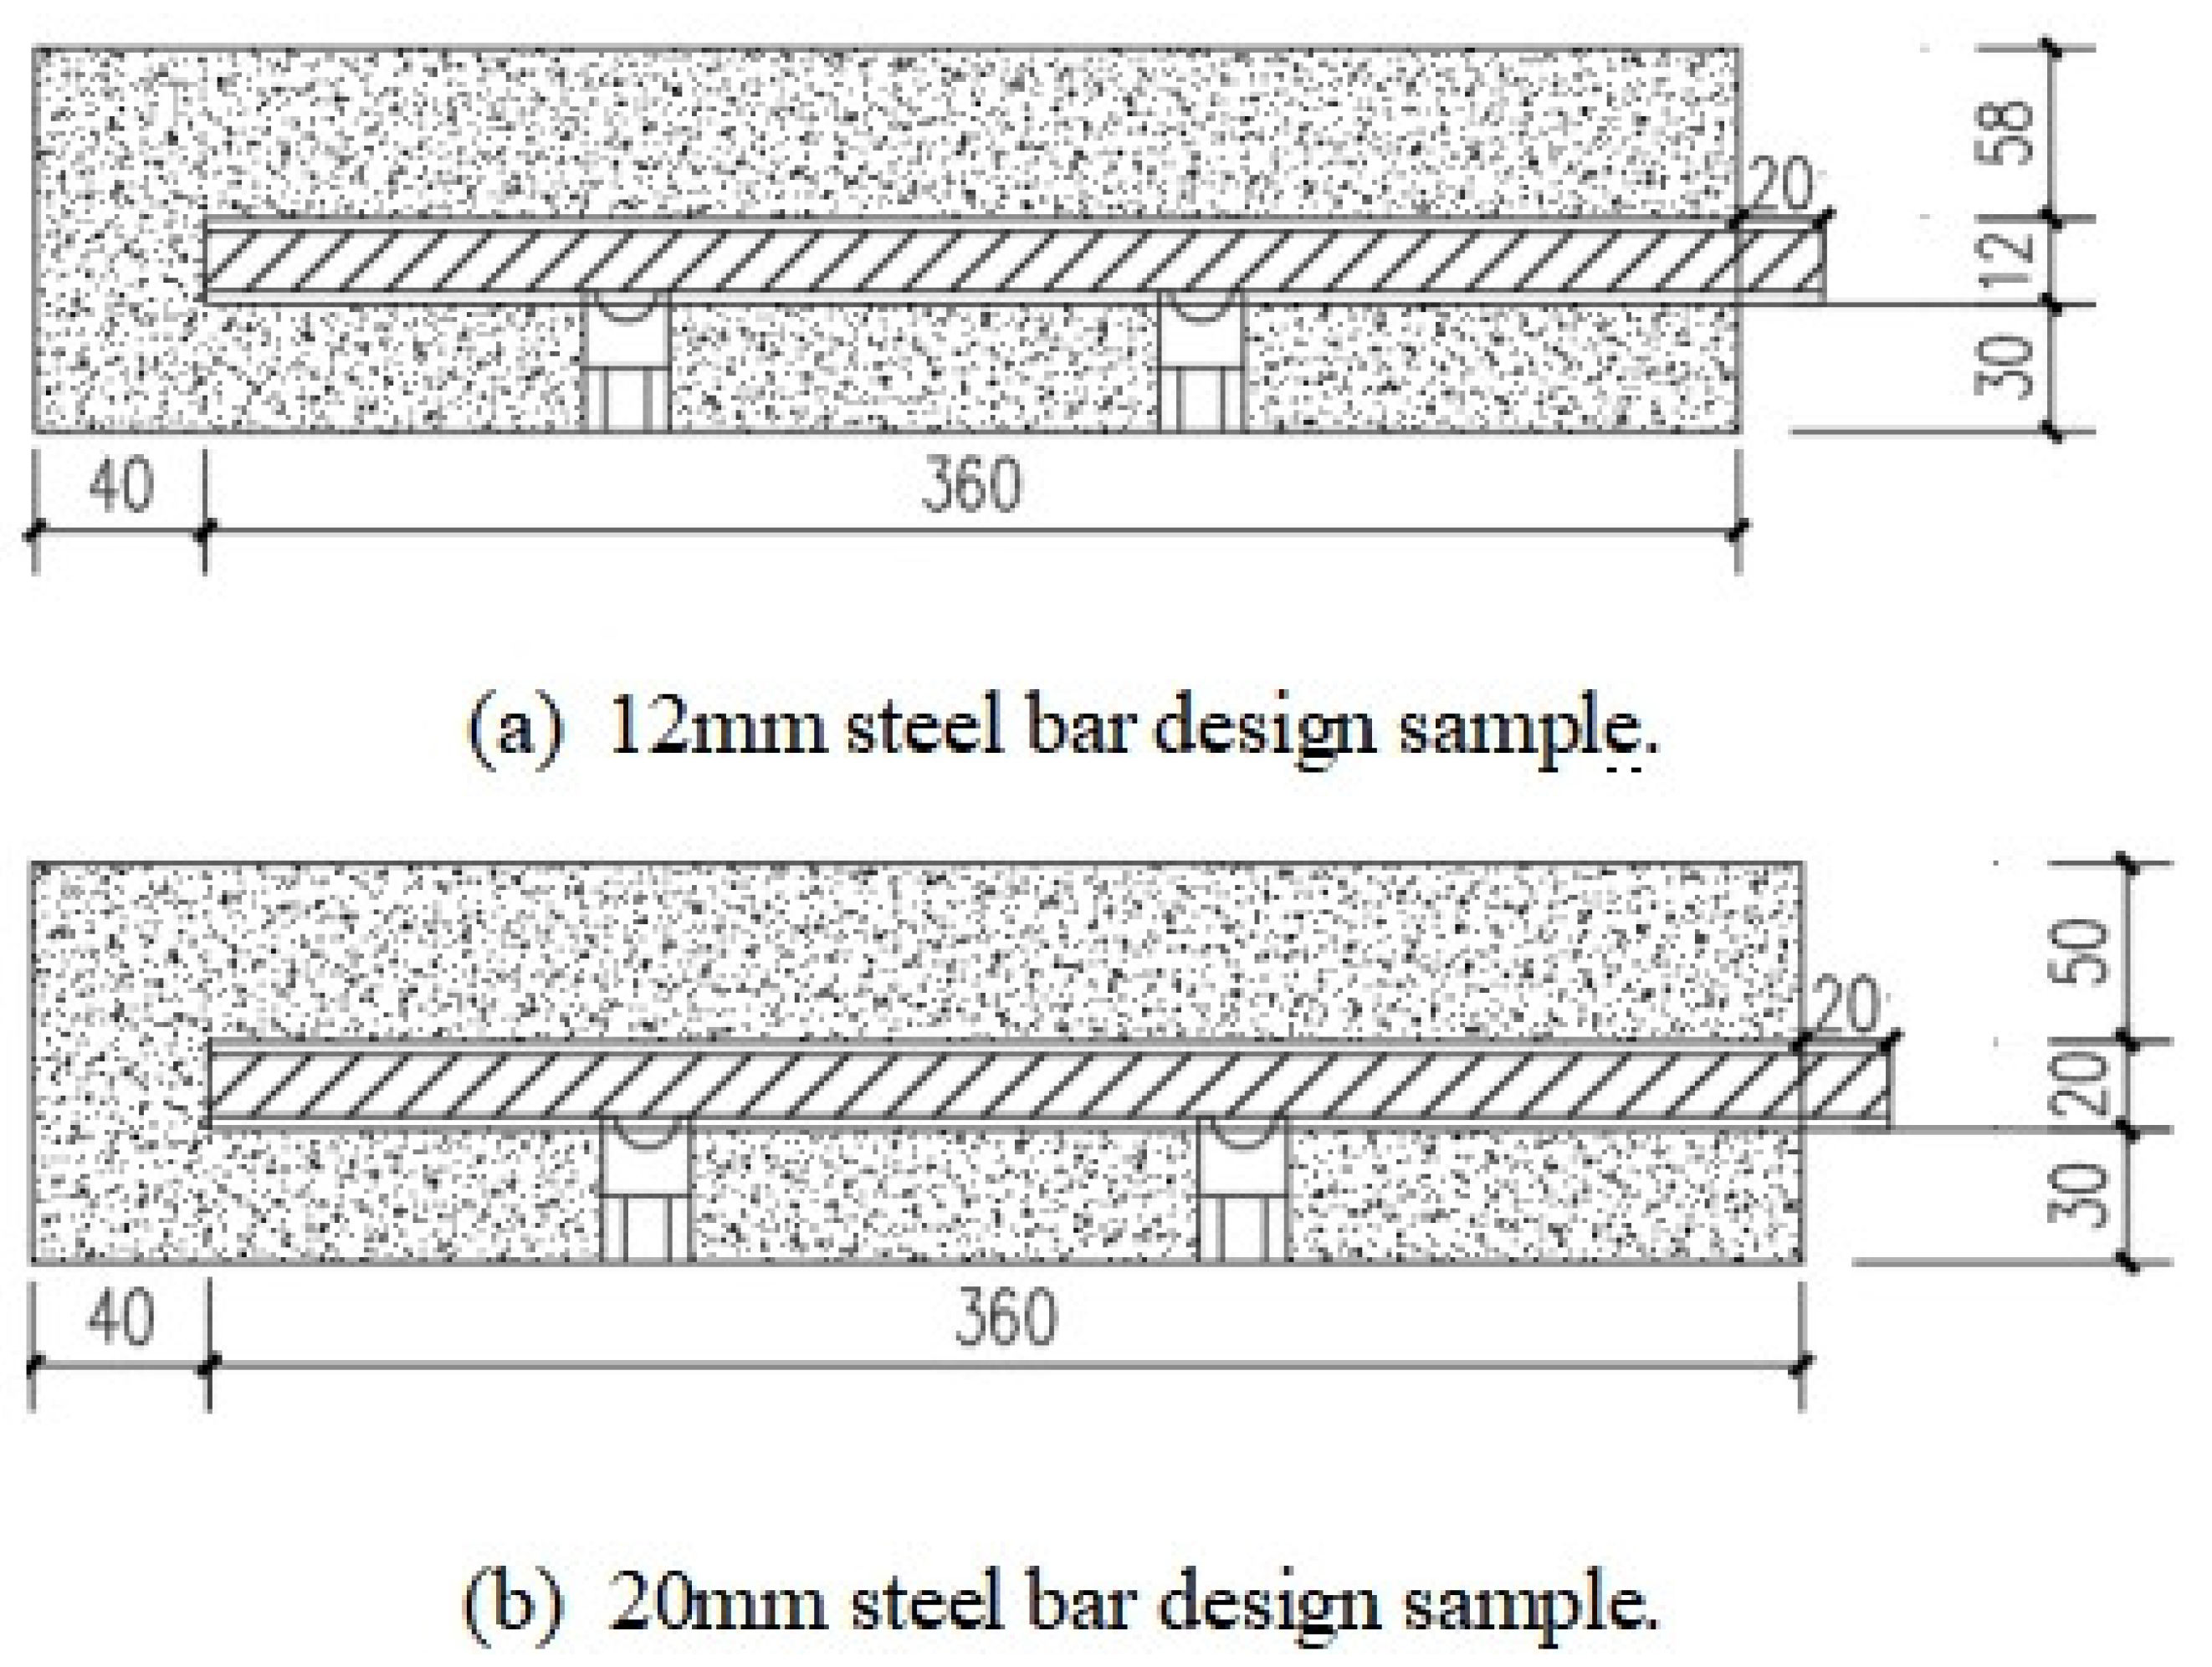
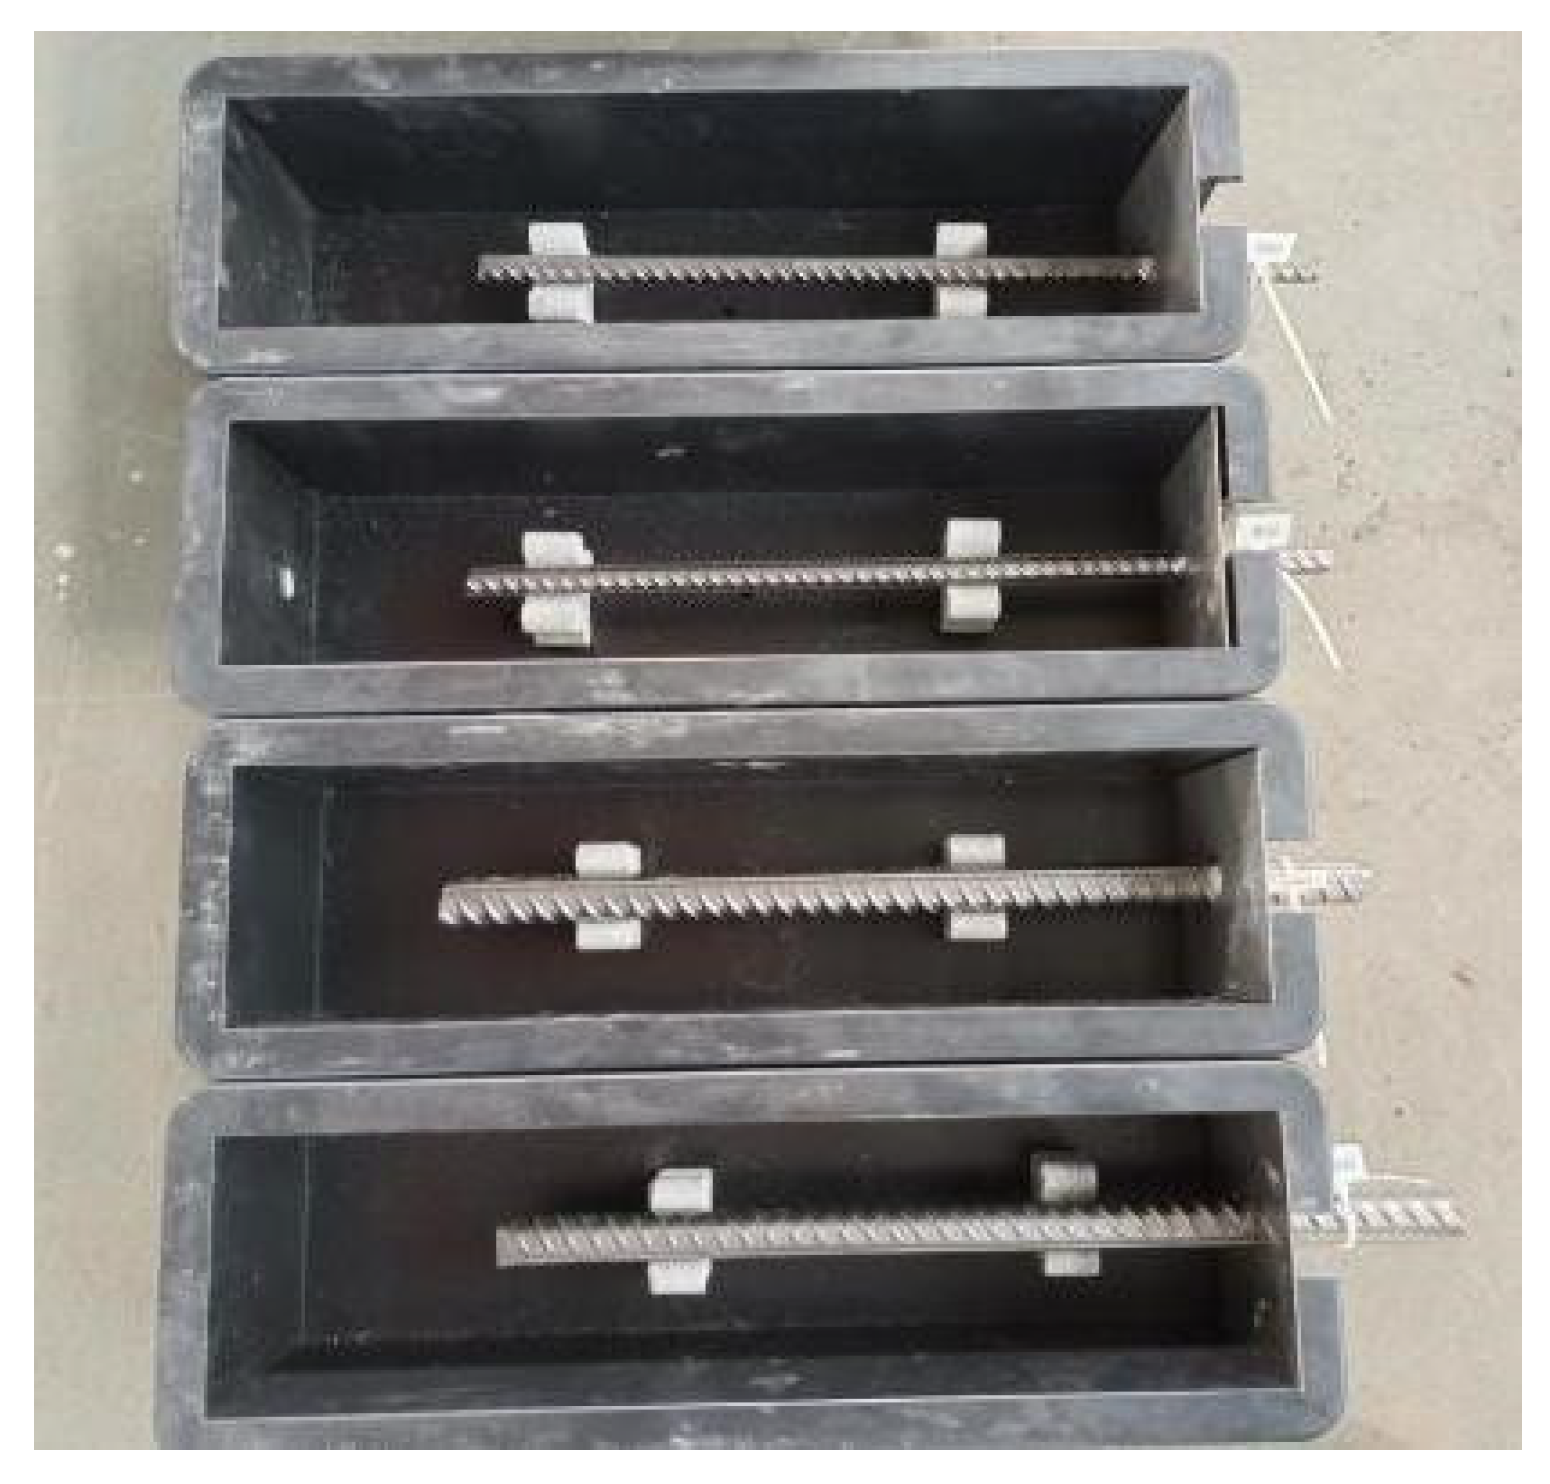
2.4.2. Electrochemical Steel Bar Corrosion Test
- (1)
- The sample was placed into a 5% NaCl solution corrosion chamber, maintaining the solution level flush with the sample. One end of the sample was connected to the positive pole of the DC power supply, while the other end of a stainless-steel rod was immersed in the solution, forming a current circuit corrosion sample.
- (2)
- According to Faraday’s law [25], its rusting time t can be calculated by using Equation (6).where t is the energization time (in s); is the quality loss of steel reinforcement (in g); Z is the reaction electrode chemical valence (+2); F is the Faraday’s constant (96,500 C/mol); MFe is the atomic weight of iron (56 g/mol); I is the current intensity (in A).
- (3)
- After the sample reached the corrosion period and showed signs of degradation, the steel bar was removed and descaled with 10% hydrochloric acid. It was then neutralized with lime water and washed with water. Afterward, the steel bar was placed in a drying box for 4 h, and finally, it was weighed.
- (4)
- The corrosion rate of steel bars was calculated using Equation (7).where is the corrosion rate of steel bars; m0 is the quality of steel bars before corrosion (in g); mt is the quality of corroded steel bars (in g).
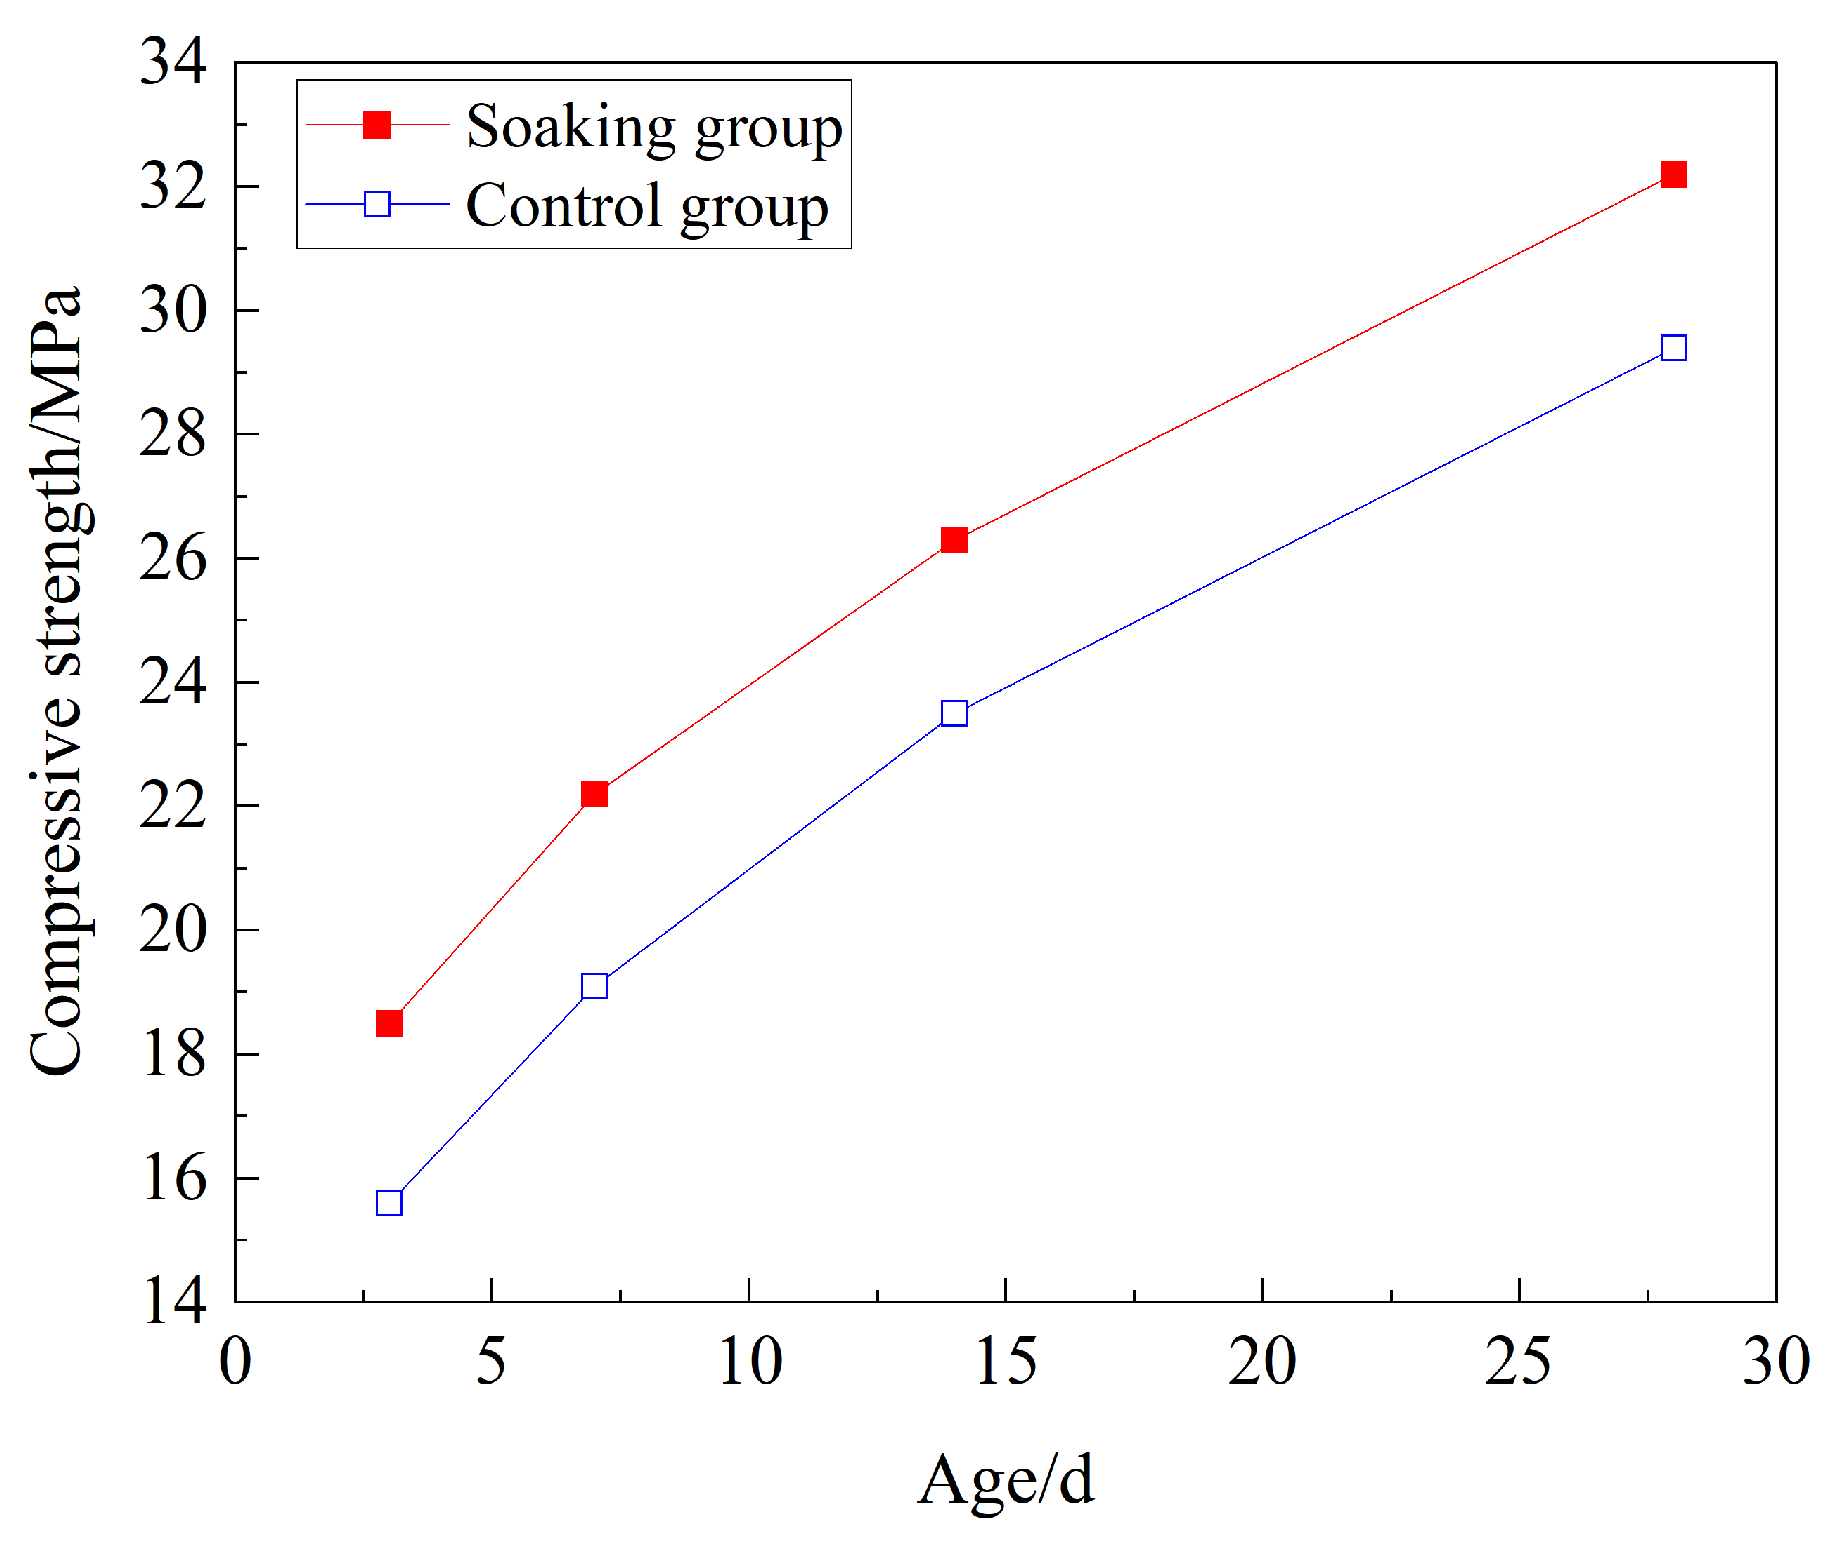
2.4.3. ALSCC30 Corrosion Test
- (1)
- The ALSCC30 samples were divided into a soaking group and a control group. The samples in the soaking group were immersed in a 5% NaCl solution for corrosion after being cured for 7 days.
- (2)
- After the corrosion time reached 3, 7, 14, and 28 days, the ALSCC30 samples were cleaned and dried for the compressive strength test.
3. Mechanical Properties Analysis
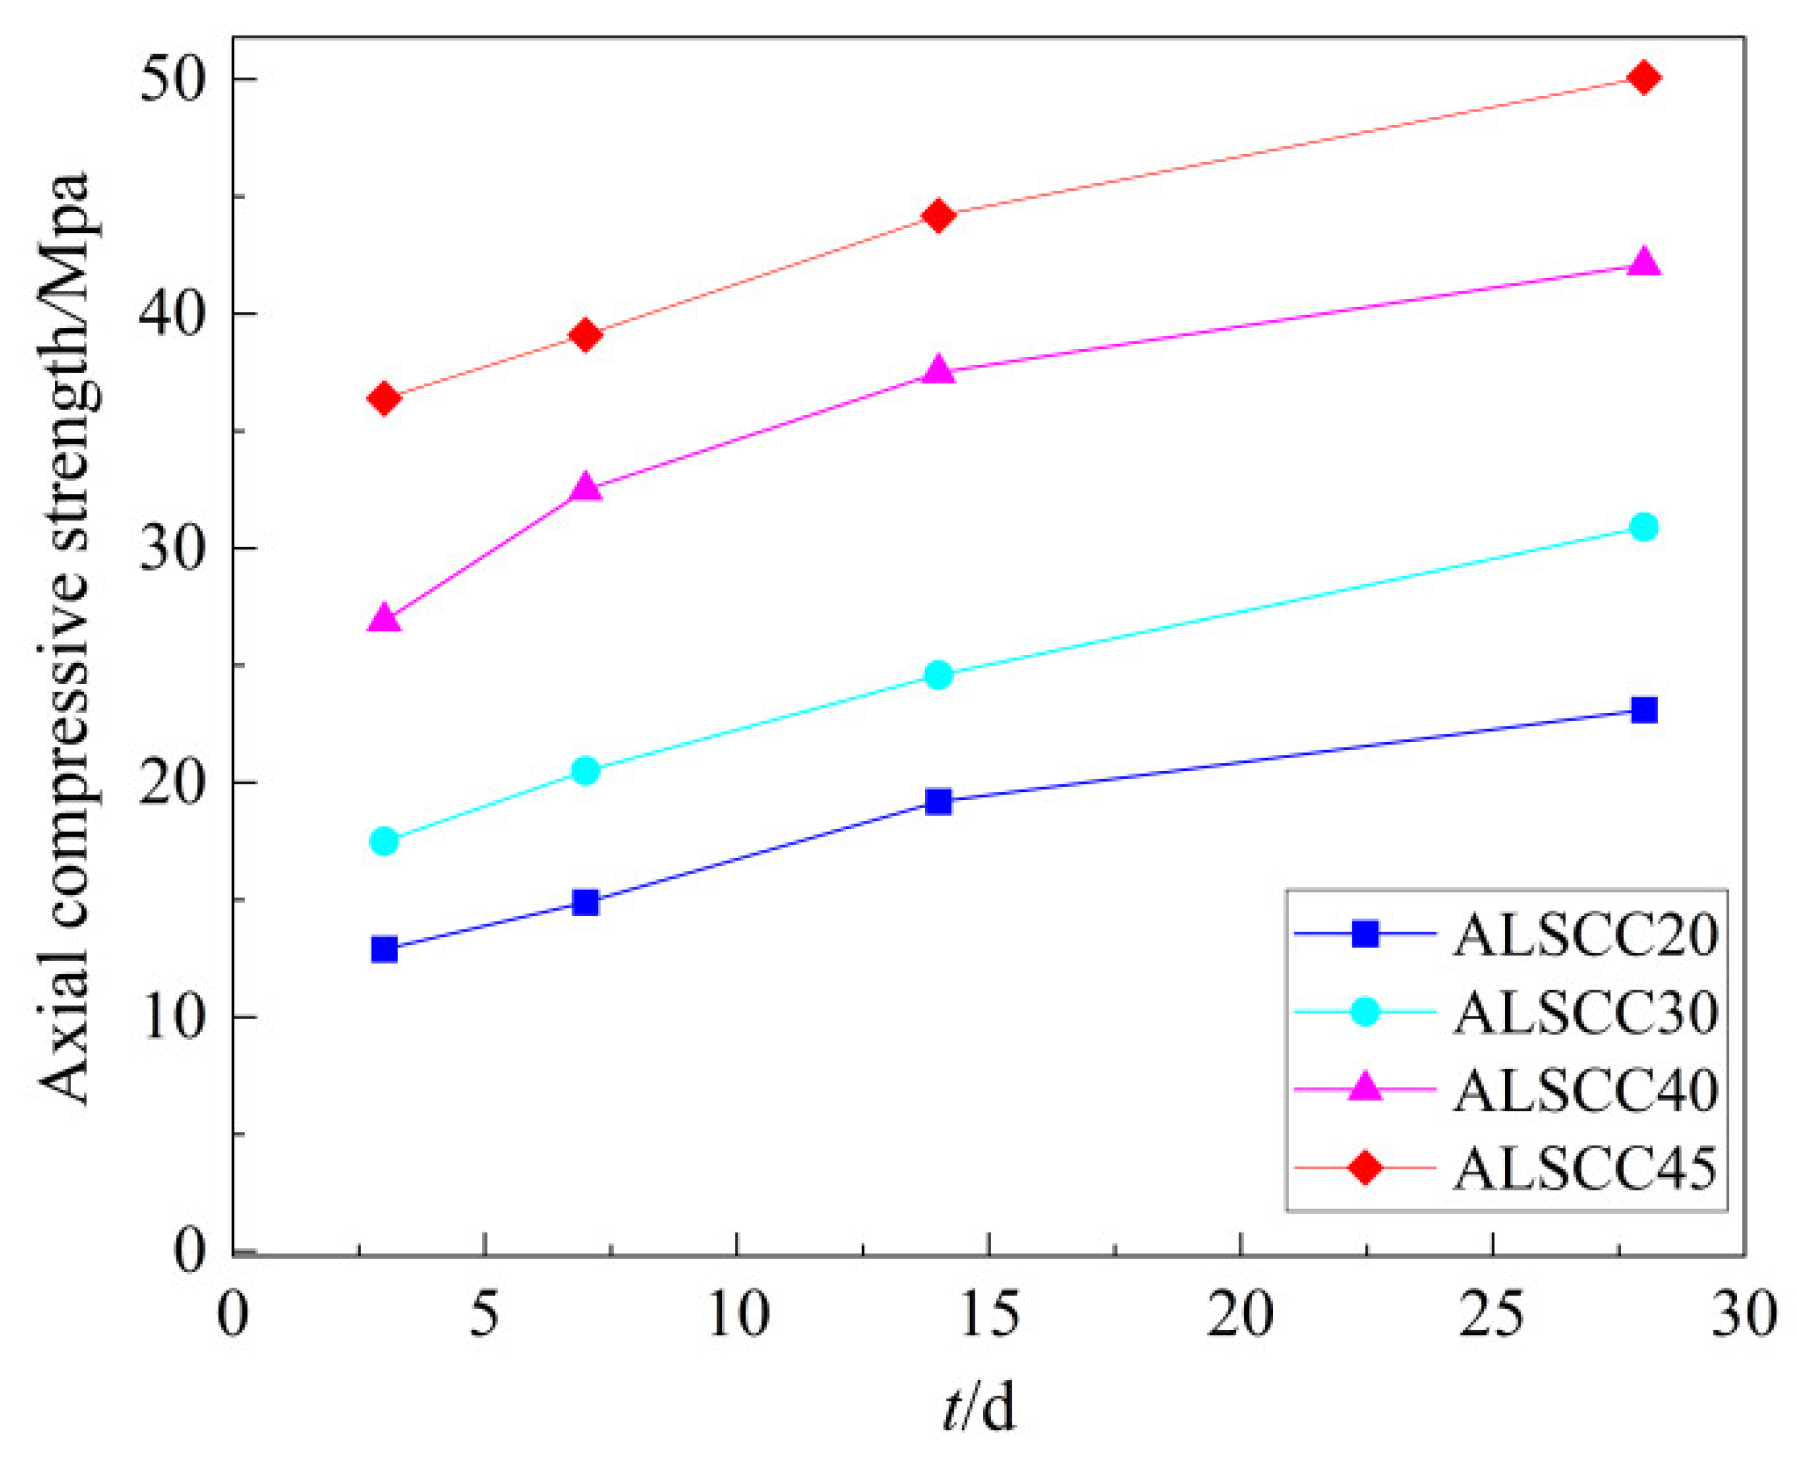
3.1. Compressive Strength
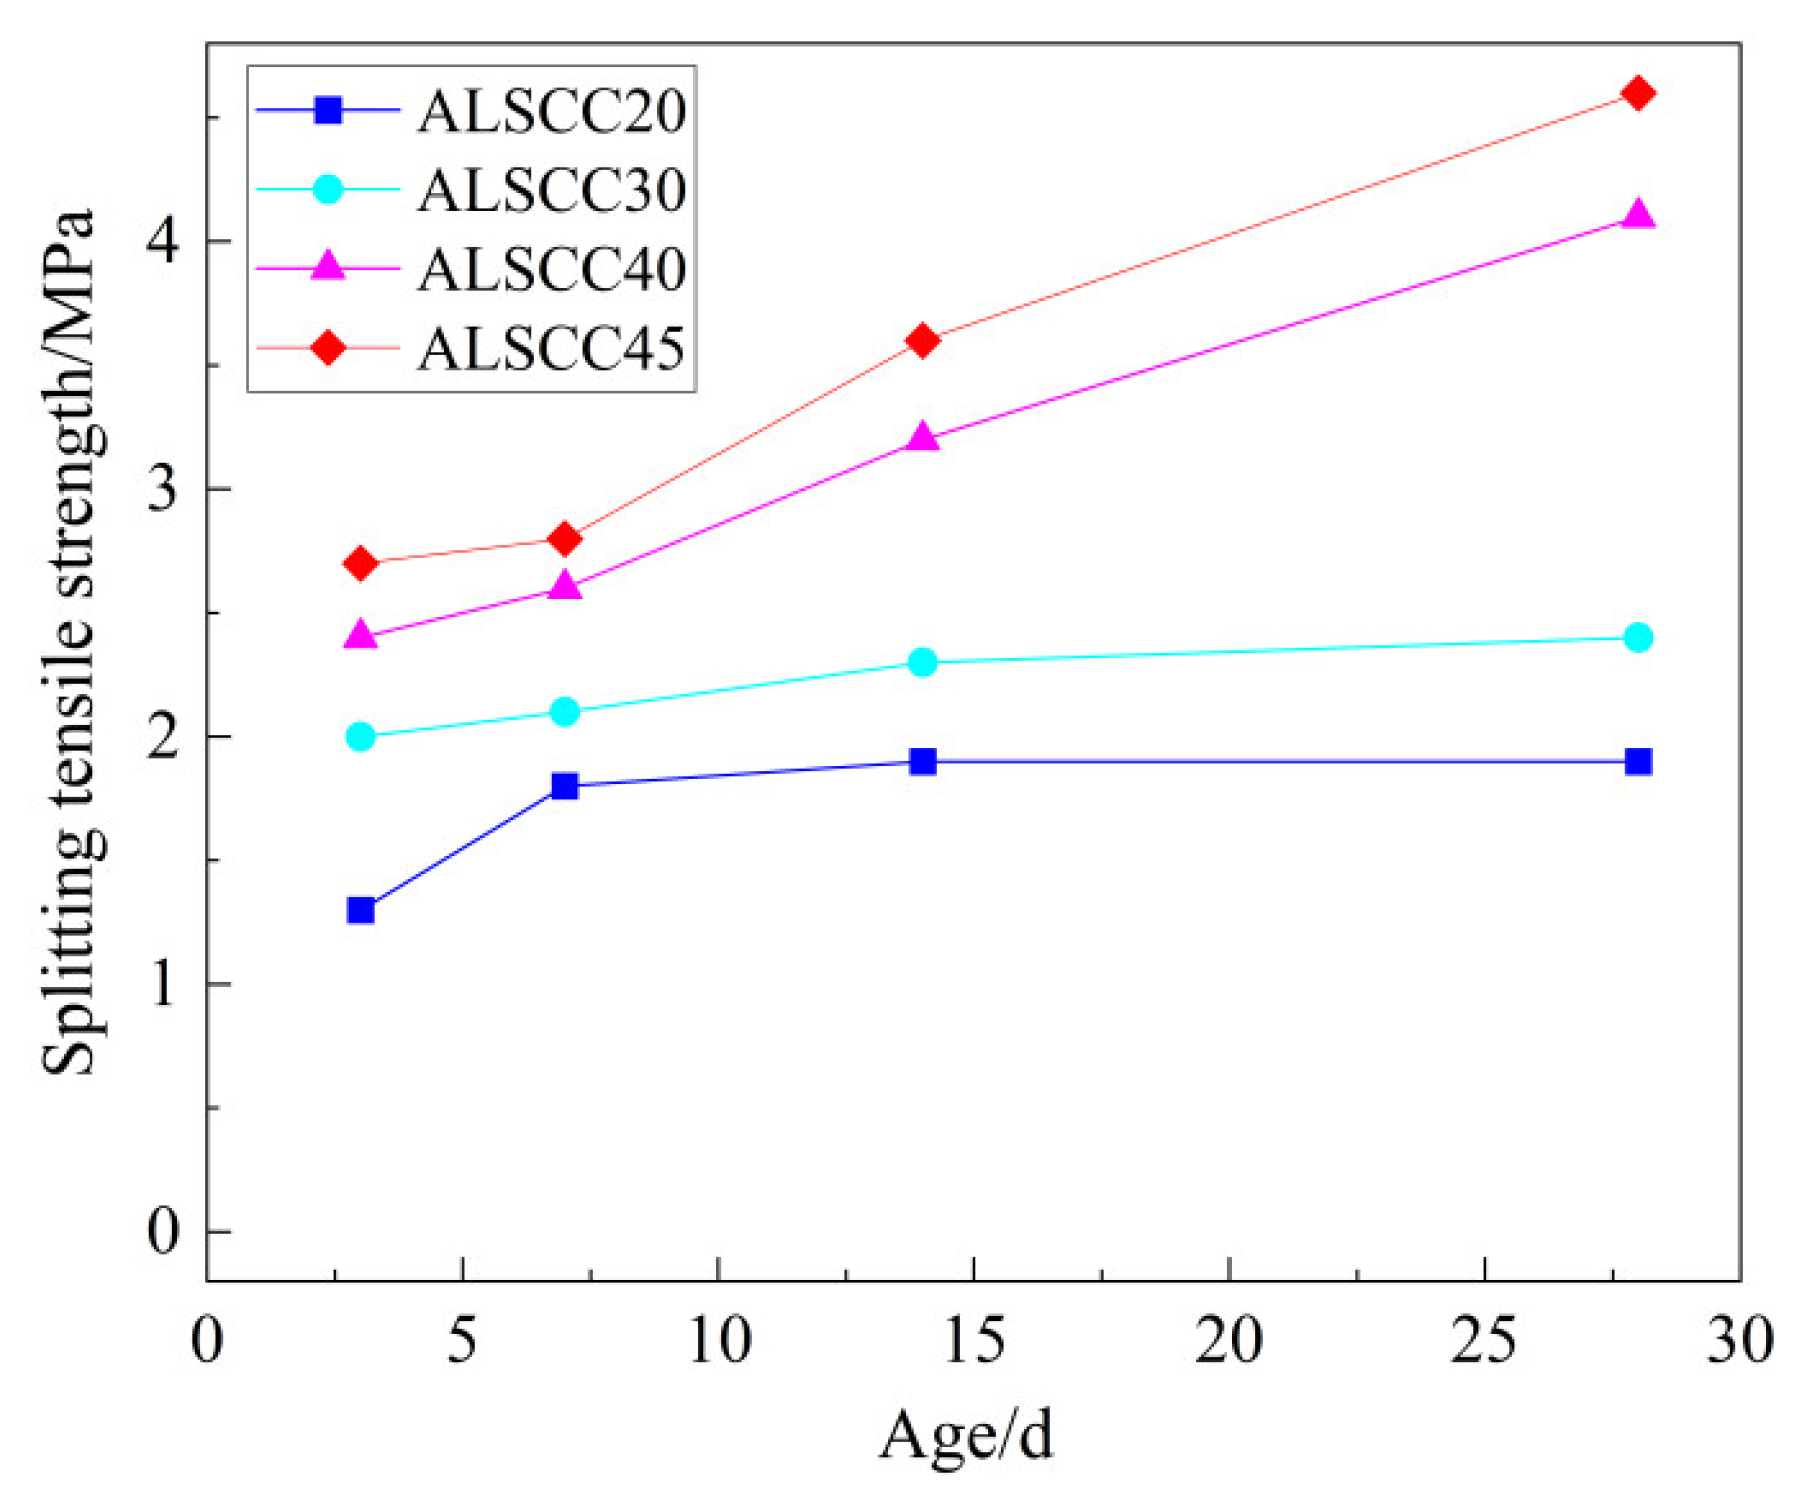
3.2. Split Tensile Strength
3.3. Elastic Modulus
4. Analysis of the Chlorine Salt Corrosion Resistance Test
4.1. Resistance to Chloride Ion Penetration
4.2. Electrochemical Corrosion of Steel Bars
4.3. Calculation Model of the Compressive Strength of ALSCC Corroded by Chloride Salt
5. Conclusions
- (1)
- ALSCC exhibits good mechanical properties, which are positively correlated with strength grade. The cube compressive strength, axial compressive strength, split tensile strength, and elastic modulus of ALSCC45 are 3.92, 2.16, 2.29, and 1.42 times higher than those of ALSCC20 at 28 days, respectively. As the water–cement ratio decreases, the compactness of the concrete improves; pores and microcracks are reduced, and the amount of cement is increased, enhancing the cementitious system and improving its mechanical properties.
- (2)
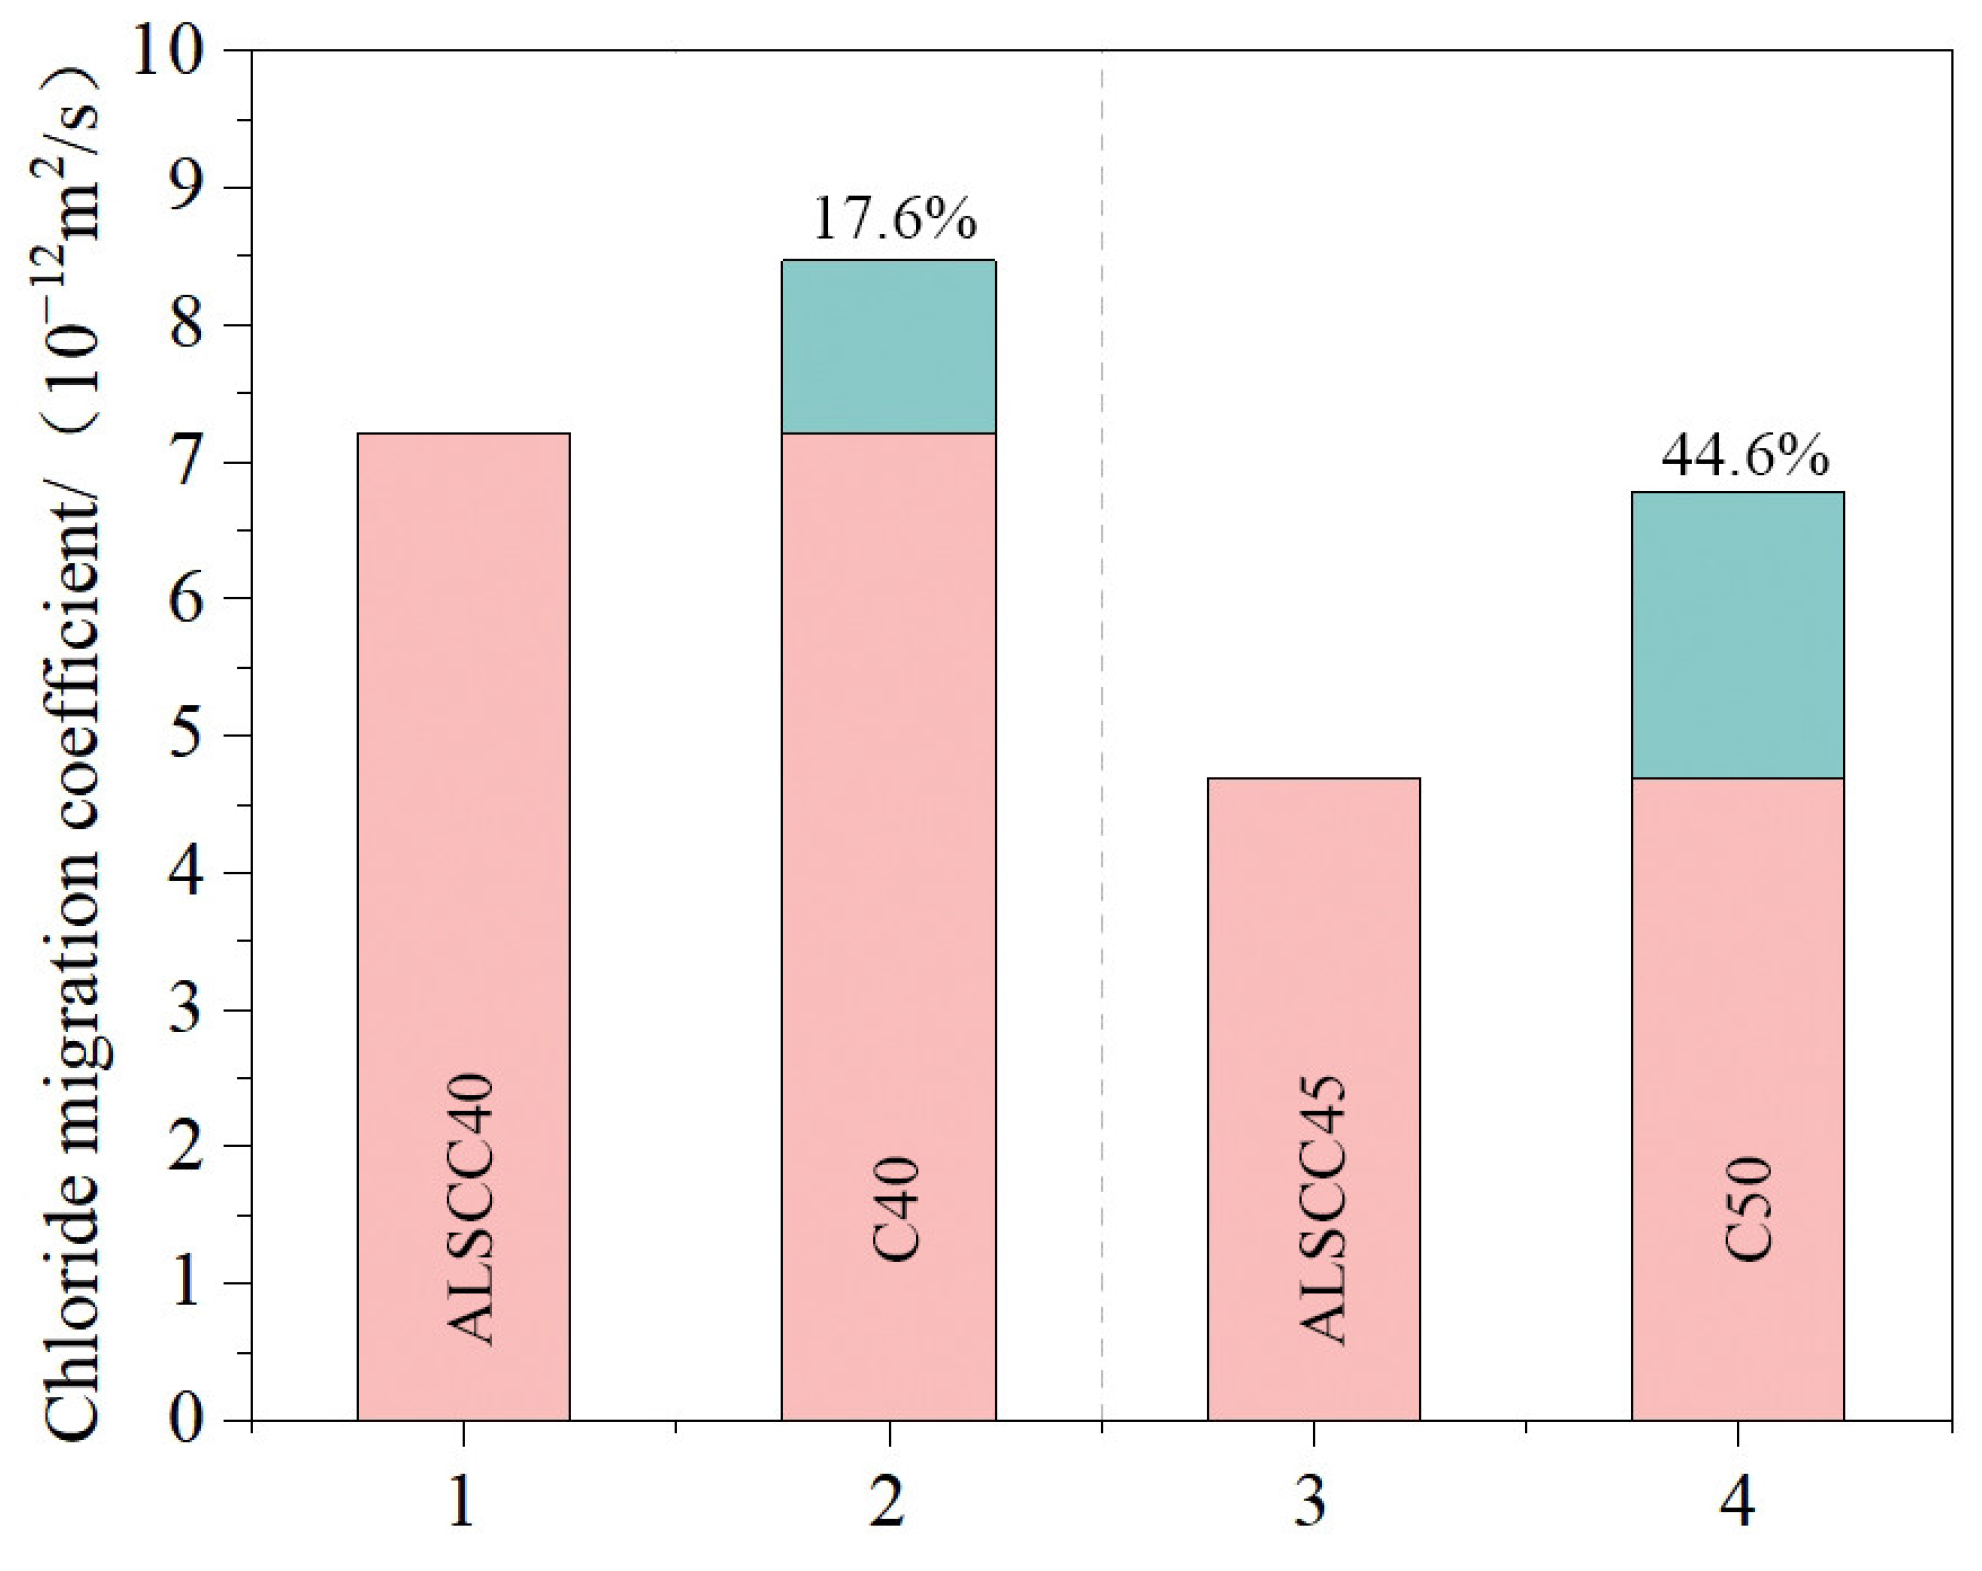
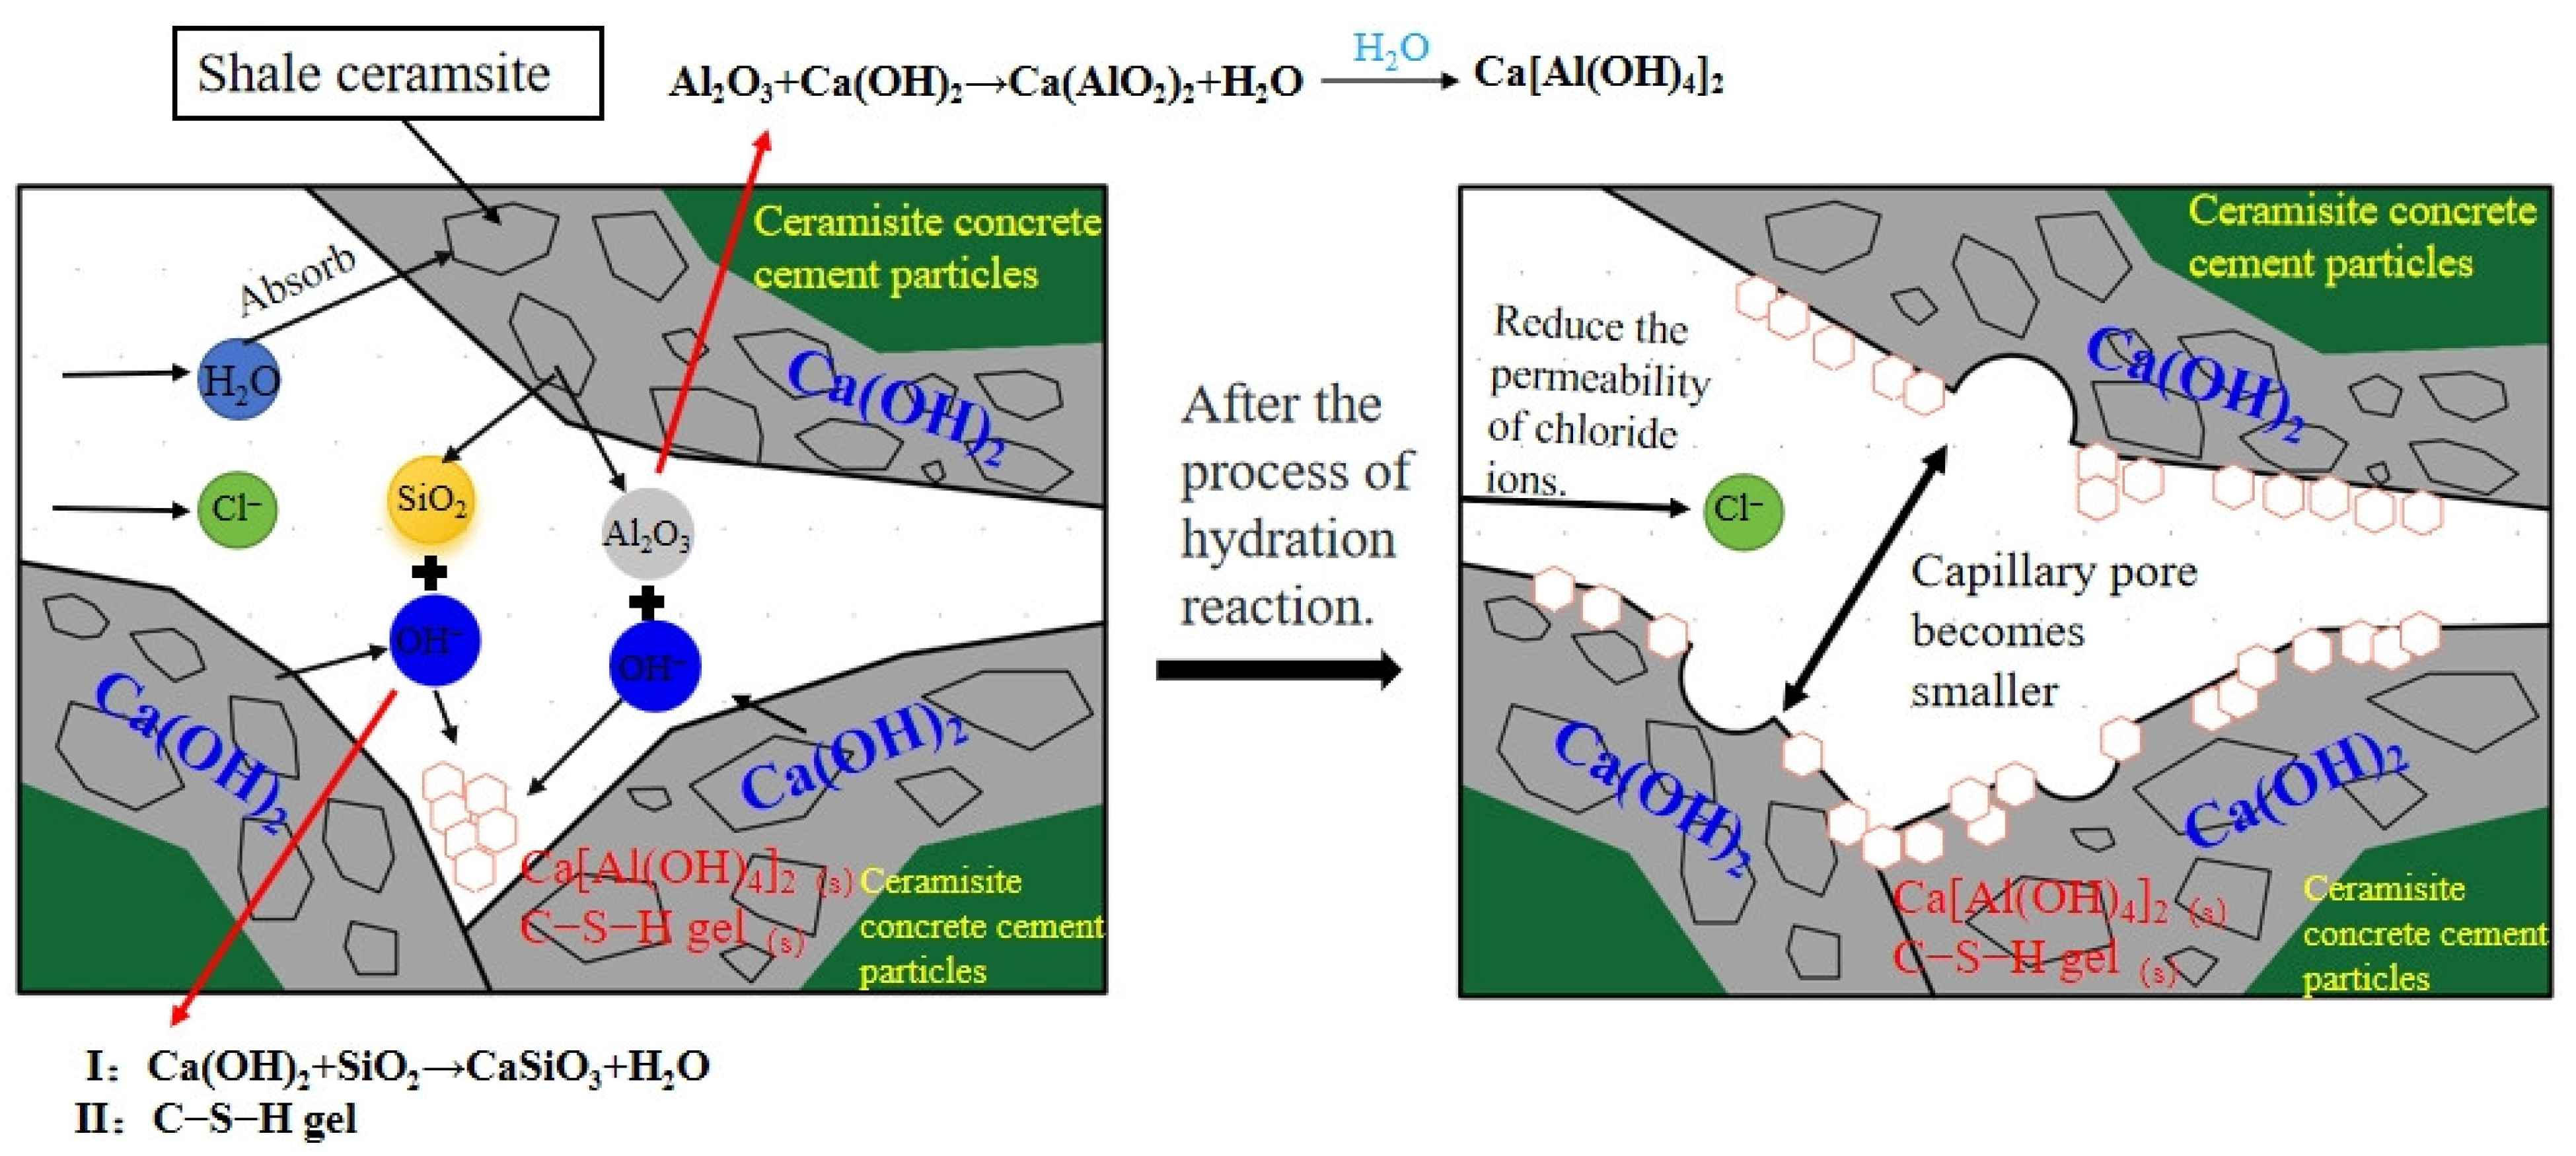
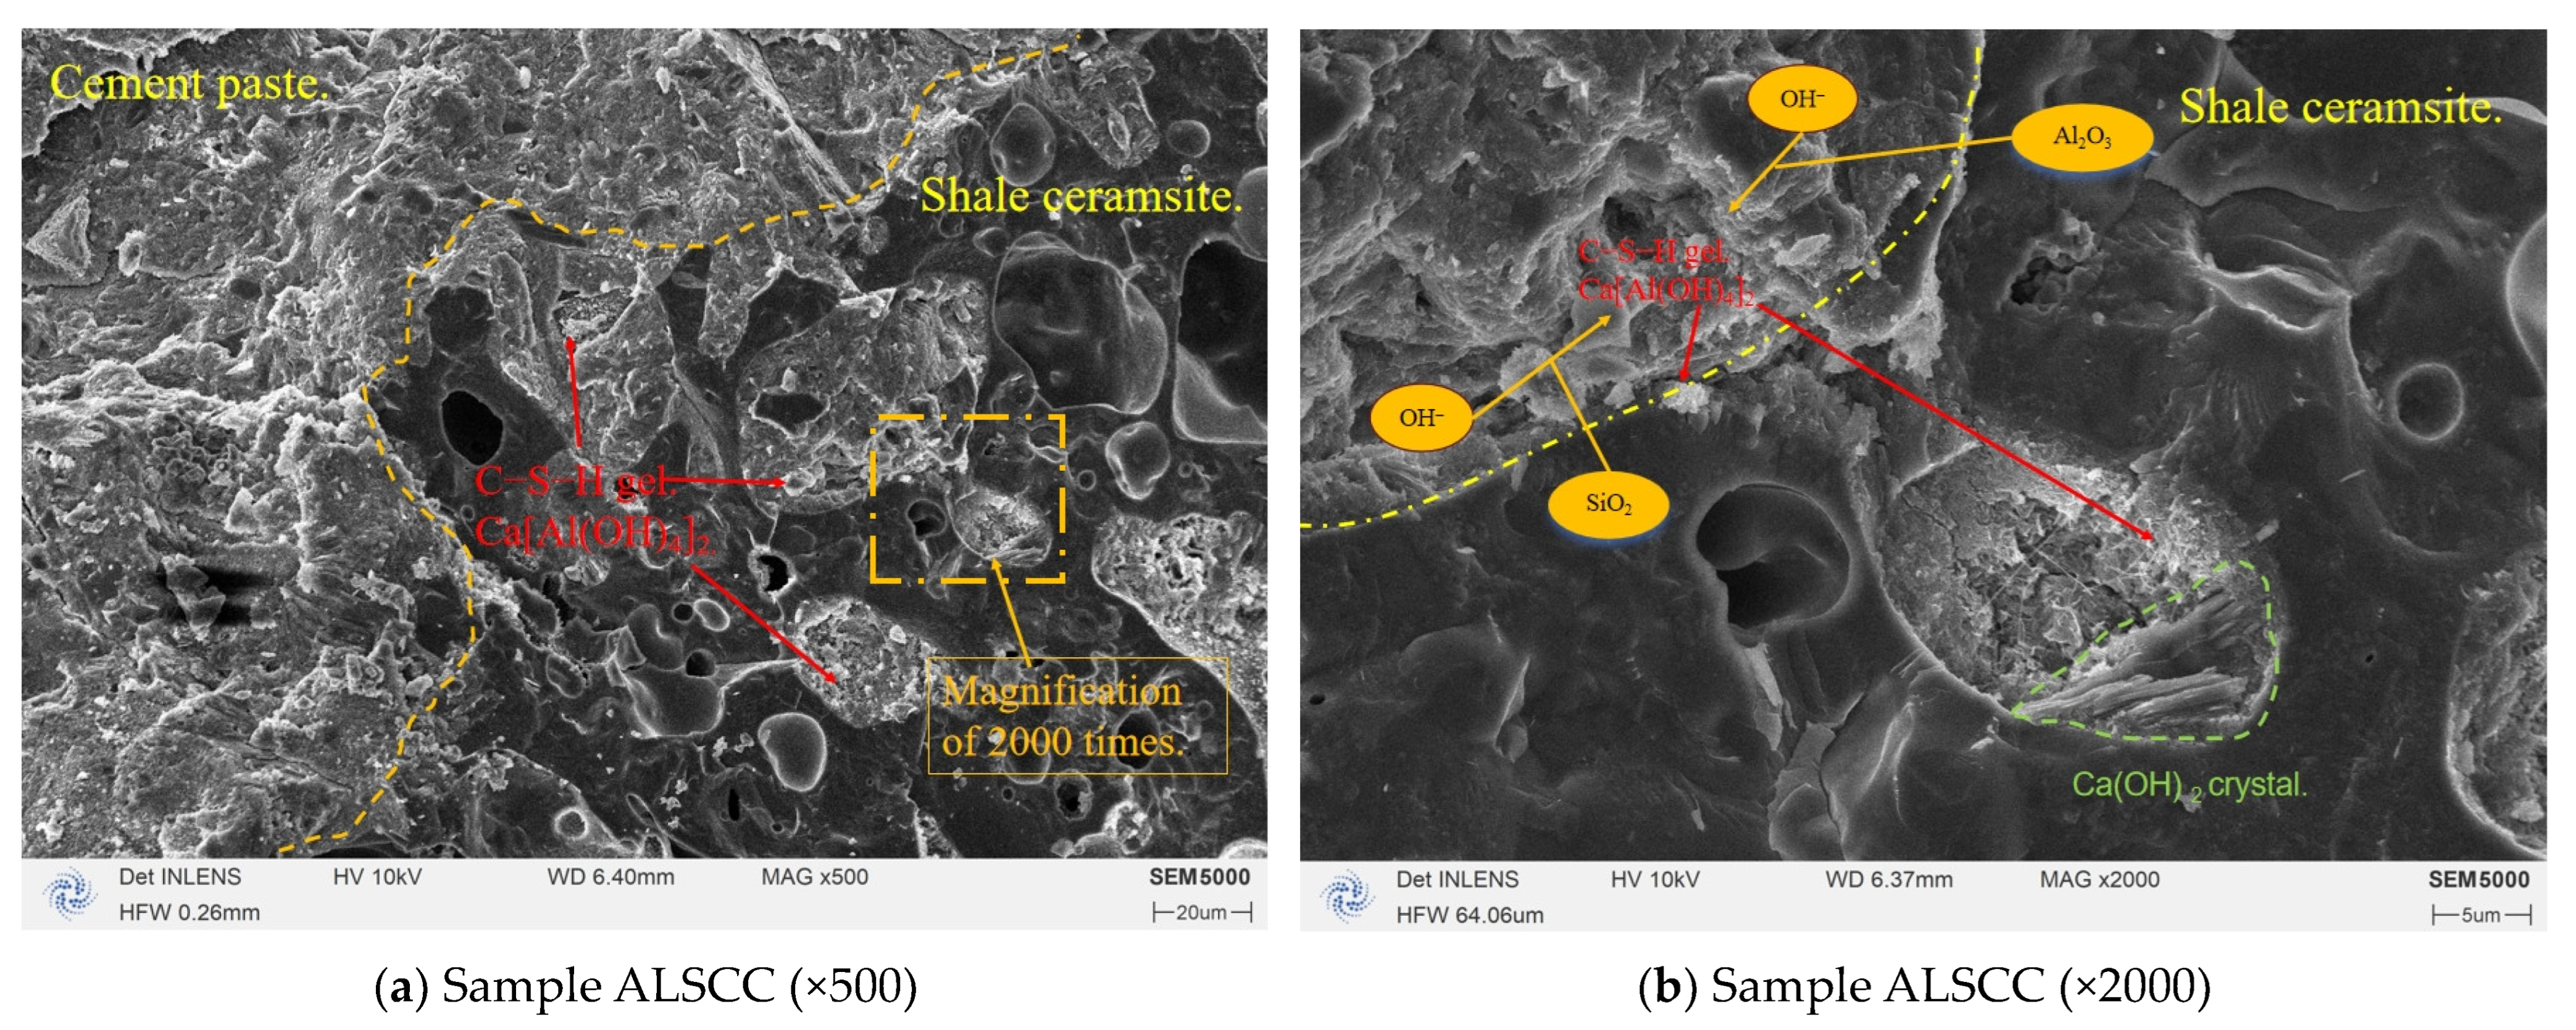
- The chloride corrosion resistance of ALSCC is superior to that of ordinary concrete. When compared with ordinary concrete of the same strength grade, the RCM values of ALSCC40 and ALSCC45 specimens are 15% and 31% lower than those of C40 and C50 samples, respectively. This is due to the ability of ceramsite particles to absorb water and reduce the water content in the pores. This reduction in water content leads to decreased permeability to chloride ions. Additionally, hydration of ceramsite and Ca(OH)2 in the concrete results in the precipitation of Ca[Al(OH)4]2 and the formation of C–S–H gel. These products fill the spaces between cement hydration products, thereby increasing the internal filling within the concrete and enhancing its resistance to chloride ions.
- (3)
- The depth of chloride ion penetration in ALSCC is inversely proportional to its strength grade. The penetration depth of chloride ions in the ALSCC45 sample is only 35.9% of that in the ALSCC20 sample. As the strength grade increases, the porosity of the concrete decreases, reducing the penetration rate and depth of chloride ions.
- (4)
- A calculation model for the compressive strength of ALSCC under chloride salt corrosion was proposed based on the ALSCC30 corrosion test results. The theoretical values of the model showed good agreement with the measured values, demonstrating high prediction accuracy with an R2 value of 0.972.
Author Contributions
Funding
Data Availability Statement
Conflicts of Interest
References
- Sukontasukkul, P. Use of viscoelastic polymer sheet as an acoustic control treatment in ceramic tiles to improve sound insertion loss. Results Eng. 2023, 17, 100897. [Google Scholar] [CrossRef]
- Yu, Q.L.; Spiesz, P.; Brouwears, H.J.H. Ultra-lightweight concrete: Conceptual design and performance evaluation. Cem. Concr. Compos. 2015, 61, 18–28. [Google Scholar] [CrossRef]
- Zhang, W.; Wang, S.; Duan, X.; Jin, Y.Z.; Feng, C.H.; Zhu, J.P.; Su, F.Q. Mechanical properties, durability and microstructure of cementitious materials with low-calcium circulating fluidized bed fly ash. Constr. Build. Mater. 2023, 369, 130394. [Google Scholar] [CrossRef]
- Sun, L.; Wang, C.; Zhang, C.W.; Yang, Z.Y.; Li, C.; Qiao, P.Z. Experimental investigation on the bond performance of sea sand coral concrete with FRP bar reinforcement for marine environments. Adv. Struct. Eng. 2023, 26, 533–546. [Google Scholar] [CrossRef]
- He, S.H.; Lv, B.T.; Huang, X.; Zou, L.Q.; Zhou, D.F. Cracking performance in the hogging moment region of HSS-UHPC continuous composite girder bridges. Structures 2024, 61, 106081. [Google Scholar]
- Li, H.; Yang, Y.M.; Wang, X.Z.; Tang, H. Effects of the position and chloride-induced corrosion of strand on bonding behavior between the steel strand and concrete. Structures 2023, 58, 105500. [Google Scholar] [CrossRef]
- Feng, W.; Tarakbay, A.; Ali, M.S.; Tang, W.C.; Cui, H.Z. Methods of accelerating chloride-induced corrosion in steel-reinforced concrete: A comparative review. Constr. Build. Mater. 2021, 289, 123165. [Google Scholar] [CrossRef]
- Shi, W.; Liu, Y.; Wang, W.; Duan, P.F.; Wang, Z.X.; Shang, Z.Z. Relationship between chloride ion permeation resistance of recycled aggregate thermal insulation concrete and pore structure parameters. Constr. Build. Mater. 2023, 370, 130666. [Google Scholar] [CrossRef]
- Zuo, X.B.; Zou, S.; Li, X.N.; Zheng, Z.K. Corrosion Process of Steel Bar in Fly Ash-Concreteunder Chloride Environment. J. Build. Mater. 2020, 23, 875–881. [Google Scholar]
- Sun, J.; Chen, Z. Influences of limestone powder on the resistance of concretes to the chloride ion penetration and sulfate attack. Powder Technol. 2018, 338, 725–733. [Google Scholar] [CrossRef]
- Zhao, X.; Liu, R.; Qi, W.; Yang, Y.Q. Corrosion resistance of concrete reinforced by zinc phosphate pretreated steel fiber in the presence of chloride ions. Materials 2020, 13, 3636. [Google Scholar] [CrossRef] [PubMed]
- Sun, D.; Shi, H.; Wu, K.; Miramini, S.; Li, B.B.; Zhang, L.H. Influence of aggregate surface treatment on corrosion resistance of cement composite under chloride attack. Constr. Build. Mater. 2020, 248, 118636. [Google Scholar] [CrossRef]
- Yi, Y.; Zhu, D.; Guo, S.; Zhang, Z.H.; Shi, C.J. A review on the deterioration and approaches to enhance the durability of concrete in the marine environment. Cem. Concr. Compos. 2020, 113, 103695. [Google Scholar] [CrossRef]
- He, S.H.; Huang, X.; Zou, L.Q.; Zheng, C.; Xin, H.H.; Liang, J.S. Performance assessment of channel beam bridges with hollow track bed decks. Structures 2024, 61, 105988. [Google Scholar]
- Huang, H.; Yuan, Y.J.; Zhang, W.; Zhu, L. Property Assessment of High-Performance Concrete Containing Three Types of Fibers. Int. J. Concr. Struct. Mater. 2021, 15, 39. [Google Scholar] [CrossRef]
- Wei, J.L.; Li, S.Y.; Zhong, F.W.; Yi, C.F.; Chen, Z. Multi-factor computation model of compressive strength of biomass-based concrete. Concrete 2021, 9, 63–68+72. [Google Scholar]
- Ge, P.; Huang, W.; Quan, W.L.; Guo, Y.T. Research on compressive strength calculation of hybrid recycled aggregate concrete. J. Huazhong Univ. Sci. Tech. (Nat. Sci. Ed.). 2021, 49, 86–91. [Google Scholar]
- Song, Z.P.; Lu, C.H.; Zheng, Y.L.; Cai, Q.M.; Zhang, J.L. Theoretical analysis and calculation model for compressive strength of silica fume concrete. Concrete 2022, 9, 89–92. [Google Scholar]
- Chen, R.M.; Xiang, Y.K.; Liang, L.; Zhao, Y. Experimental study on compressive sStrength of concrete under combined action of freeze-thaw cycle and prestress. Mater. Rep. 2022, 36, 287–291. [Google Scholar]
- GB175-2023; Common Portland Cement. China Architecture & Building Press: Beijing, China, 2023.
- GB/T50081-2002; Standard for Test Method of Mechanical Properties on Ordinary Concrete. China Architecture & Building Press: Beijing, China, 2002.
- GB/T 50082-2009; Standard for Test Methods of Long-term Performance and Durability of Ordinary Concrete. China Architecture & Building Press: Beijing, China, 2009.
- SL/T 352-2020; Test Code for Hydraulic Concrete. China Architecture & Building Press: Beijing, China, 2020.
- GB/T 50080-2016; Standard for Test Method of Performance on Ordinary Fresh Concrete. China Architecture & Building Press: Beijing, China, 2016.
- Lapiro, I.; Mezhov, A.; Kovler, K. Performance of corrosion inhibitors in reinforced concrete elements under electrical voltage. Constr. Build. Mater. 2022, 342, 127656. [Google Scholar] [CrossRef]
- Wang, C.; Sun, L.; Zhang, C.; Li, C.; Qiao, P.Z.; Chen, X.Y. Experimental study on the mechanical properties and uniaxial compressive constitutive relationship of sea sand coral concrete. J. Build. Eng. 2024, 87, 109062. [Google Scholar] [CrossRef]
- Yun, J.Z.; Chen, S.C.; Dong, C.Y.; Wang, L.; Nie, L.P. Comparative Experimental Study on Strength and Elastic Modulus of Long Age Self-Compacting Concrete and Normal Concrete. Bull. Chin. Ceram. Soc. 2023, 42, 3530–3537. [Google Scholar]
- Fang, Y. The Concrete Ice to Chloride Ion Permeability Test Method Research and Engineering Case Analysis. Master’s Thesis, Zhejiang University, Hangzhou, China, 2018. [Google Scholar]


| Shale ceramsite | Particle size | <2.5 mm | 2.5 mm~4.5 mm | 4.5 mm~9.5 mm | >9.5 mm |
| Proportion | 1.08% | 7.45% | 74.61% | 16.86% | |
| Shale pottery sand | Particle size | <0.63 mm | 0.63 mm~1.25 mm | 1.25 mm~2.5 mm | >2.5 mm |
| Proportion | 52.75% | 16.15% | 23.34% | 3.76% |
| Cement Type | Fineness (%) | Initial Setting Time (min) | Final Setting Time (min) | SO3 (%) | MgO (%) | Ignition Loss(%) | Target fcu(28) (MPa) |
|---|---|---|---|---|---|---|---|
| P.C42.5 | 1.2 | 130 | 172 | 2.25 | 1.7 | 1.02 | 47.3 |
| P.O52.5 | 3.6 | 100 | 153 | 2.49 | 1.93 | 2.07 | 58.0 |
| Strength Grade | Cement (kg/m3) | Shale Ceramsite (kg/m3) | Shale Pottery Sand (kg/m3) | Ball Milled Powder (kg/m3) | Admixture (kg/m3) | Water (kg/m3) | Unit Weight (kN/m3) |
|---|---|---|---|---|---|---|---|
| ALSCC20 | 420 | 290 | 410 | 90 | 10.2 | 250 | 14.65 |
| ALSCC30 | 460 | 280 | 430 | 90 | 11.0 | 245 | 15.10 |
| ALSCC40 | 490 | 320 | 500 | 110 | 15.0 | 220 | 15.90 |
| ALSCC45 | 520 | 310 | 540 | 110 | 15.8 | 220 | 16.46 |
| Type of Test | Sample Nomenclature | Sample Size (mm) | Number of Samples | Test Age (days) |
|---|---|---|---|---|
| Cube compressive strength | ALSCC20 | 150 × 150 × 150 | 12 | 3, 7, 14, 28 |
| ALSCC30 | 12 | |||
| ALSCC40 | 12 | |||
| ALSCC45 | 12 | |||
| Axial compressive strength | ALSCC20 | 150 × 150 × 300 | 12 | |
| ALSCC30 | 12 | |||
| ALSCC40 | 12 | |||
| ALSCC45 | 12 | |||
| Split tensile strength | ALSCC20 | 150 × 150 × 150 | 12 | |
| ALSCC30 | 12 | |||
| ALSCC40 | 12 | |||
| ALSCC45 | 12 | |||
| Elastic modulus | ALSCC20 | 150 × 150 × 300 | 9 | 7, 14, 28 |
| ALSCC30 | 9 | |||
| ALSCC40 | 9 | |||
| ALSCC45 | 9 |
| Type of Test | Sample Nomenclature | Sample Size (mm) | Number of Samples | Steel Bar Diameter (mm) | Groups |
|---|---|---|---|---|---|
| Chloride ion permeability | ALSCC20 | Ø100 × 50 | 3 | - | - |
| ALSCC30 | 3 | - | - | ||
| ALSCC40 | 3 | - | - | ||
| ALSCC45 | 3 | - | - | ||
| Electrochemical steel bar corrosion | ALSCC20 | 100 × 100 × 400 | 2 | 12 | - |
| 2 | 20 | - | |||
| ALSCC30 | 2 | 12 | - | ||
| 2 | 20 | - | |||
| ALSCC40 | 2 | 12 | - | ||
| 2 | 20 | - | |||
| ALSCC45 | 2 | 12 | - | ||
| 2 | 20 | - | |||
| ALSCC30 corrosion | ALSCC30 | 150 × 150 × 150 | 4 | - | Soaking group |
| ALSCC30 | 4 | - | Control group |
| No. | Sample Nomenclature | Steel Bar Diameter (mm) | Steel Bar Weight (g) | Corrosion Current (A) | Corrosion Time (days) |
|---|---|---|---|---|---|
| A1 | ALSCC20 | 12 | 321.83 | 0.08 | 15.10 |
| A2 | 12 | 315.66 | 0.16 | 15.73 | |
| A3 | 20 | 911.16 | 0.20 | 18.17 | |
| A4 | 20 | 914.23 | 0.40 | 18.17 | |
| B1 | ALSCC30 | 12 | 320.32 | 0.08 | 15.03 |
| B2 | 12 | 319.64 | 0.16 | 15.93 | |
| B3 | 20 | 915.96 | 0.20 | 18.27 | |
| B4 | 20 | 927.33 | 0.40 | 18.49 | |
| C1 | ALSCC40 | 12 | 320.67 | 0.08 | 15.98 |
| C2 | 12 | 322.36 | 0.16 | 16.07 | |
| C3 | 20 | 922.86 | 0.20 | 18.41 | |
| C4 | 20 | 917.06 | 0.40 | 18.29 | |
| D1 | ALSCC45 | 12 | 319.25 | 0.08 | 15.92 |
| D2 | 12 | 320.63 | 0.16 | 15.99 | |
| D3 | 20 | 915.92 | 0.20 | 18.27 | |
| D4 | 20 | 912.32 | 0.40 | 18.20 |
| Strength Grade | ALSCC20 | ALSCC30 | ALSCC40 | ALSCC45 |
|---|---|---|---|---|
| Average depth of penetration of chloride ions (mm) | 31.62 | 25.96 | 16.03 | 9.98 |
| 29.72 | 23.81 | 16.02 | 11.36 | |
| 30.12 | 25.47 | 16.04 | 11.17 |
| Strength Grade | RCM Value/(10−12 m2/s) |
|---|---|
| ALSCC20 | 17.44 |
| ALSCC30 | 14.10 |
| ALSCC40 | 7.20 |
| ALSCC45 | 4.69 |
Disclaimer/Publisher’s Note: The statements, opinions and data contained in all publications are solely those of the individual author(s) and contributor(s) and not of MDPI and/or the editor(s). MDPI and/or the editor(s) disclaim responsibility for any injury to people or property resulting from any ideas, methods, instructions or products referred to in the content. |
© 2024 by the authors. Licensee MDPI, Basel, Switzerland. This article is an open access article distributed under the terms and conditions of the Creative Commons Attribution (CC BY) license (https://creativecommons.org/licenses/by/4.0/).
Share and Cite
Cao, G.; Liu, R.; He, S.; Liao, S.; Zhang, Z. Mechanical Properties and Chloride Salt Corrosion Resistance of All-Lightweight Shale Ceramsite Concrete. Buildings 2024, 14, 1684. https://doi.org/10.3390/buildings14061684
Cao G, Liu R, He S, Liao S, Zhang Z. Mechanical Properties and Chloride Salt Corrosion Resistance of All-Lightweight Shale Ceramsite Concrete. Buildings. 2024; 14(6):1684. https://doi.org/10.3390/buildings14061684
Chicago/Turabian StyleCao, Guohui, Rui Liu, Shaohua He, Shijie Liao, and Zaihua Zhang. 2024. "Mechanical Properties and Chloride Salt Corrosion Resistance of All-Lightweight Shale Ceramsite Concrete" Buildings 14, no. 6: 1684. https://doi.org/10.3390/buildings14061684
APA StyleCao, G., Liu, R., He, S., Liao, S., & Zhang, Z. (2024). Mechanical Properties and Chloride Salt Corrosion Resistance of All-Lightweight Shale Ceramsite Concrete. Buildings, 14(6), 1684. https://doi.org/10.3390/buildings14061684