Article

In Situ Testing and FEM Analysis of Dynamic Characteristics of a Masonry Pagoda under Natural Excitation

1
Hunan Provincial Key Laboratory of Intelligent Protection and Utilization Technology in Masonry Artifacts, Hunan University of Science and Engineering, Yongzhou 425199, China
2
Hunan Engineering Research Center of Health Monitoring and Intelligent Utilization in Immovable Cultural Relics, Hunan University of Science and Engineering, Yongzhou 425199, China
3
College of Civil Engineering, Xiangtan University, Xiangtan 411105, China
4
Hunan Key Laboratory of Sciences of Urban and Rural Human Settlements in Hilly Areas, Hunan University, Changsha 410082, China
5
Shanghai Jianwei Cultural Heritage Conservation Tech. Co., Ltd., Shanghai 201315, China
*
Author to whom correspondence should be addressed.
Buildings 2024, 14(6), 1700; https://doi.org/10.3390/buildings14061700
Submission received: 17 April 2024 / Revised: 12 May 2024 / Accepted: 28 May 2024 / Published: 7 June 2024
(This article belongs to the Section Building Structures)

Abstract

:
Ancient masonry pagodas hold significant scientific, historical, and cultural importance. However, due to the complexity of masonry materials, structures, and boundary conditions, establishing finite element static and dynamic models for ancient masonry pagodas is highly challenging. This study aimed to explore the dynamic characteristics and finite element numerical simulation methods of ancient masonry pagodas in Yongzhou, Hunan province. It focused on the Huilong Pagoda in Yongzhou, where in situ test experiments under natural excitation are conducted. The SSI and NExT-ERA methods were employed to determine the ancient pagoda’s natural frequencies, vibration patterns, and damping ratios, and to validate the NExT-ERA method. The macroscopic numerical model of the Huilong Pagoda was calibrated using measured results. Subsequently, the NExT-ERA identification results were compared and analyzed with the numerical simulation results of the dynamic characteristics. The results indicate that the first three orders of natural frequencies for the ancient pagoda in the east–west direction are 1.937 Hz, 6.802 Hz, and 21.361 Hz, respectively. Similarly, the first three orders of natural frequencies in the north–south direction are 1.935 Hz, 7.439 Hz, and 21.398 Hz. The results obtained from both methods revealed that the overall structural damping ratio ranges from 0.21% to 2.89%. The numerical model was analyzed using ANSYS, and the first three orders of natural frequencies obtained were highly consistent with the measured values, exhibiting a maximum relative error of 8.54%. The numerical simulation method developed in this study can effectively simulate masonry pagodas.

1. Introduction

Masonry pagodas represent a significant form of ancient Chinese architecture, holding considerable research value for studying local material culture, architectural art, and customs. Existing masonry pagodas in China exhibit complex and diverse structures, and according to Liang Sicheng’s A Pictorial History of Chinese Architecture [1], the Huilong Pagoda studied in this paper is classified as a multi-layer Buddhist pagoda. Due to its status as a historically protected building, nondestructively identifying the dynamic characteristics of this masonry pagoda to validate the numerical model poses challenges. Therefore, this study verifies the feasibility of using the NExT-ERA method to identify dynamic characteristics and calibrate the numerical model, focusing on the Huilong Pagoda. The resulting dynamic characteristics and numerical modeling outcomes serve as a basis for enhancing the seismic protection of the pagoda.
Scholars have employed various modal identification methods to validate finite element numerical models in further studies on masonry pagodas. Preciado, A [2] utilized empirical equations to calculate the first-order natural frequency of the pagoda. They calibrated the model by adjusting the geometry, material properties, and the interaction of adjacent buildings, followed by a seismic vulnerability assessment based on the model. Wu Xiaoqin et al. [3] employed empirical equations to calculate the first two orders of natural frequencies for the Mafo Temple bottle masonry pagoda, utilized a hierarchical modeling approach to establish the finite element model, and compared the modal analysis results with the calculation results. The comparison revealed that the error of the first two orders’ natural frequencies was less than 7%, validating the finite element model. Subsequently, seismic analyses were conducted based on this validation. Bartoli, G. et al. [4] identified the parameters of the dynamic characteristics of Torre Grossa using the traditional peak-picking (PP) method and compared the experimental results with the modal analysis results, leading to the development of an accurate finite element model for subsequent static analysis of the ancient tower. Some scholars utilized the stochastic subspace identification (SSI) method to identify the dynamic characteristics of masonry towers. Ashayeri I. et al. [5] employed traditional peak-picking methods to ascertain the natural frequencies of eight historical mosques in Kermanshah. Subsequently, they proposed a simple empirical relationship between the natural oscillation of masonry mosques and the material properties of the calibration model. Tassello, A. [6] compared the modal analysis results of the finite element model with experimental results, revealing similar natural frequencies and mode vibration patterns, and discrepancies were observed in higher modes of natural frequencies. Peña, F [7], based on the study by Ramos, Luís F. [8], compared the results of modal analysis for three numerical models of the Qutb Minar masonry tower (i.e., 1. solid model, 2. beam model, and 3. rigid model), and the results show that the natural frequency is the same as the mode shapes, where the natural frequency exhibits higher modes leading to more considerable differences. Cabboi A. et al. [9] utilized data obtained from the continuous dynamic detection of the Saint Vitore Bell Tower to extract its natural frequency employing the SSI Cov method. Subsequently, they discussed the influence of temperature on automatic natural frequency identification. Simultaneously, they employed a regression model based on principal component analysis to address damage detection and localization issues, demonstrating the method’s effectiveness. Altunisik, AC et al. [10] and Nisticò, N et al. [11] extracted the dynamic characteristics of the Zağanos Bastion and an ancient belfry using enhanced frequency domain decomposition (EFDD) and stochastic subspace identification (SSI) methods, respectively. They compared the results of finite element model analyses with experimental results, thereby verifying the accuracy of the finite element model regarding natural frequencies and vibration patterns. However, the identification of dynamic characteristic parameters using algorithms is susceptible to system noise and local vibrations, making it challenging to effectively and efficiently determine the system order to mitigate the impact of disruptive factors and provide supplementary methods for identifying the dynamic characteristics of ancient buildings.
Scholars have employed the NExT-ERA method to extract dynamic characteristic parameters of large-scale geotechnical buildings under natural excitation. Subsequently, based on test conclusions, the feasibility of other methods was verified, yielding superior results, thus demonstrating the maturity and accuracy of the method in system order determination. For instance, Wan Ling et al. [12] confirmed the viability of the NExT-ERA method in identifying the overall dynamic characteristic parameters of ship hull structures by comparing model analysis results with experimental findings, and the conclusions affirmed the method’s effectiveness in analyzing complex ship hull model structures. Xu Yan et al. [13] extracted dynamic characteristic parameters of bridges using the NExT-ERA method, and they verified the enhanced version of the sparse component analysis method proposed in their paper. Abdelbarr, MH et al. [14] utilized the NExT-ERA method to identify modal characteristics of ultra-high-rise office buildings, verified the accuracy of the sub-structure method proposed in the nonparametric identification method outlined in their paper, and facilitated the practical application of the method to structural health inspections of ultra-high-rise office buildings. Guo Zengwei et al. [15] extracted modal characteristics of suspension bridges using the NExT-ERA method, examined key parameters in NExT-ERA, and explored the relationship between the identification frequency damping ratio and wind speed based on data from the health inspection system. However, most existing research focuses on identifying parameters of dynamic characteristics in large-scale geotechnical buildings, with less attention given to the dynamic characteristics of ancient buildings. It is imperative to strengthen research in this area to better inform the conservation efforts of ancient structures.
This study focuses on the Huilong Pagoda in Yongzhou City, Hunan Province. In situ dynamic characteristic testing experiments were conducted to identify the dynamic parameters of the ancient pagoda under natural excitation using the SSI and NExT-ERA methods. The ancient pagoda’s first three natural frequencies, vibration modes, and damping ratios were obtained. A comparison of the identification results from both methods verified the feasibility of using the NExT-ERA method for dynamic parameter identification of ancient masonry pagodas. Simultaneously, a macroscopic numerical model of the ancient pagoda structure was developed using the finite element analysis software ANSYS 2021 R1, from which natural frequencies and modes were derived, and a comparison was undertaken with in situ testing results for the calibration of the numerical model of the Huilong Pagoda. These dynamic characteristics and the calibrated numerical model serve as a basis and reference for further seismic response time history analysis and seismic research on the Huilong Pagoda.

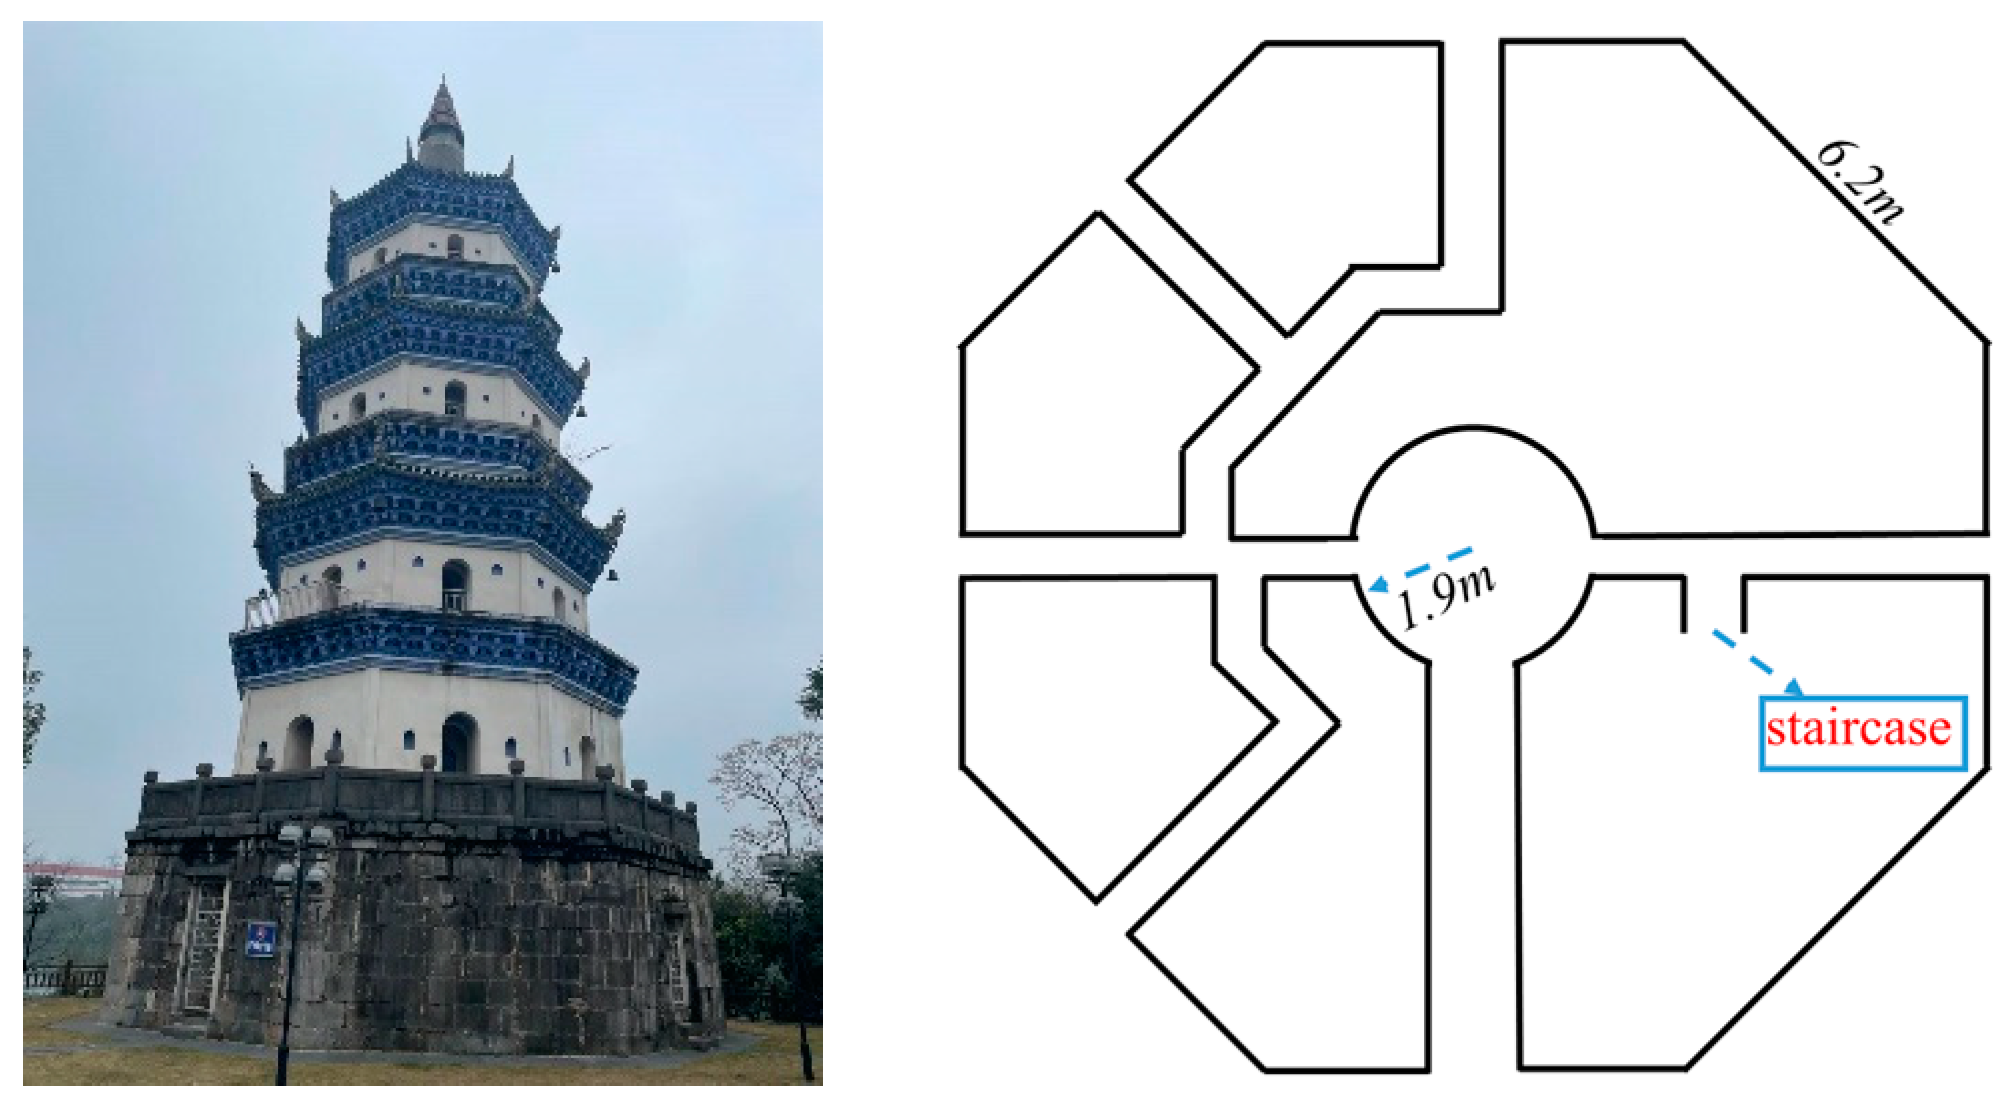
2. Structure Overview

The Huilong Pagoda is an ancient masonry pagoda situated in Yongzhou City, Hunan Province, China. Constructed during the Wanli period of the Ming Dynasty (1584), the pagoda features an octagonal design. The first floor has bluestone bars, while the second to sixth floors consist of masonry structures, and the second, fourth, and sixth floors feature flat seats, while the third and fifth floors are adorned with waist eaves. Most floors feature solid interiors, with space reserved only in the passageway and center platform areas. Wall alcoves accommodate Buddhist niches, resulting in seven floors (although the exterior appears as six floors). The Huilong Pagoda was designated twice as a provincial cultural relics protection unit in 1959 and 1983, owing to its distinctive structural features and historical and cultural significance. In 2013, it was included in the seventh batch of national critical cultural relics protection units, and the actual diagram and first floor plan of Huilong Pagoda are shown in Figure 1.

3. Measurement of Dynamic Characteristics

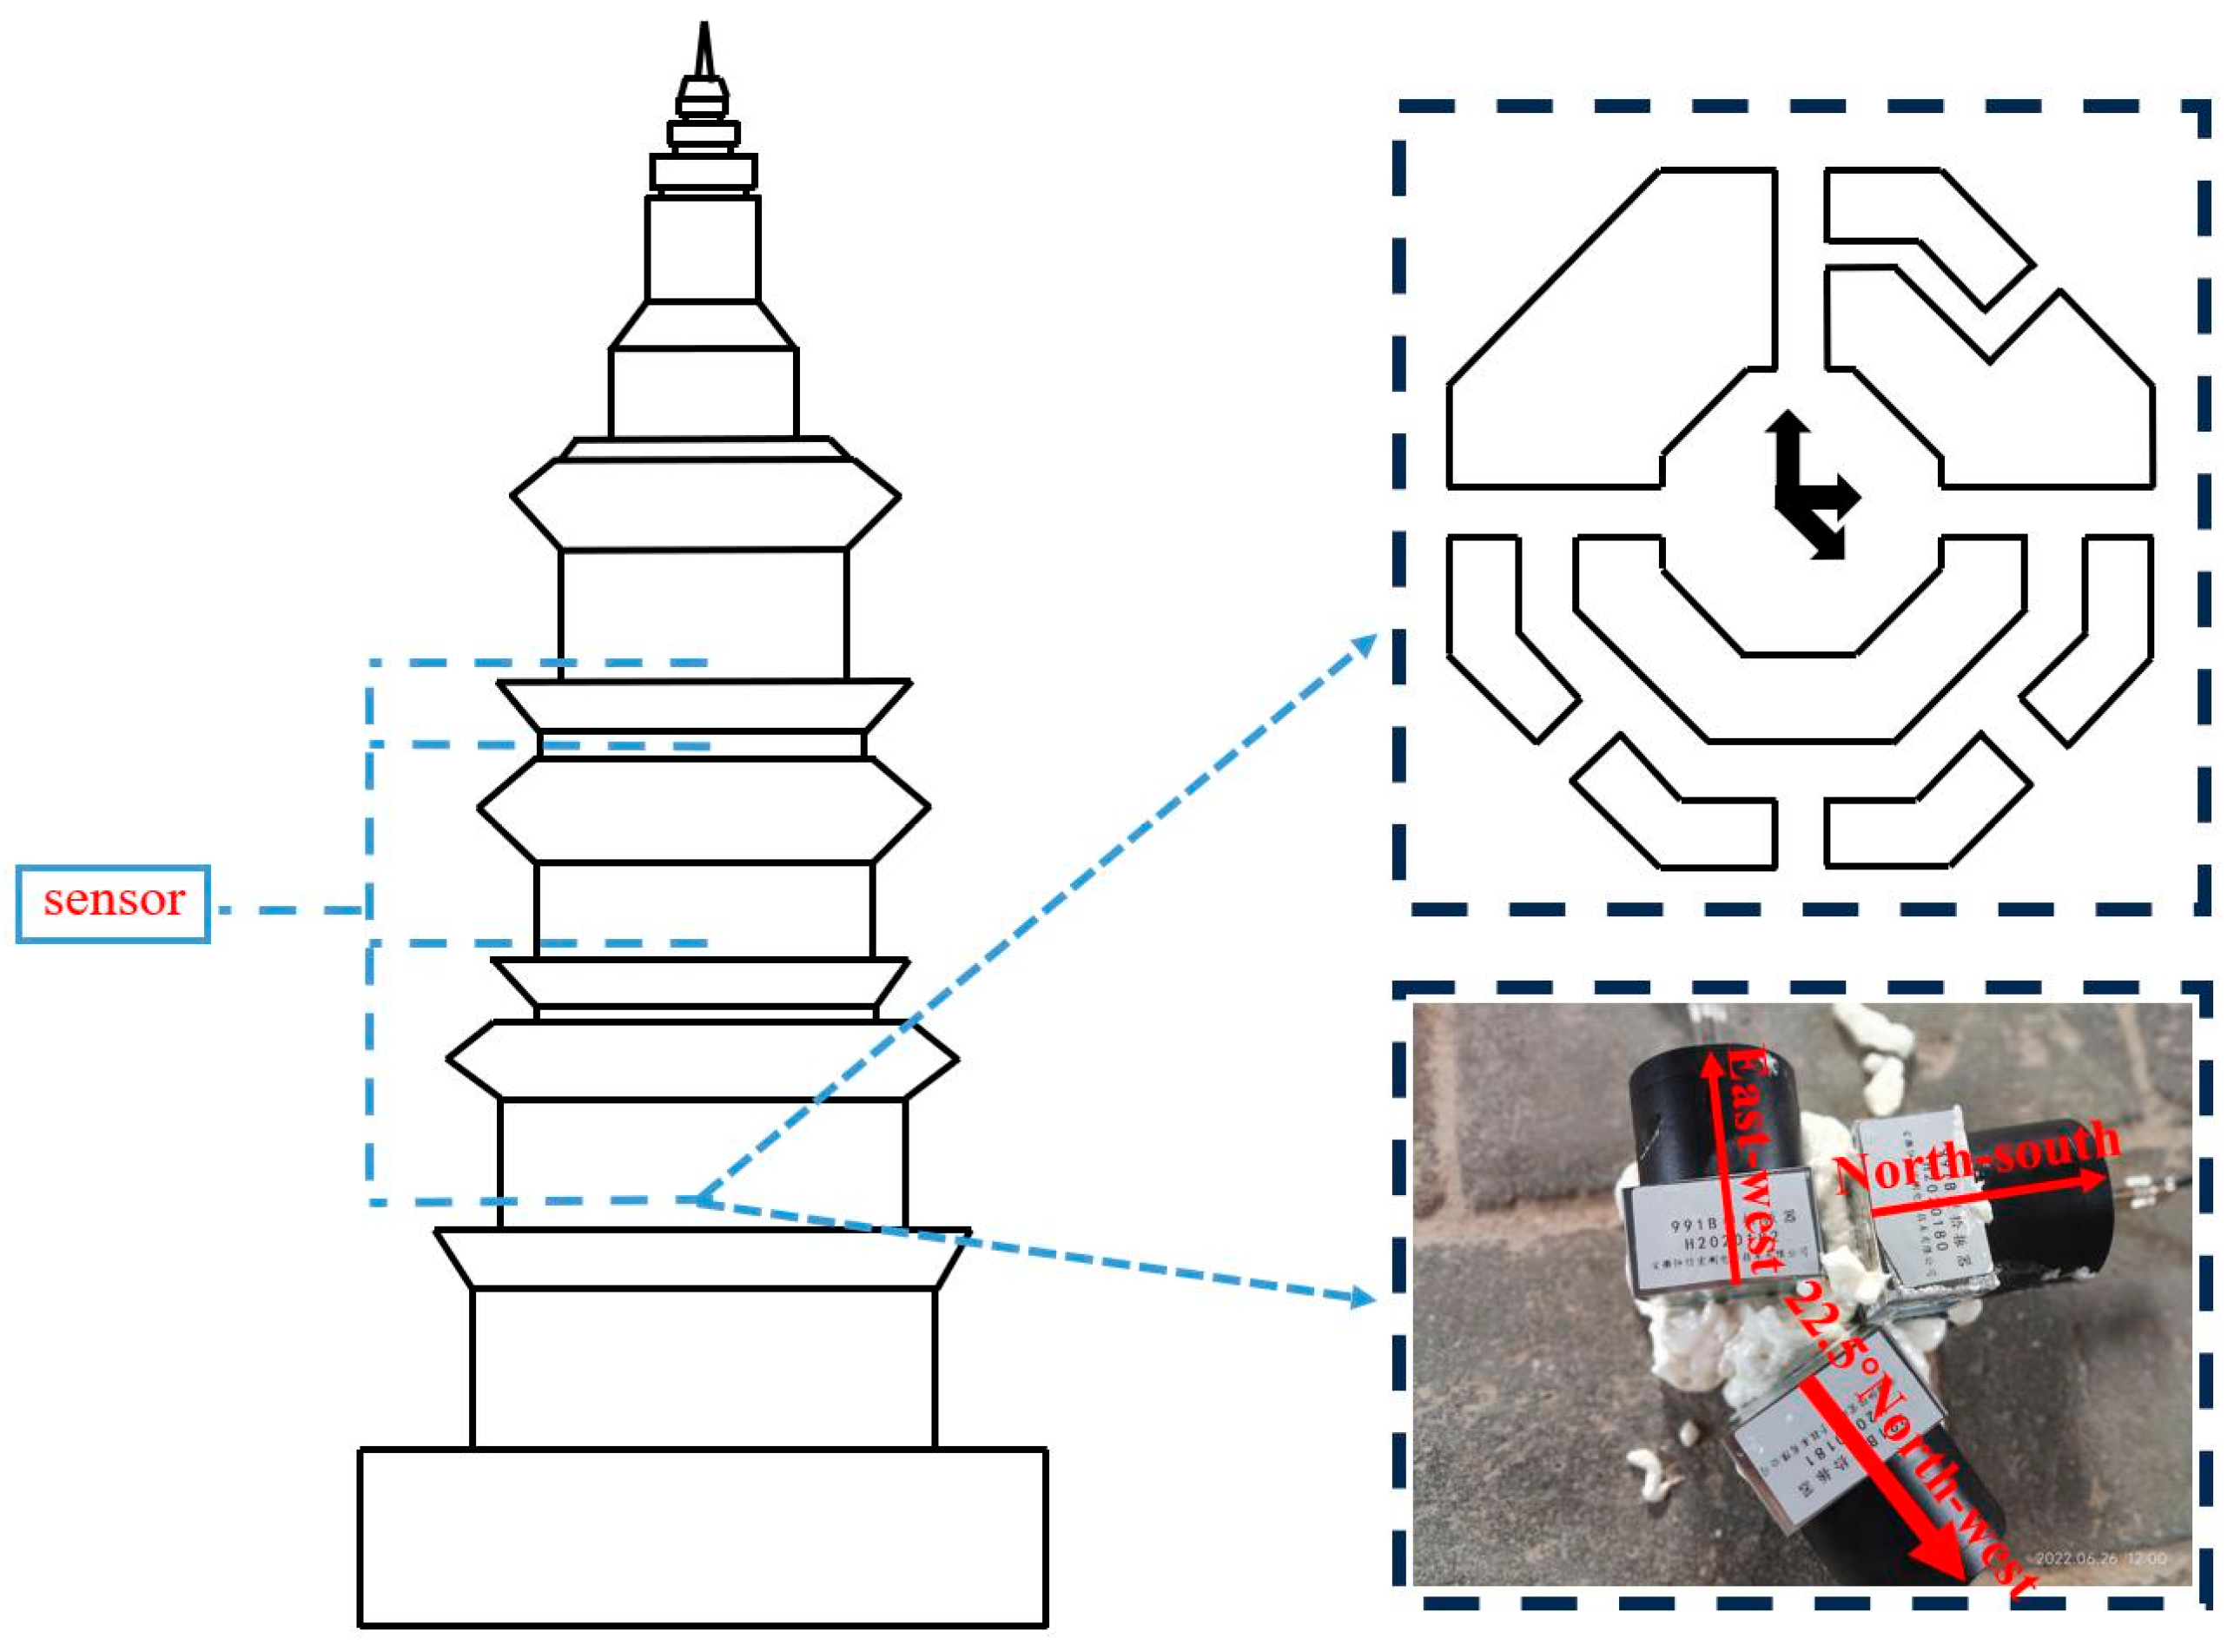
3.1. Sensor Arrangement

To preserve the structural integrity of the ancient pagoda, vibration response signals were collected from the third to sixth floors under natural excitation for dynamic characterization research. Signal acquisition was conducted using uT34 series dynamic signal acquisition equipment and 991B acceleration sensors, and the data acquisition instrument was manufactured by uTekL company. In contrast, the 991B accelerometer was manufactured by HXHC company. During the sampling process, the sensor was set to level 1 (i.e., acceleration level), with a sampling frequency range set to 128 Hz, and the total number of data points collected at each measurement point was 230,400.
Considering the overall structure of the ancient pagoda, which is approximately a regular octagonal symmetrical structure, and the minimal vibration response of its lower floors due to their solid structure, measurement points were selected in the central platform area of the third to sixth floors. Taking into account the distinction between the strong and weak axes of the pagoda, a 991B acceleration sensor was fixed in three directions using foam adhesive: east–west (X), north–south (Y), and 22.5 degrees northwest (N). A total of 12 testing sensors were positioned throughout the structure, and under environmental excitation, dynamic response time history signals of the third to sixth floors were collected simultaneously. The arrangement details of the sensors are illustrated in Figure 2.

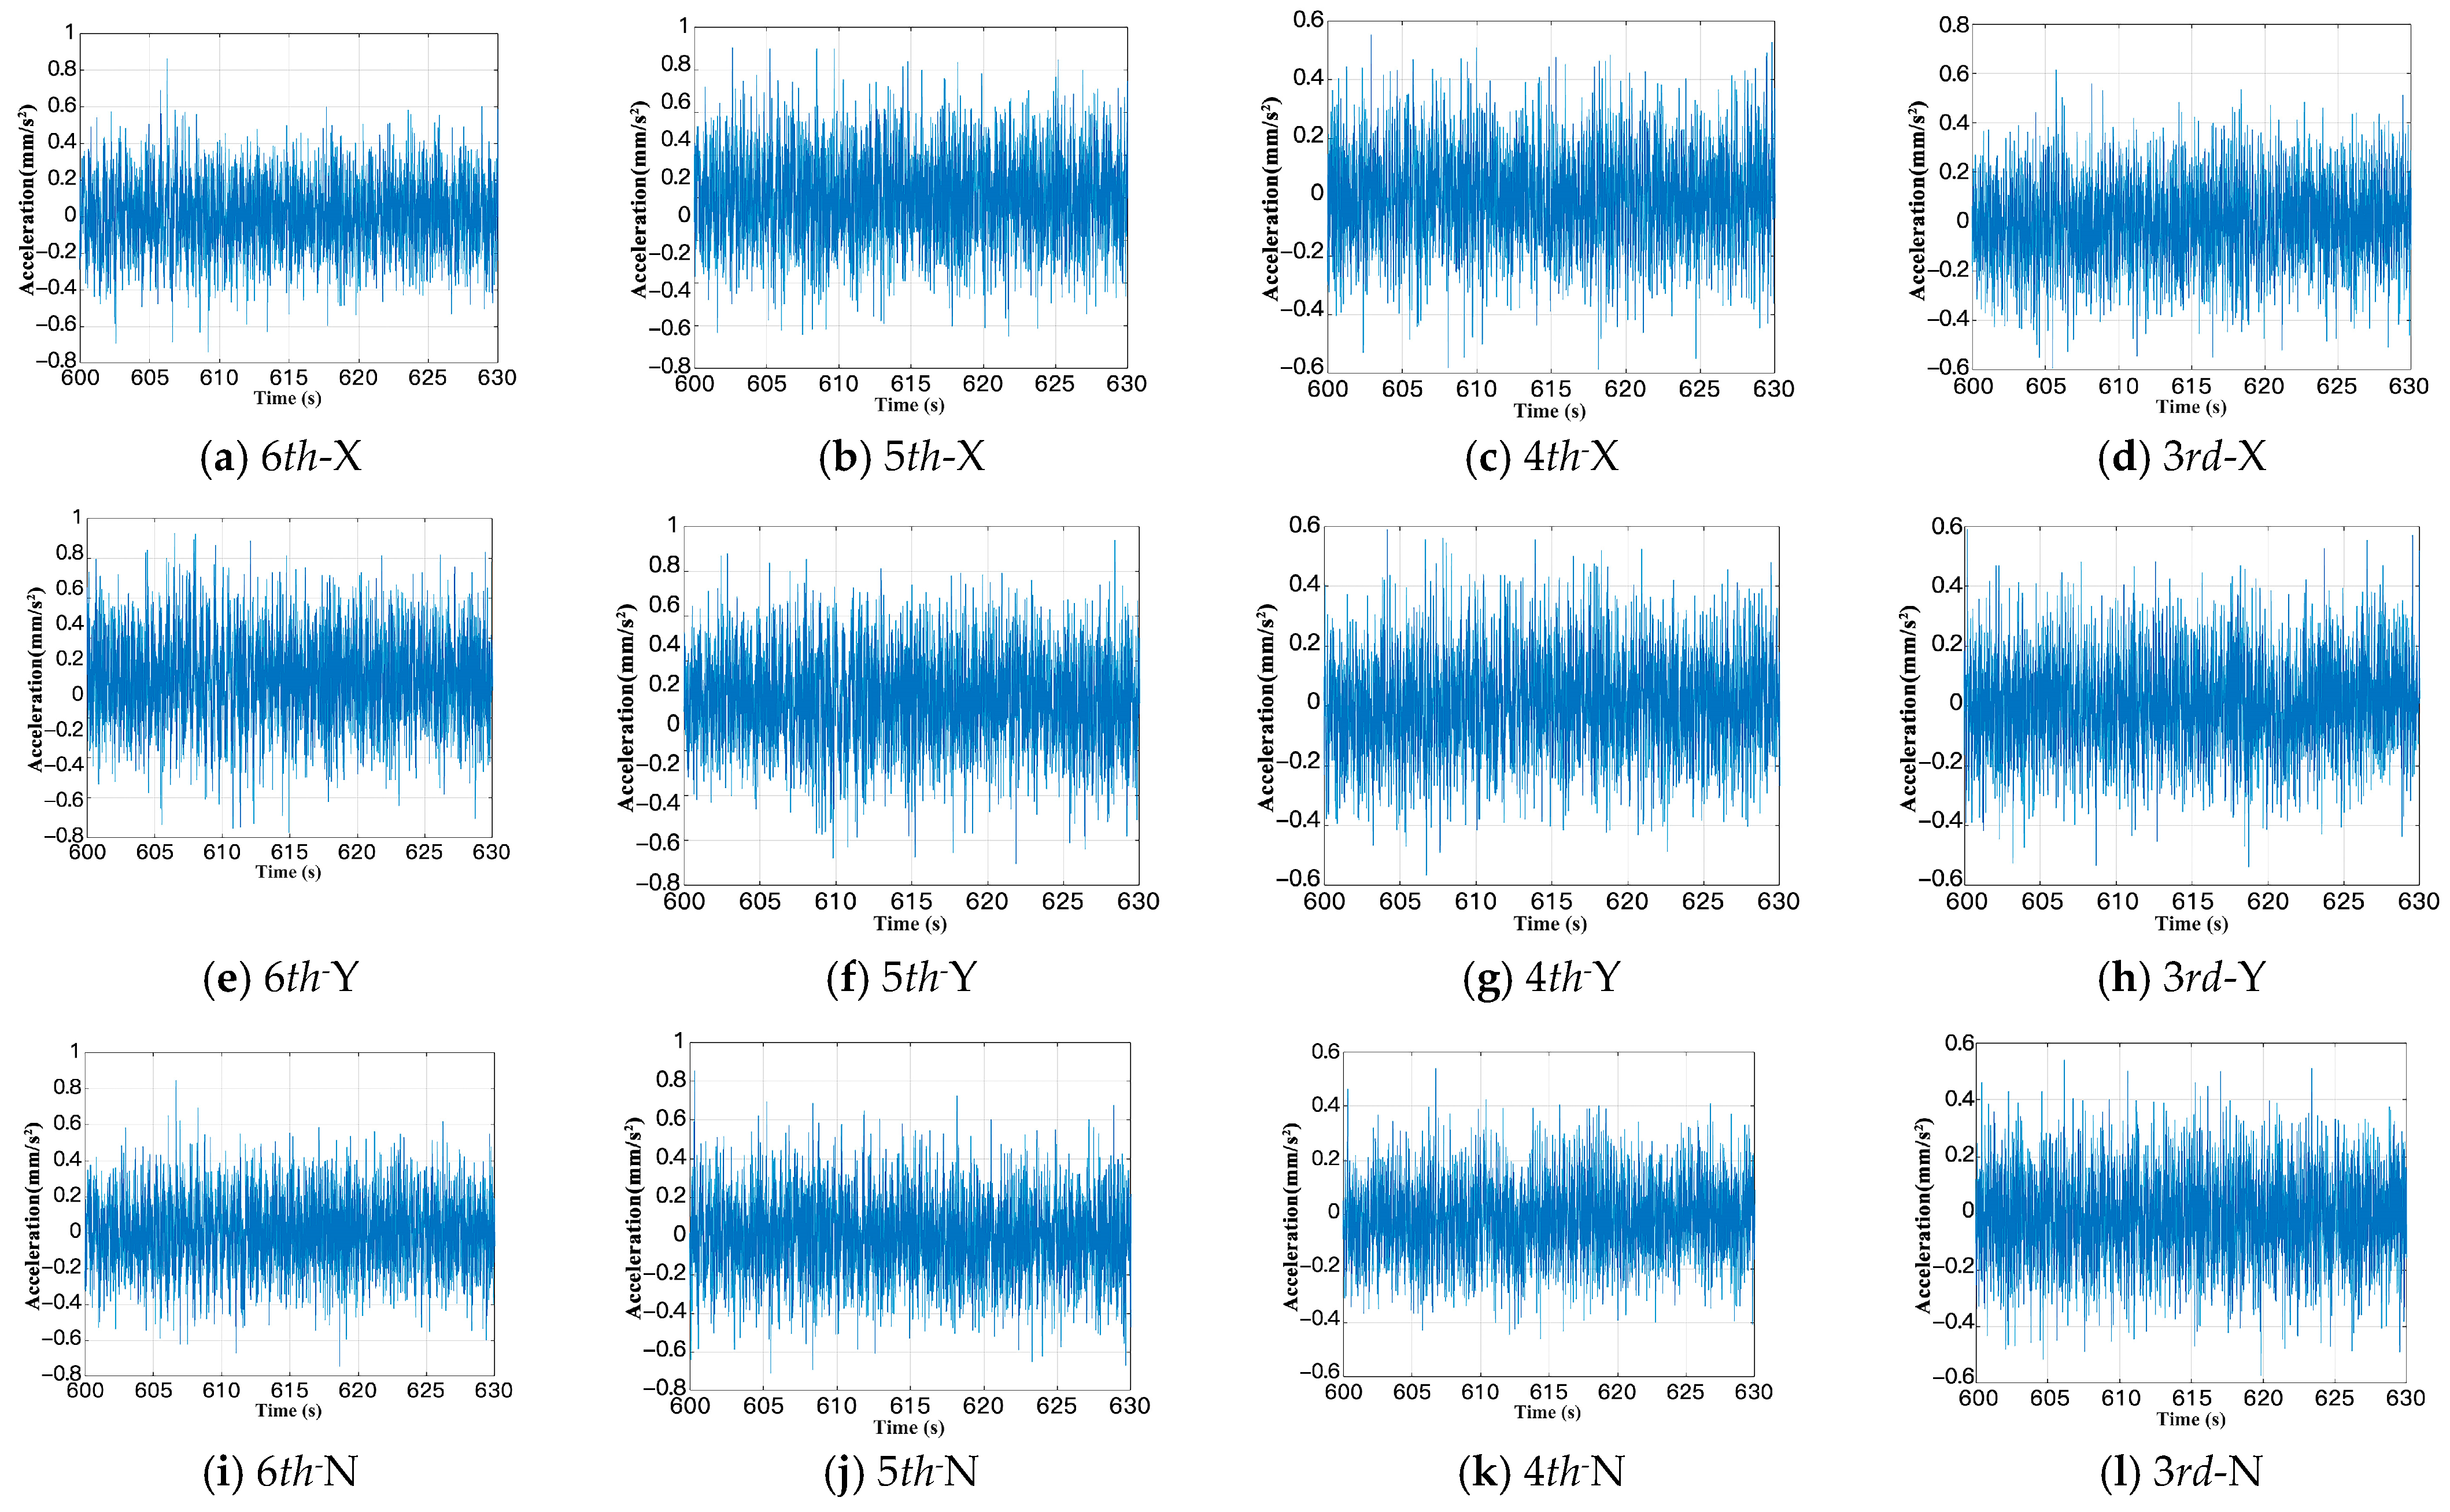
3.2. Time History Analysis

The time-range response of the acceleration of 3~6 layers recorded by the 991B accelerometer under natural excitation is shown in Figure 3. A 20 min segment of the vibration signal was selected as a sample, with a time interval of 1 min. Subsequently, the peak and root mean square of the advection acceleration for the third to sixth layers were calculated, as depicted in Figure 4. The results indicate that the peak acceleration of the fifth layer, exhibiting a significant vibration response in the X-, Y-, and N-directions, is 0.87 mm/s2, 0.83 mm/s2, and 0.82 mm/s2, respectively. Furthermore, the root means square trends of the X and N directions are similar, while the trend of the root mean square in the Y direction is opposite to that of the other directions. For future research, we will design experiments to investigate the impact of structural stiffness on peak acceleration and root mean square values under low wind speeds. As vibration in the X-direction is predominant, subsequent analysis will focus on the dynamic characteristics in both the X-direction and its perpendicular counterpart, the Y-direction.

3.3. Acceleration Self Power Spectral Density Function

The average periodogram method captures the mean statistical properties and is a key approach for examining frequency domain characteristics in random vibration analysis. In this study, a 50% overlap is applied to the data segments, and a Hamming window function is employed to window each segment [16]. The self-power spectral density function S x x f is expressed as follows:
S x x f = 1 M N F F T i = 1 M X i f X i * f
where X i f is the Fourier transform of the i t h data segment of the acceleration signal; X i * f is the conjugate complex of X i f ; M is the average number of signal segments; N F T T is the number of points used to calculate the Fourier transform.
Using the average periodogram method, the self-power spectral characteristics of the measured data samples of Huilong Pagoda are obtained in the X- and Y-directions. To better analyze the measured acceleration power spectral density function of different floors, the Y-axis is represented in logarithmic form, where S x x f denotes the i t h layer acceleration self-power spectral density function. The results are depicted in Figure 5, and determining the first three modal frequencies requires integration with the NExT-ERA method for assessment. As illustrated in Figure 5, the first three natural frequencies of the X-direction of Huilong Pagoda in logarithmic coordinates are 1.91, 6.70, and 21.36 Hz, respectively, while those in the Y-direction are 1.993, 7.424, and 21.36 Hz, respectively. This reveals that the peak frequency value in the X-direction acceleration power spectrum of Huilong Pagoda under environmental excitation is notably smaller than that in the Y-direction. This result supports the subsequent analysis.

4. Modal Identification of Huilong Pagoda
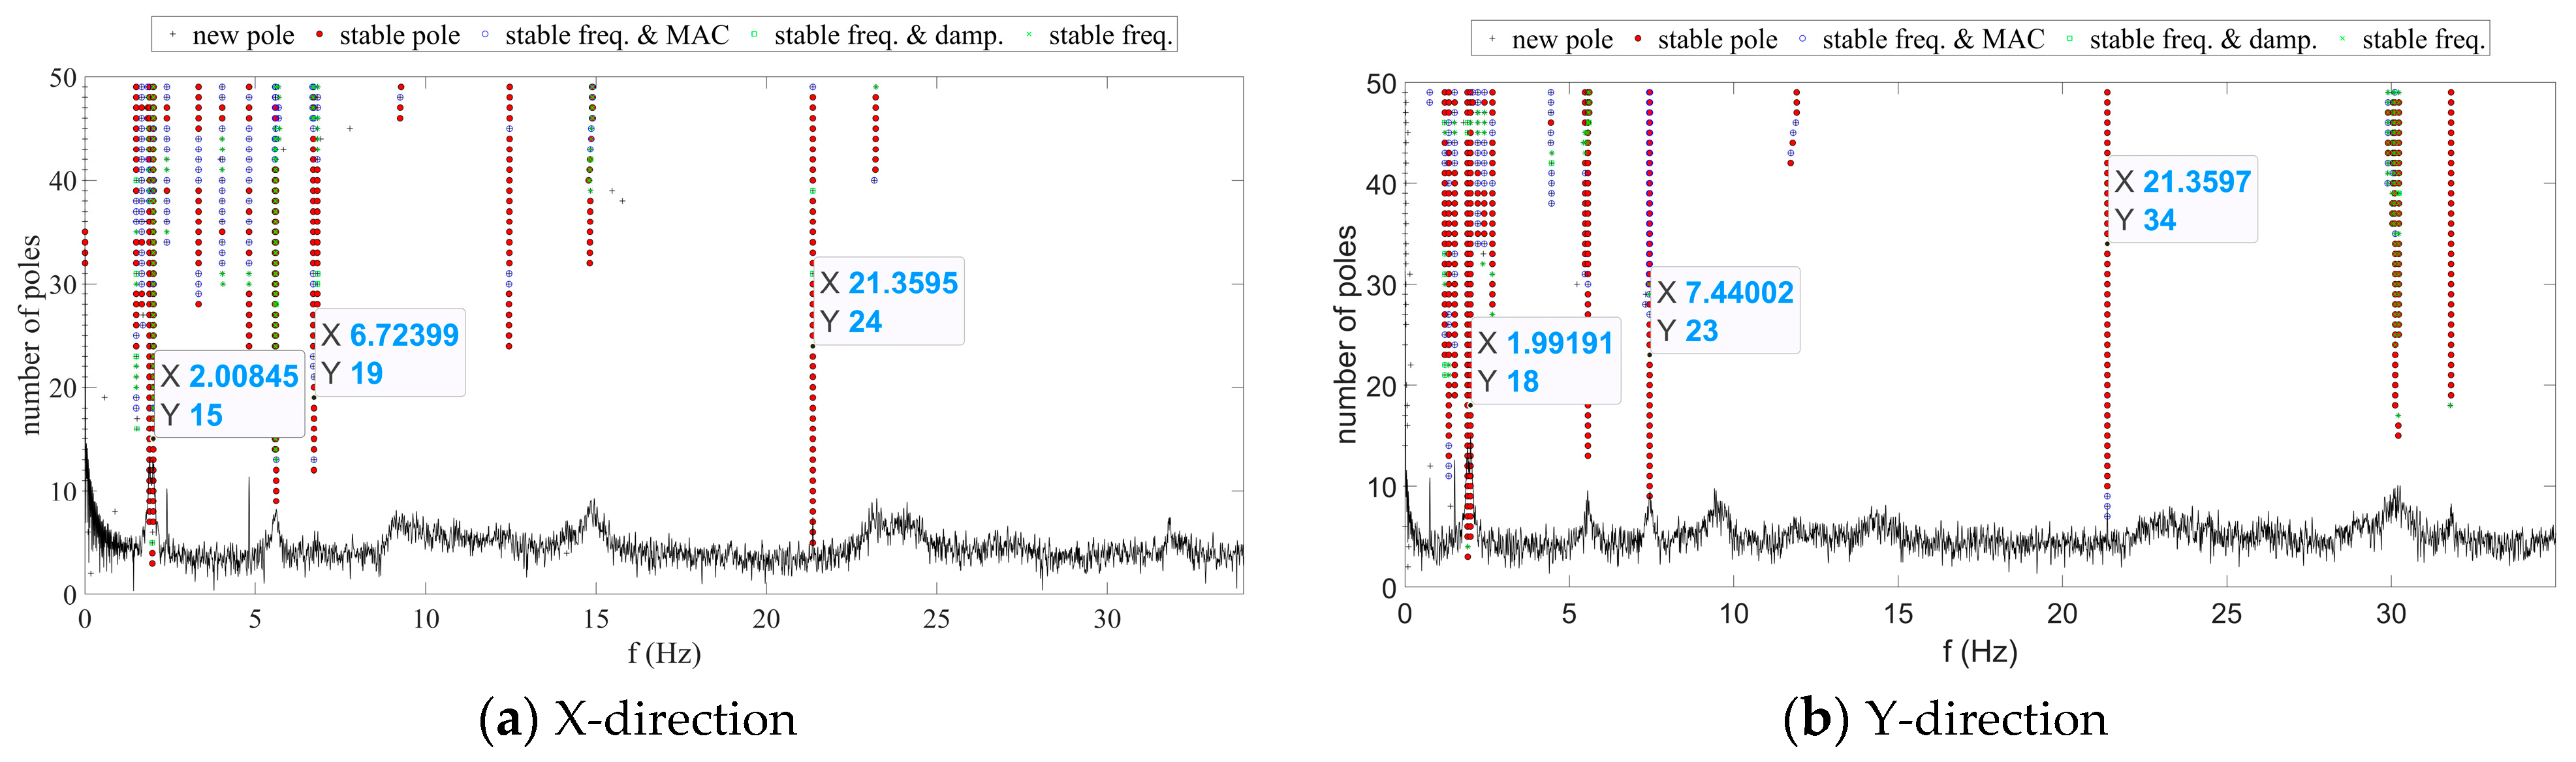
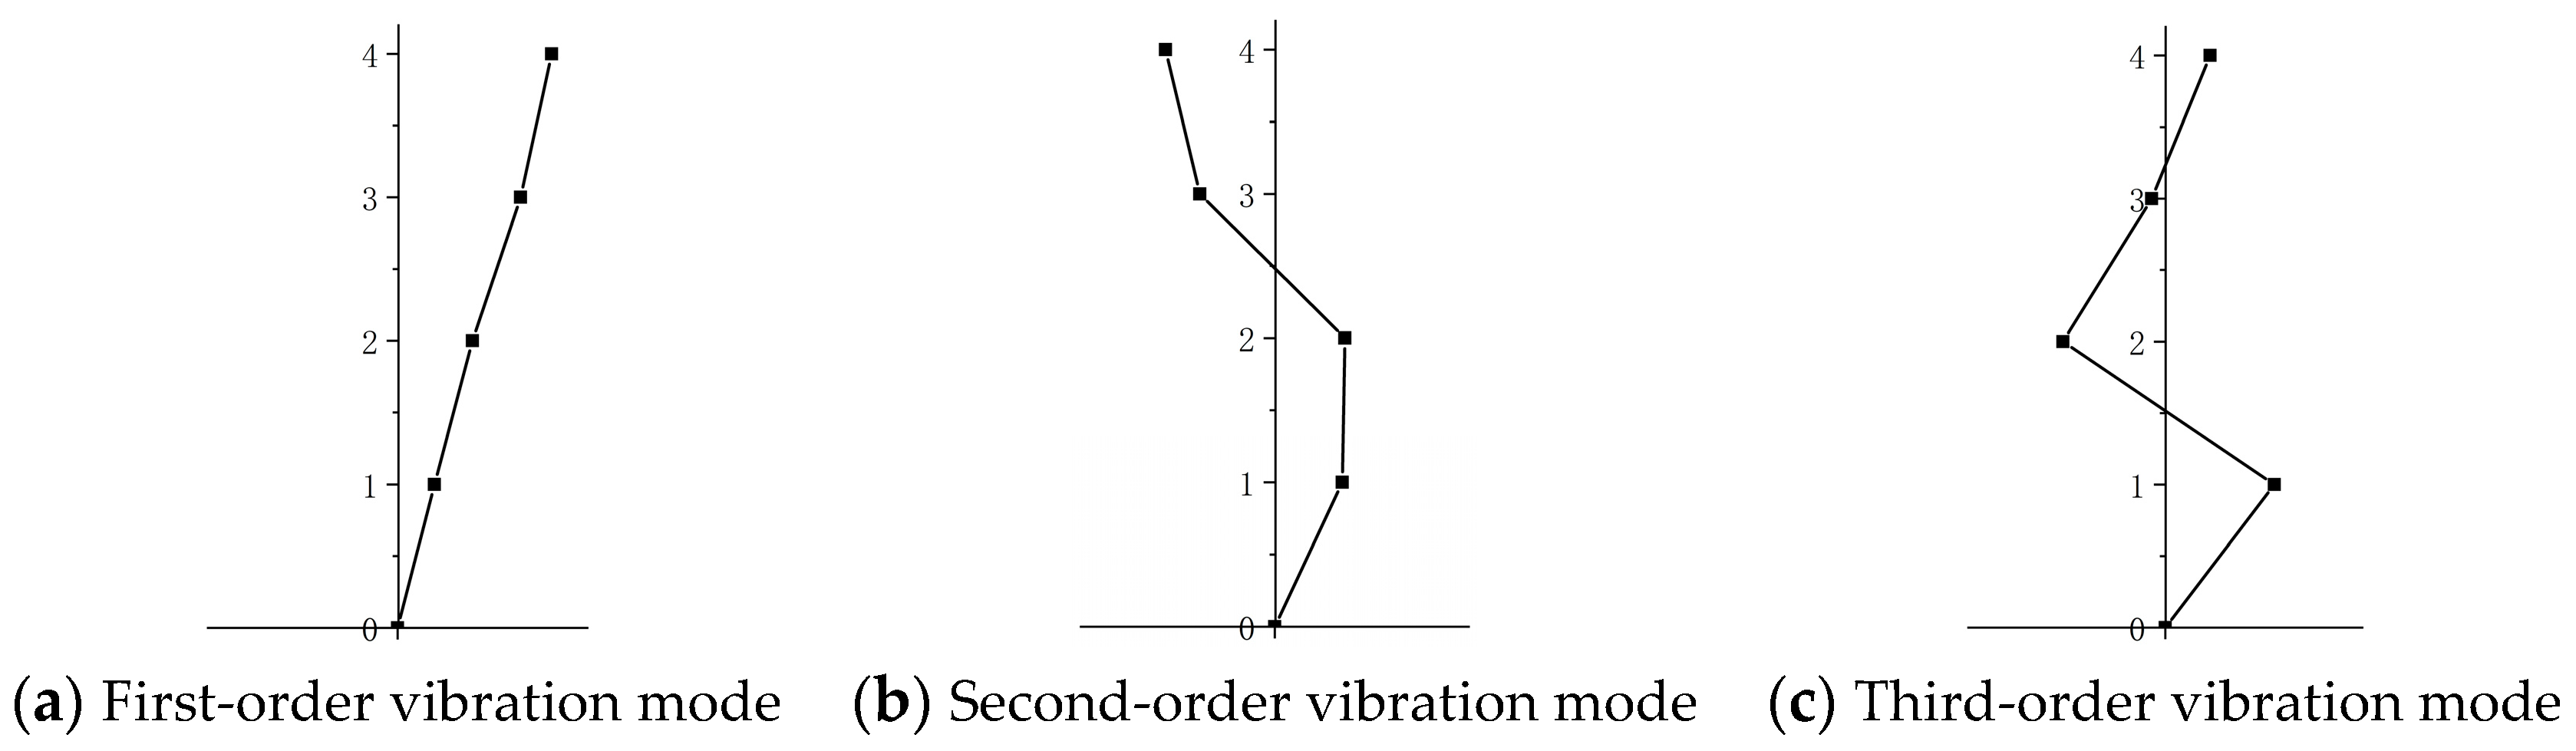
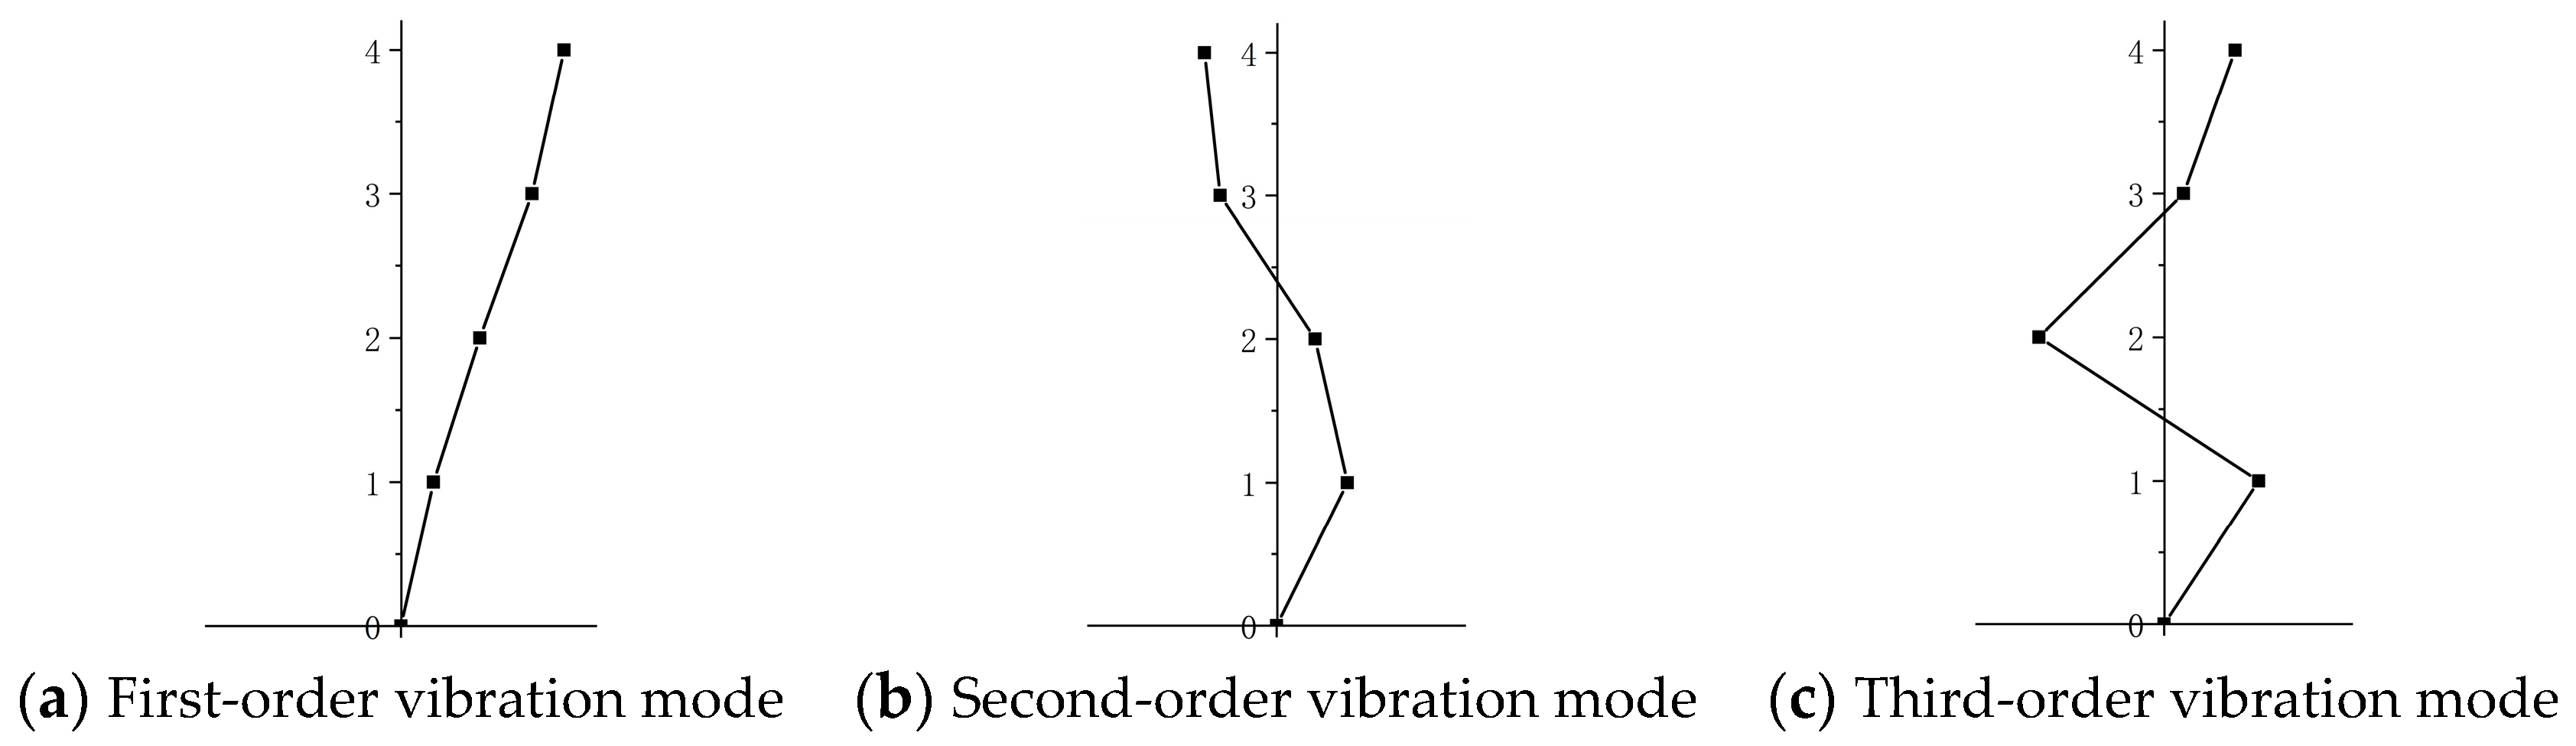
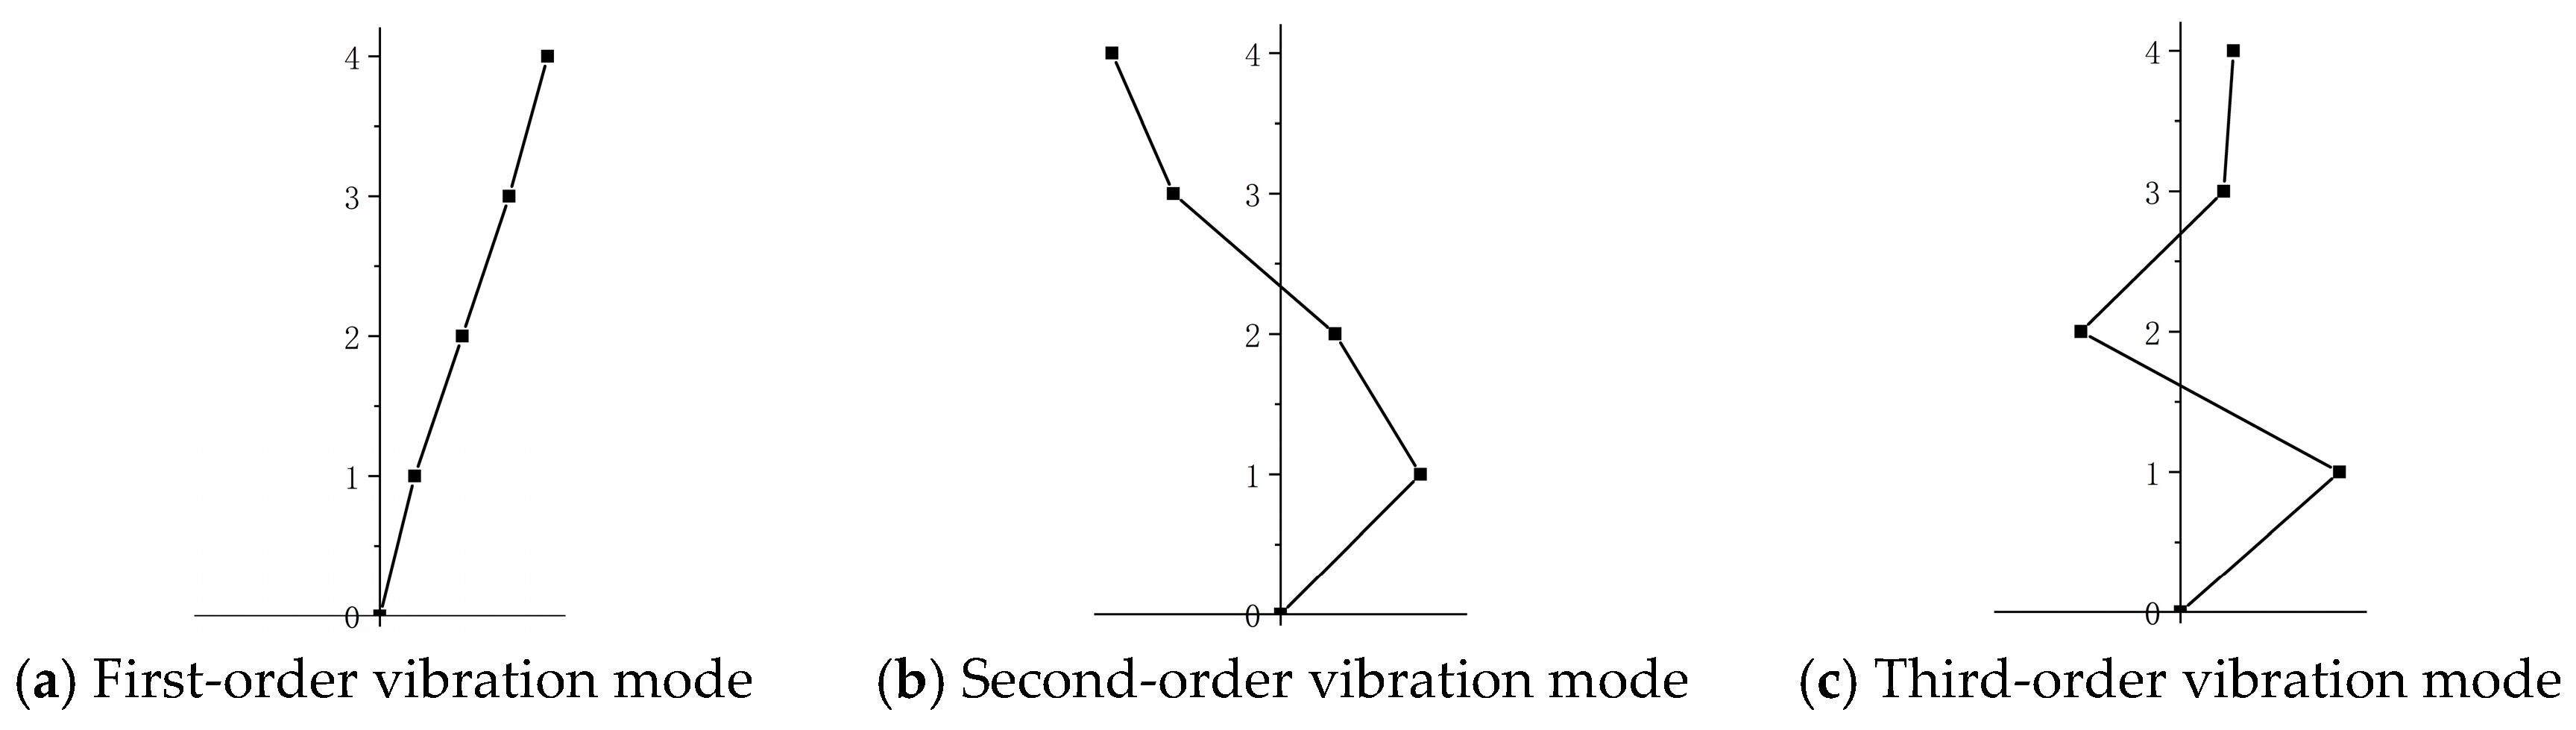
4.1. SSI Method

Random subspace modal identification is a mainstream method used in modal parameter identification. It identifies the state space matrix of the discretized system through matrix QR decomposition and singular value decomposition (SVD), facilitating dynamic characteristic calculation and analysis. This study took the horizontal acceleration vibration response signals of the third to sixth floors of the Huilong Pagoda in the X- and Y-directions as samples. Stability diagrams were computed using MATLAB R2022a and are illustrated in Figure 6. These stability diagrams aid in distinguishing between genuine and spurious modes of the structure and determining the first three orders of natural frequencies and damping, facilitating the computation of the corresponding modal vibration shapes. The first three vibration modes identified by the SSI method are shown in Figure 7 and Figure 8.
Table 1 presents the first three natural frequencies in the X-direction for the Huilong Pagoda: 2.009 Hz, 6.724 Hz, and 21.360 Hz, with a maximum damping ratio of 2.13%. The first three natural frequencies in the Y-direction are 1.992 Hz, 7.440 Hz, and 21.360 Hz, with a maximum damping ratio of 3.06%. A comparison of modal damping for each order reveals a decreasing trend with increasing vibration mode order, and the damping in the Y-direction is more significant than that in the X-direction.

4.2. NExT-ERA Method

The Natural Excitation Technique (NExT), proposed by James et al. [17] in 1993, takes the autocorrelation function and the cross-correlation function of the output data of a system subjected to Gaussian white noise as the impulse response and expresses the correlation function, R i j τ , between the responses at nodes i and j according to the time lag τ, as:
R i j τ = r = 1 N ϕ i r Q j r m r ω d r e x p ζ r ω n r τ s i n ω d r τ + θ r
ω d r = ω n r 1 ζ r 2
where the superscript r is a particular mode from a total of N modes, ϕ i r is the i t h ordinate of the r t h mode shape, m r is the r t h modal mass, Q j r is a constant associated with the response at node j , ζ r and ω n r are r t h mode damping ratio and natural frequency, respectively, ω d r is the r t h mode damped natural frequency, and θ r is the phase angle associated with the r t h modal response.
The Eigen System Realization Algorithm (ERA) was proposed by Juang and Pappa et al. [18] in 1985 to improve controllability and observability by employing the impulse response (Markov parameter) of the system without considering the external force term. The equations of motion in the first-order difference equation can be expressed in discrete state space equation format:
x i + 1 = A x i + B u i
y i = C x i + D u i
where x i is the state vector at the i t h time step, u i is the input vector at r locations, and y i is the output vector at N locations on the structure (nodes). Matrices [A, B, C, and D] are called the discretized state, input, output, and feed-through matrices.
James et al. [17] simulated the impulse response of a system induced by a white noise input load using autocorrelation and mutual correlation functions for the time lag. They used the singular value decomposition (SVD) of the Hankel matrix to estimate the transition states and the output matrix:
H k 1 = y k y k + 1 y k + 1 y k + 2 y k + q 1 y k + q y k + p 1 y k + p y k + p + q 2
The A 1 , B 1 , G matrix is obtained through SVD:
A 1 =   1 2 U T H 1 V   1 2  
B 1 =   1 2 V T E L
G = E M T U   1 2  
The eigenvalues λ and eigenvectors v of the system state coefficients matrix A 1 are computed through Equation (9):
v 1 A 1 v = Z = d i a g z 1 , z 2 , , z n
The diagonal elements of Z can be represented as:
z i = e x p λ i τ i = 1,2 , , n
The complex parametric formulation between the transform of Z and the Laplace transform is expressed as:
s i = 1 τ l n z i = λ i
where τ is the sampling period. The dynamic characteristic parameters can be derived from the following equations:
ω i = I m s i
ξ i = R e s i / s i
ψ = G ψ
where R e and I m are the real and imaginary parts of the complex vector, respectively.
Drawing from the aforementioned theory, measured horizontal acceleration response data in the X- and Y-directions from various floors were used as samples. The sixth floor was designated as the reference floor, and the inter-correlation function of each floor was calculated using MATLAB R2022a, as illustrated in Figure 9. Next, the NExT-ERA automatic program was employed to ascertain the dynamic characteristics and parameters of the Huilong Pagoda, and its genuine model was ultimately identified based on the stability diagram integrating PSD and power spectral density.
Utilizing the principles of the NExT-ERA method, a program [19] was developed in MATLAB to ascertain the dynamic characteristics. The aforementioned mutual correlation function serves as input data, with the automatic program parameters configured as follows: a convergence threshold frequency of 0.05, a modal confidence criterion value of 0.95, and an absolute deviation of the damping ratio of adjacent orders set at 0.5. The stability diagrams of power spectral density (PSD) are shown in Figure 6 above. The PSD diagram shows that the first three natural frequencies have many stable points, ensuring accurate identification of power characteristic parameters. The first three vibration modes of X and Y are shown in Figure 10 and Figure 11.
Analysis of Figure 10 and Figure 11 reveal that in the X-direction, the first three natural frequencies of the Huilong Pagoda are 1.937 Hz, 6.802 Hz, and 21.361 Hz, with a maximum damping ratio of 2.22%. Similarly, in the Y-direction, the first three natural frequencies are 1.935 Hz, 7.439 Hz, and 21.398 Hz, with a maximum damping ratio of 2.72%. Results demonstrate that the damping of higher-order vibration patterns is lower, and the damping range of the overall structure is between 0.11% and 2.72%.

4.3. Natural Frequency Comparison

This study utilized SSI and NExT-ERA to identify dynamic characteristics and obtain the first three orders of natural frequencies and vibration shapes in the X- and Y-directions. The results reveal that the vibration patterns obtained by both methods are largely consistent, with the first three orders of vibration patterns corresponding to the east–west and north–south directions of translation. The comparison of natural frequencies is shown in Table 2.
Table 2 indicates that the relative errors of each direction in the first three orders of natural frequencies obtained by the two methods are minimal, with a maximum error of 3.56%. This underscores the validity and accuracy of the NExT-ERA method in identifying dynamic characteristics. Furthermore, comparing the magnitudes of the natural frequencies reveals that the stiffness in the Y-direction exceeds that in the X-direction.

4.4. Damping Ratio Comparison

Table 3 compares the modal damping ratios derived from SSI and NExT-ERA calculations. The results reveal minimal differences in the damping of each mode. To ensure the reliability of the damping results, the average damping of the two calculation methods is used as the damping of the Huilong Pagoda, so it is determined that the overall structure exhibits damping ranging from 0.21% to 2.89%, and the damping ratios of the X- and Y-directions in the third order are significantly lower than those in the first two orders, suggesting that the third-order mode of the Huilong Pagoda experiences strong excitation; in contrast, the first two vibration modes undergo weak excitation [20].

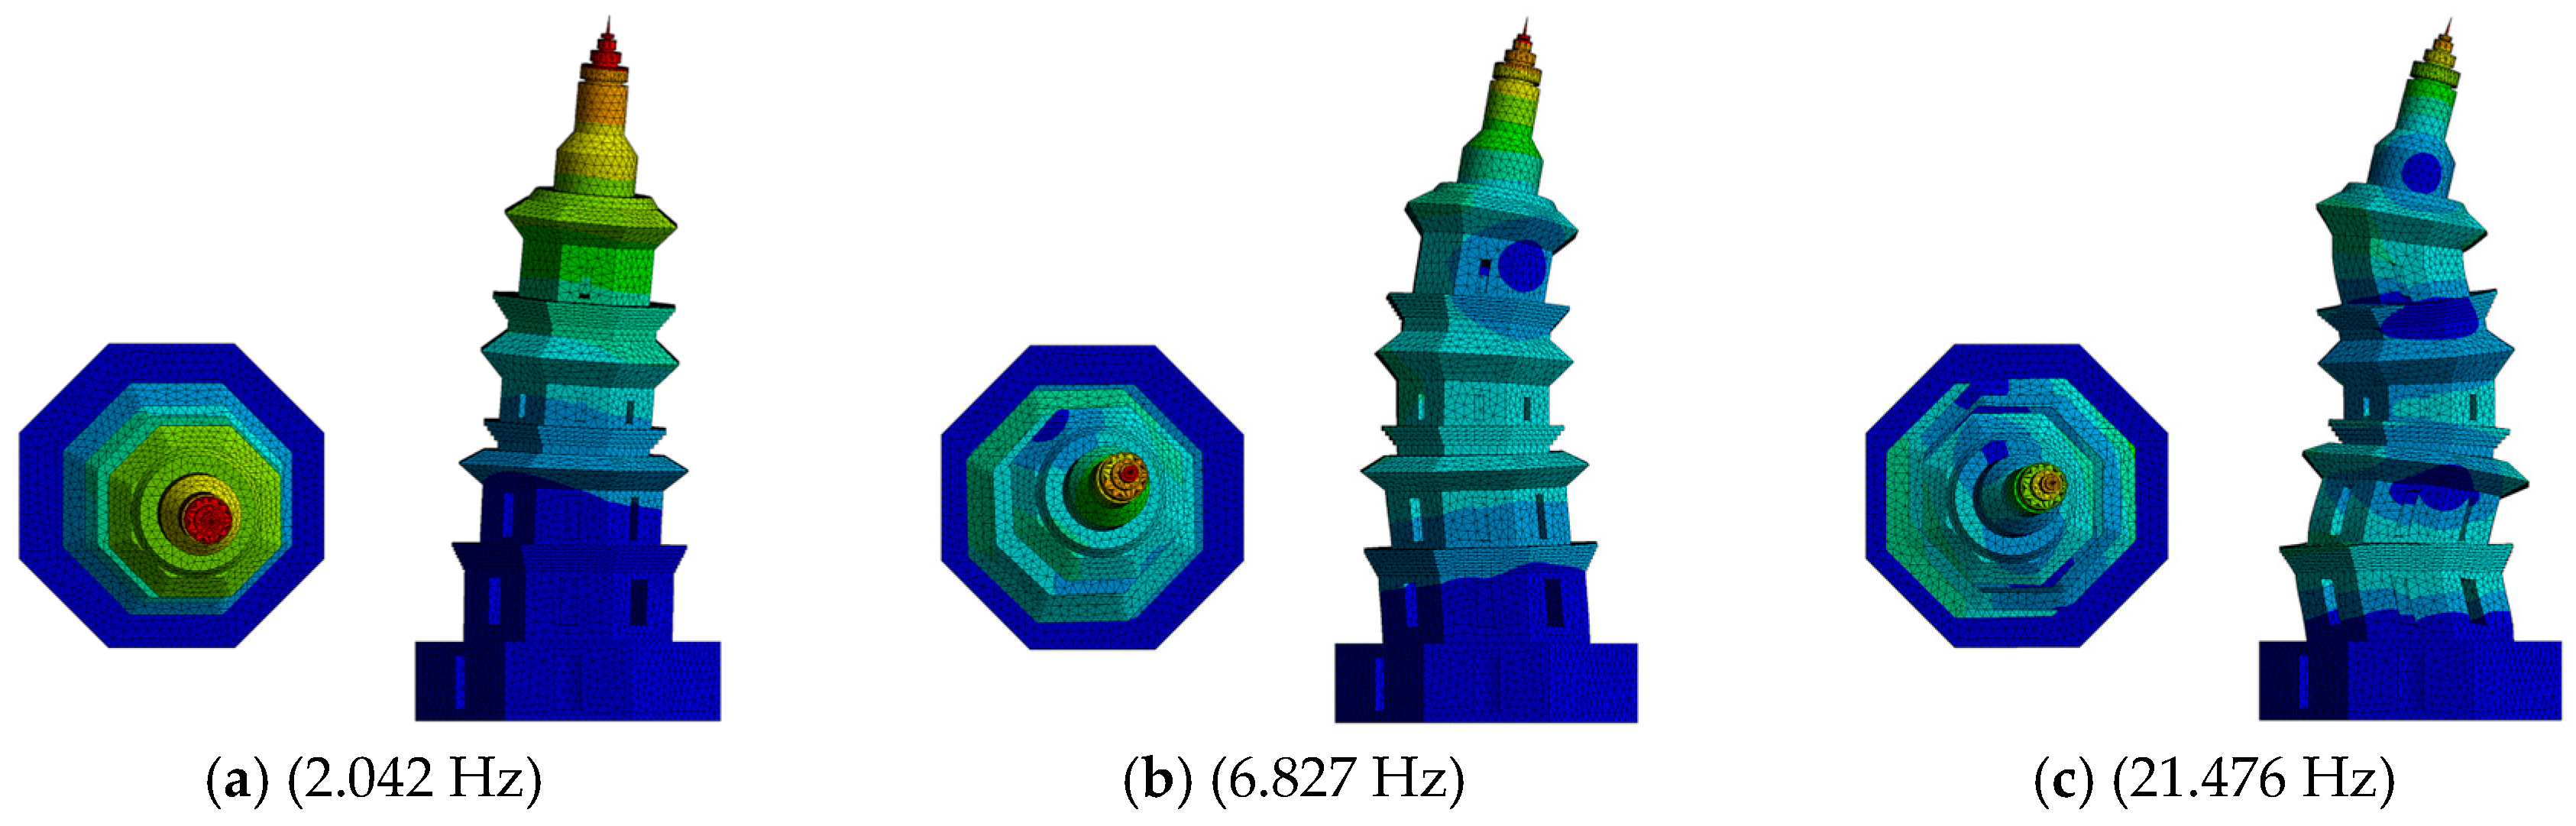
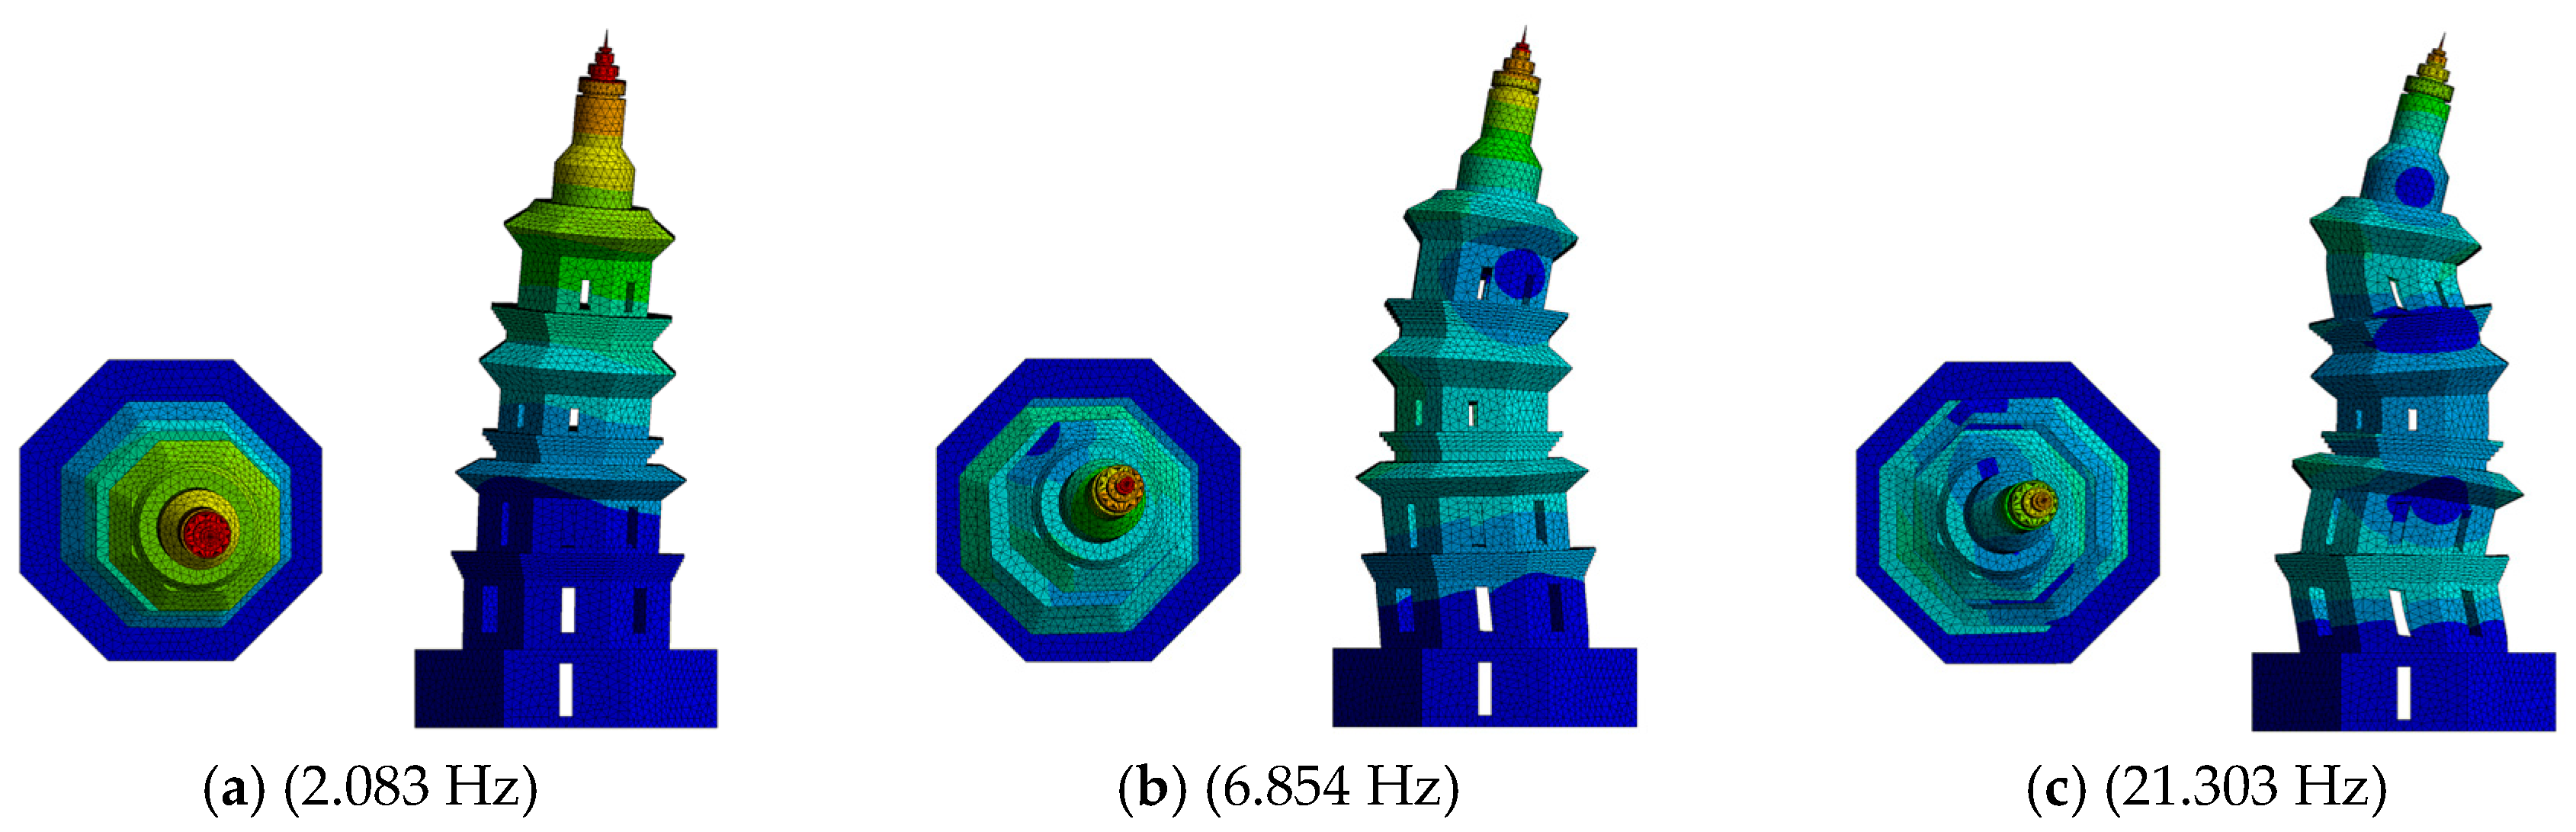
5. Finite Element Modal Analysis

5.1. Finite Element Modal

To ensure accurate dynamic characteristics research without affecting structural stiffness and improve the efficiency of finite element analysis, the Huilong Pagoda was simplified. The actual view of the Huilong Pagoda (Figure 1) was compared with the macroscopic numerical model and the first-floor plan (Figure 12). The additional guardrail on the second floor was removed (as shown in Figure 12 ①), and the polygonal eaves structure on each floor was simplified into a polygonal prism platform structure (as shown in Figure 12 ②). The corner beasts on each floor were removed (as shown in Figure 12 ③). The modeling of stairs (as shown in Figure 12 ④) was ignored, and the stairs and cement joints were not considered. The vertical layered modeling method was used to establish the model. Preliminary modal analysis was conducted on the numerical model using ANSYS. Considering that tetrahedral mesh elements are good at adapting to complex geometric features, a ten-node tetrahedral element (C3D10) was used to mesh the entire finite element model, with a single mesh size set to 400 mm, resulting in a total of 177,382 element meshes. The finite element mesh model is shown in Figure 12.
After on-site investigation, the main types of masonry in the ancient pagoda are Ming Dynasty blue stones and blue bricks. Subsequently, based on relevant literature [8,21], the parameter range of Ming Dynasty bluestone and blue brick materials was determined, and an initial modal analysis was conducted to calculate the natural frequency of the model. The identification results of the NExT-ERA method were compared, the material parameters were modified, and modal analysis was repeated until the calculated natural frequency had the smallest error compared to the measured natural frequency [5]. After experimental calculations, it was found that when each material parameter was set to the values listed in Table 4, the natural frequency of the numerical simulation results was similar to the experimental results, with a maximum relative error of 8.54%.

5.2. Modal Analysis Results

The ANSYS modal analysis results depicted in Figure 13 and Figure 14 illustrate that the first three natural frequencies of the Huilong Pagoda in the X-direction are 2.042 Hz, 6.827 Hz, and 21.476 Hz, respectively. At the same time, those in the Y-direction are 2.083 Hz, 6.854 Hz, and 21.303 Hz, respectively, and the first three vibration modes in the X-direction exhibit east–west movement, while those in the Y-direction display south–north movement. These findings suggest that the macroscopic numerical model of the Huilong Pagoda possesses symmetrical structural characteristics and exhibits uniform stress performance.
The numerical simulation results were compared with the measured natural frequencies, as presented in Table 5. The natural frequencies in the X-direction are close to the measured values, with a maximum relative error of 5.14%. Conversely, the natural frequencies in the Y-direction display a higher error than the measured values, with a maximum relative error of 8.54%. This discrepancy arises from neglecting the Y-direction staircase influence during the macroscopic numerical model construction, resulting in reduced Y-direction stiffness and a significant impact of local stiffness variations, thus compromising the accuracy of Y-direction natural frequency calculations [22]. Additionally, the finite element analysis did not account for residual damage such as wall cracking, assumed the overall structural integrity of the ancient pagoda, and employed a single parameter for the material properties of all masonry components, which further influenced the accuracy of natural frequency calculations in each mode.

6. Conclusions

Based on the in situ dynamic test data of the Huilong Pagoda, this study used two modal analysis methods for analysis. It combined the finite element analysis results of the macroscopic numerical model to propose the following contributions:
  • The maximum relative error between the results obtained by the SSI method and the NExT-ERA method in determining the natural frequency of the Huilong Pagoda is 3.56%, which verifies the accuracy of the NExT-ERA method in determining the dynamic characteristic parameters of the masonry pagoda.
  • Comparing the damping results obtained by the two methods of clearance, it was determined that the overall structural damping of the ancient pagoda is between 0.21% and 2.89%, indicating a low level of damping.
  • A macroscopic numerical model of the Huilong Pagoda was established, and the finite element analysis results were compared with the natural frequency identified by the NExT-ERA method. The results showed that the calculation results were in good agreement with the identification results, with a maximum relative error of 8.54% in the Y-direction. The model exhibited structural symmetry and uniform stress performance.

Author Contributions

Data curation, J.Z., J.H., M.S., S.W. and H.C.; writing—original draft, J.H. and S.W.; writing—review and editing, J.Z., J.H., S.W. and X.L.; Supervision, H.C. and X.L.; Investigation, X.L. All authors have read and agreed to the published version of the manuscript.

Funding

This research was financially supported by the Young Core Instructor Foundation of the Hunan Education Department, China (XJT (2022) no. 287), as well as the construction program of the applied characteristic discipline at the Hunan University of Science and Engineering.

Data Availability Statement

The original data presented in the study are included in the article; further inquiries about the findings of this study can be made to the corresponding author.

Conflicts of Interest

Author Xiaowu Li is employed by the Shanghai Jianwei Cultural Heritage Conservation Tech. Co., Ltd. The remaining authors declare that the research was conducted in the absence of any commercial or financial relationships that could be construed as a potential conflict of interest.

References

  1. Liang, S. A Pictorial History of Chinese Architecture; SDX Joint Publishing Company: Beijing, China, 2023. [Google Scholar]
  2. Preciado, A. Seismic vulnerability and failure modes simulation of ancient masonry towers by validated virtual finite element models. Eng. Fail. Anal. 2015, 57, 72–87. [Google Scholar] [CrossRef]
  3. Wu, X.Q.; Lu, J.L.; Wang, Z.S.; Yang, W.; Qiao, N. Dynamic characteristics and seismic response analysis of the bottle-shaped masonry ancient pagoda. Structures 2022, 44, 1648–1659. [Google Scholar] [CrossRef]
  4. Bartoli, G.; Betti, M.; Giordano, S. In situ static and dynamic investigations on the “Torre Grossa” masonry tower. Eng. Struct. 2013, 52, 718–733. [Google Scholar] [CrossRef]
  5. Ashayeri, I.; Biglari, M.; Formisano, A.; D’Amato, M. Ambient vibration testing and empirical relation for natural period of historical mosques. Case study of eight mosques in Kermanshah, Iran. Constr. Build. Mater. 2021, 289, 123191. [Google Scholar] [CrossRef]
  6. Tassello, A. Numerical Model and Seismic Structural Analysis of the Lamberti Tower. Master’s Thesis, Universidade do Minho, Braga, Portugal, 2013. [Google Scholar]
  7. Peña, F.; Lourenço, P.B.; Mendes, N.; Oliveira, D.V. Numerical models for the seismic assessment of an old masonry tower. Eng. Struct. 2010, 32, 1466–1478. [Google Scholar] [CrossRef]
  8. Ramos, L.F.; Casarin, F.; Algeri, C.; Modena, C. Investigations techniques carried out on the Qutb Minar, New Delhi, India. In Structural Analysis of Historical Constructions; Macmillan India Ltd.: Noida, India, 2006. [Google Scholar]
  9. Cabboi, A.; Gentile, C.; Saisi, A. From continuous vibration monitoring to FEM-based damage assessment: Application on a stone-masonry tower. Constr. Build. Mater. 2017, 156, 252–265. [Google Scholar] [CrossRef]
  10. Altunişik, A.C.; Adanur, S.; Genç, A.F.; Günaydin, M.; Okur, F.Y. Non-destructive testing of an ancient Masonry Bastion. J. Cult. Herit. 2016, 22, 1049–1054. [Google Scholar] [CrossRef]
  11. Nistico, N.; Gambarelli, S.; Fascetti, A.; Quaranta, G. Experimental Dynamic Testing and Numerical Modeling of Historical Belfry. Int. J. Archit. Herit. 2016, 10, 476–485. [Google Scholar] [CrossRef]
  12. Wan, L.; Hong, M.; Xu, J.C. Identification of modal parameters for model of a ship hull girder under ambient excitation based on NExT/ERA method. J. Ship Mech. 2013, 17, 774–784. [Google Scholar]
  13. Xu, Y.; Brownjohn, J.M.W.; Hester, D. Enhanced sparse component analysis for operational modal identification of real-life bridge structures. Mech. Syst. Signal Process. 2019, 116, 585–605. [Google Scholar] [CrossRef]
  14. Abdelbarr, M.H.; Massari, A.; Kohler, M.D.; Masri, S.F. Decomposition Approach for Damage Detection, Localization, and Quantification for a 52-Story Building in Downtown Los Angeles. J. Eng. Mech. 2020, 146, 04020089. [Google Scholar] [CrossRef]
  15. Guo, Z.W.; Shi, H.B.; Gong, H.F.; Ma, T.; Huang, X. Statistical characteristics of modal damping of long-span suspension bridge at different wind speeds. J. Vib. Control 2024, 30, 487–501. [Google Scholar] [CrossRef]
  16. Hu, J.X.; Li, Z.N.; Wang, C.Q.; Duan, X.N.; Shen, Y.J. Modal parameter identification of a high-rise building in Haikou city during typhoons. J. Build. Struct. 2020, 41, 71–82. [Google Scholar] [CrossRef]
  17. James, G.H.I.; Carne, T.G.; Lauffer, J.P. The Natural Excitation Technique (NEXT) for Modal Parameter Extraction from Operating Wind Turbines. Nasa Sti/Recon Tech. Rep. N 1993, 93, 260–277. [Google Scholar]
  18. Juang, J.N.; Pappa, R.S. An eigensystem realization algorithm for modal parameter identification and model reduction. J. Guid. Control. Dyn. 1985, 8, 620–627. [Google Scholar] [CrossRef]
  19. Chang, M.; Pakzad, S.N.; Leonard, R. Modal Identification Using SMIT. Top. Dyn. Civ. Struct. 2012, 1, 221–228. [Google Scholar] [CrossRef] [PubMed]
  20. Raghavendrachar, M.; Aktan, A.E. Flexibility by Multireference Impact Testing for Bridge Diagnostics. J. Struct. Eng. 1992, 118, 2186–2203. [Google Scholar] [CrossRef]
  21. Chun, Q.; Yang, H.B.; Meng, Z.; Han, Y. Research on the architectural form and structural performance of the brick-vault hall of Yongzuo Temple. Sci. Conserv. Archaeol. 2019, 31, 85–91. [Google Scholar] [CrossRef]
  22. Wang, D. The Dynamic Impact on the Structure of the Staircase and the Countermeasure Research. Master’s Thesis, Lanzhou Jiaotong University, Lanzhou, China, 2014. [Google Scholar]
Figure 1. Overview of Huilong Pagoda structure.
Buildings 14 01700 g001
Figure 2. Sensor layout details.
Buildings 14 01700 g002
Figure 3. Acceleration response time history of various floors under natural excitation.
Buildings 14 01700 g003
Figure 4. Anisotropic peak and RMS time history under natural excitation.
Buildings 14 01700 g004
Figure 5. Self-power spectral density function.
Buildings 14 01700 g005
Figure 6. Stability and PSD diagrams.
Buildings 14 01700 g006
Figure 7. The first three vibration modes in the X-direction.
Buildings 14 01700 g007
Figure 8. The first three vibration modes in the Y-direction.
Buildings 14 01700 g008
Figure 9. Cross-correlation function between different floors.
Buildings 14 01700 g009
Figure 10. The first three orders’ vibration modes in the X-direction.
Buildings 14 01700 g010
Figure 11. The first three orders’ vibration modes in the Y-direction.
Buildings 14 01700 g011
Figure 12. The finite element modal.
Buildings 14 01700 g012
Figure 13. The first three orders’ vibration modes in the X-direction (EW movement).
Buildings 14 01700 g013
Figure 14. The first three orders’ vibration modes in the Y-direction (NS movement).
Buildings 14 01700 g014
Table 1. Dynamic characteristic parameters (SSI).
First OrderSecond OrderThird Order
X-direction2.0096.72421.360
Damping (%)2.130.620.15
Y-direction1.9927.44021.360
Damping (%)3.060.790.31
Table 2. Comparison of natural frequency test results.
OrderSSINExT-ERARelative Error (%)
X-directionFirst order2.0091.9373.56
Second order6.7246.8021.16
Third order21.36021.3610.01
Y-directionFirst order1.9921.9352.86
Second order7.4407.4390.01
Third order21.36021.3980.18
Table 3. Comparison of damping ratio test results.
OrderSSINExT-ERAAverage Value (%)
X-directionFirst order2.13%2.22%2.18
Second order0.62%0.71%0.67
Third order0.15%0.14%0.15
Y-directionFirst order3.06%2.72%2.89
Second order0.79%0.73%0.76
Third order2.13%2.22%2.18
Table 4. The numerical model parameters.
Density (kg/m3)Young’s Modulus (GPa)Poisson’s Ratio
Blue brick18001.80.15
Bluestone2693.8800.25
Granite2660660.15
Table 5. Modal analysis results.
NExT-ERAAnalysis ResultRelative Error (%)
X-direction1.9372.0425.14
6.8026.8270.37
21.36121.4760.54
Y-direction1.9352.0837.11
7.4396.8548.54
21.39821.3030.45
Disclaimer/Publisher’s Note: The statements, opinions and data contained in all publications are solely those of the individual author(s) and contributor(s) and not of MDPI and/or the editor(s). MDPI and/or the editor(s) disclaim responsibility for any injury to people or property resulting from any ideas, methods, instructions or products referred to in the content.

