Article

Assessing the Impact of Street Visual Environment on the Emotional Well-Being of Young Adults through Physiological Feedback and Deep Learning Technologies

1
College of Architecture and Environment, Sichuan University, Chengdu 610065, China
2
College of Electronic and Information Engineering, Sichuan University, Chengdu 610065, China
*
Author to whom correspondence should be addressed.
Buildings 2024, 14(6), 1730; https://doi.org/10.3390/buildings14061730
Submission received: 13 April 2024 / Revised: 31 May 2024 / Accepted: 6 June 2024 / Published: 9 June 2024
(This article belongs to the Section Architectural Design, Urban Science, and Real Estate)

Abstract

:
Investigating the impact of street visual environments on young adults’ emotions is crucial for the promotion of walkable and healthy streets. However, the applicability and accuracy of existing studies are limited by a lack of large-scale sample validation. Moreover, many studies have determined emotions through subjective evaluation methods or relied solely on a single physiological indicator to assess levels of emotional arousal, neglecting the significance of emotional valence. In response, this study aims to enhance our understanding of the emotional impact of street visual environments by employing a method that integrates physiological feedback technology and deep learning. We collected videos of 100 streets from five districts in Chengdu to serve as experimental stimuli, and utilizing physiological feedback technology, we gathered data on electrocardiograms (ECG), electrodermal activity (EDA), and respiratory responses (RESP) from 50 participants as they observed these street environments. Subsequently, we applied deep learning techniques to process the video and physiological data, ultimately obtaining 500 data entries on street visual environment elements and 25,000 data entries on emotional arousal and valence. Additionally, we established multiple linear regression and multinomial logistic regression models to explore the relationship between visual street environments and emotions. The results reveal that elements such as green view factor (GVF), sky view factor (Sky VF), and sidewalk view factor (SVF) not only reduce emotional arousal levels but also facilitate the shift from negative to positive emotions, positively affecting emotional regulation. In contrast, visual enclosure (VE), vehicle view factor (VVF), and person view factor (PVF) are associated with negative emotional arousal, adversely affecting emotional valence. Moreover, the impact of specific visual environmental elements on different emotional states may vary. This study introduces a novel, multidisciplinary approach to accurately quantify the relationship between the environment and emotions, providing significant theoretical and practical insights for the development of healthier cities.

1. Introduction

1.1. Research Background

In the post-pandemic era, there is an increasing focus on sustainable and healthy urban development, with a heightened awareness of how environments impact psychological and emotional well-being. As an integral part of urban life [1,2,3], streets play a crucial role in shaping the emotions and quality of life of residents, especially young adults [4,5]. However, issues such as traffic congestion, insufficient greenery, and a lack of open spaces severely impact daily experiences, further affecting the emotional health of young people. To achieve sustainable urban development, the concept of smart cities offers effective solutions. Smart city design aims to enhance residents’ quality of life while promoting economic growth, emphasizing sustainable development and efficient service delivery. Through the use of smart sensors and data analysis, optimizing environments to promote emotional well-being becomes feasible [6,7]. This study aims to explore the impact of street visual environments on the emotions of young adults through physiological feedback technology. The goal is to propose improvement strategies and provide scientific evidence for creating livable, healthy, and smart urban environments.

1.2. Technology Status

Previous research on emotions often relied on subjective narratives and direct observational assessments [8,9,10]. These studies attempted to quantify emotions through manual audits, but their data, imbued with subjectivity, lacked the robustness required for reliability. The emergence of new technological methods has enhanced new research approaches for empirical studies of emotions. Notably, the advent of wireless physiological measurement devices has facilitated the direct measurement of physiological responses, which can serve as indirect indicators of psychological responses. This technological advancement provides a more accurate and objective characterization of human psychological activity [11,12,13]. Technological advances have led to the development of sensors that quantitatively and objectively reflect human perception, which are becoming more portable and are gradually being used in the study of experience in the built environment [14,15,16,17,18,19,20,21]. The integration of devices such as electrical dermal activity (EDA) sensors, electrocardiogram (ECG) sensors, and respiration (RESP) sensors allows for real-time and accurate recording of people’s emotional experiences in different environments. Specifically, EDA sensors can monitor changes in skin conductivity to effectively track an individual’s sweating and thus determine their stress level [22]; ECG sensors can approximate the arousal levels of the sympathetic and parasympathetic nervous systems through heart rate variability [23]; RESP sensors can assess emotional states by monitoring changes in breathing patterns; and respiratory rate and depth variations can indicate stress levels, anxiety, or relaxation states [24]. Empirical evidence suggests that data gleaned from these wearable physiological sensors accurately reflect participants’ spatial perceptions [21] and have been successfully applied in various urban environments, including parks [16], campuses [23], and streets [14]. This evolution towards the use of technologically advanced methods marks a significant shift towards more objective and reliable means of understanding human emotional experiences in relation to their environments.
Deep learning technology has emerged as a powerful tool in evaluating the influence of street visual environments on emotional well-being [15]. Semantic segmentation models in this field have the ability to process and analyze large amounts of visual data to identify specific environmental features that may affect human emotional states. In addition, existing datasets consisting of physiological and emotional responses are utilized to train deep learning models, which are then combined with physiological feedback techniques to improve the accuracy of physiological data measurement and emotional state recognition. This interdisciplinary approach not only improves the accuracy of emotional state assessment but also contributes to a more nuanced understanding of the relationship between environmental elements and emotional health.

2. Literature Review

2.1. Measurement of Emotion

Emotions are subjective and conscious psychological experiences accompanied by physiological responses [25,26]. Although the perception of emotions is critically important, their often elusive and ineffable nature makes them challenging to describe or measure. Thus, the description or measurement of emotions constitutes a task fraught with challenges. Psychologists commonly employ two main approaches to study emotions, i.e., the discrete category method and the dimensional model [27]. The discrete category method, such as Ekman’s theory, posits that individuals innately possess certain basic emotions, which manifest similar physiological and behavioral patterns across different populations [28]. On the one hand, James Russell’s Circumplex Model of Affect employs a dimensional model, which conceptualizes emotions in terms of two main dimensions, i.e., valence, which describes the degree of liking, and arousal, which indicates the level of excitement [29]. The model shows that any emotional state can be localized within a two-dimensional space defined by these axes. Valence indicates the degree of positive or negative emotional response on the horizontal axis, and arousal indicates the level of physiological and psychological excitement or energy on the vertical axis (Figure 1). Within this framework, emotions are further categorized into four quadrants, i.e., high arousal-positive valence (HAPV), high arousal-negative valence (HANV), low arousal-positive valence (LAPV), and low arousal-negative valence (LANV).
In 1997, Rosalind W. Picard proposed the concept of affective computing, suggesting that machines could learn human emotions through scientific methods. Affective computing aims to enable computers to recognize, understand, and express human emotions, focusing primarily on human language, facial expressions, gestures, and physiological signals [30]. Previous research predominantly relied on subjective reports from individuals, including questionnaires, interviews, and diary entries. These methods directly capture individuals’ awareness and assessment of their emotional states, thus offering advantages in evaluating the intrinsic experience of emotional perception. However, psychological measurement methods also have limitations due to individual cognitive biases and memory errors [31]. Physiological signals, direct reflections of internal physiological activities that are not consciously altered, change in response to emotional variations [32]. Therefore, monitoring and analyzing these physiological signals can yield significant information about an individual’s emotional state. Subsequently, Healey integrated physiological signal monitoring technology with wearable computing devices, engaging users with video content to elicit emotional responses and employing skin conductance sensors to detect changes in skin conductance, thereby enabling real-time assessment of users’ stress levels [33]. The progression of wearable technologies has since enabled the development of numerous portable and non-invasive devices for the everyday monitoring of emotional states [34].
In past research on the effects of the built environment on emotional responses, investigators have primarily utilized subjective evaluations to determine emotions or have relied on a single physiological indicator to gauge emotional arousal levels, thereby overlooking the aspect of emotional valence [13,15]. However, given the substantial subjectivity associated with self-assessment methods and the differential accuracy of single-modality emotion recognition methods in distinguishing among various types of emotions, many scholars have recently pivoted towards multimodal emotion recognition approaches. These approaches employ a combination of physiological signals, including ECG, EDA, and RESP, to enhance the precision and reliability of emotion detection [35].

2.2. Exploring the Impact of Street Visual Environment on Emotions

Human perception of the built environment encompasses visual and other physical characteristics, with vision being the primary source of external information for most people [36,37]. Lots of research has demonstrated that visual exposure to street environments can influence individuals’ subjective feelings and emotions, such as comfort [38], safety [39], vitality [40], and depression [41]. Early studies primarily focused on the impact of general visual attributes like brightness, openness, and complexity on emotional assessment, with relatively less attention given to specific visual elements in street environments, such as vehicles and buildings [42]. Later, streetscape elements are recognized by Cullen as key determinants of the visual quality of urban environments [43], especially visual details emphasized during planning and design processes, which significantly affect residents’ well-being. These specific visual elements can guide visual attention and play a role in the initial stages of emotional evaluation [44]. For instance, greenery can effectively reduce emotional arousal [45]. Technological advancements have opened new avenues for research. The widespread application of semantic segmentation technology allows for the more accurate quantification of visual environment elements, enabling many studies to explore the statistical relationship between visual environments and emotions in depth [46]. Chong Xian Chen et al. used street view images and semantic segmentation technology to analyze the impact of Guangzhou city street environments on emotional states, finding that different street elements have varying effects on emotions, with streets in urban fringe areas more likely to evoke positive, pleasant, relaxed, and focused emotions, while streets in city center areas are more likely to induce feelings of depression [47]. The development of physiological feedback technology has made it possible to observe and quantify emotions. Jenny J. Roe and Catharine Ward Thompson measured perceived stress through variations in cortisol secretion patterns. Their research demonstrated a significant negative correlation between higher levels of green space and stress levels [48]. Zij Iao Zhang’s study in 2021, combining virtual reality and physiological feedback methods, revealed that diversified and orderly architectural environments can stimulate positive emotions, also confirming the consistency between physiological and subjective indicators [14]. Meng Cai, Luau Xiang, et al., integrating dynamic perception and portable technology, analyzed the emotional responses of pedestrians in high-density urban areas of Hong Kong [15], and in another article in 2023, they used EDA as a proxy for arousal to measure stress, revealing that visual elements like trees, sky, and signage can effectively alleviate stress [20].
In summary, these studies illustrate that visual elements of street environments, such as buildings, vehicles, greenery, and the sky, significantly influence the regulation of residents’ emotions and perceptions. Furthermore, advancements in technology and methodologies have allowed researchers to more precisely evaluate the effects of specific visual elements on emotions. However, the current body of research is still limited by the lack of large-scale sample validation, which restricts the applicability and accuracy of the findings.

2.3. Research Goals

To bridge the gaps in existing research, our study sets out to precisely identify emotions using multimodal physiological signals by combining physiological feedback with deep learning technologies. The study utilized a laboratory experimental method and collected a diverse dataset of 100 street visual environment samples, enhancing the sample’s diversity and scope. Accordingly, the primary goals of our study are as follows:
  • To reveal how specific aspects of the street visual environment impact emotions, providing new theoretical insights into the interaction between street design and emotions.
  • To develop and validate a technical framework that combines physiological feedback technology and deep learning methods, aimed at enhancing the accuracy and reliability of research on the impact of emotions through large-scale street sample data.
  • Based on the analysis of data, to propose recommendations for street design improvements that promote residents’ emotional well-being and the development of psychologically friendly environments.

3. Data and Methodology

3.1. Research Design

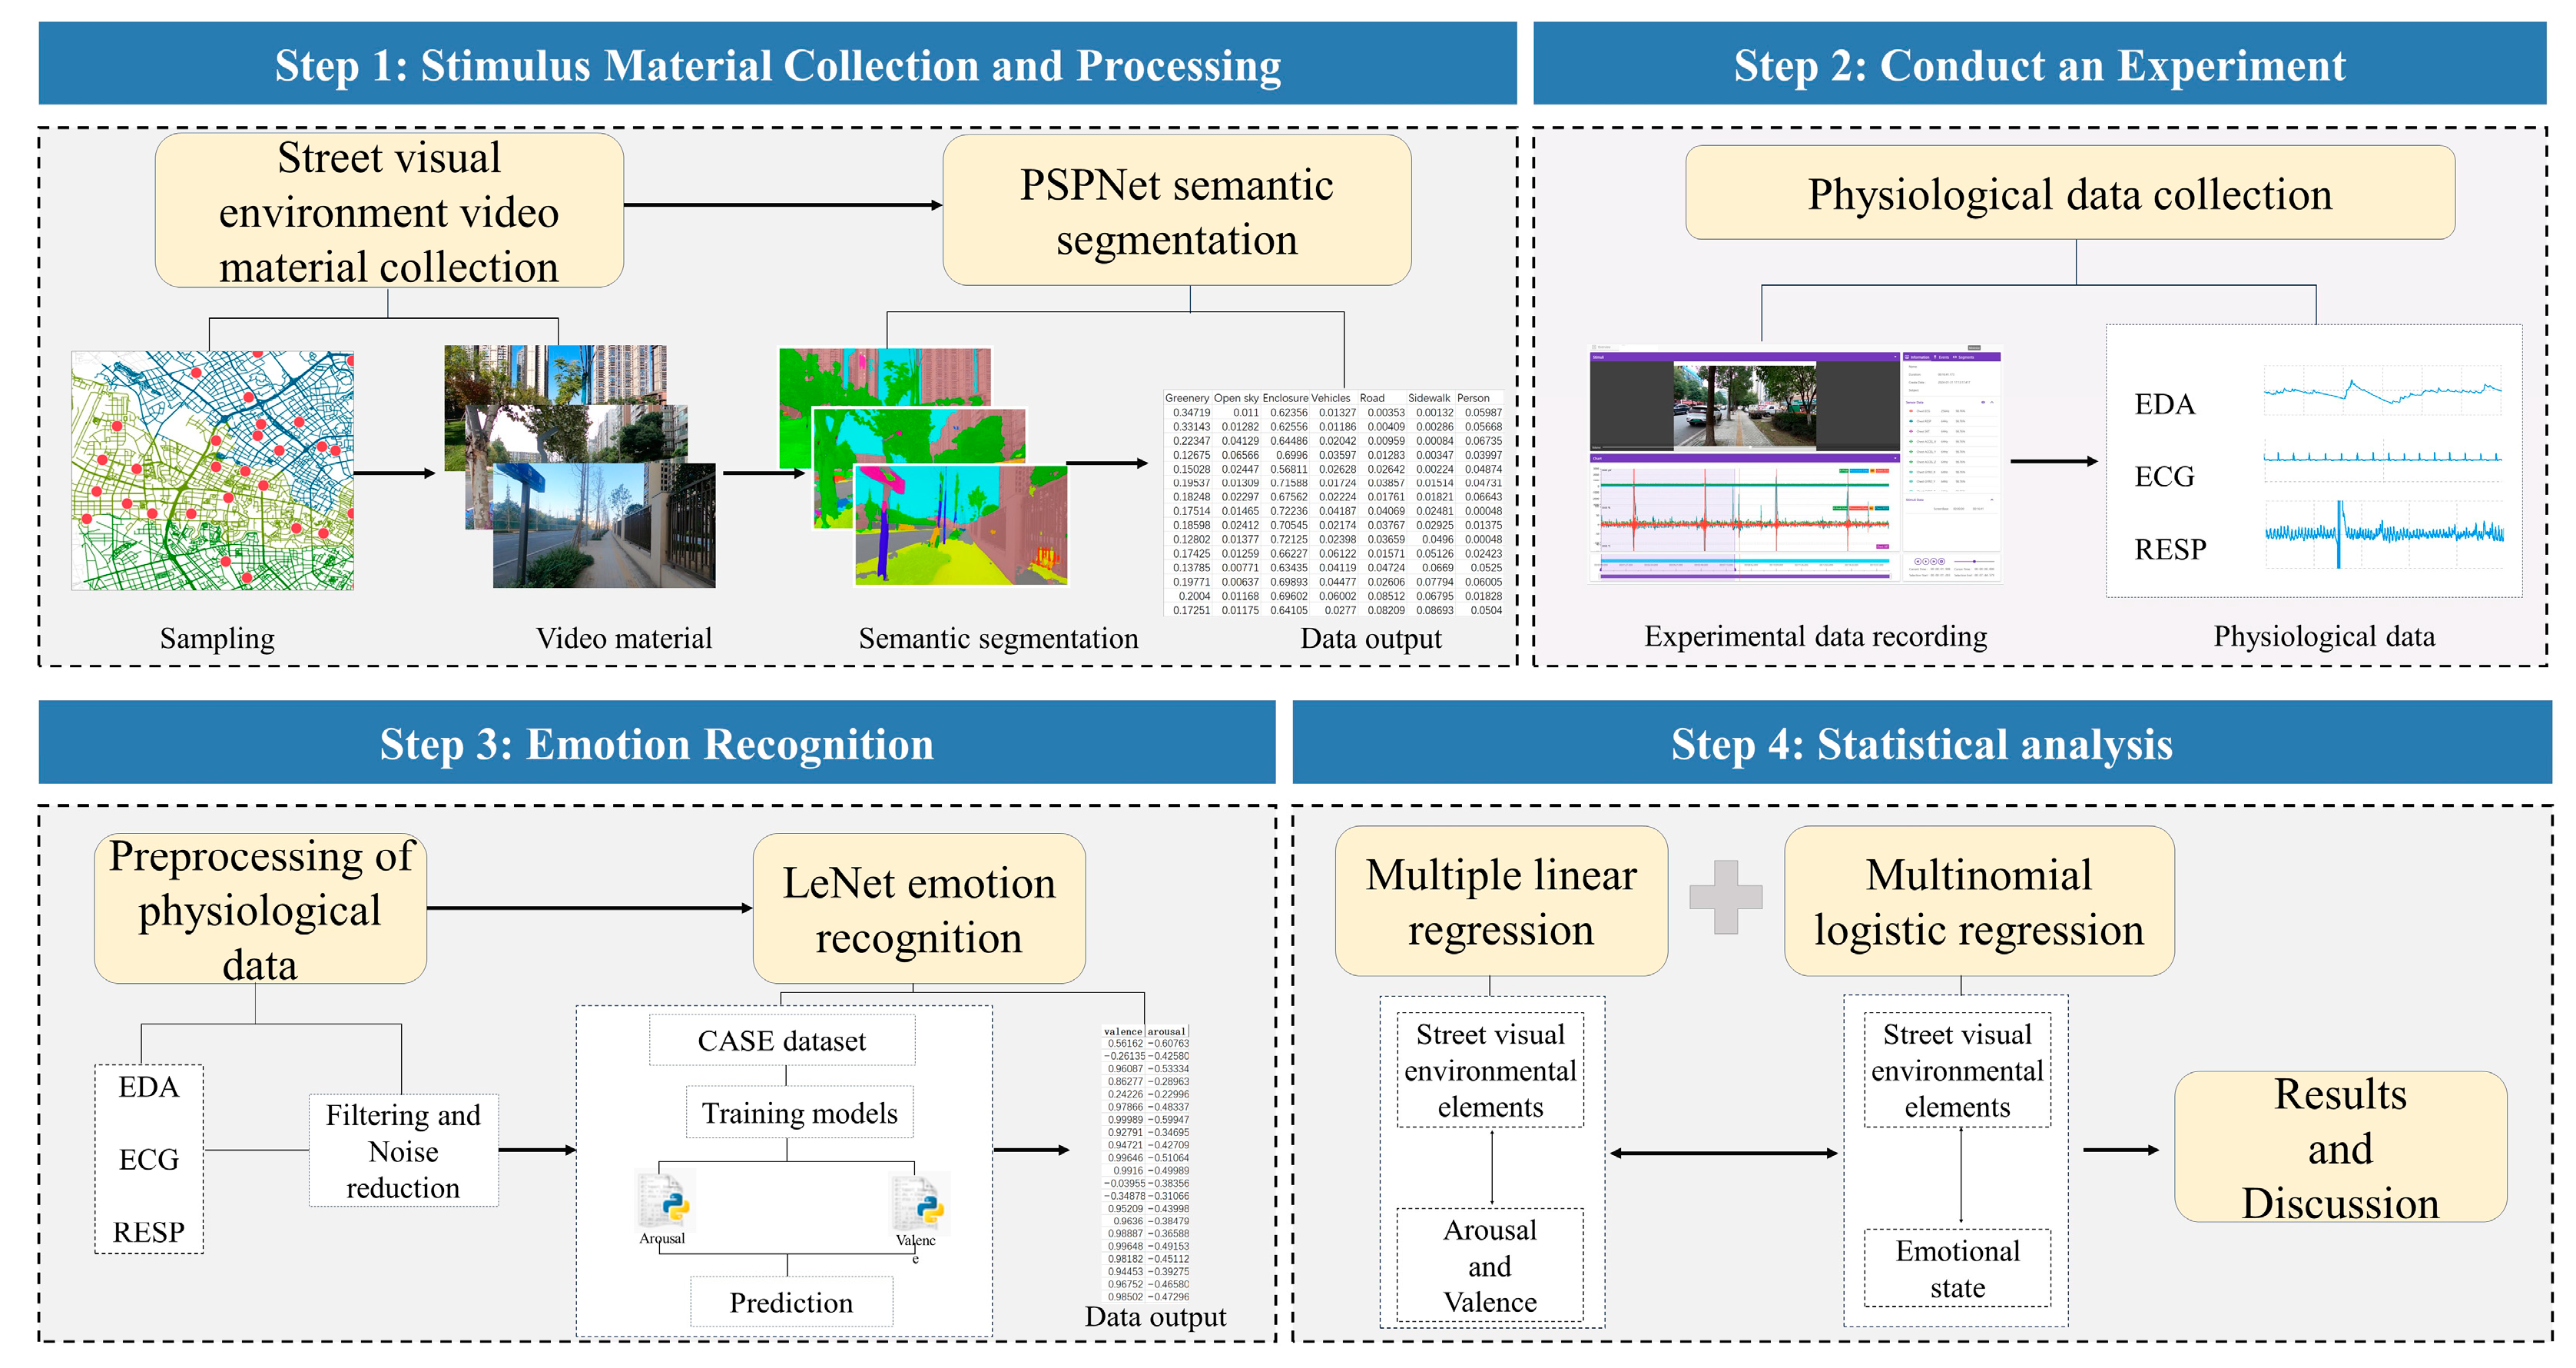
To achieve large-scale sample measurement and objective emotional data acquisition, this study was structured into four stages. The initial phase entailed the collection of stimulus materials through the random sampling of 100 streets across five urban districts in Chengdu city. This process involved capturing dynamic videos from a pedestrian viewpoint to serve as stimuli. Semantic segmentation technology was then employed to analyze and quantify visual element variables from these video images, thereby delineating the visual environmental conditions of the selected stimuli. In the second phase, the study proceeded with experiments that utilized wireless smart wearable devices to record participants’ physiological data—including electrodermal activity (EDA), electrocardiogram (ECG), and respiratory (RESP) signals—while they engaged with the street videos. The third stage is the preprocessing and transformation of physiological data. The physiological signals are preprocessed and then transformed into quantifiable emotional arousal and emotional value measures based on the emotion recognition model of deep learning techniques. Finally, multiple linear regression models and multinomial logistic regression models were applied. These analytical tools help to elucidate the effects of various visual elements in the street environment on young adults' emotions (Figure 2).

3.2. Study Area and Sample Selection

3.2.1. Study Area

This paper selects five main urban districts of Chengdu city in Sichuan Province, China, as the sources for stimulus material collection, i.e., Jinniu, Chenghua, Jinjiang, Wuhou, and Qingyang. Chengdu, with its populous urban residential areas and status as an economically prosperous and culturally rich metropolis, offers a diverse range of street environments for study, ensuring a comprehensive and representative sample. Furthermore, Chengdu has been repeatedly recognized as one of China’s happiest cities, suggesting that the psychological well-being of its residents may benefit from its built environment. Conducting research with Chengdu as a case study to explore the relationship between visual environments and young adults' emotions aims to more effectively reveal the positive impacts of urban environments on mental health (Figure 3).

3.2.2. Stimulus Materials

The environment serves as one of the most direct forms of stimulus material that can effectively evoke emotional responses in humans. The environmental stimuli in existing research have been categorized into the following four types: (1) real scenes [13], (2) still images of real scenes [49], (3) virtual reality (VR) scenes [50], and (4) videos of real scenes [38].
Through multiple preliminary experiments, it was found that real scenes provide the best environmental and spatial experience, thereby triggering the most authentic and convincing physiological responses. However, the main drawback of real-life scenes lies in the difficulty of controlling unforeseen events and other extraneous variables on site, which could significantly interfere with the accuracy of physiological data. Still images of real scenes are easy to obtain and allow for quantitative analysis through information extraction, but they tend to elicit weaker emotional and physiological changes, thus affecting data accuracy. VR scenes offer a strong sense of immersion, yet they can also induce feelings of dizziness and require the construction of scenes that might not accurately reflect real scenarios. Videos of real scenes provide more vivid and dynamic street scenes compared to still or panoramic images. This type of material not only showcases static visual elements but also includes dynamic elements of street environments, such as pedestrian flow and vehicle movement, closely resembling real street experiences. This enhances participants’ sense of immersion, making it easier for them to feel as if they are physically present in the setting. Such immersion helps to elicit more genuine and profound emotional responses, thereby providing more accurate data for the study. Additionally, using videos of real scenes as stimulus materials reduces the need for physical visits to actual locations, making experiments more manageable and executable.
Considering the feasibility of the experiment and resource allocation, a total of 100 streets were randomly selected from these five districts in Chengdu city, offering a broader dataset and increasing the diversity and representativeness of the research findings. Initially, information on urban roads within Chengdu’s main city area was obtained from OpenStreetMap, followed by division according to the administrative boundaries of the five districts. Subsequently, geographic information system (GIS) technology was employed for random sampling of streets within each district (Figure 3), ensuring the diversity and representativeness of the sample. Twenty roads were sampled within each district, including 3 arterial roads, 5 secondary roads, and 12 tertiary roads, totaling 100 roads across five districts. Videos were shot using a GoPro camera at a height of 1.7 m to simulate a pedestrian perspective. The filming speed was maintained between 0.8 and 1.3 m per second to ensure a natural and smooth visual effect. To guarantee the quality and consistency of the footage, filming was conducted strictly on clear days from 2 November to 13 November 2023, from 9 AM to 5 PM each day. Special care was taken during video shooting to avoid any factors that might affect emotional assessment, such as avoiding filming during special events (e.g., festivals or large-scale activities) to minimize the impact of non-daily activities on the street environment. Additionally, the videos did not contain directional events or specific landmarks, ensuring that observers’ attention remained primarily on the visual environment of the streets themselves. In producing the real-scene videos, consistency and coherence in filming were ensured, so that each street video accurately reflected its typical environment. Each video was carefully edited to ensure stable framing and appropriate exposure, providing a clear, authentic street visual experience. Considering that the elicitation of emotions requires some time, the sequence of stimulus videos was adjusted to group streets with similar proportions of visual environmental elements together, facilitating better emotional stimulation.

3.3. Experimental Design

3.3.1. Volunteer Recruitment

Generally, the subject pool for related studies varies from 10 to 100 participants [13,15,16,17,18,20], allowing for effective inference about the number of participants required for this experiment. The study utilized convenience sampling, requiring participants to be physically and psychologically healthy, capable of emotional perception, with normal vision or corrected vision when wearing glasses, and free from serious mental health issues. Participants, aged between 18 and 35 years with no restrictions on their occupations, had not experienced significant emotional stimuli in the past three months, ensuring they understood the experiment’s purpose and signed an informed consent form. Suitable volunteers were recruited from November to December 2023, ultimately enrolling 55 individuals.

3.3.2. Equipment

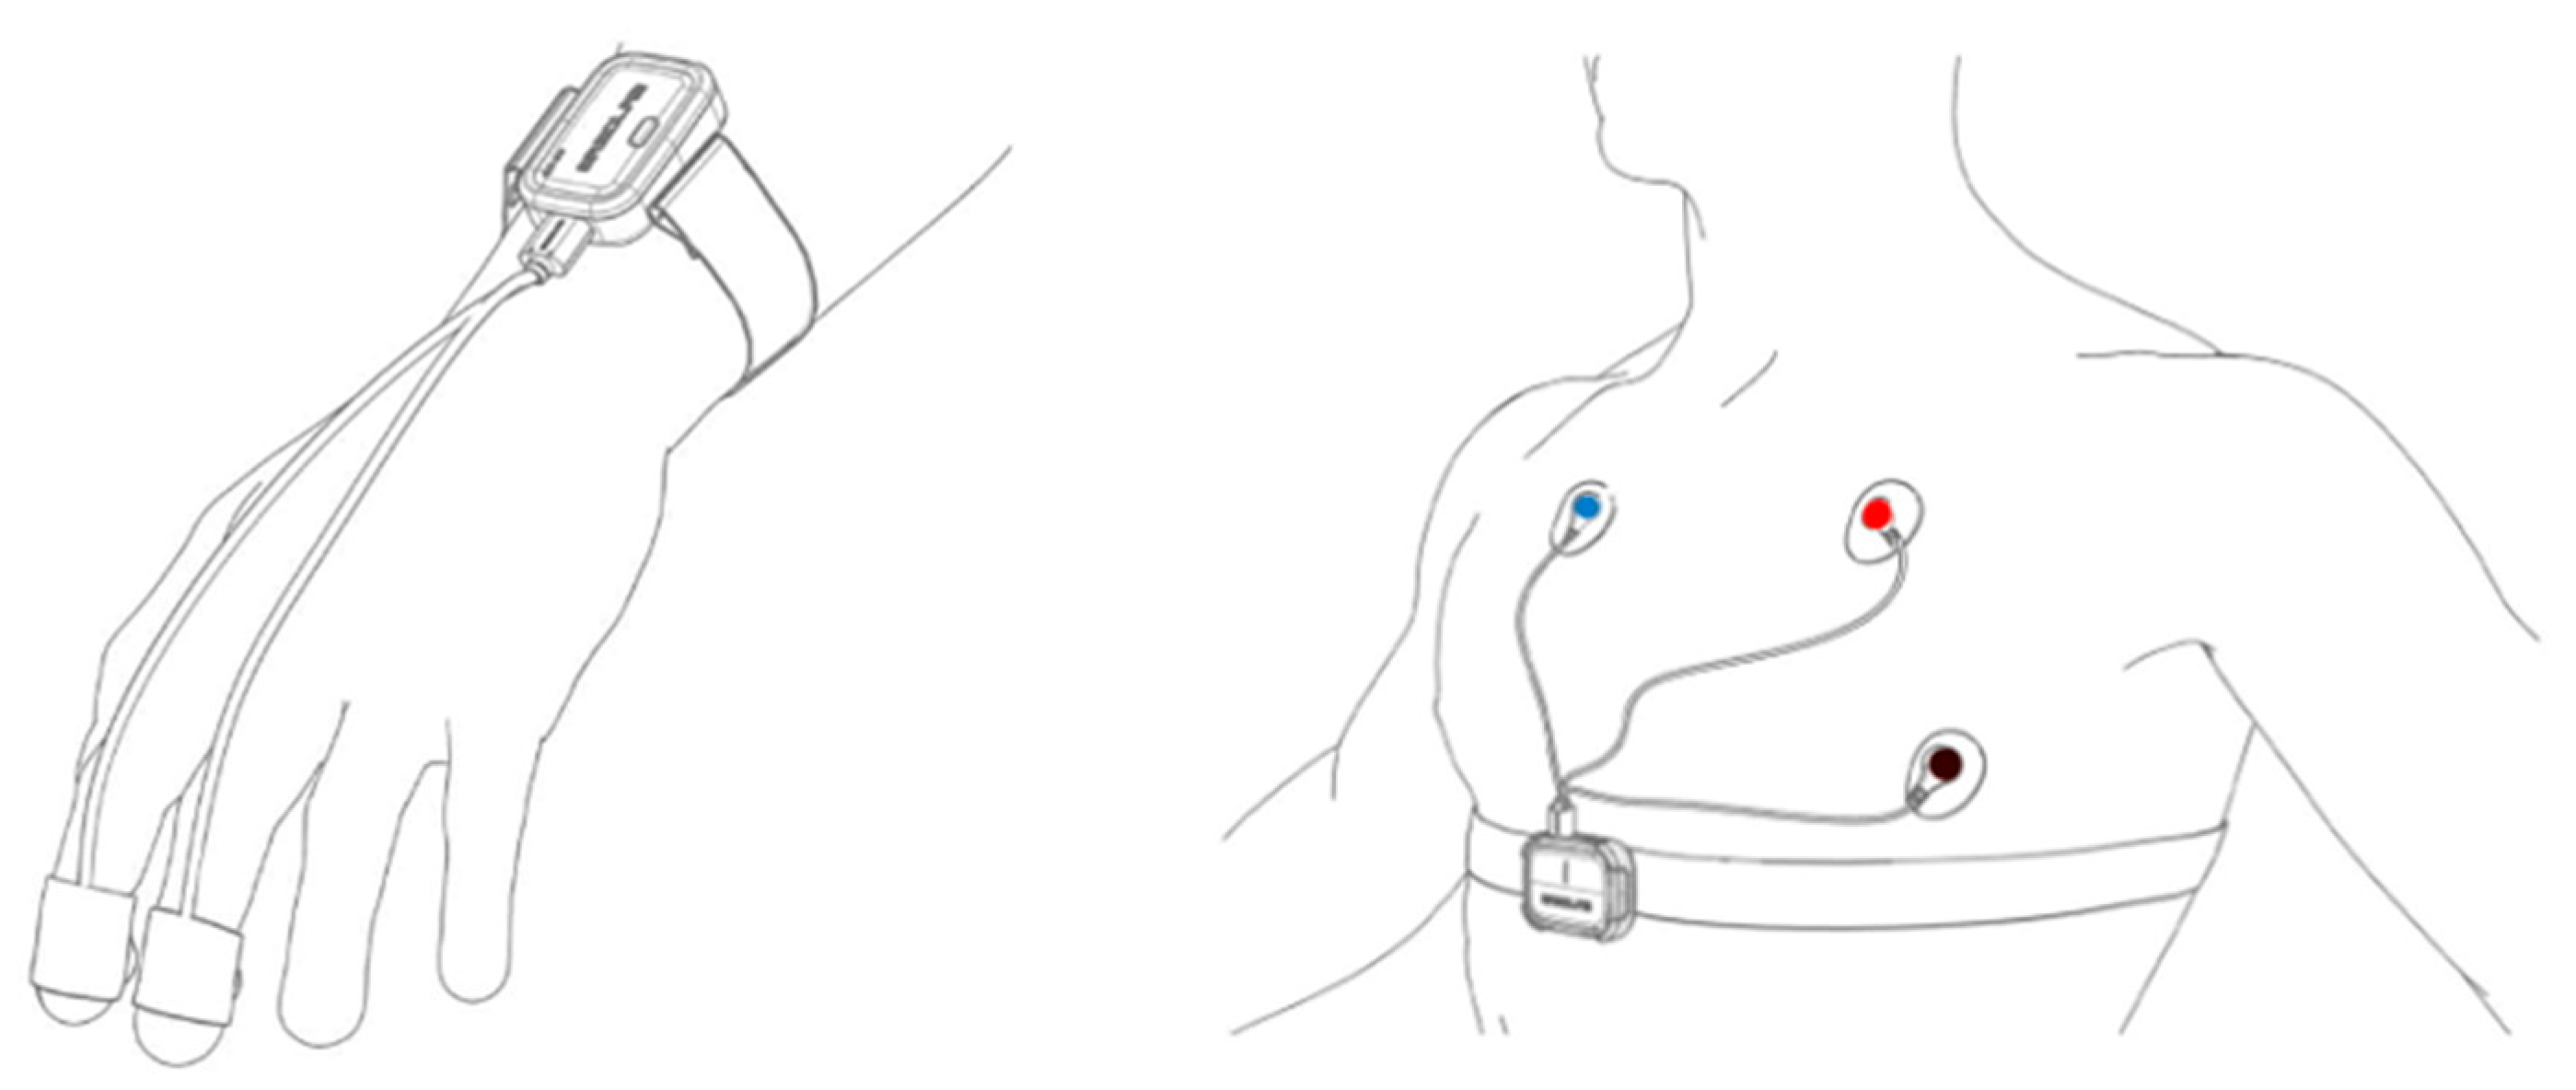
This study employed smart wearable chest strap sensors and wrist sensors from the ERGO lab. The smart wearable chest strap sensor monitored ECG and RESP, configured to fit snugly around the participant’s chest against the skin; the smart wearable wrist sensor measured EDA, worn on the participant’s wrist, with electrodes secured between the index and middle fingers (Figure 4). The devices connected to a computer via Bluetooth and sampled data at a frequency of 64 Hz.

3.3.3. Experimental Process and Data Acquisition

All experiments were conducted in the laboratory of the Entrepreneurship and Innovation Center at Sichuan University, comprising three main phases, i.e., preparation, stimulus presentation, and feedback review, with each participant’s session lasting approximately 40 min (Figure 5 and Figure 6).
During the preparation phase, participants were informed about the experimental process and precautions. Subsequently, with the assistance of researchers, participants were equipped with specialized physiological monitoring devices, including smart wearable chest strap sensors and wrist sensors. Once the devices were set up, necessary calibrations were performed to ensure the accuracy and reliability of the data. After the setup, participants rested for 2 min in a quiet environment to achieve a calm state.
In the stimulus phase, participants viewed a series of continuous street videos, each lasting 10 s, with a total video duration of 16.7 min. To maintain focus during video viewing, participants were asked to briefly record their emotional reactions to the streets after each segment, based on multiple experimental iterations.
During the review phase, all devices were removed from the participants. Then, a brief interview was conducted as a retrospective session. Participants were asked about their most memorable scenes and the reasons for their impressions, followed by an open discussion about their feelings towards these scenes. Finally, a survey was completed to gather demographic information (age, gender, and educational background).

3.4. Data Processing

3.4.1. Physiological Data Processing

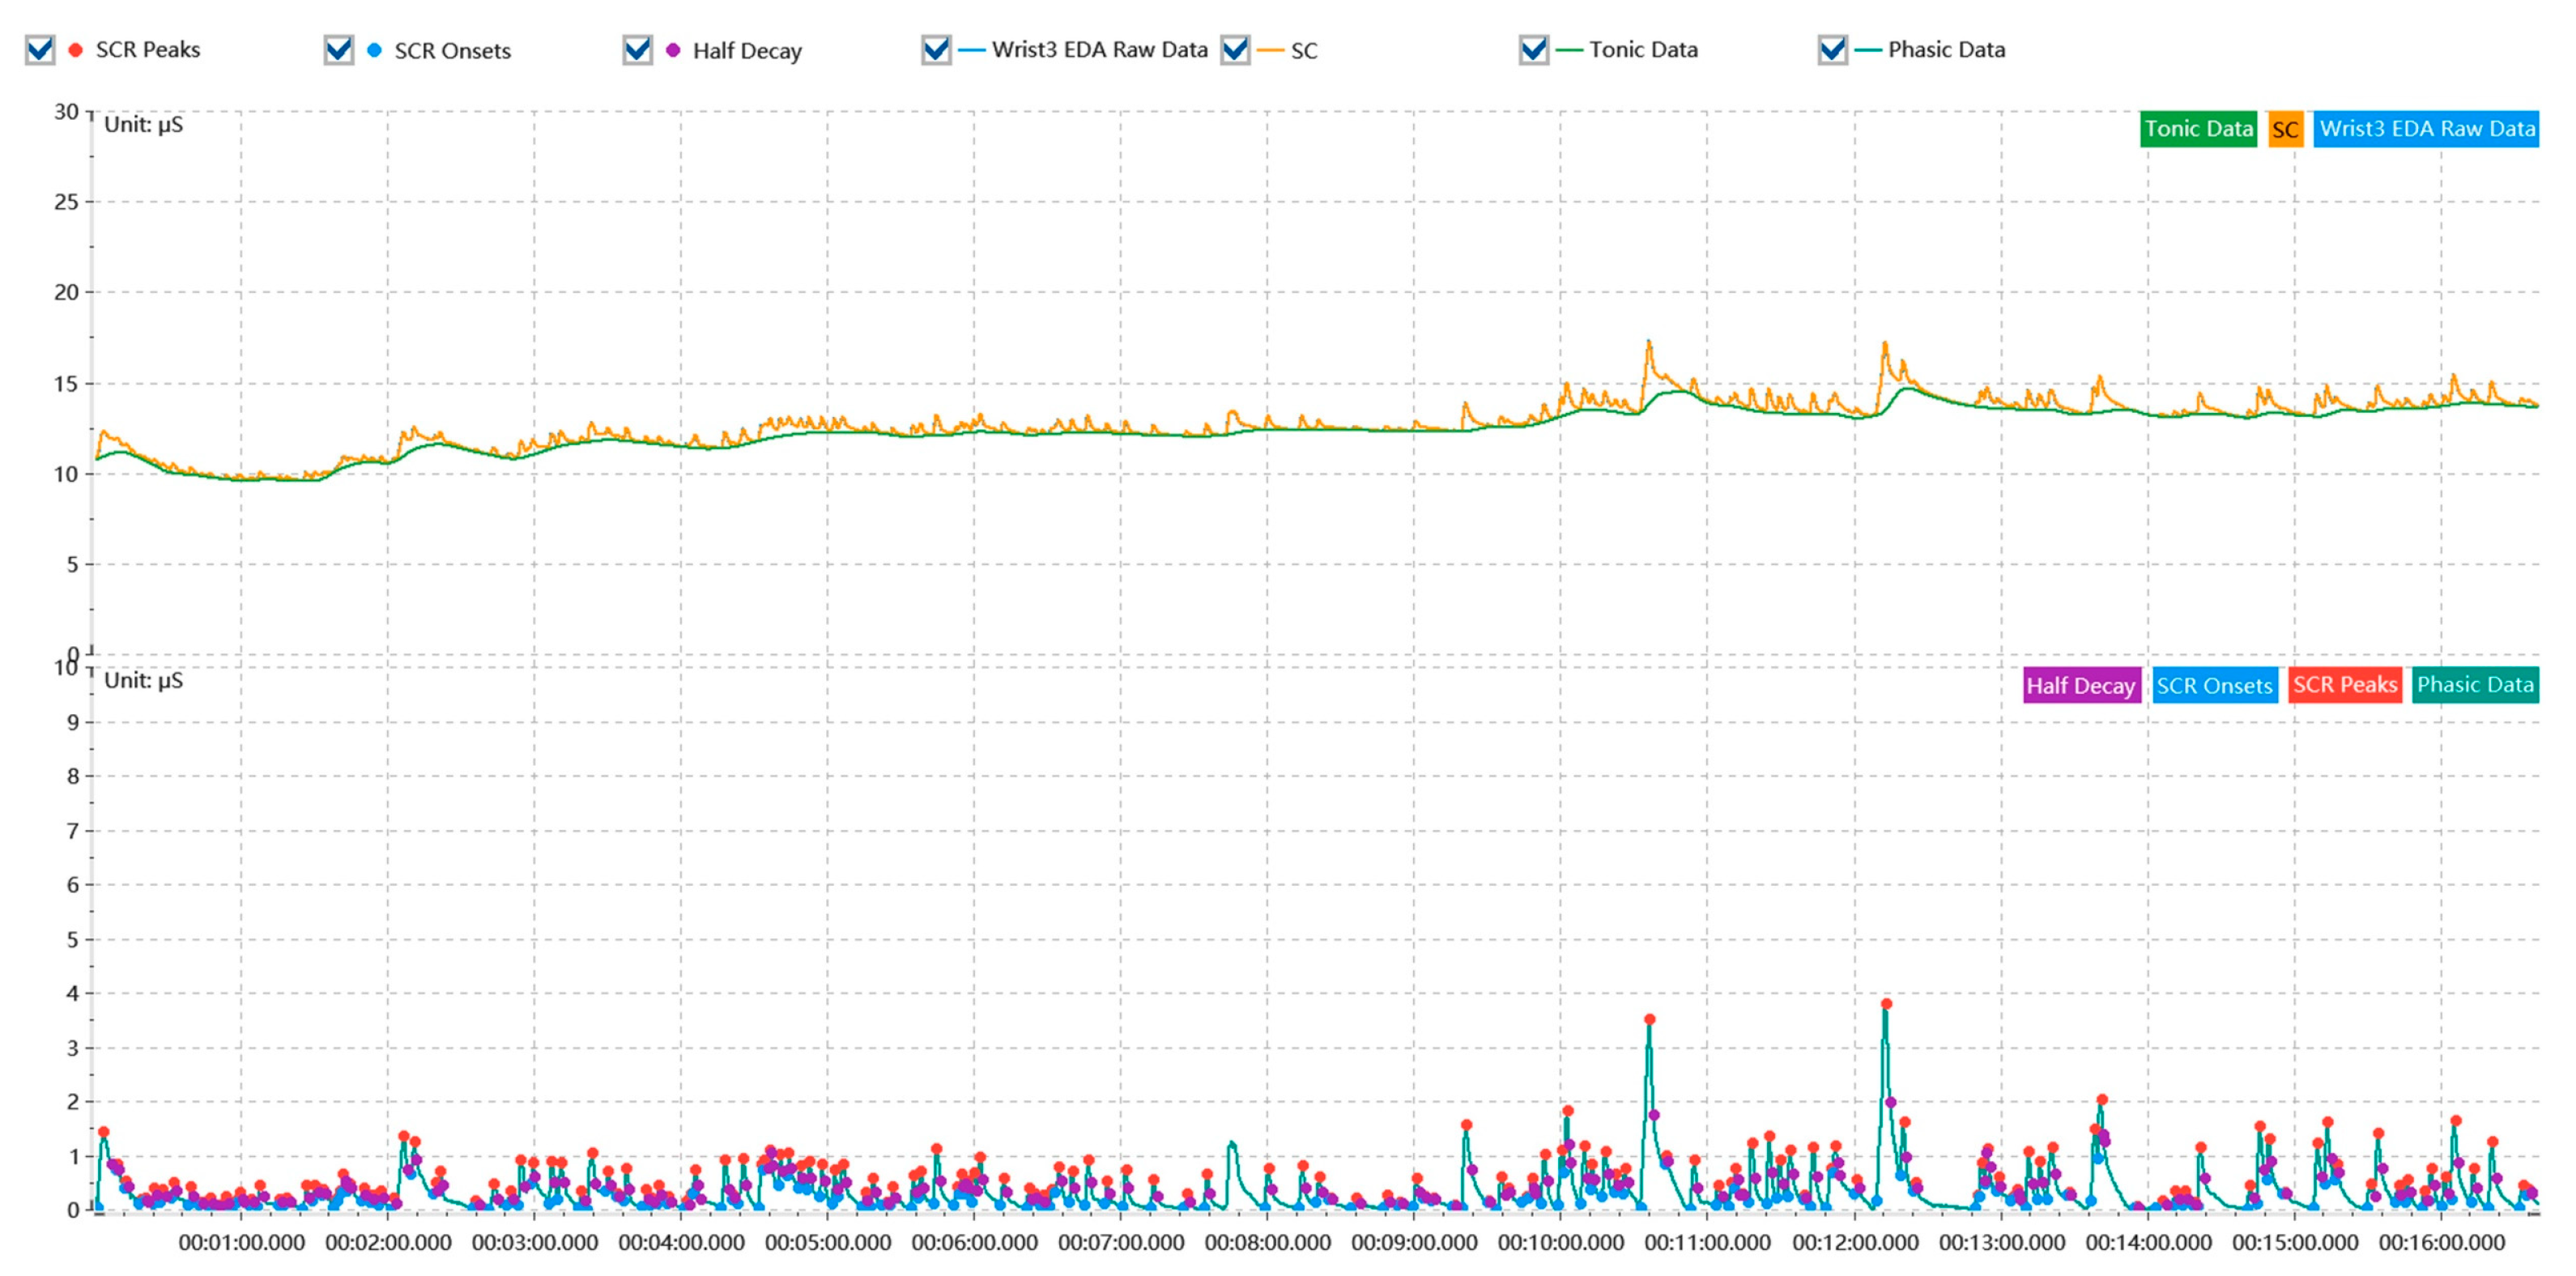
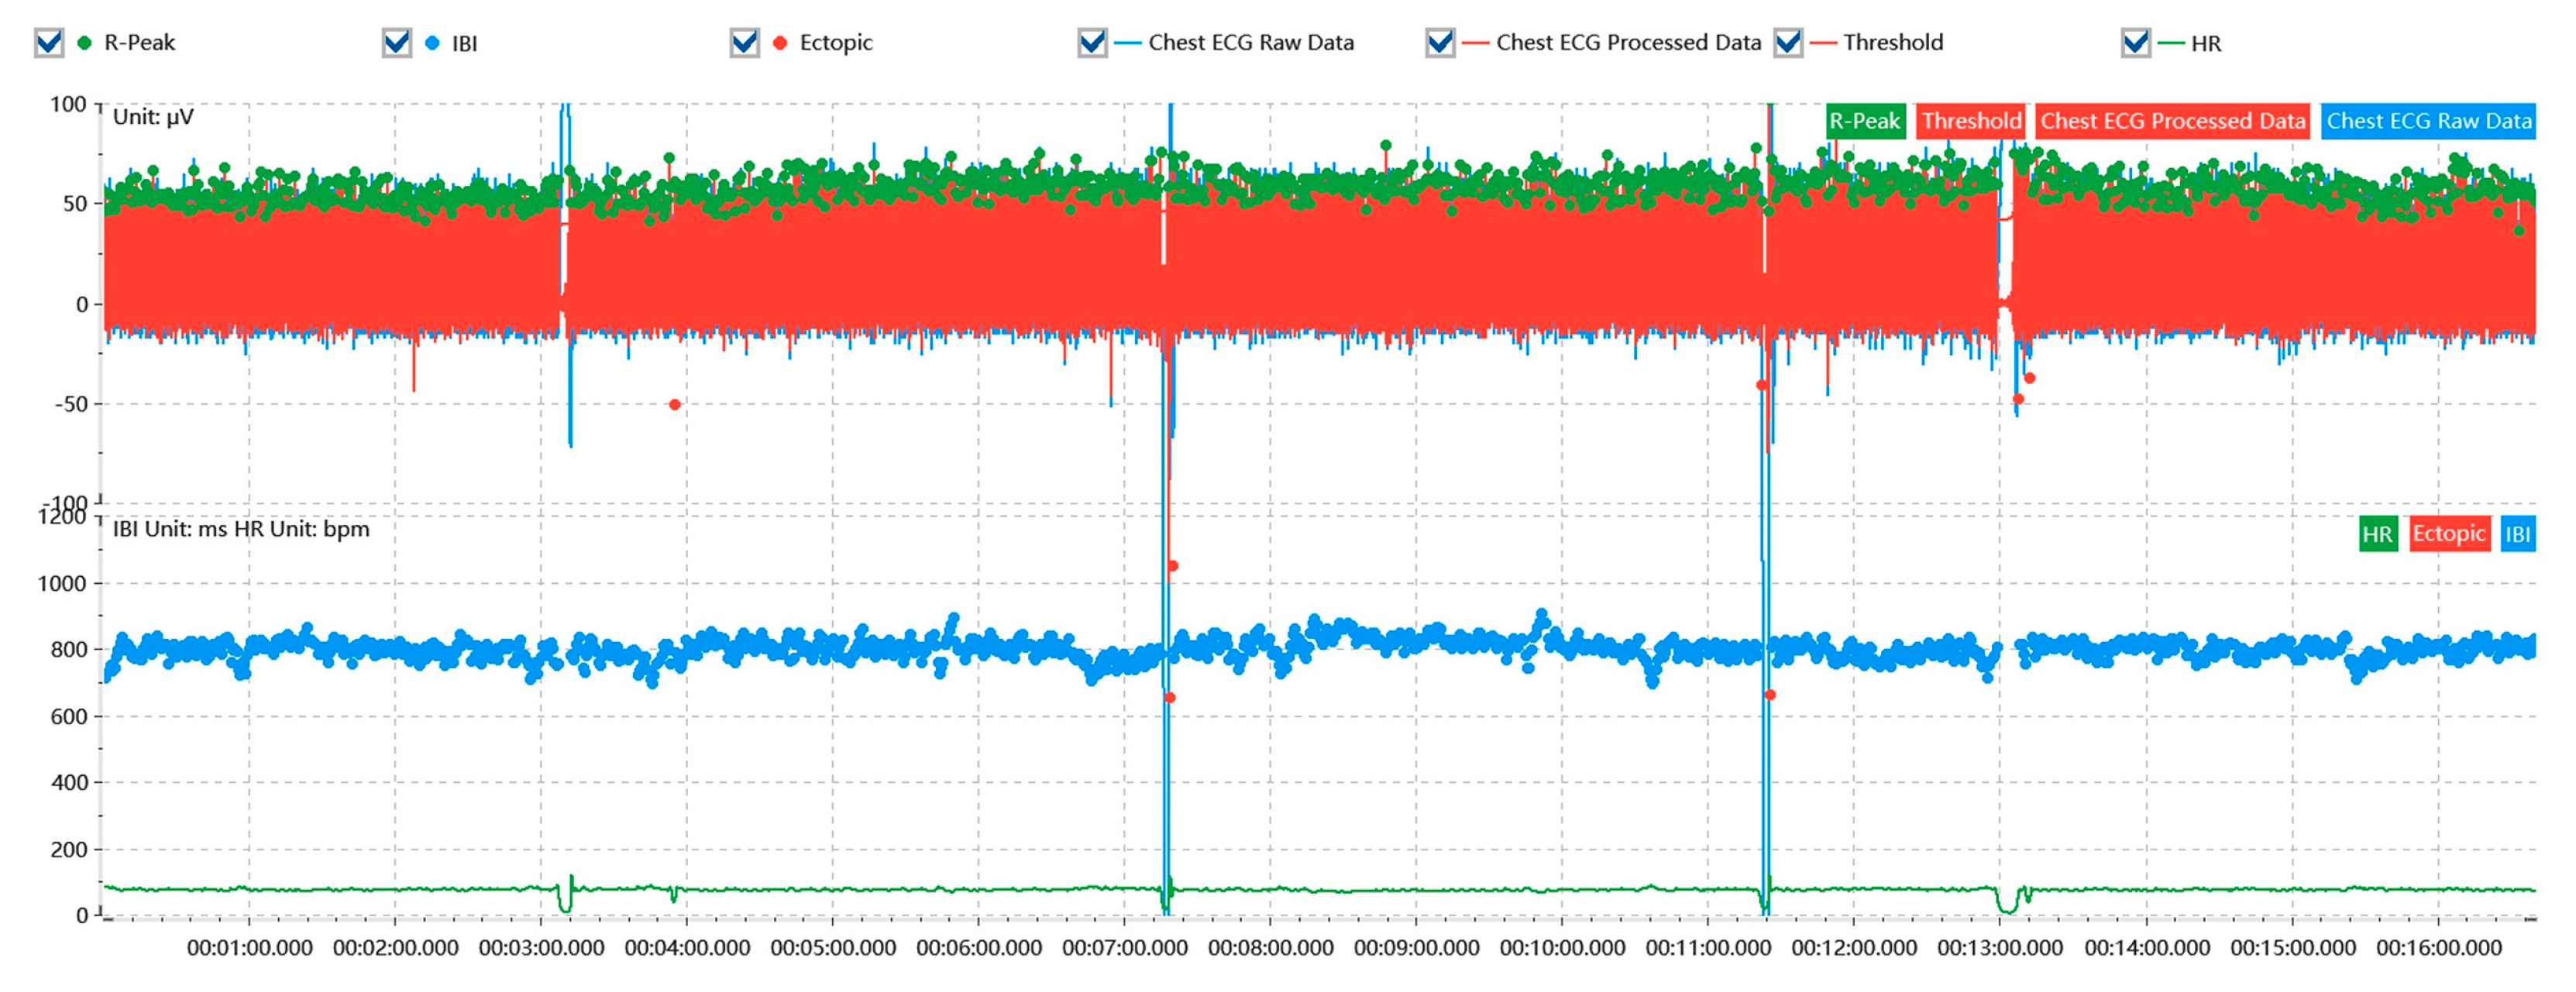
To minimize the impact of electromagnetic interference and environmental noise on the raw physiological signals, this study adopted standardized physiological signal processing techniques available on the ErgoLAB 3.0 platform, aiming to enhance signal quality and the accuracy of data interpretation. Specifically, EDA signals were denoised using a wavelet denoising method to remove baseline noise and signal drift (Figure 7). For the ECG signals, a high-pass filter threshold was set at 5 Hz and a low-pass filter threshold at 500 Hz, with a 50 Hz notch filter applied to eliminate power line interference (Figure 8). RESP signals were also subjected to wavelet denoising and were processed with the same high-pass and low-pass filter thresholds, along with a notch filter to exclude power line noise. Moreover, the extraction of R-peaks took into account a maximum breathing rate of 18 rpm, with the R-PEAK threshold set at 50%, and signals were further optimized using a sliding window averaging rectification method (Figure 9). Processed physiological data of each category were exported for subsequent analysis.

3.4.2. Emotion Signal Recognition

Given the limitations of discrete models in accurately identifying levels of emotion, this study adopted a two-dimensional emotion model for the quantitative analysis of emotions. For the task of transforming physiological data into interpretable emotional data, this research considered the application of deep learning methods. It selected the publicly available dataset CASE (Continuously Annotated Signals of Emotion) [52] published in 2019 to achieve more accurate emotion recognition. The CASE dataset offers continuous emotional annotations and a rich collection of physiological signals, including data from 30 participants (15 males and 15 females), surpassing other datasets in capturing the comprehensiveness and detail of emotional fluctuations. Furthermore, the two-dimensional emotion model utilized by the CASE dataset aligns closely with the needs of this study, employing valence and arousal dimensions for emotion assessment. For multimodal emotion recognition, the dataset was divided into a training set (70%) and a test set (30%) to develop two neural network models based on the LeNet architecture [53] for predicting valence and arousal in emotion recognition tasks.
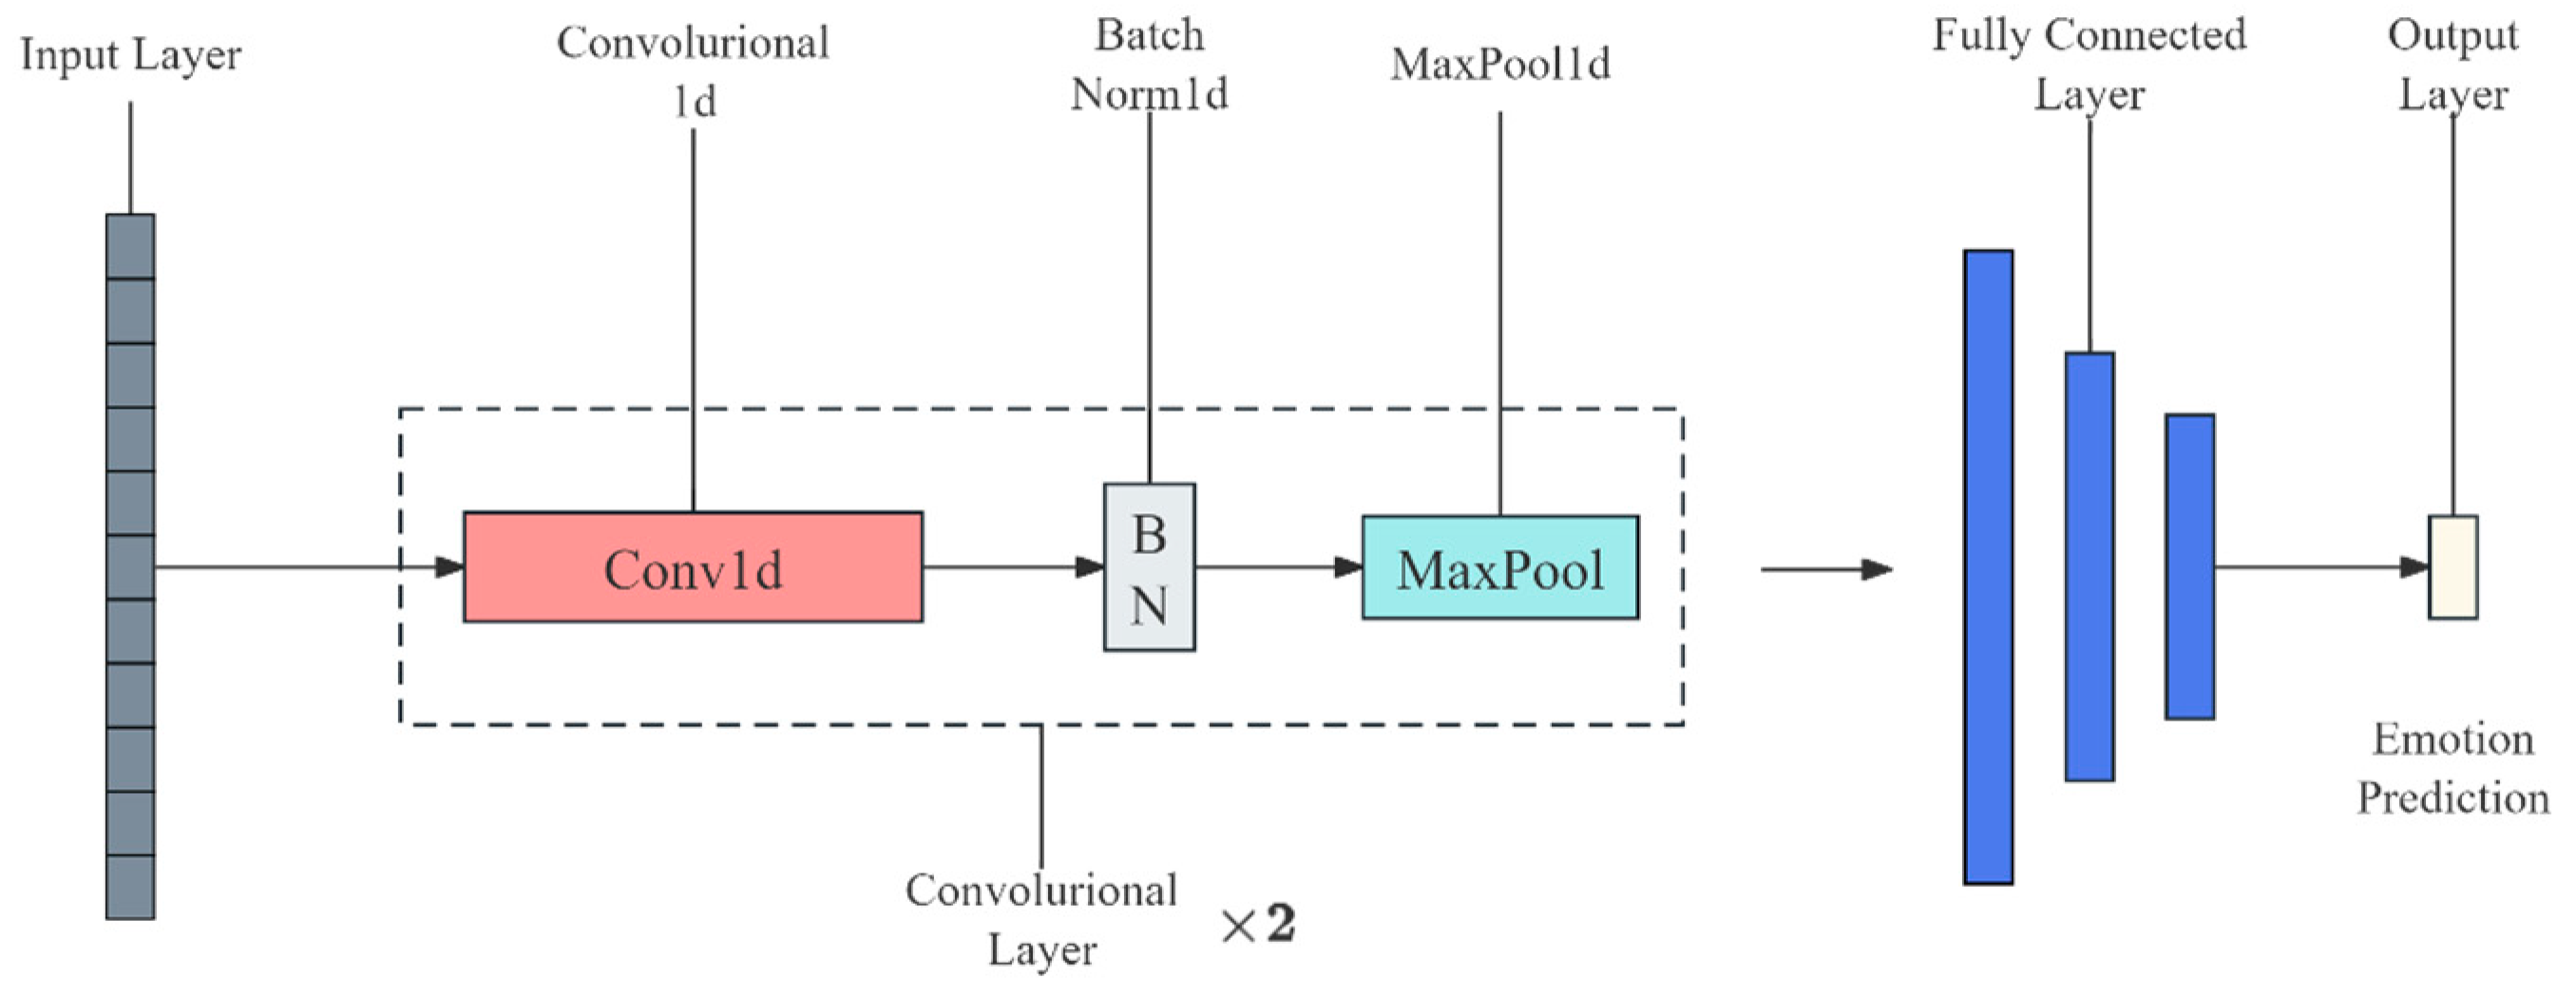
The model structure is divided into two parts, i.e., the feature extraction layer (Features) and the fully connected layer (Liners) (Figure 10). In the feature extraction segment, the model first applies a one-dimensional convolutional layer (Conv1d) with 20 filters of size 5x1 to extract features, followed by a batch normalization layer (BatchNorm1d) and a max pooling layer (MaxPool1d) to reduce the number of parameters and enhance the network’s generalization capability. The data then passes through a second convolutional layer and corresponding batch normalization and pooling layers to further refine features. In the fully connected segment, the model flattens the feature maps and processes them through a three-layer fully connected network (Linear), interspersed with activation functions (ReLU) and dropout layers (Dropout) to enhance the model’s non-linear expressive capacity and resistance to overfitting. Subsequently, it outputs a continuous scalar value as the prediction result for the regression task. Finally, the trained optimal model predicts the arousal and valence of subjects in the visual environment experiment, defining 2 s as the duration of an emotional response. The output for every 2 s generates a score for arousal and valence, with results ranging between −1 and 1.
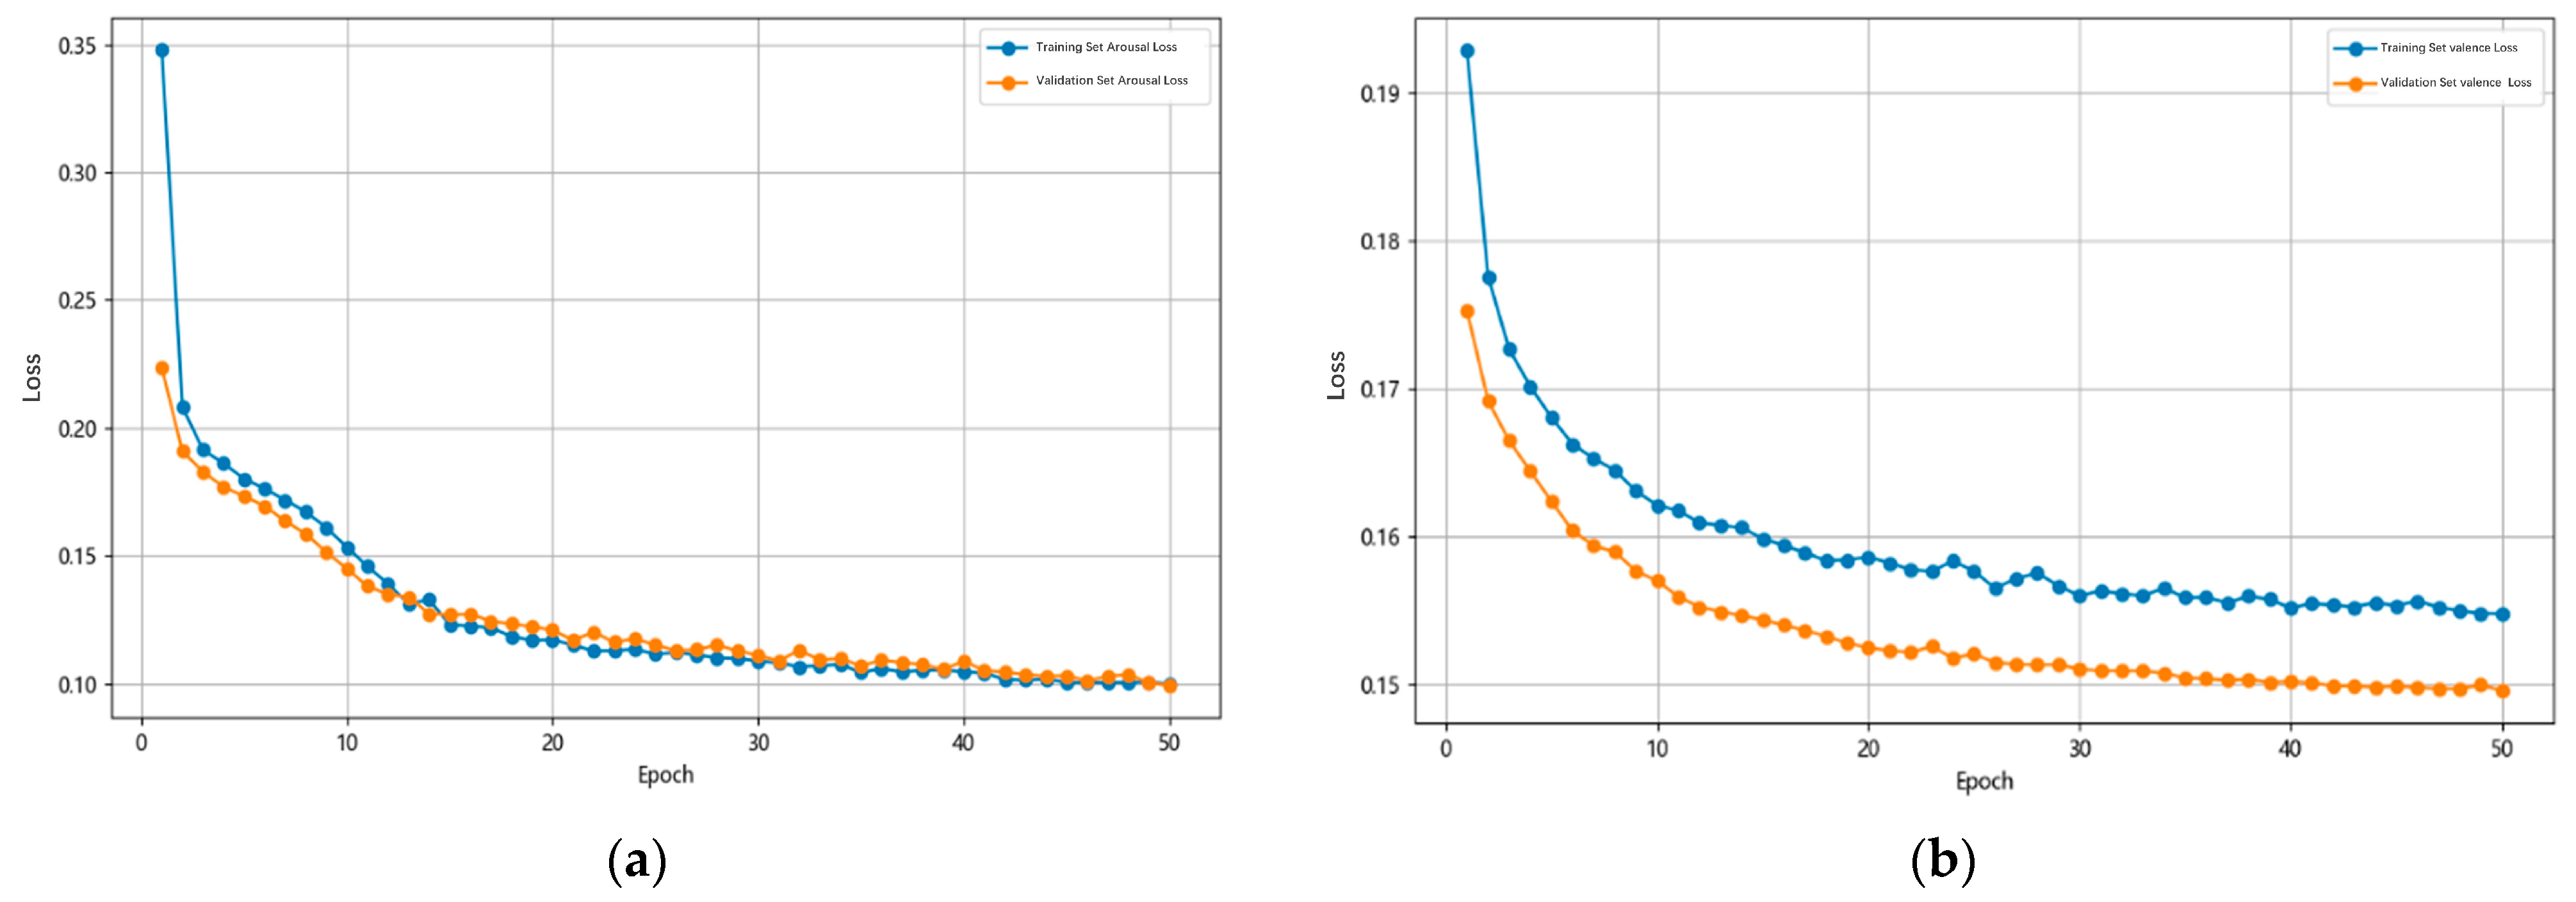
In the performance evaluation of the model, the training loss for valence was 0.18835794925689697, and for arousal, it was 0.11769991368055344. On an independent test set, the average test loss for valence was 0.1524035523335139, and for arousal, it was 0.09625050450364749. These figures indicate the model’s generalization capability on unseen data. Additionally, the model achieved its optimal test loss for both valence and arousal dimensions at the 50th training round (Figure 11).

3.4.3. Semantic Segmentation of Visual Images

This study utilizes real-scene videos as stimulus materials, which provide rich on-site information. However, due to the complexity of video data, conducting direct quantitative analysis can be a challenge. Therefore, an effective method was adopted to convert video materials into static images. Each street video has a duration of 10 s, which is sufficient to capture the various characteristics and dynamic changes of the street. Following common practice in the field of emotion recognition, 2 s is considered an appropriate time unit for effective emotion recognition. To maintain accuracy in emotional analysis, each 10-second video of the street was divided into five 2-second segments. Each segment is considered an independent unit for emotion recognition, ensuring that emotional continuity and variation are adequately considered during the analysis. For in-depth semantic segmentation analysis, one frame was selected from each 2-second segment, yielding a total of 5 images per street, resulting in 500 images in total. This conversion facilitates the application of image semantic segmentation techniques for processing and analyzing these images. This paper utilizes the ADE20K [54] dataset for scene parsing and segmentation as the training set, published by the Computer Vision Group at MIT, which is the largest open-source dataset for semantic segmentation and scene parsing. The composition of the scenes is divided into 151 categories, and the pre-trained deep learning model PSPNet (Pyramid Scene Parsing Network) [55] is used for semantic image segmentation of street scene photos (Figure 12).
Subsequently, from the 151 visual environmental elements, eight key visual variables were reclassified to assess the subjects’ street visual environment experience. Table 1 displays the following variables: green view factor (GVF), sky view factor (Sky VF), visual enclosure (VE), vehicles view factor (VVF), road view factor (RVF), sidewalk view factor (SVF), person view factor (PVF), and building view factor (BVF). These variables cover various aspects of a resident’s visual perception, including the presence of greenery, the openness of the sky, the sense of enclosure and congestion in man-made environments, and the visual impact of traffic elements in street spaces.

3.5. Statistical Analysis

In this study, both multiple linear regression models and multinomial logistic regression models are utilized to determine the relationship between different visual environments and emotional responses. Each model offers distinct advantages, with the primary difference being that emotion, as the dependent variable, can either be represented continuously through arousal and valence or categorized into four classes to correspond to four emotional quadrants. The multiple linear regression model uses the continuous values of arousal and valence as dependent variables, allowing researchers to assess how different street environment characteristics individually influence the continuous impact on emotional arousal and valence. On the other hand, the multinomial logistic regression model divides emotions into four quadrants, i.e., HAPV, HANV, LAPV, and LANV. This classification enables researchers to explore how specific street environment characteristics affect the likelihood of experiencing these four distinct types of emotional states.

3.5.1. Multiple Linear Regression Model

In this study, we effectively integrated physiological data from 50 participants to ascertain their emotional arousal and valence as dependent variables. Acknowledging the pronounced distinction between positive and negative emotional arousal and considering that the visual environmental elements of streets inducing positive or negative arousal could differ markedly, we adjusted the original arousal (A) according to the valence values. Initially, we normalized the data, resulting in (A′). Then, based on the positive or negative nature of the emotional valence, we further adjusted the arousal, defining negative arousal and positive arousal to produce the adjusted arousal (A″).
A = A + 1 2
A = { A I f   t h e   V a l e n c e   i s   p o s i t i v e A I f   t h e   V a l e n c e   i s   n e g a t i v e
Arousal, adjusted arousal, and valence were then analyzed as dependent variables. To examine the relationships among these variables, multiple linear regression was conducted using SPSS 27.0 software. Statistically, independent variables were refined and selected based on the criteria of a p-value less than 0.05 and a variance inflation factor (VIF) less than 5. The multiple linear regression equations are as follows:
A r o u s a l = β 0 + β 1 × V E 1 + β 2 × V E 2 + + β n × V E n + ε
A d j u s t e d   A r o u s a l = β 0 + β 1 × V E 1 + β 2 × V E 2 + + β n × V E n + ε
V a l e n c e = β 0 + β 1 × V E 1 + β 2 × V E 2 + + β n × V E n + ε
In these equations, arousal and valence are used as dependent variables, while VE1, VE2, …, VEn represent different visual environmental elements, acting as independent variables. Each β is the coefficient corresponding to a visual environmental element and ε is the random error term. By establishing such multiple linear regression models based on visual environmental elements, the aim is to gain a deeper understanding of how street visual environmental elements influence individuals’ arousal and valence.

3.5.2. Multinomial Logistic Regression Model

Emotions, as the dependent variable, can also be categorized into emotional quadrants based on valence and arousal, representing multiple unordered categories of the dependent variable. This study utilized SPSS software version 27.0 to conduct multinomial logistic regression, revealing the impact of visual environmental elements of streets across various emotional states. In the multinomial logistic regression model, for each non-reference category j ( j = 1,2 , , K 1 ) , the model estimates the log odds of the dependent variable Y being in category j relative to the reference category K, given the independent variables X .
l o g P Y = j | V E P Y = K | V E = β 0 j + β 1 j × V E 1 + β 2 j × V E 2 + + β n j × V E n
Here, P Y = j | V E represents the probability that the dependent variable Y falls into category j given the independent variables V E , and P Y = K | V E represents the probability for the reference category. The coefficients β 0 j , β 1 j , β 2 j , β n j describe the impact of visual environmental elements on the log odds of a specific emotional quadrant relative to the reference emotional quadrant. A positive coefficient indicates that as the independent variable increases, the odds of belonging to the corresponding category relative to the reference category increase, whereas a negative coefficient indicates a decrease in odds.
Additionally, the street visual environment variables are expressed in percentages. Considering the impact of units on the results, all eight independent variables are standardized in the multinomial logistic regression using the following formula. After standardization, the data will have a mean of 0 and a standard deviation of 1. This means that all variables will be rescaled to the same scale, allowing for fair comparison between them while preserving the information and structure in the original data.
z = x μ σ

4. Results

4.1. Descriptive Analysis

Descriptive statistical attributes of the participants are outlined in Table 2. In this experiment, a total of 55 participants were recruited. Due to disconnections of equipment or severe data interference, the data from 5 participants were rendered unusable, leaving data from 50 participants valid for analysis.
Descriptive statistical attributes of the street visual environment and participants’ emotions are outlined in Table 3. It reveals the diversity and complexity of the stimuli used, as well as the variability of these elements across different streets, thereby demonstrating that the stimuli can comprehensively represent the visual environments of urban streets. Moreover, the table showcases the diversity and complexity of people’s emotional reactions to various street visual environments. Emotional data span a wide spectrum from extreme displeasure to extreme pleasure, highlighting the multifaceted and complex impact of the visual environments of city streets on individuals’ emotional states in alignment.
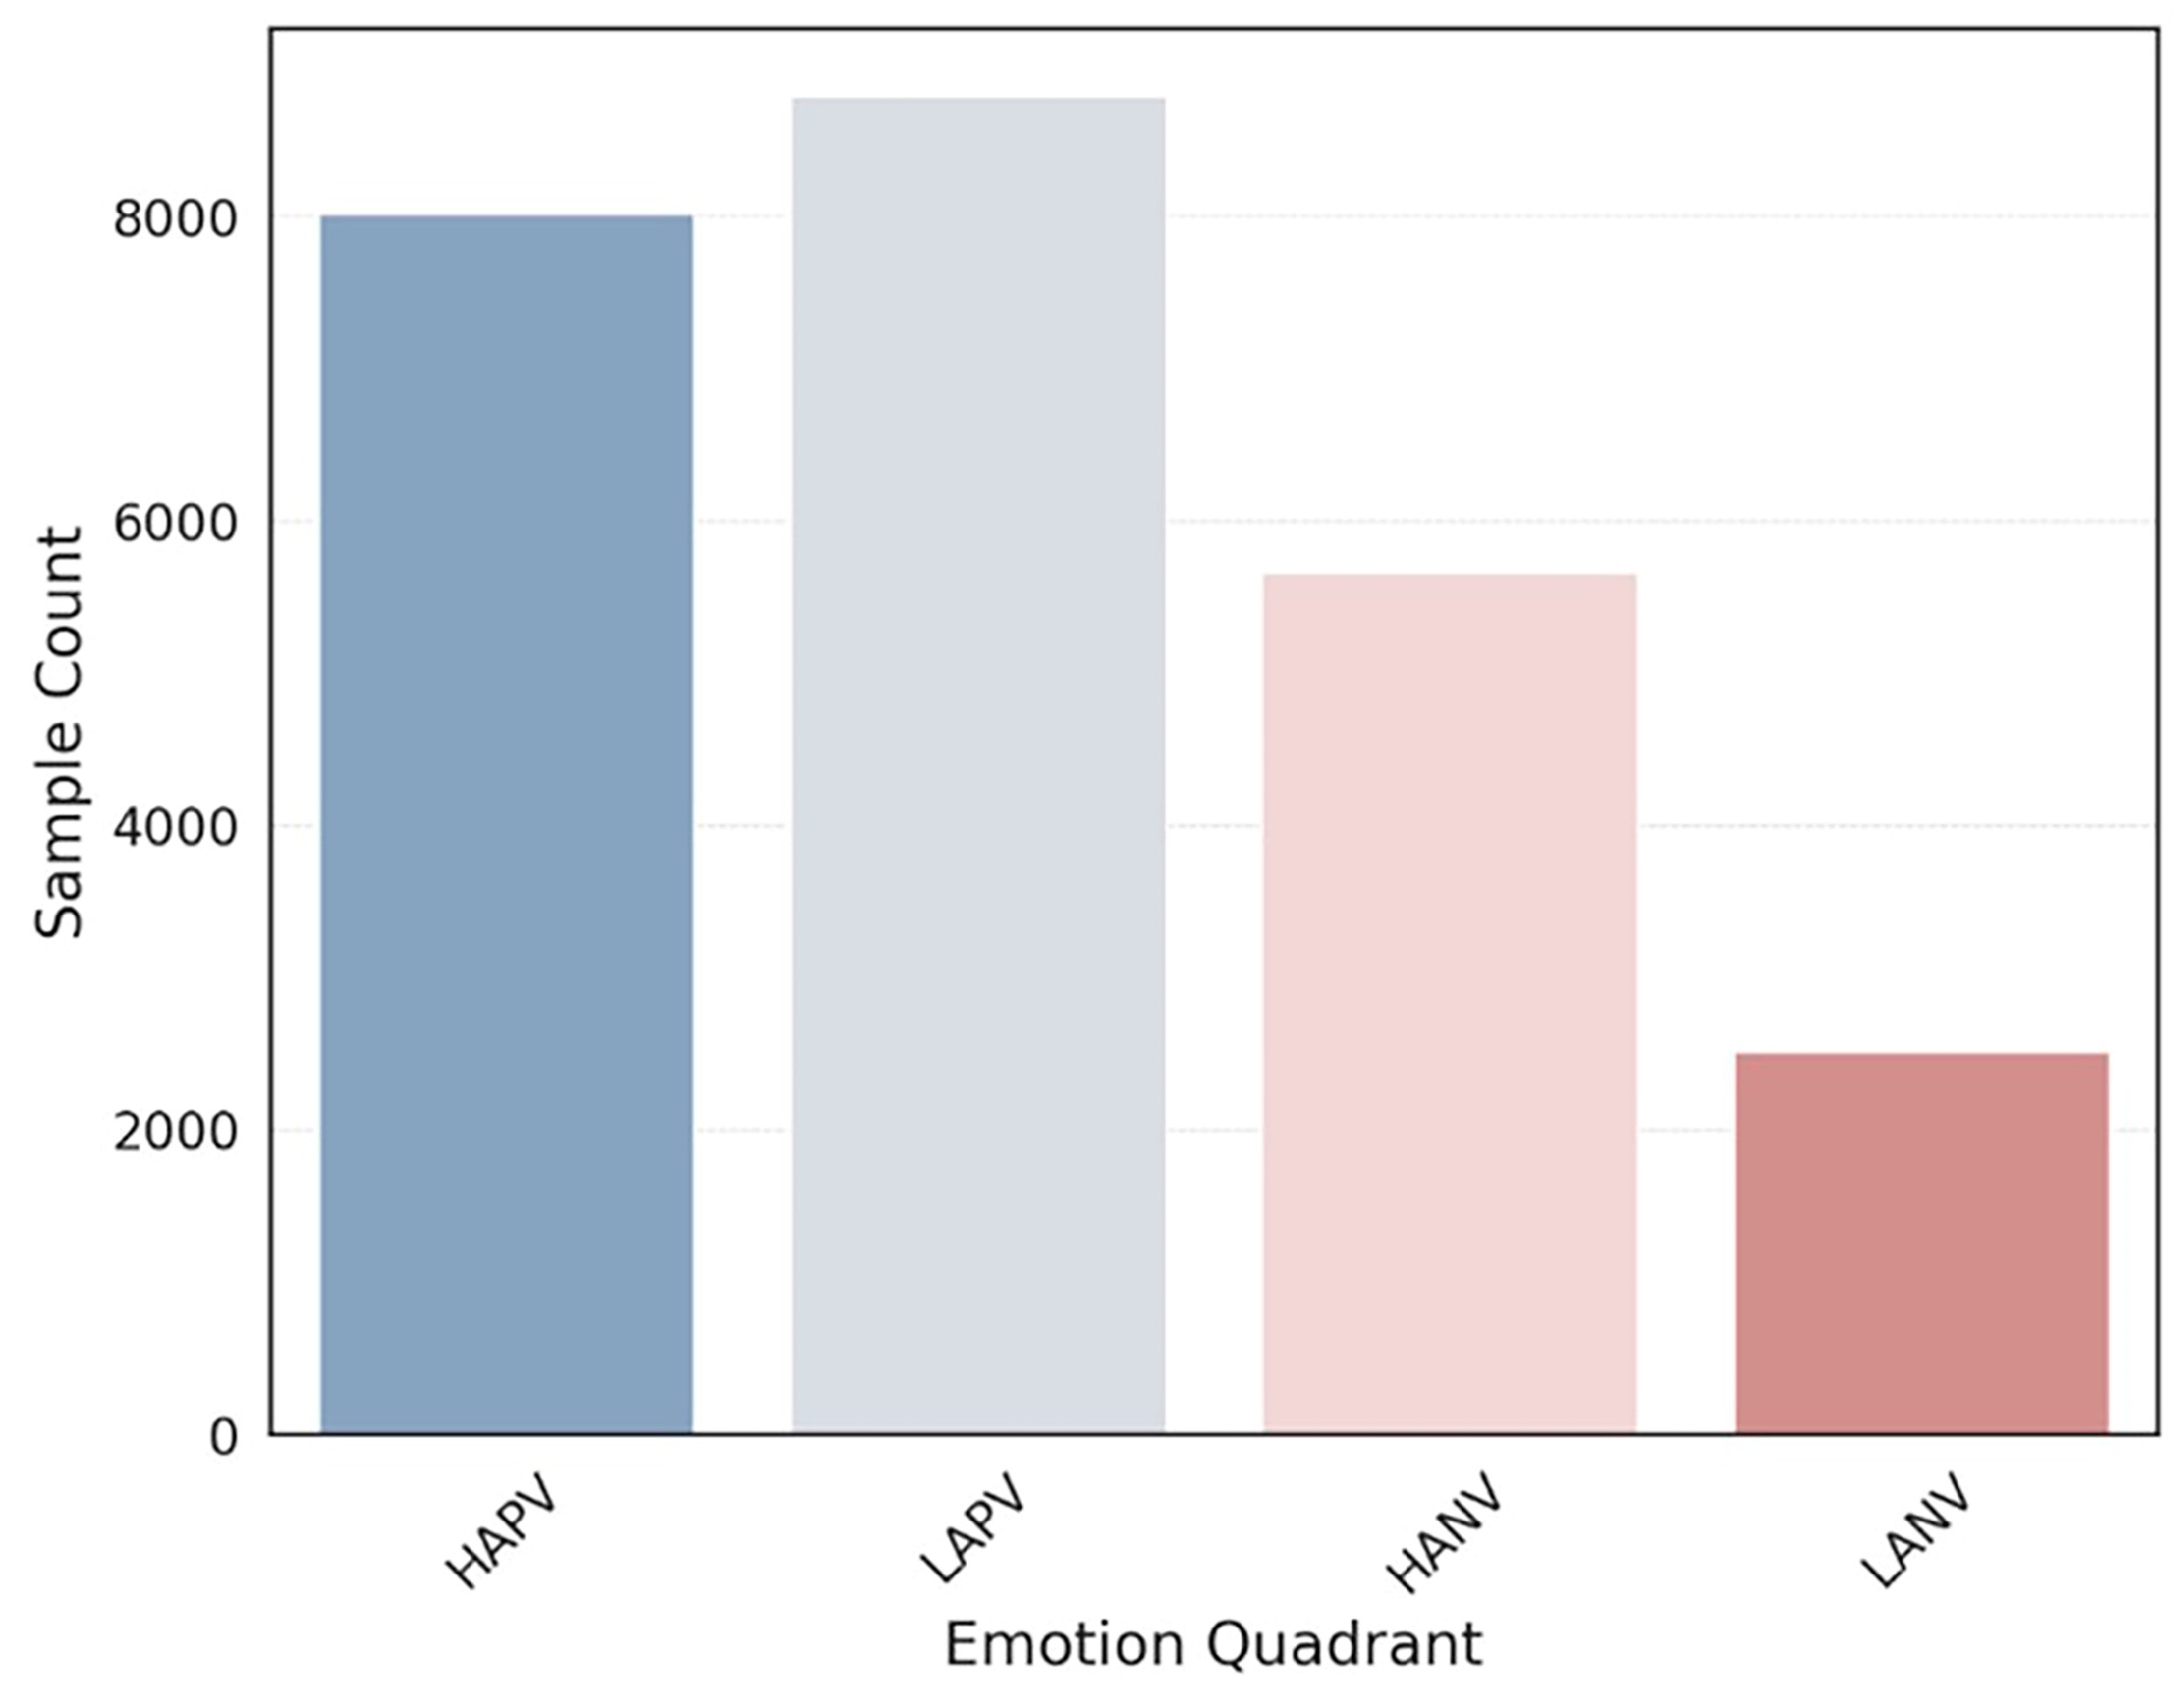
Additionally, based on the classification into emotional quadrants, there is a variation in the number of samples across different quadrants (Figure 13). The quadrants of HAPV and LAPV contain a larger number of samples, with 8025 and 8788 samples, respectively. In contrast, the quadrants of HANV and LANV have fewer samples, totaling 5668 and 2519 samples, respectively. This distribution indicates that the dataset is skewed towards representing positive emotional states over negative ones.

4.2. Multiple Linear Regression Model Results

The study explored the impact of urban environmental characteristics on emotional arousal and valence through multiple linear regression analysis. The independent variables were not collinear (VIF < 5), and residuals conformed to a normal distribution, making the final model effective and stable. Table 4 shows the model results. In the first model, with arousal as the dependent variable, the model’s R2 value was 0.012, a relatively low ratio. GVF, Sky VF, and SVF had a significant negative impact on arousal, while PVF had a positive impact on arousal. In the second model, with adjusted arousal as the dependent variable, the model’s R2 value increased to 0.144 compared to the first model, and all eight variables had a significant impact. GVF, Sky VF, and SVF showed a positive effect, while VE, VVF, RVF, PVF, and BVF exhibited negative effects. In the third model, with valence as the dependent variable, the model’s R2 value was 0.269, indicating that the selected independent variables could explain 26.9% of the variance in the dependent variable, demonstrating the model’s effectiveness in explanation. Among the eight independent variables, GVF, Sky VF, and SVF had positive impacts, while VE, VVF, RVF, and PVF had negative impacts. BVF did not show a significant effect.

4.3. Multinomial Logistic Regression Model Results

The multinomial logistic regression analysis continued to employ eight street visual elements to assess their impact on three emotional states, i.e., LAPV, HAPV, and LANV, with HANV serving as the reference category. Likelihood ratio tests conducted within the model yielded a p-value of less than 0.001 and Nagelkerke’s pseudo-R-squared value of 0.22, suggesting a robust fit and significant statistical validity of the model. Table 5 presents the model results, indicating that natural environmental elements such as GVF and Sky VF have a significant positive effect on positive emotional states LAPV and HAPV. Specifically, the ratio of GVF and Sky VF significantly increases the likelihood of experiencing low arousal and high arousal positive emotions. Conversely, man-made environmental elements like VVF, RVF, and VE have a negative impact on positive emotional states, indicating that these environmental features may reduce the likelihood of experiencing positive emotions. Additionally, SVF has a positive effect on positive emotions, while the ratio of PVF has a slight negative impact. It was observed that for LANV, SVF has a negative influence, and PVF has a positive influence, with the impact of other environmental elements being relatively minor. This phenomenon may relate to the choice of reference category. Selecting HANV as the reference category assesses other emotional states in the analysis. In this setup, the differences between LANV and HANV are not as pronounced as those between LAPV or HAPV and HANV.

5. Discussion

5.1. The Impact of Street Visual Environment on Emotions

This study established a framework to elucidate the influence of street visual environments on young adults’ emotions, leveraging objective data. The first multiple linear regression model revealed that GVF, Sky VF, and SVF effectively mitigate people’s tension, although this model exhibited a relatively low fit. Adjusting the model to distinguish between positive and negative arousal significantly enhanced the fit. The results from the adjusted model indicate that GVF, Sky VF, and SVF positively influence positive arousal, suggesting that they indeed facilitate the shift from negative to positive arousal rather than merely reducing arousal levels. This finding diverges from previous research in several ways [20,45]. Firstly, GVF, Sky VF, and SVF do not always lead to a decrease in arousal levels. In positive contexts, they can significantly elevate emotional arousal levels. Secondly, previous studies often equate arousal with stress levels [20]. However, the results suggest that equating arousal with stress might be simplistic, as high arousal levels could reflect a positive arousal state, not solely high stress levels. Additionally, VE, VVF, and PVF are associated with negative arousal, aligning with prior research findings [15,56,57,58]. The third model indicated that elements like GVF, Sky VF, and SVF positively affect emotional valence, with GVF having the most substantial impact. This highlights the significant influence of natural elements and thoughtfully designed urban infrastructure in promoting positive emotional responses, consistent with previous findings on positive arousal. Conversely, the perception of VE, VVF, RVF, and PVF tends to negatively affect emotional valence, with VVF having the most pronounced negative impact. This is likely due to their contribution to visual clutter, restricting natural visual engagement, and potentially inducing stress and anxiety associated with congestion and pollution [47]. Furthermore, BVF has a detrimental effect on positive arousal but does not significantly influence emotional valence. This indicates that the perception of BVF is associated with negative arousal but does not inherently determine the positivity or negativity of emotional responses. Rather, the emotional impact of BVF may hinge on various factors, including architectural style, aesthetic appeal, functionality, and their integration with the surrounding context. This refined perspective reveals that the emotional effects of BVF presence are complex, subtly departing from conventional interpretations seen in earlier studies [15].
Multinomial logistic regression analysis results, after categorizing the dependent variable, showed more samples in positive emotional states and fewer in negative states, indicating that streets generally positively affect emotions. GVF and Sky VF significantly correlate with high arousal positive valence states (e.g., excitement, happiness), potentially due to the biophilic restorative effect of natural elements [59]. Conversely, VE is more associated with high arousal negative valence (e.g., anxiety, fear) and low arousal negative valence (e.g., sadness, depression) emotional states, likely due to its limitation on vision and natural contact, triggering feelings of confinement and negatively inclined emotional experiences. Notably, in high arousal positive emotional states (LAPV and HAPV), the perception of Sidewalk can foster positive experiences. Conversely, in low arousal negative states (LANV), it might bring adverse effects. This reveals that, dependent on the emotional backdrop, the same environmental influences might elicit divergent reactions in individuals’ perceptions and behaviors, showcasing the nuanced and variable relationship between emotional states and the environment, a realm not extensively covered in earlier research.

5.2. Advantages and Challenges of the Research Method

Exploring the impact of street visual environments on emotions, research methodologies and technologies present various strengths and challenges. Firstly, physiological feedback technology allows for the direct detection of the physiological basis of emotions, rendering the test results free from subjective influences. However, in practical applications, it may encounter issues such as equipment precision, individual differences, and interference from other factors related to the implementation environment. Secondly, conducting research in a laboratory setting, compared to similar studies, might affect the external applicability of the results and the capacity to apply findings in broader, real-world environments. Nevertheless, this setup permits more precise measurements and control, facilitating broader data collection. Thirdly, employing deep learning techniques to transform physiological data into emotion recognition has become mainstream. This approach offers higher accuracy compared to methods used in previous similar studies [60], which either employed single physiological indicators or relied on subjective assessments to measure emotions. However, due to the lack of specialized datasets in urban research, the process of emotion signal recognition still faces accuracy challenges within the urban study domain. Lastly, the fit of multiple linear regression and multinomial logistic regression models did not meet the expected levels, possibly due to the precision of measurement devices, limitations of video stimuli, and errors in emotion recognition. This demonstrates the need to acknowledge potential limitations when adopting these novel methods. “Traditional” methods, such as interviews or surveys, though not directly probing the physiological basis of emotions, remain effective and reliable research tools. Therefore, combining these two approaches for studying the relationship between the environment and emotions may prove more effective.

5.3. Implications for Street Space Design

The built environment of cities is closely associated with various physical and mental health issues, with emotional states playing a key role in maintaining mental health. Adopting data-driven and evidence-based approaches to promote urban health development is crucial for enhancing the quality of life for city dwellers and mitigating the negative effects of high-density development [61].
This study explores the impact of street visual environments on emotions from the perspective of pedestrian zones, aiming to improve pedestrian environments through optimized spatial design. Based on the classification of urban streets in Chengdu, streets can be divided into six categories, i.e., residential streets, commercial streets, landscape streets, industrial streets, traffic streets, and specialized streets (designated pedestrian or pedestrian-friendly spaces). The sample in this study covers these categories, and data analysis results have informed the development of optional design strategies tailored to the emotional goals and needs of different street types. Overall, the street design strategies can be divided into the following two main aspects: first, strategies to promote positive emotions and well-being, primarily through enhancement; second, strategies to alleviate negative emotions and stress, primarily through control. The specific optional design strategies are summarized in Table 6.

5.4. Limitations and Future Directions

This study has its limitations. Firstly, the experimental subjects were all young people aged 20–30, lacking evidence from other population samples. Moreover, the experimental materials consisted of videos from 100 streets in five main urban districts of Chengdu, with the experiment conducted by viewing these videos. However, it is important to note that these street videos as stimulus materials might have some deficiencies in eliciting emotions, and participants may feel fatigued or numb after watching numerous videos. Additionally, semantic segmentation technology may not accurately parse all variables in the videos, potentially leading to some variables being missed or not fully captured. Other potential influences, such as sunlight, architectural style, and street type, have not been considered.
Future studies are advised to adopt more comprehensive experimental methods to collect psychophysiological data, such as establishing immersive laboratories and creating virtual reality (VR) models of real scenes. Additionally, it is recommended to explore the differences between individuals’ subjective perceptions and their physiological responses. To address the deficiencies in existing statistical models, control variables such as sound, climate, and air pollution should be included. Plans also include investigating the perception differences among various populations towards street environments and how these differences affect their psychological and physiological responses. Considering the diversity of urban environments, the impact of different types of urban spaces (such as commercial areas, residential areas, parks, etc.) on people’s perceptions and responses will also be studied. Through these research efforts, a more comprehensive understanding of the impact of urban environments on human well-being is anticipated, providing a robust scientific basis for urban planning and design.

6. Conclusions

To promote the creation of psychologically conducive street environments, this study explored the influence of street visual elements on individuals’ emotional states through multiple linear regression and multinomial logistic regression analyses. The methodological innovation of the study is reflected in the following two aspects. First, it utilized video stimuli for effective observation across a large sample of street scenes; second, it employed deep learning technology to convert multimodal physiological signals into quantifiable measures of emotional valence and arousal, enabling precise quantification of two-dimensional emotional states. These methodological advancements offer new perspectives and tools for examining the effects of urban environments on residents’ emotional well-being.
The study yields the following key conclusions: First, street environmental elements such as Sky VF, GVF, and SVF significantly contribute to shifting emotions from negative to positive arousal, rather than simply reducing arousal levels. Second, environmental elements like VE, VVF, and PVF are associated with negative emotional arousal and adversely affect emotional valence. Third, the same environmental factor may have differing impacts depending on the emotional context.
This investigation highlights the potential and efficacy of applying physiological feedback and deep learning technologies in urban studies. The regression models developed through this approach facilitate a deeper understanding of human emotional reactions in various visual environments, offering precise, concrete, quantifiable, and actionable insights for urban planners and designers. Furthermore, these insights contribute significantly to the development of smart and sustainable cities by enabling data-driven decisions that enhance urban living experiences.

Author Contributions

Conceptualization, W.Z. and L.T.; methodology, W.Z.; software, L.T.; validation, W.Z., S.N. and L.Q.; formal analysis, L.T.; investigation, L.T.; resources, W.Z.; data curation, L.T.; writing—original draft preparation, W.Z. and L.Q.; writing—review and editing, W.Z., S.N. and L.T.; visualization, L.T.; supervision, S.N.; project administration, S.N. All authors have read and agreed to the published version of the manuscript.

Funding

This work was supported by the Key Research and Development Program of Chengdu, China [grant number 2023-YF09-0019-SN].

Institutional Review Board Statement

The study was conducted according to the guidelines of the Declaration of Helsinki and approved by the Internal Review Board of the College of Architecture and Environment.

Informed Consent Statement

Informed consent was obtained from all subjects involved in the study.

Data Availability Statement

Data are available upon reasonable request from the corresponding authors due to privacy/ethical restrictions.

Acknowledgments

Our sincere thanks go to Jiayi Wu, Tengfei Han, Yike Chen, and all other participants for their invaluable assistance with the experiments.

Conflicts of Interest

The authors declare no conflicts of interest.

References

  1. Andres, L.; Bryson, J.R.; Moawad, P. Temporary Urbanisms as Policy Alternatives to Enhance Health and Well-Being in the Post-Pandemic City. Curr. Environ. Health Rep. 2021, 8, 167–176. [Google Scholar] [CrossRef] [PubMed]
  2. Esterwood, E.; Saeed, S.A. Past Epidemics, Natural Disasters, COVID19, and Mental Health: Learning from History as We Deal with the Present and Prepare for the Future. Psychiatr. Q. 2020, 91, 1121–1133. [Google Scholar] [CrossRef] [PubMed]
  3. Jamshaid, S.; Bahadar, N.; Jamshed, K.; Rashid, M.; Imran Afzal, M.; Tian, L.; Umar, M.; Feng, X.; Khan, I.; Zong, M. Pre- and Post-Pandemic (COVID-19) Mental Health of International Students: Data from a Longitudinal Study. Psychol. Res. Behav. Manag. 2023, 16, 431–446. [Google Scholar] [CrossRef] [PubMed]
  4. Jacobs, J. The Death and Life of Great American Cities; Random House: New York, NY, USA, 1961. [Google Scholar]
  5. Wu, Y.-T.; Nash, P.; Barnes, L.E.; Minett, T.; Matthews, F.E.; Jones, A.; Brayne, C. Assessing Environmental Features Related to Mental Health: A Reliability Study of Visual Streetscape Images. BMC Public Health 2014, 14, 1094. [Google Scholar] [CrossRef] [PubMed]
  6. El Barachi, M.; AlKhatib, M.; Mathew, S.; Oroumchian, F. A Novel Sentiment Analysis Framework for Monitoring the Evolving Public Opinion in Real-Time: Case Study on Climate Change. J. Clean. Prod. 2021, 312, 127820. [Google Scholar] [CrossRef]
  7. Bibri, S.E.; Krogstie, J. Smart Sustainable Cities of the Future: An Extensive Interdisciplinary Literature Review. Sustain. Cities Soc. 2017, 31, 183–212. [Google Scholar] [CrossRef]
  8. Watson, D.; Clark, L.A.; Tellegen, A. Development and Validation of Brief Measures of Positive and Negative Affect: The PANAS Scales. J. Personal. Soc. Psychol. 1988, 54, 1063–1070. [Google Scholar] [CrossRef] [PubMed]
  9. Kennedy-Moore, E.; Greenberg, M.A.; Newman, M.G.; Stone, A.A. The Relationship between Daily Events and Mood: The Mood Measure May Matter. Motiv. Emot. 1992, 16, 143–155. [Google Scholar] [CrossRef]
  10. Gaoua, N.; Grantham, J.; Racinais, S.; El Massioui, F. Sensory Displeasure Reduces Complex Cognitive Performance in the Heat. J. Environ. Psychol. 2012, 32, 158–163. [Google Scholar] [CrossRef]
  11. Lin, W.; Chen, Q.; Jiang, M.; Tao, J.; Liu, Z.; Zhang, X.; Wu, L.; Xu, S.; Kang, Y.; Zeng, Q. Sitting or Walking? Analyzing the Neural Emotional Indicators of Urban Green Space Behavior with Mobile EEG. J. Urban Health 2020, 97, 191–203. [Google Scholar] [CrossRef]
  12. Ding, X.; Guo, X.; Lo, T.T.; Wang, K. The Spatial Environment Affects Human Emotion Perception-Using Physiological Signal Modes. In Proceedings of the 27th International Conference of the Association for Computer-Aided Architectural Design Research in Asia (CAADRIA), Sydney, Australia, 9–15 April 2022; pp. 425–434. [Google Scholar] [CrossRef]
  13. Chen, Z.; Schulz, S.; Qiu, M.; Yang, W.; He, X.; Wang, Z.; Yang, L. Assessing Affective Experience of In-Situ Environmental Walk via Wearable Biosensors for Evidence-Based Design. Cogn. Syst. Res. 2018, 52, 970–977. [Google Scholar] [CrossRef]
  14. Zhang, Z.; Zhuo, K.; Wei, W.; Li, F.; Yin, J.; Xu, L. Emotional Responses to the Visual Patterns of Urban Streets: Evidence from Physiological and Subjective Indicators. Int. J. Environ. Res. Public Health 2021, 18, 9677. [Google Scholar] [CrossRef] [PubMed]
  15. Xiang, L.; Cai, M.; Ren, C.; Ng, E. Modeling Pedestrian Emotion in High-Density Cities Using Visual Exposure and Machine Learning: Tracking Real-Time Physiology and Psychology in Hong Kong. Build. Environ. 2021, 205, 108273. [Google Scholar] [CrossRef]
  16. Zhang, R. Integrating Ergonomics Data and Emotional Scale to Analyze People’s Emotional Attachment to Different Landscape Features in the Wudaokou Urban Park. Front. Archit. Res. 2023, 12, 175–187. [Google Scholar] [CrossRef]
  17. Yuan, Y.; Wang, L.; Wu, W.; Zhong, S.; Wang, M. Locally Contextualized Psycho-Physiological Wellbeing Effects of Environmental Exposures: An Experimental-Based Evidence. Urban For. Urban Green. 2023, 88, 128070. [Google Scholar] [CrossRef]
  18. Shaoming, Z.; Yuan, Y.; Linting, W. Impacts of Urban Environment on Women’s Emotional Health and Planning Improving Strategies: An Empirical Study of Guangzhou Based on Neuroscience Experiments. China City Plan. Rev. 2023, 32, 17–27. [Google Scholar]
  19. Kim, J.; Kim, N. Quantifying Emotions in Architectural Environments Using Biometrics. Appl. Sci. 2022, 12, 9998. [Google Scholar] [CrossRef]
  20. Cai, M.; Xiang, L.; Ng, E. How Does the Visual Environment Influence Pedestrian Physiological Stress? Evidence from High-Density Cities Using Ambulatory Technology and Spatial Machine Learning. Sustain. Cities Soc. 2023, 96, 104695. [Google Scholar] [CrossRef]
  21. Deng, L.; Li, X.; Luo, H.; Fu, E.-K.; Ma, J.; Sun, L.-X.; Huang, Z.; Cai, S.-Z.; Jia, Y. Empirical Study of Landscape Types, Landscape Elements and Landscape Components of the Urban Park Promoting Physiological and Psychological Restoration. Urban For. Urban Green. 2020, 48, 126488. [Google Scholar] [CrossRef]
  22. Jiang, B.; Chang, C.-Y.; Sullivan, W.C. A Dose of Nature: Tree Cover, Stress Reduction, and Gender Differences. Landsc. Urban Plan. 2014, 132, 26–36. [Google Scholar] [CrossRef]
  23. Li, D.; Sullivan, W.C. Impact of Views to School Landscapes on Recovery from Stress and Mental Fatigue. Landsc. Urban Plan. 2016, 148, 149–158. [Google Scholar] [CrossRef]
  24. Von Leupoldt, A.; Vovk, A.; Bradley, M.M.; Keil, A.; Lang, P.J.; Davenport, P.W. The Impact of Emotion on Respiratory-Related Evoked Potentials. Psychophysiology 2010, 47, 579–586. [Google Scholar] [CrossRef] [PubMed]
  25. Bower, I.; Tucker, R.; Enticott, P.G. Impact of Built Environment Design on Emotion Measured via Neurophysiological Correlates and Subjective Indicators: A Systematic Review. J. Environ. Psychol. 2019, 66, 101344. [Google Scholar] [CrossRef]
  26. Thompson, R.A. Emotional Regulation and Emotional Development. Educ. Psychol. Rev. 1991, 3, 269–307. [Google Scholar] [CrossRef]
  27. Hasnul, M.A.; Aziz, N.A.A.; Alelyani, S.; Mohana, M.; Aziz, A.A. Electrocardiogram-Based Emotion Recognition Systems and Their Applications in Healthcare—A Review. Sensors 2021, 21, 5015. [Google Scholar] [CrossRef] [PubMed]
  28. Ekman, P. An Argument for Basic Emotions. Cogn. Emot. 1992, 6, 169–200. [Google Scholar] [CrossRef]
  29. Russell, J.A. A Circumplex Model of Affect. J. Personal. Soc. Psychol. 1980, 39, 1161–1178. [Google Scholar] [CrossRef]
  30. Picard, R.W. Affective Computing; The MIT Press: Cambridge, MA, USA, 2000. [Google Scholar] [CrossRef]
  31. Bota, P.J.; Wang, C.; Fred, A.L.N.; Placido Da Silva, H. A Review, Current Challenges, and Future Possibilities on Emotion Recognition Using Machine Learning and Physiological Signals. IEEE Access 2019, 7, 140990–141020. [Google Scholar] [CrossRef]
  32. Shu, L.; Xie, J.; Yang, M.; Li, Z.; Li, Z.; Liao, D.; Xu, X.; Yang, X. A Review of Emotion Recognition Using Physiological Signals. Sensors 2018, 18, 2074. [Google Scholar] [CrossRef]
  33. Picard, R.W.; Vyzas, E.; Healey, J. Toward Machine Emotional Intelligence: Analysis of Affective Physiological State. IEEE Trans. Pattern Anal. Mach. Intell. 2001, 23, 1175–1191. [Google Scholar] [CrossRef]
  34. Birenboim, A.; Dijst, M.; Scheepers, F.E.; Poelman, M.P.; Helbich, M. Wearables and Location Tracking Technologies for Mental-State Sensing in Outdoor Environments. Prof. Geogr. 2019, 71, 449–461. [Google Scholar] [CrossRef]
  35. Li, Q.; Liu, Y.; Yan, F.; Zhang, Q.; Liu, C. Emotion Recognition Based on Multiple Physiological Signals. Biomed. Signal Process. Control 2023, 85, 104989. [Google Scholar] [CrossRef]
  36. Jos, J. Brand Experience: What Is It? How Is It Measured? Does It Affect Loyalty? J. Mark. 2009, 73, 52–68. [Google Scholar]
  37. Kiefer, P.; Giannopoulos, I.; Raubal, M.; Duchowski, A. Eye Tracking for Spatial Research: Cognition, Computation, Challenges. Spat. Cogn. Comput. 2017, 17, 1–19. [Google Scholar] [CrossRef]
  38. Kaparias, I.; Hirani, J.; Bell, M.G.H.; Mount, B. Pedestrian Gap Acceptance Behavior in Street Designs with Elements of Shared Space. Transp. Res. Rec. 2016, 2586, 17–27. [Google Scholar] [CrossRef]
  39. Harvey, C.; Aultman-Hall, L.; Hurley, S.E.; Troy, A. Effects of Skeletal Streetscape Design on Perceived Safety. Landsc. Urban Plan. 2015, 142, 18–28. [Google Scholar] [CrossRef]
  40. Jiang, Y.; Han, Y.; Liu, M.; Ye, Y. Street Vitality and Built Environment Features: A Data-Informed Approach from Fourteen Chinese Cities. Sustain. Cities Soc. 2022, 79, 103724. [Google Scholar] [CrossRef]
  41. Sarkar, C.; Webster, C.; Gallacher, J. Residential Greenness and Prevalence of Major Depressive Disorders: A Cross-Sectional, Observational, Associational Study of 94,879 Adult UK Biobank Participants. Lancet Planet. Health 2018, 2, e162–e173. [Google Scholar] [CrossRef]
  42. Zhang, H. Affective Appraisal of Residents and Visual Elements in the Neighborhood: A Case Study in an Established Suburban Community. Landsc. Urban Plan. 2011, 101, 11–21. [Google Scholar] [CrossRef]
  43. Cullen, G. Concise Townscape; Routledge: London, UK, 2012. [Google Scholar] [CrossRef]
  44. Zhang, H.; Nam, N.D.; Hu, Y.-C. The Impacts of Visual Factors on Resident’s Perception, Emotion and Place Attachment. Environ.-Behav. Proc. J. 2020, 5, 237–243. [Google Scholar] [CrossRef]
  45. Olszewska-Guizzo, A.; Sia, A.; Fogel, A.; Ho, R. Features of Urban Green Spaces Associated with Positive Emotions, Mindfulness and Relaxation. Sci. Rep. 2022, 12, 20695. [Google Scholar] [CrossRef] [PubMed]
  46. Zhang, F.; Zhang, D.; Liu, Y.; Lin, H. Representing Place Locales Using Scene Elements. Comput. Environ. Urban Syst. 2018, 71, 153–164. [Google Scholar] [CrossRef]
  47. Chen, C.; Li, H.; Luo, W.; Xie, J.; Yao, J.; Wu, L.; Xia, Y. Predicting the Effect of Street Environment on Residents’ Mood States in Large Urban Areas Using Machine Learning and Street View Images. Sci. Total Environ. 2022, 816, 151605. [Google Scholar] [CrossRef]
  48. Roe, J.; Thompson, C.; Aspinall, P.; Brewer, M.; Duff, E.; Miller, D.; Mitchell, R.; Clow, A. Green Space and Stress: Evidence from Cortisol Measures in Deprived Urban Communities. Int. J. Environ. Res. Public Health 2013, 10, 4086–4103. [Google Scholar] [CrossRef] [PubMed]
  49. Berman, M.G.; Jonides, J.; Kaplan, S. The Cognitive Benefits of Interacting with Nature. Psychol. Sci. 2008, 19, 1207–1212. [Google Scholar] [CrossRef] [PubMed]
  50. Liao, B.; Van Den Berg, P.E.W.; Van Wesemael, P.J.V.; Arentze, T.A. Individuals’ Perception of Walkability: Results of a Conjoint Experiment Using Videos of Virtual Environments. Cities 2022, 125, 103650. [Google Scholar] [CrossRef]
  51. ErgoLAB Human-Machine Environment Synchronous Cloud Platform. Available online: https://www.ergolab.cn/ (accessed on 6 March 2024).
  52. Sharma, K.; Castellini, C.; Van Den Broek, E.L.; Albu-Schaeffer, A.; Schwenker, F. A Dataset of Continuous Affect Annotations and Physiological Signals for Emotion Analysis. Sci. Data 2019, 6, 196. [Google Scholar] [CrossRef]
  53. LeCun, Y.; Boser, B.E.; Denker, J.S.; Henderson, D.; Howard, R.E.; Hubbard, W.E.; Jackel, L.D. Handwritten Digit Recognition with a Back-Propagation Network. In Proceedings of the Advances in Neural Information Processing Systems, Denver, CO, USA, 27–30 November 1989. [Google Scholar]
  54. Zhou, B.; Zhao, H.; Puig, X.; Fidler, S.; Barriuso, A.; Torralba, A. Scene Parsing through ADE20K Dataset. In Proceedings of the 2017 IEEE Conference on Computer Vision and Pattern Recognition (CVPR), Honolulu, HI, USA, 21–26 July 2017; pp. 5122–5130. [Google Scholar] [CrossRef]
  55. Zhao, H.; Shi, J.; Qi, X.; Wang, X.; Jia, J. Pyramid Scene Parsing Network. In Proceedings of the 2017 IEEE Conference on Computer Vision and Pattern Recognition (CVPR), Honolulu, HI, USA, 21–26 July 2017; pp. 6230–6239. [Google Scholar] [CrossRef]
  56. De Vries, S.; Van Dillen, S.M.E.; Groenewegen, P.P.; Spreeuwenberg, P. Streetscape Greenery and Health: Stress, Social Cohesion and Physical Activity as Mediators. Soc. Sci. Med. 2013, 94, 26–33. [Google Scholar] [CrossRef]
  57. Song, Y.; Gee, G.C.; Fan, Y.; Takeuchi, D.T. Do Physical Neighborhood Characteristics Matter in Predicting Traffic Stress and Health Outcomes? Transp. Res. Part F Traffic Psychol. Behav. 2007, 10, 164–176. [Google Scholar] [CrossRef]
  58. Shi, S.; Gou, Z.; Chen, L.H.C. How Does Enclosure Influence Environmental Preferences? A Cognitive Study on Urban Public Open Spaces in Hong Kong. Sustain. Cities Soc. 2014, 13, 148–156. [Google Scholar] [CrossRef]
  59. Samus, A.; Freeman, C.; Van Heezik, Y.; Krumme, K.; Dickinson, K.J.M. How Do Urban Green Spaces Increase Well-Being? The Role of Perceived Wildness and Nature Connectedness. J. Environ. Psychol. 2022, 82, 101850. [Google Scholar] [CrossRef]
  60. Space-Time Analytics of Human Physiology for Urban Planning—ScienceDirect. Available online: https://www.sciencedirect.com/science/article/pii/S0198971520302878 (accessed on 26 February 2024).
  61. Bibri, S.E. The Anatomy of the Data-Driven Smart Sustainable City: Instrumentation, Datafication, Computerization and Related Applications. J. Big Data 2019, 6, 59. [Google Scholar] [CrossRef]
Figure 1. Circular emotion model [29].
Buildings 14 01730 g001
Figure 2. The framework of this study.
Buildings 14 01730 g002
Figure 3. Study area and sampling point.
Buildings 14 01730 g003
Figure 4. How to wear wireless wearable devices [51].
Buildings 14 01730 g004
Figure 5. Experiment process.
Buildings 14 01730 g005
Figure 6. Experimental display.
Buildings 14 01730 g006
Figure 7. EDA preprocessing.
Buildings 14 01730 g007
Figure 8. ECG preprocessing.
Buildings 14 01730 g008
Figure 9. RESP preprocessing.
Buildings 14 01730 g009
Figure 10. LeNet model architecture.
Buildings 14 01730 g010
Figure 11. Training LOSS graph. (a) Loss of arousal for each training and validation set epoch. (b) Loss of valence for each training and validation set epoch.
Buildings 14 01730 g011
Figure 12. Segmentation results.
Buildings 14 01730 g012
Figure 13. Sample count by emotion quadrant.
Buildings 14 01730 g013
Table 1. The potential independent variables in statistical analysis.
VariableFeaturesFormula
Green view factor (GVF)Percentage of green plant pixels of the street view imageGVF = G r e e n   P l a n t   P i x e l s P
Sky view factor
(Sky VF)
Percentage of sky pixels of the street view imageSky VF =   S k y   p i x e l s P
Visual enclosure
(VE)
Percentage of vertical terrain features pixels in the street view imageVE = V e r t i c a l   T e r r a i n   F e a t u r e s   P i x e l s P
Vehicles view factor (VVF)Percentage of non-motorized and motorized vehicle pixels in the street view imageVVF = V e h i c l e   P i x e l s P
Road view factor (RVF)Percentage of road pixels of the street view imageRVF = R o a d   p i x e l s P
Sidewalk view factor (SVF)Percentage of sidewalk pixels of the street view imageSVF = S i d e w a l k   p i x e l s P
Person view factor (PVF)Percentage of person pixels of the street view imagePVF = P e r s o n   p i x e l s P
Building view factor (BVF)Percentage of building pixels of the street view imageBVF = B u i l d i n g   p i x e l s P
Table 2. Participant information statistics.
Characteristics of ParticipantsVariantN (%)
GenderMale27 (54%)
Female23 (46%)
Age18–22 years4 (8%)
23–25 years20 (40%)
Over 25 years26 (52%)
Educational BackgroundBachelor Student20 (40%)
Master Student28 (56%)
Doctoral Student2 (4%)
Table 3. Descriptive statistical attributes of street visual environment and participants’ emotions.
VariablesMeanSDMinMax
Street visual environmental characteristics
GVF0.3260.1670.000050.759
Sky VF0.080.070.000060.364
VE0.5160.1050.190.825
VVF0.040.04500.257
RVF0.0860.06200.35
SVF0.1290.06800.379
PVF0.0110.0200.179
BVF0.2140.12900.582
participants’ emotional characteristics
Arousal0.0770.6−11
Adjusted Arousal0.0160.616−11
Valence0.1630.432−0.9990.996
Table 4. The results of the multiple linear regression.
VariablesModel 1 (Arousal)Model 2 (Adjusted Arousal)Model 3 (Valence)VIF
Standardized CoefficientsStandardized CoefficientsStandardized Coefficients
GVF−0.069 ***0.248 ***0.295 ***2.123
Sky VF−0.065 ***0.195 ***0.274 ***3.339
VE−0.003−0.059 ***−0.109 ***3.184
VVF0.008−0.065 ***−0.156 ***1.461
RVF0.011−0.048 ***−0.119 ***1.448
SVF−0.047 ***0.090 ***0.210 ***1.284
PVF0.019 *−0.074 ***−0.141 ***1.418
BVF−0.003−0.066 ***−0.0071.796
R-squared0.0120.1440.269
Note: Significance * p < 0.05, ** p < 0.01, *** p < 0.001.
Table 5. The results of the multinomial logistics regression.
Emotional StateVariablesβSEWaldExp (β)
LAPVGVF ***0.6680.027615.5661.950
Sky VF ***0.6820.036362.3001.977
VE ***−0.1630.03225.5840.850
VVF ***−0.2970.021192.3980.743
RVF ***−0.2330.021117.8300.792
SVF ***0.4310.021421.7931.539
PVF ***−0.3310.023215.9810.718
BVF0.0100.0230.1901.010
HAPVGVF ***0.6920.028623.4931.997
Sky VF ***0.6850.036352.7551.983
VE ***−0.2120.03341.2230.809
VVF ***−0.3700.022271.0040.691
RVF ***−0.2630.022140.2960.769
SVF ***0.4520.022442.0221.572
PVF ***−0.3190.023193.7560.727
BVF−0.0070.0240.0850.993
LANVGVF0.0010.0350.0011.001
Sky VF−0.0050.0480.0110.995
VE0.0280.0410.4801.029
VVF0.0400.0262.3961.041
RVF0.0160.0260.3771.016
SVF *−0.0630.0275.2980.939
PVF *0.0450.0224.3131.046
BVF−0.0260.0290.8190.974
Note: Using high arousal/negative valence (HANV) as the reference category. Significance * p < 0.05, ** p < 0.01, *** p < 0.001.
Table 6. Summary of street design strategies.
Street TypeEmotional GoalsEmotional NeedsOptional Design Strategies
Residential StreetsLAPVPromote positive emotions and well-being1. Enhance natural connections and increase street greenery
2. Improve walking experience and prioritize pedestrian traffic
3. Optimize street scale to create comfortable spaces.
Commercial StreetsHAPV
Landscape StreetsLAPV\HAPV
Specialized StreetsLAPV\HAPV
Industrial StreetsLAPVAlleviate negative emotions and stress1. Reduce traffic interference and ensure pedestrian needs
2. Improve spatial design to reduce visual distractions
3. Ensure green travel and maintain smooth pedestrian flow
Traffic StreetsLAPV
Disclaimer/Publisher’s Note: The statements, opinions and data contained in all publications are solely those of the individual author(s) and contributor(s) and not of MDPI and/or the editor(s). MDPI and/or the editor(s) disclaim responsibility for any injury to people or property resulting from any ideas, methods, instructions or products referred to in the content.