Abstract
The backless cable-stayed bridge has the advantages of beautiful shape and reasonable force, but due to the low overall stiffness of the bridge pylon during cantilever construction, it is susceptible to the effect of solar temperature. To reveal the temperature deformation laws and achieve accurate alignment prediction during the installation process of steel–concrete composite pylons in complex environments, a refined numerical simulation model for the 3D bridge temperature field was established based on the proposed automatic sunshine-shadow recognition method. Subsequently, the optimal time periods for construction control are provided. The results of the study show that, during the cantilever construction of the bridge pylon, one pylon column will shade the other pylon column, resulting in asynchronous deformation that can reach 7.6 mm. The effect of solar temperature on the displacement of the bridge pylon is significant, where the maximum daily change in transverse displacement in the cantilevered state of the pylon can reach 33.6 mm, and the maximum change in cable force value can reach 52 kN. In order to mitigate the effect of solar radiation, the best construction time for the bridge pylon is 19:30~9:30, while the tensioning and measurement of the cable should be avoided from 6:00~18:00. This strategy ensures that the control of the pylon top displacement is maintained within 1/4000 of the pylon height, and the error in cable force is kept within 5%.
1. Introduction
Bridges are generally exposed to the open-air environment, resulting in an inhomogeneous temperature field under the influence of solar radiation, atmospheric temperature, and ambient wind speed [1,2]. This temperature effect will cause additional temperature stresses on the structure, in addition to the deformation of the bridge structure. In the area of extreme solar-radiation conditions, the effect of solar temperature will even exceed the constant load and live load to become the first control role, which brings a series of difficulties to the bridge construction, including elevation control and internal force control [3,4,5,6,7,8].
A cable-stayed bridge without backstays typically has cables on only one side, with the force of the main girder balanced by the weight of the pylon. This type of bridge is often used in the construction of urban-landscape bridges because of its unique structural form. During the construction of a traditional cable-stayed bridge without backstays, bracing is typically employed to support the construction pylon. However, due to the long period and high cost of bracing, an increasing number of cable-stayed bridges without backstays are transitioning to using steel–concrete composite pylons and employing the bridge pylon cantilever assembly construction method. The bridge pylon adopts the structural form of a steel box and concrete, first lifting and welding the steel box of the bridge pylon, then pouring the concrete inside the box, and gradually constructing until the bridge pylon is merged. Compared to the traditional bracket method, the temperature effect on the alignment of this construction method will be more pronounced.
For instance, in open-air environments, the welding seams of large steel structures need to be welded in specific sequences. Upon the completion of welding on one side of the structure, there will be significant differences between the structural temperature field and the temperature field at the beginning of welding due to the influence of solar and environmental temperature. As the structure is constrained by the welded seam on one side, adjacent welding plates cannot freely expand or contract, resulting in an asynchronous deformation between welding segments. Therefore, if appropriate constant temperature measures are not taken during welding, forced welding and fusion between adjacent segments may occur, forming wedge-shaped weld seams, thereby significantly affecting the linearity and internal forces of the steel structure [9,10,11,12,13]. Especially in the process of bridge pylon construction, one side of the pylon column will produce shadow blocking to the other side of the pylon column at some moments. As a result, the temperature of the shaded area decreases significantly [14], leading to a reduced temperature gradient in the pylon column. This reduced temperature gradient can reduce the bending deformation, causing the deformation of the two sides of the pylon columns to be unsynchronized, which will further increase the difficulty of the construction control [15,16].
Previous research results are based on the computational assumption that the longitudinal temperature difference of the bridge pylon is negligible. The three-dimensional temperature field in space is simplified to a two-dimensional temperature field in the plane, and the temperature-stress coupling method is used to analyze the temperature effect of the cross-section of the concrete bridge pylon [17,18,19,20]. However, the method cannot take into account the shading effect between pylon columns. The applicability to inclined bridge pylons with sunshine-shadow shading characteristics is debatable, and the calculation results of the temperature effect cannot reflect the phenomenon of unsynchronized deformation of bridge pylons. In order to more accurately grasp the real temperature field and temperature effect of the bridge structure, research scholars propose a numerical simulation method of a three-dimensional solar temperature field that can take real-time shadows into account based on the shadow identification principle of ray-tracing calculation [21,22].
This article focuses on the Longgun River Bridge, utilizing thermal conduction theory and a three-dimensional temperature field calculation method to precisely simulate the pylon temperature fields and temperature effects during construction. Finally, it provides the optimal time periods for controlling bridge pylon construction. The method employed in this article can be applied to the precise control of construction alignment for large-span complex structures, the selection of construction hoisting windows, temperature response separation in health monitoring data, and temperature modal frequency subtraction for structural damage identification, among other applications.
2. Three-Dimensional Solar Temperature Field Analysis of Bridge
2.1. Differential Equation of Heat Conduction
Based on the law that the rate of heat conduction in an object is proportional to the temperature gradient, in 1822, Fourier [23] proposed the partial differential equation for heat conduction:
where ρ and c are density (kg/m3) and specific heat capacity (J/kg·°C); kx, ky, and kz are the thermal conductivity (W/m·°C) of the material in three coordinate axes x, y, and z.
2.2. Boundary Conditions under the Solar Effect
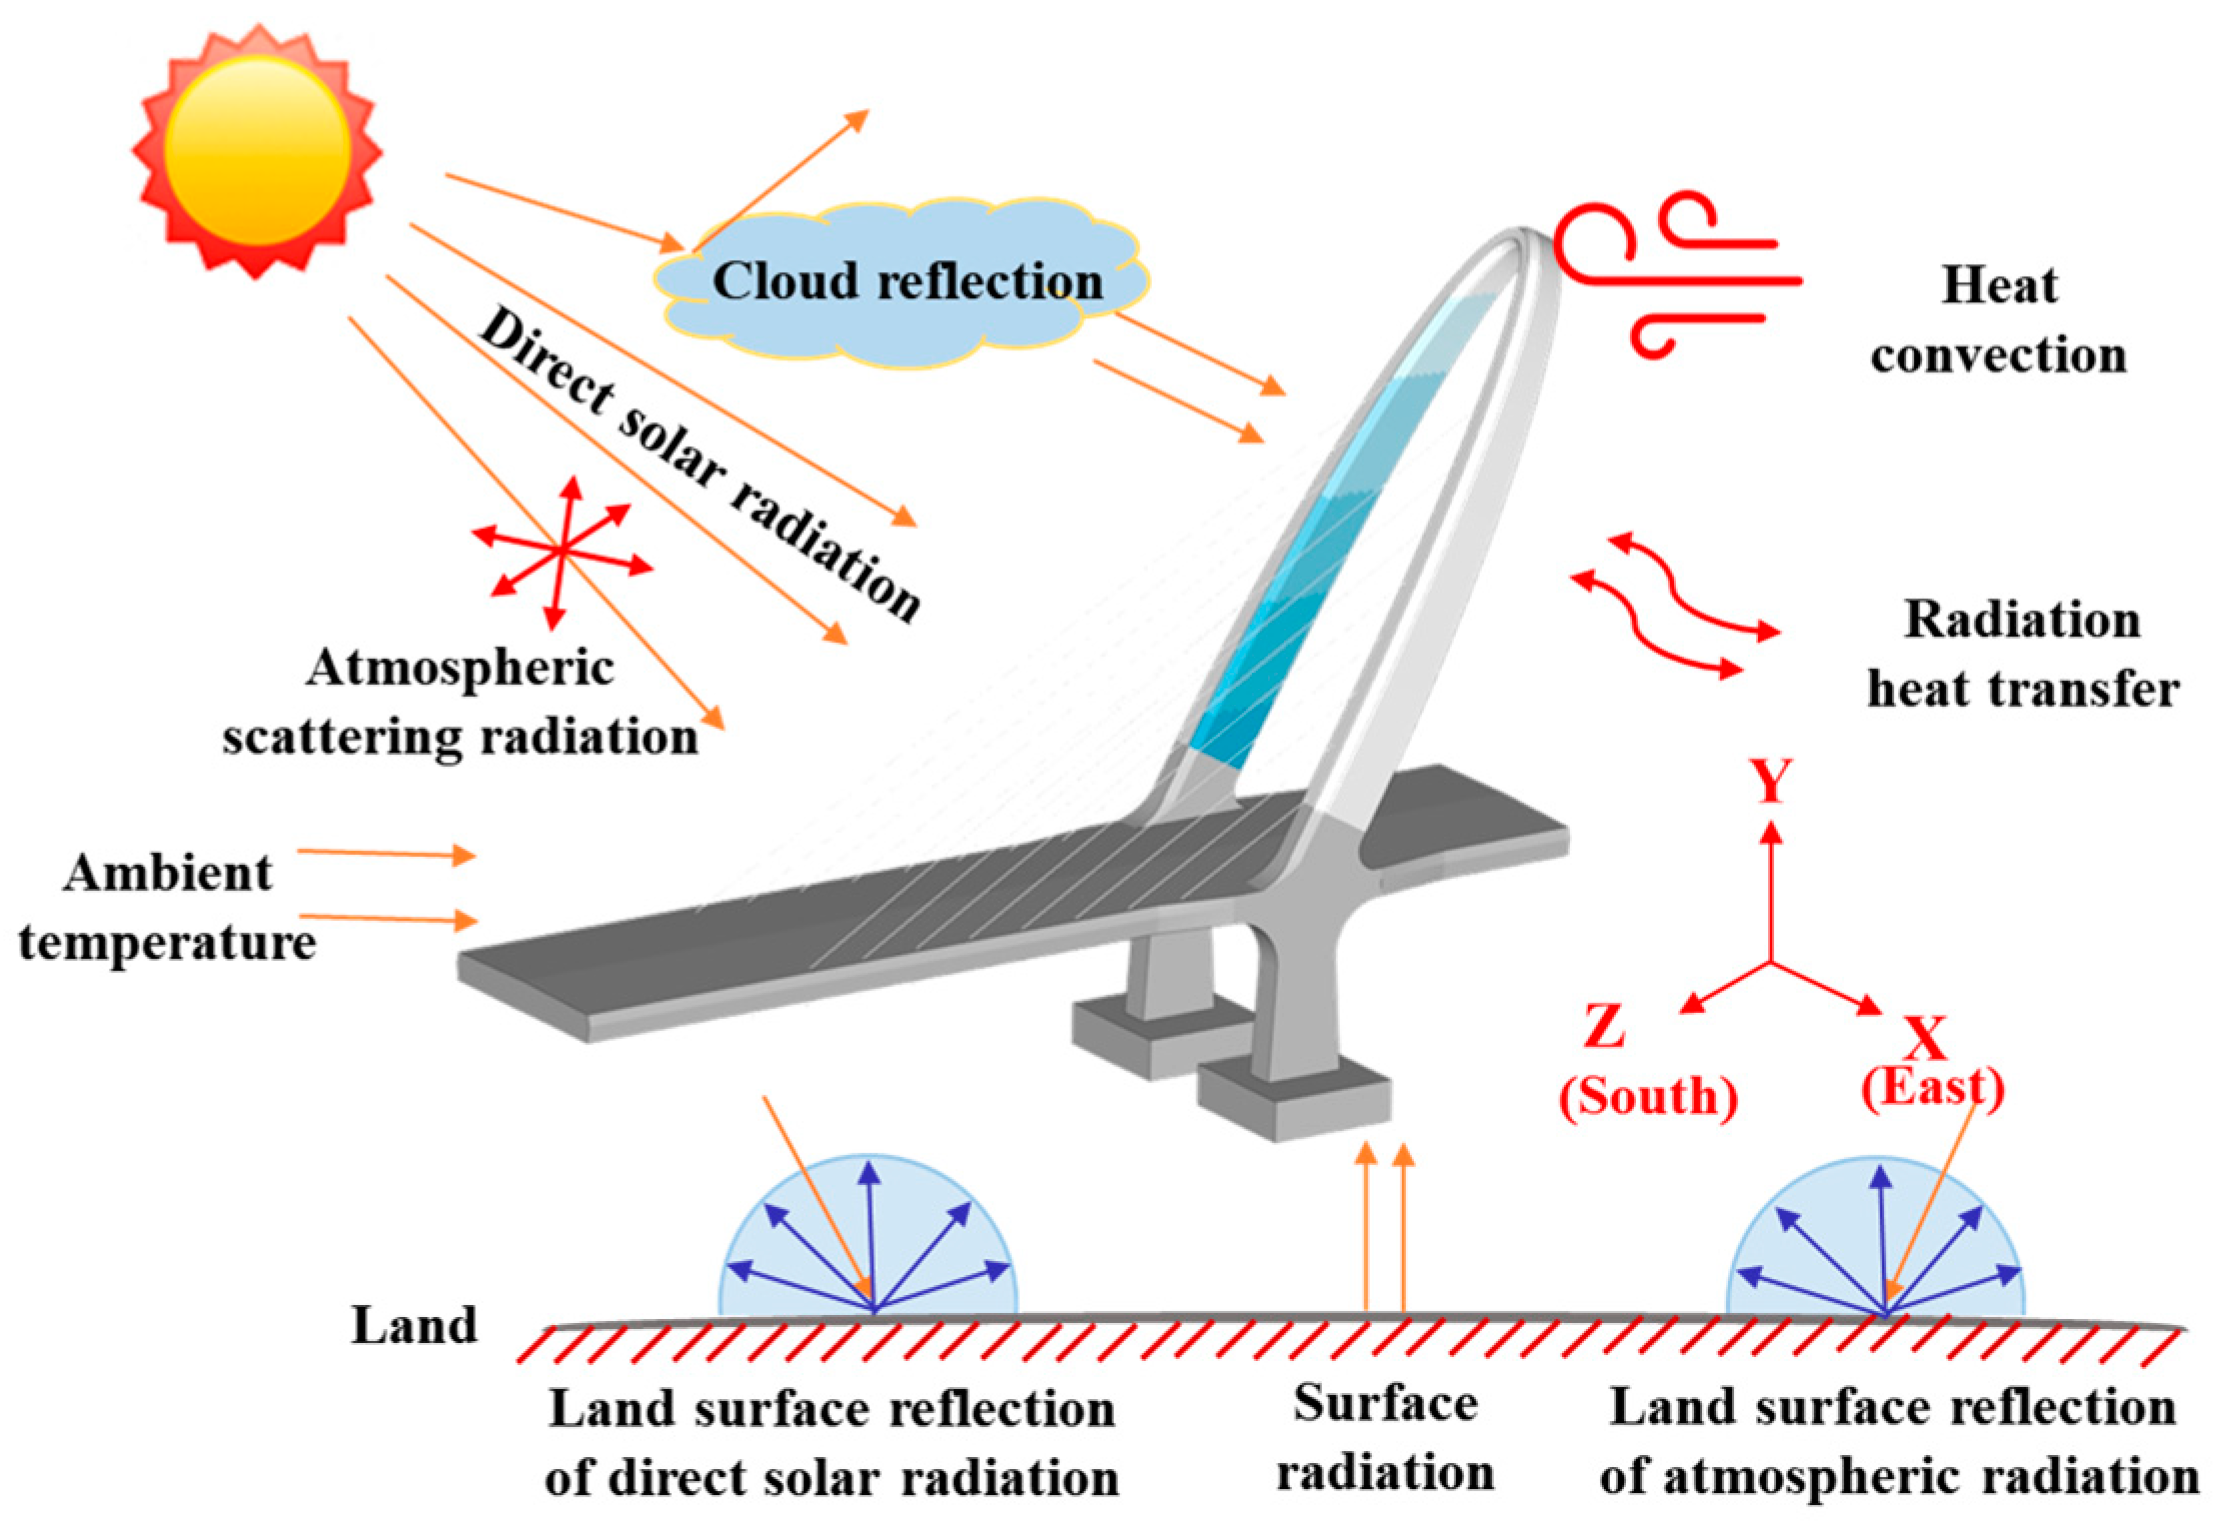
In actual engineering, the heat exchange between the bridge and the surrounding environment mainly includes three types, namely solar radiation, radiation heat transfer, and convection, as presented in Figure 1, and the total heat flux absorbed by structural surfaces is expressed as:
where qs is the solar-radiation heat flux absorbed by the structure surface; qc and qr are the heat fluxes of convection and radiation heat transfer between the structure’s surface and outside, respectively.

Figure 1.
Thermal boundary condition of bridge pylon under solar effect.
2.2.1. Solar Radiation
Solar radiation includes direct solar radiation that passes directly through the atmosphere, diffuse radiation that has been scattered by atmospheric constituents and clouds, and reflected radiation from the ground or water [24]. It is calculated with respect to factors such as the normal direction of the surface of the structure, the solar altitude angle, the solar azimuth angle, and the composition of the ground surface, as well as the material properties of the structure [25,26]:
where ξ is the absorptivity of the structural surface to solar radiation; Icb, Icd, and Icr are the intensities of direct solar radiation, diffuse radiation, and ground-reflected radiation intensity in the horizontal plane. Rb, Rd, and Rρ are correction factors of direct radiation, diffuse radiation, and ground-reflected radiation.
2.2.2. Radiation Heat Transfer
The radiative heat transfer between the surface of the structure and its surroundings can be approximated as [27]:
where e is the surface emissivity of the structure; Cs is the Stefan-Boltzmann constant. Ta and T are the temperature of the surrounding environment and bridge structure, respectively.
2.2.3. Convection
The convective heat transfer between the surface of the structure and the outside atmosphere follows the Newtonian cooling equation, and the calculation method is:
where hc is the convective heat-transfer coefficient, whose value is related to the surface roughness of the structure, wind speed, and atmospheric temperature. The specific calculation can be referenced from [28,29].
2.3. Calculation Method of 3D Solar Temperature Field
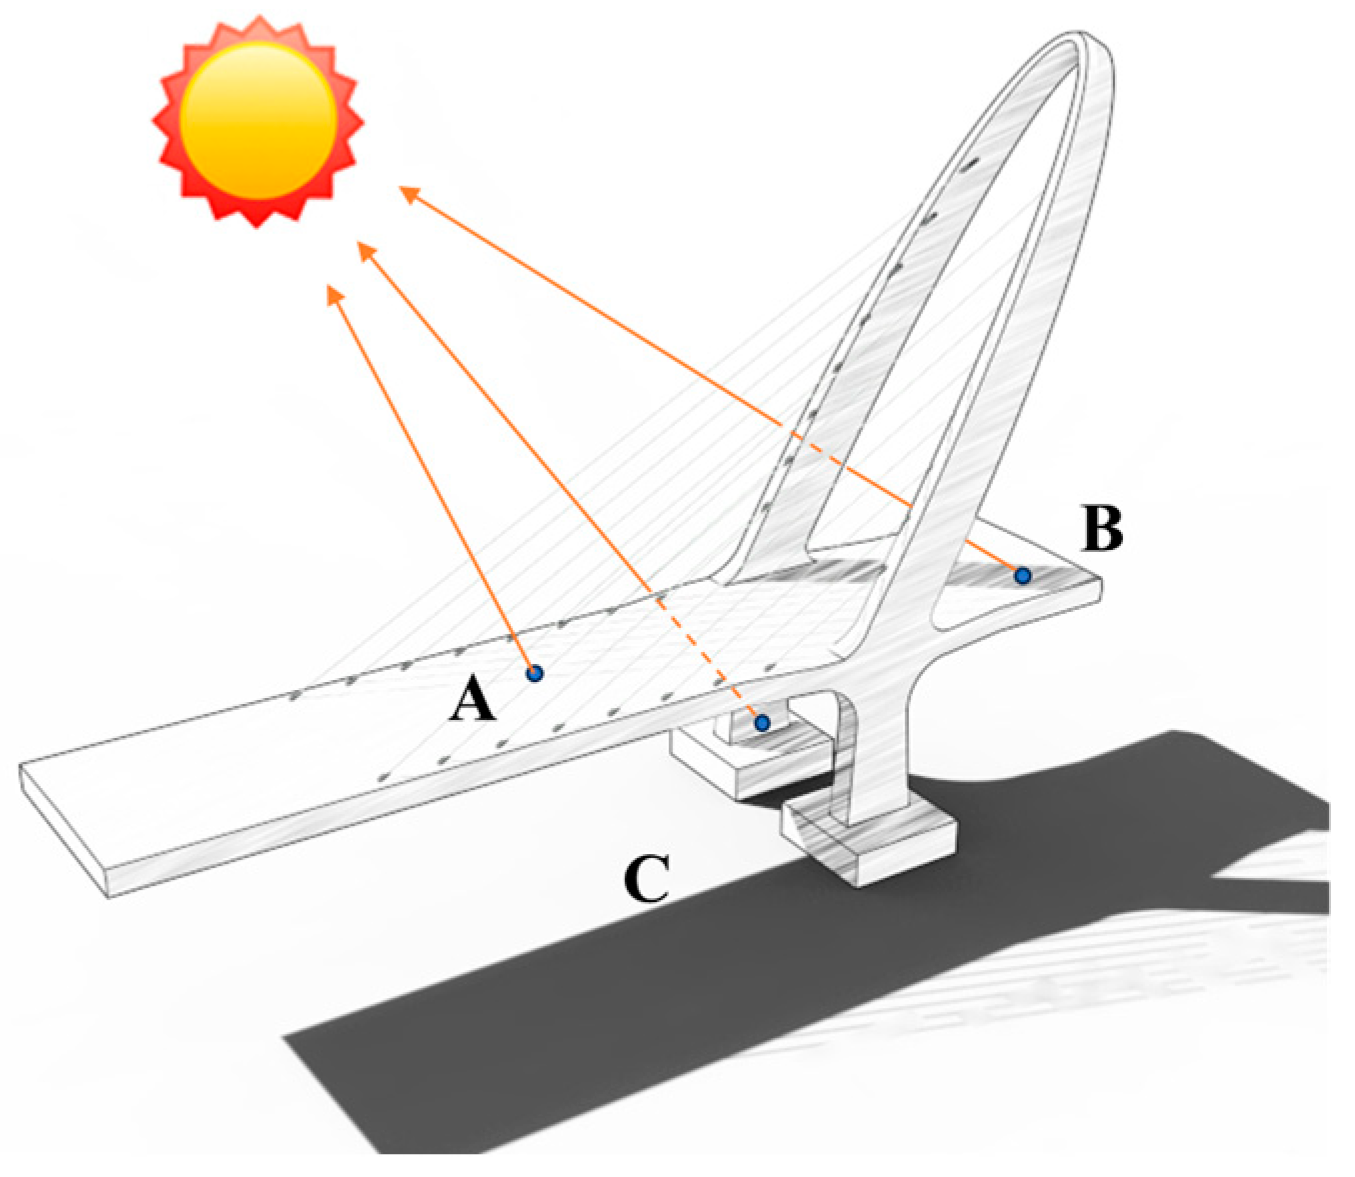
The solar radiation received on the surface of the structure is closely related to the distribution range of sunshine shadows. The bridge can be divided into light areas, mutual-sheltering areas, and self-shelter areas under sunlight. The shadows can be determined by using a ray-tracing algorithm, as shown in Figure 2. First, from the point to be judged to send a ray parallel to the sun’s rays, determine whether the ray and the structure of the intersection point, if the intersection point exists, is the point to be judged for the shadow areas, and vice versa, the point to be judged for the light areas. For example, in Figure 2, point A is the light areas, point B is his mutual-shelter areas, and point C is the self-shelter areas.

Figure 2.
Sunshine-shadow recognition.
This paper is based on the Hottel clear-sky modeling algorithm [26], discretizing the structural surface into a mesh using finite-element techniques and identifying different areas through ray-tracing technology. However, traditional identification methods involve a large number of invalid calculations, which greatly wastes computational resources. Therefore, this paper adopts the triangular center coordinate method based on a raster accelerated structure to effectively and conveniently calculate the solar temperature field. The method realizes the accurate and efficient identification of the shadows of complex structural bridges and the accurate calculation of the structural three-dimensional temperature field by efficient intersection algorithms and reasonable raster divisions [15,21].
3. Finite-Element Numerical Simulation
3.1. Engineering Background
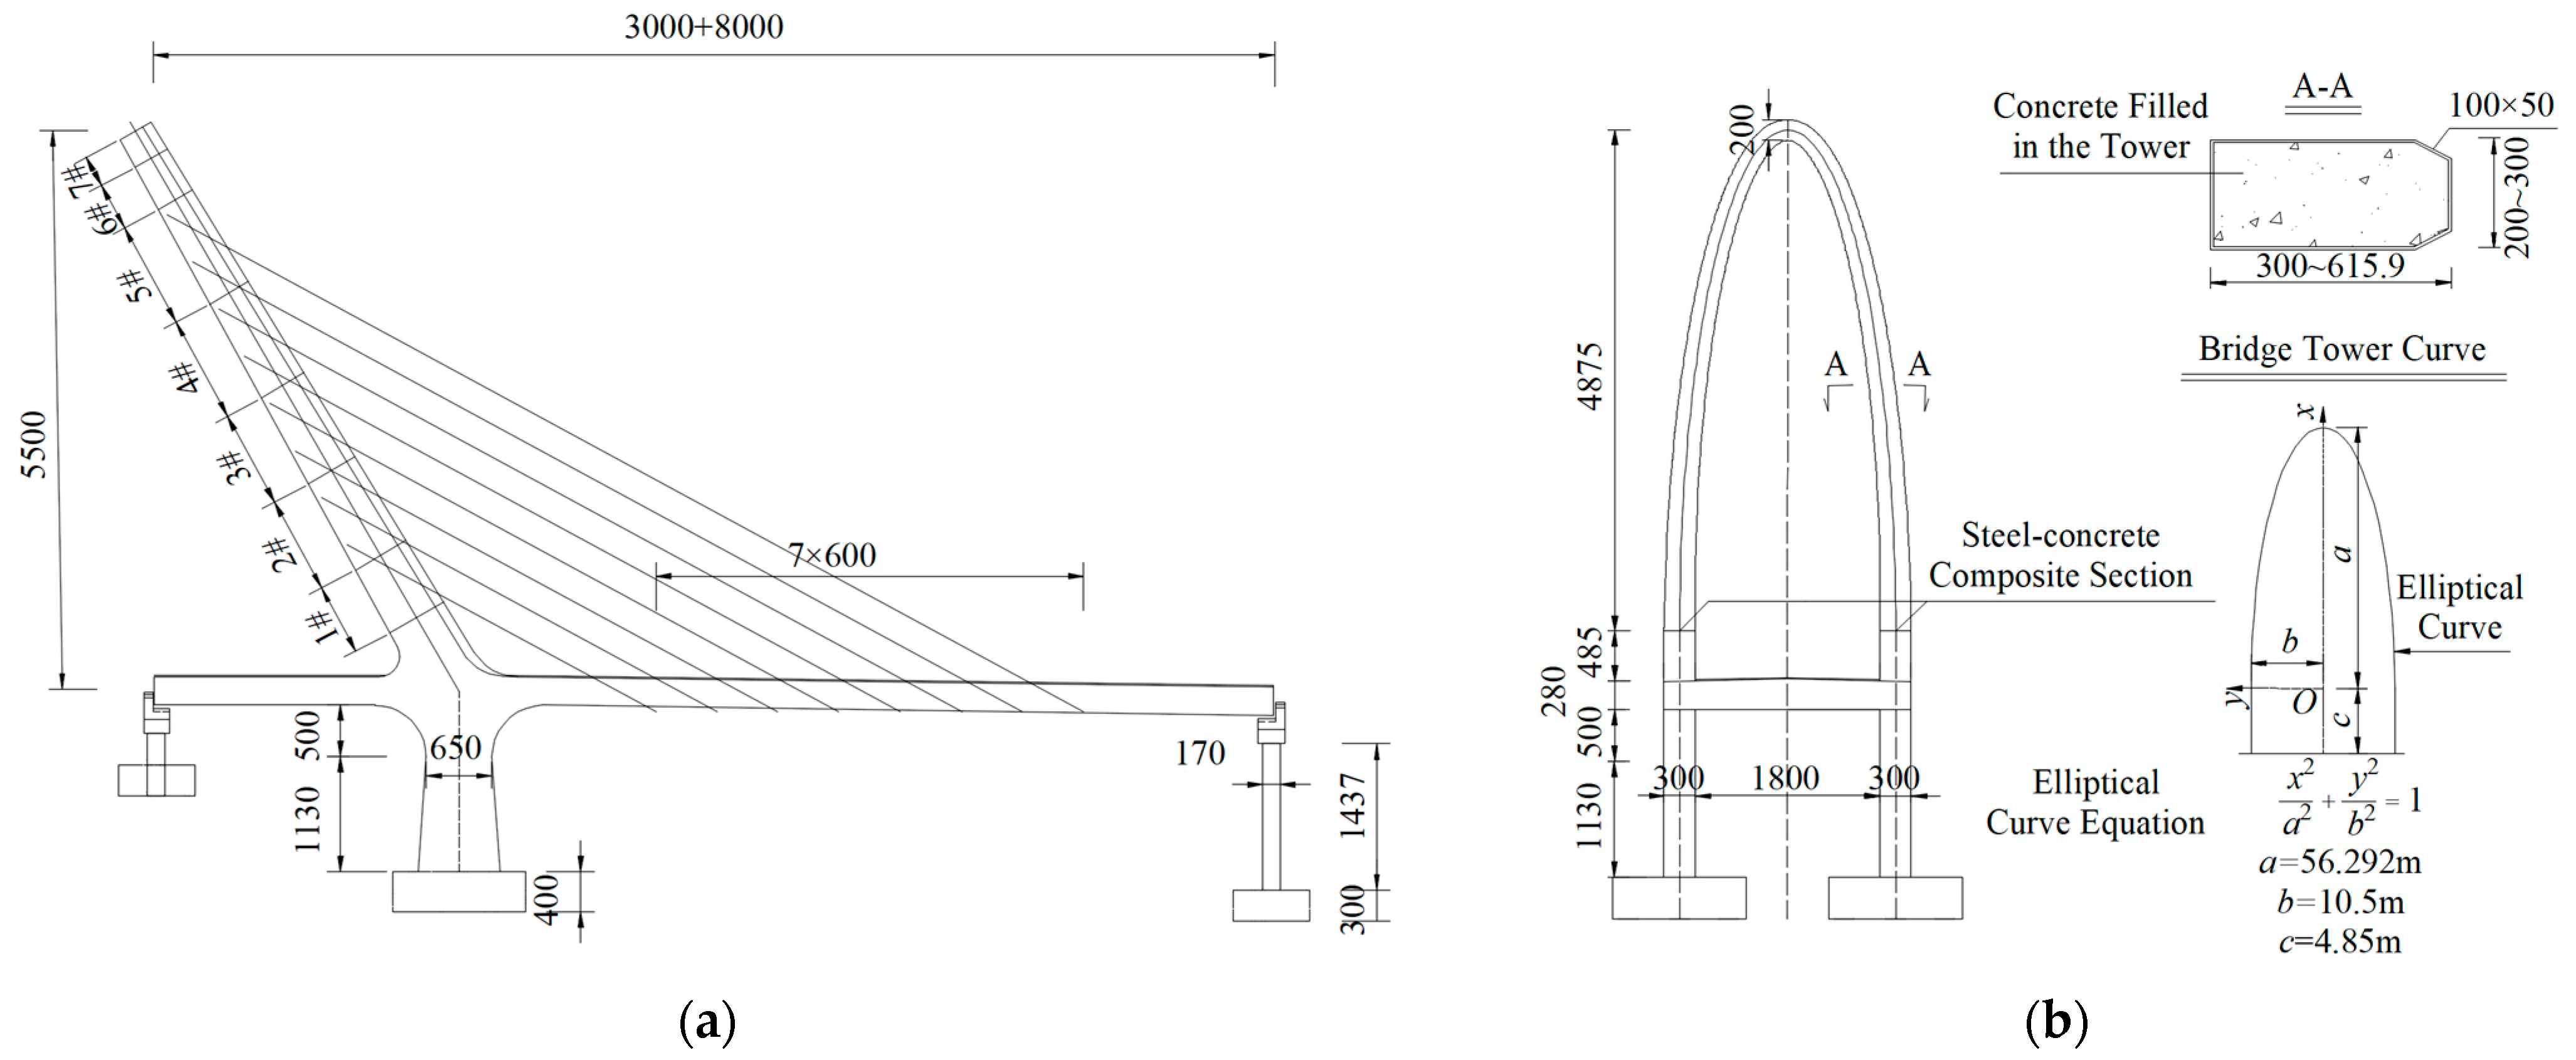
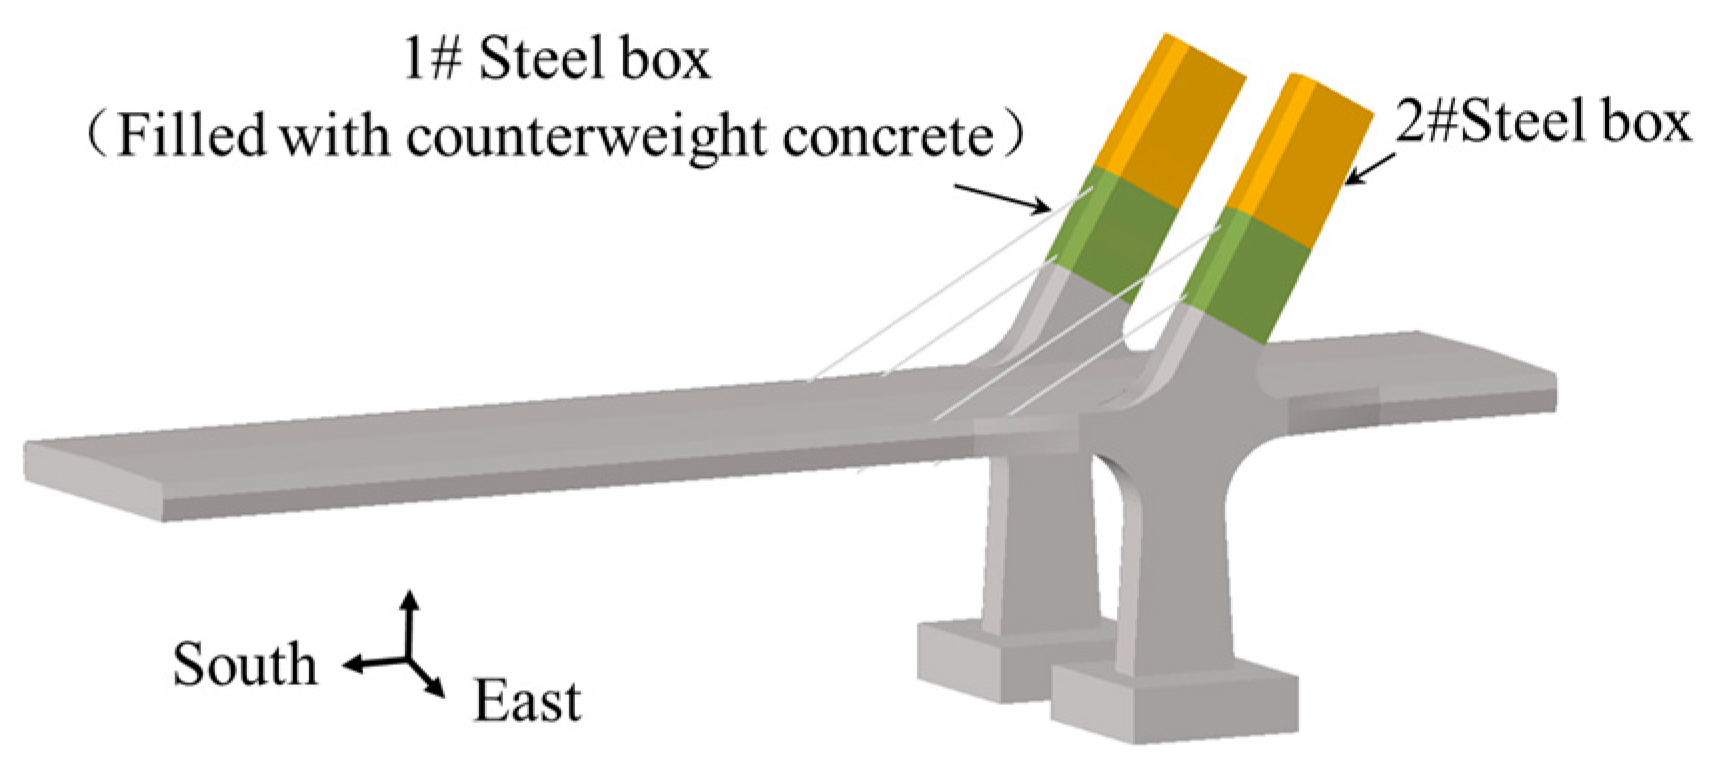
This paper is based on the engineering of the Longgun River Bridge, which is a cable-stayed bridge without backstays, with a span arrangement of 80 + 30 m. The bridge pylon is a composite structure of a steel box filled with counterweight concrete, standing at a height of 55 m and forming a 60° angle with the bridge deck. The cross-section of the bridge gradually transitions in size from the bottom to the top, with a width of 3.0 m × 6.2 m at the base and tapering to 2.0 m × 3.0 m at the top. The tension cables are arranged in a spatial double-corded vertical lute shape, comprising a total of 16 cables. The bridge stands in a north-south direction, with geographical coordinates of 110.5° E longitude and 19.0° N latitude. Figure 3 presents a structural diagram of the bridge pylon.
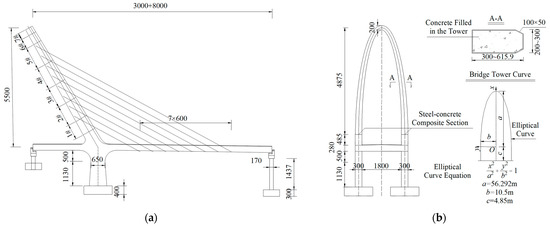
Figure 3.
Schematic diagram of bridge structure (unit: cm): (a) elevation diagram; (b) bridge pylon section.
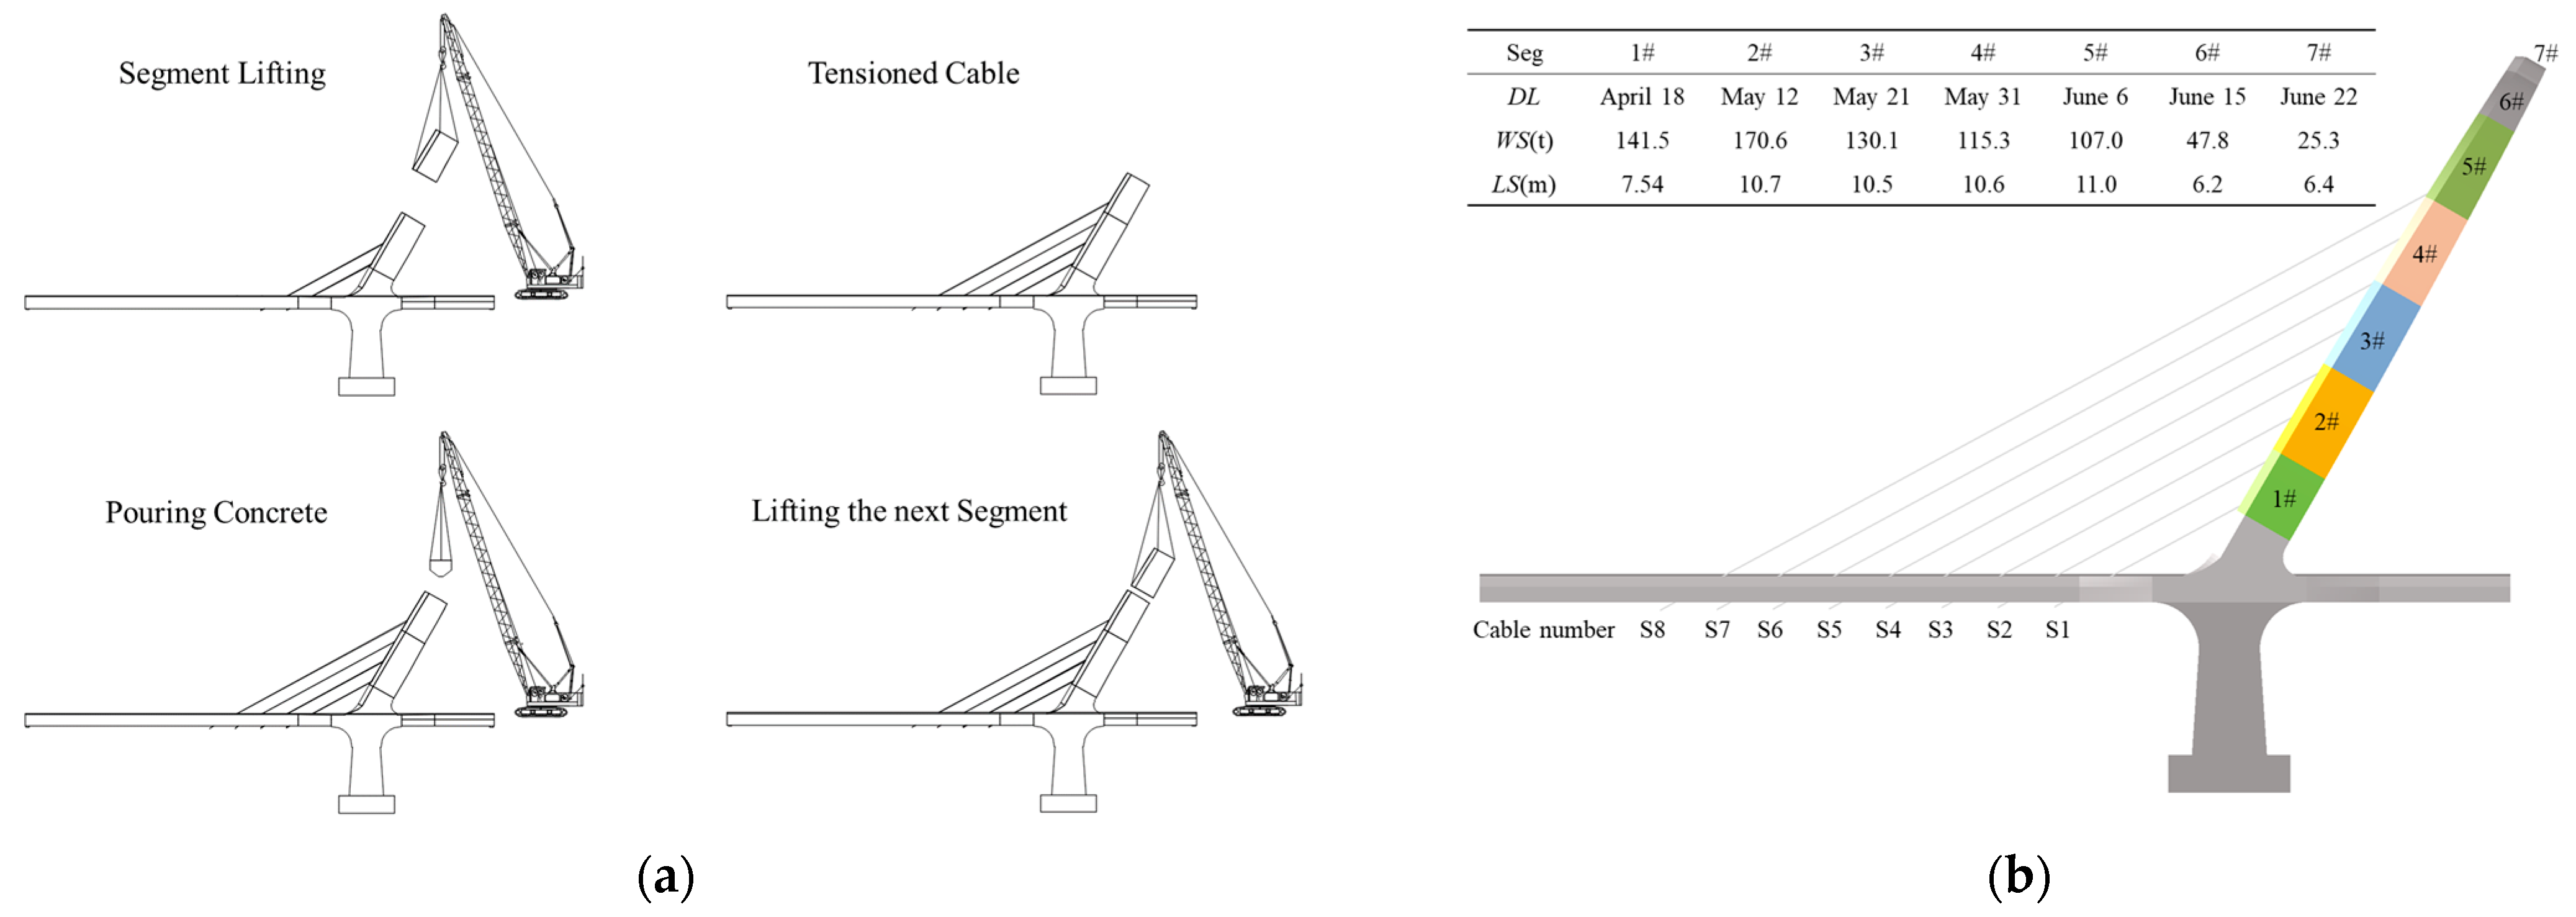
The bridge pylon of the Longgun River Bridge adopts the cantilever assembly construction method, with the construction process illustrated in Figure 4a. The bridge pylon is divided into seven sections, with two pairs of cables on each of the 2#~5# segments, and the cables are tensioned after lifting completion. Figure 4b shows the bridge pylon lifting date (DL) for the year 2023, the weight per segment (WS), and the segment length (LS). Because the overall stiffness of the bridge pylon in the cantilever state is lower and more sensitive to the temperature effect of solar radiation, this paper only analyzes the solar temperature field and temperature effect during the construction of the bridge pylon.
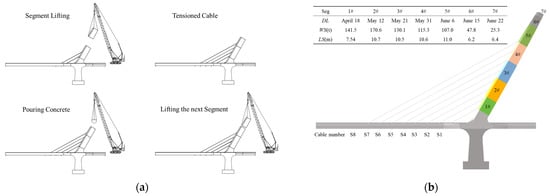
Figure 4.
Construction information: (a) construction process; (b) segment information.
3.2. Finite-Element Model
The analysis model is established by ABAQUS 2019 software, employing DS3/DS4 heat-transfer elements to simulate the steel structure and DC3D8/DC3D6 heat-transfer elements to simulate the concrete structure. The S3/S4 and C3D8/C3D6 elements are used to simulate the mechanical calculations of shell and solid elements. The mesh division of the bridge pylon is illustrated in Figure 5, and the material thermal parameters are provided in Table 1.
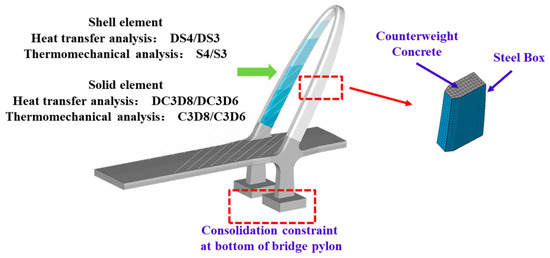
Figure 5.
Schematic diagram of bridge model.

Table 1.
Thermal parameter.
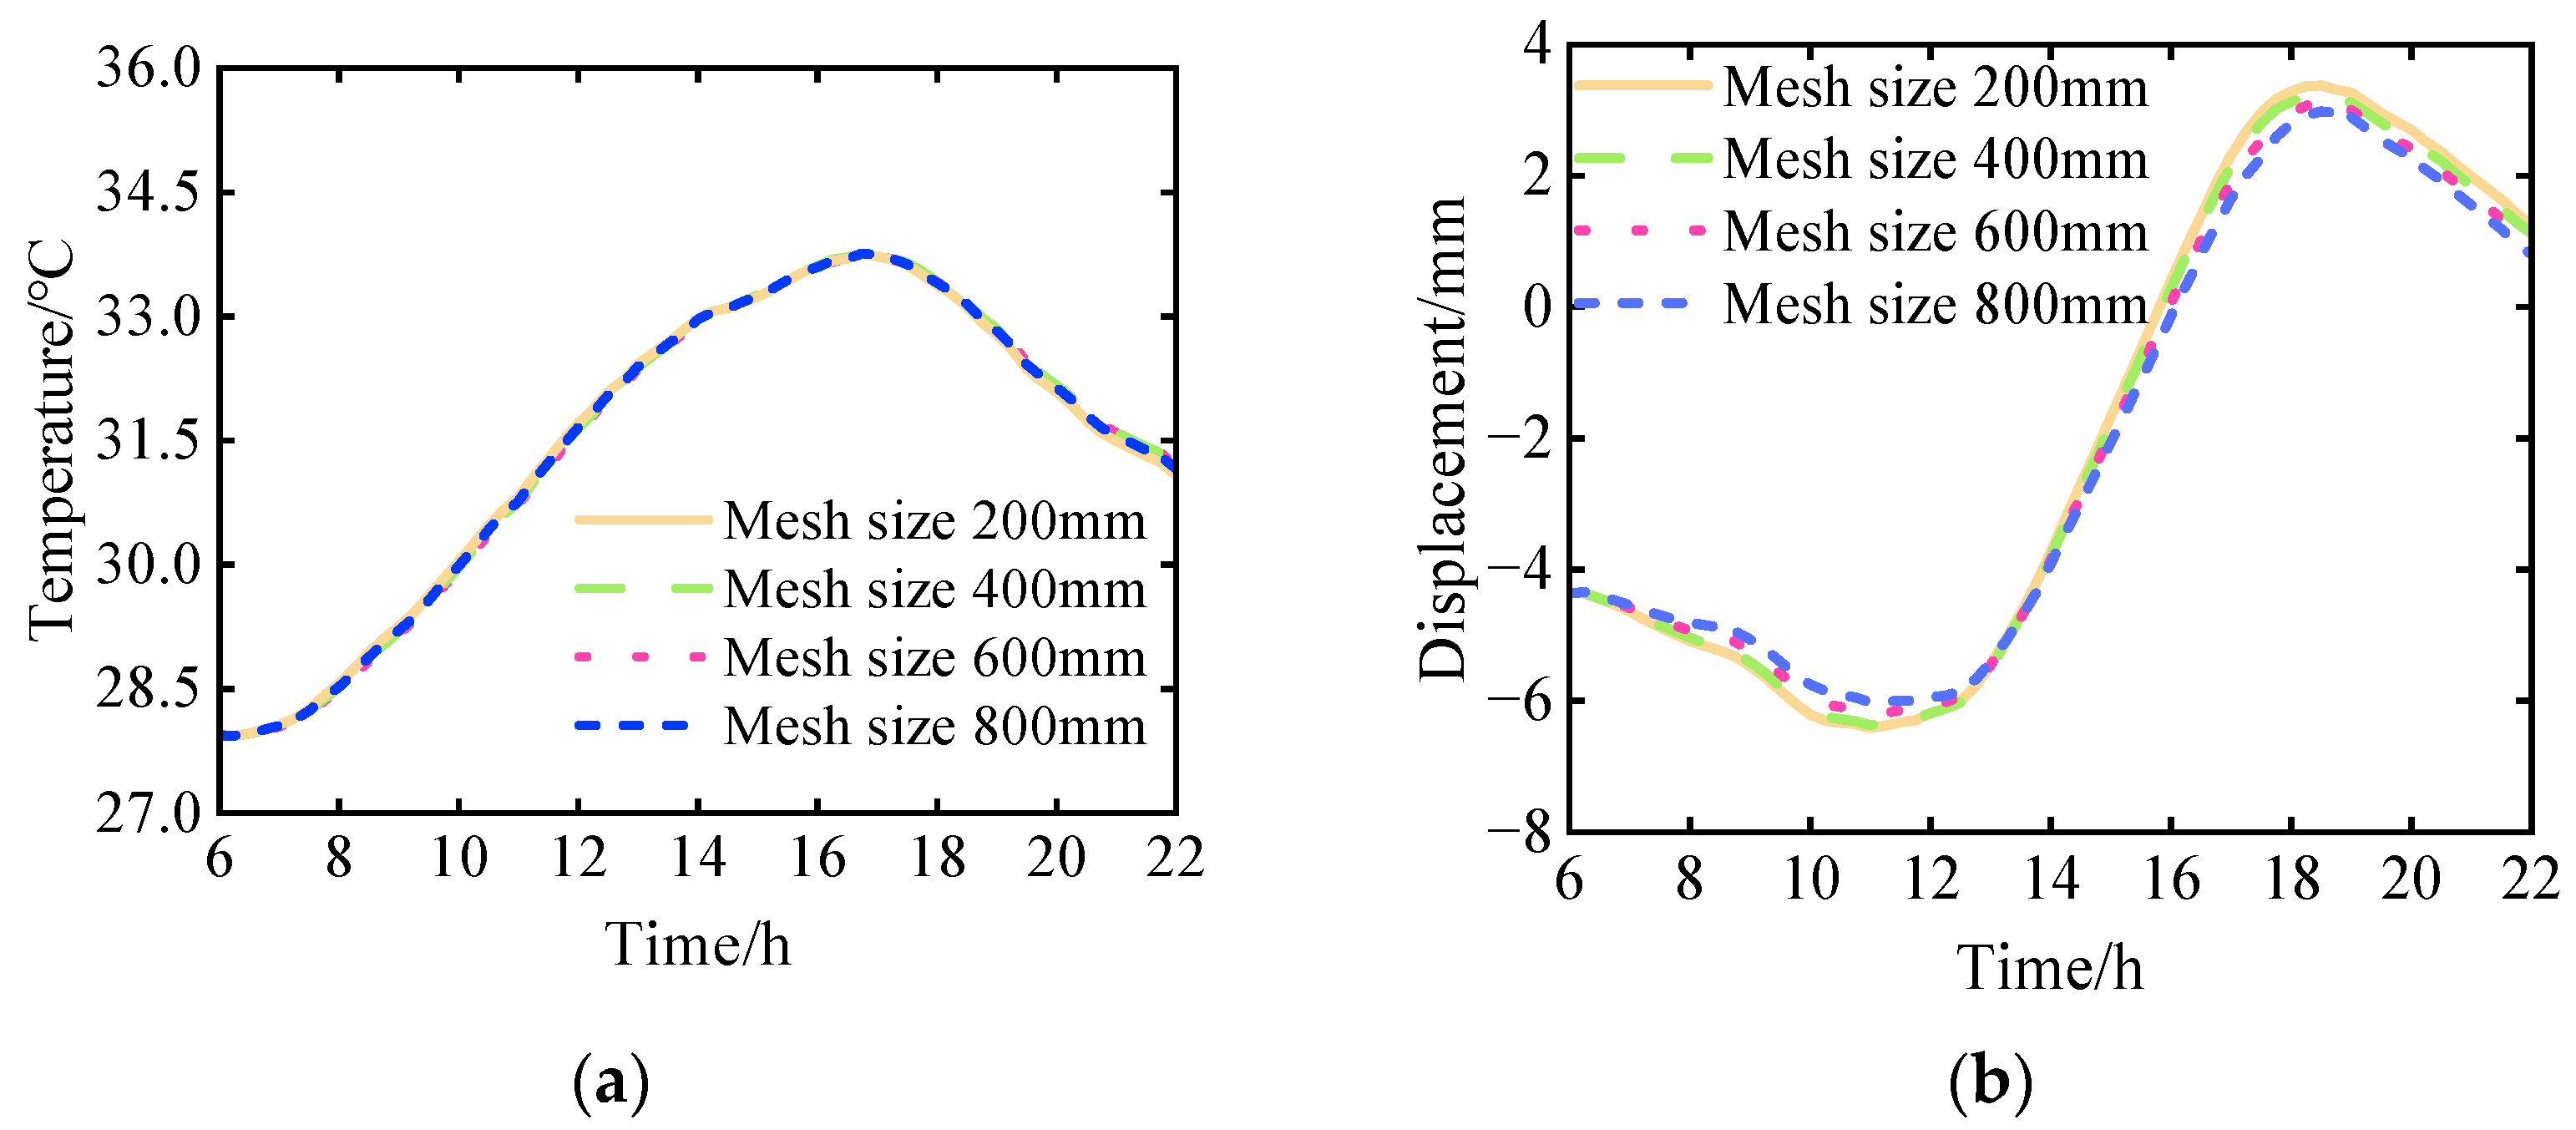
Prior to the temperature effect analysis, the relationship between the temperature field, temperature effects, and the mesh size under maximum cantilever conditions was calculated. The temperature and displacement of the pylon top are presented in Figure 6, in which the convergence results are obtained. The correlation between the temperature field of the bridge and the mesh size is minimal. However, there is a certain correlation between the size of the bridge displacement and the mesh size. When the mesh size exceeds 600 mm, there is a significant deviation in bridge displacement, while displacement is more consistent when the mesh size is less than 400 mm. Considering the computational cost and accuracy, a model element size of 400 mm was chosen.
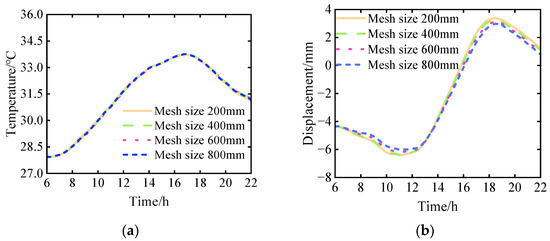
Figure 6.
Model calculation results under different mesh sizes: (a) temperature variation; (b) longitudinal displacement of pylon top.
3.3. Heat-Transfer Boundary Conditions
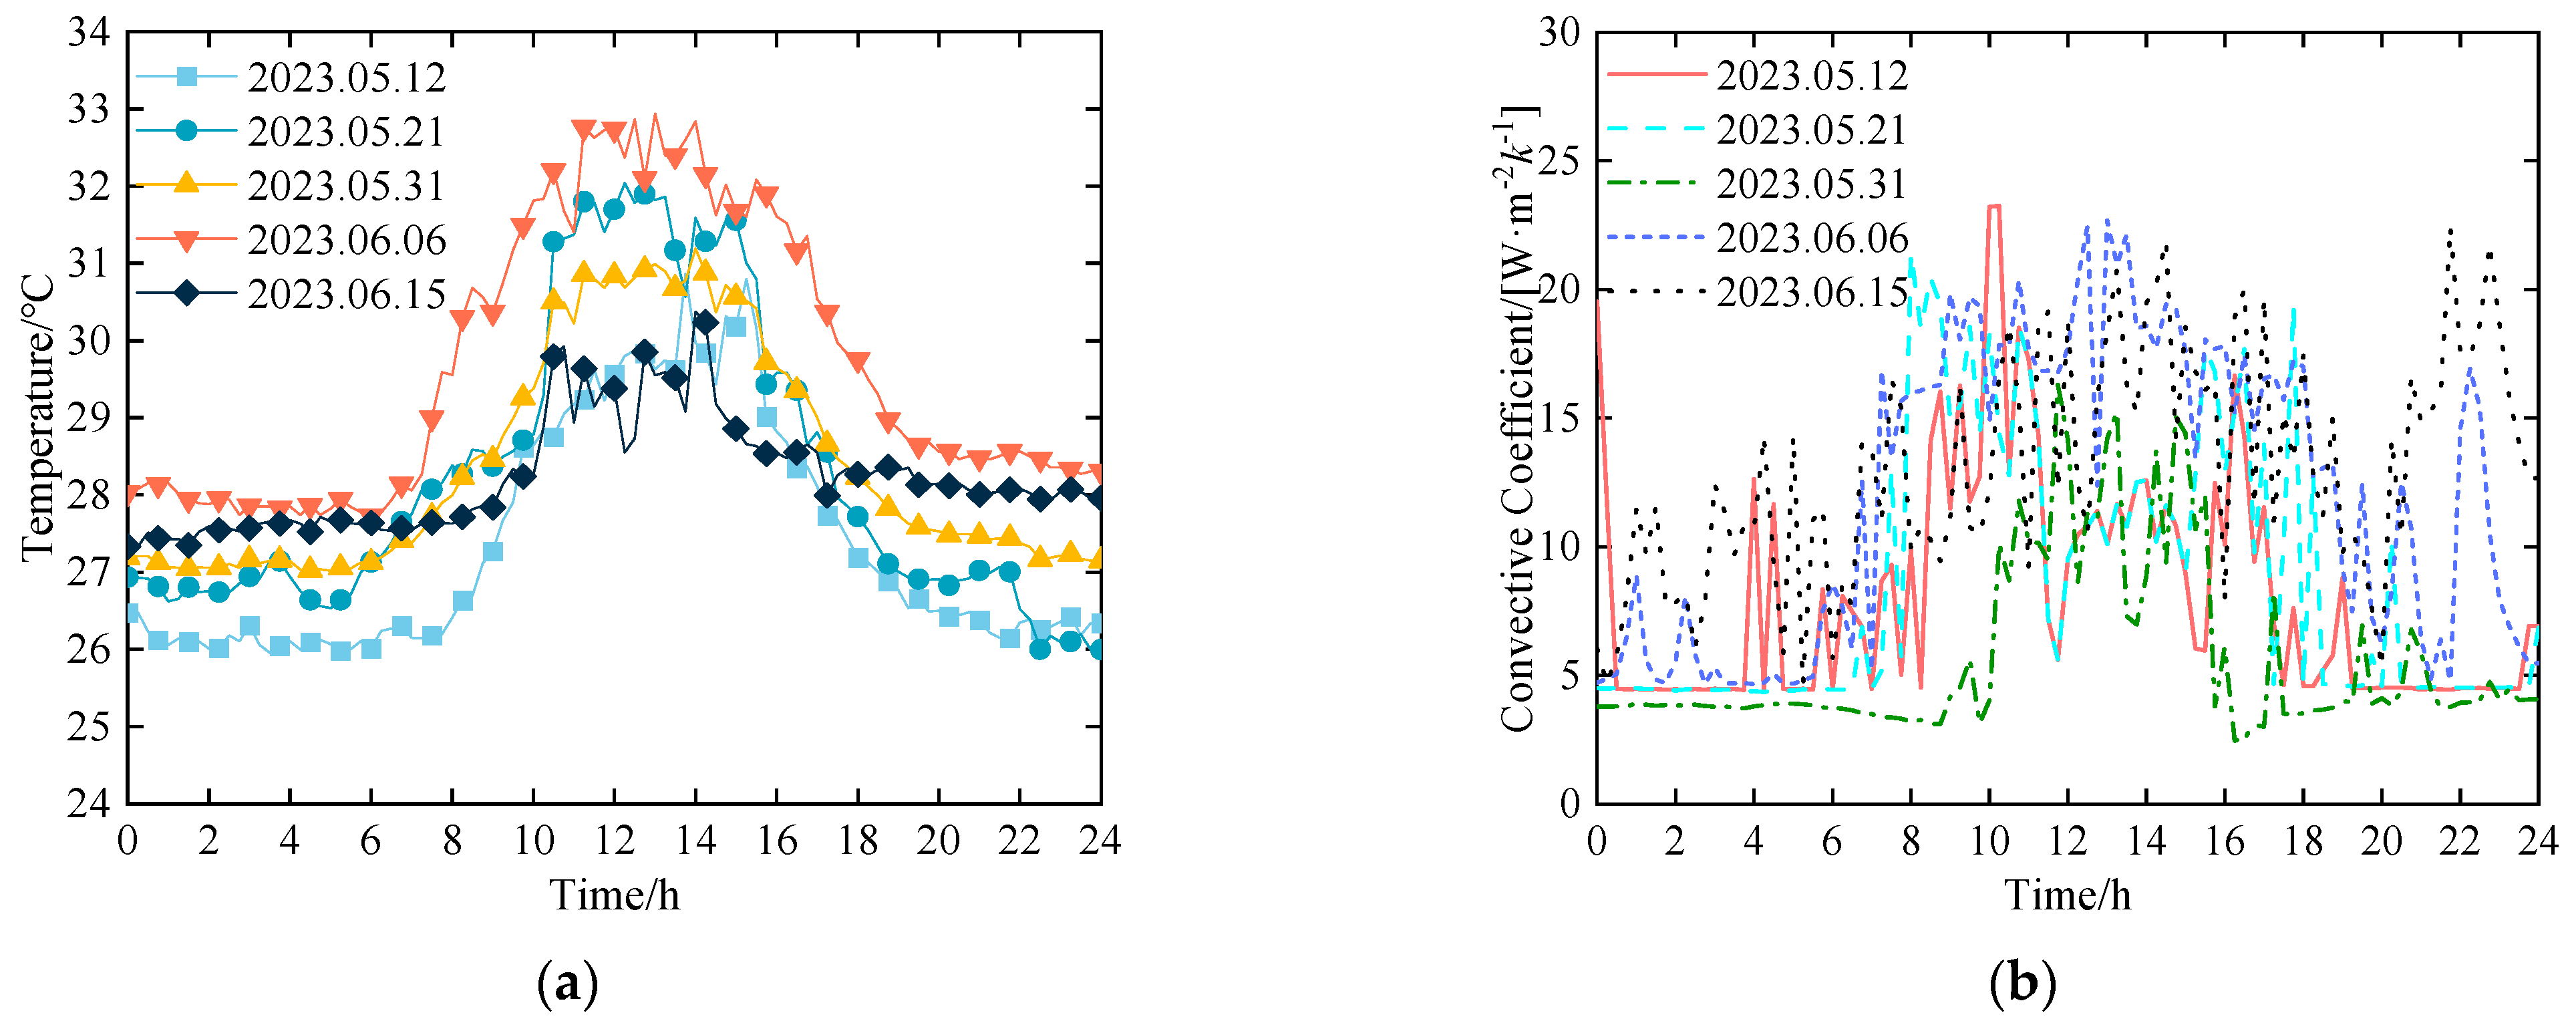
In this paper, the meteorological conditions measured at the bridge location during the crane construction of the bridge pylon from May to June 2023 are utilized as the boundary conditions for calculation. The calculation time is advanced by 2 days to eliminate the effect of the initial temperature field. The ambient temperature on the day of each construction section is shown in Figure 7a, and the convective heat-transfer coefficient is shown in Figure 7b. The temperature effect during the construction of the steel box in segment #1 is not significant, primarily due to the stiffness of the concrete lower pylon column beneath section #1. Therefore, this paper selects the 2#~6# segment bridge pylon to analyze the temperature field and temperature effect of the bridge pylon during the construction process.
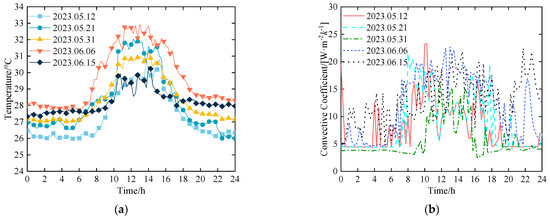
Figure 7.
Boundary condition: (a) atmospheric temperature; (b) bridge pylon surface convection coefficient.
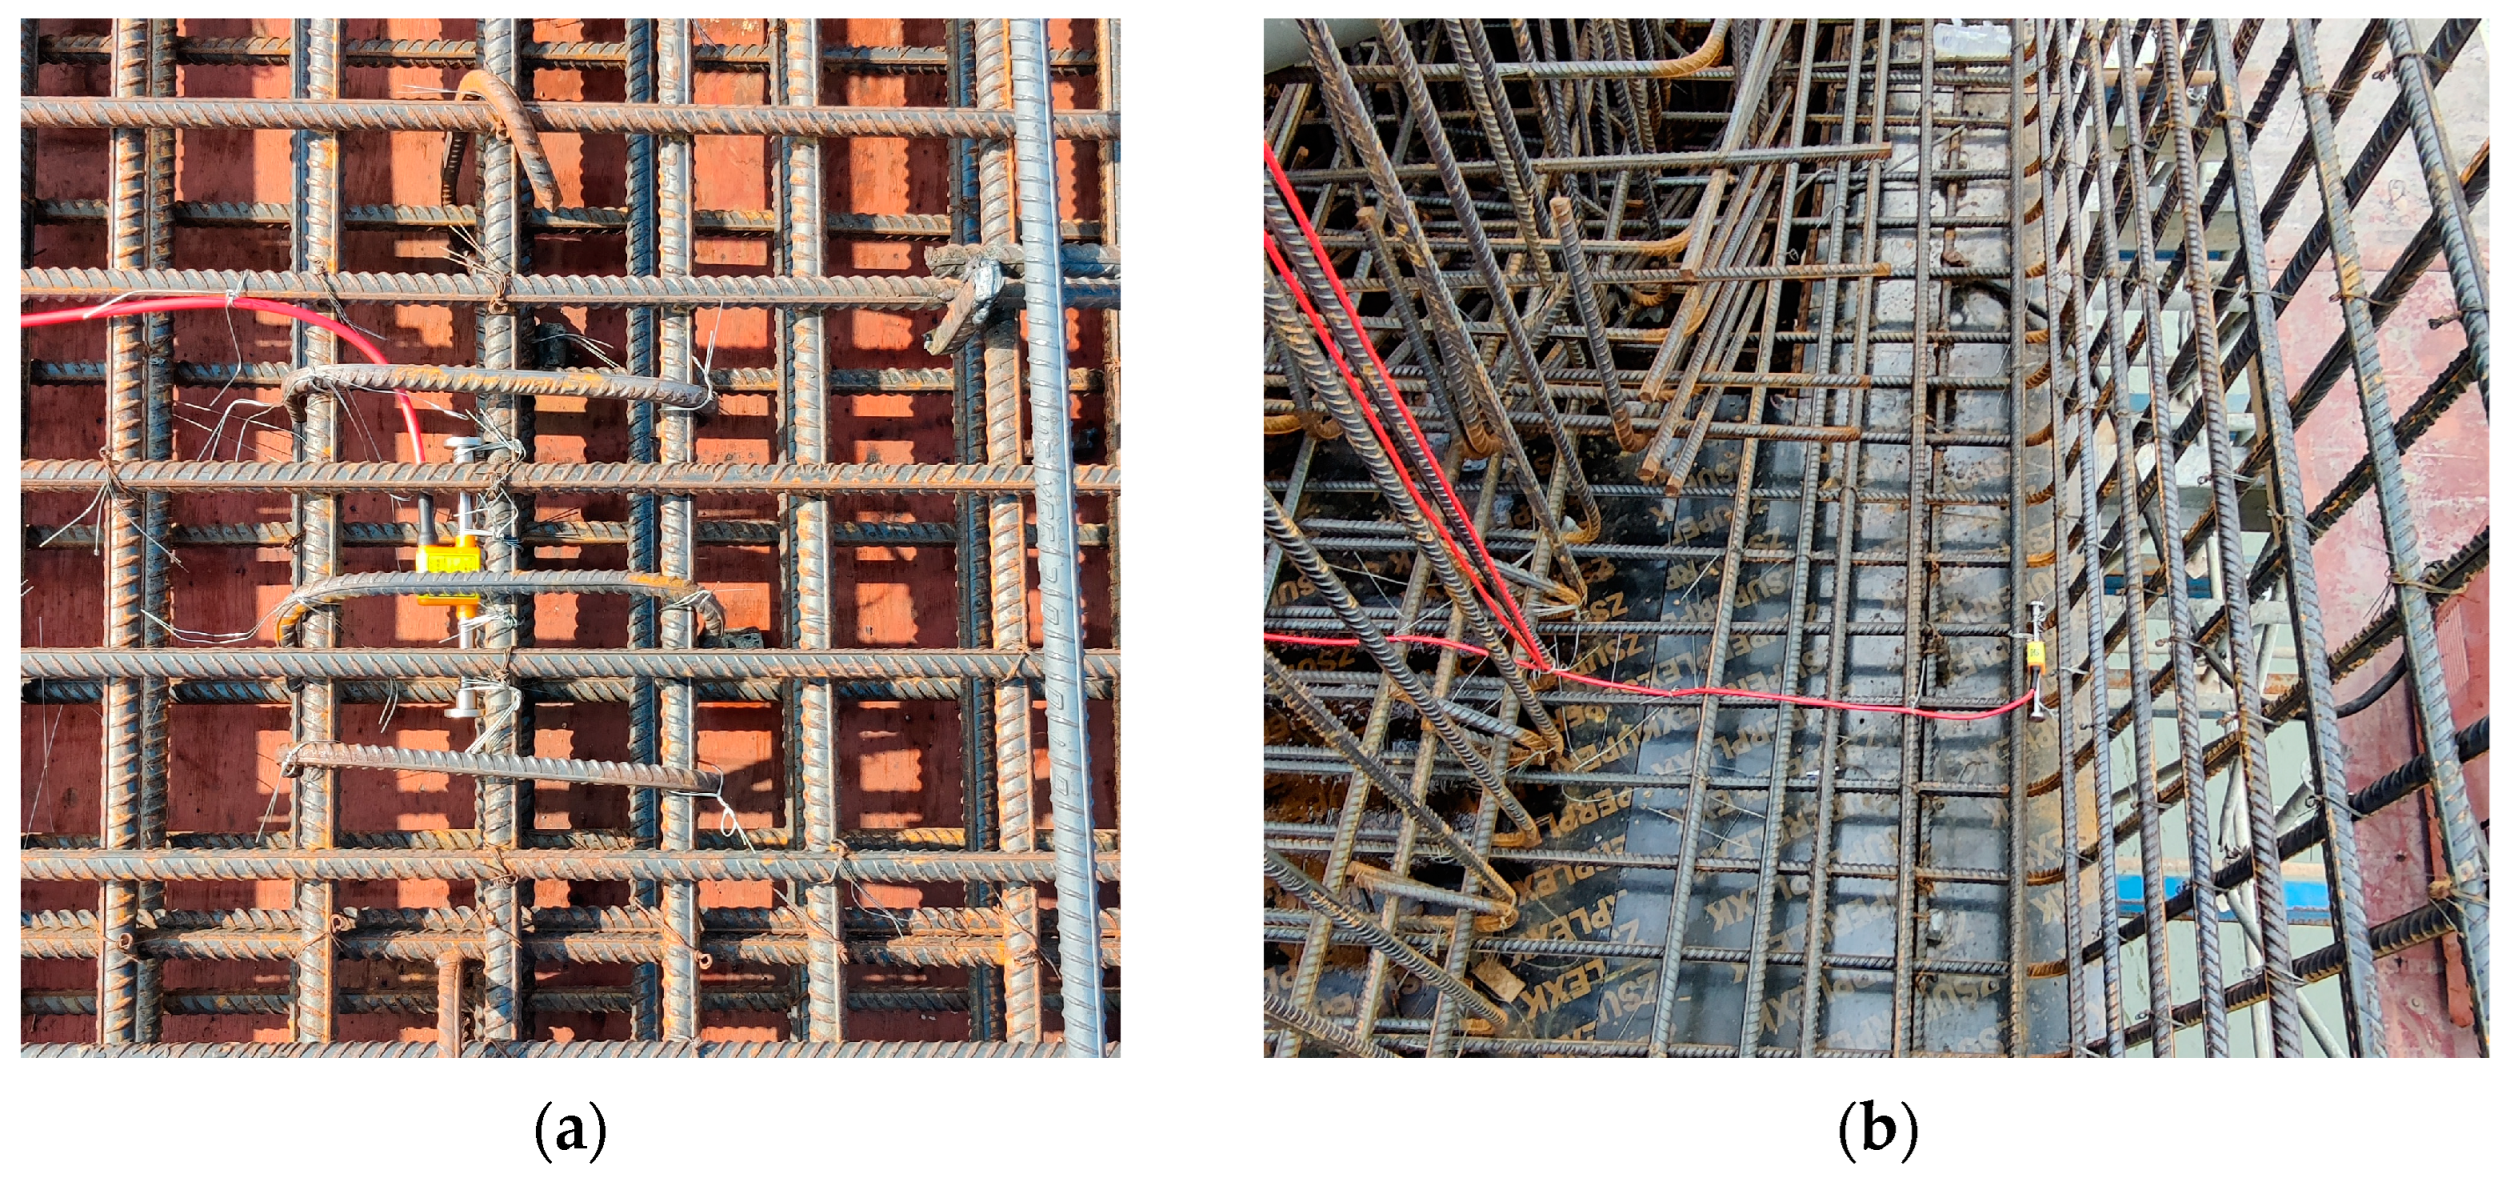
3.4. Model Validity Analysis
The solar temperature field of the bridge pylon structure will be affected by shading between the bridge components. Therefore, accurately identifying the sunshine shadow of the bridge structure is essential for accurately calculating the temperature field of the bridge structure. In this paper, 24 and 25 April 2023, were selected for verifying the accuracy of the calculation through a comparison between the measured temperature field of the main girder and the simulated temperature field derived from the finite-element analysis. Figure 8 shows the arrangement of measurement points, and Figure 9 illustrates the measured and simulated results of the main beam temperature field. ‘LY-S’ denotes the simulated results, and ‘LY-M’ represents the measured results. From Figure 9, it is evident that the calculated simulated values of the main beams are largely consistent with the actual temperature variations, with a maximum error of no more than 1.5 °C. This indicates that the method adopted in this paper can realize the accurate simulation of the three-dimensional solar temperature field of the complex structure.
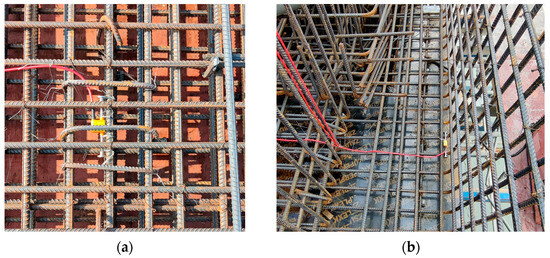
Figure 8.
Measurement point layout: (a) main beam roof; (b) main girder floor.
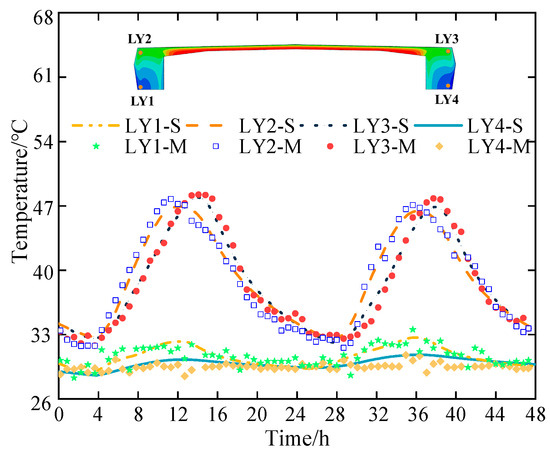
Figure 9.
Bridge temperature field comparison results.
4. Analysis of Temperature Field
To illustrate the variations in the bridge temperature field during the construction of the Longgun River Bridge, the bridge structure was analyzed after the completion of the first diagonal cable tensioning. Figure 10 depicts the current stage of the bridge calculation model, indicating that the 1# steel box has been encased in counterweight concrete, and the tensioning of the first and second pairs of diagonal cables has been completed.
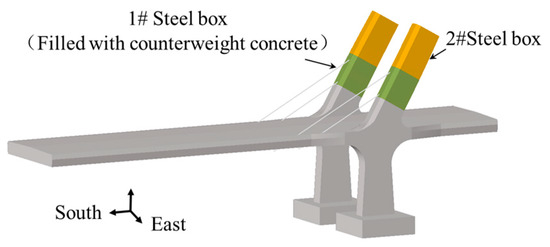
Figure 10.
Model diagram after the first cable tension is completed.
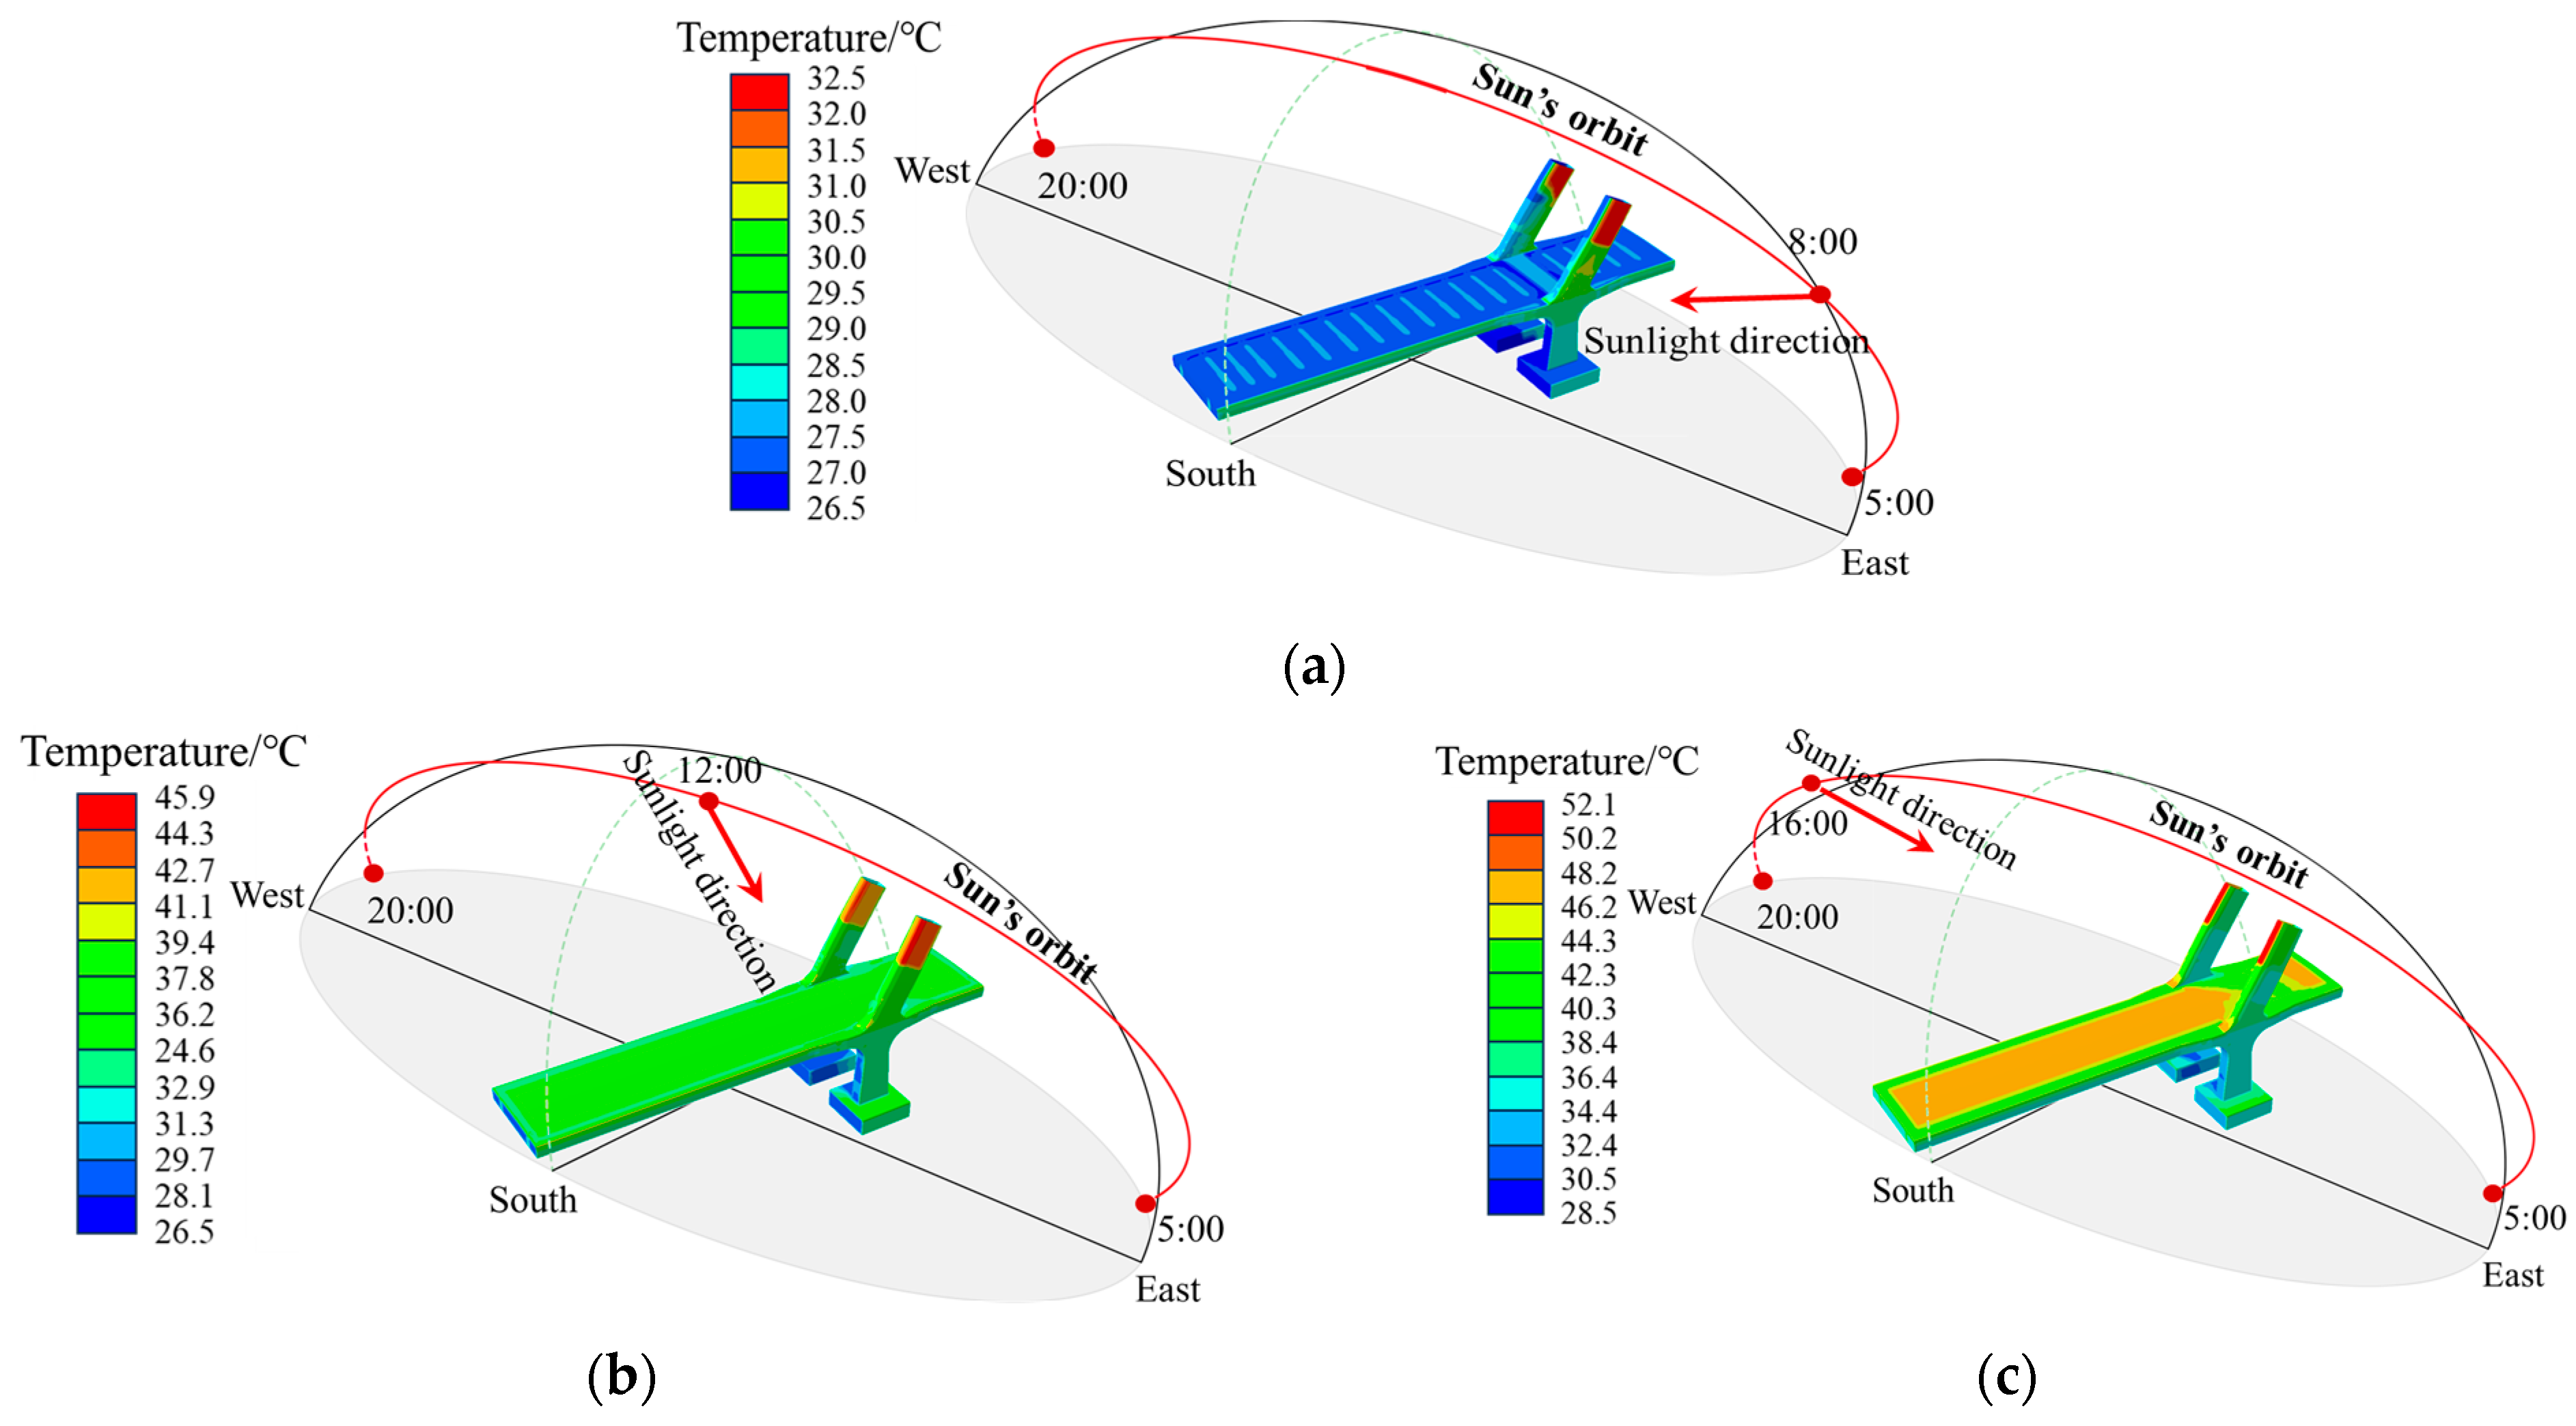
Figure 11 displays a cloud representation of the temperature field of the bridge structure as of 19 May 2023. It can be observed that the temperature between the bridge components continued to rise after 8:00. Due to the significantly higher thermal conductivity of steel compared to concrete, the surface temperature of the steel box on the bridge pylon increases rapidly under sunlight, remaining consistently higher than that of the concrete throughout the day. The maximum surface temperature of the steel box is recorded at 16:00, reaching 51.2 °C. Owing to the larger specific heat capacity of the concrete in the pylon, the temperature difference between the poured and unpoured sections is more obvious, with the maximum temperature difference reaching 10.6 °C at 16:00. At this time, the temperature of the concrete main girder inner deck plate can reach up to 47.2 °C, and the two sides of the solid section are 44.3 °C.

Figure 11.
Bridge temperature cloud at typical moments: (a) 8:00; (b) 12:00; (c) 16:00.
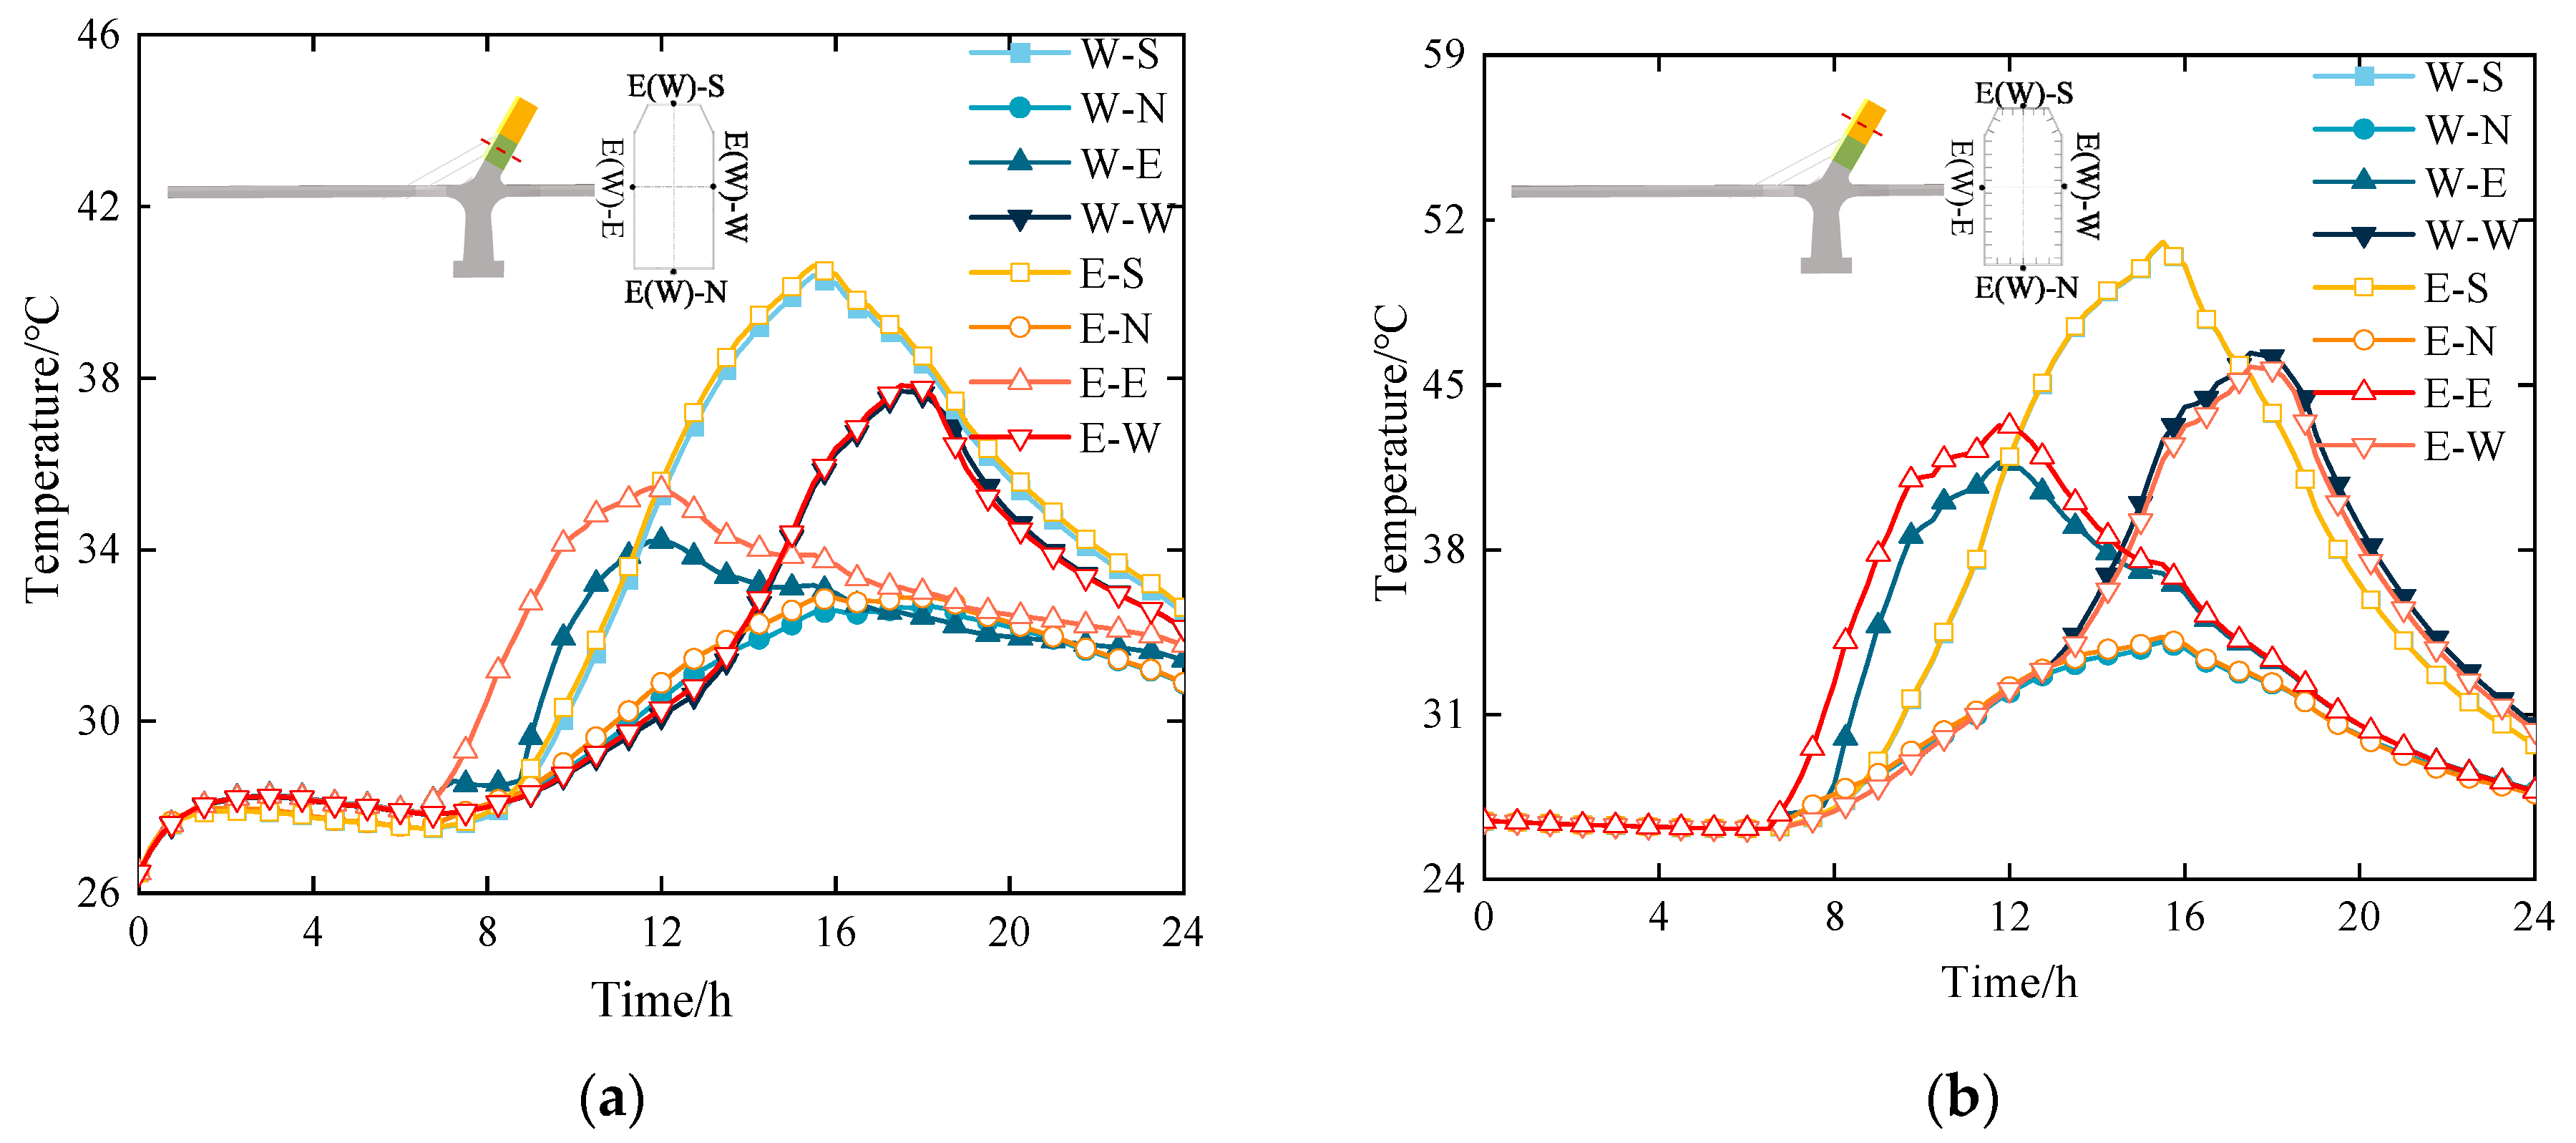
Figure 12 shows the surface-temperature variation curves for the 1# and 2# sections of the east and west bridge pylons, where ‘E-E’, ‘E-S’, ‘E-W’, and ‘E-N’ represent the east, south, west, and north side walls of the east bridge pylon, respectively. Similarly, ‘W-E’, ‘W-S’, ‘W-W’, and ‘W-N’ denote the east, south, west, and north side walls of the west bridge pylon.
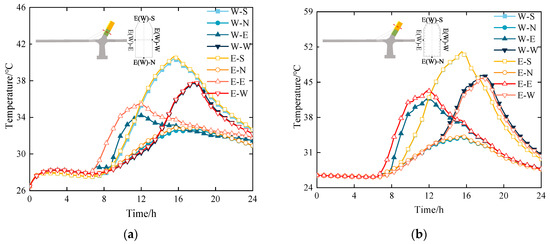
Figure 12.
Bridge pylon temperature variation curve: (a) 1# bridge pylon steel box; (b) 2# bridge pylon steel box.
It can be seen from Figure 12b that the highest temperature on the surface of the steel box of the bridge pylon appears on the south pylon wall, reaching 52 °C. Between 7:00 and 8:00, the shading effect of the east side bridge pylon on the west side bridge pylon results in significant temperature differences between the eastern walls of the two pylons, with a maximum temperature difference of 4.3 °C observed at 8:00. Figure 12a illustrates the surface-temperature variation curve of the 1# bridge pylon segment. Due to the heat transfer between the steel box and the concrete in the pylon, the surface temperature of the 1# bridge pylon segment will be significantly lower than that of the 2# steel box, although the trends are similar. At 16:00, the maximum temperature difference between the upper and lower segments of the 1# and 2# sections on the south side of the pylon wall can reach 10.6 °C.
5. Analysis of Temperature Effects on Bridge Pylon
Through the analysis of the temperature field of the bridge pylon in the previous subsection, it is evident that, at different times of the day, one side of the bridge pylon casts shade on the other side, resulting in a sudden drop in temperature in the shaded area. The temperature difference will cause asynchronous deformation on both sides of the bridge pylon, thereby imposing higher requirements on the control of the construction alignment of the bridge pylon. Since the bridge pylon is approximately in a single cantilever state, the base stress of the bridge pylon and the displacement change at the pylon top become more noticeable under solar temperature.
5.1. Pylon Top Displacement
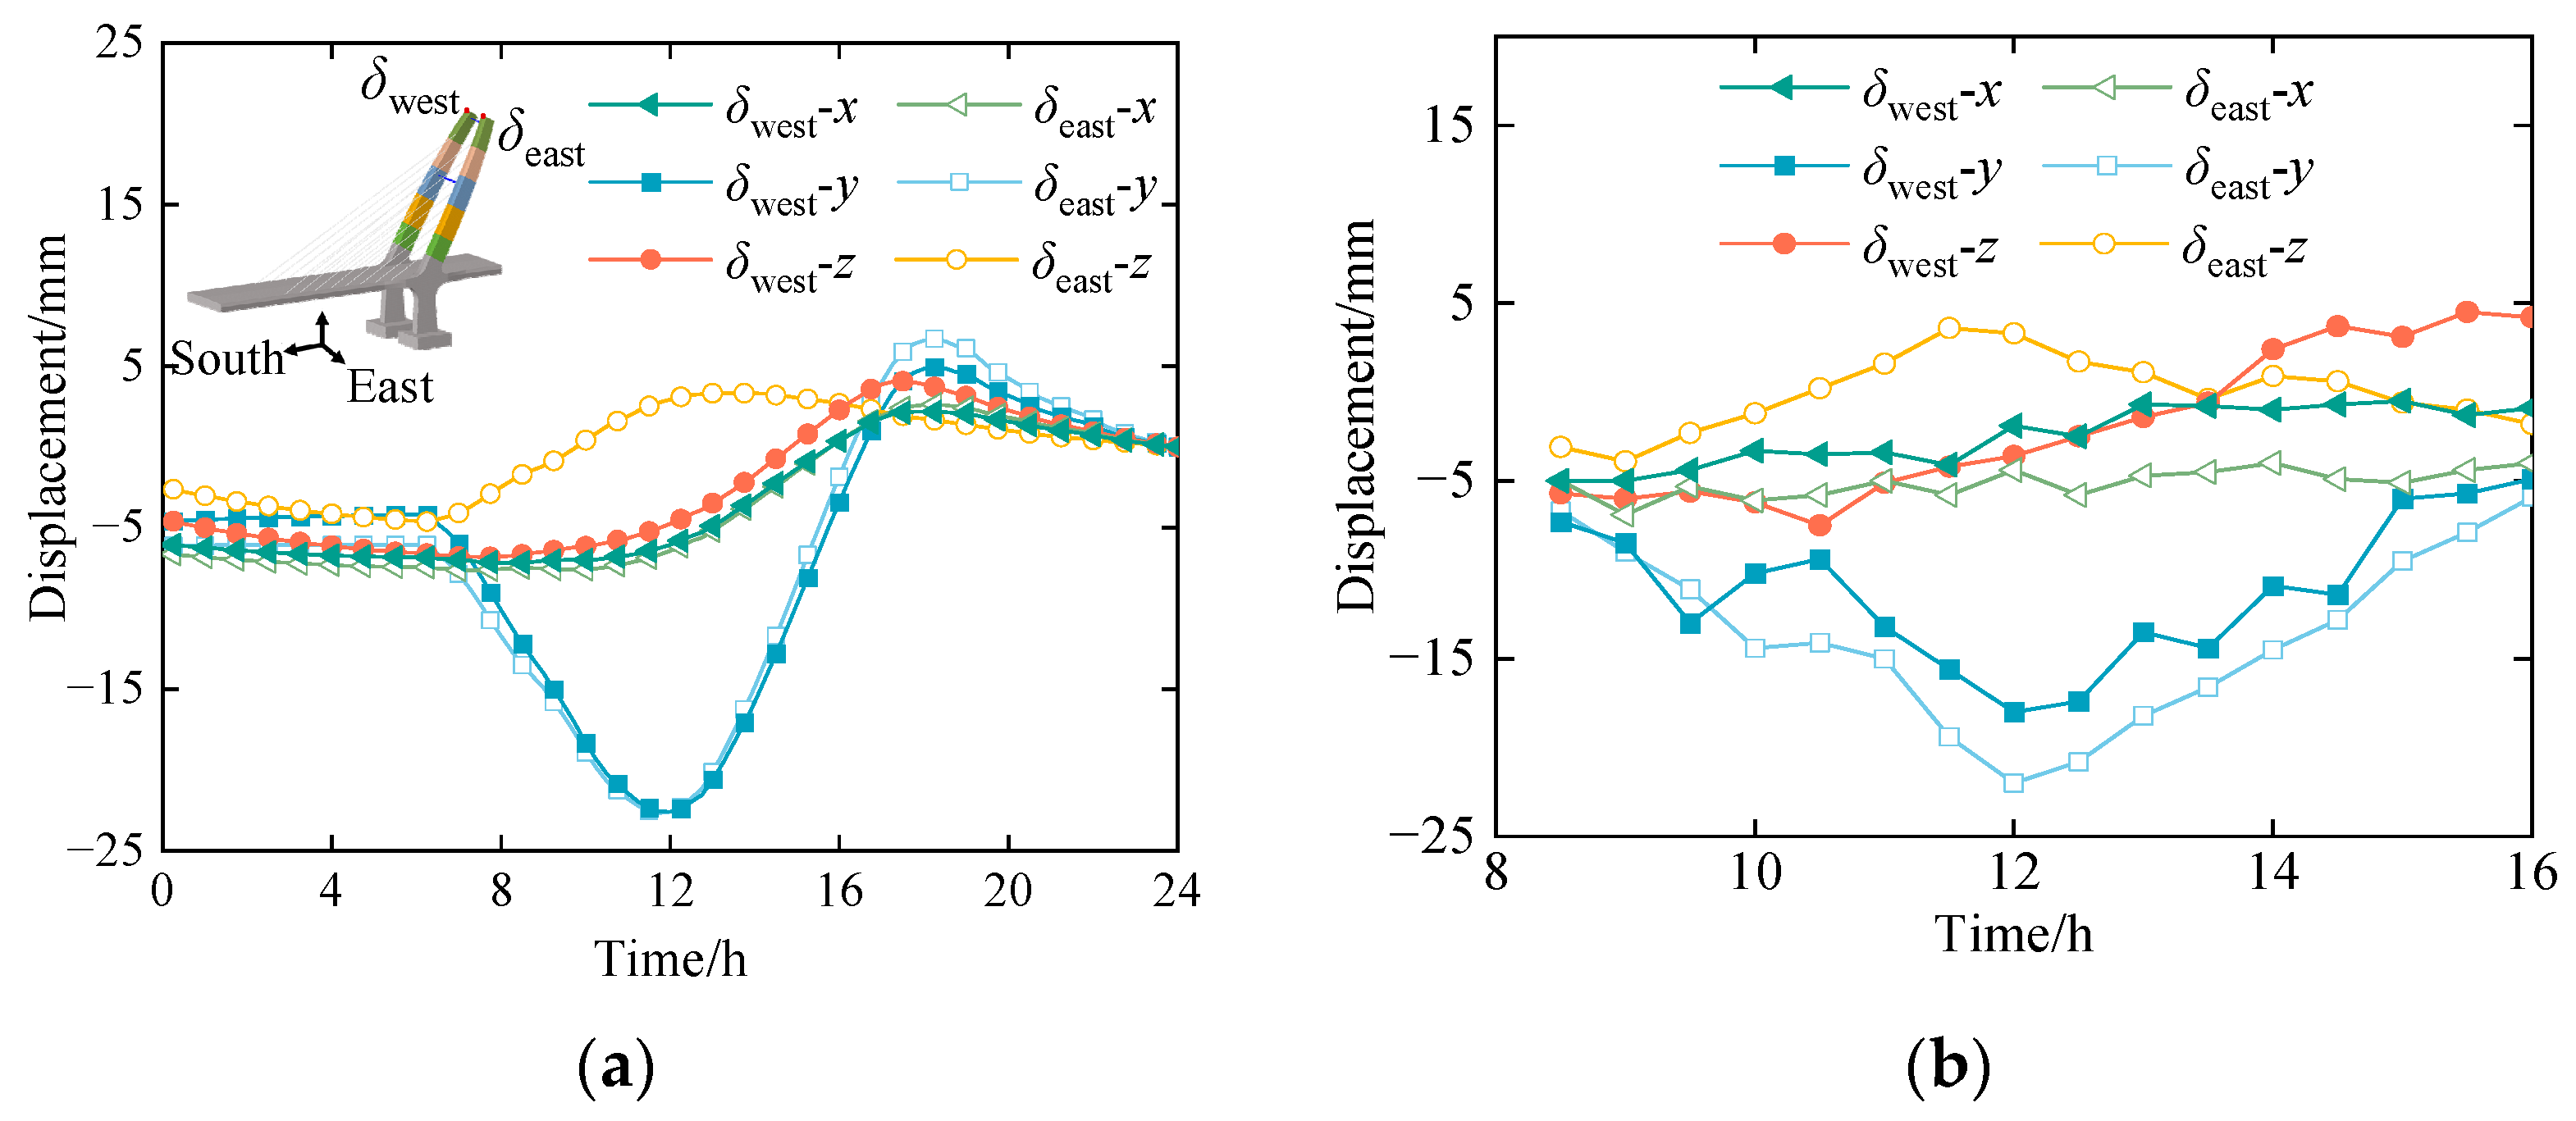
The overall stiffness of the bridge pylon in the cantilevered construction state is weak, and the effect of temperature on the pylon displacement is more significant. Figure 13a illustrates the variation in pylon girder displacement during the construction of segment 5# under temperature effect, where δeast(west)-x represents the longitudinal displacement of the east (west) bridge pylon, δeast(west)-y represents the transverse displacement of the east (west) bridge pylon. After sunrise, due to the shading from the east bridge pylon to the west bridge pylon, significant asynchronous vertical deformation occurs. At 12:00, the vertical displacement difference between the two sides of the bridge pylon can reach 7.7 mm, while the magnitude of vertical displacement change in the bridge pylon during the whole day was only 10.8 mm. Both the longitudinal and transverse displacements of the bridge pylons exhibit similar trends, with a longitudinal variation range of 10.1 mm and a transverse variation range of 29.3 mm over the course of the entire day. It can be analyzed that the transverse displacement should be the key factor of the alignment control of the bridge pylon construction of the cable-stayed bridge without backstays.

Figure 13.
Bridge pylon displacement: (a) calculated displacement of bridge pylon; (b) measured displacement of bridge pylon.
Figure 13b shows the measured displacement of the bridge pylon from 8:00 to 16:00 during the current construction phase. As can be seen from the figure, the method used in this paper is similar to the measured results. At 12:00, the minimum displacement in the transverse measurement was −17.4 mm, while the calculated result was −22.3 mm, with a difference of only 4.9 mm between the two. The maximum deviation throughout the day is only 3.7 mm in the vertical direction and 3.8 mm in the longitudinal direction of the bridge, indicating the accuracy of the simulation.
5.2. Bridge Pylon Base Stress
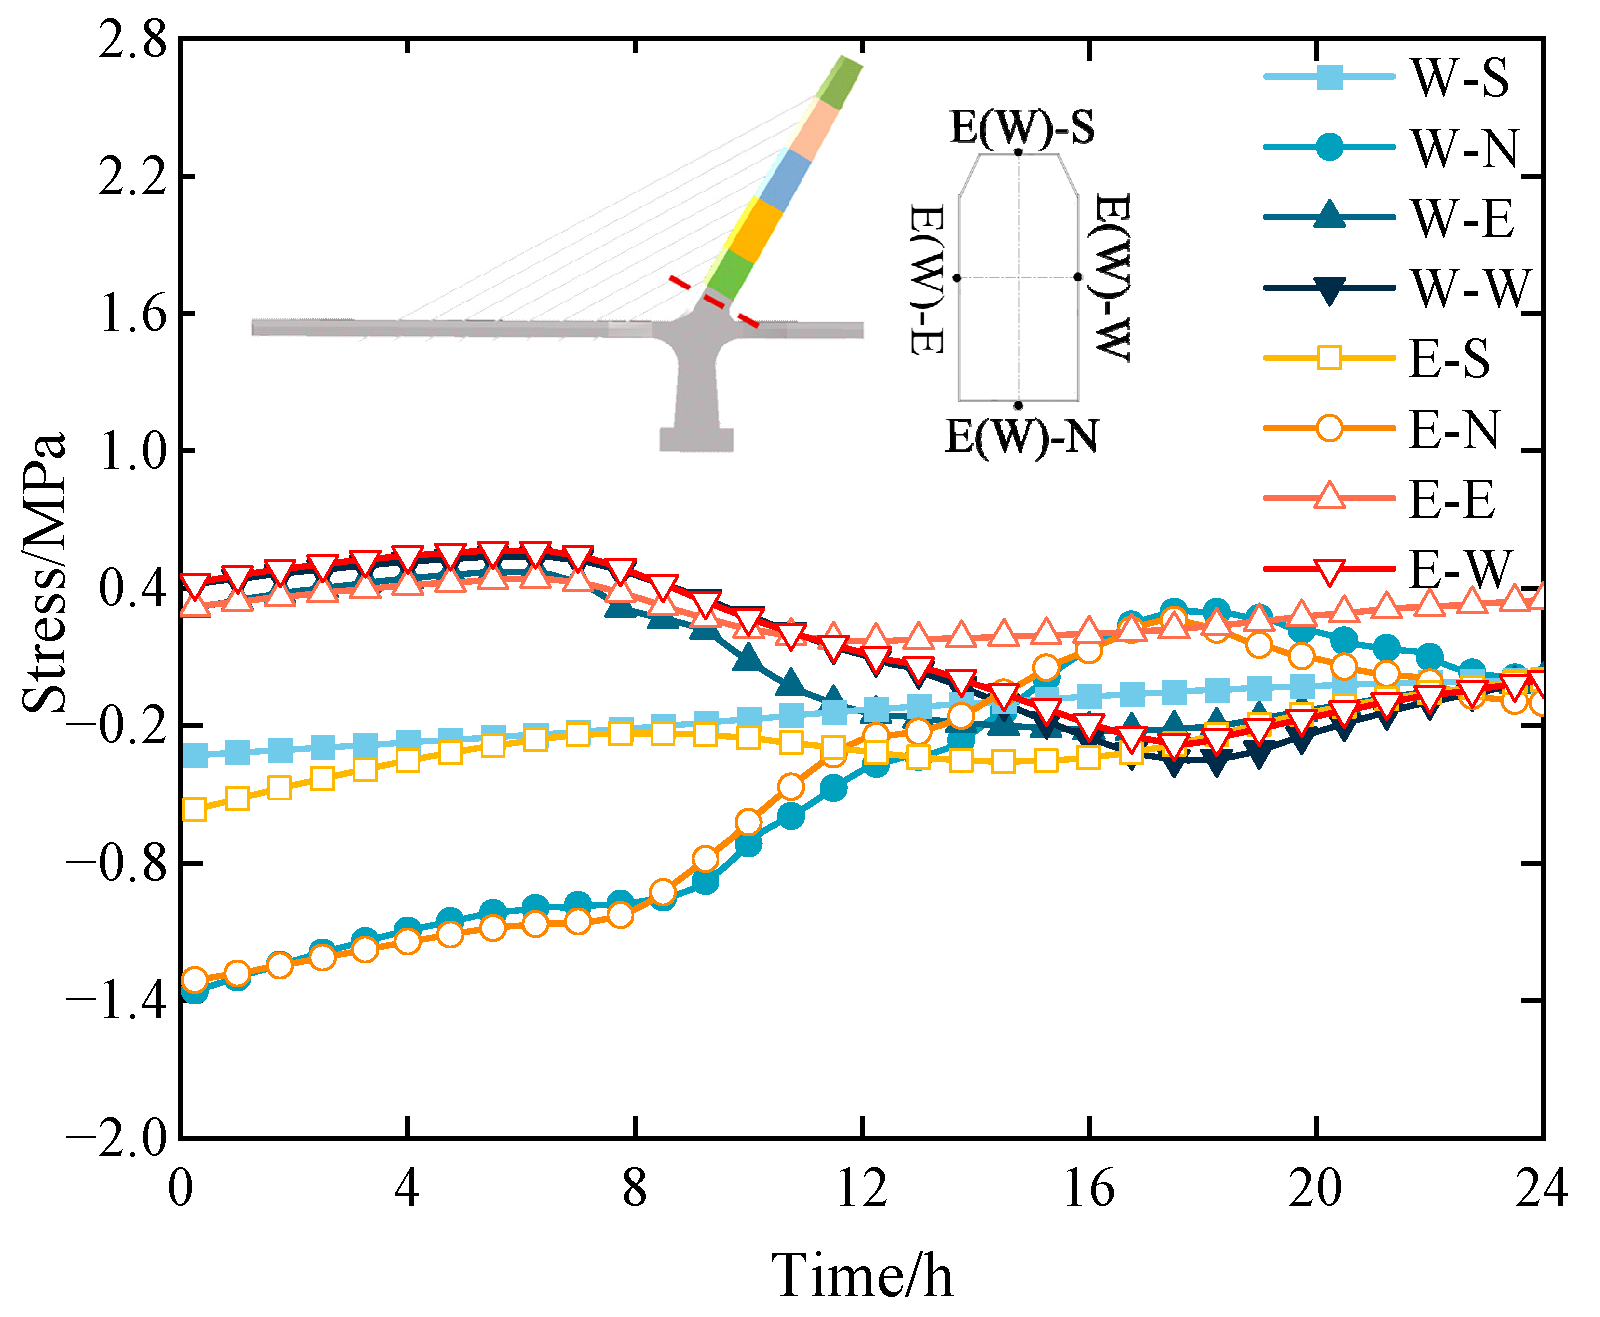
Figure 14 shows the concrete stress change at the base of the bridge pylon under the construction phase of the 5# bridge pylon. Under the influence of solar temperature, the bridge pylon moved to the south side before 18:00. The south side of the pylon wall exhibited a gentle transition, with the bridge’s surface stress showing less sensitivity to sunlight temperature, while the north side of the pylon wall exhibited the opposite trend. The tensile stress on the north side of the pylon wall gradually increased from −1.4 MPa to 0.4 MPa before 18:00, followed by a gradual transition to compressive stress. The stress change trend of the east and west side pylon walls of different bridge pylons was relatively consistent. However, due to the shading influence of the east side pylon, a stress difference gradually appears on the east pylon wall of the east and west pylon after 8:00, reaching a maximum of 0.44 MPa at 17:30.
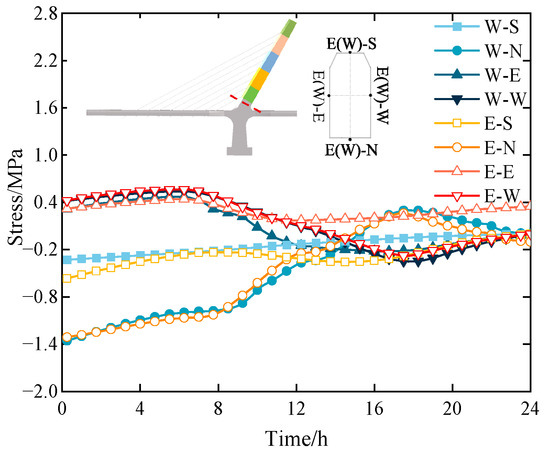
Figure 14.
Bridge pylon surface stress change.
6. Construction Control Recommendations
This paper is based on the engineering of the Longgun River Bridge; the vertical height of the pylon is 55 m. According to the requirements of the construction stage control accuracy in the Chinese code ‘Technical Specifications for Construction Monitoring and Control of Highway Bridges’ (JTG/T 3650-01-2022) [30], the steel structure installation of cable-stayed bridge pylons should be controlled within an accuracy of H/4000 (where H is the height of the bridge pylon), with an elevation error not exceeding ± 2 mm × n (where n is the number of bridge pylon segments), and the allowable relative error for cable-stayed cable force should not exceed 5%. To ensure the aforementioned construction control accuracy target, the construction error caused by temperature can be mitigated by reasonably arranging the lifting time of the bridge pylon and tensioning time of the cable-stayed cable, ensuring that the alignment shape and cable force after the bridge is completed meet the design target.
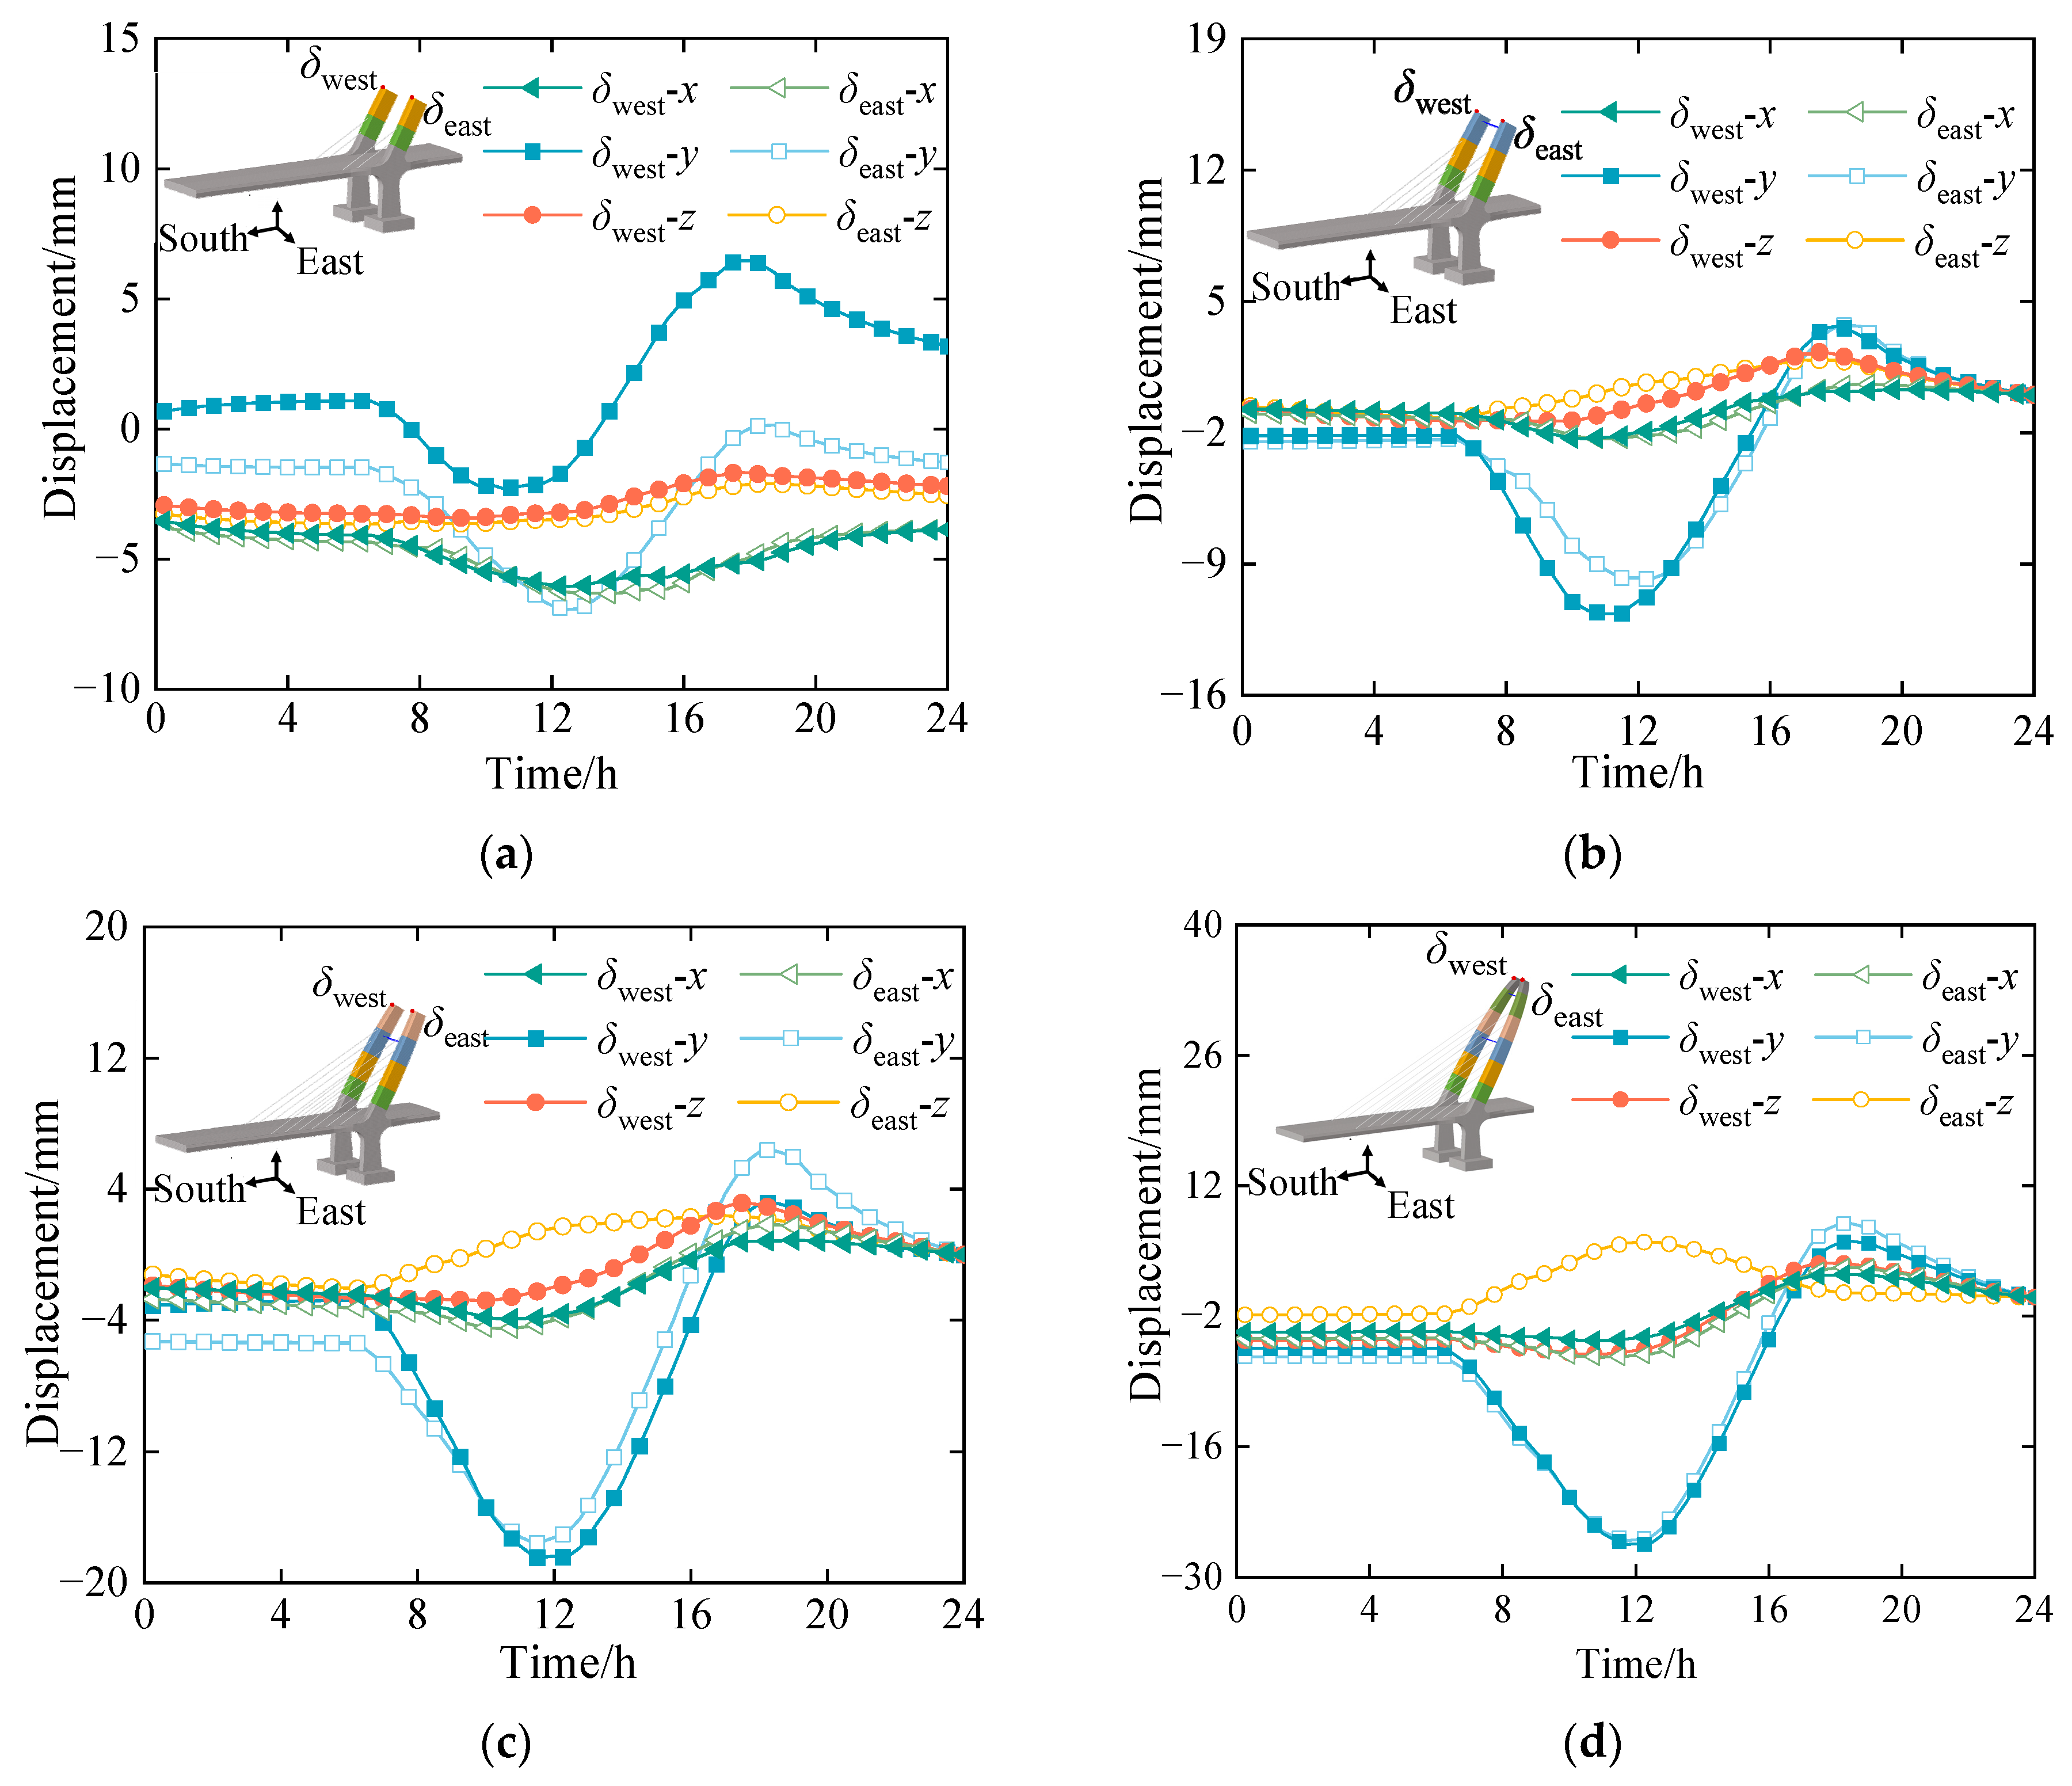
The temperature effect caused by solar radiation in each construction stage is depicted in Figure 15. Through analysis, it is found that, as the height of the bridge pylon increases during the construction process, the impact of solar temperature on the bridge displacement also increases. The maximum daily change in transverse displacement of the bridge pylon in the cantilever state can reach up to 33.6 mm, while the effects on longitudinal and vertical displacement are relatively smaller, remaining within specification limitations.
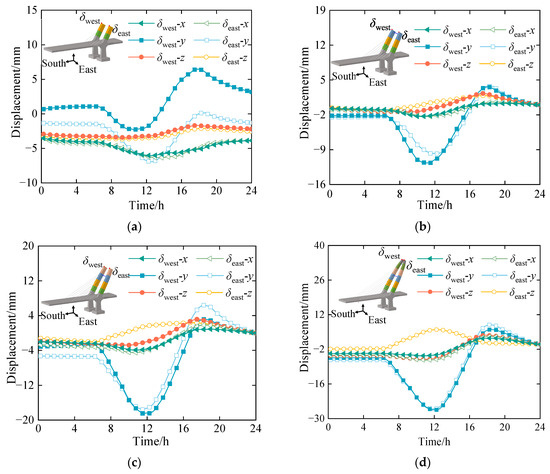
Figure 15.
Displacement changes of bridge pylon under solar radiation at different construction stages: (a) 2# bridge pylon segment; (b) 3# bridge pylon segment; (c) 4# bridge pylon segment; (d) 6# bridge pylon segment.
Table 2 provides a list of recommended construction control times for the bridge pylon construction process. During certain moments, one side of the bridge tower will be shaded by the other, and the temperature in the shaded area will drop significantly. This leads to asynchronous displacement between the two bridge towers. Therefore, the construction control time for the two bridge towers also differs. From the table, it can be seen that, when the pylon height is low, the bridge pylon’s stiffness is high, allowing for most of the day to meet construction requirements. However, as the pylon’s height increases, the bridge pylon’s stiffness weakens, and the positioning of the bridge pylon and welding time should be controlled between 19:30~9:30 to weaken the impact of sunlight temperature on the bridge pylon alignment.
Table 2.
Reasonable construction control time for bridge pylons.
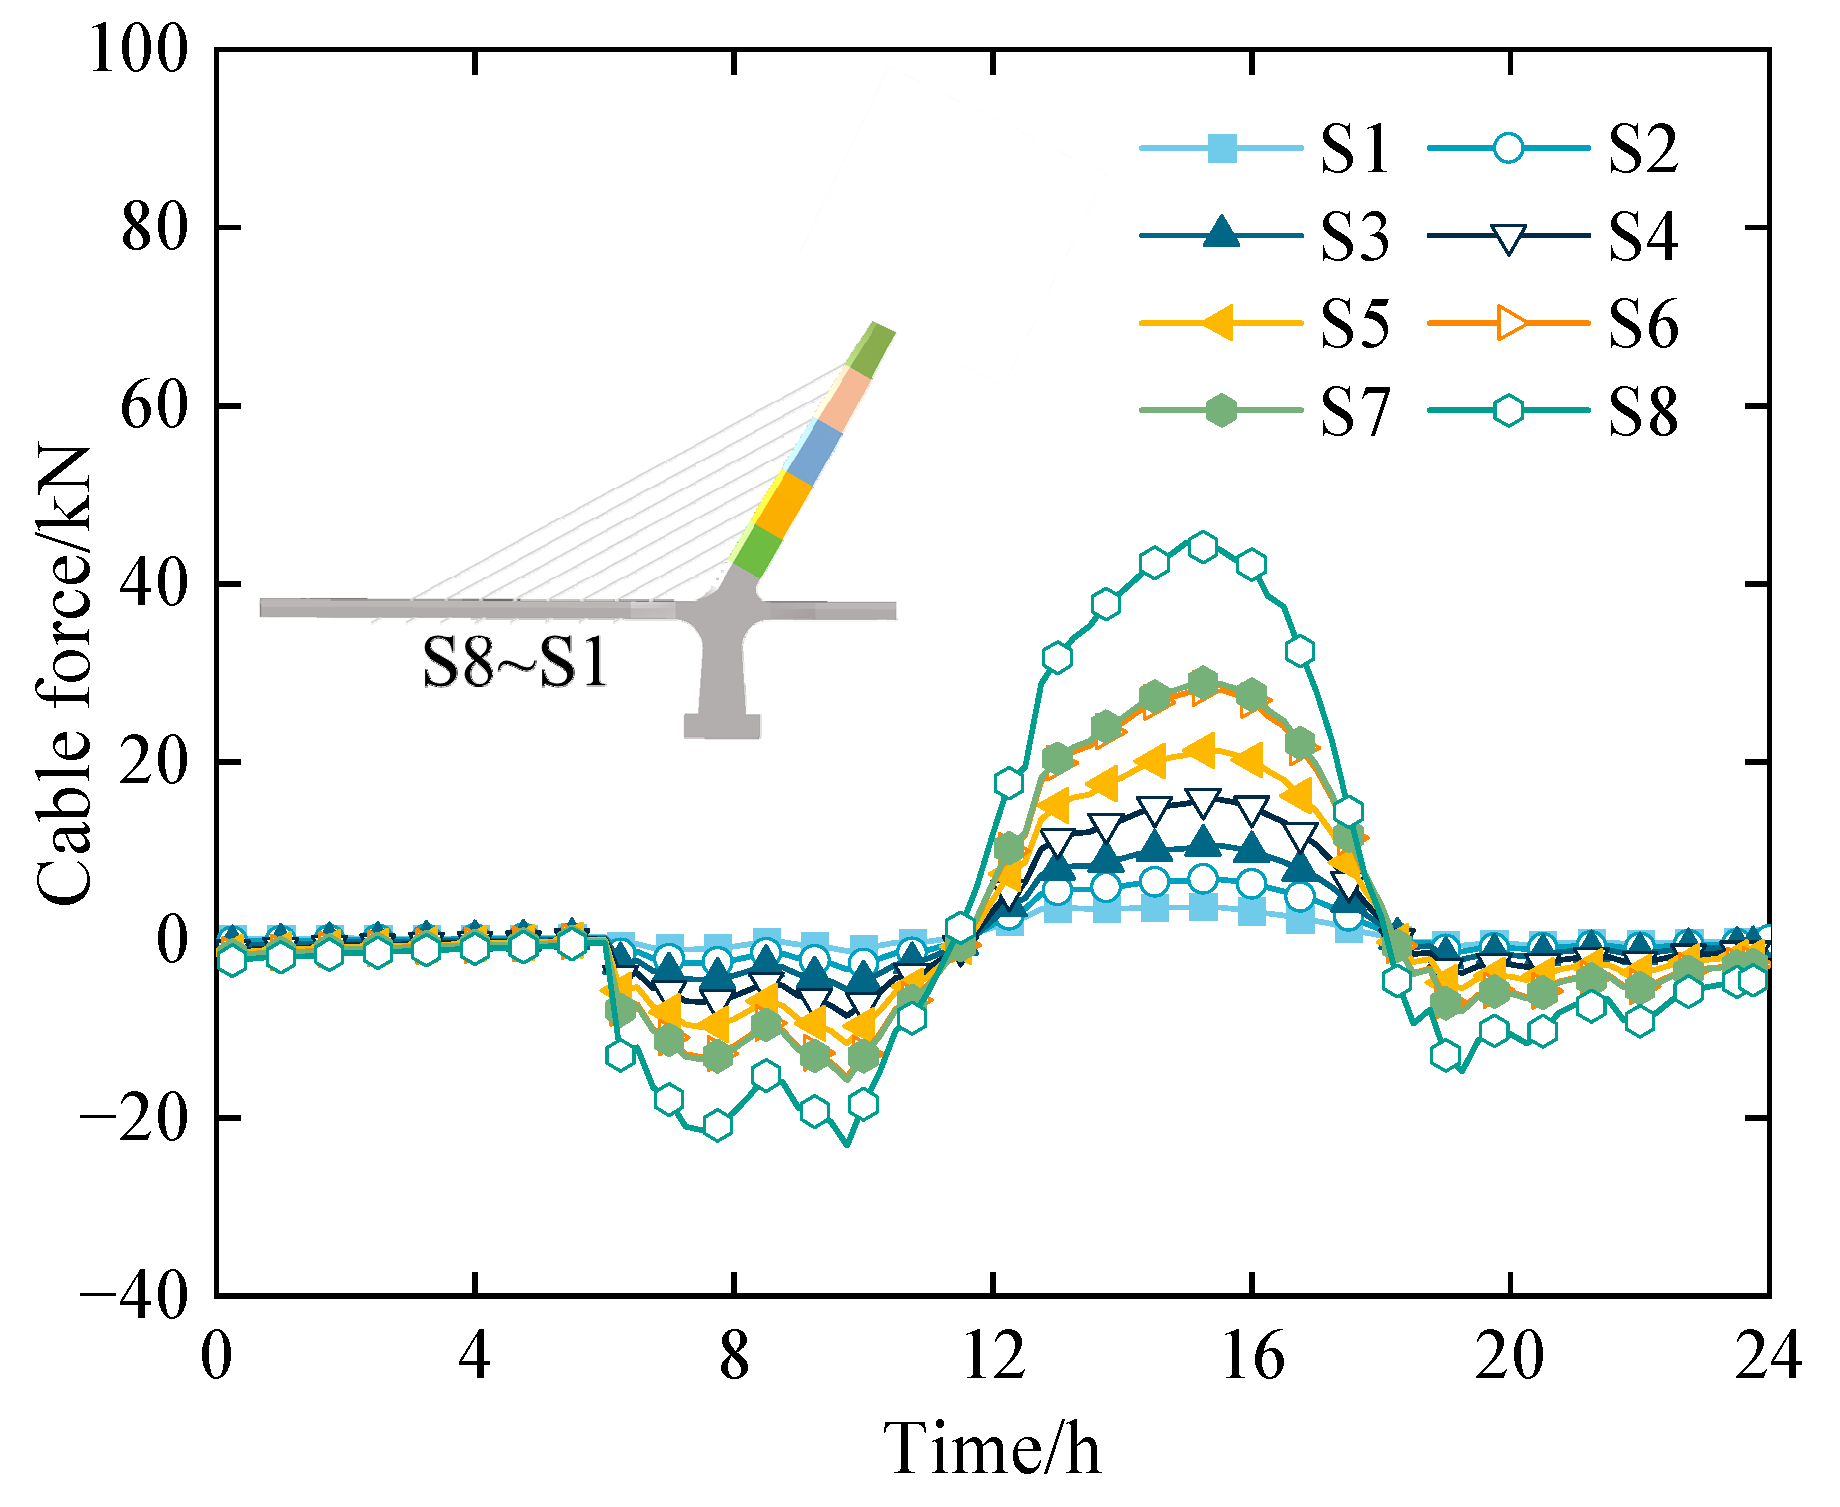
Figure 16 shows the change in cable force for each cable under the influence of solar temperature after the tension of cable S1~S8. Table 3 shows the maximum value of cable force change in each construction stage; the most significant changes in cable force occur between 6:00 to 18:00. The change in cable force of the cable-stayed bridge without backstays increases with the height of the pylon and the length of the cable. In the maximum cantilevered state of the bridge pylon, the maximum increase in cable force of cable S8 can reach up to 52 kN, which accounts for 1.4% of the design force. In order to ensure the quality of construction, the cable tensioning and measurement should be selected between 18:00~6:00, when the influence of solar temperature is small.

Figure 16.
Cable force under the influence of solar temperature.
Table 3.
Maximum position and value of cable force change in different construction stages.
According to the solar temperature effect on the Longgun River Bridge, construction activities are conducted in adherence to the predetermined timelines. Through a comparative analysis of measured deviations in pylon top and cable tensions against their theoretical counterparts, it was observed that the deviation in pylon top is 11 mm, while the average relative error in cable tension is 2.1%. These discrepancies fall well within the permissible construction tolerances, thus ensuring the construction quality of the Longgun River Bridge amidst the challenging conditions of high temperature and humidity prevalent in Hainan.
7. Conclusions
This paper accurately analyses the temperature distribution patterns of the curved special-shaped pylon cable-stayed bridge without backstays by employing the shadow recognition algorithm proposed in previous studies. Based on this, the temperature-induced stress and displacement of the structure were calculated, the deformation characteristics of the bridge pylon were summarized, and the optimal construction times for bridge pylon lifting and cable tensioning were predicted. The following conclusions were drawn:
(1) During the construction process, one side of the bridge pylon will produce shadow shading on the other side; the maximum temperature difference between the light area and the shadow area of the bridge pylon can reach 4.3 °C. Additionally, the temperature difference between the upper and lower sections of the poured and unpoured concrete steel box surfaces can be up to 10.6 °C, due to the presence of the concrete in the pylon during the construction process;
(2) Due to shadow shading between the bridge pylons, asynchronous deformation occurs between the two sides of the bridge pylons. Moreover, the direction of these asynchronous deformation changes during the construction process. When the height of the bridge pylon is low, asynchronous deformation in the transverse direction is more pronounced. Meanwhile, as the height of the bridge pylon increases, asynchronous deformation in the vertical direction becomes more apparent. The stresses at the base of the pylons are also affected by the shadow between the pylons, resulting in stress differences. During the construction of segment 5# of the bridge pylons, the transverse stress difference can reach 0.44 MPa;
(3) Under the influence of temperature, the transverse displacement of the bridge pylon is particularly sensitive to solar temperature. As the height of the bridge pylon increases during the construction process, the effect of solar temperature on bridge displacement and cable-stayed cable force also increases. The maximum daily variation in the transverse displacement of the bridge pylon in the maximum cantilever condition can reach up to 33.6 mm, and the maximum variation in cable force is 52 kN for cable S8;
(4) To mitigate the impact of solar effects, the construction schedule for bridge pylons in the cable-stayed bridge without backstays should be limited to between 19:30 and 9:30. The tensioning and measurement of cables should be avoided between 6:00 and 18:00. Furthermore, the daily variation pattern of each control parameter should be taken into consideration to correct for the temperature effect.
Author Contributions
Conceptualization, J.L. and B.G.; methodology, Z.W., Y.L. and J.L.; software, B.G.; validation, B.G. and Z.W.; formal analysis, S.L. and L.F.; investigation, B.G. and J.L.; supervision, J.L.; project administration, J.L.; writing—original draft preparation, B.G. and J.L.; writing—review and editing, B.G., L.F., J.L., Y.L., S.L. and Z.W. All authors have read and agreed to the published version of the manuscript.
Funding
This research was funded by the Key Research and Technologies for the Construction of the Main Pylon of Curved Special-shaped Pylon Cable-stayed Bridge without Backstays (Grant No. T-GL-XMGS(J)-HAN-HDLYGL-02-JS-034).
Data Availability Statement
All datasets are publicly available.
Conflicts of Interest
Author Lianjun Feng is employed by the Xiamen Company of China First Highway Engineering Co., Ltd. The remaining authors declare that the research was conducted in the absence of any commercial or financial relationships that could be construed as a potential conflict of interest.
References
- Liu, J.; Liu, Y.J.; Zhang, C.; Zhao, Q.; Lyu, Y.; Jiang, L. Temperature action and effect of concrete-filled steel tubular bridges: A review. J. Traffic Transp. Eng. 2020, 7, 174–191. [Google Scholar] [CrossRef]
- Meng, Q.L.; Zhu, J.S. Fine temperature effect analysis–based time-varying dynamic properties evaluation of long-span suspension bridges in natural environments. J. Bridge Eng. 2018, 23, 04018075. [Google Scholar] [CrossRef]
- Tong, M.; Tham, L.G.; Au, F.T.K.; Lee, P.K.K. Numerical modelling for temperature distribution in steel bridges. Comput. Struct. 2001, 79, 583–593. [Google Scholar] [CrossRef]
- Bai, Y.X.; Liu, Y.J.; Liu, J.; Wang, Z.; Yan, X.K. Research on solar radiation-caused radial temperature difference and interface separation of CFST. Structures 2024, 62, 106151. [Google Scholar] [CrossRef]
- Tu, G.Y.; Yan, D.H.; Zhang, K.N. Calculation method and countermeasure for closure temperature influence in trussed CFST arch bridge. Eng. Mech. 2008, 25, 236–240. [Google Scholar]
- Li, X.G.; Luo, H.R.; Ding, P.; Chen, X.H.; Tan, S.L. Prediction Study on the Alignment of a Steel-Concrete Composite Beam Track Cable-Stayed Bridge. Buildings 2023, 13, 882. [Google Scholar] [CrossRef]
- Lou, P.; Zhu, J.P.; Dai, G.L.; Yan, B. Experimental study on bridge—Track system temperature actions for Chinese high-speed railway. Arch. Civ. Mech. Eng. 2018, 18, 451–464. [Google Scholar] [CrossRef]
- Hagedorn, R.; Martí-Vargas, J.R.; Dang, C.N.; Hale, W.M.; Floyd, R.W. Temperature gradients in bridge concrete I-girders under heat wave. J. Bridge Eng. 2019, 24, 04019077. [Google Scholar] [CrossRef]
- Mirambell, E.; Aguado, A. Temperature and stress distributions in concrete box girder bridges. J. Struc. Eng. 1990, 116, 2388–2409. [Google Scholar] [CrossRef]
- Long, G.; Yang, Y.H.; Zhu, W.Q.; Liu, Y.J. Analysis and handing of upwarping accident of main girder of a steel box girder cable-stayed bridge. Bridge Constr. 2018, 48, 113–117. [Google Scholar]
- Zhou, L.; Xia, Y.; Brownjohn, J.M.W.; Koo, K.Y. Temperature analysis of a long-span suspension bridge based on field monitoring and numerical simulation. J. Bridge Eng. 2016, 21, 04015027. [Google Scholar] [CrossRef]
- Wang, J.F.; Xu, Z.Y.; Fan, X.L.; Lin, J.P. Thermal effects on curved steel box girder bridges and their countermeasures. J. Perf. Constr. Facil. 2017, 31, 04016091. [Google Scholar] [CrossRef]
- Mosavi, A.A.; Seracino, R.; Rizkalla, S. Effect of temperature on daily modal variability of a steel-concrete composite bridge. J. Bridge Eng. 2012, 17, 979–983. [Google Scholar] [CrossRef]
- Liu, H.B.; Chen, Z.H.; Zhou, T. Theoretical and Experimental Study on the Temperature Distribution of H-shaped. Appl. Therm. Eng. 2012, 37, 329–335. [Google Scholar] [CrossRef]
- Liu, Y.; Han, S.; Gong, B.X.; Wang, Z.; Liu, J.; Shen, Z. Refined 3D Solar Temperature Field and Effect Simulation of Ultra-High Steel Bridge Pylon. Appl. Sci. 2023, 13, 4400. [Google Scholar] [CrossRef]
- Hu, W.; Liu, J.; Liu, Y.J.; Lyu, Y.; Li, H.T.; Xian, J.P.; Ma, Y.P. Construction alignment and closure control of CFST truss arch bridges based on temperature effect. Structures 2024, 63, 106471. [Google Scholar] [CrossRef]
- Zhu, J.S.; Meng, Q.L. Effective and fine analysis for temperature effect of bridges in natural environments. J. Bridge Eng. 2017, 22, 04017017. [Google Scholar] [CrossRef]
- Kennedy, J.B.; Soliman, M.H. Temperature distribution in composite bridges. J. Struc. Eng. 1987, 113, 475–482. [Google Scholar] [CrossRef]
- Dai, P.; Qian, Y.J. Short-term temperature characteristics of H-shaped section concrete pylon of cable-stayed bridge. J. Southwest Jiaotong Univ. 2014, 49, 59–65. [Google Scholar]
- Zhang, H.L.; Li, J.; Liu, C.G.; Jiang, T.H.; Wei, J. Thermal Effect of the Cable-Stayed Bridge Tower. Wuhan Univ. J. Nat. Sci. 2003, 04, 1121–1125. [Google Scholar]
- Wang, Z.; Liu, Y.J.; Tang, Z.W.; Zhang, G.J.; Liu, J. Three-dimensional temperature field simulation method of truss arch rib based on sunshine shadow recognition. China J. Highw. Transp. 2022, 35, 91–105. [Google Scholar]
- Gu, B.; Xie, P.Z.; Qian, H.; Lei, L.H. 3D-temperature field and its effect of inverted Y-shaped concrete pylon in lower Yangtze region. J. Cent. South Univ. 2020, 50, 248–260. [Google Scholar]
- Elbadry, M.M.; Ghali, A. Temperature Variations in Concrete Bridges. J. Struct. Eng. 1983, 109, 2355–2374. [Google Scholar] [CrossRef]
- Chen, D.S.; Wang, H.J.; Qian, H.L.; Li, X.Y.; Fan, F.; Shen, S.Z. Experimental and Numerical Investigation of Temperature Effects on Steel Members Due to Solar Radiation. Appl. Therm. Eng. 2017, 127, 696–704. [Google Scholar] [CrossRef]
- Liu, B.Y.H.; Jordan, R.C. The Interrelationship and Characteristic Distribution of Direct, Diffuse and Total Solar Radiation. Sol. Energy 1960, 4, 1–19. [Google Scholar] [CrossRef]
- Hottel, H.C. A Simple Model for Estimating the Transmittance of Direct Solar Radiation Through Clear Atmospheres. Sol. Energy 1976, 18, 129–134. [Google Scholar] [CrossRef]
- Zhao, R.D.; Wang, Y.B. Studies on Temperature Field Boundary Conditions for Concrete Box-girder Bridges Solar Radiation. Chin. J. Highw. 2016, 29, 52–61. [Google Scholar]
- Kehlbeck, F. Einfluss der Sonnenstrahlung bei Brückenbauwerken; Werner-Verlag: Bielefeld, Germany, 1975. [Google Scholar]
- ASHRAE. Handbook of Fundamentals; American Society of Heating, Refrigerating, and Air Conditioning Engineers: Peachtree Corners, GA, USA, 1972. [Google Scholar]
- JTG/T 3650-01-2022; Technical Specifications for Construction Monitoring and Control of Highway Bridges. Ministry of Transport of China: Beijing, China, 2022. (In Chinese)


Disclaimer/Publisher’s Note: The statements, opinions and data contained in all publications are solely those of the individual author(s) and contributor(s) and not of MDPI and/or the editor(s). MDPI and/or the editor(s) disclaim responsibility for any injury to people or property resulting from any ideas, methods, instructions or products referred to in the content. |
© 2024 by the authors. Licensee MDPI, Basel, Switzerland. This article is an open access article distributed under the terms and conditions of the Creative Commons Attribution (CC BY) license (https://creativecommons.org/licenses/by/4.0/).