Article

Assessment of Glass-Fiber-Reinforced Polymer (GFRP)–Concrete Interface Durability Subjected to Simulated Seawater Environment

1
College of Civil Engineering, Nanjing Forestry University, Nanjing 210037, China
2
Faculty of Architecture and Civil Engineering, Huaiyin Institute of Technology, Huaian 223001, China
*
Author to whom correspondence should be addressed.
Buildings 2024, 14(6), 1732; https://doi.org/10.3390/buildings14061732
Submission received: 24 April 2024 / Revised: 31 May 2024 / Accepted: 7 June 2024 / Published: 9 June 2024

Abstract

:
Fiber-reinforced polymer (FRP)-retrofitted concrete structures are extensively utilized, and they have attracted growing research interest due to their combined performance in marine environments. To investigate the effect of seawater exposure, a total of 20 single-shear GFRP (glass-FRP)-bonded concrete structures were tested. Three corrosion conditions, i.e., exposure to single-salinity and triple-salinity seawater through wet–dry cycles as well as continuous immersion in triple-salinity seawater, were simulated and tested. The minimum shear strength (13,006 N) was tested using specimen B150-T-DW-90, which was cured in triple-salinity seawater with wet–dry cyclic exposure. The results of the shear strengths, load–displacement curves, interfacial shear stresses, and fracture energies indicated that seawater exposure degraded the bonding strength of the GFRP–concrete interface. Notably, the wet–dry cycles in triple-salinity seawater resulted in the most significant interface degradation, which could exacerbate with prolonged exposure. By introducing a parameter, the residual coefficient α, a new strength calculation model for GFRP–concrete exposed to a seawater environment was proposed and discussed.

1. Introduction

The performance of concrete structures may gradually become weaker over time due to prolonged use and exposure to harsh environments such as seawater, elevated temperature regimes, or freeze–thaw cycles [1,2,3]. To maintain the safety performance of these structures, external repairing/reinforcing methods are often used [4,5]. Recently, FRP (fiber-reinforced polymer)–concrete-reinforced structures have attracted increasing attention due to their light weight, high strength, and excellent durability [6,7,8,9]. For FRP–concrete structures, the performance of composite structures is mainly governed by the FRP–concrete interface [10], which can be divided into four types according to its bonding process, i.e., dry bond interface [4], wet bond interface [11], shear key interface [12], and a combined shear key with a wet bond interface [13]. A dry bond interface is used to enhance the performance of existing concrete structures by bonding them with FRP materials via epoxy adhesive, which is most widely used in composite structures.
The influence of water or moisture on the durability of interfaces in FRP–concrete-bonded structures is a critical area of study. The impact of moisture or a hydrothermal environment can be attributed to the disruption of weaker hydrogen bonds between the epoxy adhesive and concrete caused by water molecules [4]. Tuaka et al. [14] conducted a pivotal experimental analysis, focusing on the CFRP–concrete bond interface within a moisture environment. Their findings revealed that exposure to moisture significantly compromises the bond strength between FRP and concrete. Later, Zheng et al. [15] studied the bond–slip behavior of an FRP–concrete bond subjected to a static load after hydrothermal environment exposure, and a noticeable deterioration of the bond stiffness was observed.
In addition to the direct influence of water molecules, the curing method of wet–dry cycles is also one of the reasons for interfacial degradation. Liang et al. [16] explored the synergistic effects of these cycles combined with a sustained load on FRP–concrete bond behavior, deducing that wet–dry cycles diminish the interface bond strength. This degradation was exacerbated under the dual influence of sustained loading and wet–dry exposure, particularly after the application of a sustained load. Choi et al. [17] and Kabir et al. [18] conducted experimental studies on the durability of CFRP–concrete beams in various harsh environments. Their investigations revealed that although temperature and moisture cycles primarily cause failure within a concrete substrate, concrete–adhesive interface failure is predominantly due to salt fog cycles.
The bond behaviors of FRP–concrete interfaces in marine or seawater environments have also been discussed. First, Al-Rousan et al. [19] conducted experiments on dry bond FRP–concrete composite beams in a sulfate solution, revealing a significant decrease in bond interface strength under wet–dry cycles. Fazli et al. [20] experimentally investigated the effective bond length of CFRP sheets subjected to marine environment exposure. The penetration and diffusion of a saltwater solution altered the mechanical properties of concrete and epoxy. Compressive strength influenced the maximum bond stress. The effective bond length of the CFRP–concrete interface was clearly influenced by both the CFRP stiffness and concrete strength. Further, Zhang et al. [4] investigated the durability of FRP–high-strength-concrete double-lap joints subjected to seawater immersion. Their findings showed a reduction in the ultimate loads of the interface with an increase in the immersion duration.
Recently, the durability of FRP–seawater and sea-sand concrete (SSC) composite structures has also become a concern to engineers [21,22]. Bazli et al. [23] explored the resilience of SSC-filled FRP tubes, specifically in marine environments. Their observations revealed a heightened deterioration in composites made of basalt-FRP (BFRP) and glass-FRP (GFRP) in contrast to those made with carbon-FRP (CFRP). Furthermore, an investigative study by Xie et al. [24] on BFRP bars encased in SSC and subjected to different solution environments underscored the critical role of alkalinity in the weakening of BFRP materials.
Previous research has revealed the degradation of FRP–concrete composite structures in harsh seawater environments, predominantly focused on conventional seawater corrosion conditions. However, the heterogeneity and complexity of marine environments necessitate a deeper exploration into corrosion models, particularly under conditions of ultra-high salinity. To address this gap, we conducted accelerated corrosion experiments using GFRP–concrete single-shear specimens under ultra-high salinity conditions and explored the durability of the composite structures after long-term corrosion exposure. Based on the experimental study, shear strength and load–displacement curves were discussed and the long-term behaviors of GFRP–concrete single-shear specimens under the designated environmental conditions were predicted. The outcomes of this research make significant contributions to expanding the available experimental database and enhancing our understanding of the durability of FRP–concrete interfaces when exposed to seawater environments.

2. Materials and Methods

2.1. Materials

The GFRP–concrete specimens were designed using the bonding structures of concrete bricks and GFRP plates. The concrete components in this experiment were designed with dimensions of 230 mm × 40 mm × 40 mm and a strength grade of C60. To determine the performance of the concrete, three concrete cubes with dimensions of 150 mm × 150 mm × 150 mm were prepared and the compressive strength of the concrete cubes was measured according to the Standard Test Methods for Mechanical Properties of Ordinary Concrete (GB/T 50081-2019) [25]. The compositions of the concrete are listed in Table 1. The average compressive strength (fcu) of these three concrete cubes was tested to be 61.4 MPa. The GFRP plates were designed with dimensions of 300 mm × 30 mm × 6 mm using a pultrusion process and were manufactured by Nanjing Kangte FRP Co., Ltd. in Nanjing, China. To realize the interface connection between the GFRP plates and concrete specimens, structural adhesives (including a bottom-impregnating adhesive and a bonding adhesive) produced by Kaben Technology Group Co., Ltd. (Company in Nanjing, China) were used. The mechanical properties of the materials used in this study are listed in Table 2. It should be noted that the mechanical performance indicators of the GFRP and adhesive in the table were derived from the manufacturer’s test results.

2.2. Seawater Corrosion Conditions

In order to simulate the corrosion conditions of seawater, two types of seawater salinity (single- and triple-salinity) water maintenance environments were prepared. The single-salinity seawater was formulated according to the composition of artificial seawater provided by the American Society for Testing and Materials, standard ASTM D-1141-98 (2021) [26] of the Standard Technical Specification for Artificial Seawater, as listed in Table 3. In addition, based on the data in Table 3, three times the ion concentration of seawater (i.e., triple-salinity seawater) was prepared to study the performance of the specimens under high-concentration accelerated corrosion conditions.
To investigate the durability performance of specimens exposed to different seawater environments, three types of corrosion-cured specimens were tested for strength—namely, single-salinity dry–wet cycle curing (S-DW), triple-salinity dry–wet cycle curing (T-DW), and triple-salinity immersion curing (T-IM). For each cycle of dry–wet cycle curing, the components were first immersed in a seawater solution for 12 h and then naturally air-dried for 12 h. The curing durations for all GFRP–concrete specimens were 30, 60, and 90 days. In order to maintain the salinity of the seawater, the seawater used in the experiment was updated every two weeks. The details of the experimental parameters are provided in Table 4.

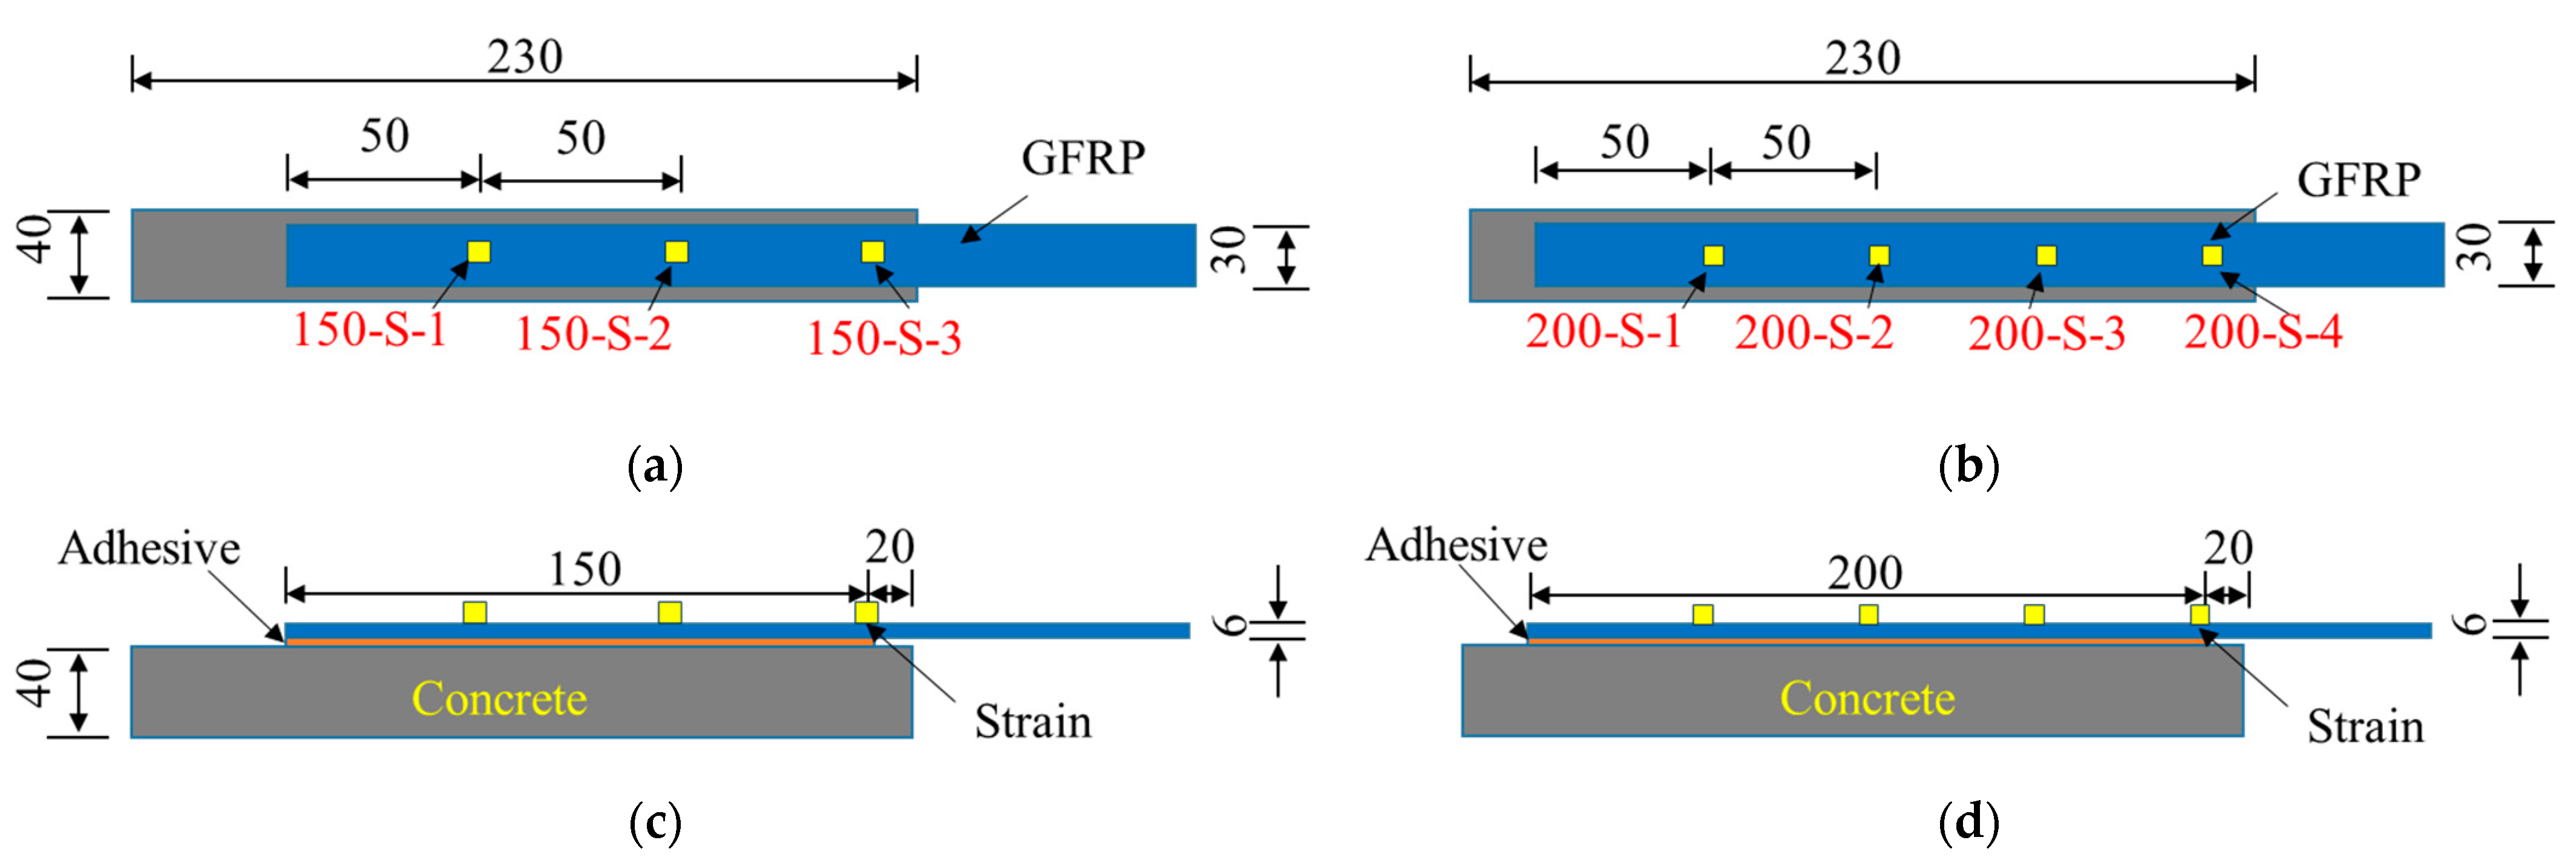
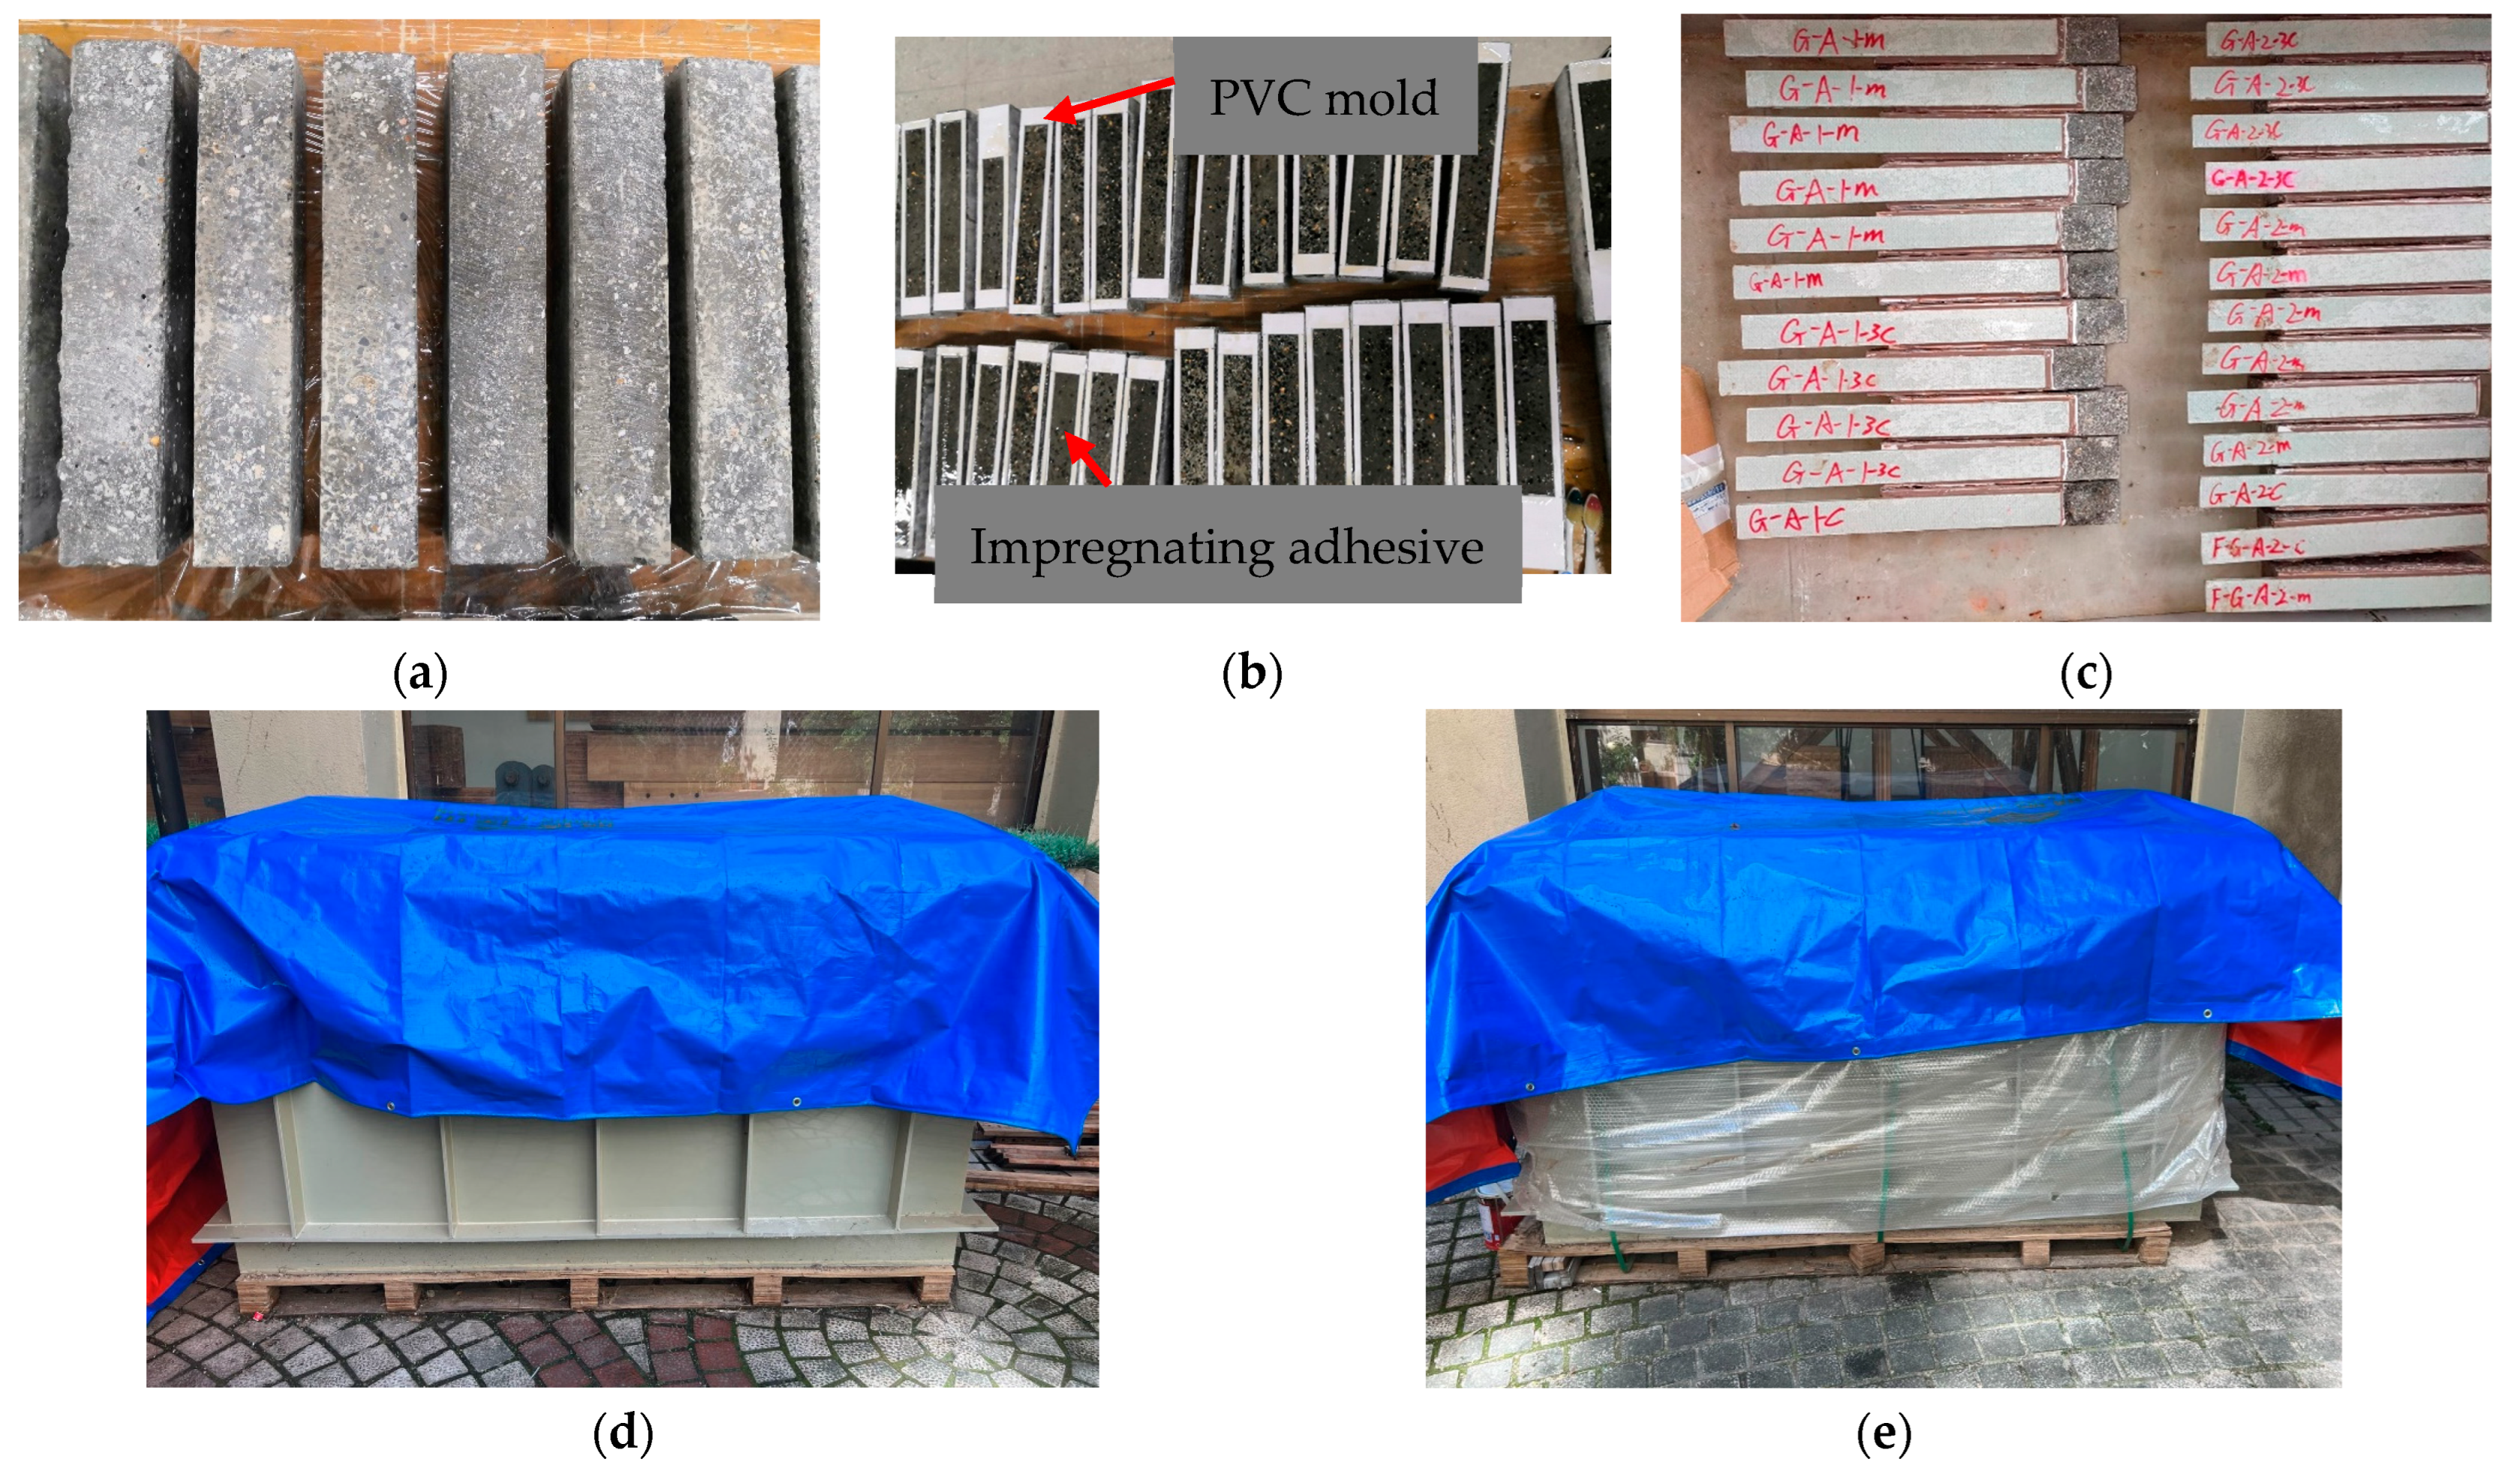
2.3. Specimen Production and Maintenance

A total of 20 specimens were produced, including two natural-cured specimens (i.e., reference specimens) and 18 seawater-cured specimens (listed in Table 5). The dimensions of these specimens are plotted in Figure 1. The specimens cured in air conditions were labeled as “150-A-30” and “200-A-30”, which corresponded with the specimens with adhesive lengths of 150 mm and 200 mm, respectively. As described previously, for the bonded specimen, “B150” and “B200” described the bonded specimens with adhesive lengths of 150 mm and 200 mm, respectively. “S-WD”, “T-WD”, and “T-IM” described the single-salinity dry–wet cycle curing, triple-salinity wet–dry cycle curing, and triple-salinity immersion curing conditions, respectively. We used “−30”, “−60”, and “−90” to indicate maintenance durations of 30, 60, and 90 days, respectively.
For each GFRP–concrete-bonding specimen, the widths and thicknesses of the adhesive layers were manufactured as 30 mm and 1 mm, respectively (as shown in Figure 1). The production process of the GFRP–concrete specimens was as follows: First, we polished the bonding surfaces of the concrete bricks and GFRP plates, and we used an ash-removal treatment after oblique fine stripes appeared on the polishing interfaces. Second, we evenly applied a thin layer of impregnating adhesive to the bonding surfaces of the dry concrete. The thickness of the bonding layers was 1 mm. To ensure that the thickness of the bonding layer was uniformly 1 mm, a PVC mold layer was prefabricated and affixed to each specimen (the thickness of the mold was 1 mm and the internal area was prefabricated to the corresponding size of the FRP bonding zone), as shown in Figure 2b. Third, we applied a bonding adhesive to the surfaces of the concrete bricks and GFRP plates to adhere them together. After uniform extrusion, the specimens were placed in a dry-room environment and left to stand for 7 days to ensure the complete solidification of the bonding connection. Fourth, we placed the specimens in the respective curing chambers for corrosion maintenance (the seawater curing chambers are shown in Figure 2d,e).
To ascertain the strain (or stress) on the surface of the specimens during the tests, strain gauges were arranged on the surfaces of the GFRP with a spacing of 50 mm between adjacent strain gauges. For the specimen with a 150 mm bond length, three strain gauges were arranged equidistant from the outer surface of the FRP within the bond range (i.e., 150-S-1, 150-S-2, and 150-S-3); for the specimen with a 200 mm bond length, four strain gauges (i.e., 200-S-1, 200-S-2, 200-S-3, and 200-S-4) were arranged. The locations of the strain gauges are shown in Figure 1. During the test, the sampling frequency of the strain gauges was 1 Hz.

3. Test Setup and Results
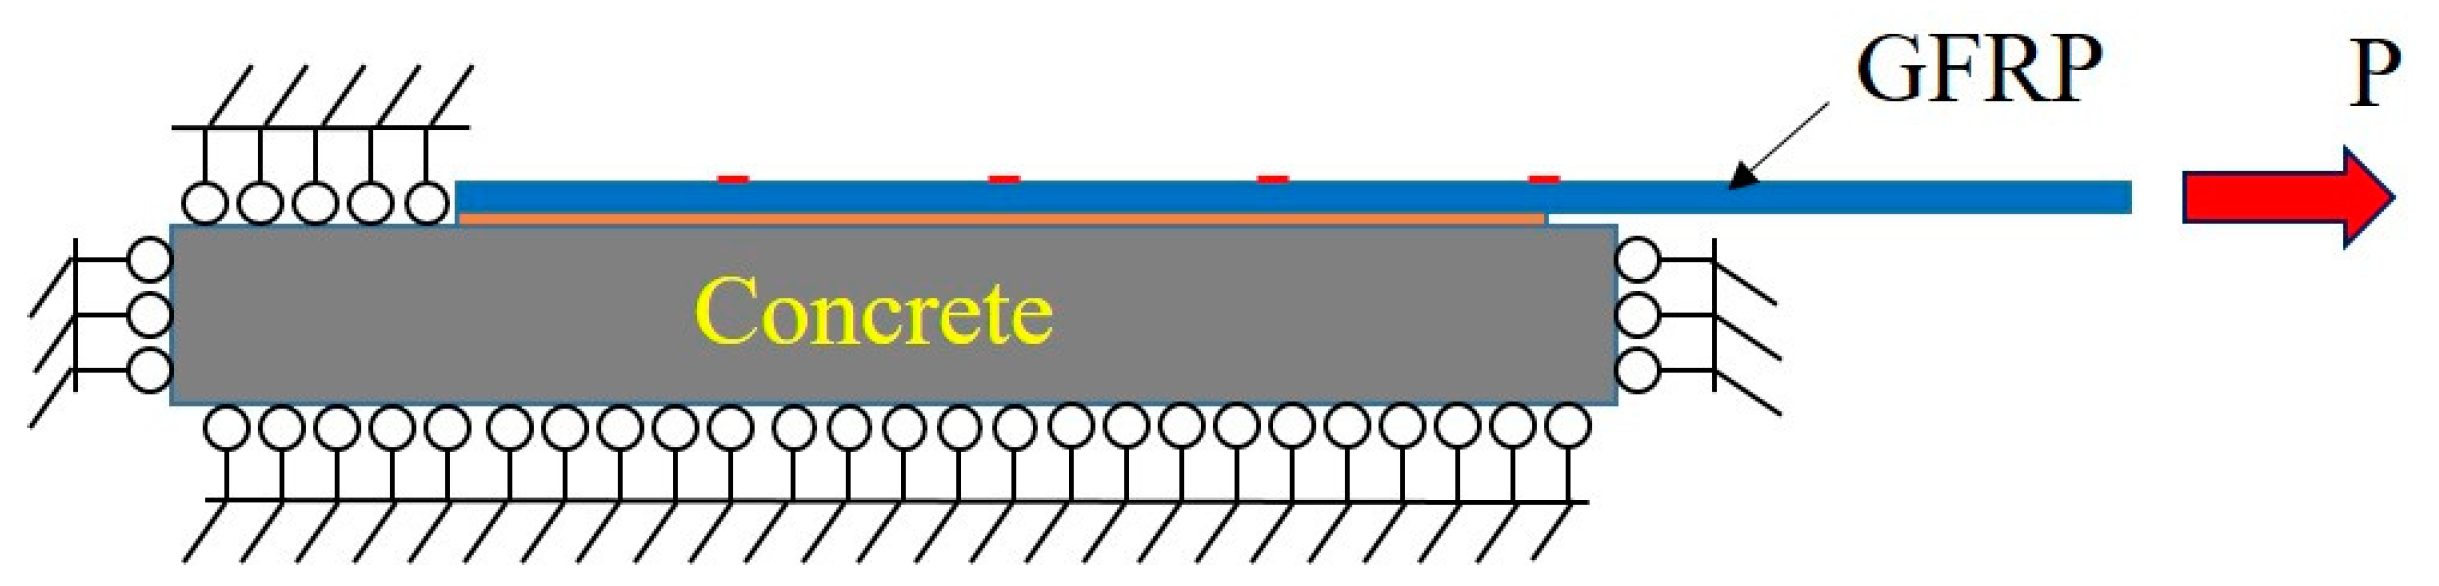
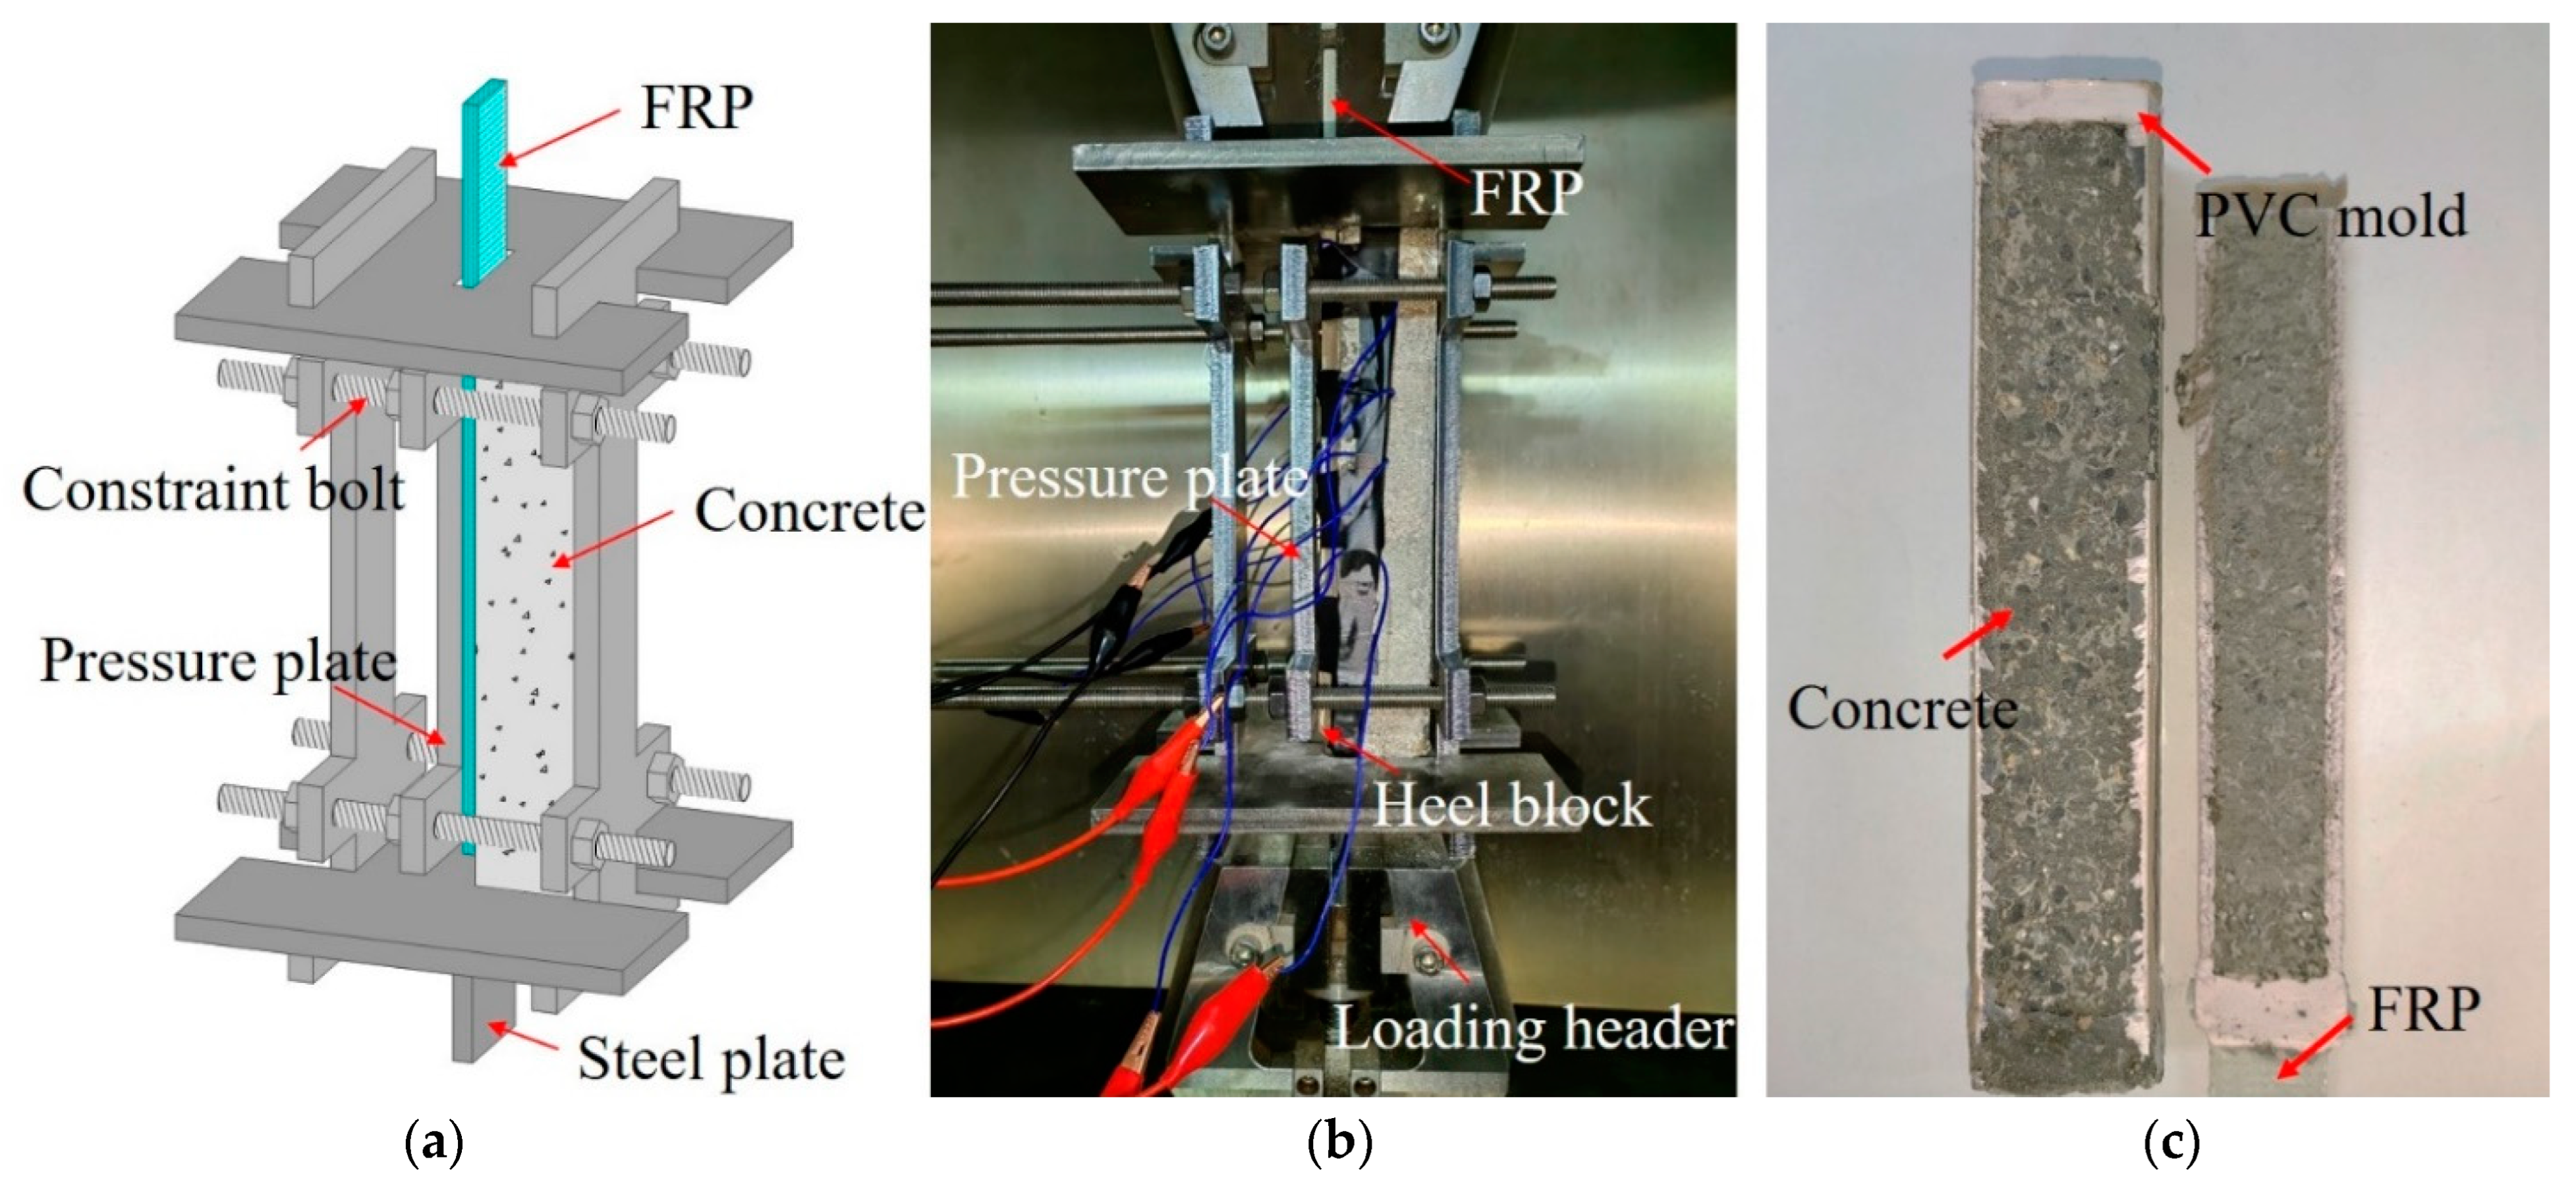
3.1. Test Setup

The single-shear performance of the GFRP–concrete-bonded specimens was investigated. A schematic diagram of specimen loading is shown in Figure 3. The testing machine used in this study was a QJBV212, with a maximum capacity of 100 kN. To ensure the stable fixation of the specimen on the testing machine base, a specific clamping device, as depicted in Figure 4a, was designed and fabricated. This clamping device comprised five steel plates, four screws, multiple bolts, and a pressure block. The vertical space was constrained by the upper and lower steel plates as well as two anchors, while the lateral space of the anchor plate was restricted by four bolts and nuts. The pressure block was affixed to prevent specimen deflection. When positioning the single-shear specimen, the GFRP at the free end could pass through the square hole in the upper steel plate. Each specimen underwent displacement-controlled quasi-static shear loading at a rate of 2 mm/min. Throughout the loading process, the TDS630 data acquisition system captured strain information from the specimens at a sampling frequency of 1 Hz. An image of the failure specimen is presented in Figure 4c.

3.2. Failure Modes

The degradation of GFRP–concrete-bonded structures in a seawater environment involves several key mechanisms. (1) Chloride-ion penetration into GFRP materials causes performance reduction, debonding, softening, and overall material degradation [27]. (2) Salt deposits from seawater on GFRP surfaces lead to scaling, which affects the friction properties and surface roughness, thereby diminishing the performance and service life [28]. (3) Chloride-ion-induced corrosion adversely impacts the compressive and tensile strength of concrete [29]. (4) The presence of sulfate in seawater contributes to concrete erosion, weakening its strength and durability [30]. (5) Chloride ions infiltrating binder materials cause deterioration, leading to embrittlement as well as reduced bond strength and durability [31]. (6) Epoxy resin binders can undergo hydrolysis due to prolonged seawater immersion, impairing their bonding properties [32].
In this study, all components of the GFRP–concrete specimens were subjected to these corrosion factors, so the mechanical performance and damage characteristics were the result of the combined effect of multiple factors. Through the loading test, debonding and a peeling failure mode were observed for the specimens (as shown in Figure 4c), and this form of damage centrally occurred at the interface between the adhesive layer and the concrete. This phenomenon was attributed to the insufficient strength of the bond interface on the concrete surface, which led to separation between the adhesive layer and the concrete, thus triggering the interface peeling damage. At the early stage of loading, the specimen underwent continuous quasi-static stretching. When the load was increased to a certain strength, the upper end of the bond zone (the free end of the GFRP) first underwent peeling cracking. Under the continuous action of shear loading, the peeling area rapidly extended to the entire bonded surface, leading to separation of the entire bonded specimen. Based on this observation and in order to further improve the bonding performance, it is recommended that a more suitable binder is selected in practical engineering that is based on the specific type of concrete and the expected usage environment. At the same time, deeper treatment of the concrete surface is recommended to further increase its roughness, thereby improving the bonding effect between the binder and the concrete matrix.

3.3. Strains of the Bonded Specimens
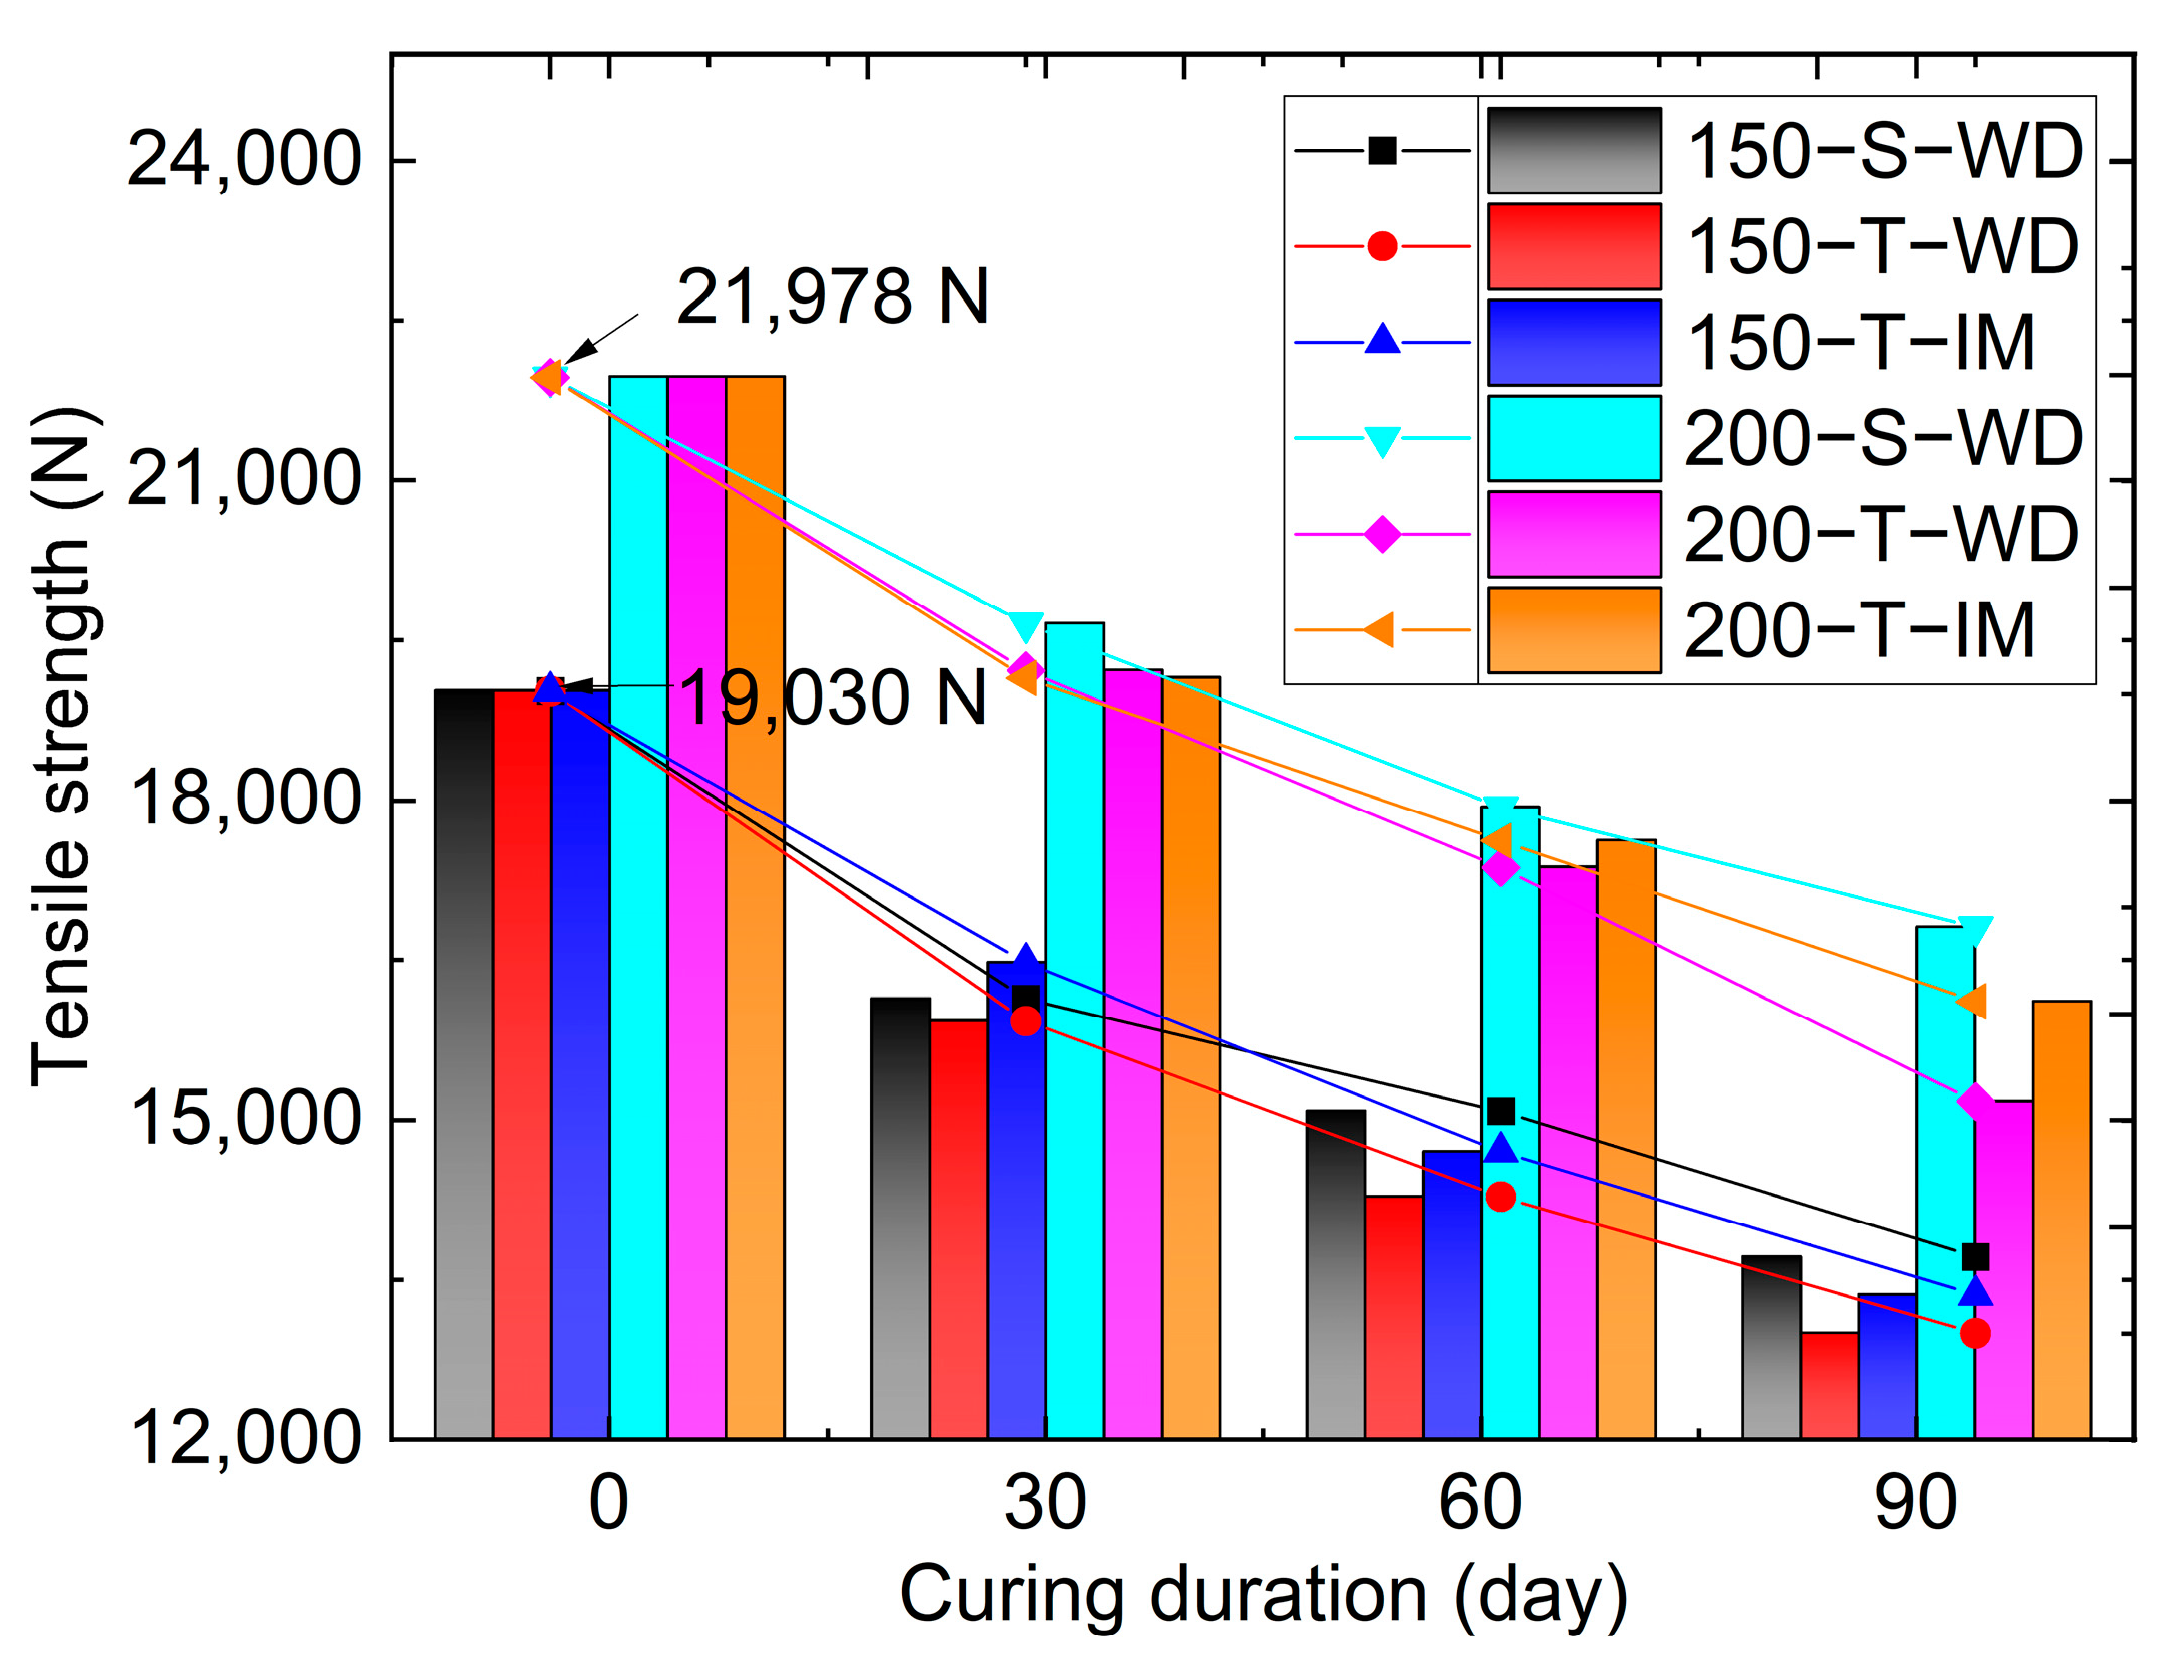
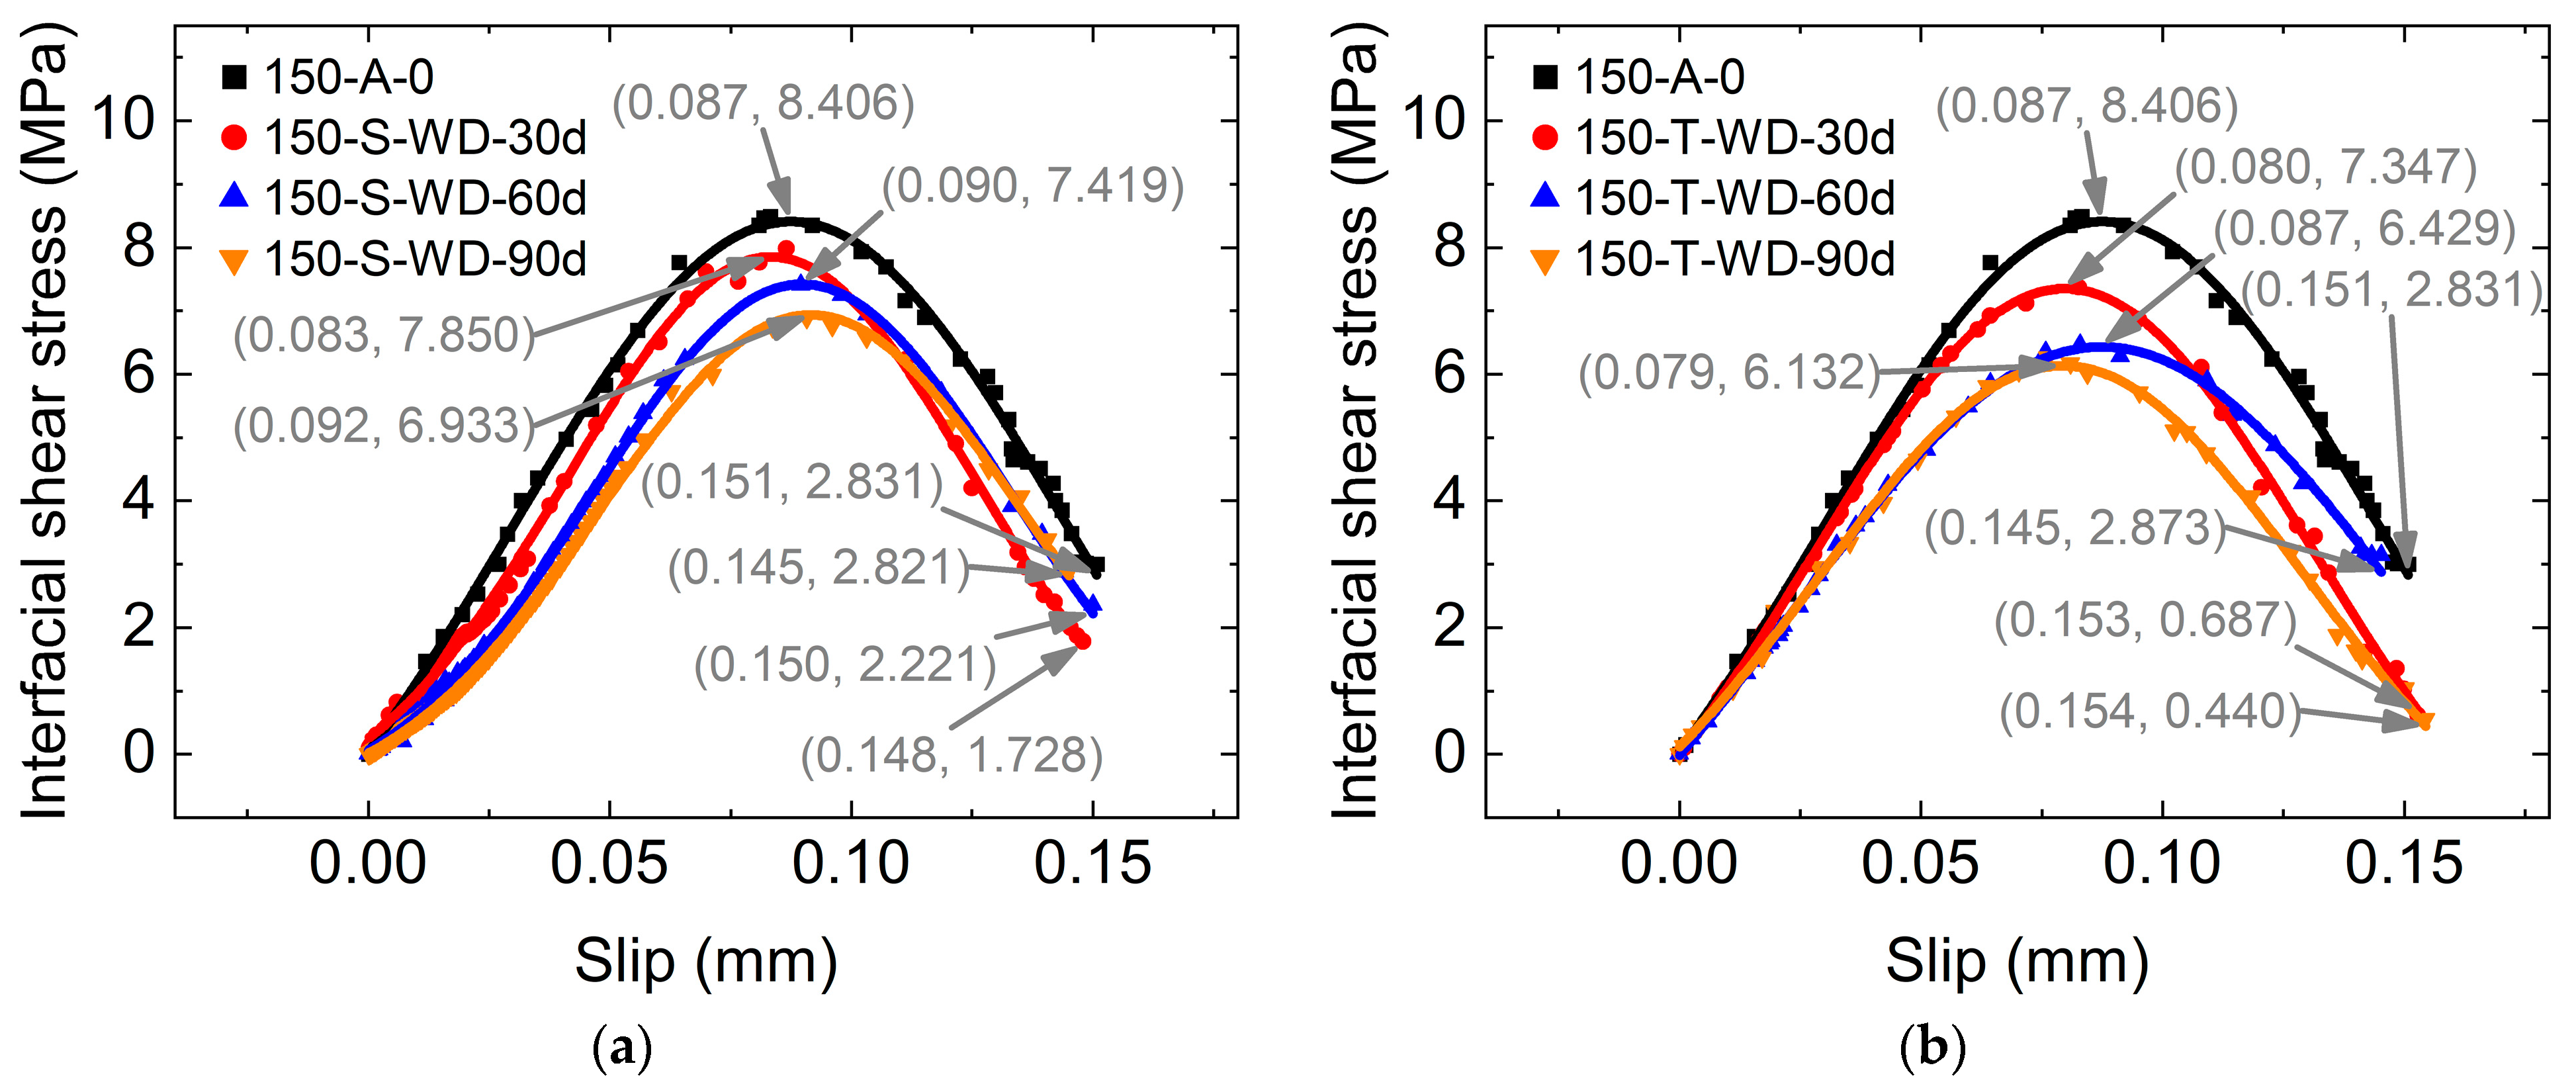
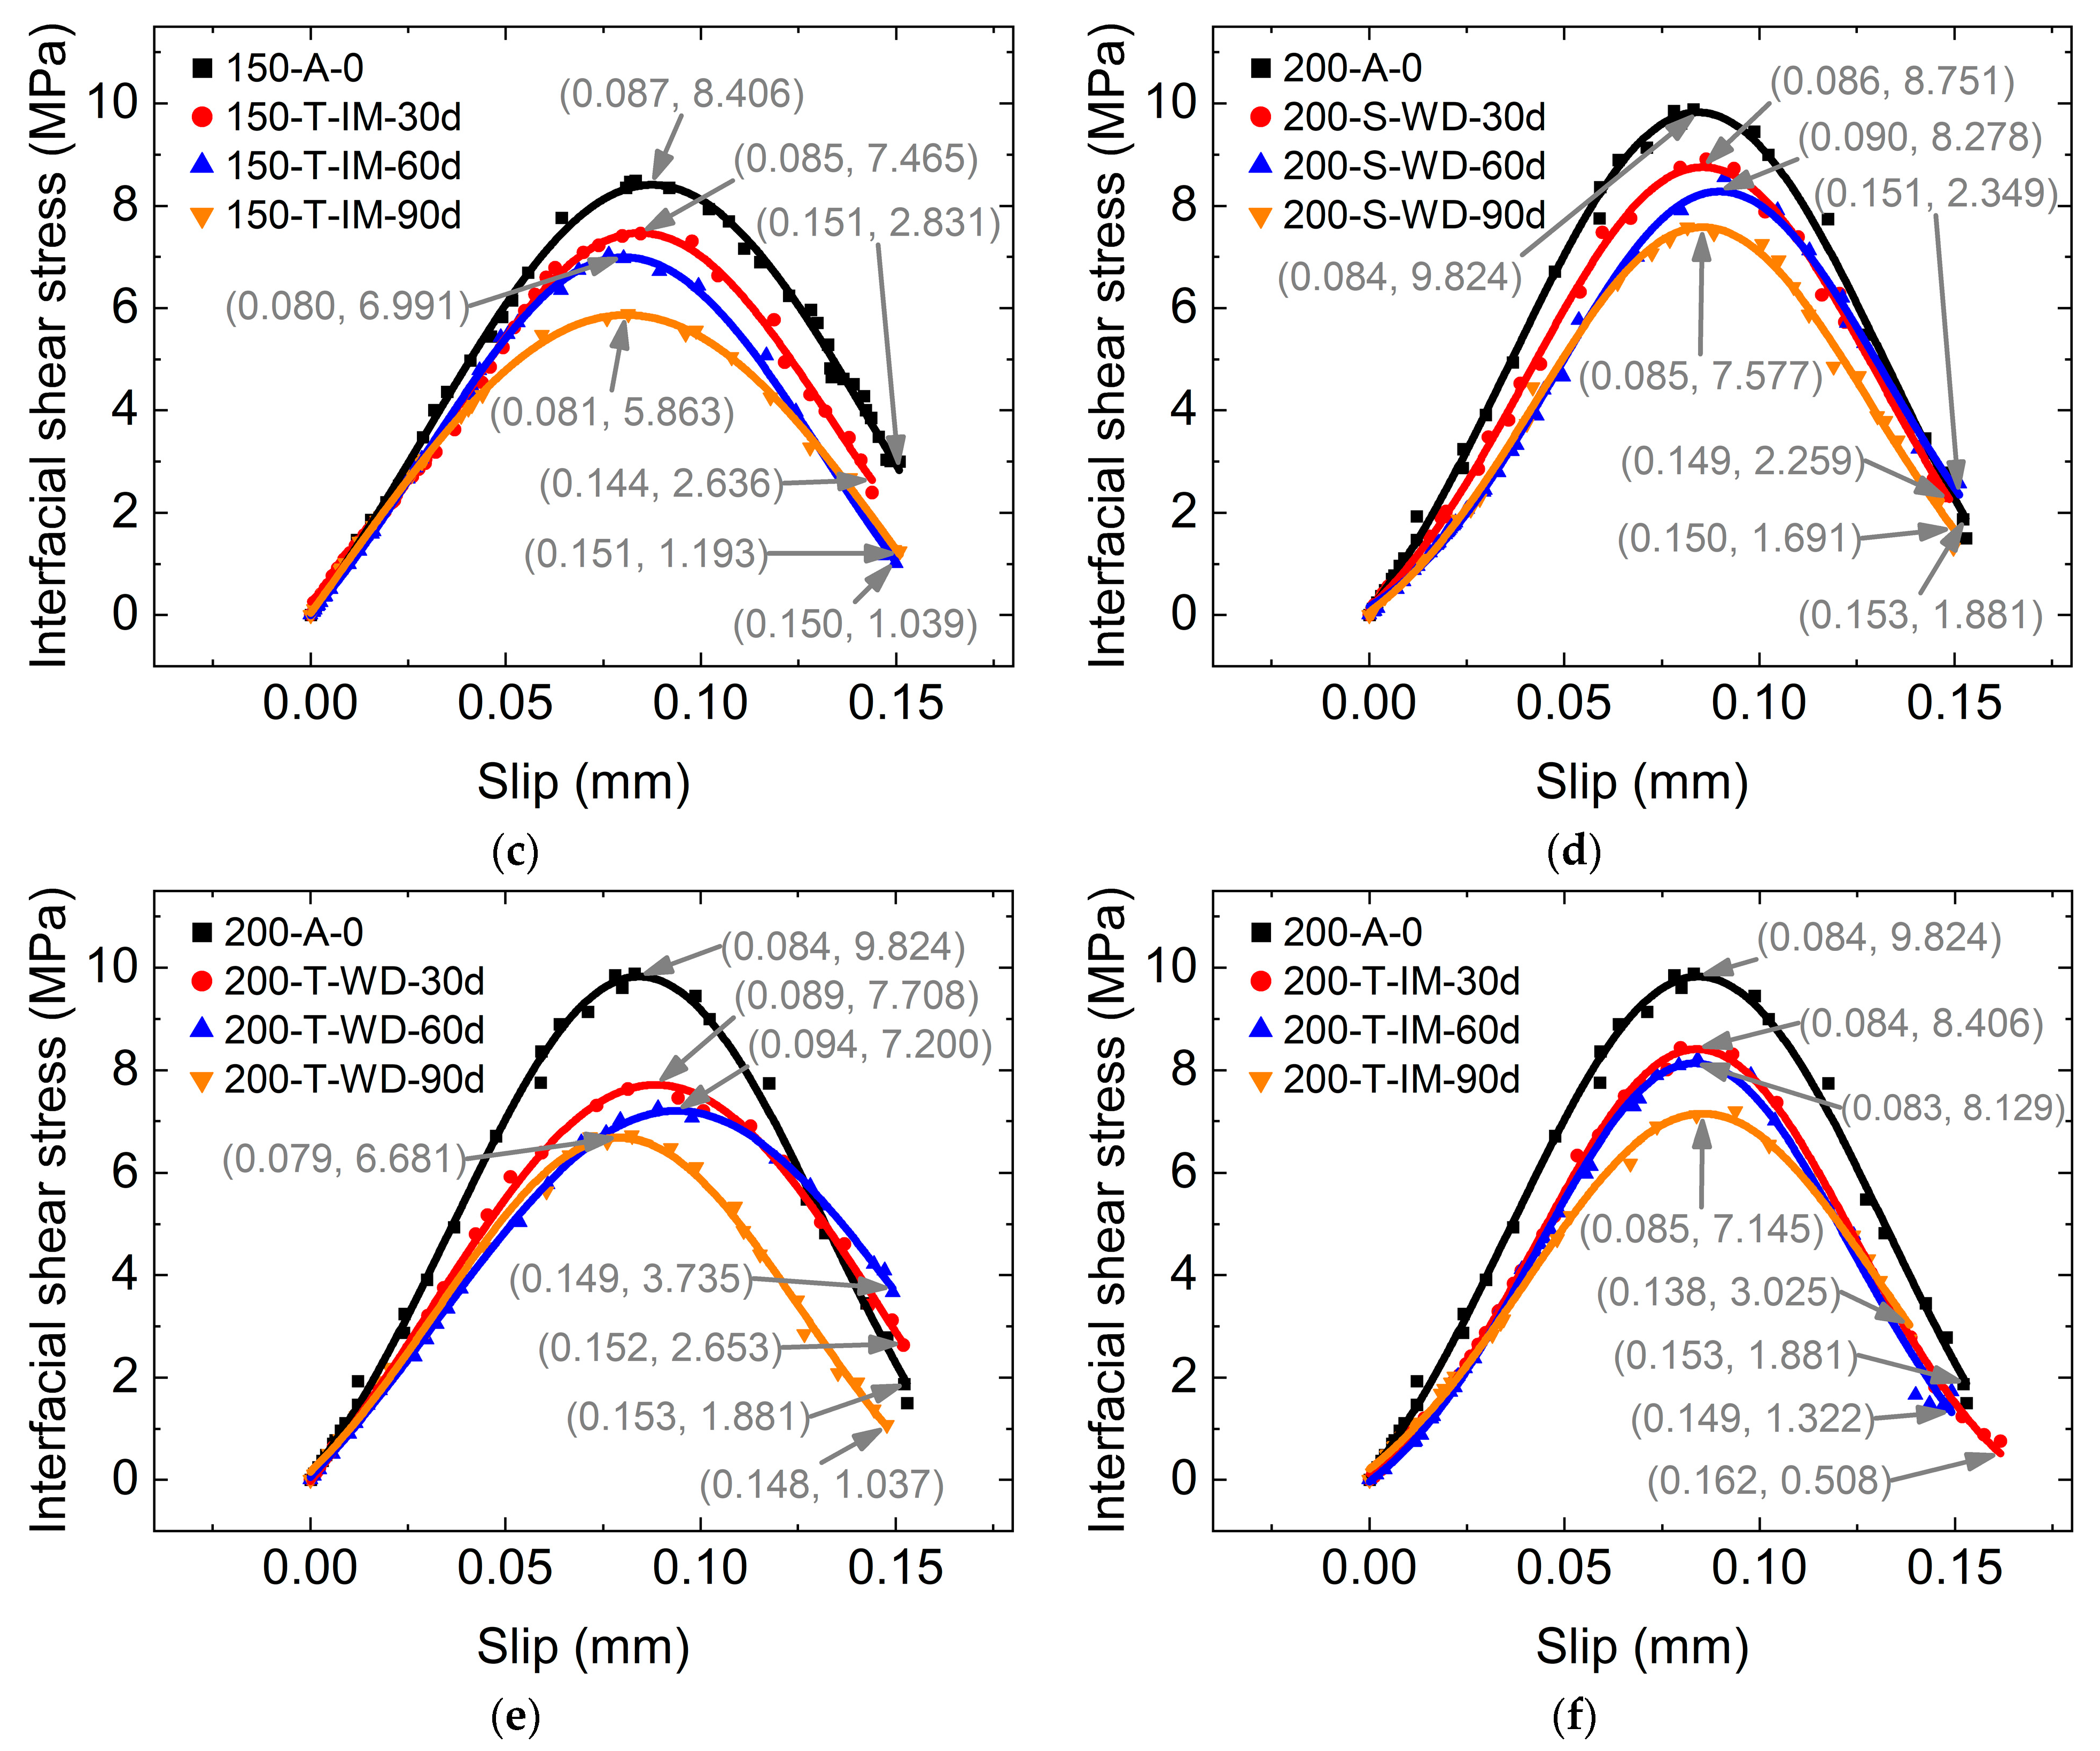
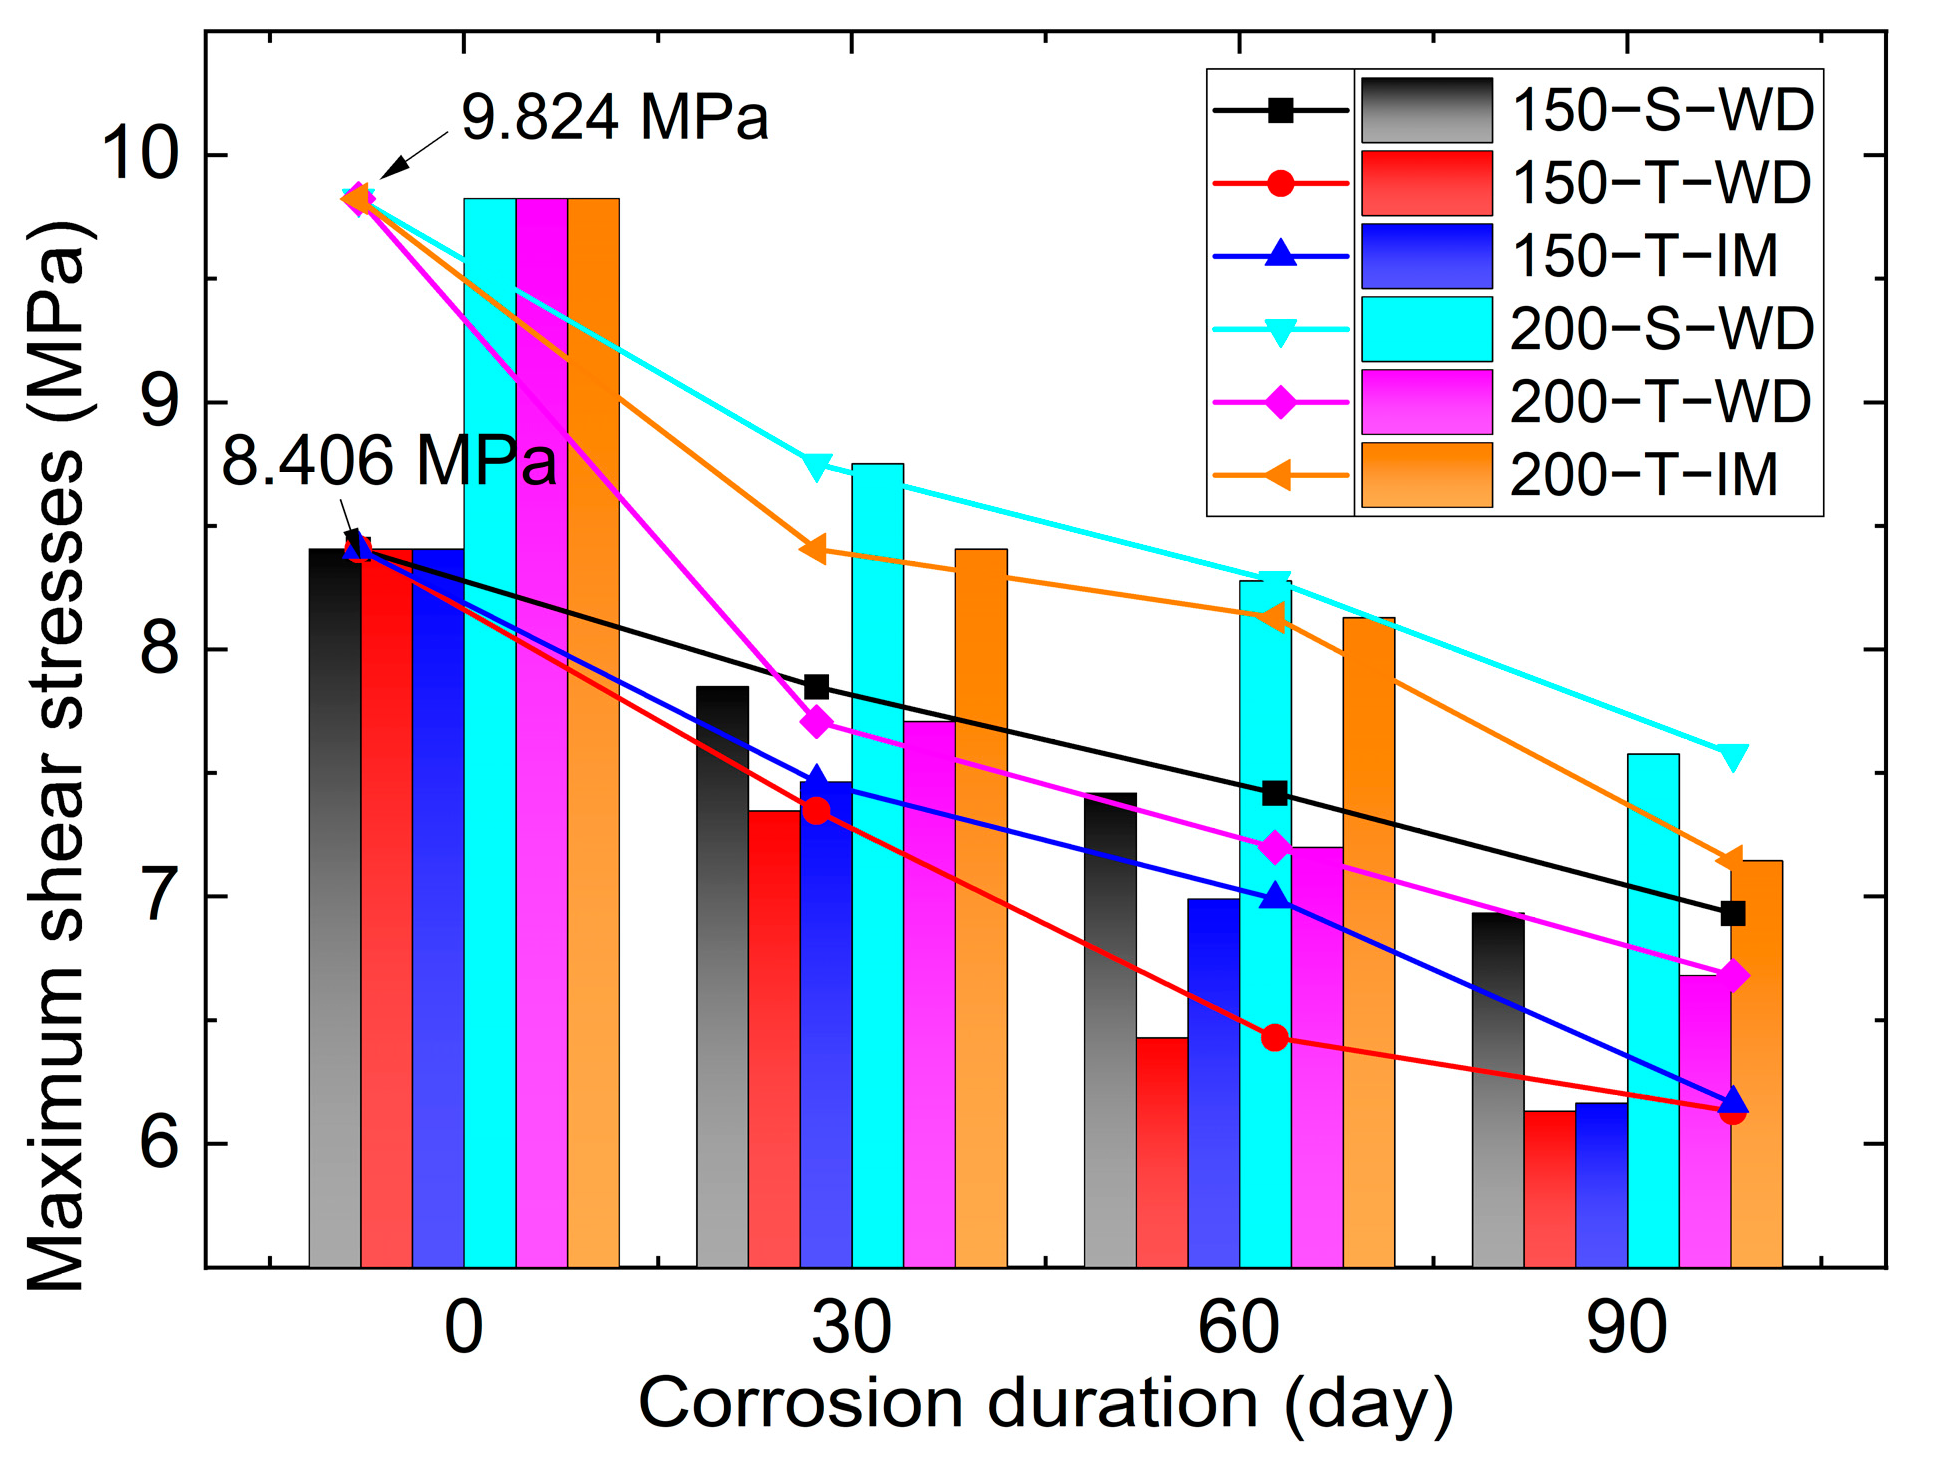
An analysis of the strain patterns in the specimens offered a comprehensive characterization of their failure processes. This was exemplified by the specimen labeled 200-T-WD-60, as illustrated in Figure 5. On the surface of this GFRP specimen, four strain gauges—200-S-1, 200-S-2, 200-S-3, and 200-S-4—were employed to monitor deformation. With an increase in load, a linear escalation in strain was observed at these points, notably with 200-S-4, which consistently registered significantly higher strain values compared with the other gauges. This trend suggested a localized concentration of stress in this area. Upon the application of an external load approximating 15,000 N (14,711 N), a pronounced and abrupt increase in strain was recorded at all four measuring points, culminating in the eventual failure of the specimen. This rapid escalation of strain underscored the critical threshold at which the structural integrity of the specimen was compromised. Throughout the loading process, the variations in the strain values across these four positions were substantial. Disproportionately high stress was recorded with 200-S-4 in comparison to the other gauges, indicating a preliminary onset of damage within the bond zone at this specific location. During the initial phase of the loading process, the strain readings for 200-S-1 and 200-S-2 were markedly low. A similar phenomenon was reported in another article [33]. This observation suggested that the bonding layer situated between these two points played a minimal role in the force transfer at the outset. It implied that the effectiveness of the load distribution within the bonded structure was not uniform, leading to differential stress concentrations that were pivotal in understanding the mechanics of failure in such composite materials.

3.4. Shear Strength

The shear strengths of the GFRP–concrete-bonding specimens after seawater curing are presented in Table 2 and Figure 6. Specimens 150-A-0 and 200-A-0 exhibited shear strengths of 19,030 N and 21,978 N, respectively, indicating superior strength in the 200 mm adhesive length specimen compared with the 150 mm one. A notable decline in strength was observed in specimens subjected to seawater corrosion. For instance, specimen 150-S-DW, initially recorded at 19,030 N (room temperature reference specimen 150-A), exhibited reduced strengths of 16,144 N, 15,089 N, and 13,719 N after 30, 60, and 90 days of single-salinity wet–dry cycles, respectively. This trend, suggesting that prolonged seawater exposure intensifies damage to GFRP–concrete-bonded structures, aligned with findings from previous studies [15,16]. A comparison between the “150-S-DW” and “150-T-DW” series revealed lower strengths in specimens exposed to triple-salinity wet–dry cycles than those in single-salinity for identical durations, underscoring the exacerbating effect of a higher salinity on interfacial zone degradation. A similar pattern was observed in the “200-S-DW” and “200-T-DW” series. The observed debonding damage pattern suggested that a wet–dry cycle in seawater contributed to the degradation of the bonding interface between the adhesive and concrete.

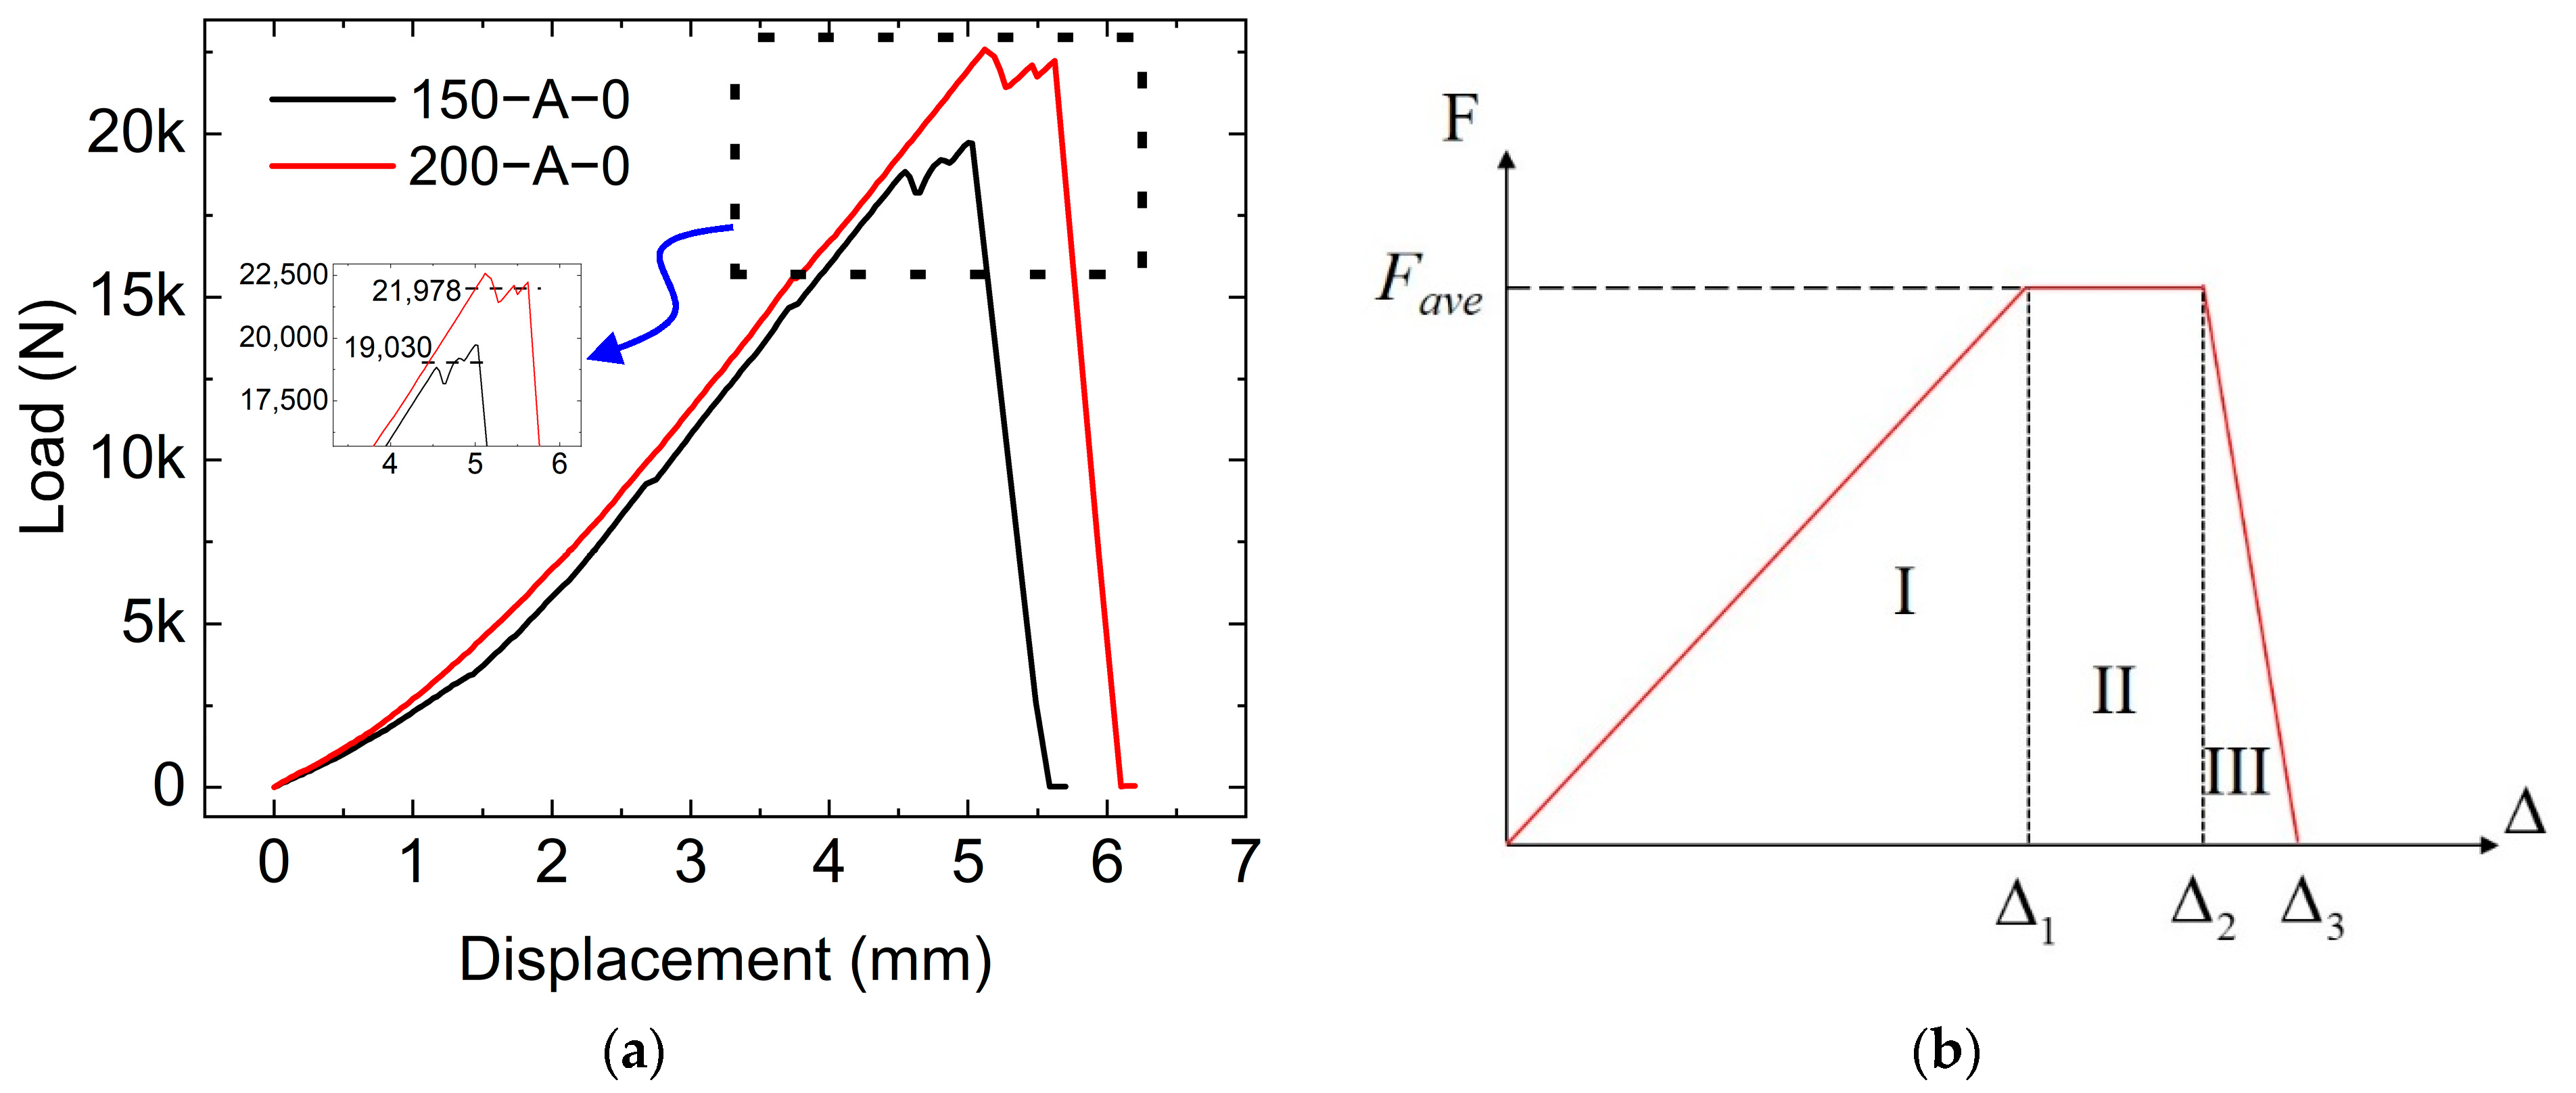
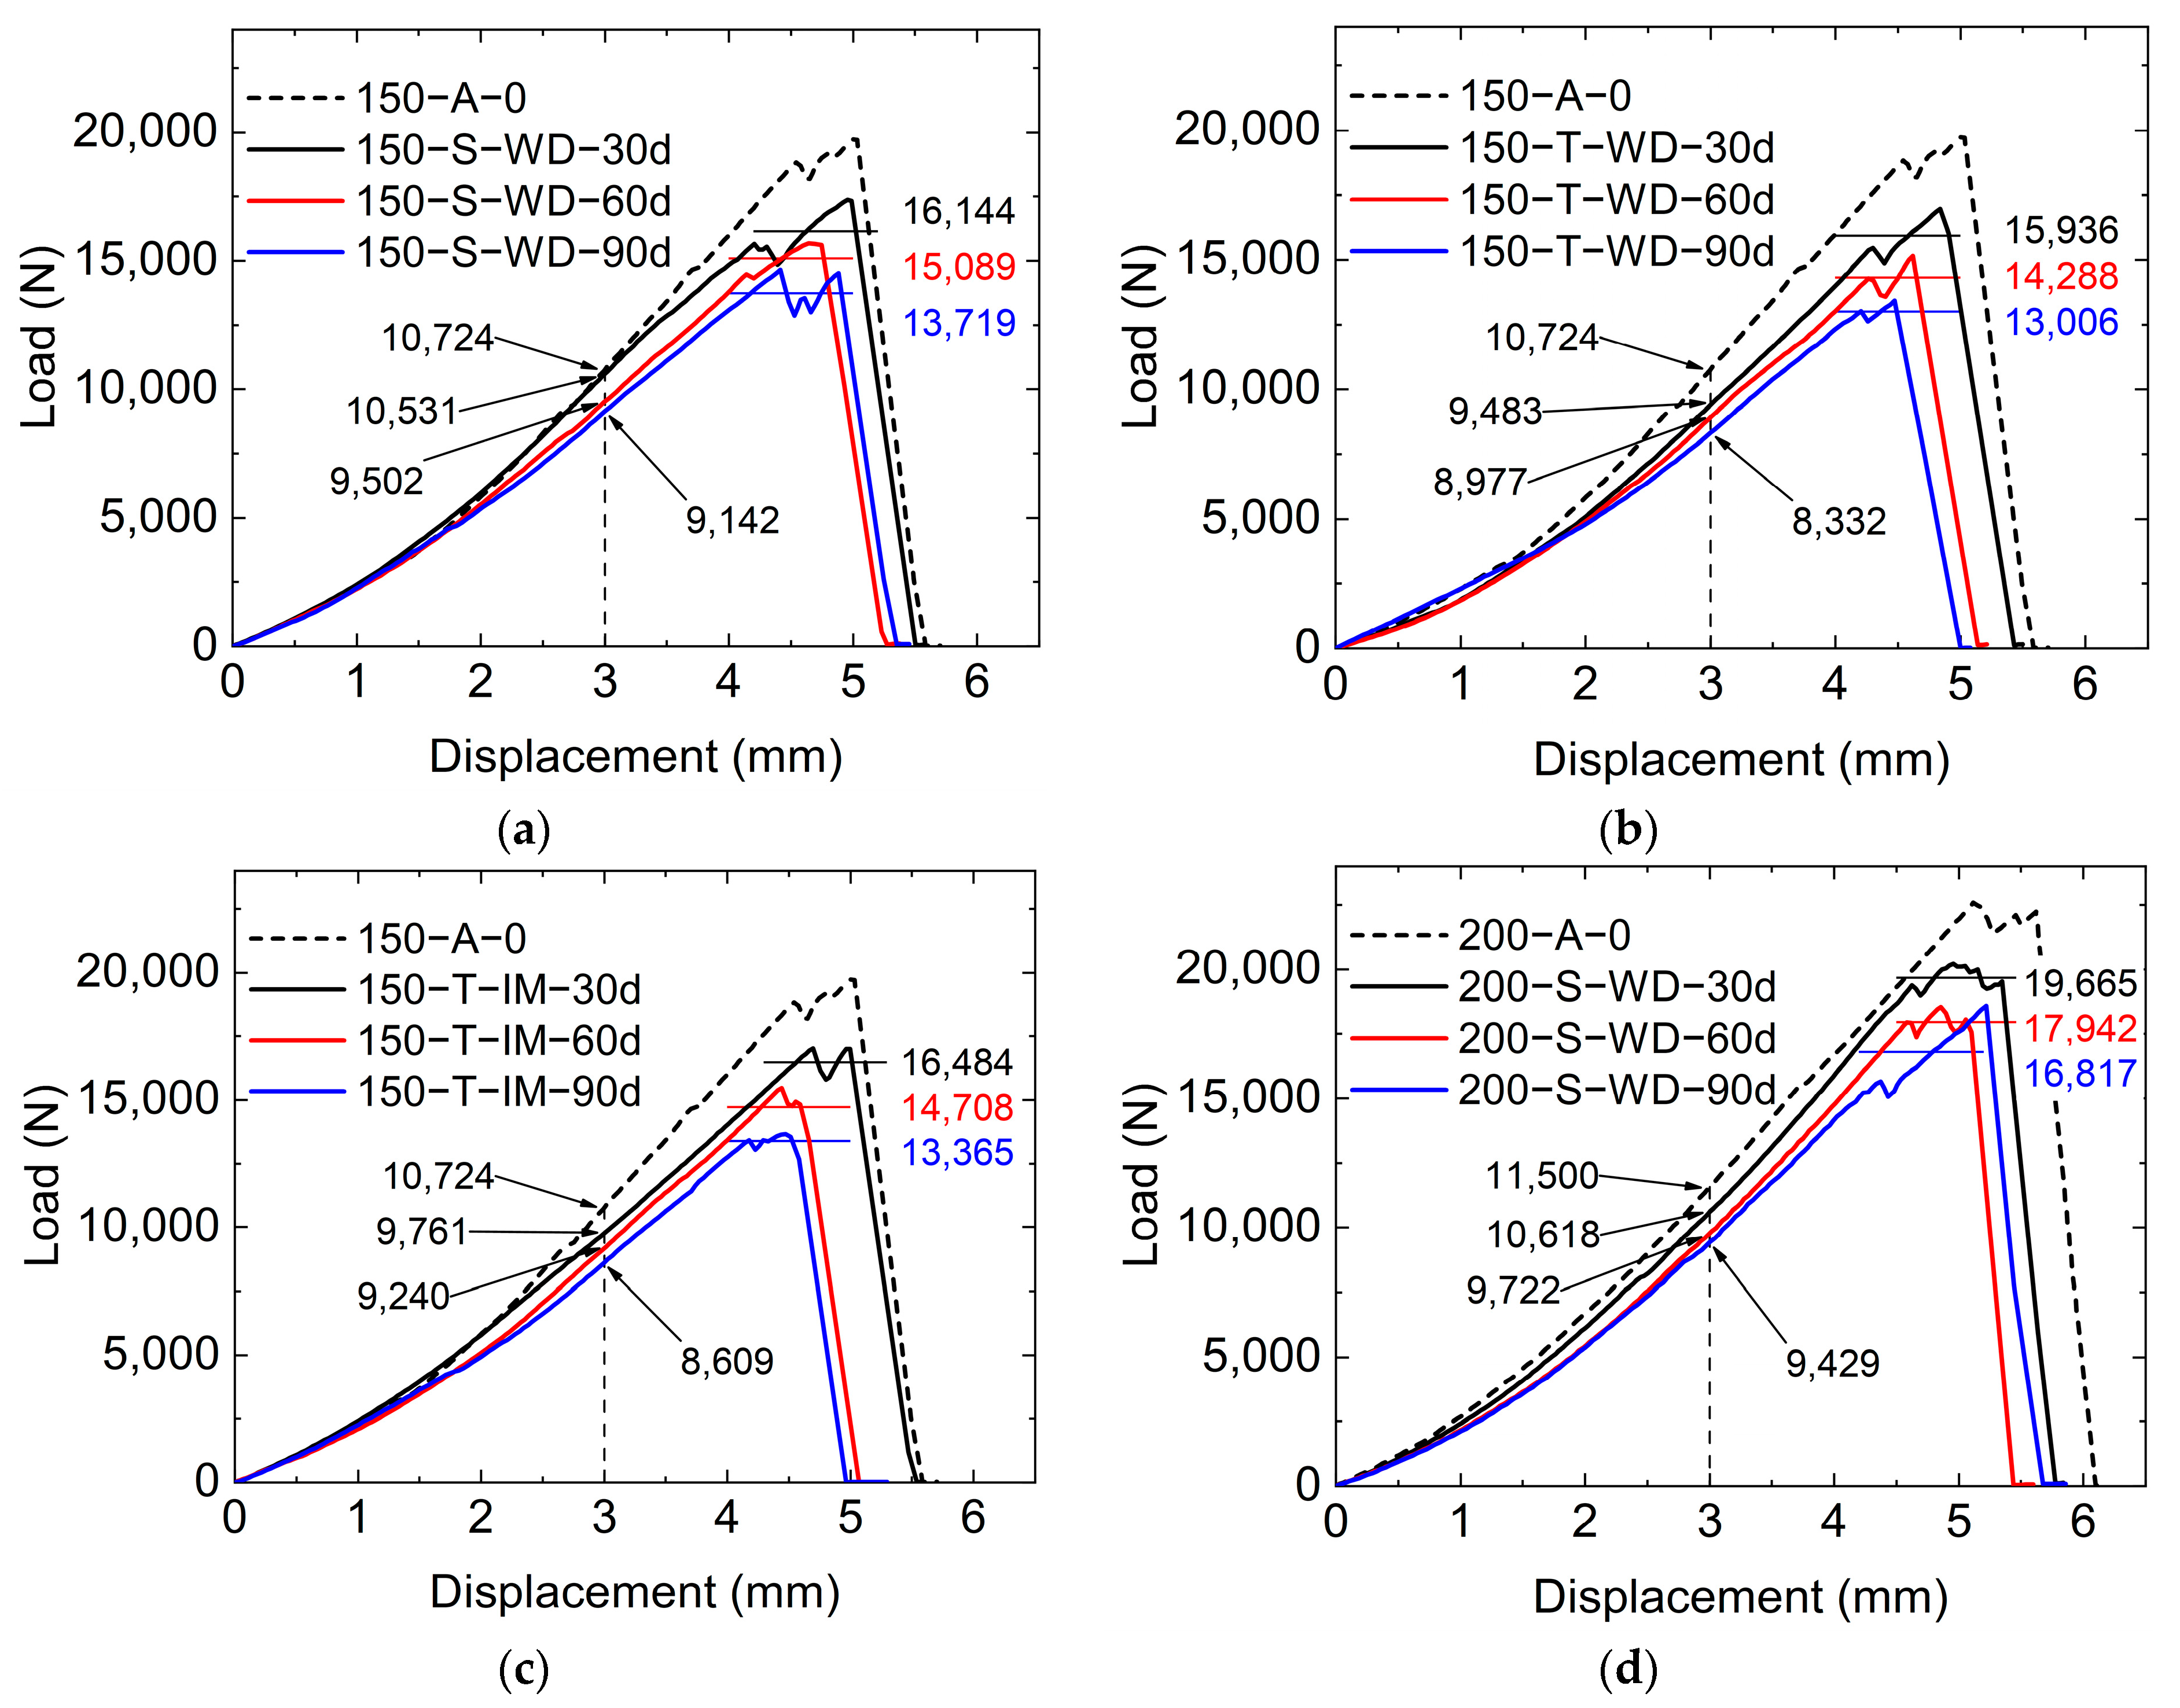
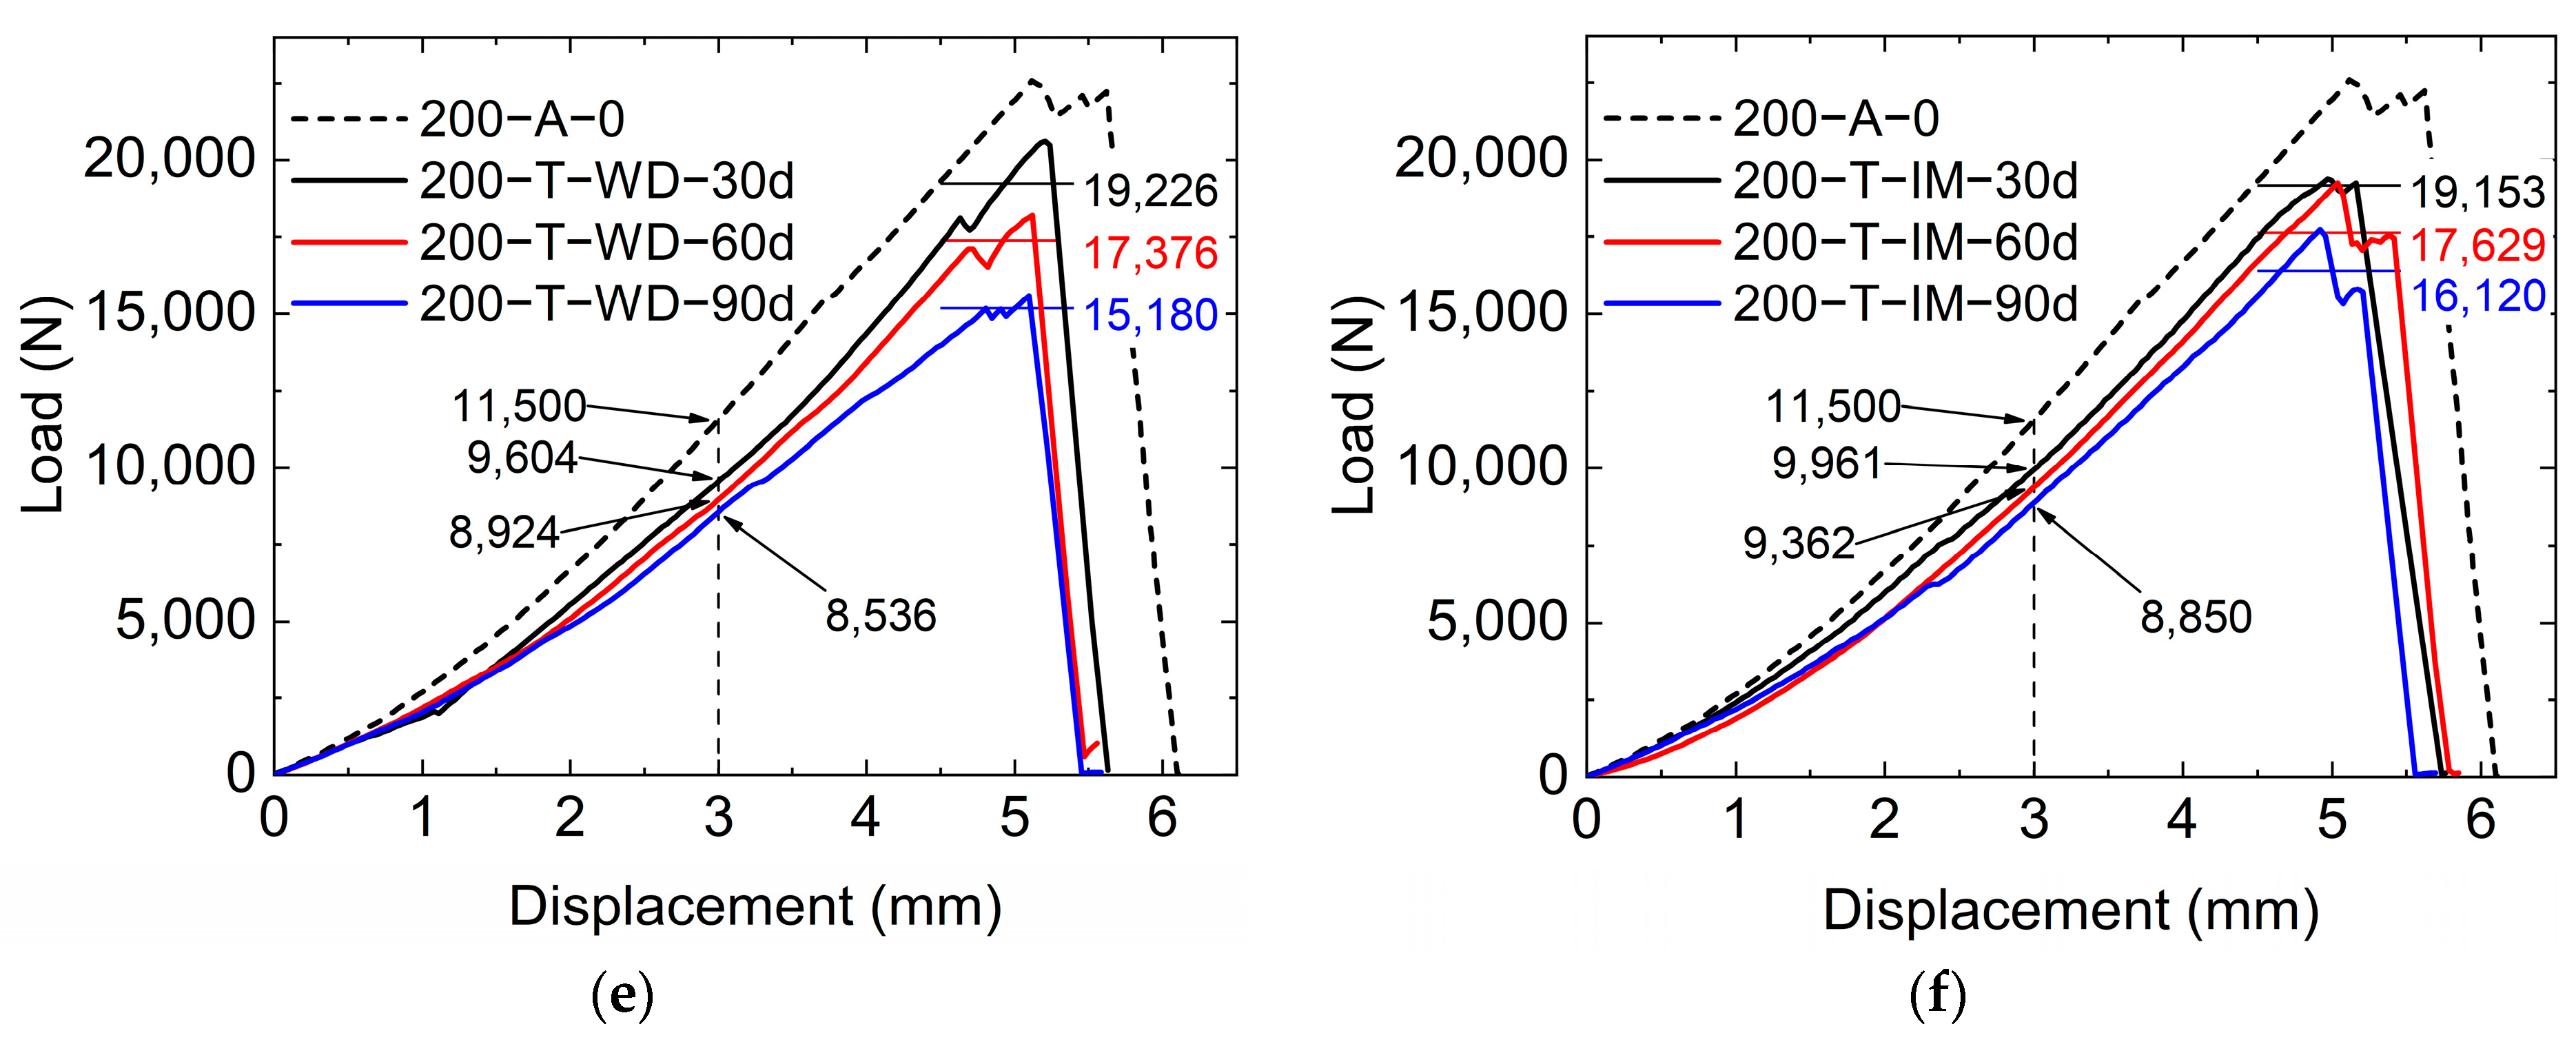
3.5. Load–Displacement Curves

Figure 7 provides a detailed representation of the load–displacement curves for the reference specimens, offering key insights into their mechanical behavior. Initially, a slight variation in the curve’s slope was observed during the early stage of loading. This initial variation was attributed to the presence of a small gap at the end of the specimen, a deliberate design consideration to account for the initial load application. As the shear load application continued, the curve exhibited a trend towards stabilization, indicative of the specimen maintaining a linear elastic behavior over an extended strain range. This phase reflected the robust elastic properties of the material under gradually increasing stress.
As the displacement continued to increase, a critical juncture was reached when the peak stress within the bonded zone surpassed the specimen’s inherent bond strength. During this period, the bonded specimen entered a “slip stage”. This resulted in the initiation of peeling at the bonding interface. The early stages of peeling were marked by variability in the initial peel area, which, in turn, led to fluctuations in the load applied to the specimen. This fluctuation was contained within a certain range, reflecting the variable response of the material under stress.
For the purposes of a quantitative analysis and a comparative assessment, the average load value, denoted as Fave, at this stage was calculated (see Table 5). This average value served as a representative measure of the specimen’s average peeling load. Experimental results showed that the peeling loads for the specimens with bonding lengths of 150 mm and 200 mm were found to be 19,030 N and 21,978 N, respectively. These values were critical in understanding the bond strength and durability of the specimens.
The final phase in the specimen’s response was characterized by a rapid peeling of the bonding interface, a process that accelerated as the remaining bonded area diminished. This rapid peeling phase was a crucial indicator of the overall integrity and durability of the specimen, culminating in comprehensive structural damage. The load–displacement behavior, therefore, provided essential insights into the mechanical performance and failure mechanisms of the specimens under varying conditions of stress and strain.
The load–displacement curves in Figure 7 could be divided into the following three stages (as shown in Figure 7b): (1) the initial linear elastic stage, where the specimen remained within the linear elastic range and the internal bond layer remained intact; (2) the ultimate load capacity stage (approximated by a horizontal line), where the load value represented the average during the fluctuation period as shear displacement and peeling persisted; and (3) the final brittle damage stage, where bond interface peeling accelerated, causing a rapid load decrease until the specimen was completely destroyed.
Figure 8 presents the load–displacement curves for the GFRP–concrete specimens following their exposure to seawater corrosion. During the loading phase of the testing process, a comparison of the load capacities under identical tensile displacements revealed a critical trend. Specifically, the load-bearing capacity of the specimens after seawater exposure was consistently lower than that of the unexposed specimens. This phenomenon was exemplified when analyzing the data for specimens 150-A and 150-S-WD. When subjected to a tensile displacement of 3.00 mm, the recorded loads for these specimens were 10,724 N, 10,531 N, 9502 N, and 9142 N, respectively. Such a trend indicated a degradation in the interface bonding stiffness as a result of seawater corrosion. This observation was pivotal in understanding the impact of corrosive marine environments on the structural integrity of the GFRP–concrete composites. The diminished load capacity under equivalent displacement conditions after exposure to seawater highlighted the weakened bonding stiffness and, by extension, the overall durability of the specimens.

4. Damage Mechanism and Durability Analysis

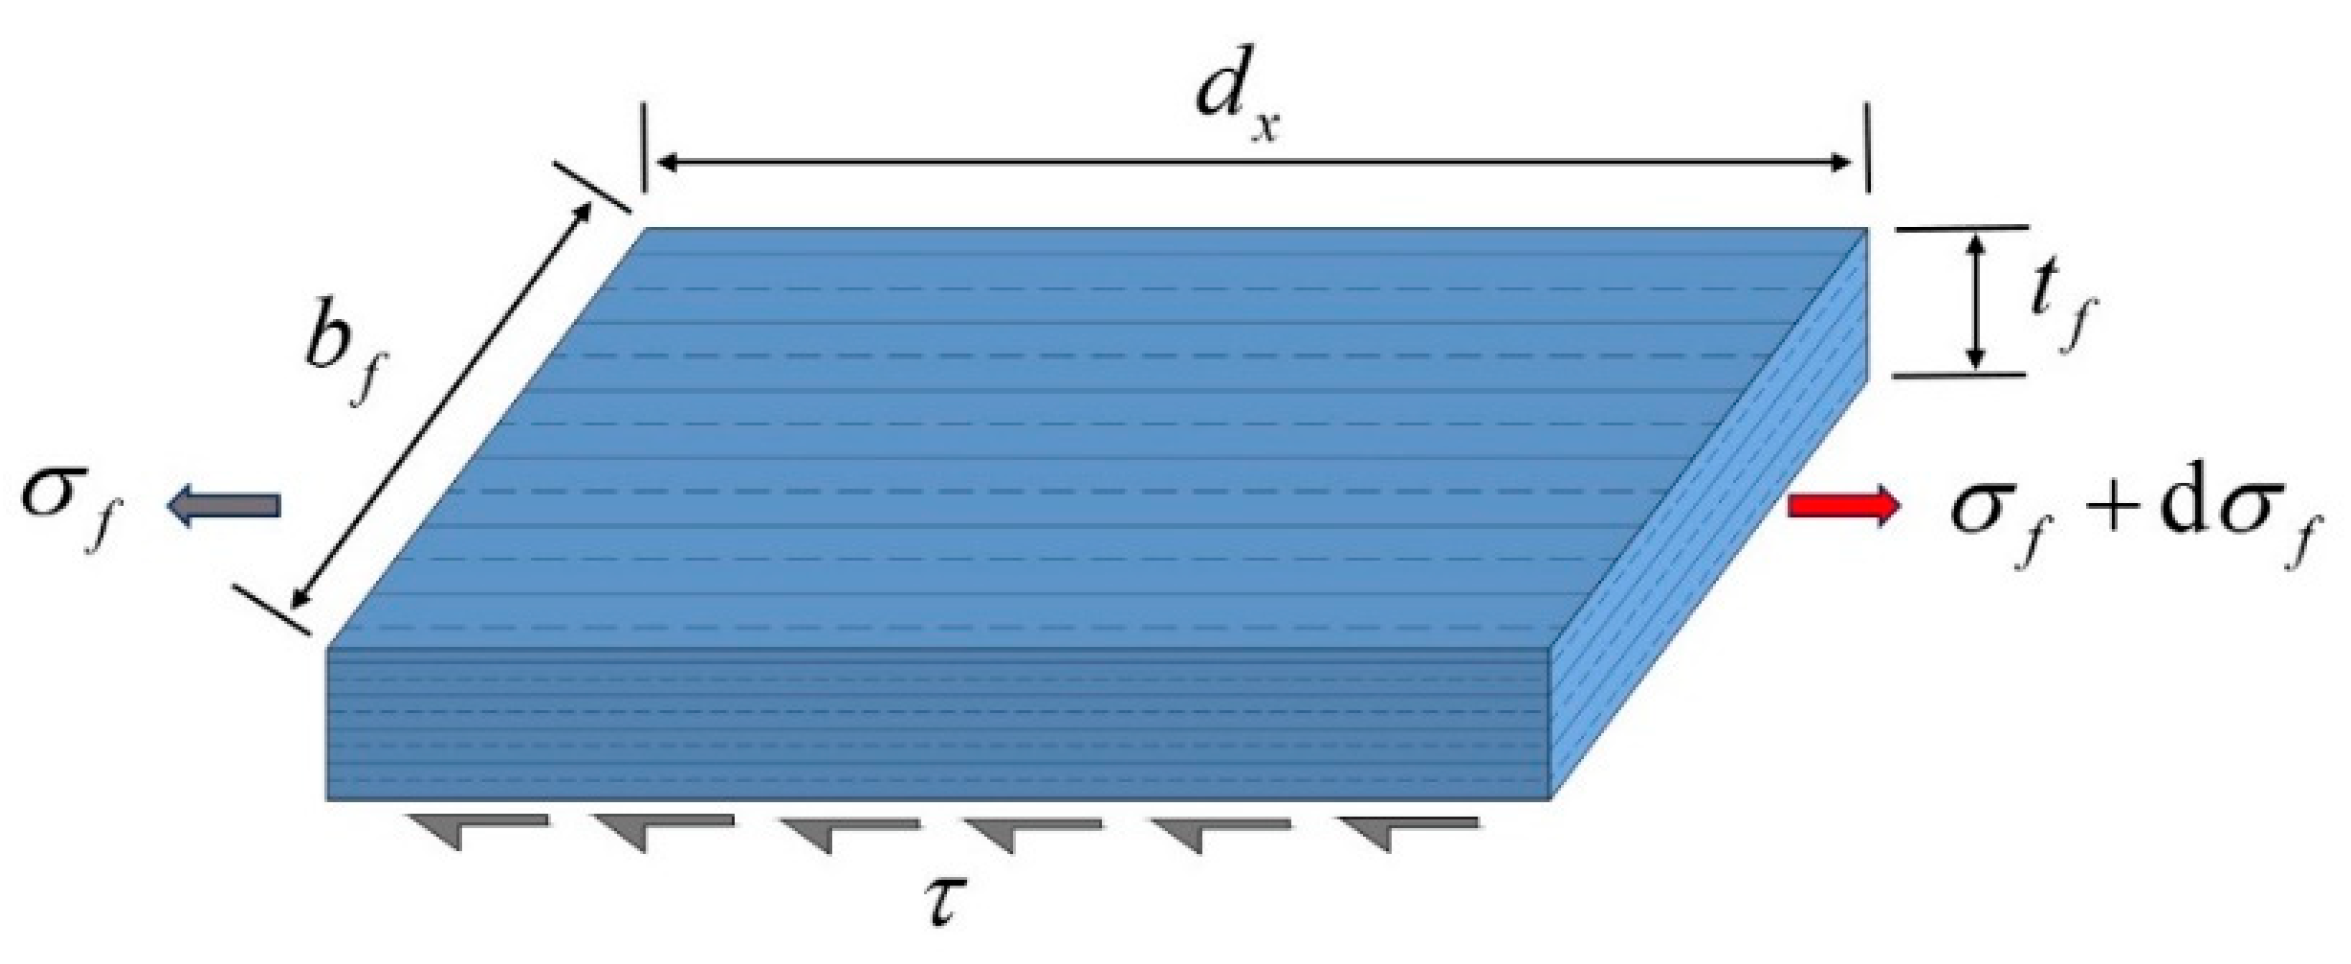
4.1. Bond–Slip Mechanism of Specimens

For the GFRP–concrete-bonding structures employed in the experiment, when the specimen was subjected to shear, the GFRP micro-blocks in the bond region experienced three types of forces (including two tensile stresses, σf and σf + dσf, and shear stress τ, transferred by the bonding layer), as depicted in Figure 9. According to the equilibrium equations of mechanics, the following equations could be obtained [34,35]:
σ f b f t f + τ b f d x = ( σ f + d σ f ) b f t f
τ = t f d σ f d x = E f t f d ε f d x
where σf is the tensile stress on the left side of the GFRP micro-block, τ is the shear stress of the micro-block, bf and tf are the width and thickness of the micro-block, Ef is the elastic modulus of the micro-block, and εf is the tensile strain of the micro-block.
The average shear stress between two adjacent strain gauges could be approximated as the shear stress at that point, i.e., the average bond shear stress between two adjacent strain gauges could be obtained by the following equation:
τ i = E f t f ε i ε i 1 Δ x
where Δx is the distance between two measuring points. Based on this mechanism, the slip at i-th point, si, is the difference between the slip of the GFRP at that point and the slip of the concrete, which could be calculated by following equation:
s i = s i 1 + ( s f i s c i )
where sfi is the slip of FRP, which could be calculated by:
s f i = ε i + ε i 1 2 Δ x
sci is the slip of concrete, which could be calculated by:
s c i = ε c i + ε c i 1 2 Δ x
According to the distribution of strains in Figure 6, before the failure of the specimen, the strains of 200-S-1 and 200-S-2 were quite small, indicating that the slip of the bonding layer in the interval between these two measuring points was almost zero. Therefore, to quantify the bond–slip, the following assumptions were made: (1) the strain of the GFRP at the end far from the tension was 0 and the relative slip with the concrete was 0; and (2) the deformation of the concrete far from the interface was negligible. In this study, the GFRP strain gauges were equally spaced from each other, so that, starting from the end far from the tension, the strain of the GFRP was integrated. The slip at i point on the GFRP, si, could be obtained by:
s i = ε c i + ε c i 1 2 Δ x + s i 1
Based on the above discussion, the shear stress–slip curves of the bonded specimens were obtained and are presented in Figure 10. A Gaussian curve was used to fit the stress–slip data and the fitted curve is shown as the solid line in Figure 10.
Figure 10 demonstrates the interfacial shear stress–slip curve of the GFRP–concrete specimens under different harsh environments. Two distinct segments, including a rising segment and a falling segment, were observed in all the curves. For specimens of the same curing series (such as 150-S-WD in Figure 10a), under the same slip amount, the shear stress of the specimens after seawater erosion was lower than the reference specimen (150-A-0). When the bond stress reached its strength (for example, the maximum shear stress of B150-A was 8.406 MPa), the interface started to peel and a fast decrease in the bond stress was observed. This abrupt decrease was mainly caused by the sudden expansion of the damage and cracks at the interface after reaching a certain length. In the later part of the decline section, the interface damage was quite serious and caused brittle overall peeling.
Figure 11 plots the maximum of the interfacial shear stresses of the GFRP–concrete specimens. With an increase in corrosion duration, the initial bond stiffness became smaller and the maximum bond stress decreased. For example, the maximum bond stresses of corrosion duration for the 150-S-WD specimen series for 0 days, 30 days, 60 days, and 90 days were 8.406, 7.850, 7.419, and 6.933 MPa, respectively. By comparing the bond–slip curves of the specimens for the same period of time in single- and triple-salinity wet–dry corrosion environments, it was seen that a higher salinity had a greater corrosive effect on the bond strength of the interface. For instance, the maximum shear stresses of 150-S-WD-30 and 150-T-WD-30 were 7.850 and 7.347 MPa, respectively. In addition, based on a comparison of the curves for specimens with different bonding lengths (150 mm and 200 mm) for the same conditions of maintenance (e.g., 150-S-WD-30 and 200-S-WD-30), it was also seen that an increase in bonding length had a certain enhancement on the bonding stress.

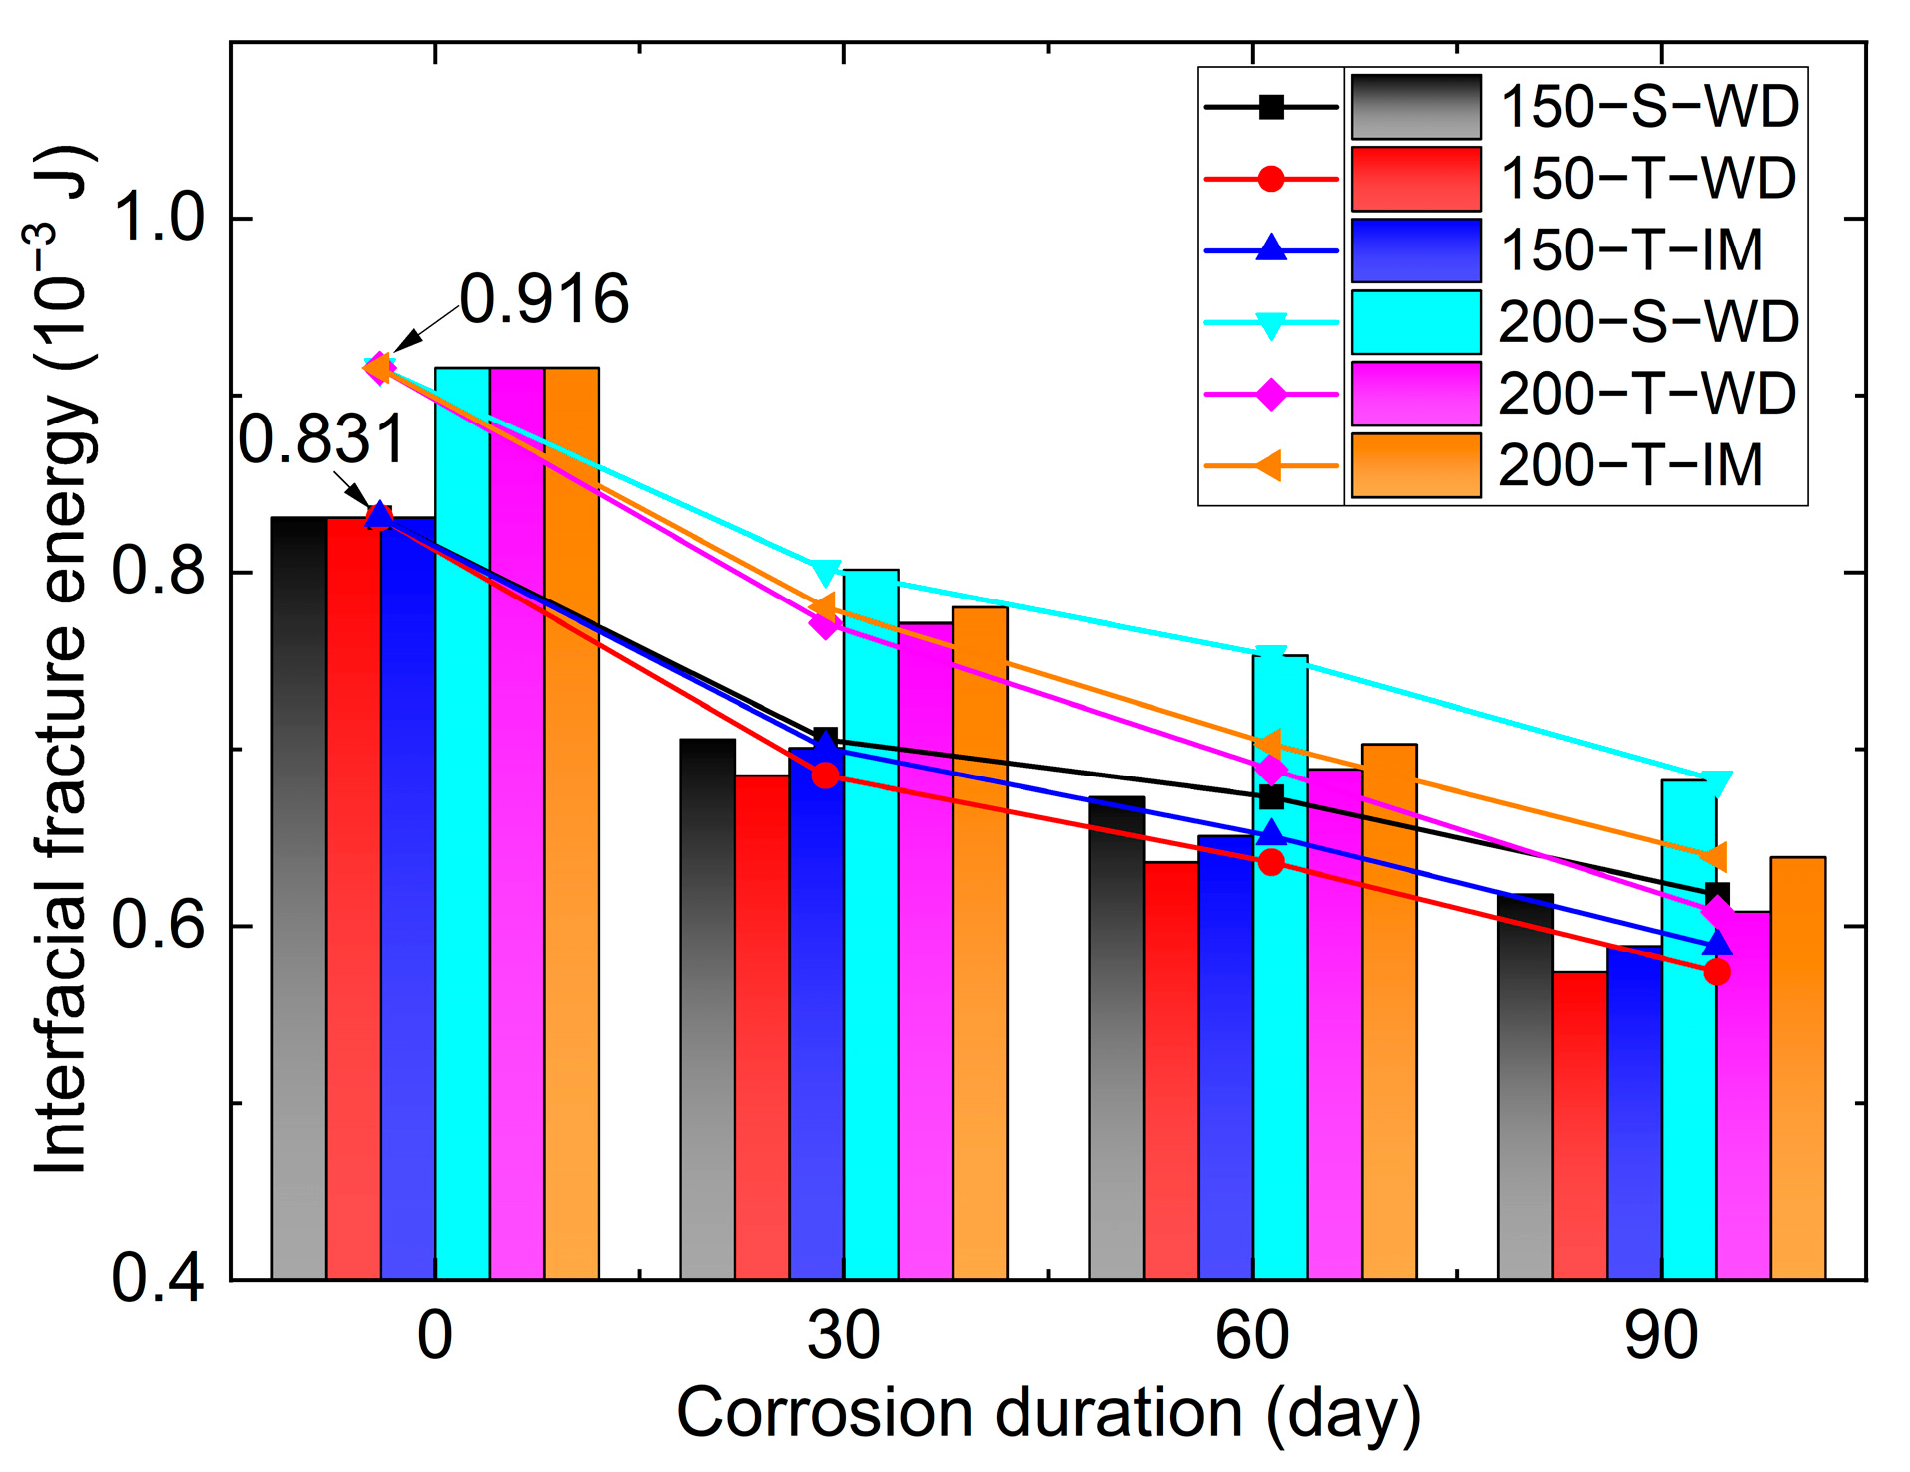
4.2. Interfacial Fracture Energy

The interfacial fracture energy for each specimen was determined by integrating the respective bond–slip curves following the methodology outlined by Pang et al. [35] and the results are depicted in Figure 12. A consistent trend of diminishing fracture energy was observed in correlation with an increase in corrosion duration. Taking the 150-S-WD series as an example, the interfacial fracture energy exhibited a decline from the reference value of 0.831 × 10⁻³ J (for specimen 150-A) to 0.706 × 10⁻³ J, 0.673 × 10⁻³ J, and 0.618 × 10⁻³ J after 30, 60, and 90 days of corrosion, respectively. This trend suggested a progressive weakening of the bond performance between the FRP and concrete under the influence of seawater corrosion. A further comparative analysis between the S-WD and T-WD specimen series revealed that wet–dry cycles in high-salinity seawater intensified the corrosive degradation. Notably, the minimum recorded interfacial fracture energy was 0.574 × 10⁻³ J, observed in the specimen labeled 150-T-WD-90. This finding underscored the exacerbated impact of high-salinity conditions on the structural integrity of the specimens.

4.3. Strength Calculation Model

It is known that the interfacial fracture energy of GFRP–concrete-bonded specimens has the following relationship with their shear load capacity [34]:
P u = β l b f 2 E f t f G f
where βl is the coefficient of the effective bond length and Gf is the interfacial fracture energy of the bonded specimen.
For the corroded specimens in this study, we assumed that the effective bond length of the specimen was constant and the residual performance after seawater corrosion could be characterized by a new parameter, residual coefficient α. The shear capacity of the bonded specimen after seawater corrosion could then be described as:
P u f = α β l b f 2 E f t f G f
where Puf is the tested strengths of the bonded specimens and α is the residual coefficient for each specimen. Based on Equation (9), the residual coefficient could be obtained by:
α = P u f β l b f 2 E f t f G f
According to Equation (10), the residual coefficient α for the air-cured specimens (but not exposed to corrosion) theoretically was 1. However, in the seawater-exposed specimens, the residual coefficient decreased as the corrosion duration increased. This relationship is quantified and presented in Figure 13a, which illustrates the calculation of the residual coefficient for the GFRP–concrete-bonded specimens after seawater corrosion. Figure 13b plots the linearly fitted degradation curves of the residual coefficient, which could be described by the following:
α = b a × t
where b is the intercept of the fitted curves, t is the corrosion duration (united in days), and a is the slope of the fitted curves, which characterized the degradation rate of the residual coefficient.
To simplify the calculation, the intercept b was uniformly assumed to be 1. Therefore, the shear strength of the GFRP–concrete-bonded specimens could be characterized by the following strength calculation model as:
P u f = β l b f 2 E f t f G f × ( 1 a × t )
Compared with the other corrosion conditions such as single-salinity wet–dry cycles and triple-salinity immersion, the degradation rates, a, of the residual coefficient were significantly higher for specimens subjected to wet–dry cycles in triple-salinity seawater. For example, the degradation rate, a, for specimen 150-T-WD was determined to be 0.0020/day, in contrast to 0.0017/day and 0.0018/day for specimens 150-S-WD and 150-T-IM, respectively.
Additionally, an analysis of the specimens with different bonding lengths under the same corrosion conditions revealed a distinct pattern: specimens with a 150 mm bonding length exhibited higher degradation rates of the residual coefficient than those with a 200 mm bonding length. For instance, the slope for specimen 150-S-WD was 0.0017/day, markedly greater than the 0.0014/day observed for 200-S-WD. This trend suggested that the bonding length was a significant factor influencing the rate of residual coefficient degradation.

5. Conclusions

This study conducted an experiment on the interfacial durability of GFRP–concrete-bonded specimens exposed to seawater environments. Three corrosion conditions were tested, including single-salinity wet–dry cycle exposure, triple-salinity wet–dry cycle exposure, and triple-salinity immersion. This study contributes to the enrichment of the experimental database and the in-depth understanding of the interfacial performance of GFRP–concrete-bonded specimens exposed to seawater environments. Based on the experimental study, the following conclusions were drawn:
(1)
Using loading tests, debonding and a peeling failure mode were observed for all the specimens. This phenomenon was attributed to the insufficient strength of the bond interface on the concrete surface, which led to separation between the adhesive layer and the concrete, thus triggering the interface peeling damage.
(2)
Based on the investigation on strains of the bonded specimens, an obvious stress concentration was observed in the bonding area close to the loading end. Using specimen 200-T-WD-60 as an example, when the tensile load was 17,376 N, the maximum strain was obtained by strain gauge 200-S-4, which was 2165 με. This phenomenon showed that the damage to the bonding layer in this area was the main reason for the early failure of the specimen. We anticipated that the additive reinforcement of this interface area would improve the shear strength of the bonded structure.
(3)
After the corrosion of seawater, the shear strengths, initial bond stiffness, interfacial stresses, and fracture energy of the bonding specimens decreased and extended seawater corrosion exacerbated the damage to the GFRP–concrete-bonded structures. The minimum shear strength (13,006 N) was tested using specimen B150-T-DW-90, which was cured in triple-salinity seawater with wet–dry cyclic exposure. For wet–dry cycle exposure, a higher seawater salinity accelerated the degradation of the interfacial zone.
(4)
By introducing a residual coefficient, α, the degradation mechanism of the bonded specimens exposed to seawater environments could be illustrated and the strength of the GFRP–concrete interface exposed to seawater conditions could be characterized by the proposed strength calculation model. It should be noted that the proposed residual coefficient, α, may only be applicable to the performance of specimens in artificially simulated seawater environments that are the same or similar to this experiment and further validation is needed for the effectiveness of residual coefficients in other seawater environments. In addition, considering the varied service conditions encountered by concrete structures in marine environments, the effects of the more aggressive factors, i.e., biomass erosion and seawater–load-coupling erosion, may significantly differ [36]. The exploration of these damage mechanisms requires further study.

Author Contributions

Conceptualization, J.L.; Methodology, J.L.; Software, D.M.; Validation, L.W. and Q.W.; Formal Analysis, D.M.; Investigation, D.M.; Writing—Original Draft, D.M.; Writing—Review and Editing, J.L. and L.W.; Supervision, L.W. and Q.W.; Funding Acquisition, J.L. All authors have read and agreed to the published version of the manuscript.

Funding

This research was funded by financial support from the National Natural Science Foundation of China (Grant No.: 52108151).

Data Availability Statement

Data will be made available on request.

Acknowledgments

The authors thank the anonymous referees for their invaluable comments on an earlier version of the manuscript.

Conflicts of Interest

The authors declare no conflicts of interest.

References

  1. Lee, J.; Lopez, M.M. Frictional bond-slip model for the concrete-FRP interface under the FRP U-wrap region. Constr. Build. Mater. 2019, 194, 226–237. [Google Scholar] [CrossRef]
  2. Yuan, H.; Lu, X.S.; Hui, D.; Feo, L. Studies on FRP-concrete interface with hardening and softening bond-slip law. Compos. Struct. 2012, 94, 3781–3792. [Google Scholar] [CrossRef]
  3. Manjunath, M.; Seth, D.; Balaji, K.; Roy, S.; Tangadagi, R.B. Utilization of industrial-based PVC waste powder in self-compacting concrete: A sustainable building material. J. Cleaner Prod. 2023, 428, 139428. [Google Scholar] [CrossRef]
  4. Zhang, P.; Hu, Y.; Pang, Y.; Gao, D.; Xu, Q.; Zhang, S.; Sheikh, S.A. Experimental study on the interfacial bond behavior of FRP plate-high-strength concrete under seawater immersion. Constr Build Mater. 2020, 259, 119799. [Google Scholar] [CrossRef]
  5. Zeng, J.; Zhang, X.W.; Chen, G.M.; Wang, X.M.; Jiang, T. FRP-confined recycled glass aggregate concrete: Concept and axial compressive behavior. J. Build. Eng. 2020, 30, 19. [Google Scholar] [CrossRef]
  6. Liu, J.; Guo, T.; Feng, D.M.; Liu, Z.X. Fatigue Performance of Rib-to-Deck Joints Strengthened with FRP Angles. J. Bridge Eng. 2018, 23, 14. [Google Scholar] [CrossRef]
  7. Wang, Y.L.; Guo, X.Y.; Shu, S.Y.H.; Guo, Y.C.; Qin, X.M. Effect of salt solution wet-dry cycling on the bond behavior of FRP-concrete interface. Constr. Build. Mater. 2020, 254, 15. [Google Scholar] [CrossRef]
  8. Guo, T.; Liu, J.; Deng, Y.; Zhang, Z.L. Fatigue Performance of Orthotropic Steel Decks with FRP Angles: Field Measurement and Numerical Analysis. J. Perform. Constr. Facil. 2019, 33, 11. [Google Scholar] [CrossRef]
  9. Zakir, M.; Sofi, F.A.; Naqash, J.A. Compressive testing and finite element analysis-based confined concrete model for stiffened square FRP-concrete-steel double-skin tubular columns. J. Build. Eng. 2022, 44, 19. [Google Scholar] [CrossRef]
  10. Zhang, P.; Hu, Y.; Pang, Y.Y.; Zhang, S.Q.; Zia, A.; Gao, D.Y.; Zhu, H.; Sheikh, S.A. Experimental study on the bond behavior of GFRP plate-high-strength concrete composite interfaces under the coupled effects of sustained load and seawater immersion. Structures 2021, 30, 316–328. [Google Scholar] [CrossRef]
  11. Nordin, H.; Täljsten, B. Testing of hybrid FRP composite beams in bending. Compos. Pt. B-Eng. 2004, 35, 27–33. [Google Scholar] [CrossRef]
  12. Joo, H.J.; Lee, S.; Yoon, S.J.; Park, J.K.; Youn, S.G. Experimental investigation on the structural behavior of shear connectors used in the FRP and concrete bridge deck system. In Fracture and Strength of Solids Vi, Pts 1 and 2. Key Engineering Materials 306–308; Putra, I.S., Suharto, D., Eds.; Trans Tech Publications Ltd.: Durnten-Zurich, Switzerland, 2006; pp. 1355–1360. [Google Scholar]
  13. Zhu, H.; Zhang, P.; Wu, G.; Wu, Z.S. (Eds.) Experimental Study on Bending Performances of FRP-Concrete Composite T-Beams with Prefabricated BFRP Shell. In Proceedings of the 5th International Conference on Fiber-Reinforced Polymer (FRP) Composites in Civil Engineering (CICE), Beijing, China, 27–29 September 2010; Springer: Berlin/Heidelberg, Germany, 2010. [Google Scholar]
  14. Tuakta, C.; Büyüköztürk, O. Deterioration of FRP/concrete bond system under variable moisture conditions quantified by fracture mechanics. Compos. Pt. B-Eng. 2011, 42, 145–154. [Google Scholar] [CrossRef]
  15. Zheng, X.H.; Huang, P.Y.; Guo, X.Y.; Huang, J.L. Experimental Study on Bond Behavior of FRP-Concrete Interface in Hygrothermal Environment. Int. J. Polym. Sci. 2016, 2016, 12. [Google Scholar] [CrossRef]
  16. Liang, H.J.; Li, S.; Lu, Y.Y.; Yang, T. The combined effects of wet-dry cycles and sustained load on the bond behavior of FRP-concrete interface. Polym. Compos. 2019, 40, 1006–1017. [Google Scholar] [CrossRef]
  17. Choi, S.; Gartner, A.L.; Van Etten, N.; Hamilton, H.R.; Douglas, E.P. Durability of Concrete Beams Externally Reinforced with CFRP Composites Exposed to Various Environments. J. Compos. Constr. 2012, 16, 10–20. [Google Scholar] [CrossRef]
  18. Kabir, M.I.; Samali, B.; Shrestha, R. Fracture Properties of CFRP-Concrete Bond Subjected to Three Environmental Conditions. J. Compos. Constr. 2016, 20, 15. [Google Scholar] [CrossRef]
  19. Al-Rousan, R.; Haddad, R. NLFEA sulfate-damage reinforced concrete beams strengthened with FRP composites. Compos. Struct. 2013, 96, 433–445. [Google Scholar] [CrossRef]
  20. Fazli, N.; Yassin, A.Y.M.; Shafiq, N.; Teo, W. Effective bond length of CFRP sheets externally bonded to concrete beams under marine environment. Constr. Build. Mater. 2018, 167, 726–738. [Google Scholar] [CrossRef]
  21. Wang, D.H.; Gong, Q.N.; Yuan, Q.; Luo, S.R. Review of the Properties of Fiber-Reinforced Polymer-Reinforced Seawater-Sea Sand Concrete. J. Mater. Civ. Eng. 2021, 33, 18. [Google Scholar] [CrossRef]
  22. Hu, X.L.; Xiao, J.Z.; Zhang, K.J.; Zhang, Q.T. The state-of-the-art study on durability of FRP reinforced concrete with seawater and sea sand. J. Build. Eng. 2022, 51, 15. [Google Scholar] [CrossRef]
  23. Bazli, M.; Li, Y.L.; Zhao, X.L.; Raman, R.K.S.; Bai, Y.; Al-Saadi, S.; Haque, A. Durability of seawater and sea sand concrete filled filament wound FRP tubes under seawater environments. Compos. Pt. B-Eng. 2020, 202, 223. [Google Scholar] [CrossRef]
  24. Xie, J.H.; Li, Y.C.; Lu, Z.Y.; Fan, Z.H.; Li, J.L.; Li, S.X. Effects of Immersion in Water, Alkaline Solution, and Seawater on the Shear Performance of Basalt FRP Bars in Seawater-Sea Sand Concrete. J. Compos. Constr. 2022, 26, 14. [Google Scholar] [CrossRef]
  25. GB/T50081; Physical and Mechanical Properties of Concrete Test Method Standard. National Standards of the People’s Republic of China: Beijing, China, 2019.
  26. ASTM D-1141-98; Standard Practice for the Preparation of Substitute Ocean Water. ASTM International: West Conshohocken, PA, USA, 2021.
  27. Wang, X.Q.; Lau, D. Atomistic investigation of GFRP composites under chloride environment. Adv. Struct. Eng. 2021, 24, 1138–1149. [Google Scholar] [CrossRef]
  28. Ni, B.; Shen, S.; Liu, X.; Chen, S. Effects of temperature and salinity on fouling in hypersaline seawater. Desalin Water Treat. 2020, 173, 41–48. [Google Scholar] [CrossRef]
  29. Ragab, A.M.; Elgammal, M.A.; Hodhod, O.A.; Ahmed, T.E. Evaluation of field concrete deterioration under real conditions of seawater attack. Constr. Build. Mater. 2016, 119, 130–144. [Google Scholar] [CrossRef]
  30. Safhi, A.E.; Benzerzour, M.; Rivard, P.; Abriak, N.E.; Ennahal, I. Development of self-compacting mortars based on treated marine sediments. J. Build. Eng. 2019, 22, 252–261. [Google Scholar] [CrossRef]
  31. Lu, Z.; Xie, J.; Zhang, H.; Li, J. Long-term durability of basalt fiber-reinforced polymer (BFRP) sheets and the epoxy resin matrix under a wet–dry cyclic condition in a chloride-containing environment. Polymers 2017, 9, 652. [Google Scholar] [CrossRef]
  32. Liu, T.; Liu, X.; Feng, P. A comprehensive review on mechanical properties of pultruded FRP composites subjected to long-term environmental effects. Compos. Part. B 2020, 191, 107958. [Google Scholar] [CrossRef]
  33. Liu, J.; Guo, T.; Hebdon, M.H.; Yu, X.M.; Wang, L.B. Behaviors of GFRP-steel bonded joints under cyclic loading after hygrothermal aging. Constr. Build. Mater. 2020, 242, 118106. [Google Scholar] [CrossRef]
  34. Jiang, F.X.; Yang, Q.R.; Wang, Y.T.; Wang, P.; Hou, D.S.; Jin, Z.Q. Insights on the adhesive properties and debonding mechanism of CFRP/concrete interface under sulfate environment: From experiments to molecular dynamics. Constr. Build. Mater. 2021, 269, 13. [Google Scholar] [CrossRef]
  35. Pang, Y.Y.; Wu, G.; Wang, H.T.; Gao, D.Y.; Zhang, P. Bond-slip model of the CFRP-steel interface with the CFRP delamination failure. Compos. Struct. 2021, 256, 13. [Google Scholar] [CrossRef]
  36. Vergiev, S. Tall Wheatgrass (Thinopyrum ponticum): Flood resilience, growth response to sea water immersion, and its capacity for erosion and flooding control of coastal areas. Environments 2019, 6, 103. [Google Scholar] [CrossRef]
Figure 1. Dimensions of the GFRP–concrete-bonding specimens (unit: mm). (a) Top view of the specimen with 150 mm bonding length; (b) top view of the specimen with 200 mm bonding length; (c) side view of the specimen with 150 mm bonding length; (d) side view of the specimen with 200 mm bonding length.
Buildings 14 01732 g001
Figure 2. Specimen production figures and seawater curing box. (a) Polished concrete; (b) concrete after gluing; (c) bonded specimens; (d) seawater curing box A; (e) seawater curing box B.
Buildings 14 01732 g002
Figure 3. Schematic diagram of specimen loading.
Buildings 14 01732 g003
Figure 4. Loading configuration and failure specimen. (a) Clamping device; (b) loading setup; (c) image of failure specimen.
Buildings 14 01732 g004
Figure 5. Strains of 200-T-WD-60.
Buildings 14 01732 g005
Figure 6. Shear strengths of the GFRP–concrete-bonding specimens.
Buildings 14 01732 g006
Figure 7. Load–displacement curves. (a) Load–displacement curves; (b) normalized load–displacement curves.
Buildings 14 01732 g007
Figure 8. Load–displacement curves for corroded specimens. (a) 150-S-DW; (b) 150-T-DW; (c) 150-T-IM; (d) 200-S-DW; (e) 200-T-DW; (f) 200-T-IM.
Buildings 14 01732 g008aBuildings 14 01732 g008b
Figure 9. Schematic force diagram of GFRP micro-block.
Buildings 14 01732 g009
Figure 10. Shear stress–slip curves of the bonded specimens. (a) Series of B150-S-WD; (b) series of B150-T-WD; (c) series of B150-T-IM; (d) series of B200-S-WD; (e) series of B200-T-WD; (f) series of B200-T-IM.
Buildings 14 01732 g010aBuildings 14 01732 g010b
Figure 11. Maximum shear stresses of GFRP–concrete-bonded specimens.
Buildings 14 01732 g011
Figure 12. Interfacial fracture energy of each specimen.
Buildings 14 01732 g012
Figure 13. Residual coefficients and their fitted curves. (a) Residual coefficients; (b) fitted curves of residual coefficient.
Buildings 14 01732 g013
Table 1. The compositions of concrete.
Water/Binder RatioCementSandCoarse AggregateWaterWater Reducer (%)
0.3348566711371601.39
Table 2. Mechanical properties of the GFRP and adhesives.
Mechanical PropertyGFRPImpregnating AdhesiveBonding Adhesive
Young’s Modulus (GPa)20.22 (Longitudinal direction)
12.39 (Transversal direction)2.94.50
13.66 (Thickness direction)
Strength (MPa)537.86 (Longitudinal direction)60 (Tensile strength)60 (Tensile strength)
303.24 (Transversal direction)
327.43 (Thickness direction)
Poisson’s Ratio0.370.330.35
Table 3. Chemical composition of substitute ocean water (g/L).
ComponentNaClMgCl2Na2SO4CaCl2KClNaHCO3KBrH3BO3SrCl2NaF
Concentration24.535.204.091.160.6950.2010.1010.0270.0250.003
Table 5. GFRP–concrete-bonding specimens and their shear strengths.
Specimen No.Shear Strength *,
Fave (N)
SpecimenShear Strength *,
Fave (N)
B150-A-019,030B200-A-021,978
B150-S-DW-3016,144B200-S-DW-3019,665
B150-S-DW-6015,089B200-S-DW-6017,942
B150-S-DW-9013,719B200-S-DW-9016,817
B150-T-DW-3015,936B200-T-DW-3019,226
B150-T-DW-6014,288B200-T-DW-6017,376
B150-T-DW-9013,006B200-T-DW-9015,180
B150-T-IM-3016,484B200-T-IM-3019,153
B150-T-IM-6014,708B200-T-IM-6017,629
B150-T-IM-9013,365B200-T-IM-9016,120
* The shear strength was the average value of the load in the fluctuation section during the loading process of the specimen.
Table 4. The details of the experimental parameters.
ConditionsCorrosion ModeSalinityDuration (Days)
1cWet–dry cycleSingle-salinity30, 60, and 90
3cWet–dry cycleTriple-salinity30, 60, and 90
mImmersionTriple-salinity30, 60, and 90
Disclaimer/Publisher’s Note: The statements, opinions and data contained in all publications are solely those of the individual author(s) and contributor(s) and not of MDPI and/or the editor(s). MDPI and/or the editor(s) disclaim responsibility for any injury to people or property resulting from any ideas, methods, instructions or products referred to in the content.

