
Study on the Effect of Cracking Parameters on the Migration Characteristics of Chloride Ions in Cracked Concrete
Abstract
:1. Introduction
2. Chloride Diffusion Theory
2.1. Homeostasis Studies
2.2. Transient Studies
3. Numerical Model of Cracked Concrete
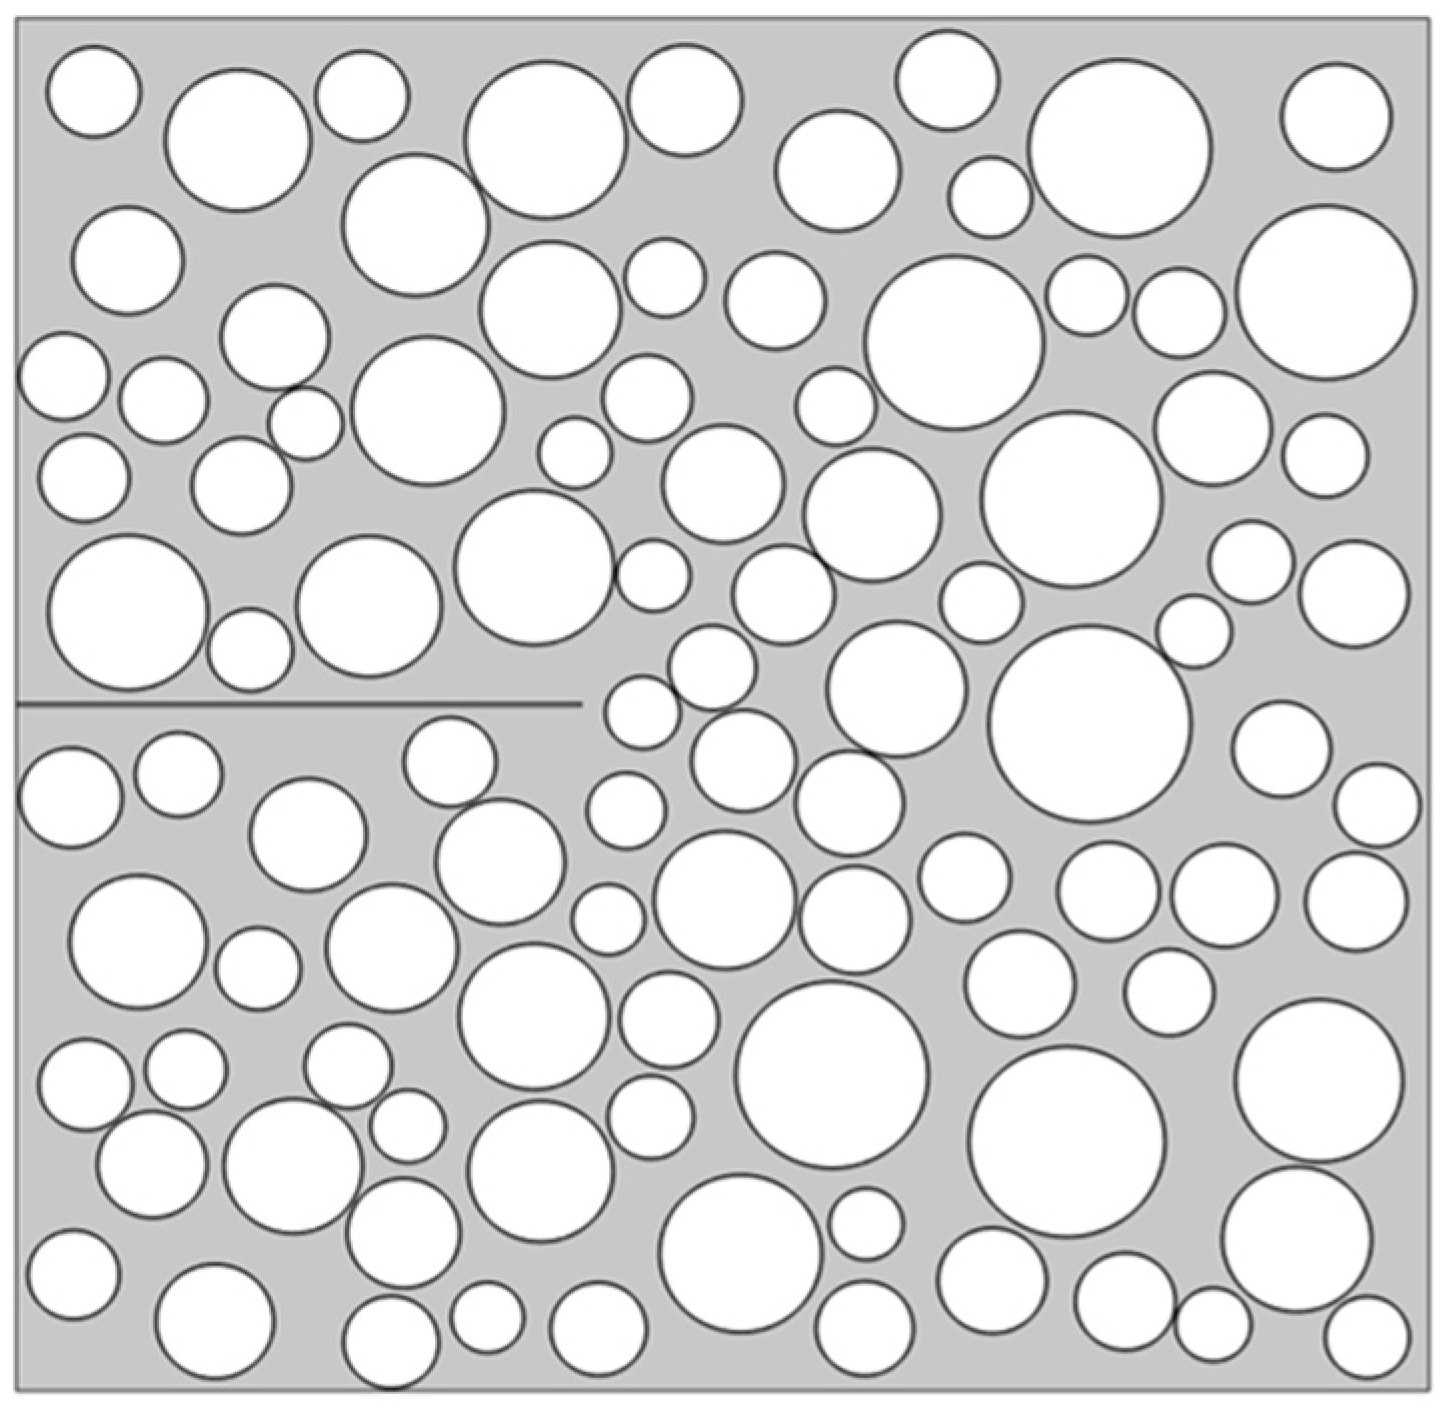
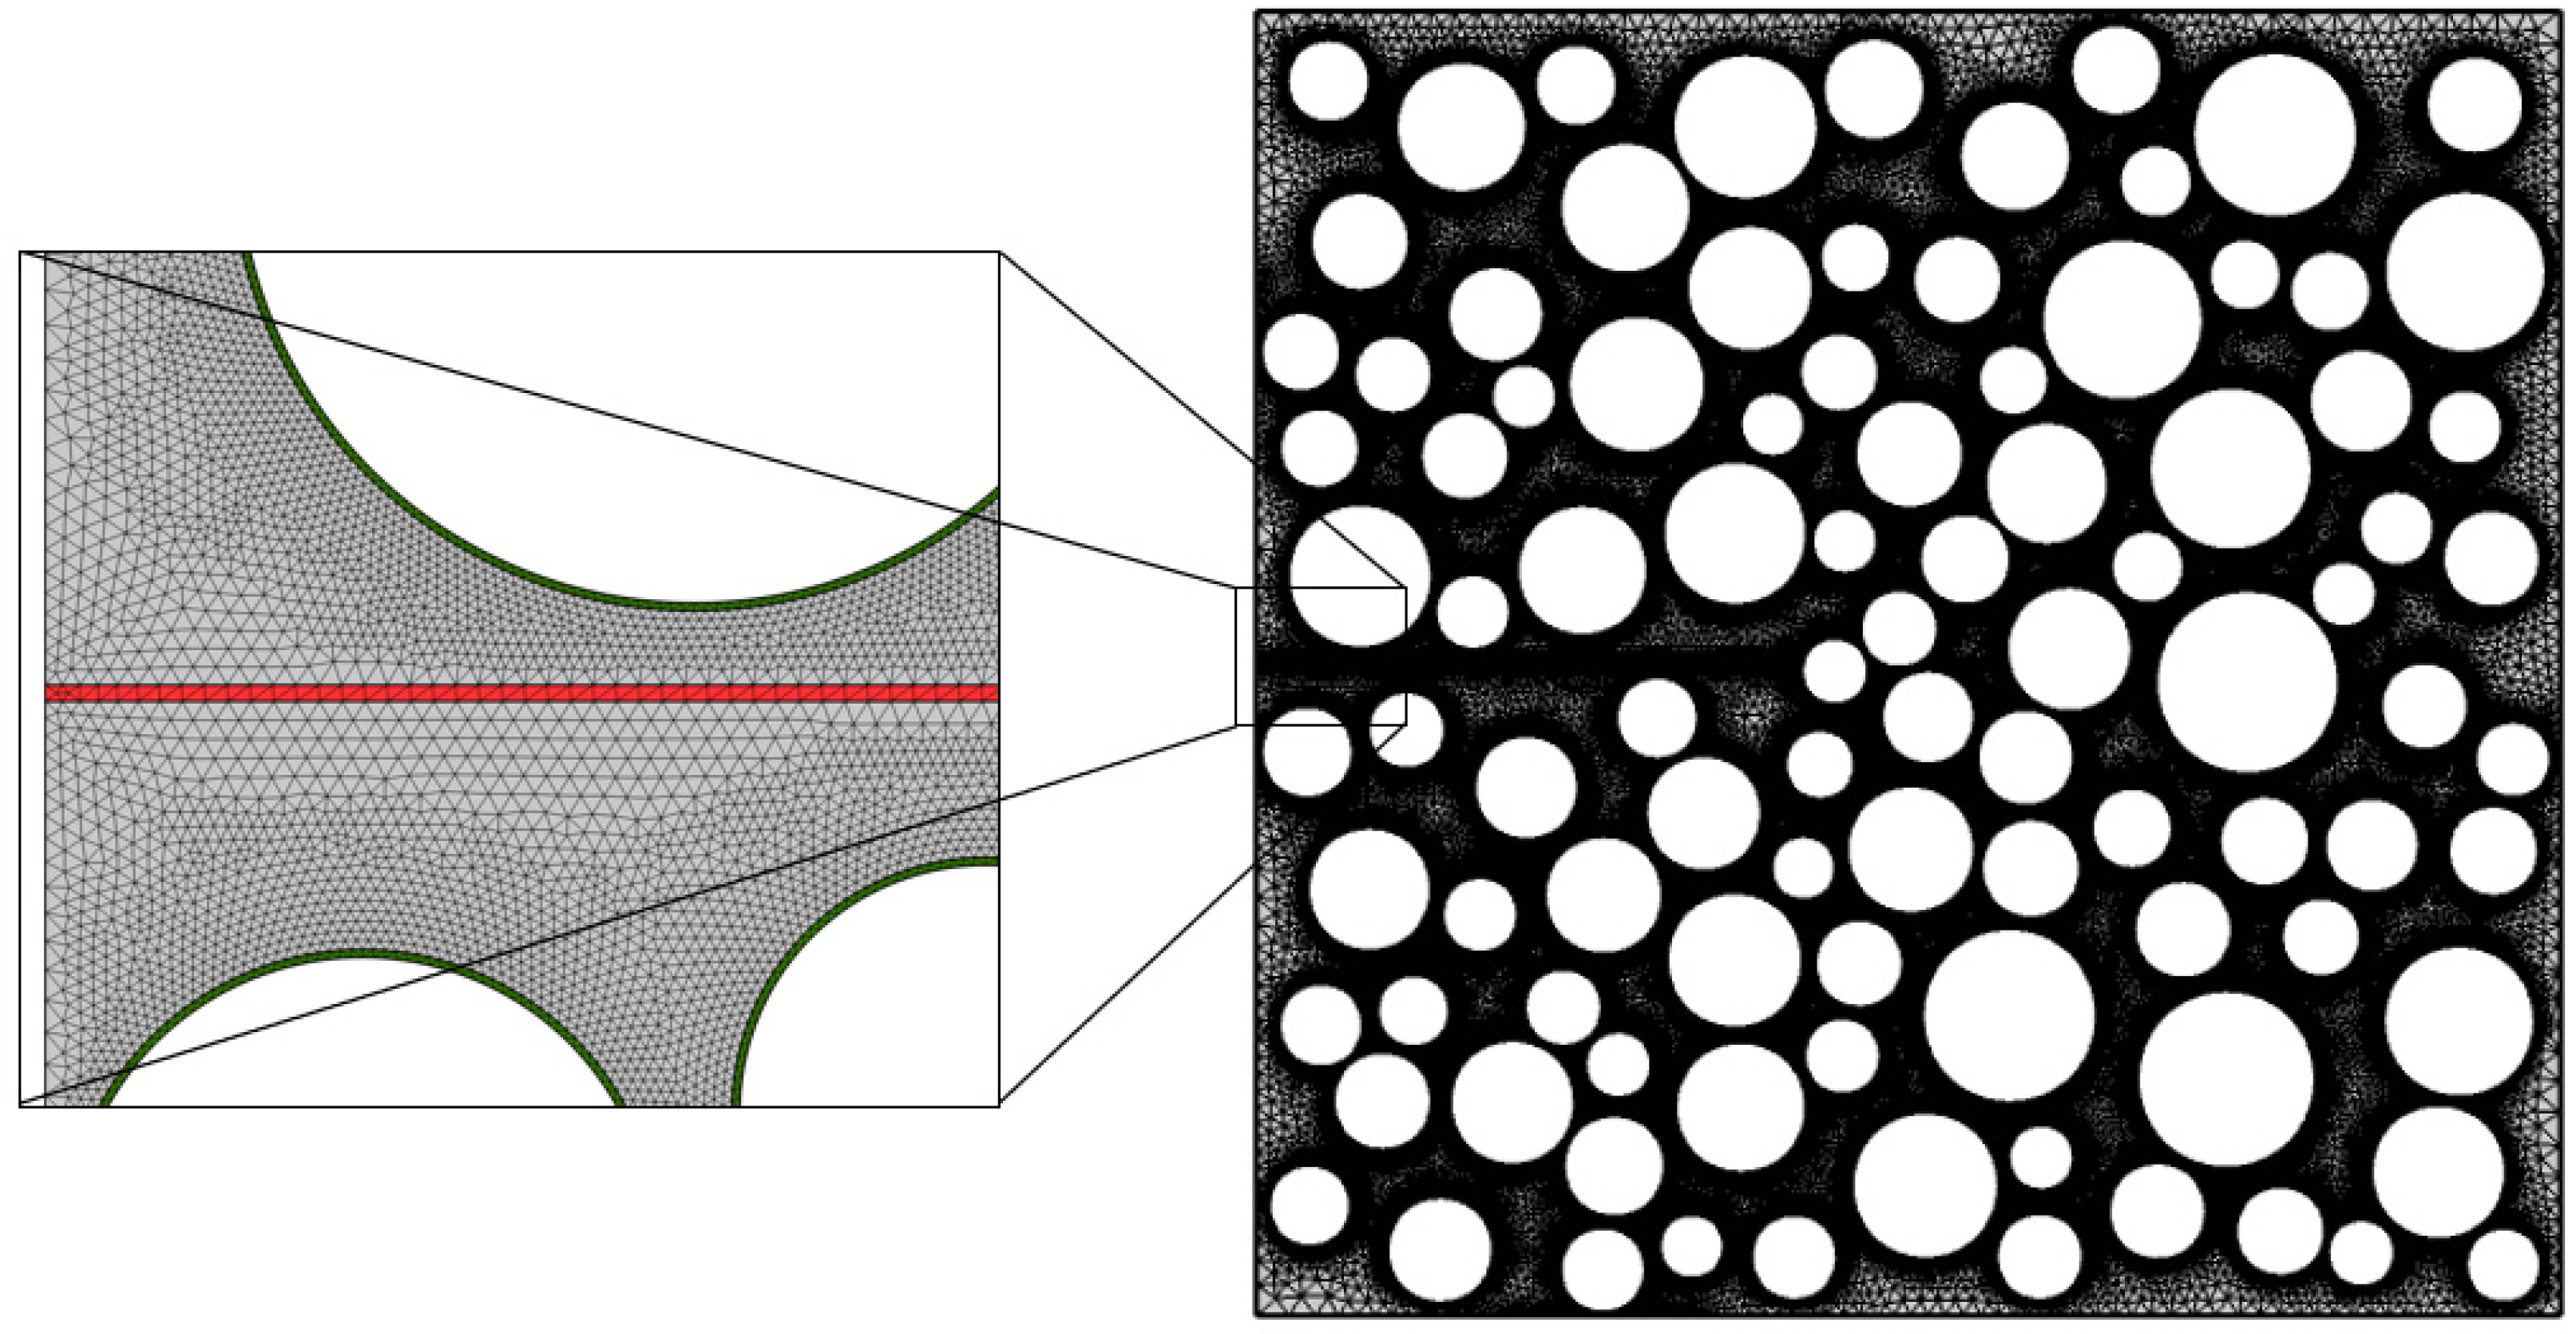
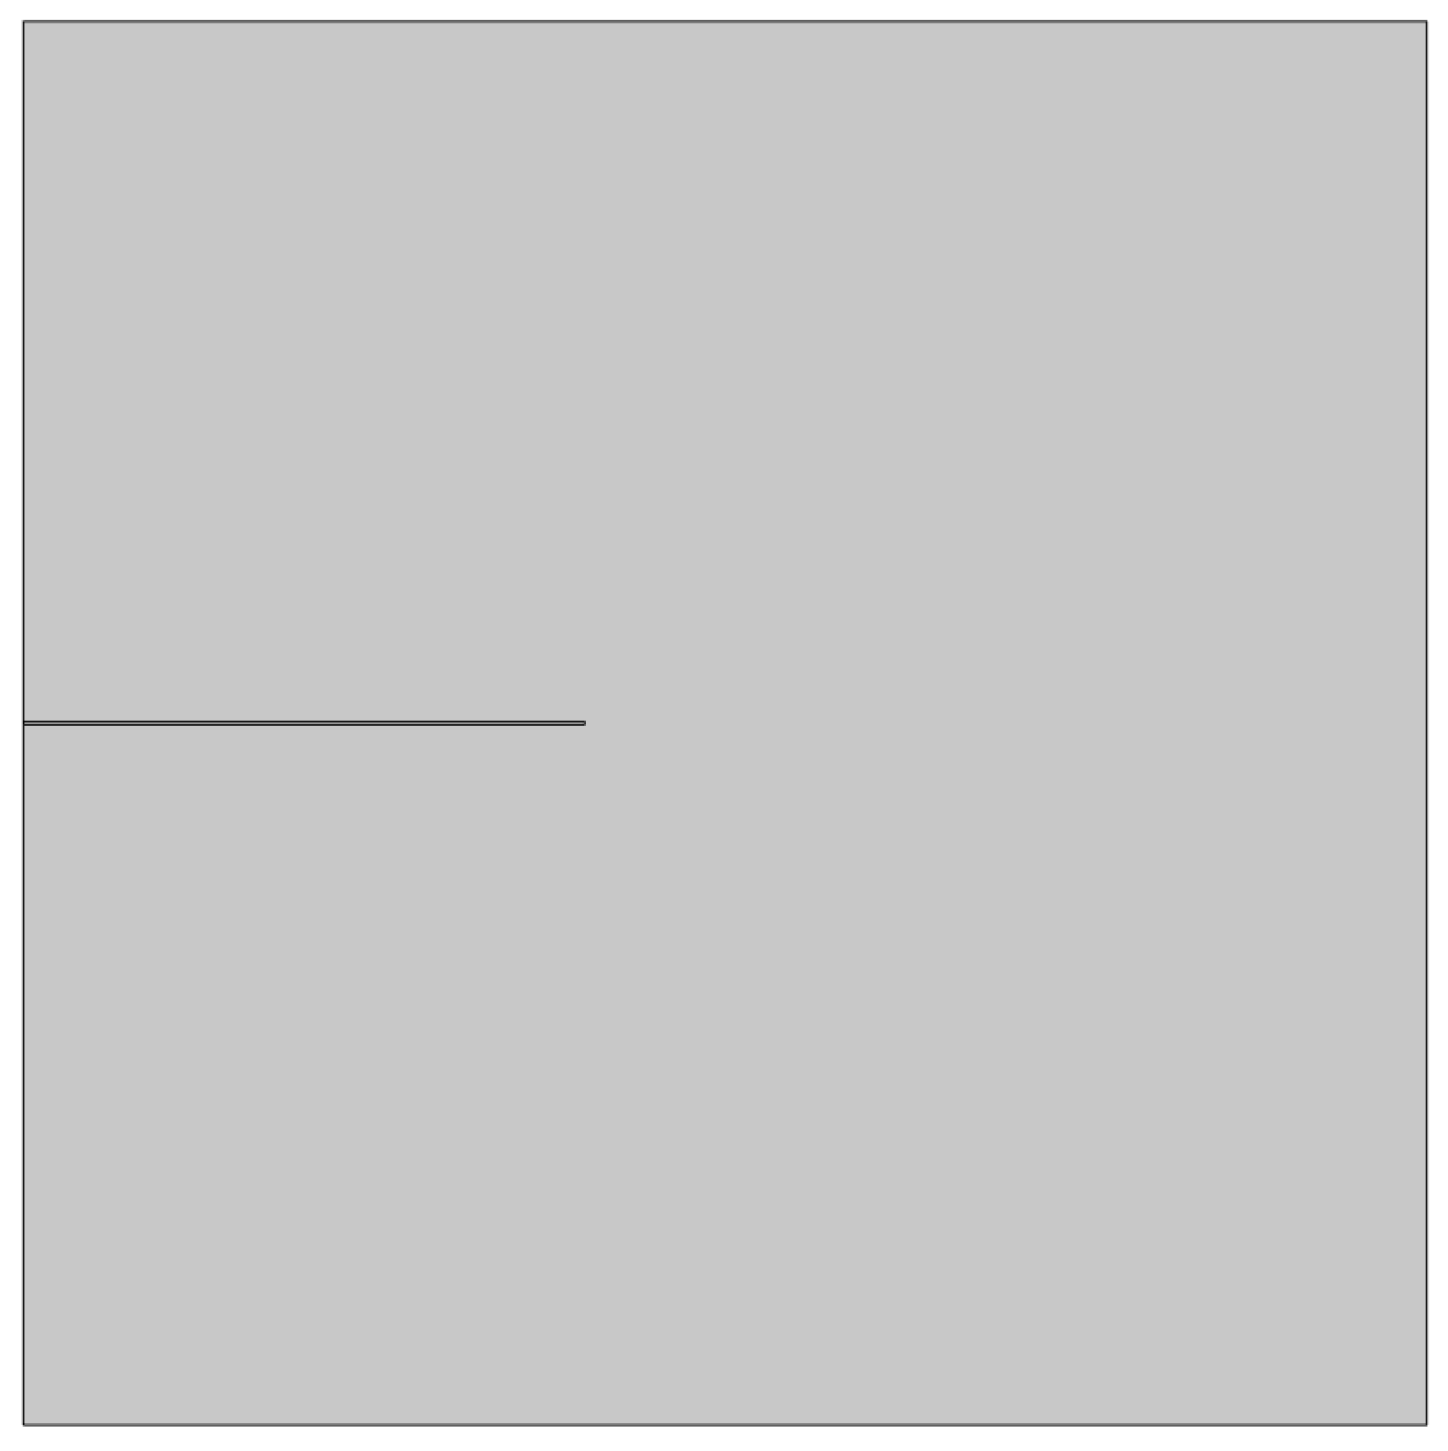
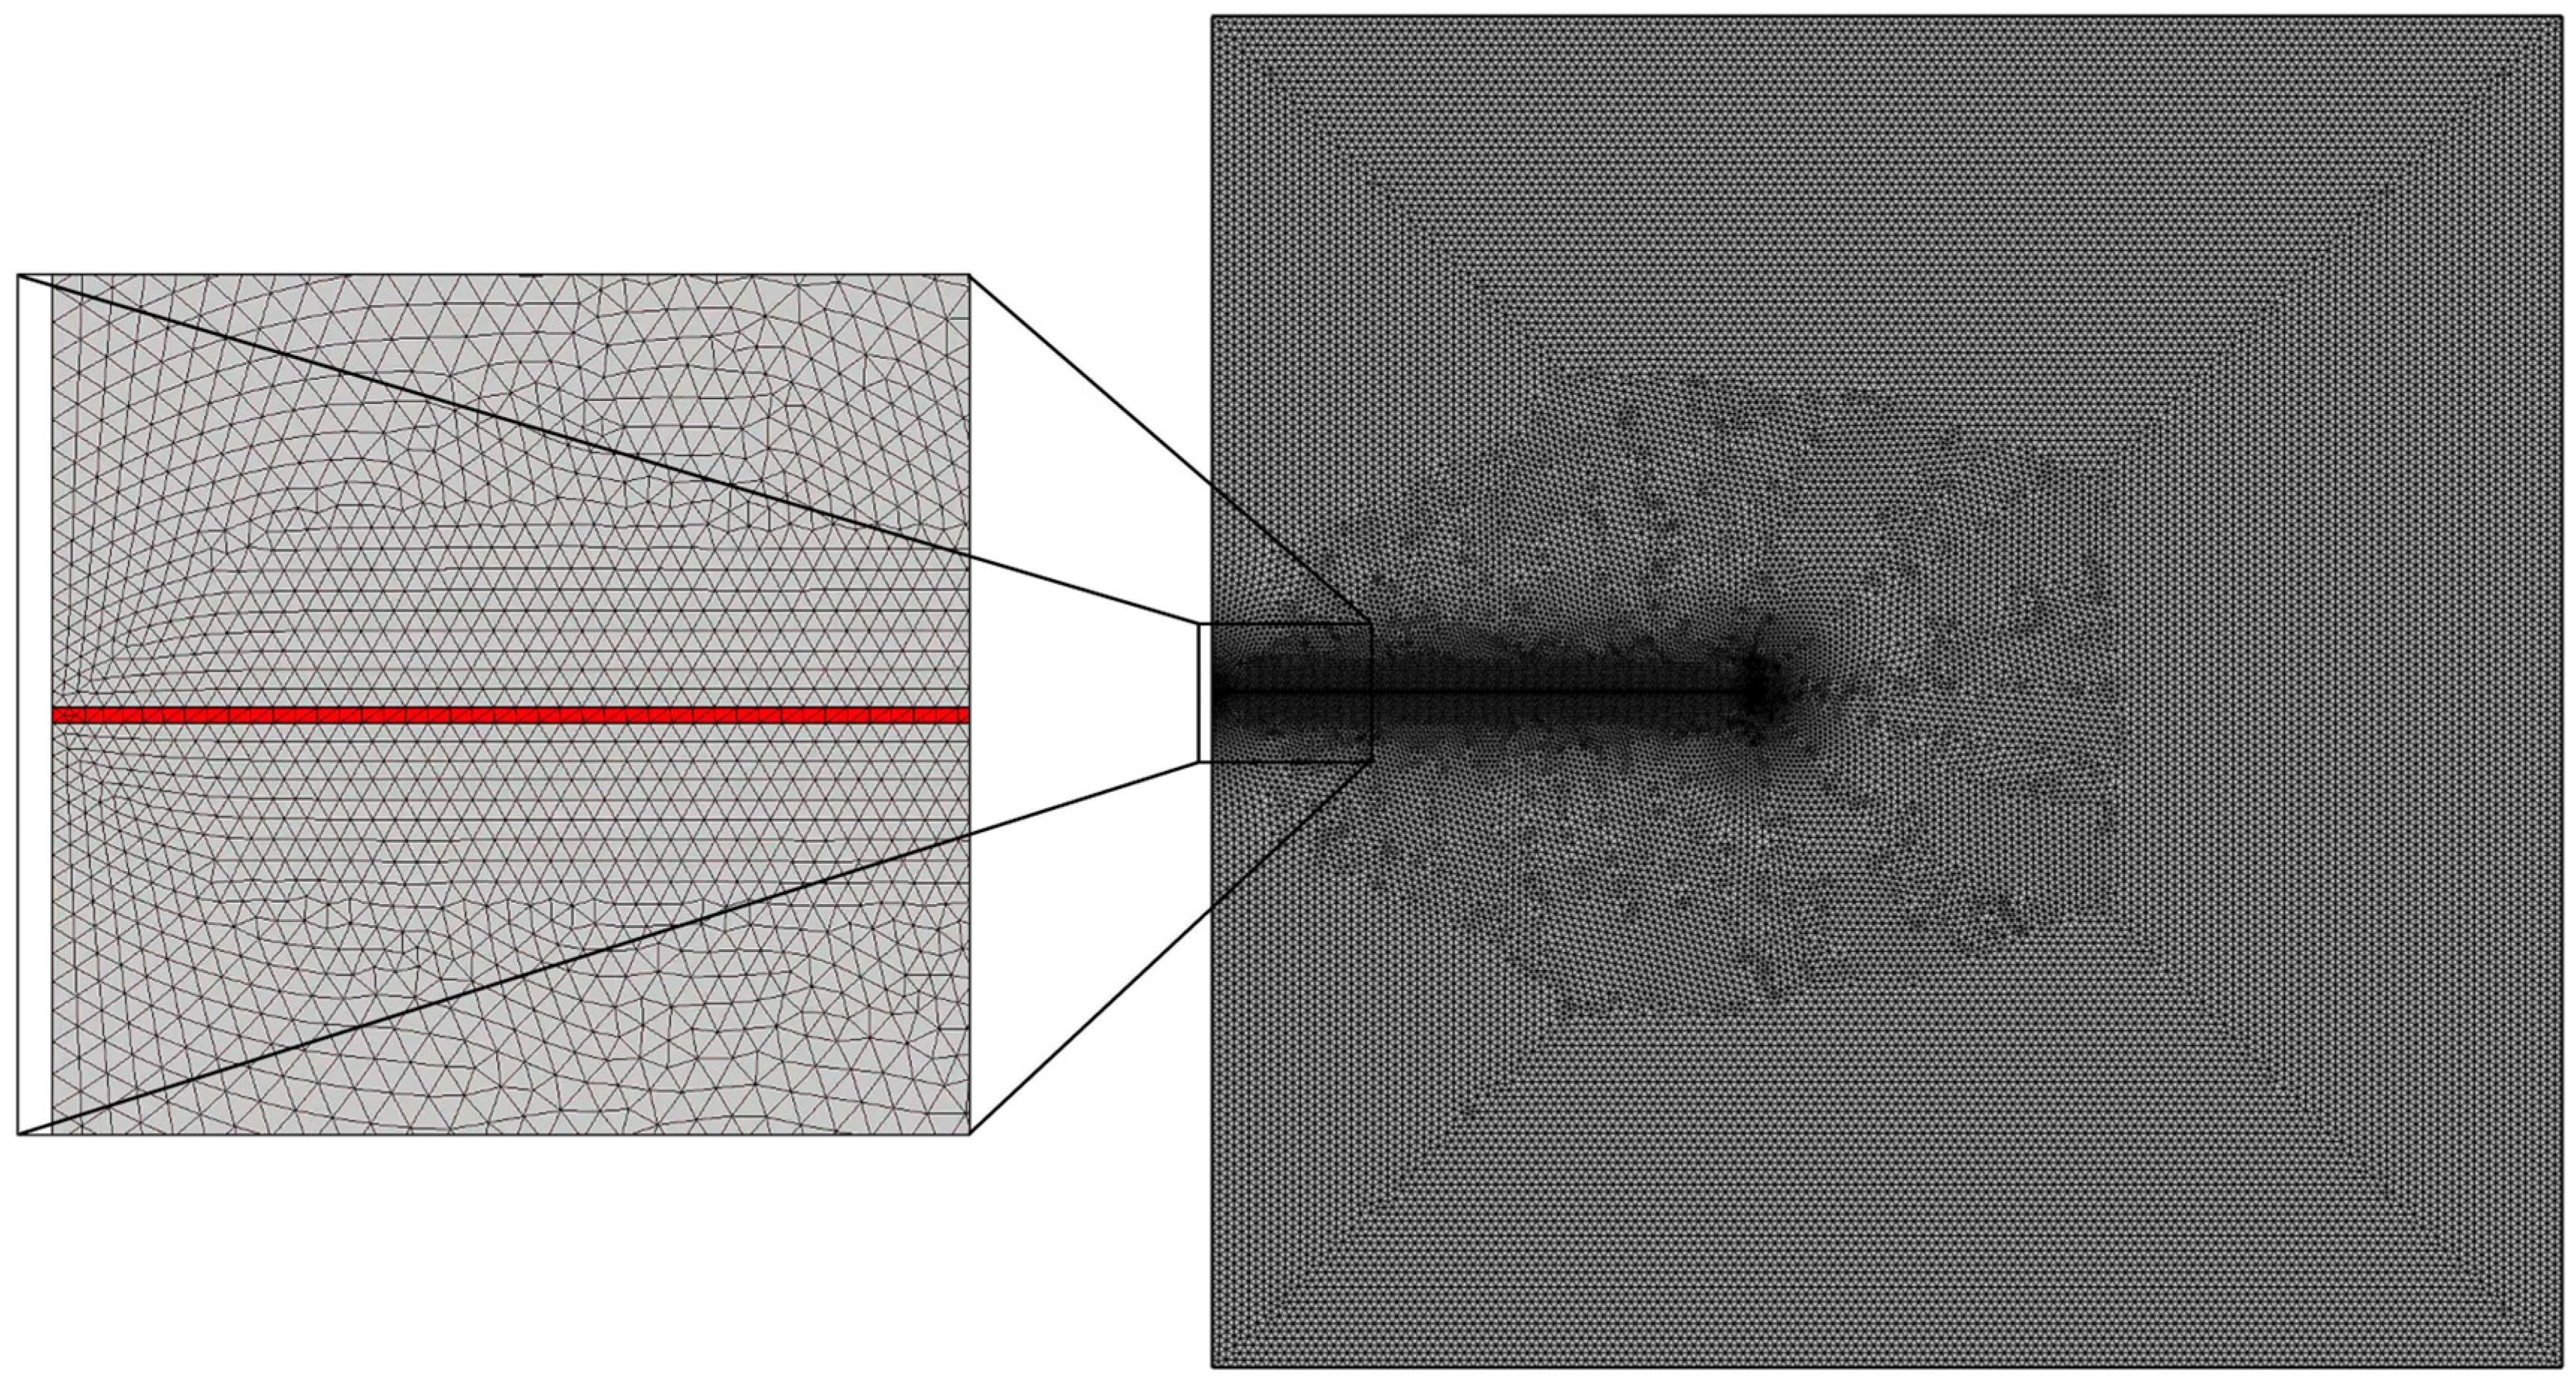
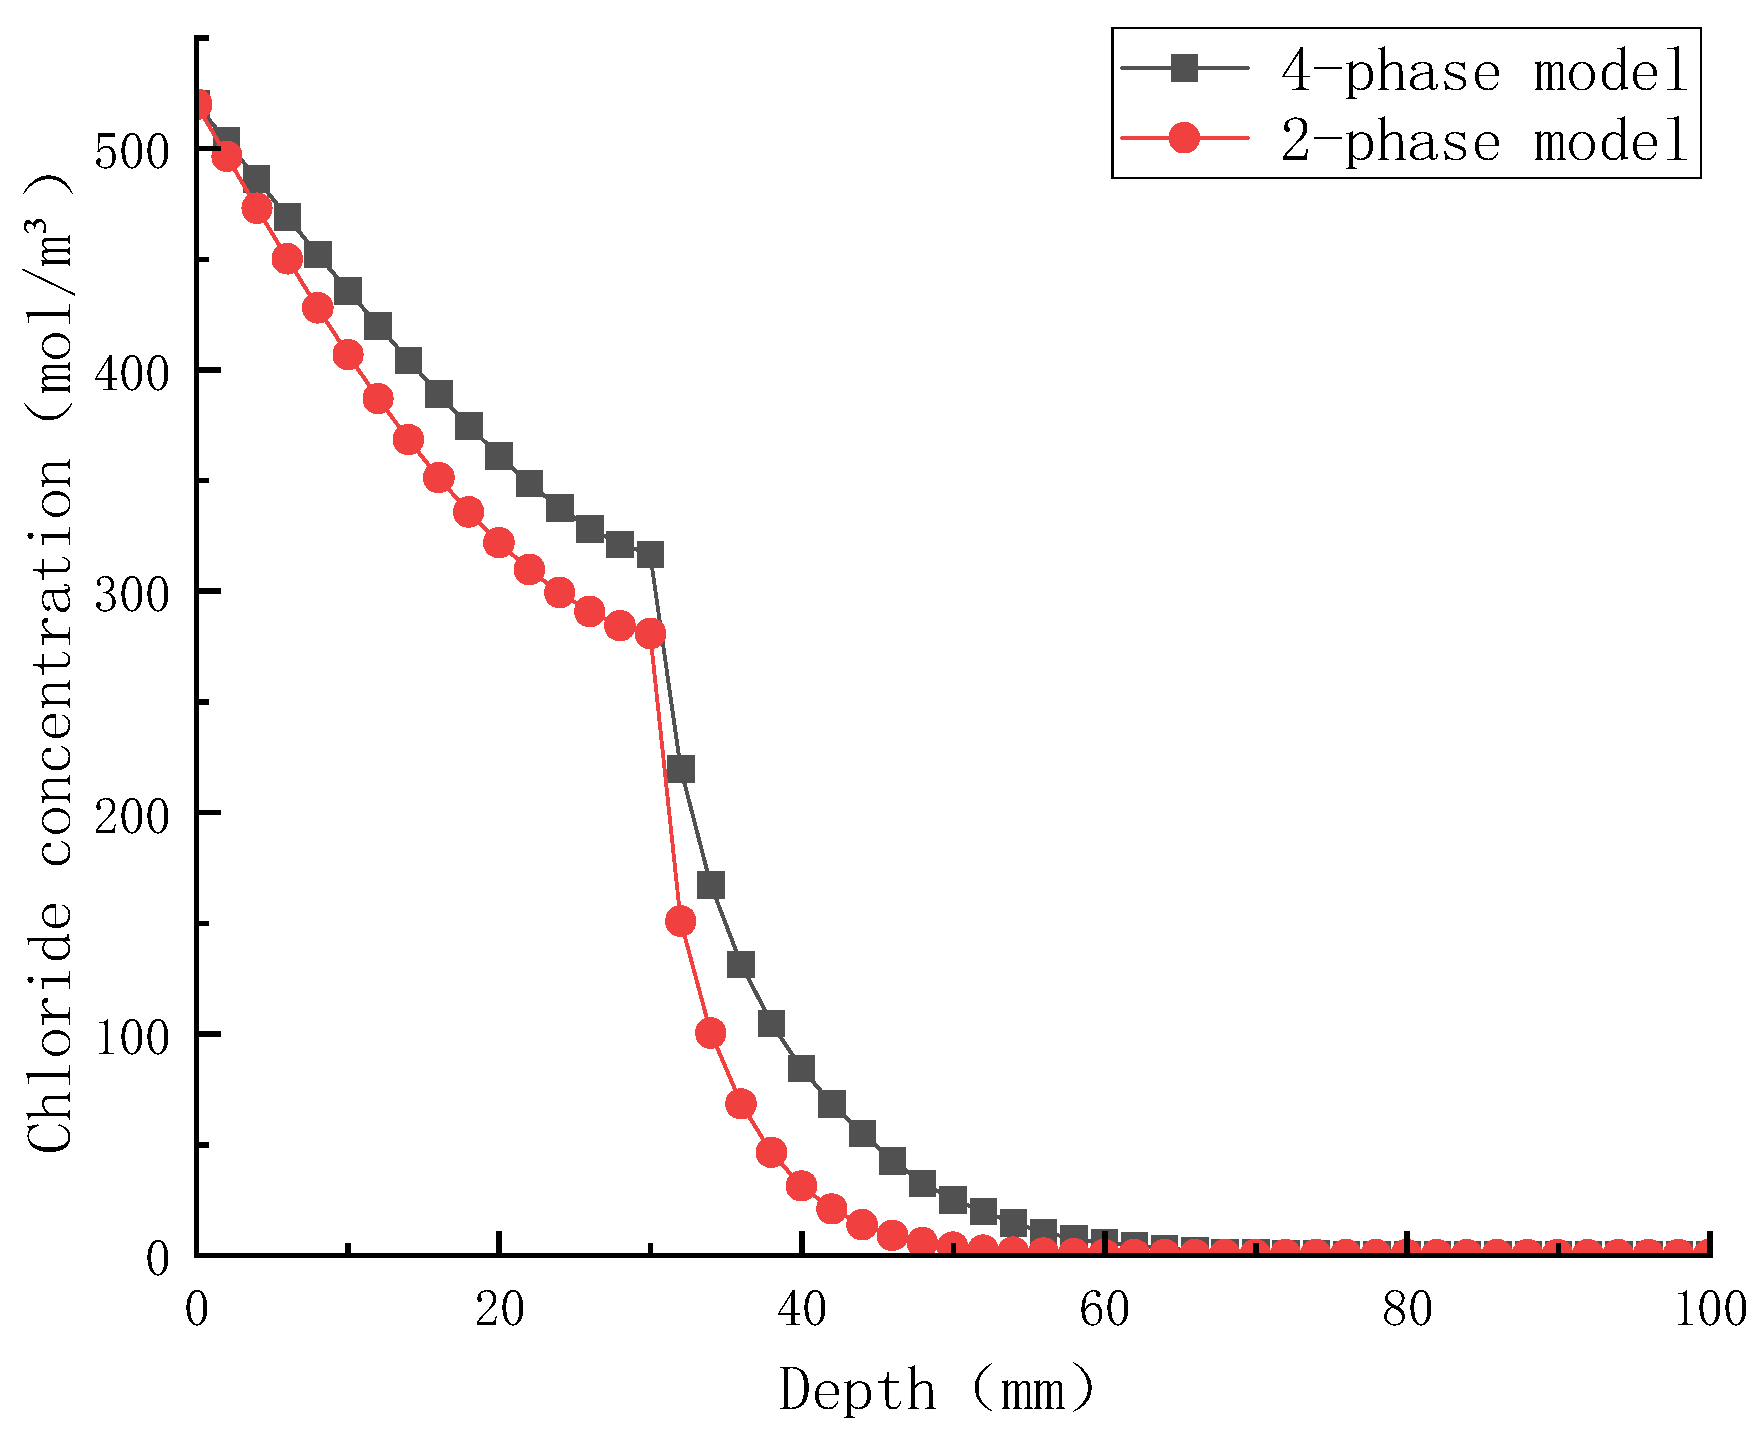
3.1. Four-Phase Model versus Two-Phase Model
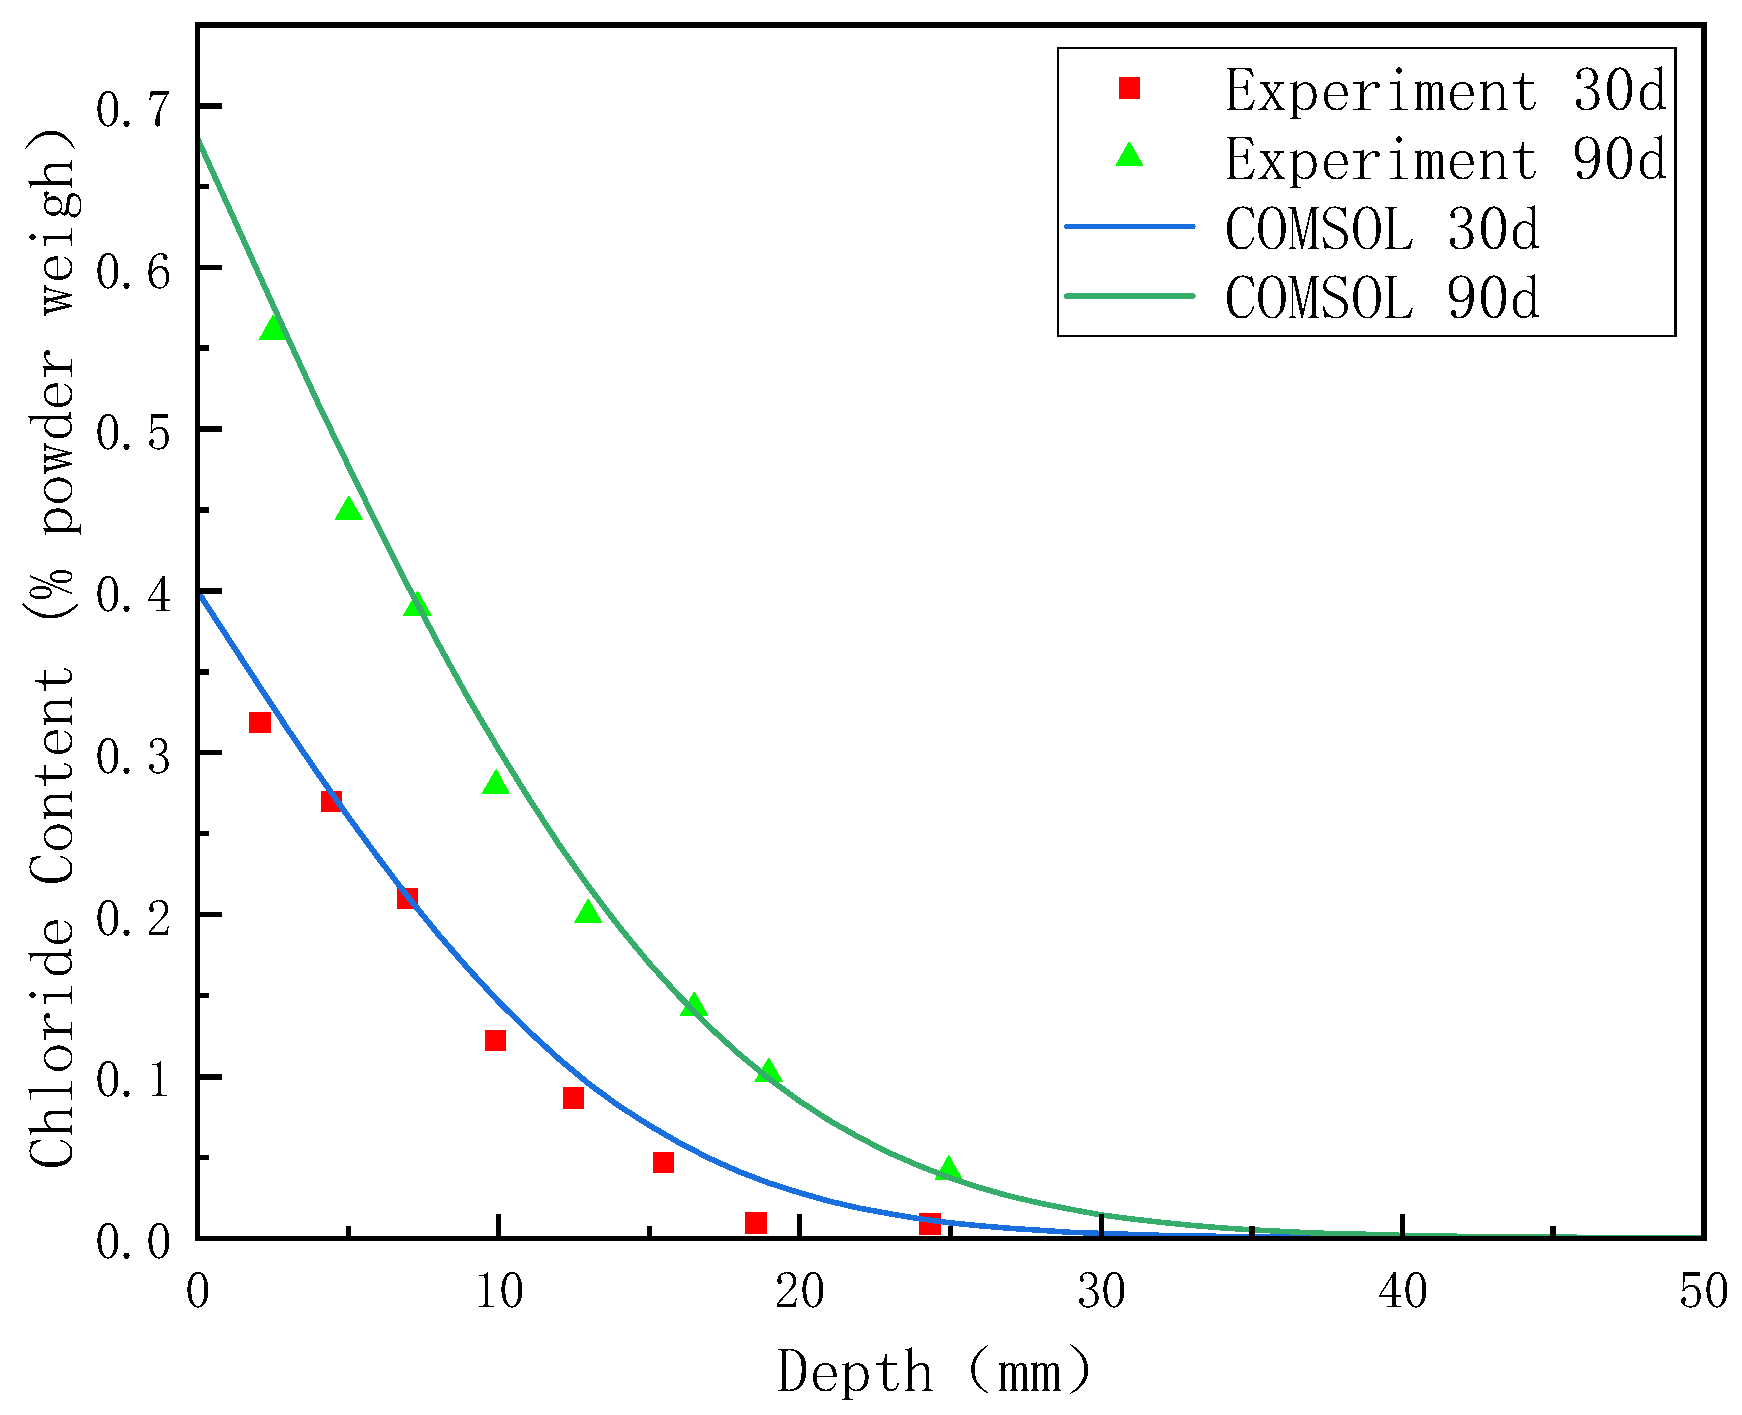
3.2. Validation of the Simulation Model
4. Simulation Results and Discussion
4.1. Crack Location Parameters
4.2. Crack Angle Parameters
4.3. Crack Width Coefficient and Crack Length Coefficient
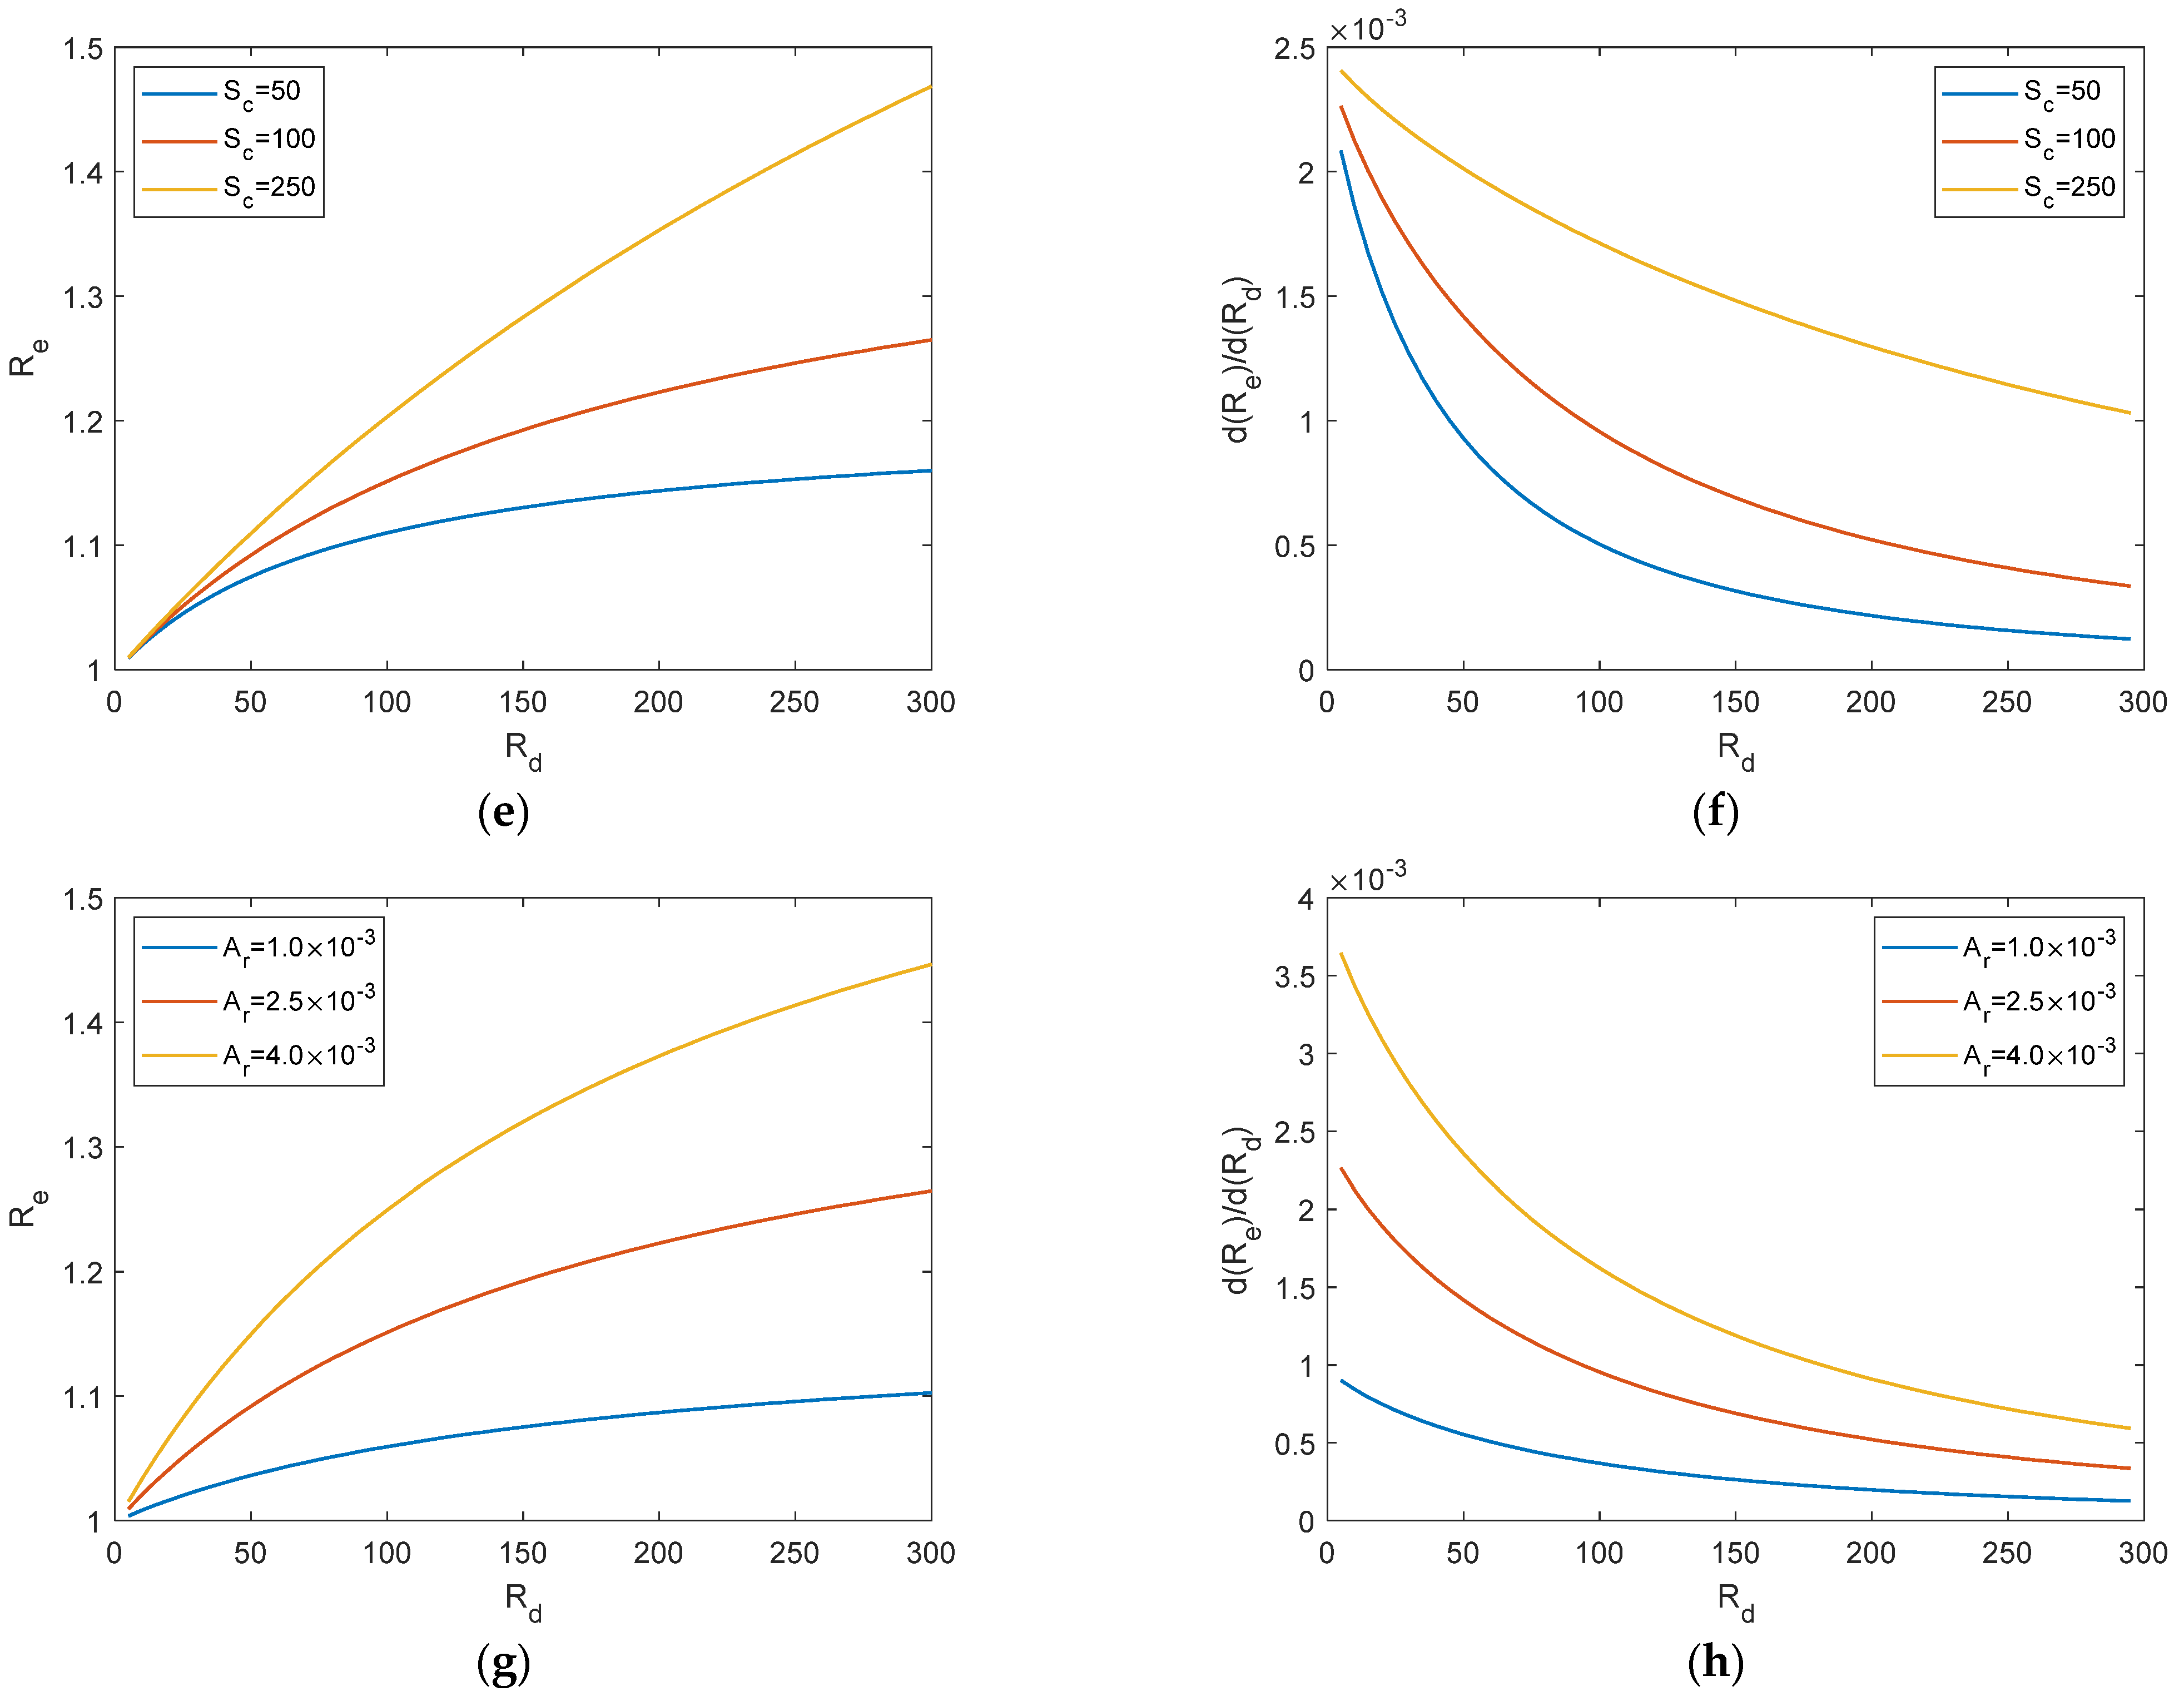
4.4. The Aspect Ratio of the Crack and Crack Area Ratio
4.5. Dimensionless Crack Diffusion Coefficient
4.6. Crack Frequency
4.7. The Theoretical Solution for the Equivalent Diffusion Coefficient
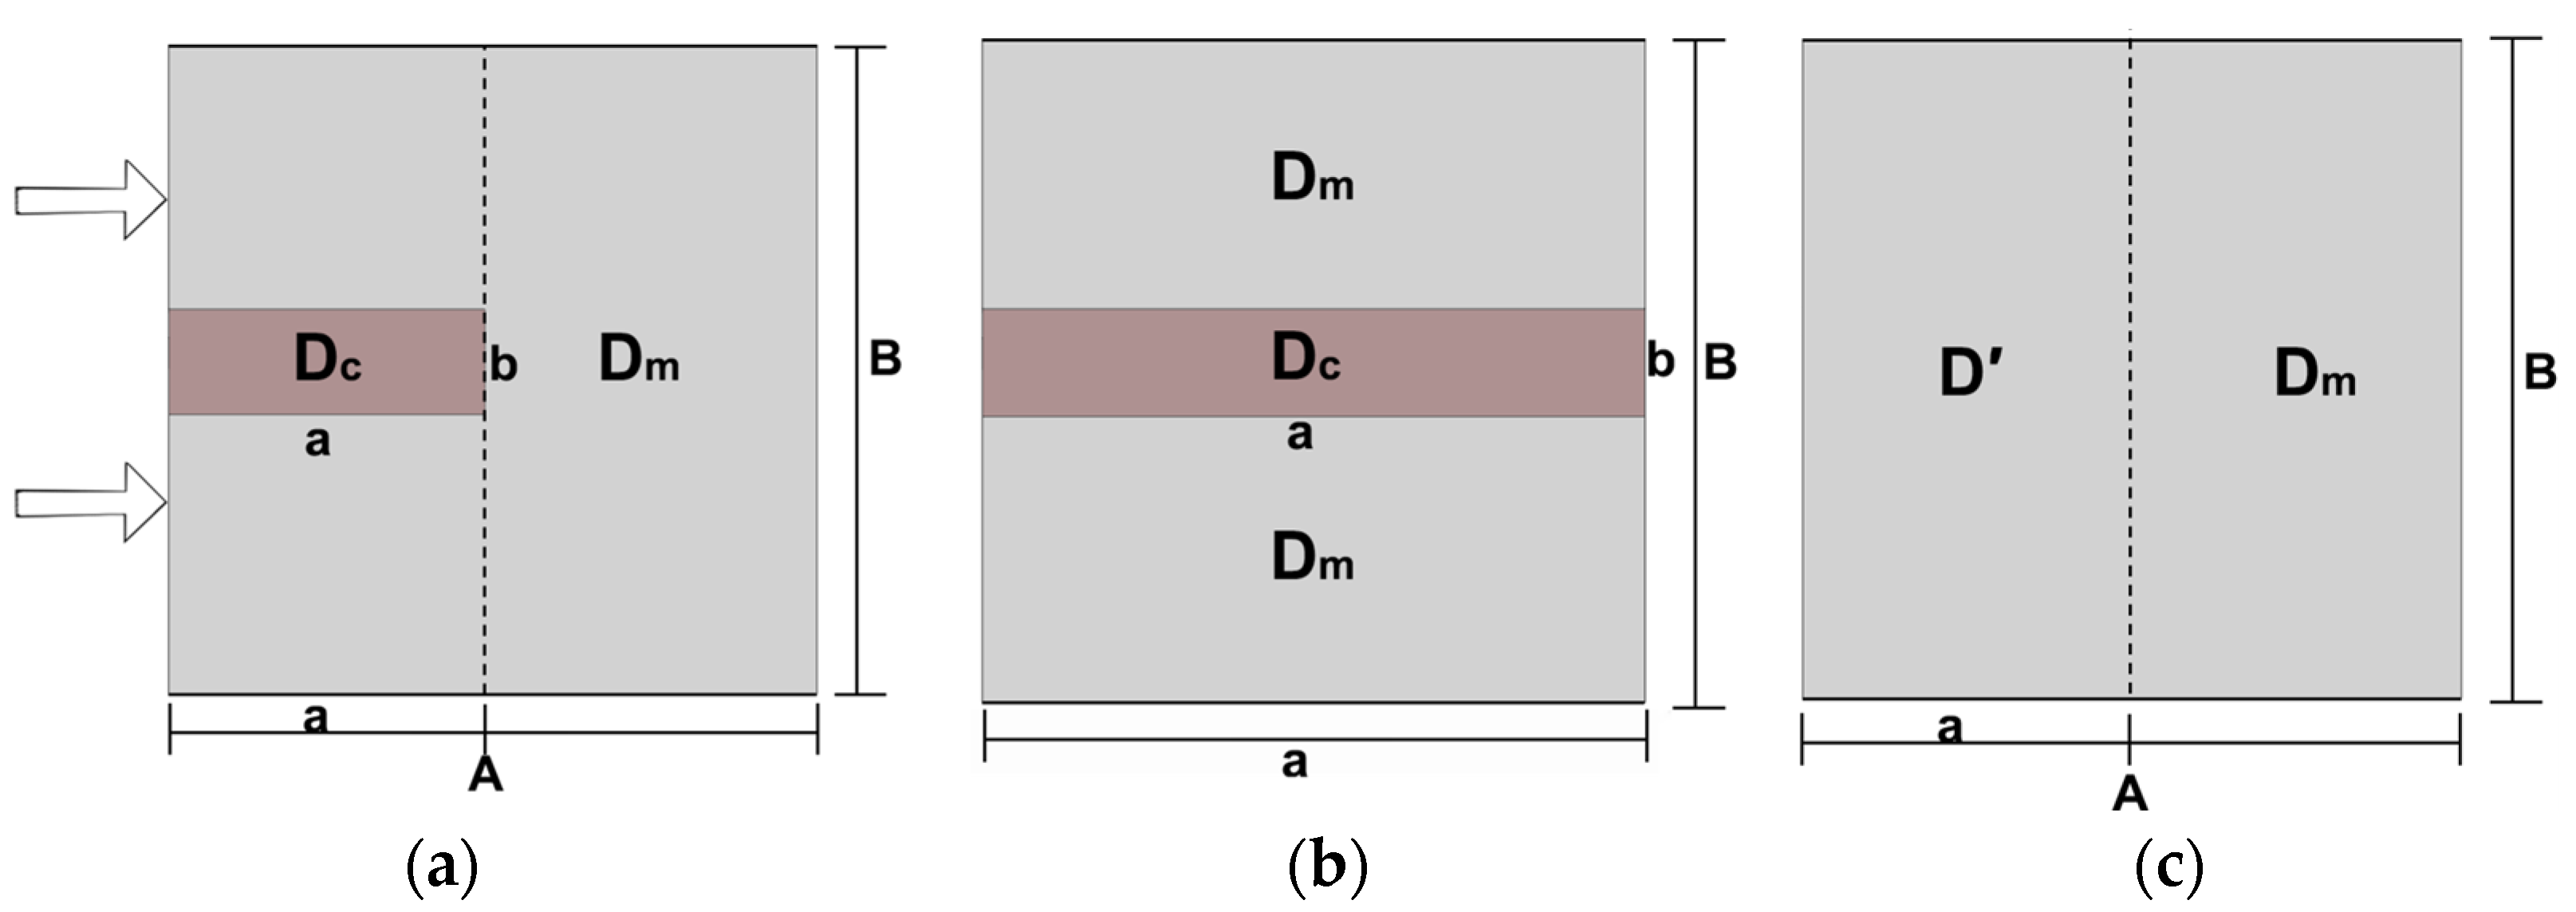
4.7.1. Parallel Model and Series Model
4.7.2. Verification of Theoretical Solutions
5. Conclusions
- (1)
- When the crack position varies along the x-direction, the change in the equivalent diffusion coefficient in the middle portion of the concrete is gradual, while it rapidly increases near the left and right boundaries. When the crack position varies along the y-direction, the trend is opposite to that of the x-direction. In the middle portion, the equivalent diffusion coefficient changes gradually, while it rapidly decreases near the top and bottom boundaries. Generally, cracks pose the greatest threat to concrete when they are close to the inlet and outlet surfaces, and the least threat when they are close to the top and bottom boundaries. The impact on concrete is relatively small when cracks move in the middle positions.
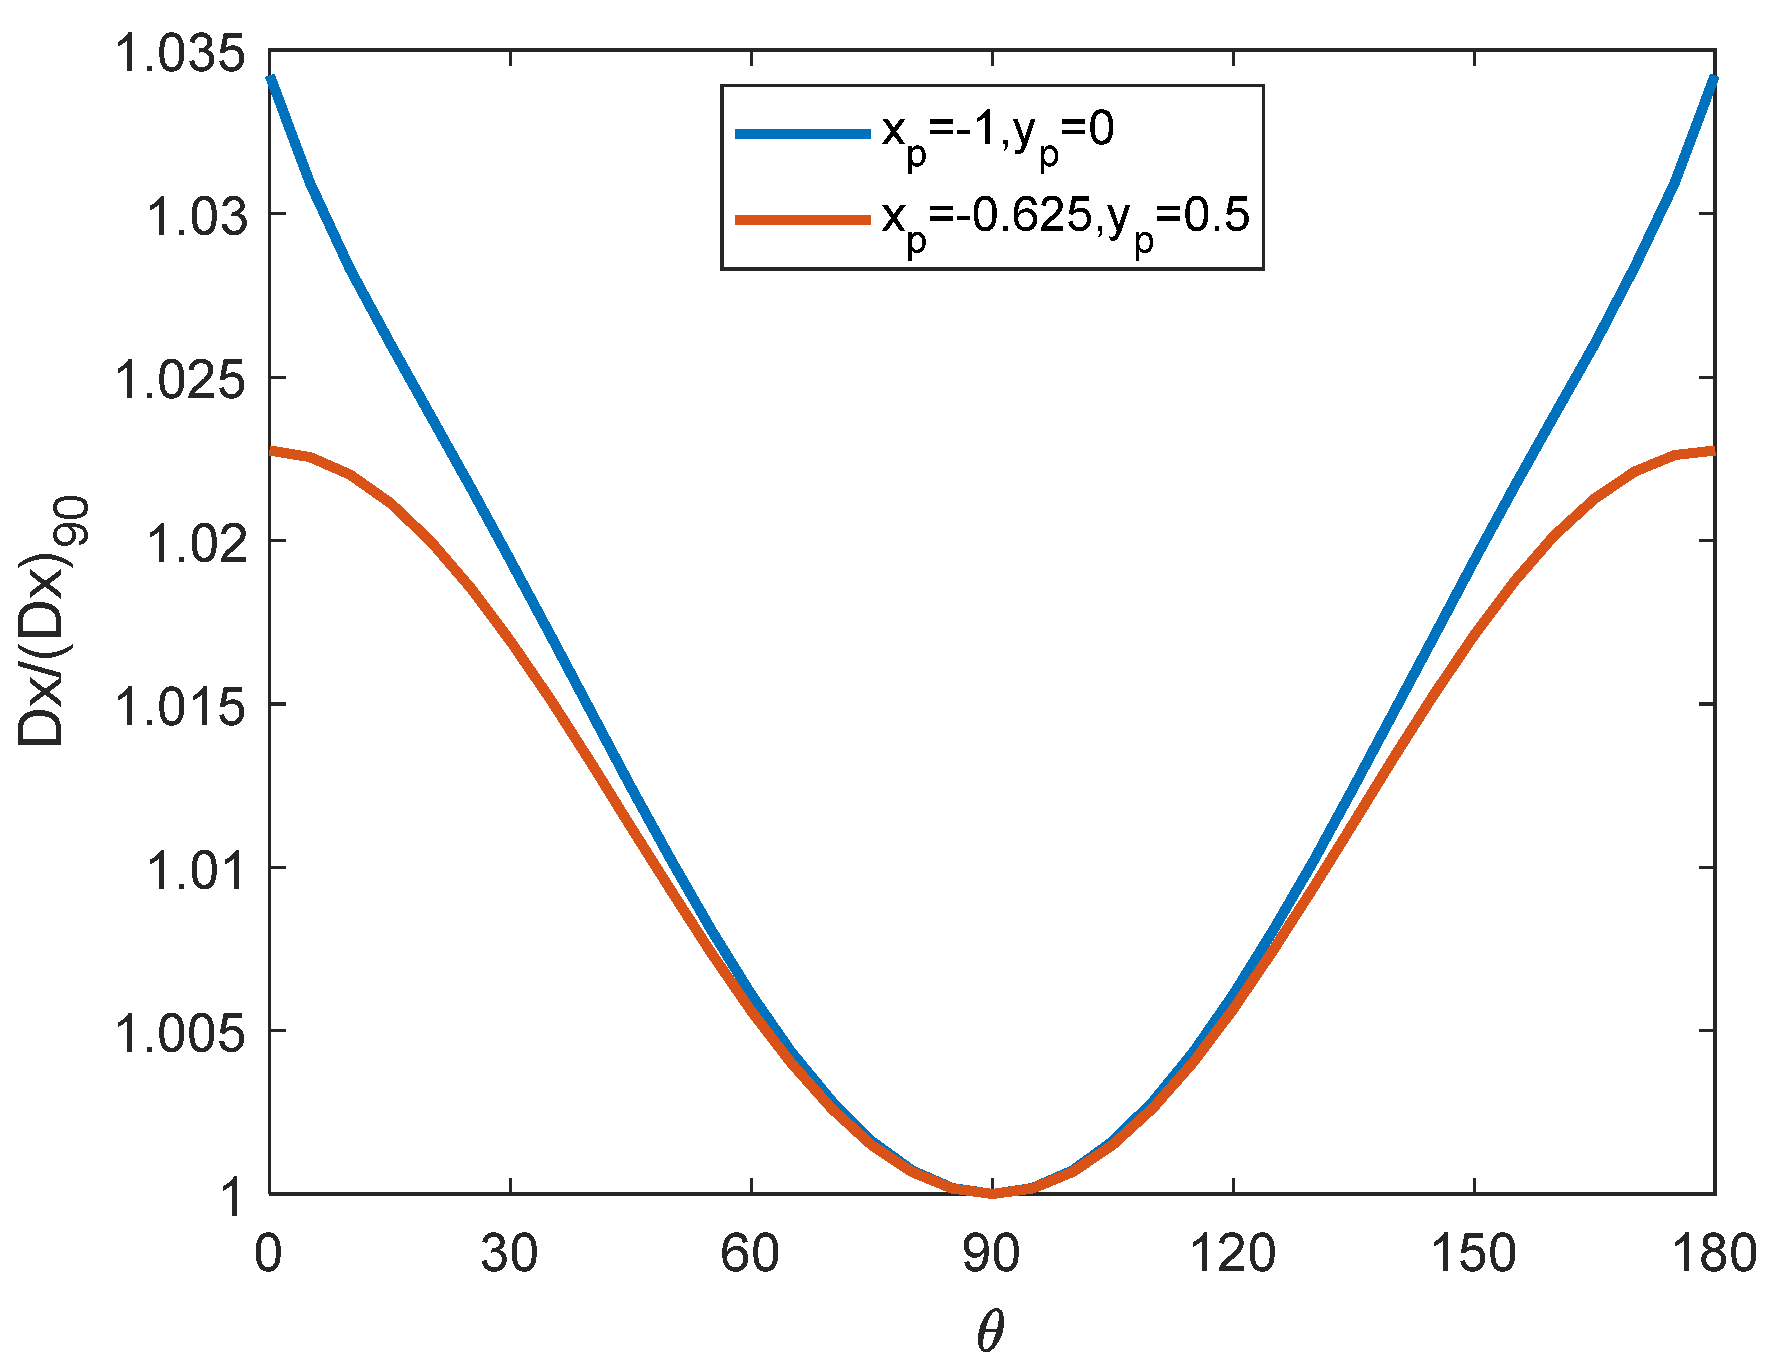
- (2)
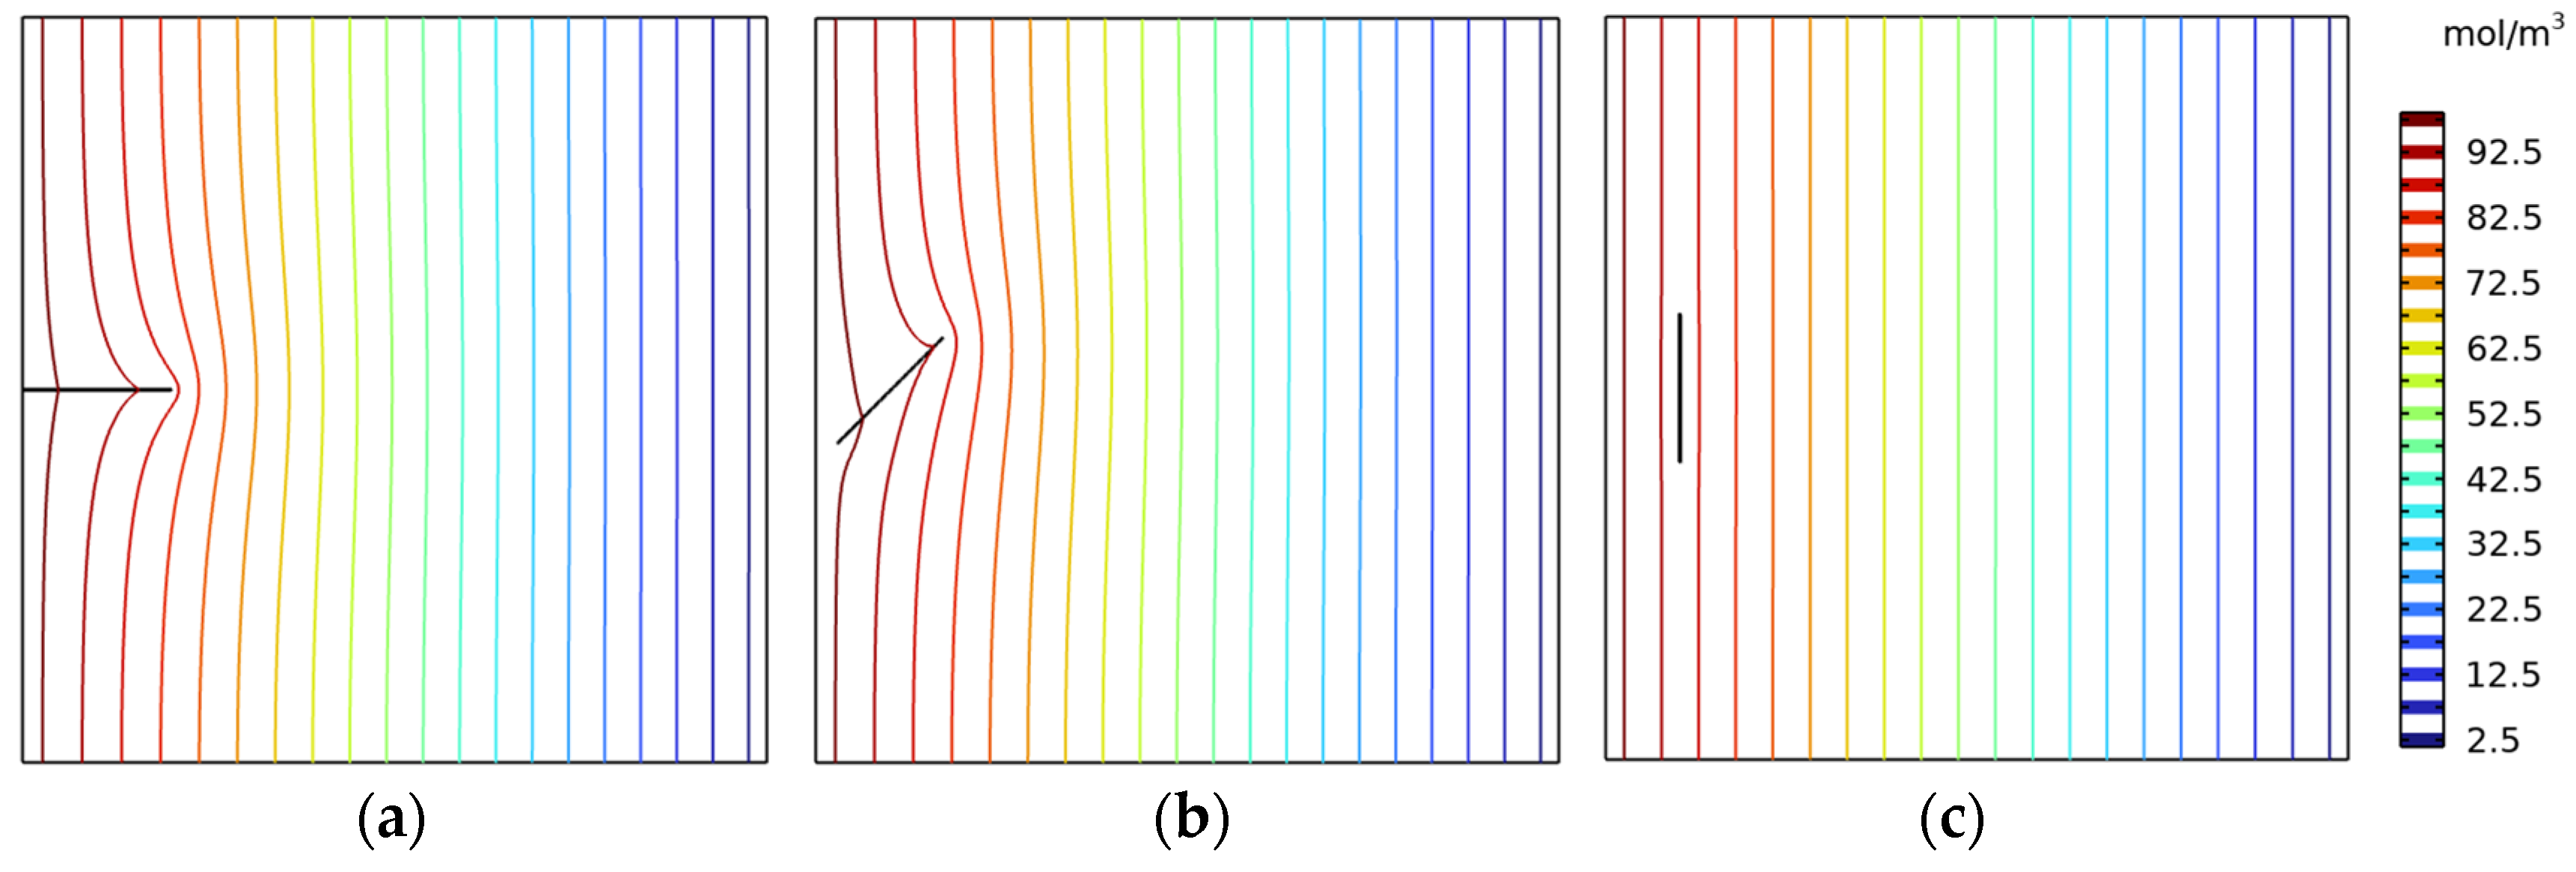
- Under the influence of the crack angle, when θ = 90° (i.e., the crack is perpendicular to the direction of chloride ion diffusion), the damage to concrete is minimized. However, when θ = 0° or θ = 180° (i.e., the crack is parallel to the direction of chloride ion diffusion), the damage to concrete is maximized.
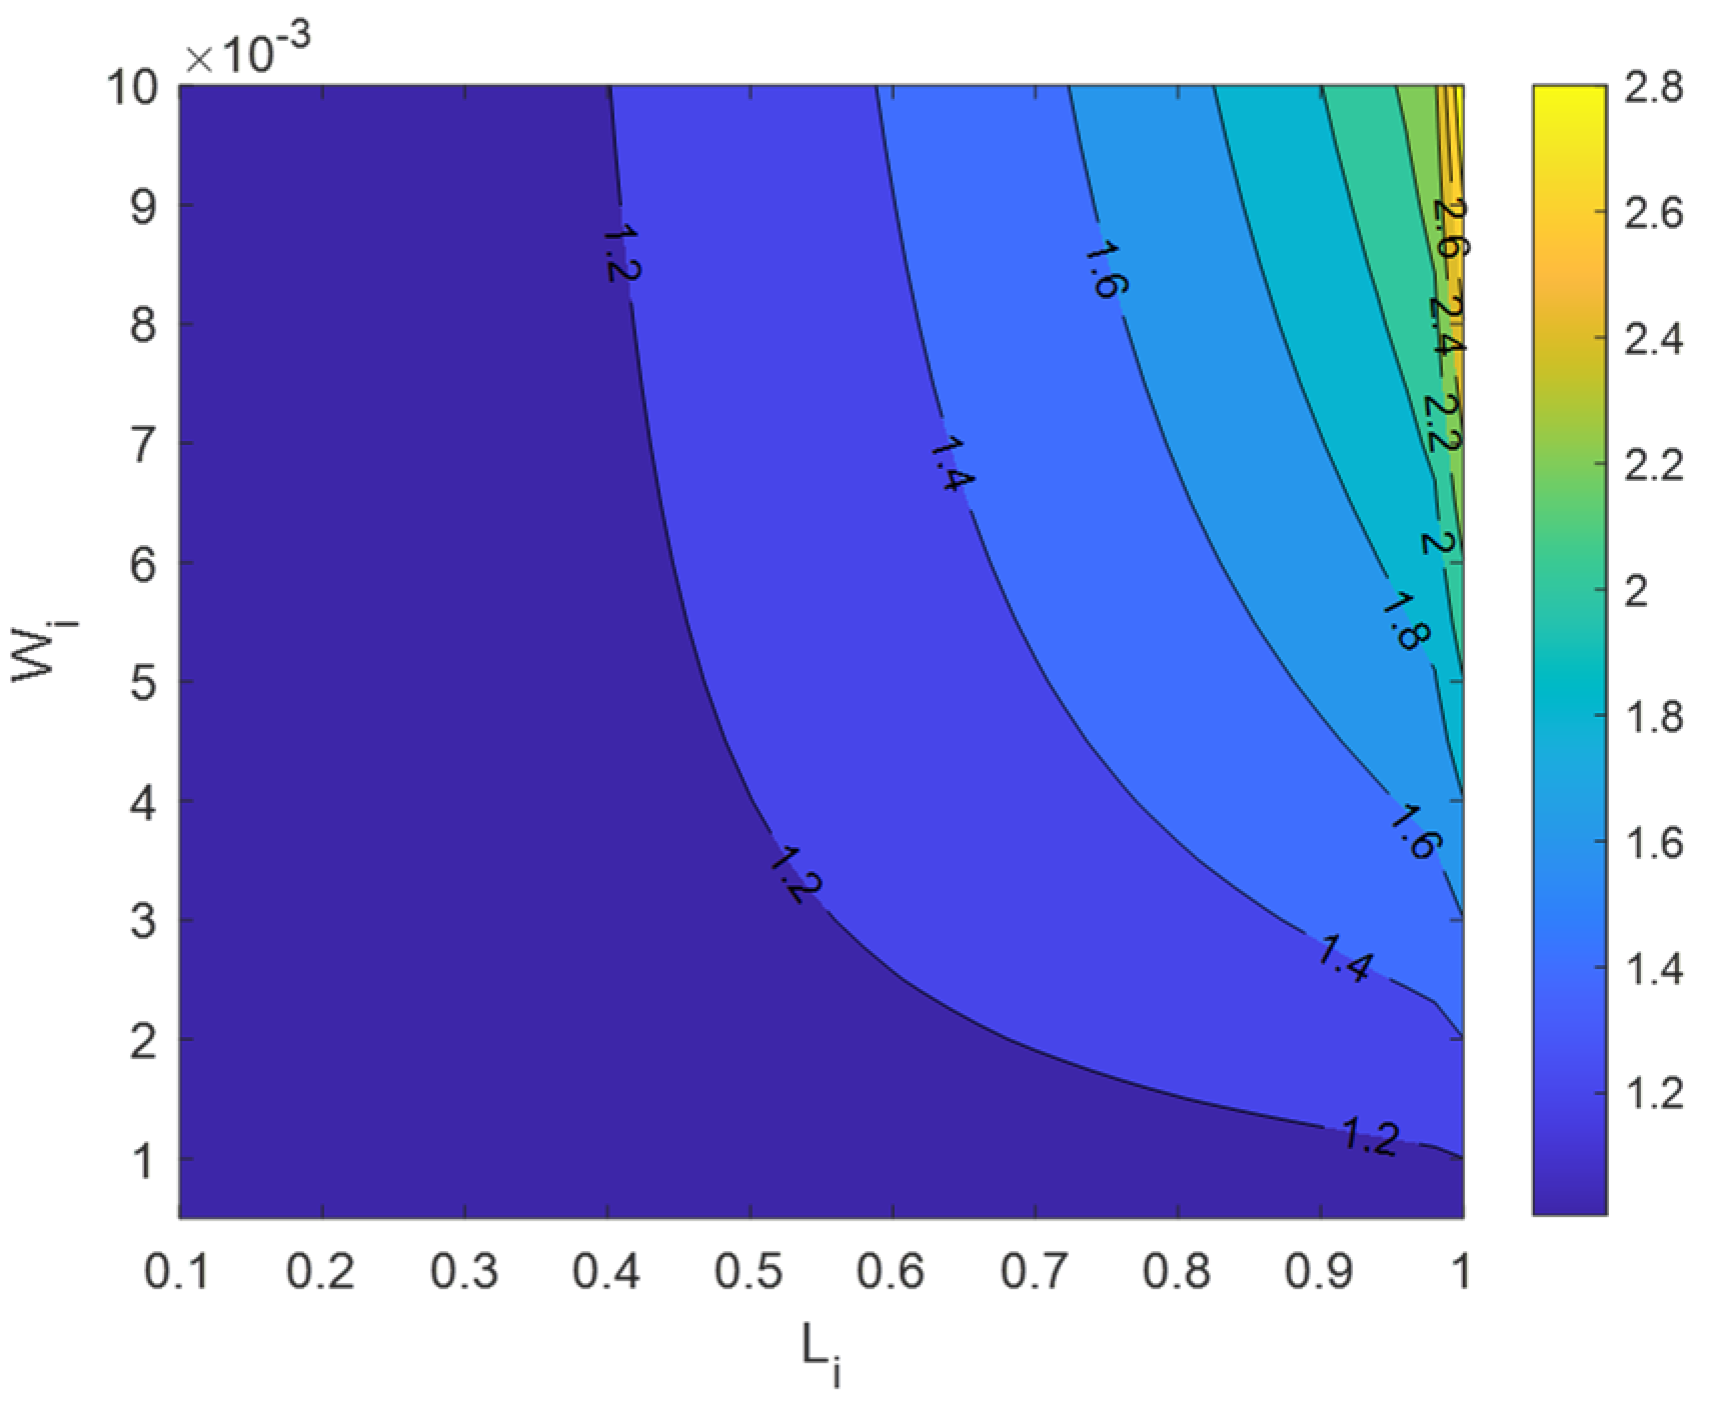
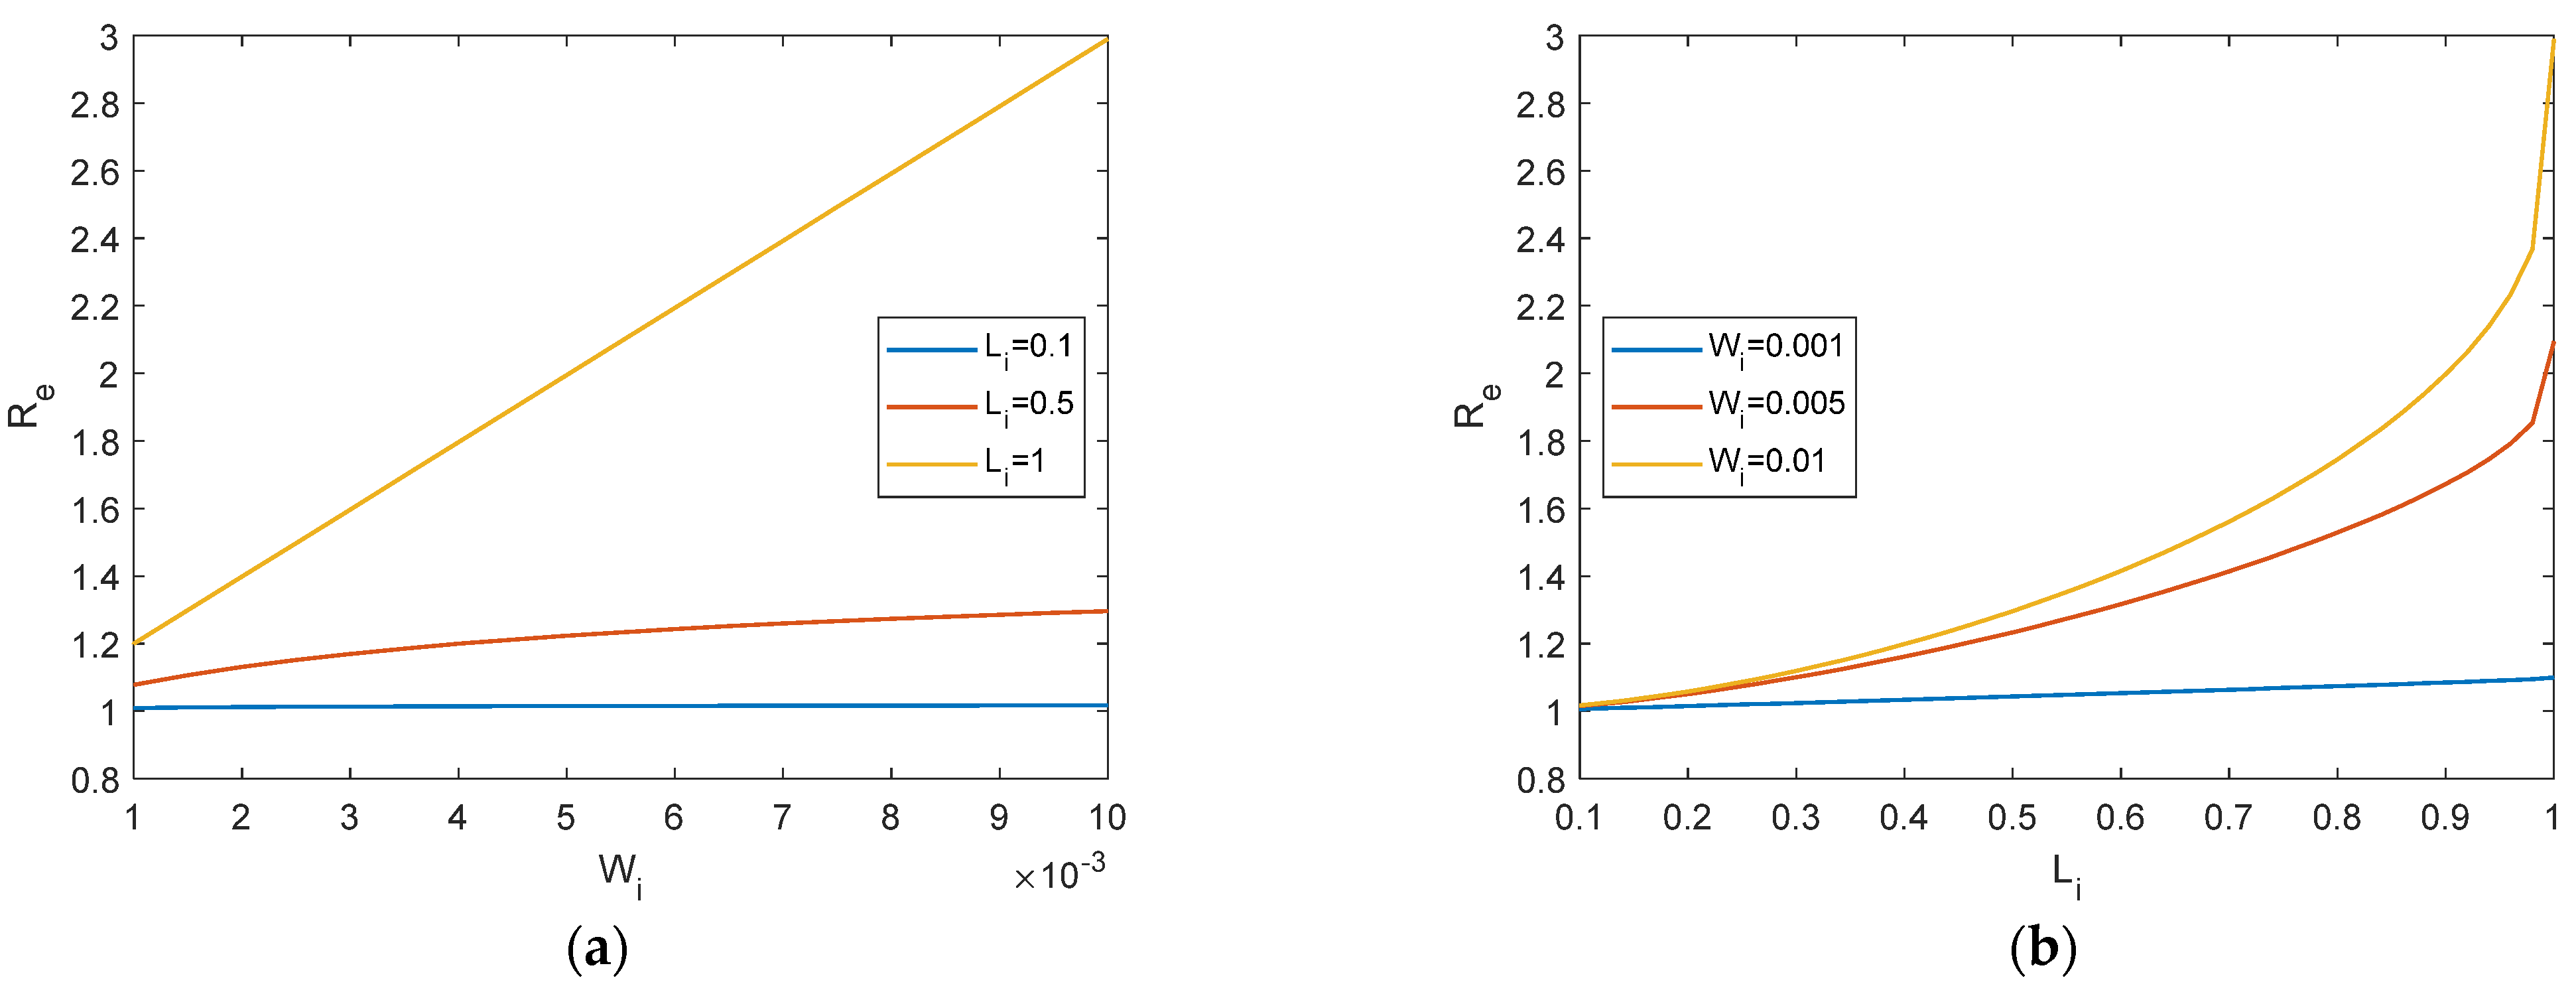
- (3)
- When the crack length is about to penetrate the concrete, the equivalent diffusion coefficient of cracked concrete increases sharply. Under the condition of equal crack area, the thinner and longer the crack, and the greater the equivalent diffusion coefficient of cracked concrete. The increase in the equivalent diffusion coefficient of cracked concrete is non-linear with the increase in the crack diffusion coefficient, and the trend of increase gradually diminishes. Different crack structural parameters lead to different trends in the variation in the equivalent diffusion coefficient of cracked concrete with the crack diffusion coefficient.
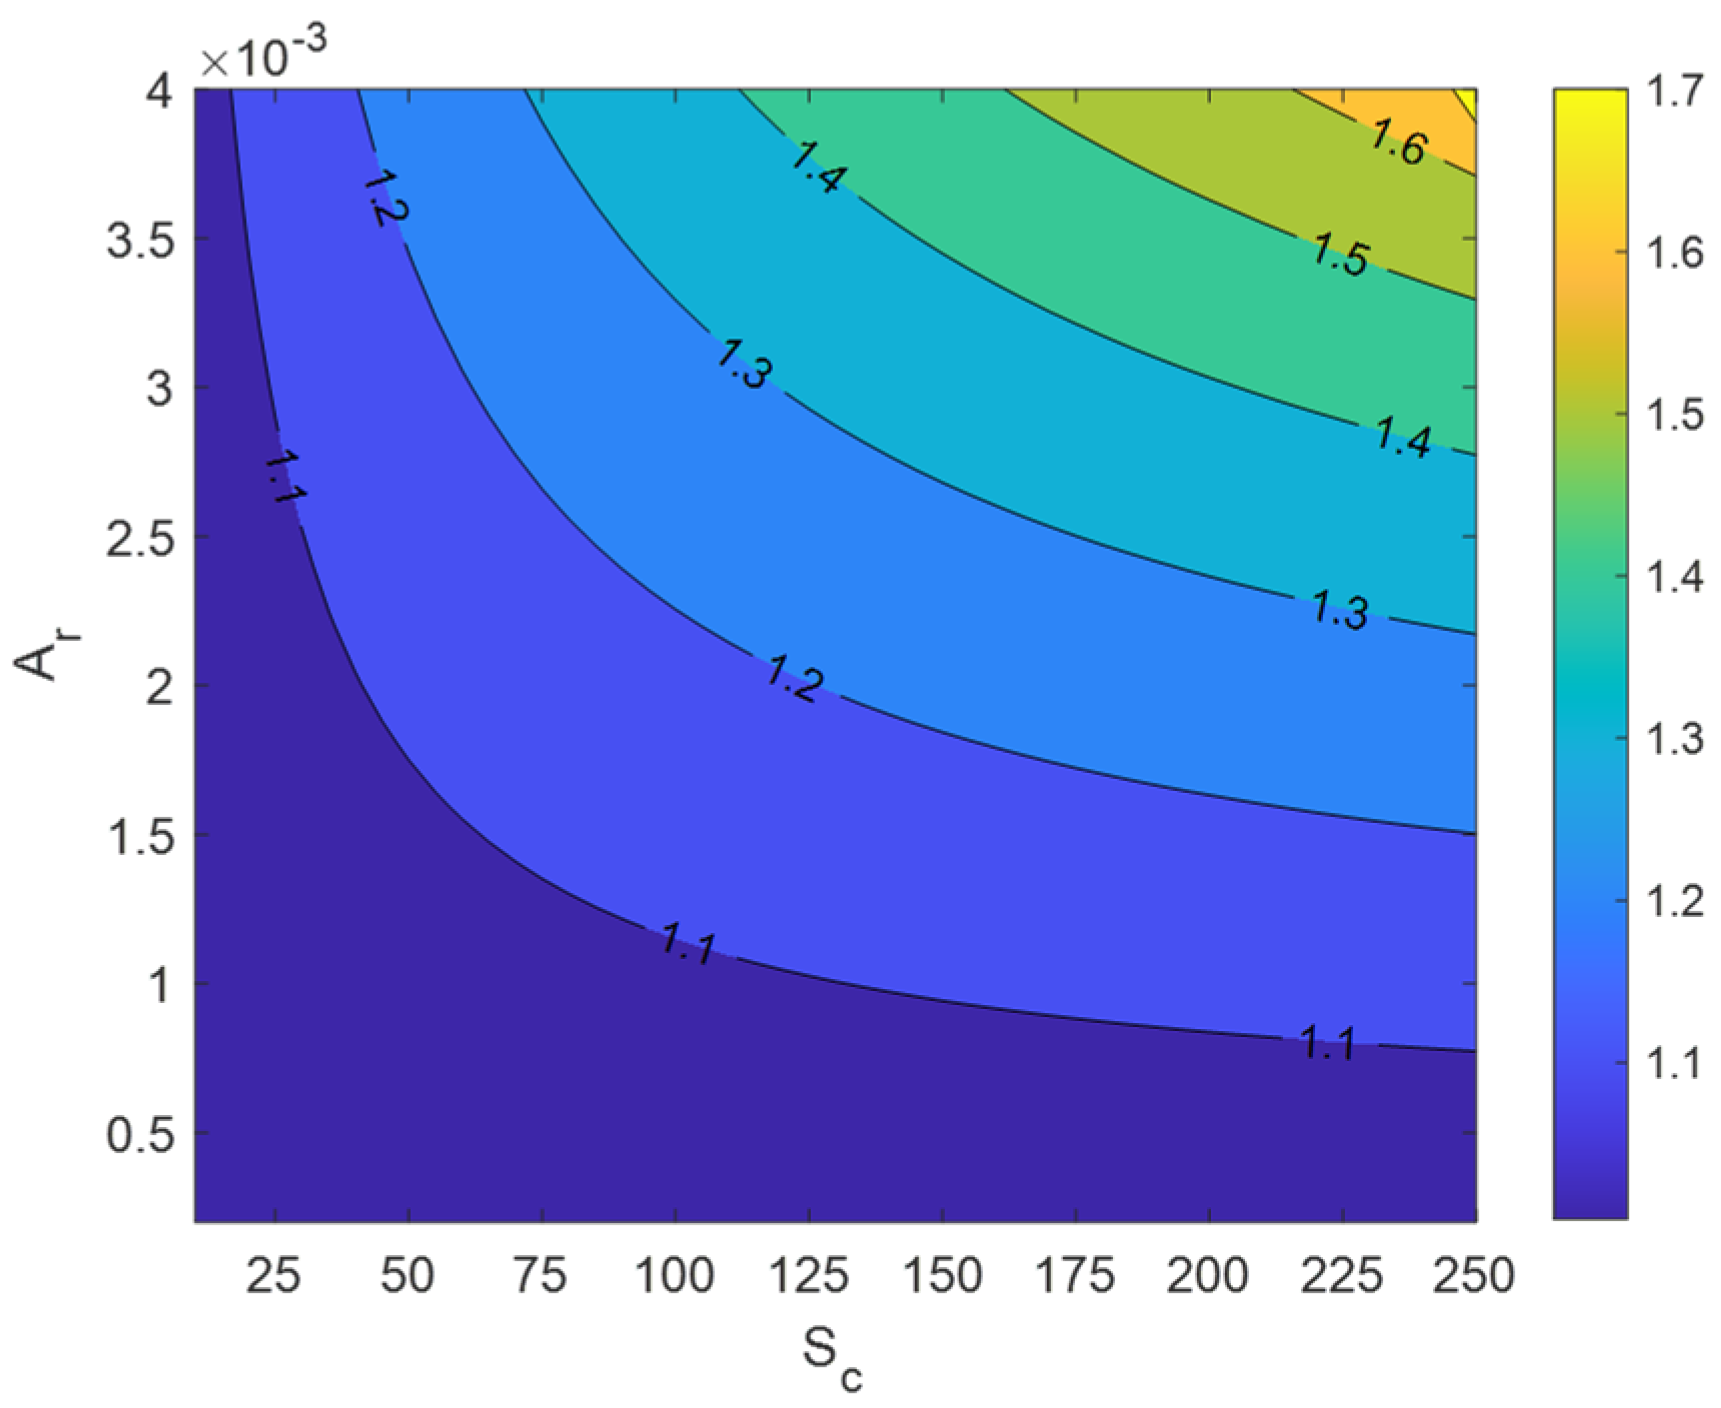
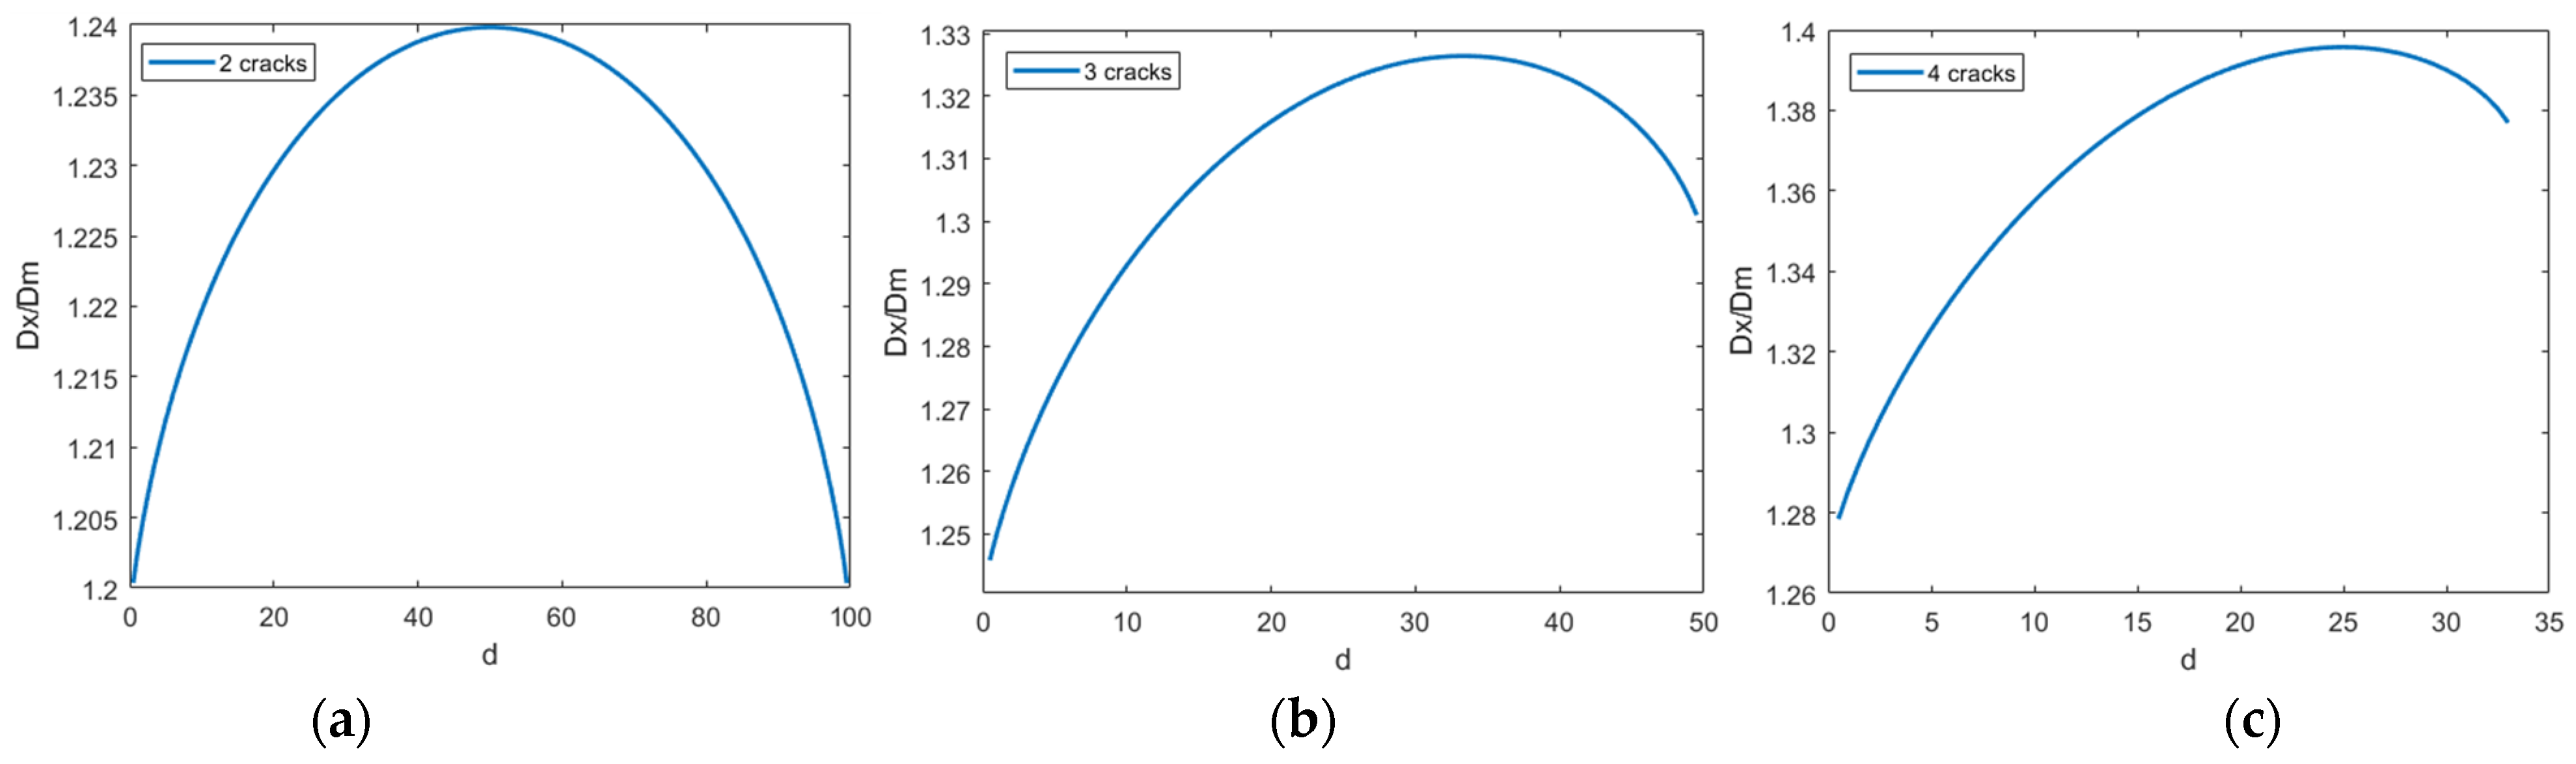
- (4)
- Through studying multiple cracks, the following pattern is discovered. When the side length of concrete is B and the number of cracks is n (n ≥ 2), if the spacing between cracks is located at B/n, and the distance between the cracks at the top and bottom ends and the concrete edge is B/2n, the equivalent diffusion coefficient reaches its maximum value. At this point, the damage to the concrete is maximized.
- (5)
- Based on Fick’s diffusion law, a theoretical model for the equivalent diffusion coefficient of cracked concrete was established. A comparison between theoretical and numerical solutions shows that the maximum error in the equivalent diffusion coefficient calculated using the “parallel-then-series” model is 4.4%, while for the “series-then-parallel” model, it is 13.2%. Both models can effectively predict the equivalent diffusion coefficient of cracked concrete in real projects, with the “parallel-then-series” model exhibiting higher accuracy.
Author Contributions
Funding
Data Availability Statement
Acknowledgments
Conflicts of Interest
References
- Liang, Y.; Zhao, F.; Luo, J.; Chen, P. Study on time-varying seismic vulnerability and analysis of ECC-RC composite piers using high strength reinforcement bars in offshore environment. Earthq. Eng. Eng. Vib. 2022, 21, 1035–1051. [Google Scholar] [CrossRef]
- Miyandehi, B.M.; Feizbakhsh, A.; Yazdi, M.A.; Liu, Q.; Yang, J.; Alipour, P. Performance and properties of mortar mixed with nano-CuO and rice husk ash. Cem. Concr. Compos. 2016, 74, 225–235. [Google Scholar] [CrossRef]
- Kalantari, S.; Diznab, M.A.D.; Tehrani, F.M. Sustainability of internally-cured concrete for mitigating shrinkage cracking using service life prediction models. In Proceedings of the International RILEM Conference on Early-Age and Long-Term Cracking in RC Structures; Kanavaris, F., Benboudjema, F., Azenha, M., Eds.; Springer International Publishing: Cham, Switzerland, 2021; pp. 277–289. [Google Scholar]
- Da, B.; Yu, H.; Ma, H.; Tan, Y.; Mi, R.; Dou, X. Chloride diffusion study of coral concrete in a marine environment. Constr. Build. Mater. 2016, 123, 47–58. [Google Scholar] [CrossRef]
- Wang, H.; Jin, K.; Zhang, A.; Zhang, L.; Han, Y.; Liu, J.; Shi, F.; Feng, L. External erosion of sodium chloride on the degradation of self-sensing and mechanical properties of aligned stainless steel fiber reinforced reactive powder concrete. Constr. Build. Mater. 2021, 287, 123028. [Google Scholar] [CrossRef]
- Huang, D.; Niu, D.; Zheng, H.; Su, L.; Luo, D.; Fu, Q. Study on chloride transport performance of eco-friendly coral aggregate concrete in marine environment. Constr. Build. Mater. 2020, 258, 120272. [Google Scholar] [CrossRef]
- Shen, D.; Liu, X.; Zeng, X.; Zhao, X.; Jiang, G. Effect of polypropylene plastic fibers length on cracking resistance of high performance concrete at early age. Constr. Build. Mater. 2020, 244, 117874. [Google Scholar] [CrossRef]
- Dai, L.; Bian, H.; Wang, L.; Potier-Ferry, M.; Zhang, J. Prestress loss diagnostics in pretensioned concrete structures with corrosive cracking. J. Struct. Eng. 2020, 146, 04020013. [Google Scholar] [CrossRef]
- Gérard, B.; Marchand, J. Influence of cracking on the diffusion properties of cement-based materials: Part I: Influence of continuous cracks on the steady-state regime. Cem. Concr. Res. 2000, 30, 37–43. [Google Scholar] [CrossRef]
- Li, Y.; Chen, X.; Zhang, G. A study on effects of water-cement ratio and crack width on chloride ion transmission rate in concrete. Comput. Concr. 2017, 19, 387–394. [Google Scholar] [CrossRef]
- Li, G.; Zhou, Q.; Wang, W.; Lu, C.; Chen, C.; Guo, Z.; Lu, C. Chloride diffusion along the interface between concrete matrix and repair materials under flexural loading. Constr. Build. Mater. 2023, 372, 130829. [Google Scholar] [CrossRef]
- Li, W.; Liu, W.; Wang, S. The effect of crack width on chloride-induced corrosion of steel in concrete. Adv. Mater. Sci. Eng. 2017, 2017, 1–11. [Google Scholar] [CrossRef]
- Djerbi, A.; Bonnet, S.; Khelidj, A.; Baroghel-bouny, V. Influence of traversing crack on chloride diffusion into concrete. Cem. Concr. Res. 2008, 38, 877–883. [Google Scholar] [CrossRef]
- Jang, S.Y.; Kim, B.S.; Oh, B.H. Effect of crack width on chloride diffusion coefficients of concrete by steady-state migration tests. Cem. Concr. Res. 2011, 41, 9–19. [Google Scholar] [CrossRef]
- Lv, L.-S.; Wang, J.-Y.; Xiao, R.-C.; Fang, M.-S.; Tan, Y. Chloride ion transport properties in microcracked ultra-high performance concrete in the marine environment. Constr. Build. Mater. 2021, 291, 123310. [Google Scholar] [CrossRef]
- Wang, W.; Wu, J.; Wang, Z.; Wu, G.; Zou, Z. Influence of uniaxial tensile loading on the chloride diffusivity coefficient of recycled aggregate concrete. Eur. J. Environ. Civ. Eng. 2020, 24, 2329–2341. [Google Scholar] [CrossRef]
- Lin, Z.; Kanwal, H.; Hao, W. Effects of crack width and healing time on healing performance of microcapsule-based self-healing concrete. J. Test. Eval. 2022, 50, 2043–2053. [Google Scholar] [CrossRef]
- Gagné, R.; François, R.; Masse, P. Chloride penetration testing of cracked mortar samples. Concr. Under Sev. Cond. 2001, 1, 198–205. [Google Scholar]
- Abdalla, H.M.; Karihaloo, B.L. Determination of size-independent specific fracture energy of concrete from three-point bend and wedge splitting tests. Mag. Concr. Res. 2003, 55, 133–141. [Google Scholar] [CrossRef]
- Şahmaran, M. Effect of flexure induced transverse crack and self-healing on chloride diffusivity of reinforced mortar. J. Mater. Sci. 2007, 42, 9131–9136. [Google Scholar] [CrossRef]
- Bentz, D.P.; Garboczi, E.J.; Lu, Y.; Martys, N.; Sakulich, A.R.; Weiss, W.J. Modeling of the influence of transverse cracking on chloride penetration into concrete. Cem. Concr. Compos. 2013, 38, 65–74. [Google Scholar] [CrossRef]
- Liu, Q.; Yang, J.; Xia, J.; Easterbrook, D.; Li, L.; Lu, X.-Y. A numerical study on chloride migration in cracked concrete using multi-component ionic transport models. Comput. Mater. Sci. 2015, 99, 396–416. [Google Scholar] [CrossRef]
- Liu, Q.; Hu, Z.; Wang, X.; Zhao, H.; Qian, K.; Li, L.; Meng, Z. Numerical study on cracking and its effect on chloride transport in concrete subjected to external load. Constr. Build. Mater. 2022, 325, 126797. [Google Scholar] [CrossRef]
- Wu, T.; De Lorenzis, L. A phase-field approach to fracture coupled with diffusion. Comput. Methods Appl. Mech. Eng. 2016, 312, 196–223. [Google Scholar] [CrossRef]
- De Maio, U.; Greco, F.; Lonetti, P.; Pranno, A. A combined ALE-cohesive fracture approach for the arbitrary crack growth analysis. Eng. Fract. Mech. 2024, 301, 109996. [Google Scholar] [CrossRef]
- Šavija, B.; Pacheco, J.; Schlangen, E. Lattice modeling of chloride diffusion in sound and cracked concrete. Cem. Concr. Compos. 2013, 42, 30–40. [Google Scholar] [CrossRef]
- Šavija, B.; Luković, M.; Schlangen, E. Lattice modeling of rapid chloride migration in concrete. Cem. Concr. Res. 2014, 61–62, 49–63. [Google Scholar] [CrossRef]
- Du, X.; Jin, L.; Zhang, R.; Li, Y. Effect of cracks on concrete diffusivity: A meso-scale numerical study. Ocean Eng. 2015, 108, 539–551. [Google Scholar] [CrossRef]
- Cheng, Y.; Zhang, Y.; Wu, C.; Jiao, Y. Experimental and simulation study on diffusion behavior of chloride ion in cracking concrete and reinforcement corrosion. Adv. Mater. Sci. Eng. 2018, 2018, 1–14. [Google Scholar] [CrossRef]
- Yu, S.; Jin, H. Modeling of the corrosion-induced crack in concrete contained transverse crack subject to chloride ion penetration. Constr. Build. Mater. 2020, 258, 119645. [Google Scholar] [CrossRef]
- Du, X.; Jin, L.; Ma, G. A meso-scale numerical method for the simulation of chloride diffusivity in concrete. Finite Elem. Anal. Des. 2014, 85, 87–100. [Google Scholar] [CrossRef]
- Zhao, R.; Wang, M.; Guan, X. Exploring exact effects of various factors on chloride diffusion in cracked concrete: ABAQUS-based mesoscale simulations. Materials 2023, 16, 2830. [Google Scholar] [CrossRef] [PubMed]
- Walraven, J.C.; Reinhardt, H.W. Theory and experiments on the mechanical behavior of cracks in plain and reinforced concrete subjected to shear loading. Heron J. 1981, 82, 25417. [Google Scholar]
- Lu, B.; Shi, C.; Cao, Z.; Guo, M.; Zheng, J. Effect of carbonated coarse recycled concrete aggregate on the properties and microstructure of recycled concrete. J. Clean. Prod. 2019, 233, 421–428. [Google Scholar] [CrossRef]
- Peng, J.; Hu, S.; Zhang, J.; Cai, C.S.; Li, L. Influence of cracks on chloride diffusivity in concrete: A five-phase mesoscale model approach. Constr. Build. Mater. 2019, 197, 587–596. [Google Scholar] [CrossRef]
- Chen, X.; Yu, A.; Liu, G.; Chen, P.; Liang, Q. A multi-phase mesoscopic simulation model for the diffusion of chloride in concrete under freeze–thaw cycles. Constr. Build. Mater. 2020, 265, 120223. [Google Scholar] [CrossRef]
- Wang, L.; Soda, M.; Ueda, T. Simulation of chloride diffusivity for cracked concrete based on RBSM and truss network model. J. Adv. Concr. Technol. 2008, 6, 143–155. [Google Scholar] [CrossRef]
- Lyu, K.; She, W.; Chang, H.; Gu, Y. Effect of fine aggregate size on the overlapping of interfacial transition zone (ITZ) in mortars. Constr. Build. Mater. 2020, 248, 118559. [Google Scholar] [CrossRef]
- Yang, C.-C.; Weng, S.-H. A Three-phase model for predicting the effective chloride migration coefficient of ITZ in cement-based materials. Mag. Concr. Res. 2013, 65, 193–201. [Google Scholar] [CrossRef]
- Jiang, J.; Sun, G.; Wang, C. Numerical calculation on the porosity distribution and diffusion coefficient of interfacial transition zone in cement-based composite materials. Constr. Build. Mater. 2013, 39, 134–138. [Google Scholar] [CrossRef]


| Four-Phase Model | Two-Phase Model | |
|---|---|---|
| Constitute | Mortar matrix, coarse aggregates, ITZ, cracks. | Mortar matrix, cracks. |
| Advantages | The influences of the four phases on the diffusion properties of concrete can be considered. The study on ion transport can delve into a microscopic level, enabling analysis of the distribution and transport processes of ions in localized regions of concrete. | Only the influence of the two phases on the diffusion properties of concrete can be considered. The study of ion transport is limited to a macroscopic level, allowing analysis of the distribution and transport patterns of ions in the entirety of concrete. |
| Disadvantages | Modeling complexity, large computational requirements, and required parameters are numerous and difficult to obtain. | Simple modeling, low computational effort, fewer parameters required. |
| Four-Phase Model | Two-Phase Model | |
|---|---|---|
| Aggregate size range () | 5 mm–15 mm | |
| Aggregate volume fraction () | 50% | |
| Interface transition zone thickness () | 100 μm | |
| Diffusion coefficient in the interfacial transition zone ) | ||
| Mortar diffusion coefficient ) | ||
| Crack diffusion coefficient ) |
| Four-Phase Model | Two-Phase Model | |
|---|---|---|
| ) |
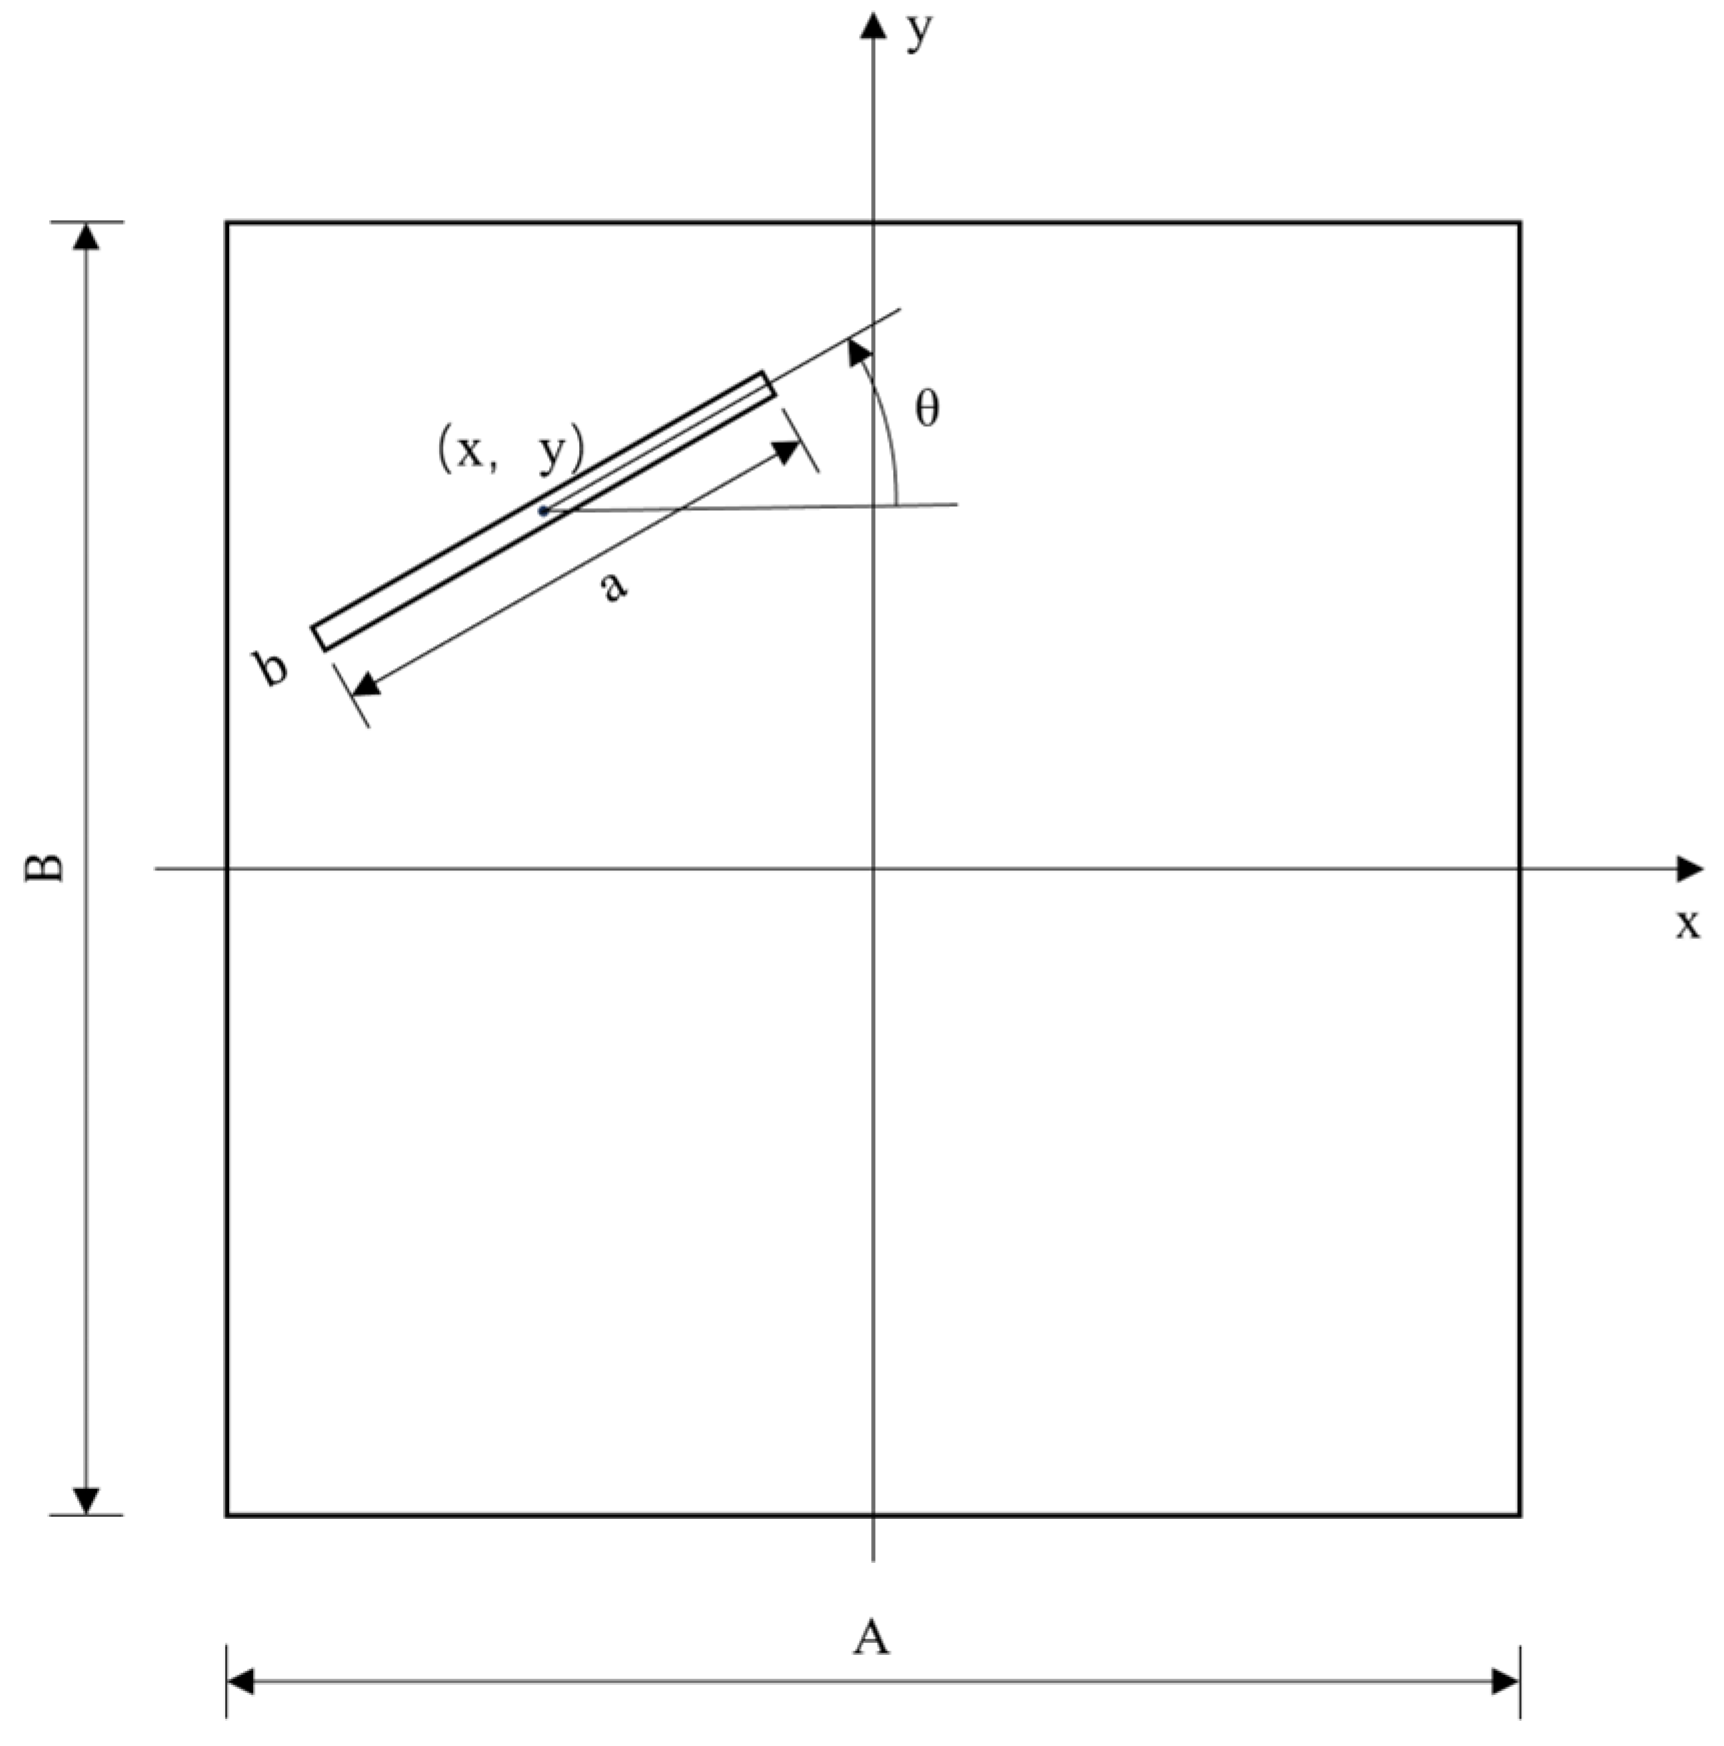
| Parameters | Connotation |
|---|---|
| Length of the concrete matrix | |
| Width of the concrete matrix | |
| Length of the crack | |
| Width of the crack | |
| Angle rotated counterclockwise from the positive x-axis to the major axis of the crack | |
| Coordinates of the center of the crack | |
| Maximum distances from the crack center to the y-axis and the x-axis | |
| Diffusion coefficient of the concrete matrix | |
| Diffusion coefficient of the crack | |
| Equivalent diffusion coefficient in the x-direction for concrete containing cracks |
| Dimensionless Parameters | Formulas |
|---|---|
| Crack location parameters | |
| Crack angle | |
| Crack width | |
| Crack length coefficient | |
| Aspect ratio of the crack | |
| Crack area ratio | |
| Dimensionless crack diffusion coefficient | |
| Dimensionless equivalent diffusion coefficient |
| Parallel Model | Series Model | ||||
|---|---|---|---|---|---|
| Theoretical Solution (m2/s) | Real Value (m2/s) | Errors (%) | Theoretical Solution (m2/s) | Real Value (m2/s) | Errors (%) |
| 5.8953 × 10⁻¹² | 5.8953 × 10⁻¹² | 0 | 4.70469 × 10⁻¹² | 4.7047 × 10⁻¹² | 2.92057 × 10⁻⁶ |
| 6.13436 × 10⁻¹² | 6.1344 × 10⁻¹² | 6.52061 × 10⁻⁶ | 4.70562 × 10⁻¹² | 4.7056 × 10⁻¹² | 5.23485 × 10⁻⁶ |
| 6.37342 × 10⁻¹² | 6.3734 × 10⁻¹² | 3.13804 × 10⁻⁶ | 4.70656 × 10⁻¹² | 4.7066 × 10⁻¹² | 7.78033 × 10⁻⁶ |
| 6.61248 × 10⁻¹² | 6.6125 × 10⁻¹² | 3.02457 × 10⁻⁶ | 4.7075 × 10⁻¹² | 4.7075 × 10⁻¹² | 5.31844 × 10⁻⁷ |
| 6.85154 × 10⁻¹² | 6.8515 × 10⁻¹² | 5.83814 × 10⁻⁶ | 4.70844 × 10⁻¹² | 4.7084 × 10⁻¹² | 8.92046 × 10⁻⁶ |
| 7.0906 × 10⁻¹² | 7.0906 × 10⁻¹² | 0 | 4.70938 × 10⁻¹² | 4.7094 × 10⁻¹² | 3.84899 × 10⁻⁶ |
| Parallel-Then-Series Model | Series-Then-Parallel Model | ||||
|---|---|---|---|---|---|
| Theoretical Solution (m2/s) | Real Value (m2/s) | Errors (%) | Theoretical Solution (m2/s) | Real Value (m2/s) | Errors (%) |
| 5.29125 × 10⁻¹² | 5.1988 × 10⁻¹² | 1.778206 | 4.75076 × 10⁻¹² | 5.1988 × 10⁻¹² | 8.618147 |
| 5.38559 × 10⁻¹² | 5.2649 × 10⁻¹² | 2.292374 | 4.7517 × 10⁻¹² | 5.2649 × 10⁻¹² | 9.747541 |
| 5.47579 × 10⁻¹² | 5.3255 × 10⁻¹² | 2.822126 | 4.75264 × 10⁻¹² | 5.3255 × 10⁻¹² | 10.756855 |
| 5.56212 × 10⁻¹² | 5.3814 × 10⁻¹² | 3.35816 | 4.75359 × 10⁻¹² | 5.3814 × 10⁻¹² | 11.666376 |
| 5.64481 × 10⁻¹² | 5.4331 × 10⁻¹² | 3.896616 | 4.75453 × 10⁻¹² | 5.4331 × 10⁻¹² | 12.489599 |
| 5.72409 × 10⁻¹² | 5.4811 × 10⁻¹² | 4.433233 | 4.75547 × 10⁻¹² | 5.4811 × 10⁻¹² | 13.238774 |
Disclaimer/Publisher’s Note: The statements, opinions and data contained in all publications are solely those of the individual author(s) and contributor(s) and not of MDPI and/or the editor(s). MDPI and/or the editor(s) disclaim responsibility for any injury to people or property resulting from any ideas, methods, instructions or products referred to in the content. |
© 2024 by the authors. Licensee MDPI, Basel, Switzerland. This article is an open access article distributed under the terms and conditions of the Creative Commons Attribution (CC BY) license (https://creativecommons.org/licenses/by/4.0/).
Share and Cite
Huang, T.; Feng, S.; Wang, M.; Peng, Z. Study on the Effect of Cracking Parameters on the Migration Characteristics of Chloride Ions in Cracked Concrete. Buildings 2024, 14, 1738. https://doi.org/10.3390/buildings14061738
Huang T, Feng S, Wang M, Peng Z. Study on the Effect of Cracking Parameters on the Migration Characteristics of Chloride Ions in Cracked Concrete. Buildings. 2024; 14(6):1738. https://doi.org/10.3390/buildings14061738
Chicago/Turabian StyleHuang, Tao, Shuang Feng, Mengge Wang, and Zhongqi Peng. 2024. "Study on the Effect of Cracking Parameters on the Migration Characteristics of Chloride Ions in Cracked Concrete" Buildings 14, no. 6: 1738. https://doi.org/10.3390/buildings14061738