Article

The Influence of the Aggressive Medium upon the Degradation of Concrete Structures: Numerical Model of Research

1
Civil Engineering Department, Kazan State University of Architecture and Engineering, 420043 Kazan, Russia
2
Department of Theoretical Mechanics, Kazan Federal University, 420008 Kazan, Russia
3
Department of Building Materials Technology, Saint Petersburg State University of Architecture and Civil Engineering, 190005 St. Petersburg, Russia
*
Author to whom correspondence should be addressed.
Buildings 2024, 14(6), 1762; https://doi.org/10.3390/buildings14061762
Submission received: 24 April 2024 / Revised: 24 May 2024 / Accepted: 2 June 2024 / Published: 11 June 2024
(This article belongs to the Special Issue Research on Concrete and Cement-Based Materials)

Abstract

:
This article discusses the impact of the aggressive environment on the pattern of pore distribution, strength, and mass absorption of investigated samples. For this purpose, a physical and numerical research model has been developed based on Fick’s second law and Zhurcov’s theory. Consequently, computer tomography research revealed that pore redistribution was revealed in test samples due to exposure. The degradation model is proposed assuming that in the first stage of interaction between concrete constructions and aggressive medium, the product of interaction is accumulated in the surface of structures and pores. Interaction products in the form of needle-shaped crystals grow in time and create additional stress in the body of the structure, resulting in partial distribution of the surface of the structure due to the growth. In this state, the excretion of dissolved substances (in the form of citrate and calcium acetate), leaching of Ca(OH)2, and decalcination of CSH lead to a decrease in the strength of cement stone. Based on the developed numerical models, the dependences of aggressive environment impact on the on the parameters of the structure of cement composites at different exposure times were obtained. For the samples obtained during the activation of Portland cement in the electromagnetic mill, energy parameters of the destruction process are 1.85–2.2 times heavier than the control compositions. The samples obtained by activating Portland cement in the electromagnetic mill have a higher susceptibility to an aggressive environment (they absorb 1.8 times more energy per unit of time for structure transformation). However, the higher U-energy barrier (1.85 times greater than the control composition) provides both a longer term of exploitation and a lower kinetics of the change in the strength of the material.

1. Introduction

The annual production of reinforced concrete structures is higher than four billion cubic meters. When in service, reinforced concrete structures are exposed to various influences such as physical, chemical, and biological ones, which results in loss of bearing capacity and durability [1,2]. For instance, exposure to an environment with a pH value of <7 reduces the durability of concrete [3], whilst being exposed to organic acids ultimately results in destruction of concrete structures [4,5,6,7,8]. Reinforced concrete structures may degrade due to leaching of the hydration products of cement stone, which causes an increase in its porosity [9]. A quantitative gain in the porosity value influences the kinetics of degradation of reinforced concrete structures [10].
Exposure to ammonium chloride results in structural concrete based on Portland cement experiencing a decrease in porosity, weight loss, along with diminishing bending and compressive strength. In order to assess the extent of influence of aggressive environments and media upon the loss of strength of concrete over time, the authors have developed a model of strength reduction [11]. An aggressive environment triggers the dissolution of the hydration products of cement stone, the dissolution of calcium hydroxide, and the decalcification of CSH gels, which all lead to a decrease in the pH of the pore medium of concrete [12]. The authors also agree with this conclusion [13,14]. They do add that the strength of cement concretes goes down due to extraction of calcium ions. With the temperature of the aggressive environment going from 25 to 85 °C, an increase in the kinetics of calcium ion leaching by 2–6 times occurs [15]. The influence of aggressive environments and an electric field on reinforced concrete structures speeds up the rate of degradation up to 100 times [16]. This leads to the conclusion that a methodology that would allow assessing the service life of concrete building structures operating under the influence of aggressive environments must be designed and developed.
One of the issues related to solving this problem is the experimental determination of the kinetic dependences of changes in the physical properties of the material under the separate and combined influence of operational factors [17,18]. Various models are used to evaluate the degradation of reinforced concrete structures operating in an aggressive environment. The Nernst–Planck–Poisson equation allows for a description of the process of fluid migration in the body of concrete structures [19,20]. Based on statistical experimental data and fracture mechanics, the authors have developed a model of the influence of a sulfate medium on the strength of the “reinforcement-cement stone” contact [21]. The authors [22] assess quantitatively the diffusion of an aggressive environment into concrete by probabilistic analysis and modeling using the Monte Carlo numerical method. The combination of Monte Carlo methods, modeling of the stress–strain state of reinforced concrete structures, and Fick’s law makes it possible to determine the service life of structures and the probability of destruction [23].
The penetration of aggressive media into the concrete body is modeled by Fick’s first law. As per the law, the dissolved substance diffuses in proportion to the gradient of its concentration [24]. Fick’s second law states that the rate of change in the concentration of a substance at a given point is due to diffusion. With this in mind, in the case of reinforced concrete structures, the diffusion coefficient of the substance must be used [25,26,27,28,29,30,31]. Preliminary grinding can significantly increase the strength and durability of building constructions, especially in aggressive environments [32,33].
However, the method of solving this problem is the relevant scientific problem, which takes into account the mechanical degradation of concrete over time in response to changes in porosity, profile, and parameters of the structure of cement stone. The aim of this work is to develop a mathematical model of degradation of cement stone in an aggressive environment (obtained without treatment and with treatment in the electromagnetic mill) considering porosity changes and concentration of acidity based on Fick’s second law.

2. Materials and Methods

2.1. Materials

In order to conduct experimental studies, Portland cement CEM I 42.5 B (Novotroitsk, Russia) was employed. It conformed to the requirements of EN 197-1 and had the following mineralogical composition: C3S—64–65%, C2S—11–13%, C3A—5–6%, C4AF—14–15%. The average density of cement stone was determined on samples of 2 × 2 × 2 cm, concrete, on cubes of 10 × 10 × 10 cm, dried to a constant mass at a temperature of 105 °C. The compressive strength of cement stone was determined on samples measuring 2 × 2 × 2 cm (a series of 6 samples). The compressive strength of concrete was determined on 10 × 10 × 10 cm samples while bending strength was established on 10 × 10 × 40 cm beam samples (a series of 6 samples). The kinetics of mass absorption of the samples was determined on beam samples sized 4 × 4 × 16 cm.
For the purposes of processing Portland cement, a vortex layer machine (to be more specific, an electromagnetic mill) model 297, manufactured by LLC Regionmettrans, was employed. The method of processing dispersed material in an electromagnetic mill is shown in [34]. A mixture of carboxylic acids, illustrated in Table 1, was selected as a model medium to simulate the waste products of microorganisms in the pore liquid of concrete. The acid concentration was increased to 10% [35,36] in order to increase the rate of bio-damage.
The samples were put in a model medium as shown in Figure 1 to determine the effect produced by an aggressive medium on the extent of damage to cement stone and concrete.
The temperature of the model medium was kept at 20 ± 1 °C, and the pH value was equal to 3 during the experimental studies. X-ray computed tomography was employed to investigate cement stone samples sized 2 × 2 × 2 cm prior to exposure to an aggressive environment and after fourteen and twenty-eight days of exposure. The structure of the cement stone was established by X-ray computed tomography on a General Electric V|tome|X S 240 machine (Germany). The samples were scanned with a microfocus tube at a voltage of 130 kV and a current strength of 130 mA. The photographing for each sample was adjusted separately depending on the density properties of the minerals of which the sample was composed.
The compression strength tests were conducted on the presses IR 5082-5 and IR 5082 with electromechanical drive. The press has a connection to the computer that automatically collects data.
IR spectral examinations were conducted under standard registration conditions on a Perkin Elmer FT-IR Spectrometer model Spectrum 65 in the region of 650–4000 cm−1 employing the Miracle ATR (ZnSe crystal) incomplete built-in reflection attachment at twenty scans. In order to obtain the required spectra, a sample of the material was tightly pressed against the surface of the element of attenuated total reflectance equipped with a ZnSe crystal with a special clamp included in the set-top box. The background spectrum is recorded and subtracted automatically. Following registration, the incomplete built-in reflection attachment correction and preservation of the spectrum are automatically performed. All the required settings of the device and the calculation method are embedded into the installed software. The software enables the generation of IR spectra from a test sample of the material and then they are validated from the control spectra. The spectra of the samples are identified by the software product library.
Optical images of sediment samples from the bottom of the test vessel were obtained via a Levenhuk D870T digital optical microscope (8 MP, trinocular).

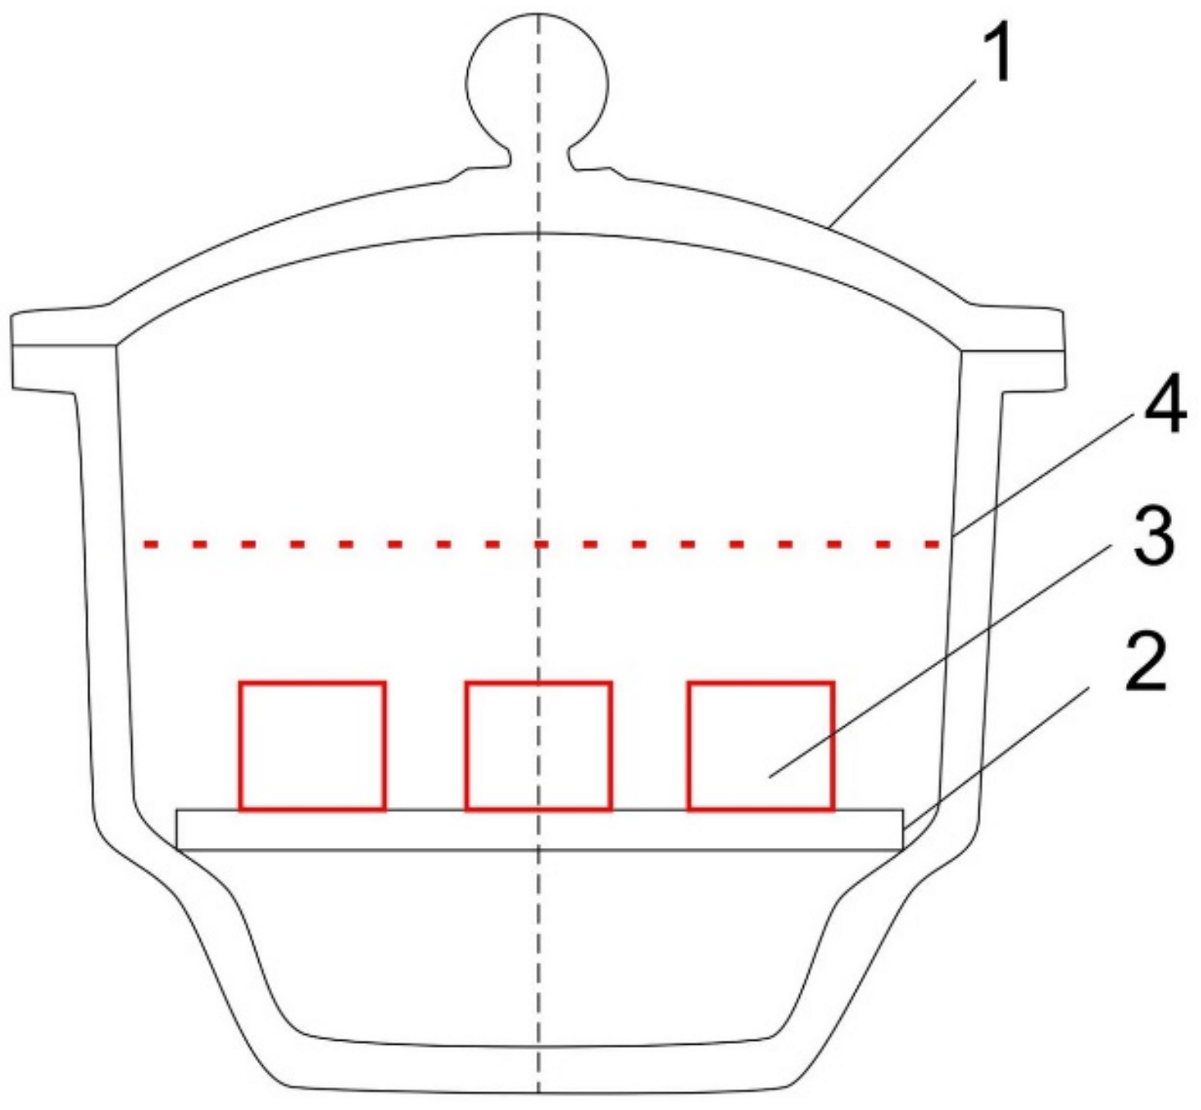
2.2. The Research Model

The amount of substance penetrating into concrete must be determined in order to assess the degree of degradation of concrete and reinforced concrete structures in an aggressive environment. To that end, a ratio based on Fick’s second law is oftentimes employed:
C t = x λ C x + y λ C y ,
where C is the pH value of the medium; λ is the filtration coefficient; x, y are the coordinates; t is time. The boundary conditions were assumed to be the following: C 0 , t t = λ C 0 , t С k t , at x = 0 and at x = b, or y = 0 and y = h, where С k is the pH of the aggressive medium.
It is well-known that Equation (1) is parabolic and it comes with a number of downsides, namely that the penetration rate of material at the start of diffusion is infinite and the substance penetrates the entire depth of the material instantaneously. In fact, this does not happen, which is backed up by practice. Experimental studies show that the central part of the cement stone remained the same as before the experiment. Therefore, this paper proposes the introduction of the parameter τ to Equation (1), which limits the penetration rate of aggressive substances:
C t + τ 2 C t 2 = x λ C x + y λ C y ,
where τ is the delay parameter. This yields a hyperbolic equation, i.e., an analogue of the oscillation equation is obtained with the parameter τ determining the front of penetration of an aggressive medium into concrete.
Equation (2) is solved in finite differences in both time and coordinates, with an explicit scheme used in time.
C i j k + 1 C i j k 1 Δ t = λ i + 1 j k λ i 1 j k C i + 1 j k C i 1 j k Δ x 2 + λ i j + 1 k λ i j 1 k C i j + 1 k C i j 1 k Δ y 2 + λ i j k C i + 1 j k 2 C i j k + C i 1 j k Δ x 2 + C i j + 1 k 2 C i j k + C i j 1 k Δ y 2 .
In order to ensure the convergence of the solution of Equation (7), a restriction (the Courant condition) is put on the time step:
λ Δ t 1 Δ x 2 + 1 Δ y 2 1 2 .
The diffusion ratio λ depends on the open porosity p of the material which was assumed to be of the following form:
λ = λ 0 p α ,
where λ 0 is the initial diffusion ratio, and α is the parameter. The change in porosity is taken as:
p = 1 + p 0 1 e β t C b C ,
where p0 is the initial porosity of concrete, β is the parameter, Cb is the initial pH level in concrete. As the aggressive medium made its way into the cement concrete, the limit equilibrium theory was employed in order to determine the maximum load P t on the test sample as per the equation.
P t = R b C , t d A ,
where R b is the compressive strength, and A is the cross-sectional area of the sample.
The method was the following. The first step consists in setting the initial and boundary conditions for the concentration of an aggressive medium in concrete. Then new concentrations of the aggressive medium are established at various points in the concrete using a new time step. At the next step, the problem is solved iteratively in time, that is, at each step, the concentration of the aggressive medium is established via the previous values, taking into consideration the boundary conditions. With that completed, Equation (7) was put to use in order to determine the strength of the sample. A program was designed and developed using the Julia language specifically to solve the problem.

Material Destruction Model (Koroleva Model)

Models based on the equations of chemical kinetics and Zhurkov’s model [37] were put forward in order to describe the kinetics of changes in the strength of the material. It is assumed that the rate of change in the resistance of the material in an aggressive medium is proportional to the constant k d :
d F d t = k d F n ,
where F is the parameter characterizing the change in the structure of the material; k d is the constant of the rate of destruction of the material.
The solution of this differential equation has the following form:
k s = 1 1 n F 0 1 n k d t 1 1 n ,
This equation is used to determine both the energy and kinetic parameters of the material destruction process based upon experimental data: ΔS—amount of energy absorbed by the material in the case of destruction; BE—total amount of energy; U —energy potential of destruction resistance; and k d —destruction rate constant.
Then, Equation (9) is supplemented with the specified requirement for changing the structurally sensitive property F: Δ F = α R F 0 = F 0 F , along with the effect of the operating conditions upon the energy potential of the resistance of the material:
U = U 0 k m ( γ σ + α C )
(where U 0 is the potential barrier of the destruction process; k m is the multiplicative ratio of the influence of factors; γ is the coefficient of overvoltage of bonds; σ is the applied external load; α is the proportionality ratio; C is the concentration of the aggressive medium; α R is the permissible range of parameter F). This yields a formula to calculate the maximum time t m a x to achieve a given change in the structurally sensitive property of the material (strength):
t m a x = α R F 0 A 0 1 e U R T ,
where A0 is a constant equal to the maximum rate of destruction at the specified parameters; U is the activation energy of the destruction process; R is the universal gas constant; T is the temperature of the medium.
The rate of change of the structurally sensitive property is v R = d R / d t , determined by experimental data:
v R = R i + 1 R i t i + 1 t i .
Further on, a dependence graph is constructed, l n ( v R ) = f 1 T , one approximated by a linear function l n ( v R ) = b k ( 1 T ) , where b = ln(A0); k = U/R. Then, the value b is established, A0 is calculated, and the tangent of the slope angle is used to find the effective activation energy of the destruction process: U = R t g α .

3. Results

3.1. Identification of Mechanical Properties

Experiments were performed on samples sized 4 × 4 × 16 cm made of sand cement mortar in order to determine the mechanical properties included in the degradation model. The samples were immersed in water and then weighed at certain intervals. The weighings determined the weight of water penetrating into each sample. Tests were conducted on control samples and samples obtained from activated Portland cement. The measurement results are given in Table 2.
There is also a way to model the process of water absorption numerically. This process was modeled based upon Fick’s second law:
I w t = λ w 2 I w x 2 + 2 I w y 2 ,
where λ w is the diffusion ratio in water and I w is the humidity index ( 0 I w 1 ). As before, the boundary conditions were assumed as the third order.
The humidity index was established by the following formula:
I w = P w P w m a x ,
where P w is the weight of water in the sample and P w m a x is the maximum weight of water that the sample can absorb (with all pores filled).
The maximum possible weight of water is determined by the following formula:
P w m a x = γ w V p = γ w p 0 V = p 0 V ,
where γ w = 1 is the specific gravity of water, V p is the volume of pores, V is the volume of the sample, and p 0 represents porosity.
Computed tomography results of the studied samples helped determine the porosity:
p 0 = V p V .
The value λ w was assumed to be constant as one can neglect the process of dissolving cement stone in water.
Then, λ w is found from the condition of the minimum discrepancy between the numerical and experimental values of the weight of water:
δ = P w n u m λ w , t i P w e x p e r t i 2 m i n .
Initial parameters for calculations:
p 0 k = 0.132 ,   λ 0 k = 0.53 ;   p 0 a = 0.12 ,   λ 0 a = 0.31 ;   α = 1.6 ; β = 0.0002 ; v = 0.9 .
The data regarding the change in the pH value in the cement stone under investigation are given in Figure 2.
Figure 2 illustrates that the diffusion process in the sample obtained through the activation of Portland cement in an electromagnet mill is slower as compared to the control samples (which is confirmed by the experiment).
The calculation results demonstrated that the parameter τ affects not only the depth of penetration of the aggressive medium into the samples under investigation, but also the appearance of waviness between the pH values. It is worth mentioning that when at high values of v, the shape of the change in the pH value in the samples under examination also remains rectangular whilst becoming more rounded at low values.
The effect of the parameter α on the distribution of the pH value has also been analyzed. It turned out that when α 1 , the distribution of pH values in the sample under investigation took the form of a diamond (Figure 3).

3.2. A study of the Impact of an Aggressive Medium on the Physical and Mechanical Properties of Cement Composites

The impact of the modelled medium on the extent of damage to the samples under investigation was established. X-ray computed tomography has been used to obtain orthogonal sections and 3D visualization of cement stone samples sized 2 × 2 × 2 cm prior to exposure (K1, A1), after 14 days (K2, A2) and 28 (K3, A3) days of exposure in an aggressive medium (Figure 4). The distribution of pores in terms of sizes was established depending on the time of exposure to an aggressive medium.
The results obtained by X-ray computed tomography via the Amira-avizo PC are demonstrated in Figure 5. The change in the quantitative content of pores in the samples throughout degradation is shown in Table 3.
Table 3 shows that as the exposure of samples in an aggressive medium increases, the total pore volume in the compositions under examination decreases. This may be indicative of the fact that products of interaction of the aggressive medium (calcium acetate, calcium citrate) precipitate and settle down in the pores and capillaries of cement stone. The change in porosity speaks to the process of dissolution of the components of the cement stone of the control composition (the proportion of pores with a size of 1.0 and 1.5 mm goes up and the proportion of pores with a size of 0.5 mm goes down slightly), also showing that there are processes of dissolution in the pore space for cement stone from activated Portland cement and that it is being filled with products coming from the interaction of portlandite with citric acid (calcium citrate). In this case, the balance of pores with sizes of 1.0 and 1.5 mm diminishes, while the proportion of pores with a size of 0.5 mm rises. The changes in porosity due to the effect of an aggressive environment have also been observed in a study showing a decrease in the volume of pores as a result of filling of the reaction products «cement stone-aggressive environment» [38].
This is also accompanied by a change in the volume and mass of cement stone with the control sample decreasing on average from 7669 mm3 to 6333 mm3 and from 16.29 g to 10.13 g (after 14 days of exposure) and to 4714 mm3 and 8.32 g (after 28 days of exposure), that is, by 17% and 38% (volume) and 37.8% and 49% (mass), respectively. The volume and mass of the cement stone of the sample obtained via activation decreases on average from 7797 mm3 to 7606 mm3 and from 19,185 g to 16,615 g (after 14 days of exposure) and to 6799 mm3 and 15.07 g (after 28 days of exposure), that is, by 2.5% and 13% (volume) and 13% and 21% (weight), respectively. The changes in the mass and porosity of samples treated in an aggressive environment are also shown in [39].
Therefore, computer tomography tools can be used to analyze the total amount of pores in cement stone. Thus, computer tomography provides new analytical applications for conservation science [40] in contact field research [41].
It shows that the aggressive medium impacts the external geometric properties of the sample as well as the internal volume of the pore space. The mass absorption of samples exposed to an aggressive medium reflects the processes occurring in the inner pore space of the material (Figure 4). In the initial period (up to four days), mass absorption associated with the penetration of an aggressive medium into the sample volume through pores and capillaries registers a regular increase. It is followed by a reduction in mass absorption owing to chemical interaction and removal of the dissolved substance from the sample volume. The material balance equation in this case should state that the change in mass absorption in this instance is equal to:
W m = 1 m 0 V p p + V p r ρ s V p r ρ t
where V p p is the volume of the pore space filled with an aggressive medium; V p r is the volume of the dissolved substance; m 0 is the initial mass of the sample; ρ s is the density of the aggressive medium; ρ t is the density of the cement stone components interacting and dissolving in an aggressive medium.
It follows from this equation that at V p p + V p r ρ s < V p r ρ t and ρ t > ρ s , the mass absorption goes down, as illustrated in Figure 6 (the kinetics of mass absorption is performed on samples of fine-grained concrete sized 4 × 4 × 16 cm). Aside from dissolution, there is a process of filling pores with chemical interaction products. In the case of the cement stone from the control composition, this process is less intensive as compared to cement stone on activated Portland cement. This difference is also well seen in Figure 6; in the first 6 days, corrosion products accumulate (about 1.5 times less intense in the compositions obtained during activation), from day 6 to day 28, the mass loss reduces due to the removal of cement stone hydration products, and at the same time, the weight loss of the control sample is 1.5–2 times larger in comparison with the composition obtained by the activation of Portland cement in the electromagnetic mill. Similar mass changes have been recorded in [42].
By grinding cement, the particle size decreases, and therefore, the value of the SSA increases [43,44]. As a result, the resistance of milled cement to aggressive environments increases.

3.3. The Degradation Model

When cement compositions are exposed to an aggressive medium, the products of the interaction of cement stone components and the aggressive medium formed on the surface of the samples. Also, they precipitated. Optical images (Figure 7) and the IR spectrum (Figure 8) of sediment from the bottom of the test vessel, as well as sediment formed by the interaction of an aggressive medium and Ca(OH)2, were obtained.
Figure 7 demonstrates clear crystalline formations of the reaction products of the aggressive medium and Ca(OH)2, as well as cement stone and the aggressive medium. In the case shown in Figure 7C,D, the crystalline formations are clearer and more perfect.
The characteristic frequencies in the IR spectrum of citric acid are fluctuations of the OH group at 3236 cm−1 and the CO group at 1645 cm−1, and in acetic acid, at3387 cm−1 and 1646 cm−1, respectively. Interaction of calcium hydroxide and citric acid leads to the formation of calcium citrate. When calcium hydroxide interacts with acetic acid, calcium acetate is formed.
IR spectrometry data demonstrated the predominance of saturated structures in the form of CH, CH2, and CH3 (bands in the region of 3000–2800 cm−1, 1465, 1378 cm−1). The sediment under examination is marked by a considerable content of oxygen compounds with groups C=O, COON, and OH (bands 1600–1650 cm−1).
IR spectrum analysis identified bands in the region 3500–3000 cm−1 (a wider band from the bottom of the test vessel, line 1), corresponding to a hydroxyl group [45,46]. Fluctuations of the hydroxyl group OH were observed at 3494 cm−1. The absorption frequency of the investigated sediment at 3054 cm−1 corresponds to the absorption band OH-group involved in the formation of chelate complexes with ions of Ca2+.The carboxylate-anions COO are detected at frequencies 1567 cm−1 and 1467 cm−1. In the IR spectrum, there is a slightly displaced band of valence oscillations C=O group at 1612 cm−1 in the area of carbonyl group oscillations (in the citric acid, the oscillation band of this group is 1654 cm−1). This occurs when the carbonyl group is reduced by a double bond and polarized. In the region 1210–1435 cm−1, hydroxyl group fluctuations –OH were observed. C−О bonds are observed at intervals of 1125–1175 cm−1. OH and C=O groups have significant interactions.
Therefore, the conducted research has served as the basis for a model of degradation of cement compositions, presented in Figure 9. This model is based on the fact that at the first stage of interaction between concrete structures and an aggressive medium, the products of their interaction build upon the surface of structures and inside pores. Products of interaction formed as needle crystals grow over time, thereby creating additional stresses in the body of the structure, which results in the partial destruction of the surface zone of the structure (Figure 9B, position 2). This leads to the removal of the dissolved substance (in the form of citrate and calcium acetate), leaching of Ca(OH)2, and decalcification of CSH, resulting in the cement stone losing strength.

3.4. Numerical Studies of Changes in the Compressive Strength of Cement Stone Aged in an Aggressive Medium

The compressive strength of cement stone aged in an aggressive medium at different exposure times was established (Table 4).
Figure 10 presents the effect of the delay parameter τ on the distribution of the pH value in the cement stone (where orange is the control sample, green stands for activated, and the dotted line is τ = 0). It is worth mentioning that not only does taking into account the delay parameter slow down the penetration rate of the aggressive medium, but it also effects a smaller change in the wave front (close to rectangular).
Figure 10 demonstrates the effect of exposure time on the distribution of the pH value in cement stone (where orange is the control sample, and green is that obtained by activation in an electromagnetic mill). Three cases were examined: t = 2, t = 6, t = 12 h. Figure 10 shows that with increased exposure time, the aggressive medium enters the sample obtained by activation much more slowly, which means that the strength of a sample like this will decrease with lower kinetics.
The results of changes in the strength of the samples under examination which have been obtained depending on the duration of exposure in an aggressive medium are backed up by the calculation data using the kinetics model of changes in the strength of the material (Table 5).
The calculations shown in Table 5 indicate that the compositions obtained through activation of Portland cement in an electromagnetic mill are marked by the following:
(1) The value of the kinetic ratio of destruction is significantly less than two million times.
(2) The energy parameters of the destruction process (the fracture resistance of cement stone) are 1.85–2.2 times greater than the control composition.
(3) The value of ΔS is 1.78 times greater, which points to a higher susceptibility of the cement material from activated Portland cement to an aggressive medium (as it absorbs more energy per unit of time for the transformation of the structure). However, a higher energy barrier U yields an increase in both the service life and a lower kinetics of changes in the strength of the material (see conclusion No. 1 from the analysis of Table 5).

4. Conclusions

In this research, instruments and results of the computed tomography were first proposed to develop a physical and numerical model of degradation of cement stone operating (based on Fick’s second law) in an aggressive environment.
The aggressive medium produces a conspicuous effect on the porosity distribution and the strength of the cement stone. This leads to the control sample increasing in the number of pores with a diameter of 1.0 and 1.5 mm as a result of exposure, and in the sample obtained by activation, the number of pores with a diameter of 0.5 mm increases. Computed tomography results showed that the volume of samples was reduced by 38% and 13% for the control and activated formulations after twenty-eight days of exposure.
A model of degradation of cement stone in an aggressive medium has been put forward. The first stage involves the products of interaction between the model medium and cement stone accumulating on the surface of the structure and in the pores. As a result of this interaction, needle-like crystals are formed, which create additional stresses in the body of the structure while leading to surface destruction. This leads to the removal of the dissolved substance (in the form of citrate and calcium acetate), leaching of Ca(OH)2, and decalcification of CSH, resulting in the cement stone losing strength.
The proposed numerical models have helped achieve dependences of the effect of an aggressive medium on the structure parameters of cement composites at different exposure times, as a result of which a mathematical model (demonstrating a high convergence with experimental research results) of the material degradation process in an aggressive medium has been developed, taking into account changes in porosity, acidity concentration, and kinetic parameters of changes in the structural strength of the samples under examination.
The resulting model will provide a better service life assessment of concrete constructions under aggressive environments. This model offers the modification of Fick’s law, which allows us to consider the deceleration of the penetration process of aggressive environment into constructions.
A further step to this research would be the determination of the dependencies of the diffusion of an aggressive medium into cement composites, taking into account the compaction of the structure of cement stone formed due to removal and blockage of pores by the interaction products of “cement stone–aggressive medium” and the development of a model of degradation of cement composites.

Author Contributions

Conceptualization, I.R. and K.E.; methodology, K.E.; software, S.F.; validation, I.R., K.R. and S.F.; formal analysis, K.E.; investigation, I.R.; resources, I.R.; data curation, S.F.; writing—original draft preparation, I.R.; writing—review and editing, K.E.; visualization, S.F.; supervision, K.R.; project administration, I.R.; funding acquisition, I.R. All authors have read and agreed to the published version of the manuscript.

Funding

The results in Section 3.1 and Section 3.4 are obtained under support from the Russian Science Foundation (project No. 24-29-00524). The results in Section 3.2 and Section 3.3 was funded by the subsidy allocated to Kazan Federal University for the state assignment in the sphere of scientific activities, project No. FZSM-2023-0009.

Data Availability Statement

Data are contained within the article.

Conflicts of Interest

The authors declare no conflicts of interest.

References

  1. Arum, C.; Olotuah, A. Making of strong and durable concrete. Emir. J. Eng. Res. 2006, 11, 25–31. [Google Scholar]
  2. Neville, A.M. Properties of Concrete; Longman Group Limited: Harlow, UK, 1995. [Google Scholar]
  3. Makhloufi, Z.; Kardi, E.H.; Bouhicha, M.; Benaissa, A.; Bennacer, R. The strength of limestone mortar with quaternary binder: Leaching effect by demineralized water. Constr. Build. Mater. 2012, 36, 171181. [Google Scholar] [CrossRef]
  4. Afroughsabet, V.; Biolzi, L.; Monteiro, P.J.M.; Gastaldi, M.M. Investigation of the mechanical and durability properties of sustainable high performance concrete based on calcium sulfoaluminate cement. J. Build. Eng. 2021, 43, 102656. [Google Scholar] [CrossRef]
  5. Witkowska-Dobrev, J.; Szlachetka, O.; Dohojda, M.; Wiśniewski, K. Effect of Acetic Acid on Compressive Strength and Geometric Texture of the Surface of C20/25 Class Concrete. Sustainability 2021, 13, 5136. [Google Scholar] [CrossRef]
  6. Hubáček, A.; Hela, R. Concrete in the Environment of Agricultural Buildings. Solid State Phenom. 2021, 322, 38–40. [Google Scholar] [CrossRef]
  7. Ren, J.; Zhang, L.; Walkley, B.; Black, J.R.; San Nicolas, R. Degradation resistance of different cementitious materials to phosphoric acid attack at early stage. Cem. Concr. Res. 2022, 151, 106606. [Google Scholar] [CrossRef]
  8. Kumar, N.V.S. Effet des solutions d’acide sulfurique et chlorhydrique sur le béton de poussière de roche concassée. Mater. Today Proc. 2021, 46, 509–513. [Google Scholar] [CrossRef]
  9. Youssari, F.Z.; Taleb, O.; Benosman, A.S. Towards understanding the behavior of fiber-reinforced concrete in aggressive environments: Acid attacks and leaching. Constr. Build. Mater. 2023, 368, 130444. [Google Scholar] [CrossRef]
  10. Jiang, C.; Jiang, L.; Tang, X.; Gong, J.; Chua, H. Impact of calcium leaching on mechanical and physical behaviors of high belite cement pastes. Constr. Build. Mater. 2021, 286, 122983. [Google Scholar] [CrossRef]
  11. Yang, H.; Jiang, L.; Zhang, Y.; Pu, Q.; Xu, Y. Predicting the calcium leaching behavior of cement pastes in aggressive environments. Constr. Build. Mater. 2011, 243, 88–96. [Google Scholar] [CrossRef]
  12. Omrane, M.; Mouli, M.; Benosman, A.S.; Senhadji, Y. Deterioration of Mortar Composites in Acidic Environment. Adv. Mater. Res. 2015, 1064, 3–8. [Google Scholar] [CrossRef]
  13. Jebli, M.; Jamin, F.; Pelissou, C.; Malachanne, E.; Garcia-Diaz, E.; El Youssoufia, M.S. Leaching effect on mechanical properties of cement-aggregate interface. Cem. Concr. Compos. 2018, 87, 10–19. [Google Scholar] [CrossRef]
  14. Babaahmadi, A.; Tang, L.; Abbas, Z.; Martensson, P. Physical and mechanical properties of cementitious specimens exposed to an electrochemically derived accelerated leaching of calcium. Int. J. Concr. Struct. Mater. 2015, 9, 295–306. [Google Scholar] [CrossRef]
  15. Kamali, S.; Gérard, B.; Moranville, M. Modelling the leaching kinetics of cement-based materials influence of materials and environment. Cem. Concr. Compos. 2003, 25, 451–458. [Google Scholar] [CrossRef]
  16. Cai, X.; He, Z.; Shao, Y.; Sun, H. Macro- and micro-characteristics of cement binders containing high volume fly ash subject to electrochemical accelerated leaching. Constr. Build. Mater. 2016, 116, 25–35. [Google Scholar] [CrossRef]
  17. Allsopp, D.; Seal, K.J.; Gaylarde, C.C. Introduction to Biodeterioration, 2nd ed.; Cambridge University Press: Cambridge, UK, 2004; 252p. [Google Scholar]
  18. Yakovleva, G.; Sagadeev, E.; Stroganov, V.; Kozlova, O.; Okunev, R.; Ilinskaya, O. Metabolic activity of micromycetes affecting urban concrete constructions. Sci. World J. 2018, 2018, 8360287. [Google Scholar] [CrossRef] [PubMed]
  19. Samson, E.; Marchand, J. Modeling the effect of temperature on ionic transport in cementitious materials. Cem. Concr. Res. 2007, 37, 455–468. [Google Scholar] [CrossRef]
  20. Samson, E.; Marchand, J.; Snyder, K.A. Calculation of ionic diffusion coefficients on the basis of migration test results. Mater. Struct. 2003, 36, 156–165. [Google Scholar] [CrossRef]
  21. Bastidas-Arteaga, E.; Sánchez-Silva, M.; Chateauneuf, A.; Silva, M.R. Coupled reliability model of biodeterioration, chloride ingress and cracking for reinforced concrete structures. Struct. Saf. 2008, 30, 110–129. [Google Scholar] [CrossRef]
  22. Biondini, F.; Bontempi, F.; Frangopol, D.M.; Malerba, P.G. Cellular automata approach to durability analysis of concrete structures in aggressive environments. J. Struct. Eng. 2004, 130, 1724–1737. [Google Scholar] [CrossRef]
  23. Frangopol, D.M.; Lin, K.-Y.; Estes, A.C. Reliability of reinforced concrete girders under corrosion attack. J. Struct. Eng. 1997, 123, 286–297. [Google Scholar] [CrossRef]
  24. Tu, X.; Wu, Y. Numerical analysis on corrosion and mechanical performance of shear stud connector in concrete. Constr. Build. Mater. 2023, 363, 129816. [Google Scholar] [CrossRef]
  25. Thoft-Christensen, P. Stochastic Modelling of the Diffusion Coefficient for Concrete; Department of Building Technology and Structural Engineering, Aalborg University: Aalborg, Denmark, 2002. [Google Scholar]
  26. Ozbolt, J.; Balabanic, G.; Kuster, M. 3D numerical modelling of steel corrosion in concrete structures. Corros. Sci. 2011, 53, 4166–4177. [Google Scholar] [CrossRef]
  27. Liberati, E.A.; Nogueira, C.G.; Leonel, E.D.; Chateauneuf, A. Nonlinear formulation based on FEM, Mazars damage criterion and Fick’s law applied to failure assessment of reinforced concrete structures subjected to chloride ingress and reinforcements corrosion. Eng. Fail. Anal. 2014, 46, 247–268. [Google Scholar] [CrossRef]
  28. Kalinkin, A.; Krzhizhanovskaya, M.; Gurevich, B.; Kalinkina, E.; Tyukavkina, V. Hydration of mechanically activated blended cements studied by in situ X-ray diffraction. Inorg. Mater. 2015, 51, 828–833. [Google Scholar] [CrossRef]
  29. Burmeister, C.; Titscher, L.; Breitung-Faes, S.; Kwade, A. Dry grinding in planetary ball mills: Evaluation of a stressing model. Adv. Powder Technol. 2018, 29, 191–201. [Google Scholar] [CrossRef]
  30. Vdovin, E.; Stroganov, V.; Amel’chenko, M.; Kraus, E.; Fazleev, I. Biostability of Road Cement-Mineral Materials Reinforced with Dispersed Fibre. In International Scientific Conference on Socio-Technical Construction and Civil Engineering; Lecture Notes in Civil Engineering; Springer: Cham, Switzerland, 2021; Volume 169, pp. 289–296. [Google Scholar] [CrossRef]
  31. Stroganov, V.; Sagadeev, E.; Ibragimov, R.; Potapova, L. Mechanical activation effect on the biostability of modified cement compositions. Constr. Build. Mater. 2020, 246, 118506. [Google Scholar] [CrossRef]
  32. Kara, C.; Kutuk, S.; Kutuk-Sert, T. Improvement of the durability of concrete by substitution of raw ground colemanite. Case Stud. Constr. Mater. 2023, 19, e02393. [Google Scholar] [CrossRef]
  33. Kutuk, S. Morphology, Crystal Structure and Thermal Properties of Nano-Sized Amorphous Colemanite Synthesis. Arab. J. Sci. Eng. 2024. [Google Scholar] [CrossRef]
  34. Ruslan, I.; Ruslan, B.; Evgenij, K. The effect of metal and polypropylene fiber on technological and physical mechanical properties of activated cement compositions. Case Stud. Constr. Mater. 2022, 16, e00882. [Google Scholar] [CrossRef]
  35. Strokin, K.; Novikov, D.; Konovalova, V. Forecasting the durability of reinforced concrete under conditions of microbiological corrosion. E3S Web Conf. 2021, 274, 04003. [Google Scholar] [CrossRef]
  36. Stroganov, V.F.; Sagadeev, E.V.; Potapova, L.I.; Kukoleva, D.A. A comprehensive study of the processes of biodamage of mineral building materials. Izvestiya KGASU 2011, 4, 274–281. [Google Scholar]
  37. Galitsyn, V.P.; Shkurenko, S.I.; Slastnov, A.E.; Pakhomov, P.M. Correlation of Breaking Elongation and Linear Density of a Fiber Obtained from Ultrarhigh-Molecular-Weight Polyethylene Gel with Its Strength Indicators. Fibre Chem. 2023, 55, 25–30. [Google Scholar] [CrossRef]
  38. Svintsov, A.P.; Nikolenko, Y.V.; Fediuk, R.S. Aggressive effect of vegetable oils and organic fatty acids on cement-sand mortar and concrete. Constr. Build. Mater. 2022, 329, 127037. [Google Scholar] [CrossRef]
  39. Rossetti, A.; Ikumi, T.; Segura, I.; Irassar, E.F. Sulfate performance of blended cements (limestone and illite calcined clay) exposed to aggressive environment after casting. Cem. Concr. Res. 2021, 147, 106495. [Google Scholar] [CrossRef]
  40. Possenti, E.; Conti, C.; Gatta, G.D.; Marinoni, N.; Merlini, M.; Realini, M.; Vaughan, G.B.; Colombo, C. Synchrotron X-ray diffraction computed tomography to non-destructively study inorganic treatments for stone conservation. iScience 2022, 25, 105112. [Google Scholar] [CrossRef] [PubMed]
  41. Wang, J.-P.; Li, M.-C.; Qi, M.; Ge, S.; Dadda, A. Micro-macro investigation on bio-cemented sand under different grouting saturation: An effective enhancement method. Geomech. Energy Environ. 2024, 37, 100530. [Google Scholar] [CrossRef]
  42. Ghassemi, P.; Toufigh, V. Durability of epoxy polymer and ordinary cement concrete in aggressive environments. Constr. Build. Mater. 2020, 234, 117887. [Google Scholar] [CrossRef]
  43. Kutuk-Sert, T.; Ozturk, M.; Kutuk, S. Digital image processing of warm mix asphalt enriched with nanocolemanite and nanoulexite minerals. Constr. Build. Mater. 2023, 399, 132542. [Google Scholar] [CrossRef]
  44. Ibragimov, R.A.; Korolev, E.V.; Deberdeev, T.R.; Leksin, V.V. Efficient complex activation of Portland cement through processing it in the vortex layer machine. Struct. Concr. 2019, 20, 851–859. [Google Scholar] [CrossRef]
  45. Yuan, H.; Dangla, P.; Chatellier, P.; Chaussadent, T. Degradation modeling of concrete submitted to biogenic acid attack. Cem. Concr. Res. 2015, 70, 29–38. [Google Scholar] [CrossRef]
  46. Bao, H.; Xu, G.; Wang, Q.; Peng, Y.; Liu, J. Study on the deterioration mechanism of cement-based materials in acid water containing aggressive carbon dioxide. Constr. Build. Mater. 2020, 243, 118233. [Google Scholar] [CrossRef]
Figure 1. The schematic representation of tests in a model medium: 1—desiccator; 2—sample stand; 3—test samples; 4—model medium.
Buildings 14 01762 g001
Figure 2. Changes in the pH values in the cement stone under investigation after five days of exposure: (a) in the control sample; (b) in the activated sample.
Buildings 14 01762 g002
Figure 3. The effect produced by the parameter α on the distribution of the pH value in cement stone.
Buildings 14 01762 g003
Figure 4. Orthogonal section and 3D visualization of samples: (a,c)—control sample; (b,d)—obtained by activation in ABC.
Buildings 14 01762 g004
Figure 5. Three-dimensional visualization of pores in the samples.
Buildings 14 01762 g005
Figure 6. Kinetics of mass absorption in the simulated medium: ○—control sample; □—sample obtained from activated Portland cement.
Buildings 14 01762 g006
Figure 7. Optical images: (A,B)—from the bottom of the test vessel at a magnification of 500× and 2000×, respectively; (C,D)—sediment of the interaction of an aggressive medium and Ca(OH)2 at a magnification of 2000×.
Buildings 14 01762 g007
Figure 8. The IR spectrum of the samples under examination: 1—from the bottom of the test vessel (black line); 2—sediment of the interaction of the aggressive medium and Ca(OH)2 (red line).
Buildings 14 01762 g008
Figure 9. Degradation model: (A)—scheme of removal of solute as a result of hydration: 1—zone of high porosity due to large volumes of liquid; 2—zone of precipitation from the products of interaction of cement stone and the modeled medium; 3—zone that does not interact with the medium; (B)—stress distribution in the described zones (σ—stress; x is the thickness of the cement stone; 1, 2, 3 are the zones of the cement stone).
Buildings 14 01762 g009
Figure 10. The effect of the distribution of the pH value in cement stone: (A)—from the parameter τ; (B)—from time.
Buildings 14 01762 g010
Table 1. The composition of the model medium.
Inorganic Ions, mg/L
Ca2+NO3−S2−CO32−
640601000700
Organic acids, mg/L
AceticCitricMalic
198016,020400
Table 2. Absorption of water over time.
Time, HourControl SampleActivated
Water Absorption by Weight, %Water Weight, gWater Absorption by Weight, %Water Weight, g
000.0000.00
0.253.216.612.714.50
1420.763.418.26
3525.953.920.94
65.729.584.122.02
126.131.664.222.55
246.1531.924.323.09
366.232.184.423.63
486.2532.444.524.17
Table 3. The change in the volume of pores in the samples during exposure.
Type of SampleTotal Pore Volume, mm3:
Prior to the TestsAfter Fourteen Days of TestsAfter Twenty-Eight Days of Tests
control sample84.782.772.4
sample obtained via activation70.739.235.2
Table 4. Compressive strength of cement stone.
CompositionCompressive Strength, MPa after Exposure Throughout the Day:
071428
control sample42.5
100%
34.8
82%
29.8
70%
26.8
63%
sample obtained via activation54.8
100%
54.8
91%
47.1
86%
43.7
80%
Table 5. Kinetic and energy parameters of changes in the structural strength of the samples under examination.
Name of the CompositionKinetic and Energy Parameters
nkdΔS, J/mol·KBE, J/molU, J/mol
control sample4.743.78 × 10−8−147.8251,765.8641,636.37
sample obtained via activation7.911.83 × 10−14−263.311,5373.3977,053.24
Disclaimer/Publisher’s Note: The statements, opinions and data contained in all publications are solely those of the individual author(s) and contributor(s) and not of MDPI and/or the editor(s). MDPI and/or the editor(s) disclaim responsibility for any injury to people or property resulting from any ideas, methods, instructions or products referred to in the content.

