Article

Comparative Study on the Seismic Vulnerability of Continuous Bridges with Steel–Concrete Composite Girder and Reinforced Concrete Girder

1
School of Civil Engineering and Architecture, Suqian University, Suqian 223800, China
2
School of Civil Engineering, Qingdao University of Technology, Qingdao 266520, China
*
Author to whom correspondence should be addressed.
Buildings 2024, 14(6), 1768; https://doi.org/10.3390/buildings14061768
Submission received: 1 May 2024 / Revised: 5 June 2024 / Accepted: 6 June 2024 / Published: 12 June 2024
(This article belongs to the Section Building Structures)

Abstract

:
For medium- and small-span bridges, the weight of the superstructure in steel–concrete composite girder bridges is lighter than that of a reinforced concrete girder bridge. However, it is still uncertain whether steel–concrete composite girder bridges exhibit superior seismic performance compared to reinforced concrete girder bridges. This study quantitatively compared the seismic performance of the two types of bridges. Using the theory of probabilistic seismic demand analysis, the seismic vulnerability curves of bridges were derived. To conduct seismic demand analysis for probabilistic analysis on the OpenSEES platform, bridge samples were generated using the Latin hypercube stratified sampling method, which considers the uncertainties associated with the two types of bridges. The vulnerability curves of the piers, bearings, abutments, and the system of the two bridges were established using probabilistic analysis of the time history analyses. The results showed that the seismic vulnerabilities of components and the overall system of the steel–concrete composite girder bridge were both lower than those of the reinforced concrete girder bridge. When the peak ground acceleration (PGA) of the ground motion was 0.3 g, the moderate and serious damage probabilities of the piers in the steel–concrete composite bridge were only 54.61% and 60.89%, respectively, of those of the reinforced concrete bridge. Consequently, replacing the upper reinforced concrete girders with steel–concrete composite girders can significantly improve the seismic performance of a large number of existing bridges.

1. Introduction

Medium- and small-span girder bridges were commonly used in highway and railway transportation systems due to their easy construction [1,2]. Reinforced concrete girder bridges have been widely used in practical scenarios due to their low cost, good compression performance of concrete materials, and high tensile strength of rebar. Under the load of vehicles, the upper edge of the main girder in these bridges is subjected to compression, while the lower edge is under tension for a simply supported girder bridge. Some concrete girders experience cracking and damage throughout their service life. The stiffness and load-bearing capacity of the concrete girders are significantly affected, which results in the need for their replacement. To optimize the mechanical properties of the materials, steel with excellent tensile performance can be used as the lower edge of the girder [3,4,5]. A girder with the upper section made of concrete and the lower section made of steel is referred to as a steel–concrete composite girder. Steel–concrete composite girders not only leverage the advantages of concrete and steel materials but also offer benefits such as rational overall force distribution, convenient construction, and environmental friendliness [6,7,8,9]. With the increasing emphasis on green and sustainable construction practices and the ongoing transformation and upgrading of bridge infrastructure, the proportion of standardized and industrialized steel–concrete composite girder bridges in highway and railway projects was steadily rising [10,11,12]. Therefore, replacing old or damaged concrete girders with steel–concrete composite girders is a feasible, effective, and promising method.
Replacement with steel–concrete composite girders not only addresses issues related to the degradation of upper structure performance or insufficient load-bearing capacity, but also improves the seismic performance of the bridge [13,14]. Seismic damage investigations of previous earthquakes have revealed issues such as abutment concrete cracking, pier concrete crushing, and serious damage of bearings in reinforced concrete girder bridges [15]. The easily damaged parts of reinforced concrete girder bridges are piers, bearings, and abutments [16,17,18]. In order to improve the seismic safety of reinforced concrete bridge and prolong their service life, carbon fiber-reinforced polymers (CFRP) and other materials can be used to strengthen the piers [19]. Compared to reinforced concrete girder bridges, steel–concrete composite girder bridges are 20% lighter in the upper structure, which results in an improvement in seismic performance.
Previous studies have often employed experimental and numerical simulations to separately investigate the seismic performance of reinforced concrete and steel–concrete composite girder bridges [20,21,22,23]. Due to the different structural forms and building materials used in the two types of bridges, there are various uncertainties associated with the two types of bridges [24,25,26,27]. Existing research did not take into account the impact of these uncertainties in the comparative seismic performance studies of the two types of bridges. A quantitative comparative study of the seismic performance of the reinforced concrete and steel–concrete composite girder bridges was essential, employing a probability-based seismic vulnerability analysis approach that can account for the impacts of uncertainties [28,29,30].
The seismic vulnerability analysis approach was used to quantitatively compare the seismic performance of the reinforced concrete and steel–concrete composite girder bridges in the present study. A typical three-span steel–concrete composite continuous girder bridge (referred to as the steel–concrete composite girder bridge) and a three-span reinforced concrete continuous girder bridge (referred to as the concrete girder bridge) were used in this study. Considering the uncertainties of structural parameters in the two types of bridges and the randomness of ground motion, this study utilized the Latin hypercube sampling method to generate bridge samples for probabilistic analysis of bridge seismic demands. Nonlinear dynamic time history analyses of the bridge samples were performed using the OpenSEES platform to establish the finite element model of the two bridges. Probabilistic seismic demand analyses were conducted with the results of the time history analysis. Finally, seismic vulnerability curves of the two types of bridges were established and compared. The seismic performances of the two types of bridges were investigated and the superiority of the composite bridge was discussed. The research conclusions can provide guidance on both seismic performance assessment of existing bridges and the formulation of seismic performance enhancement schemes.

2. Fundamental Theory

2.1. Uncertainty

The seismic demand of a bridge is uncertain and primarily influenced by the excitation source (ground motion) and the excitation object (structural model). The uncertainty of ground motion is inherently accidental and cannot be artificially controlled due to its high randomness. However, the uncertainty in the structure, which is related to cognitive uncertainty caused by insufficient knowledge or operational errors, can be reduced through artificial means, such as improving the model. Therefore, the seismic response of a bridge is a composite random vibration with randomness originating from both the ground motion and the bridge. Deterministic seismic demand analysis method is challenging in consideration the influence of various uncertainties on the seismic demand analysis of bridges. While the probabilistic seismic demand analysis method is an effective approach to address this issue.
Due to the complexity of site conditions, ground motion records of the same earthquake measured are always different at an array of stations. Therefore, it is difficult to capture the uncertainty of ground motions when using a limited number of actual seismic records. From statistical perspective, at least 40 ground motions are required to conduct statistical analyses of the uncertainty in ground motions. Additionally, synthetic seismic waves often fail to adequately represent the uncertainty of real ground motion. In this study, 100 real ground motion records were selected from the database of the Pacific Earthquake Engineering Center in the United States to comprehensively consider the uncertainty of ground motions in the seismic demand analysis of the two types of bridges.
The uncertainty of the structure is always described by uncertain parameters. Existing research, considering the diversity of bridge forms, construction materials, and construction levels, has identified parameters that describe the uncertainty of bridge structures. These parameters mainly include material aspects (such as concrete strength and steel strength), structural aspects (such as structural quality, damping ratio, expansion joint width, and concrete cover thickness), and geometric dimensions (length and width of each section). It is challenging to account for the uncertainties of the geometric dimensions of all components in the bridge considering the large number of components in a real bridge structure [24,31,32,33]. For bridges that have already been constructed and used, their geometric dimensions have been determined. Therefore, this study only focused on material and structural uncertainties, and their probability distributions are presented in Table 1.

2.2. Seismic Vulnerability

Performance-based seismic engineering is an approach that enables the seismic design of structures to determine structural performance objectives that minimize seismic risk. Seismic vulnerability was a key in performance-based seismic engineering that involves the assessment of a structure’s capacity to resist seismic demand. In recent years, an increasing number of countries have adopted performance-based seismic design frameworks in their bridge seismic codes, making vulnerability analysis the main method for bridge seismic performance evaluation. Seismic vulnerability can be defined using Formula (1) proposed by Shivang et al. [29].
P f = P L S I M = y
LS (limit state) refers to the state of failure of a structure or component, while IM (ground motion intensity parameter) indicates the intensity of the ground motion.
The seismic demand of a structure signifies its reaction to seismic activity, determined by a specific ground motion intensity index. The seismic capacity of a structure denotes the maximum load it can endure under various limit states. Consequently, the seismic vulnerability of the structure can be quantified as the probability that the seismic demand surpasses the seismic capacity. This relationship is mathematically expressed in Formula (2):
P f = P D C 1
In Formula (2), C represents the seismic capacity of the structure and D represents the seismic demand of the structure. The lognormal distribution function is a suitable model for capturing the probability distribution of both C and D [30]. Consequently, the seismic vulnerability of the structure can be effectively characterized using Formula (3):
P f = ϕ I n D ^ C ^ β D 2 + β C 2
In Formula (3), Φ [•] represents the standard normal distribution function. C ^ and D ^ denotes the median value of C and D, respectively. Similarly, β C and β D represents the logarithmic standard deviation of C and D, respectively. Cornell et al. proposed an approximate relationship between structural seismic demand and ground motion intensity, which can be expressed as Formula (4) [34].
D ^ = a I M b
In Formula (4), a and b are fitting coefficients. Substituting Formula (4) into Formula (3), the normal distribution function expression of structural seismic vulnerability is Formula (5).
P f = ϕ b I n I M + I n a I n C ^ β D 2 + β C 2
Based on Formula (5), the vulnerability of individual component can be determined. In fact, a bridge always consists of multiple components such as piers, abutments, and bearings. The calculation of the failure probability of the entire bridge system becomes challenging due to the structural complexity [35,36]. To simplify the analysis, it is common practice to treat the system as a series system and use the first-order boundary method to establish the seismic vulnerability upper and lower bounds of the entire bridge system, which is calculated using Formula (6).
max i = I m P f i P f s 1 i = 1 m 1 P f i
In Formula (6), Pfs represents the seismic vulnerability of the entire bridge system, m represents the number of components, and Pfi represents the vulnerability of a component, which was calculated using Formula (5). By applying the theory of probabilistic seismic demand analysis, the damage probability of bridge components (piers, bearings, and abutments) and the entire structure under a given ground motion intensity (IM) can be derived. Then, the seismic performance of the two types of bridges can be quantitatively compared.

3. Engineering Examples

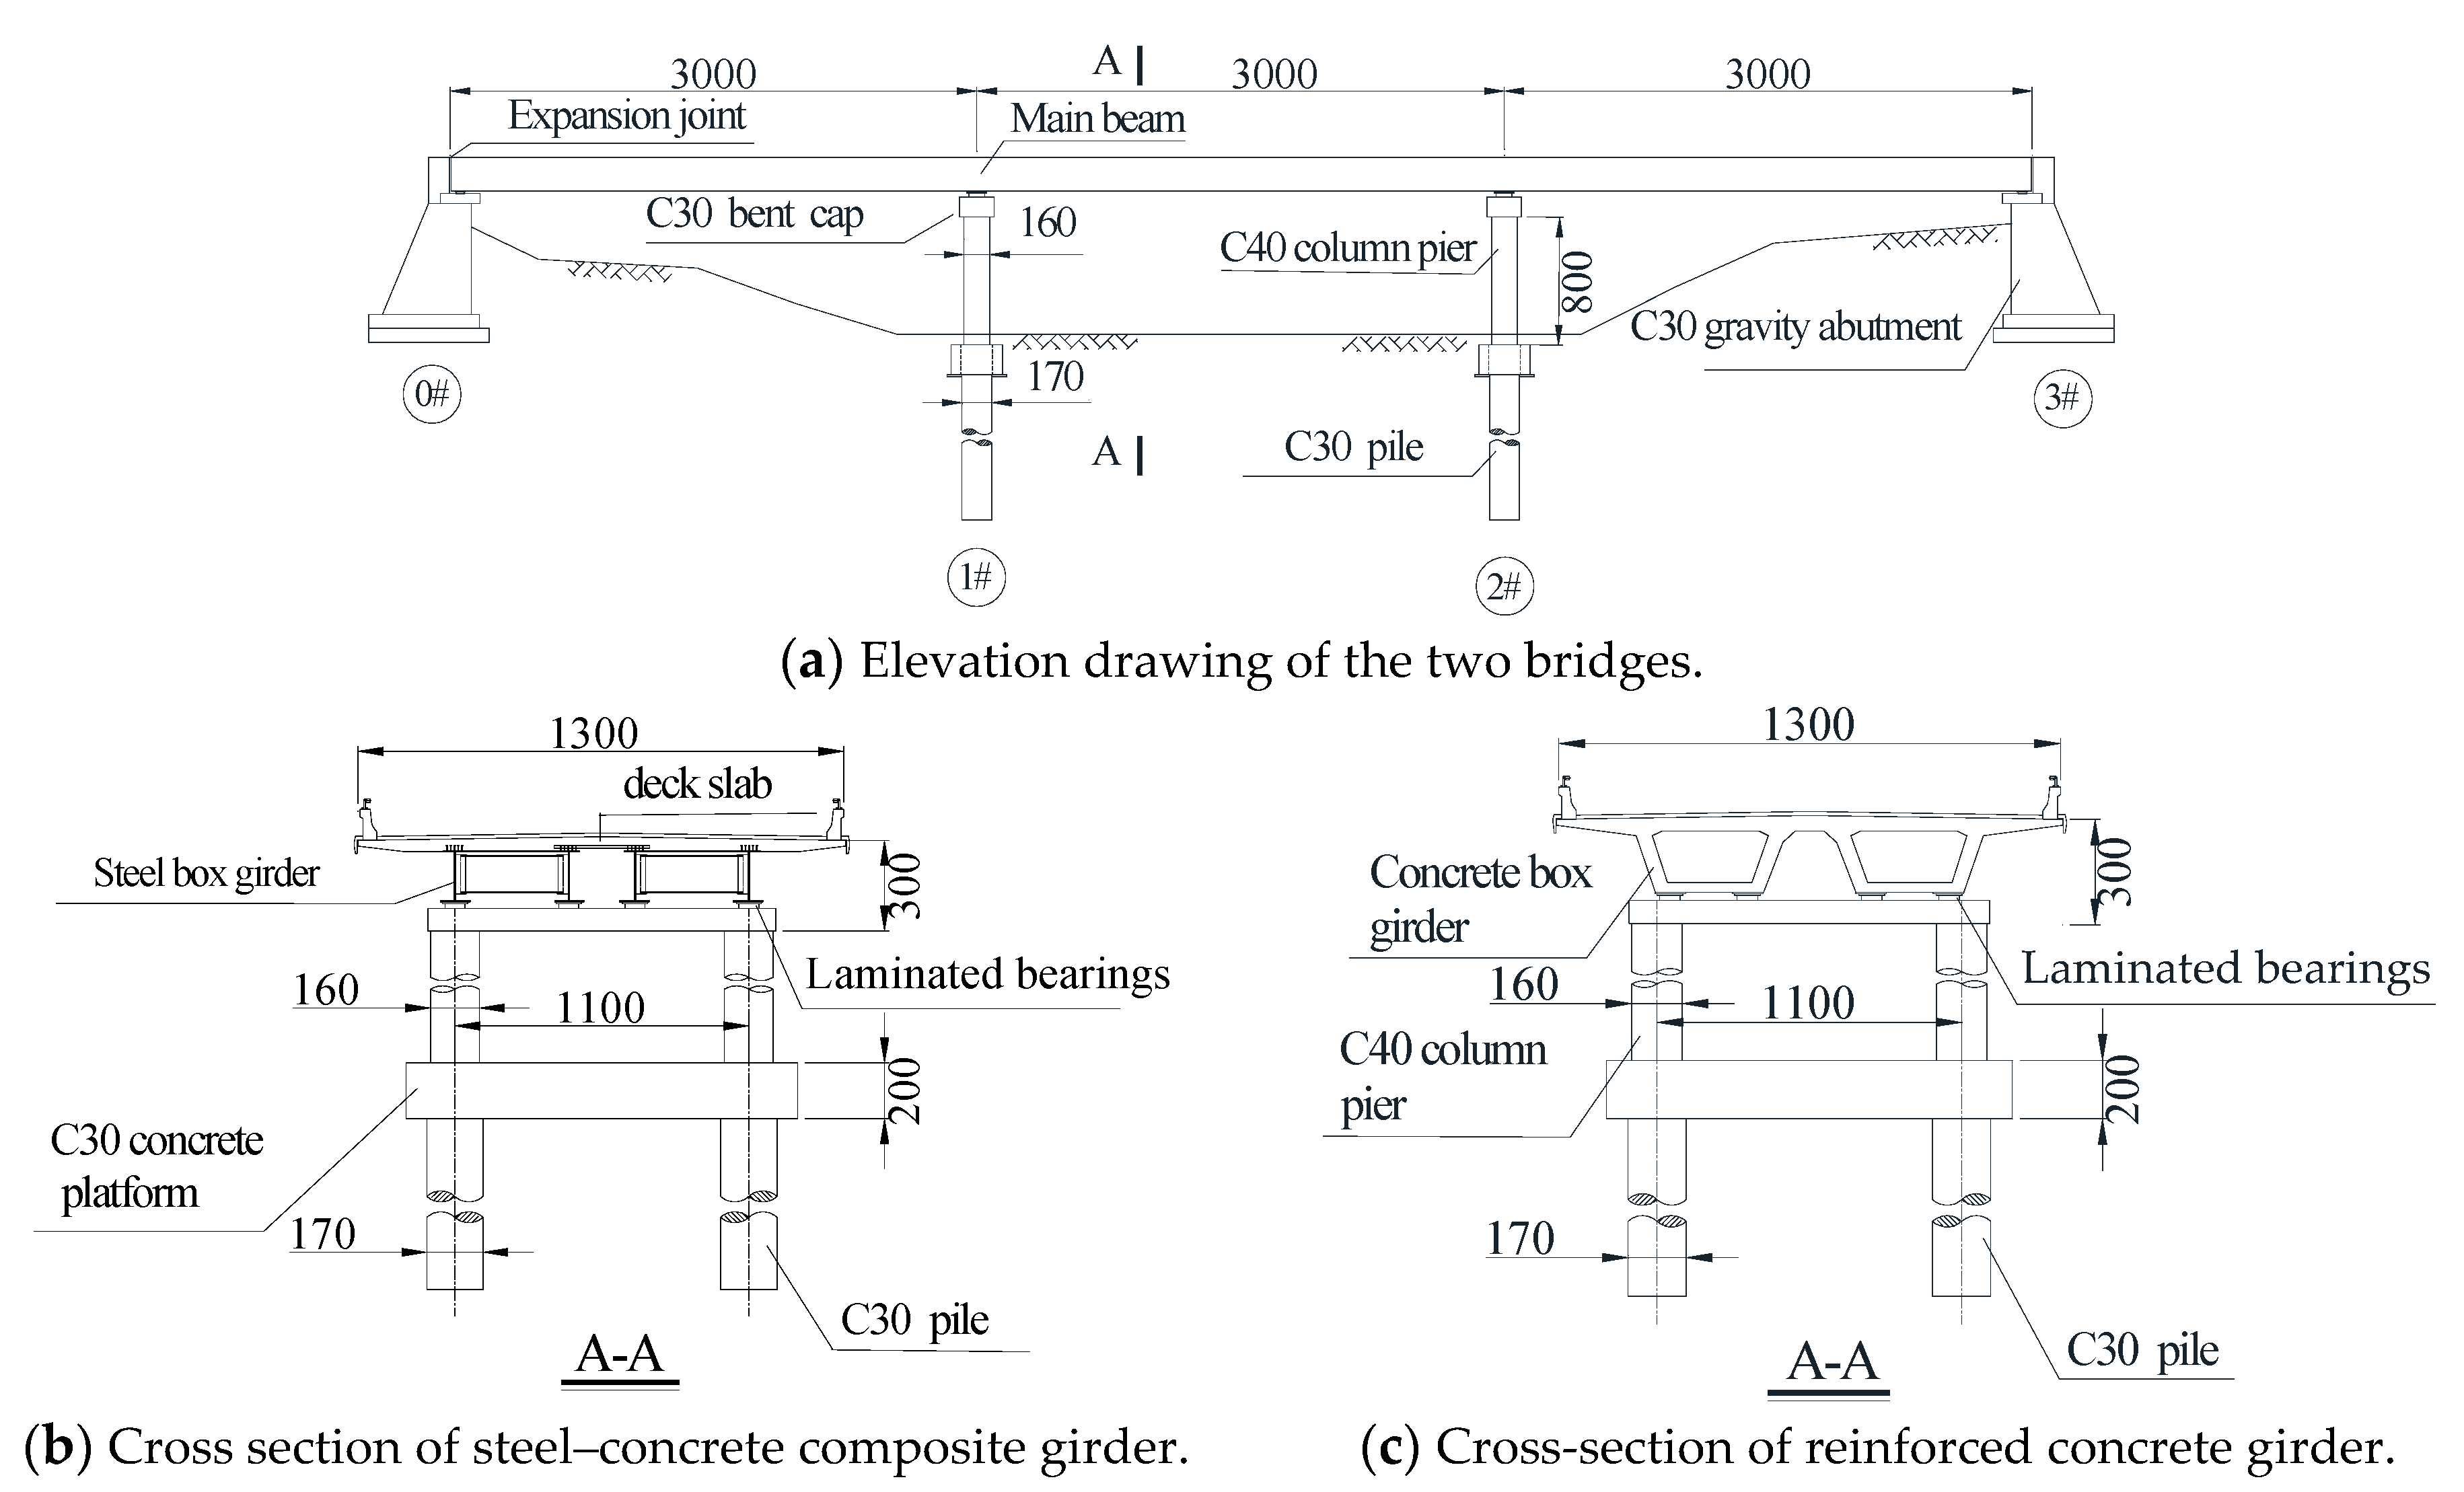
3.1. Bridge Overview

In this study, a 3 × 30 m steel–concrete composite continuous girder bridge and a 3 × 30 m reinforced concrete continuous girder bridge were selected to compare their seismic vulnerability (Figure 1). The upper structure of the two girder bridges has a full width of 26.5 m, with a separation of 0.5 m between the two bridges. The width of each bridge was 13 m. The steel–concrete composite continuous girder bridge consists of four steel main girder. The steel–concrete composite girders were made of Q420qD steel and have a height of 2 m. The outer steel girder spacing was 4 m, with a 1 m cantilever. The steel girder was composed of welded upper and lower flanges and a web plate. The steel girder was prefabricated in factory and connected on-site using high-strength bolts between segments. The bridge deck was a prefabricated reinforced concrete structure with a compressive strength of 50 MPa. The steel–concrete composite girders were composed of upper flanges, lower flanges, and welded webs. The steel girders were prefabricated in factory and connected on-site using high-strength bolts. Transverse connection systems were installed at the top of the piers and in the middle of the spans. The bridge deck was a prefabricated reinforced concrete structure with a thickness of 0.3 m. The standard compressive strength of the concrete was 50 MPa. The reinforced concrete continuous girder bridge was a prefabricated double-box single-chamber structure. The standard compressive strength of the concrete was also 50 MPa. The lower structures of the two bridges were both concrete column piers with a diameter of 1.6 m. The standard compressive strength of the concrete used in the piers and abutments was 40 MPa. Each pier was equipped with four laminated bearings, while each abutment has four laminated bearings with polytetrafluoroethylene (PTFE). The details of the two bridges are shown in Figure 1.

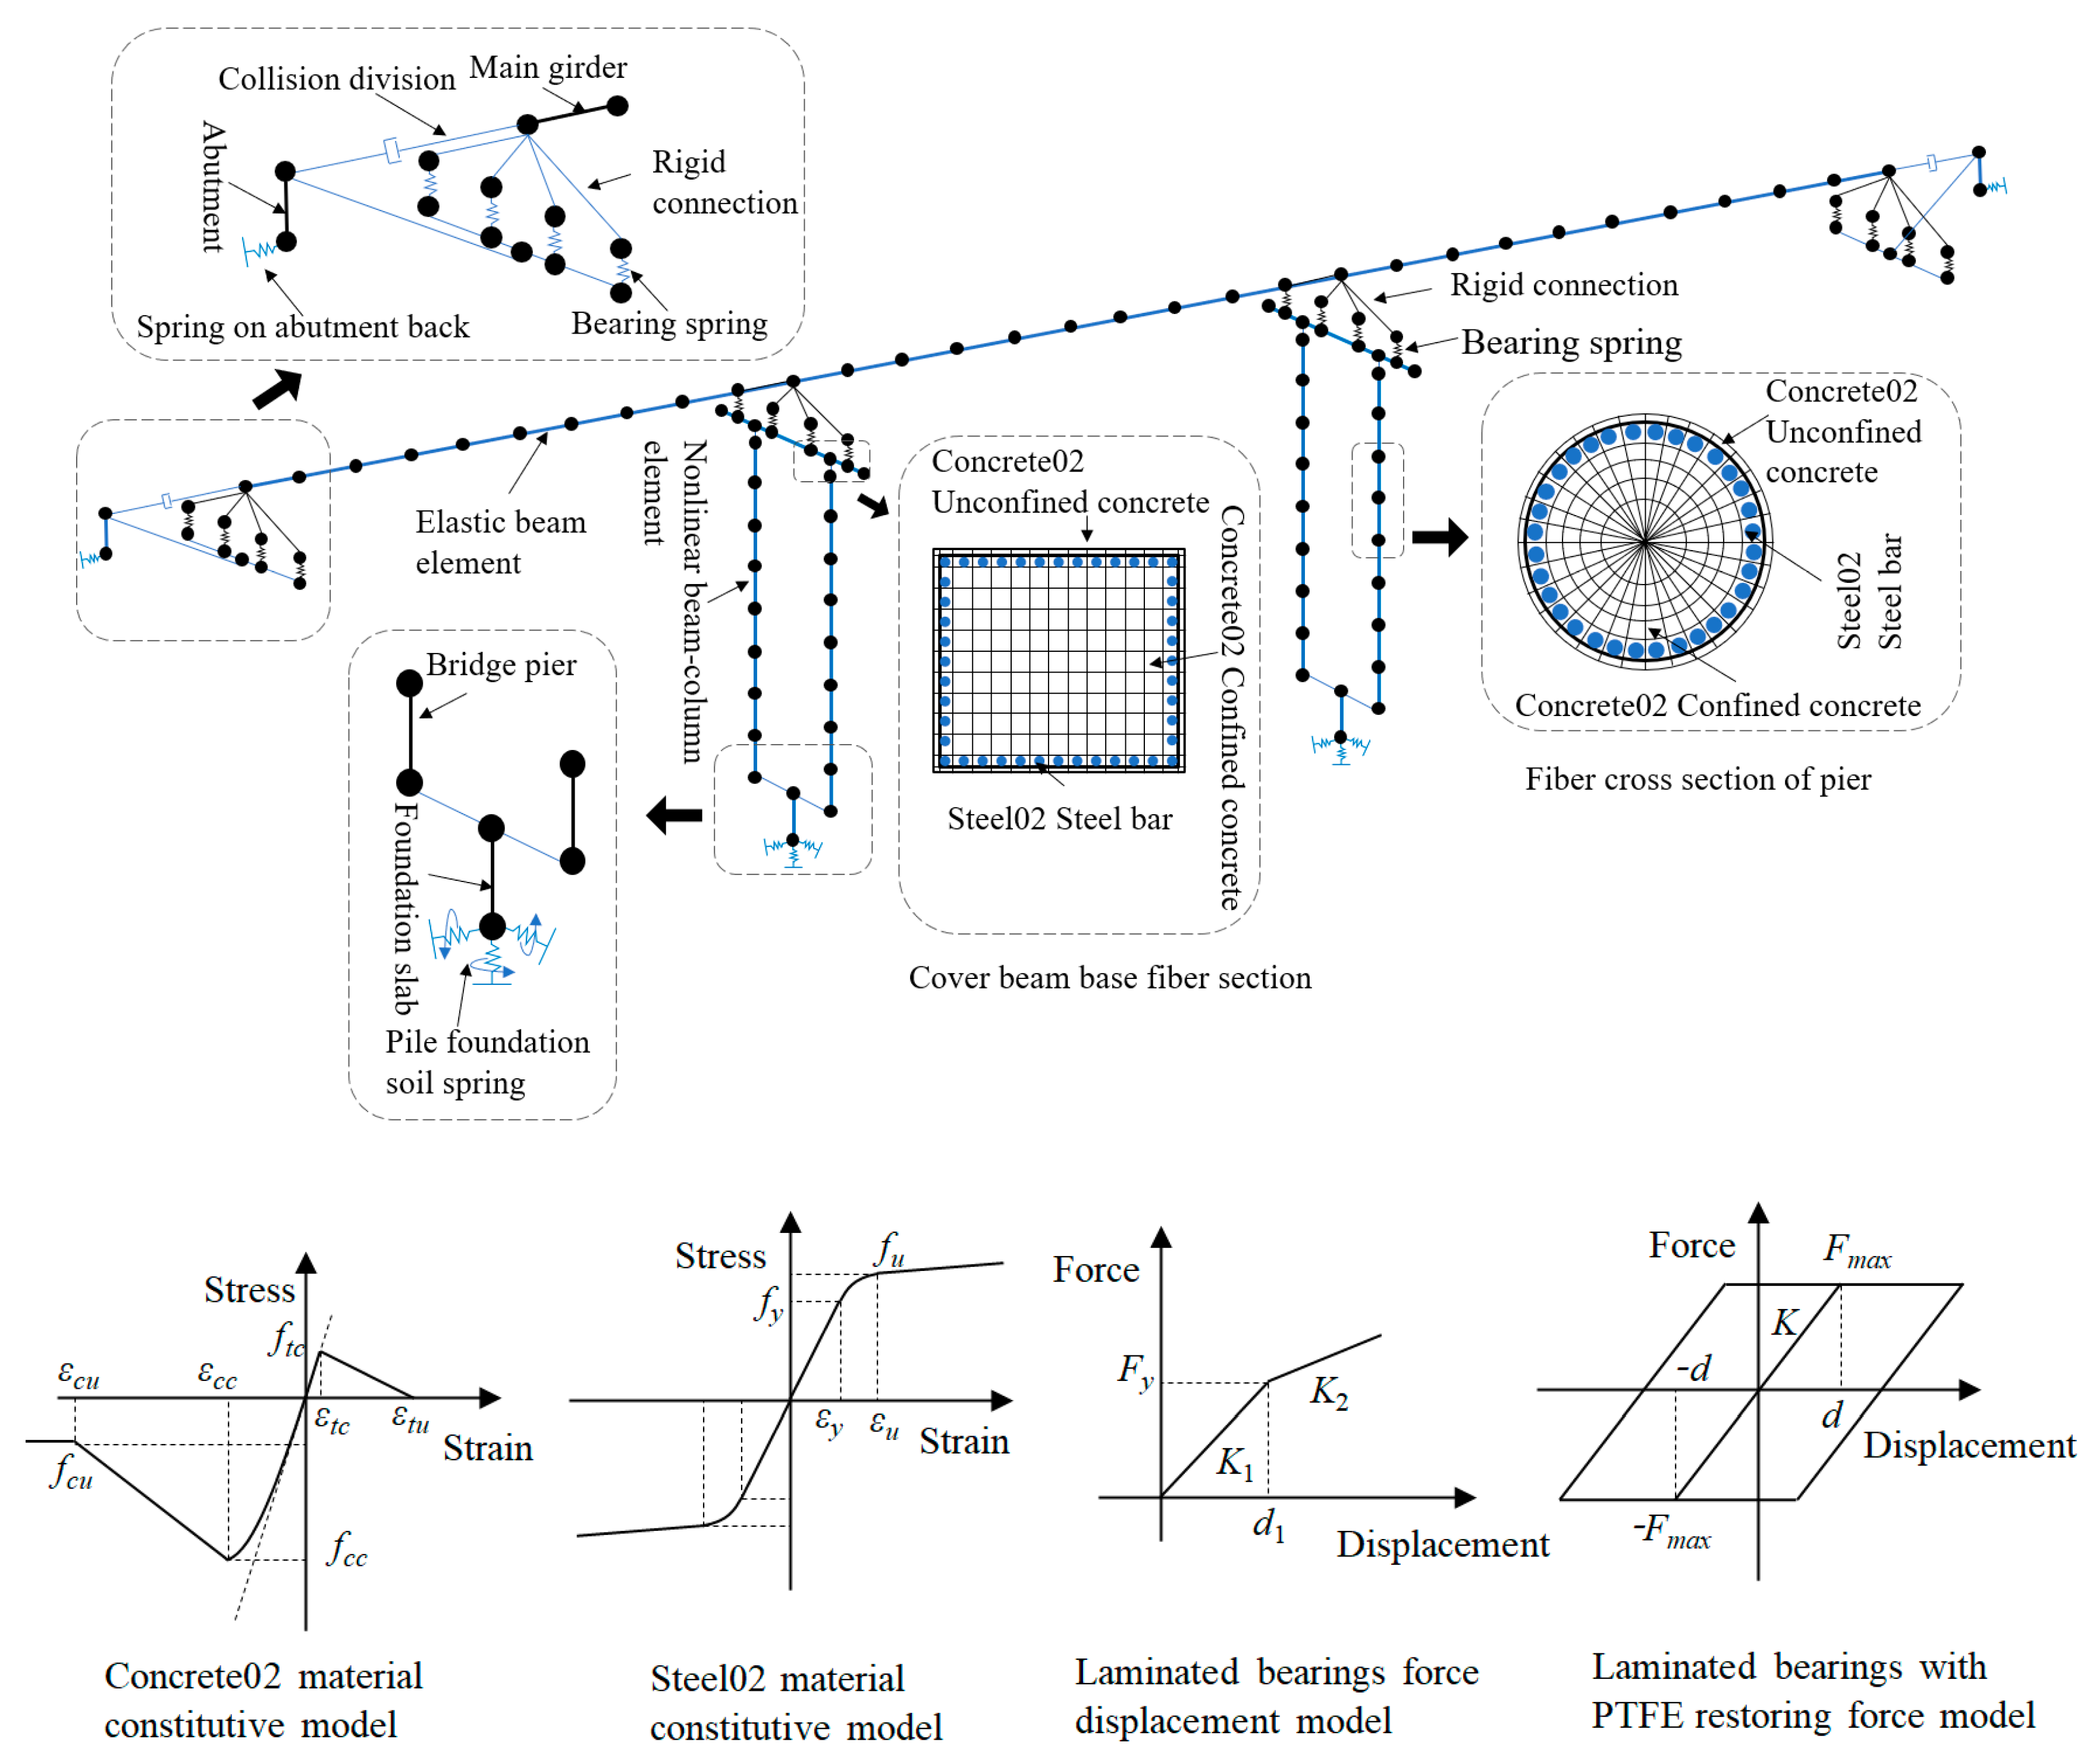
3.2. Finite Element Modeling

The main girder of a bridge typically experiences elastic deformation during an earthquake, while plastic failure may occur in the pier and bent cap. Therefore, the main girder was simulated using elastic beam column elements in the OpenSees platform [2]. The elastic modulus and the moment of inertia of the cross-section were determined based on the material properties and section sizes of the steel–concrete composite girder and concrete girder, respectively. Gravity loads are assumed to be distributed equally among the girders [37]. The pier and bent cap were simulated using nonlinear fiber beam–column elements. The Concrete02 and Steel02 material models were used to model concrete and steel of the pier and bent cap, respectively. The sections of piers and bent caps were divided into fiber sections with corresponding material models [38]. The material constitutive relationships were shown in Figure 2. The bearings were simulated using the Elastomeric Bearing (Bouc-Wen) element and the Elastomeric Bearing (Plasticity) element according to the type of bearings [32]. The expansion joint was simulated using gap single-pressure material and collision element. The pier foundation was simulated using spring elements [39]. The stiffness of the spring element included three translational parameters and three rotational stiffness parameters, which were calculated according to the soil conditions around the piles. The abutment was simulated using the simplified model recommended by the California Bridge Seismic Code [40], and the stiffness of the abutment including the stiffness of the pile foundation and the stiffness of the backfill soil. The whole finite element models of the steel–concrete composite girder and concrete girder established in the OpenSEES platform are shown in Figure 2.

3.3. Probabilistic Analysis of Seismic Demand

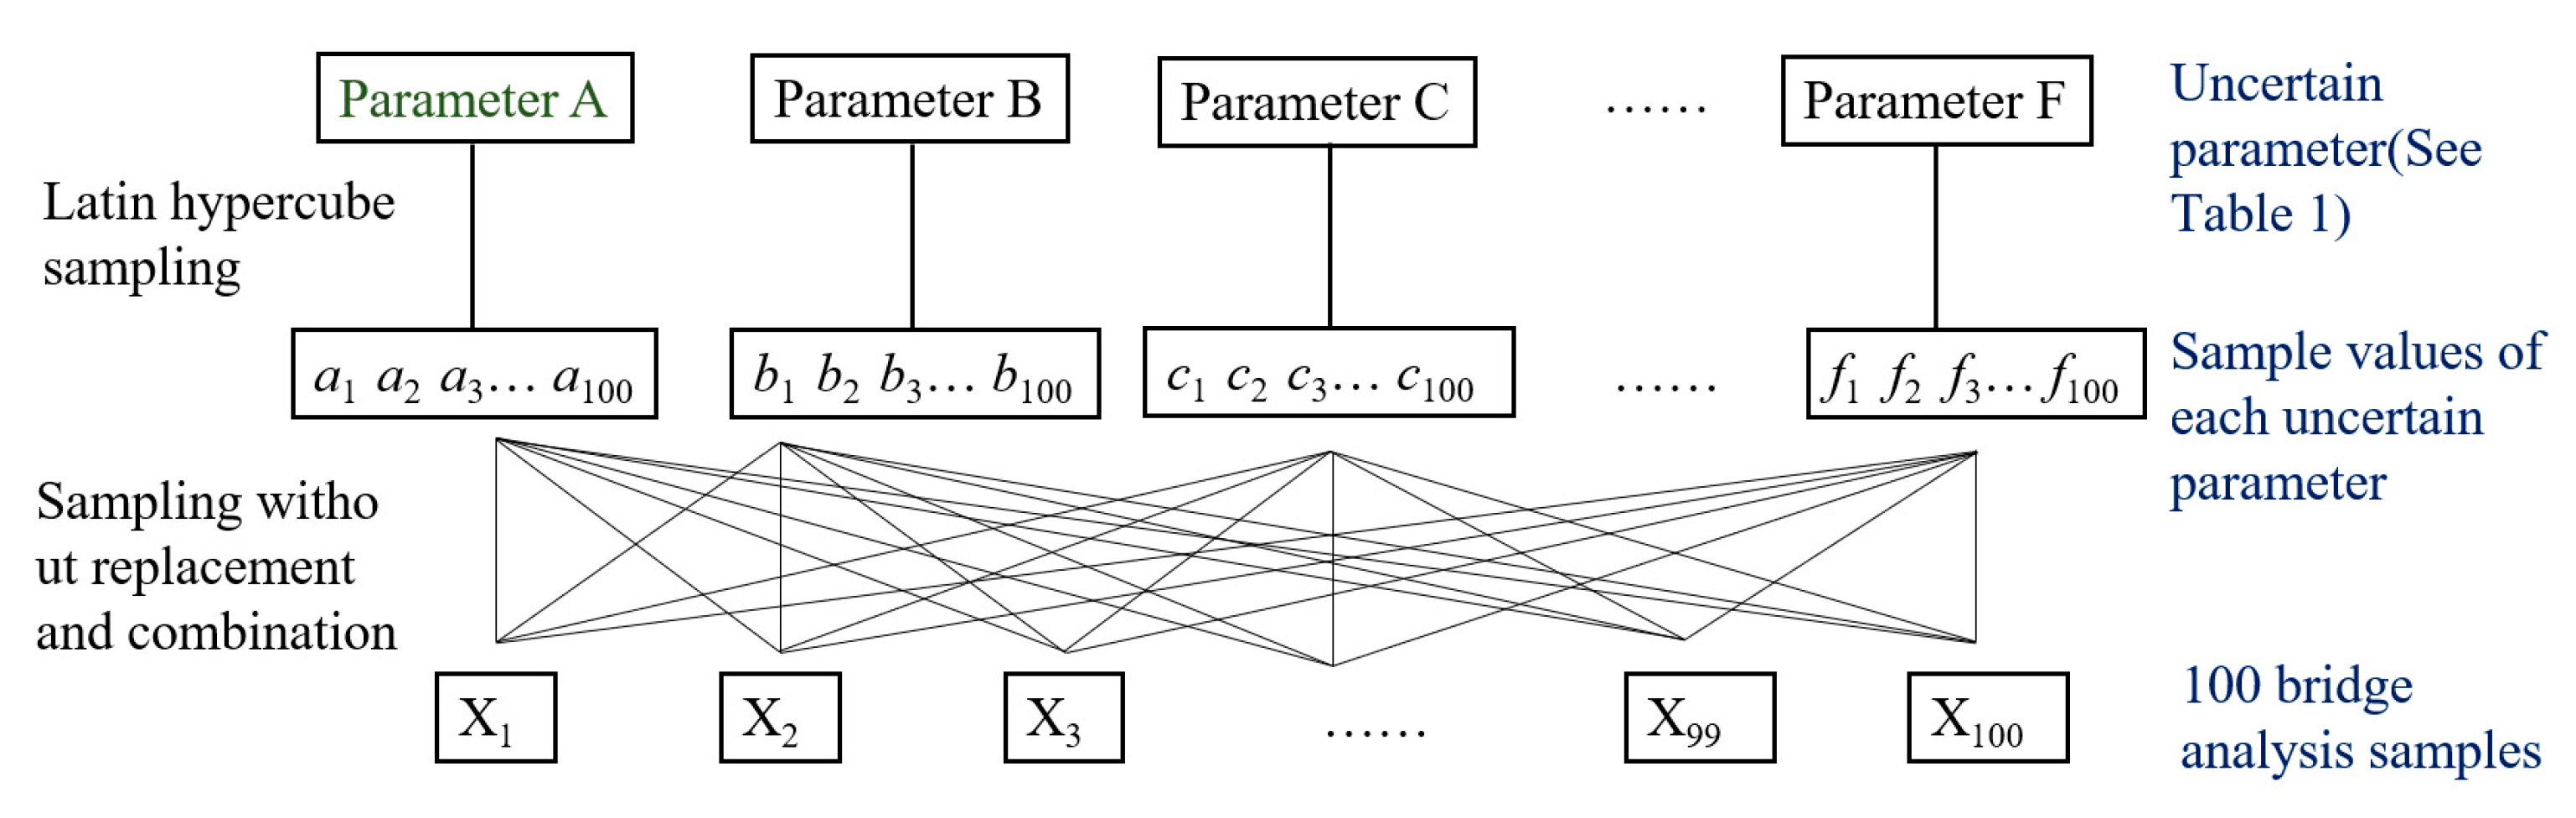
3.3.1. Probability Analysis Samples

Based on the probability distribution characteristics of parameters listed in Table 1, the seismic demand probabilistic analysis samples for the two bridges were generated using the Latin hypercube stratified sampling technique. This needs to divide the probability interval of each parameter from 5% to 95% into 100 columns with equal probability. The mean value of each column was then selected as the sample value for the corresponding uncertain parameter. Notably, the sampling was conducted without replacement, ensuring that the sample value of each parameter was not reused in the process. By randomly combining these sampled values of all the uncertainty parameters in Table 1, a set of 100 bridge samples were generated for the steel–concrete composite bridge and concrete bridge, respectively. The detailed procedure was illustrated in Figure 3.

3.3.2. Ground Motion Records

The Pacific Earthquake Engineering Center Strong Motion Database (NGA-West2) is a comprehensive collection of tens of thousands of real seismic records from various locations worldwide. For this study, 100 real seismic records were selected from this database to meet the statistical regression analysis requirements. The 100 real seismic records were specifically chosen based on the site conditions of the two bridges, ensuring that they represented non-pulse motions. The acceleration response spectra of the 100 selected ground motion records, considering a damping ratio of 0.05, are depicted in Figure 4a. Additionally, Figure 4b presents the corresponding information regarding the magnitude, fault distance, shear wave velocity, and significant duration of the 100 ground motion records.

3.3.3. Nonlinear Dynamic Time History Analysis

The 100 selected ground motion records were randomly combined with the 100 samples of the steel–concrete composite girder bridge and the concrete girder bridge, respectively. Then, 100 sets of ground motion–steel–concrete composite bridge samples and 100 sets of ground motion–concrete bridge samples were developed. Nonlinear dynamic time history analyses of the ground motion–steel–concrete composite girder bridge samples and the ground motion–concrete girder bridge samples were conducted using the OpenSEES platform. The peak ground acceleration (PGA) was used as the intensity index of ground motions. The bearing displacement, pier displacement ductility ratio, and abutment displacement were used as the seismic demand indexes of corresponding components. By applying Formula (4), regression fitting was performed for seismic demands of components and ground motion intensity. The probabilistic seismic demand models for the steel–concrete composite girder bridge and the concrete girder bridge were developed (Figure 5). The mathematical expressions of these models are presented in Table 2 and Table 3.
The p values in Table 2 and Table 3 are significantly smaller than the 0.01 significance threshold, affirming the suitability of the seismic demand regression models for the two bridges. Taking PGA as the ground motion strength index, the fitting effects of the seismic demands of concrete girder bridge and steel–concrete composite girder bridge were both good. Figure 5 depicts the regression model of the seismic demands of the piers, bearings, and abutments of two bridges for the seismic intensity. The probabilistic seismic demands of components in Figure 5 are consistent with the studies conducted by Zhong et al. [38], Shekhar et al. [39], and song et al. [32], verifying the accuracy of the finite element model. The determination coefficient (R2) of the regression models for components in concrete girder bridge are all bigger than 0.5. The determination coefficient of the regression models for components in steel–concrete composite girder bridge are all bigger than 0.6 (Figure 5). This indicates that PGA was a suitable index of ground motion intensity in the probabilistic analysis of seismic demands. Displacement and displacement ductility ratio were suitable seismic demand indexes of corresponding components. Figure 5 indicates that as the seismic intensity increases, the seismic demands of the two bridges significantly increase. Furthermore, the rate of increase in seismic demand is essentially the same for both bridges.

3.4. Seismic Vulnerability of Components

3.4.1. Definition of Limit State

For girder bridges with small and medium spans, the pier may experience slight, moderate, serious, or complete damage states under earthquakes. The slight damage state was defined by the condition that the tensile steel bars began to yield. The moderate damage state was defined by the state that the concrete cover began to fall off. The serious damage state was the state that the core concrete was cracking. The complete damage state was the state that the compressed steel bar was buckling, or the structure was collapsed. In the longitudinal direction, the displacement ductility ratio limit values for the pier under the four damage states were 1.0, 1.2, 1.65, and 3.65, respectively. Similarly, in the transverse direction, the corresponding displacement ductility ratio limit values for the pier under the four damage states were 1.0, 1.35, 1.77, and 3.77, respectively. Displacement was used as the index to quantify the damage state of abutments and bearings. The limit values for displacements in four damage states were 30 mm, 50 mm, 100 mm, and 200 mm. For the laminated bearing located at the piers, the limit values at the four damage states were 40 mm, 100 mm, 150 mm, and 250 mm, respectively. For the laminated bearings with PTFE located at the abutment, the displacement values under the four failure states were 60 mm, 120 mm, 200 mm, and 300 mm, respectively. To account for uncertainties in the limit states of piers, abutments, and bearings, a variation coefficient of 0.25 was applied in slight and moderate damage states, while in serious and complete damage states, the variation coefficient was increased to 0.5.

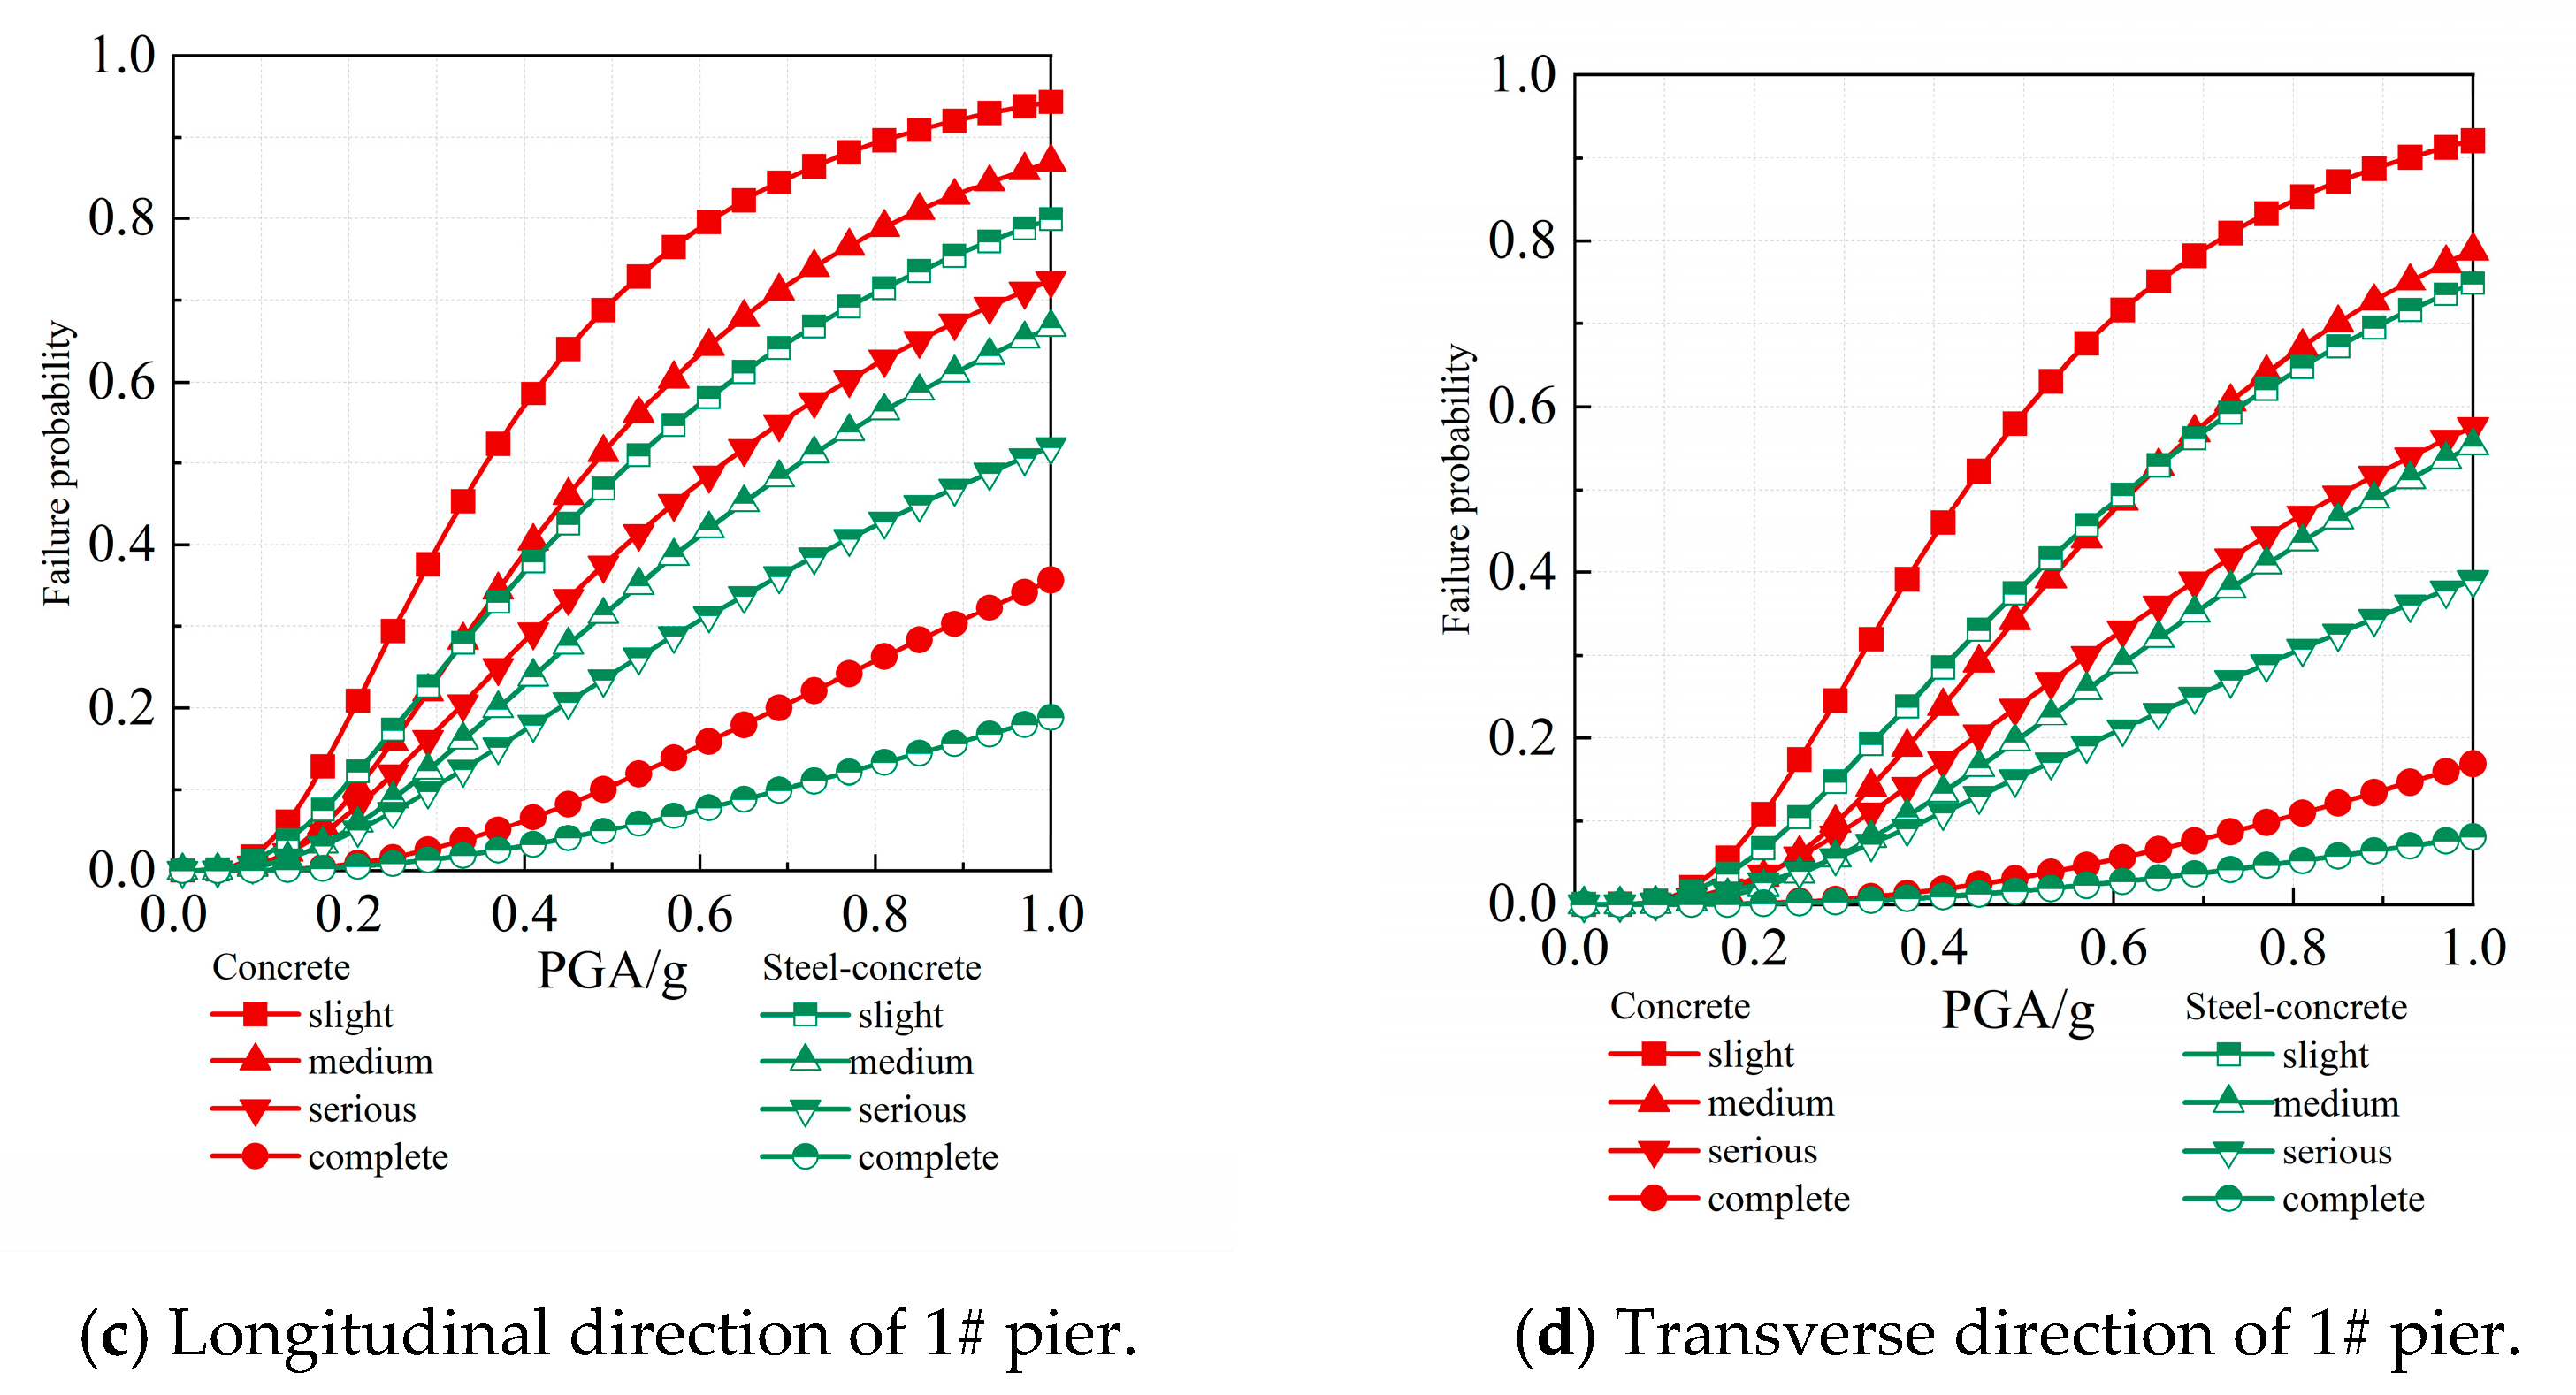
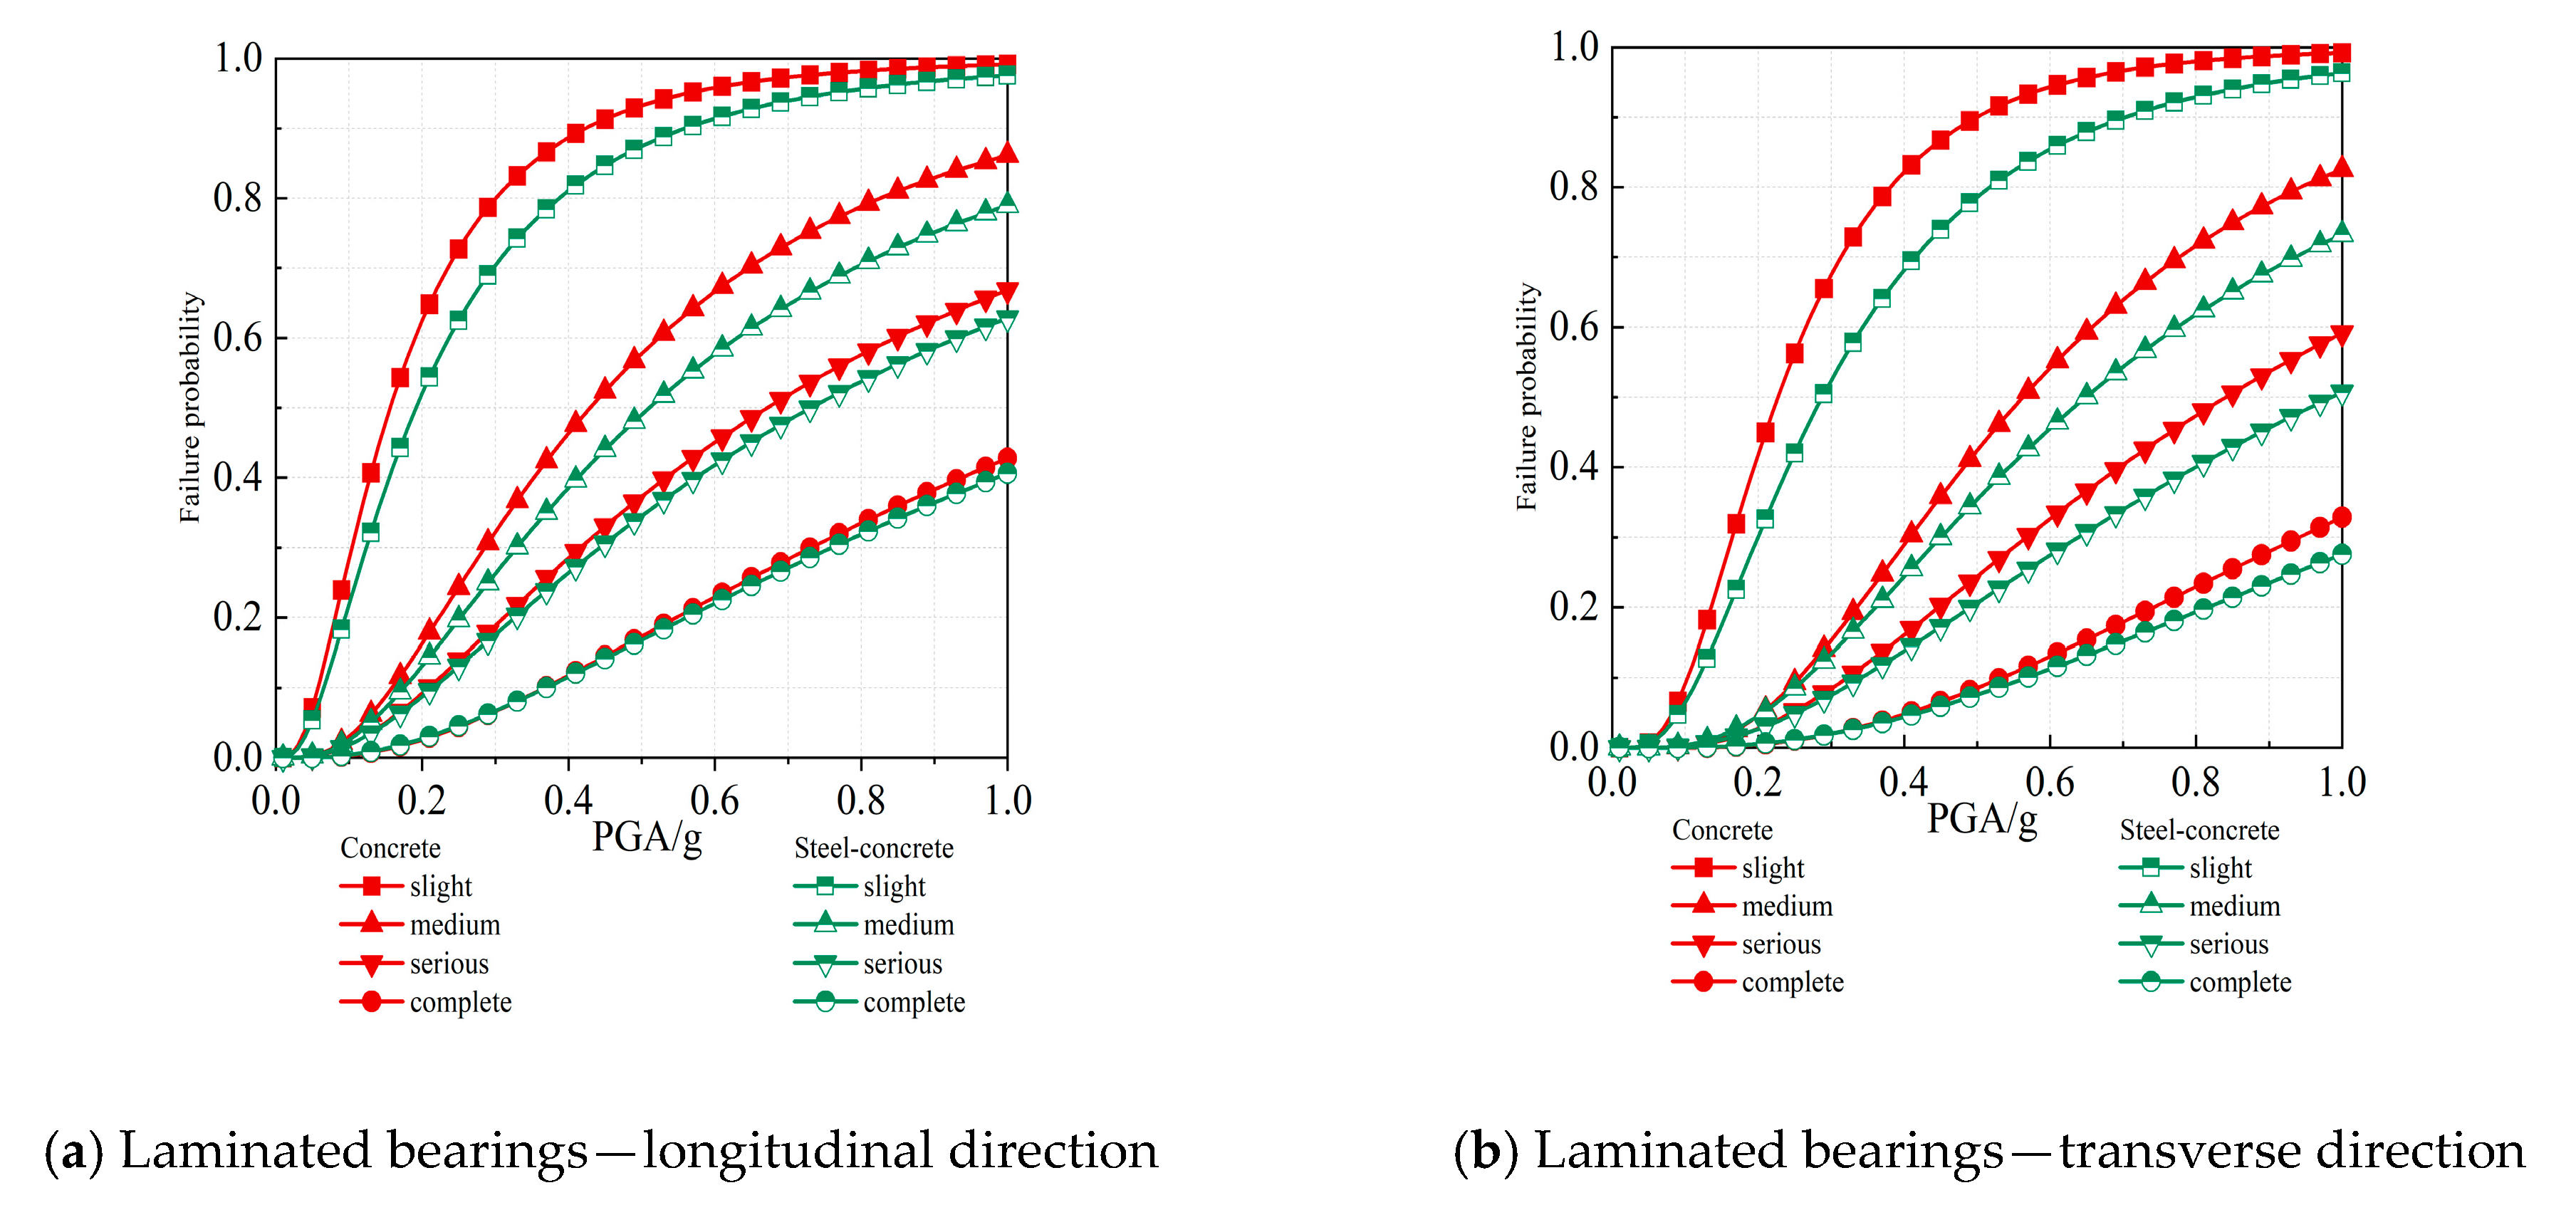
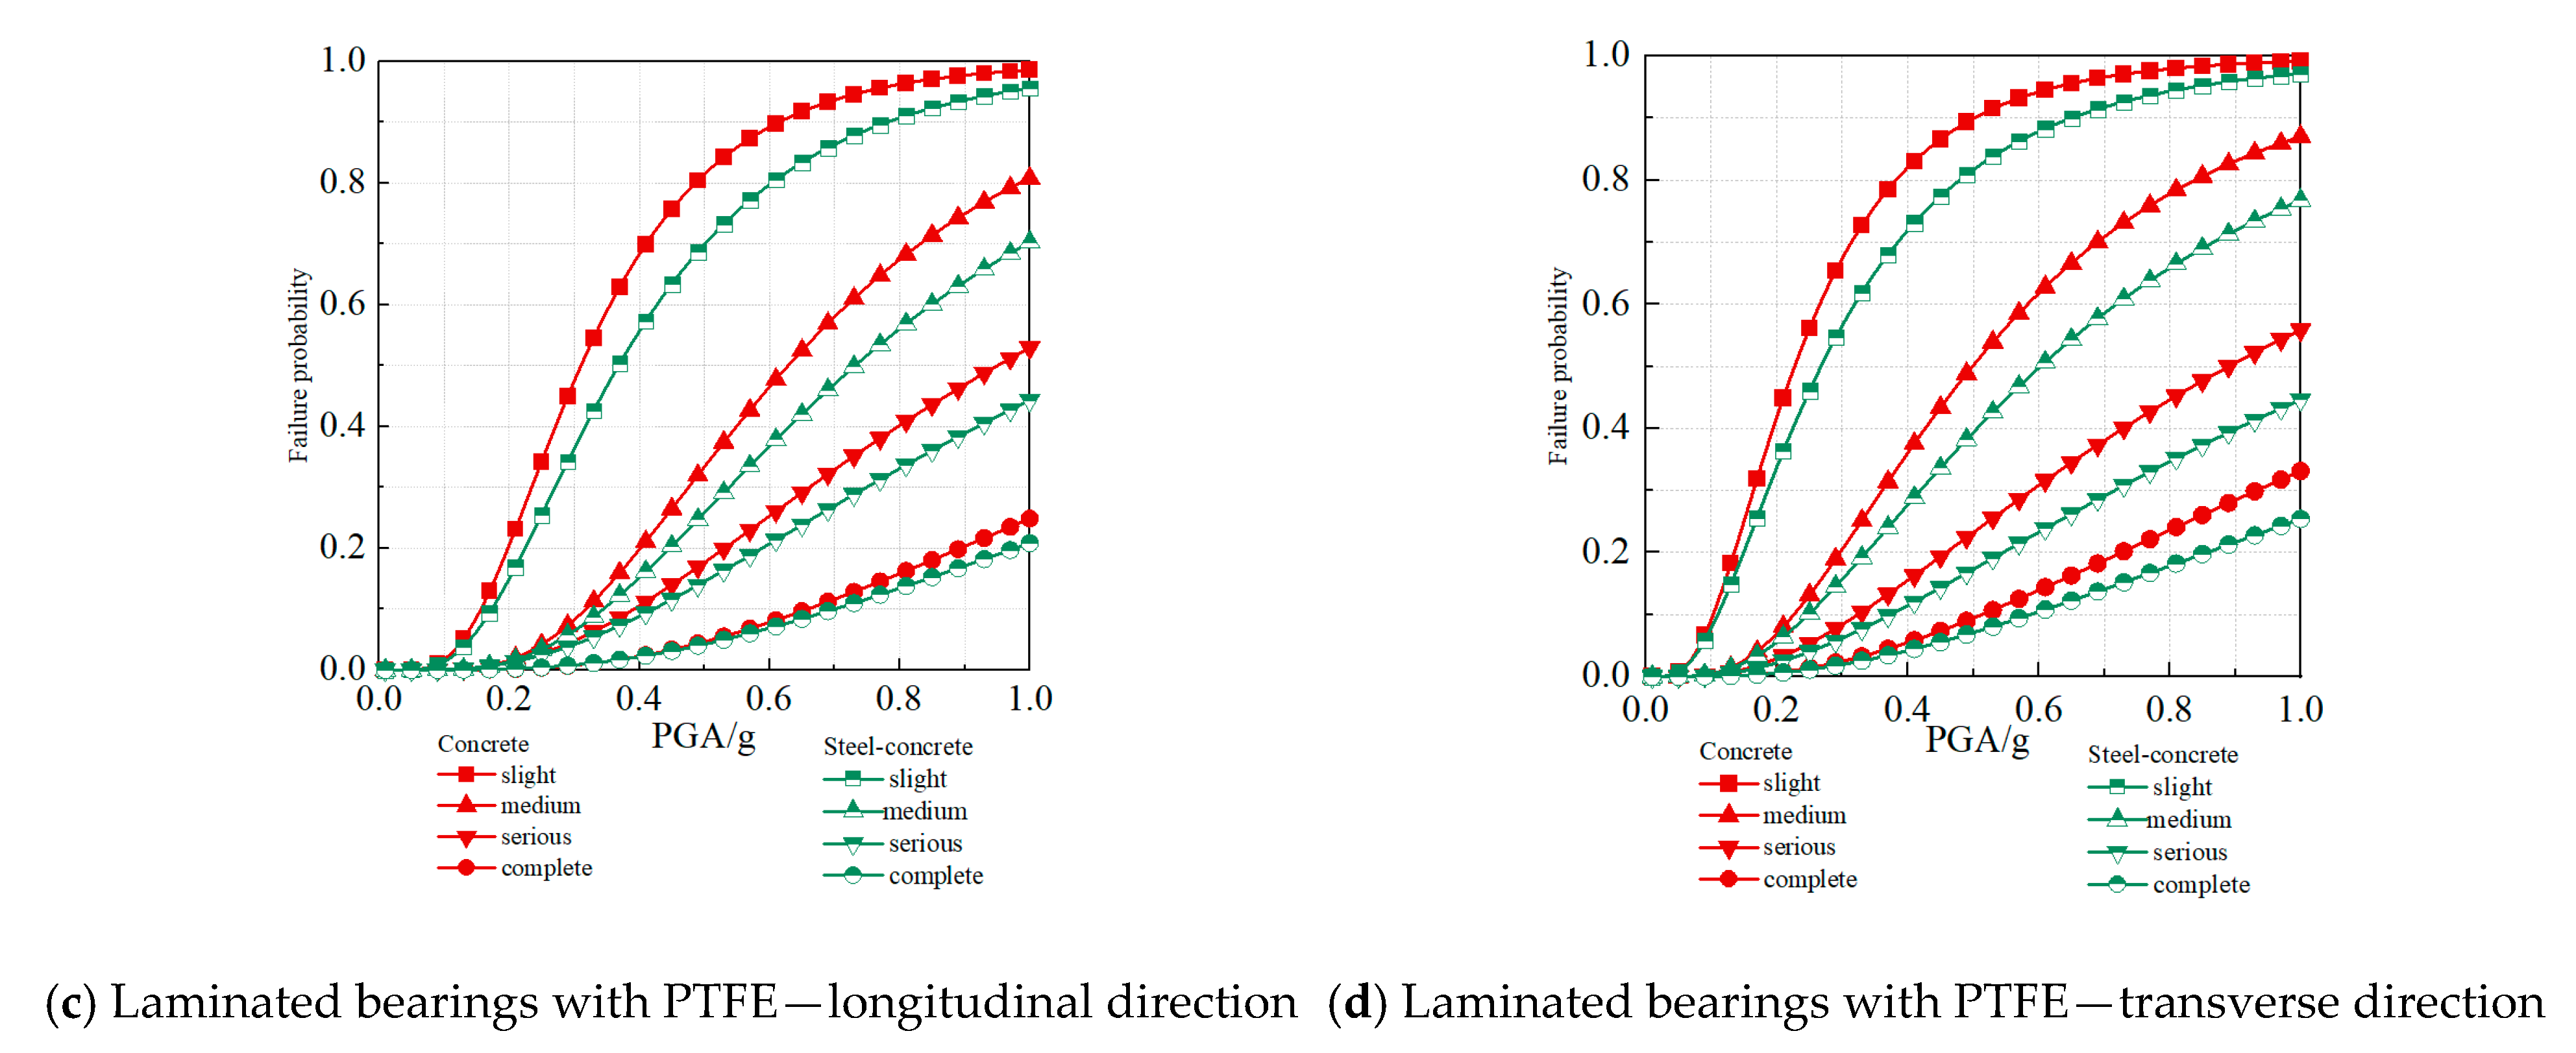
3.4.2. Vulnerability of Bridge Components

Using the seismic demand models of components of in Table 2 and Table 3, the seismic vulnerability of the piers and abutments in the concrete girder bridge and steel–concrete composite girder bridge were computed using Formula (5). The arrangement of abutments and piers in the girder bridge was symmetrical, as illustrated in Figure 1. The seismic performances of 0# abutment and 3# abutment was consistent. The seismic performances of 1# pier and 2# pier were also very similar. Therefore, the seismic vulnerability curves of 0# abutment and 1# pier are shown in Figure 6. The slight damage probability of the concrete bridge at the peak ground acceleration (PGA) of 0.4 g was 57.1%, which was consistent with the result by Shekhar et al. [39] and verified the accuracy of the finite element model developed in the present study.
When the peak ground acceleration (PGA) was 0.1 g, the probabilities of slight, moderate, serious, and complete damage of the piers and abutments in the two types of bridges were all below 3%. The failure probabilities of piers and abutments in the concrete girder bridge and the steel–concrete composite girder bridge were small when the intensity of seismic ground motion was low. With the increase in PGA, the seismic vulnerabilities of the pier and abutment in the steel–concrete composite girder bridges were significantly lower than those of the piers and abutments in the concrete girder bridge. When the PGA was 1.0 g, the four damage probabilities of the pier in the steel–concrete composite bridge in the longitudinal direction were 15.3%, 23.3%, 28.3%, and 47.2% less than those of concrete bridges, respectively. In the transverse direction, the probabilities of the four damage states of the pier in the steel–concrete composite bridge were 18.6%, 29.9%, 32.1%, and 52.0% less than those of concrete bridges, respectively, when the PGA was 1.0 g. When the PGA was 1.0 g, the four damage probabilities of the abutment in the steel-concrete composite bridge were 89.9%, 80.9%, 73.5%, and 70.4% of those of concrete bridges in the longitudinal direction. In the transverse direction, the four damage probabilities of the abutment in the steel–concrete composite bridge were 95.4, 87.5%, 83.8%, and 75.8% of those of concrete bridges when the PGA was 1.0 g.
Table 4 provided a comparison of the probabilities of the four damage states in the longitudinal and transverse directions for the two types of bridges at PGA values of 0.2 g, 0.3 g, and 0.4 g, respectively.
Table 4 demonstrated the seismic performances of piers and abutments in steel–concrete composite girder bridge and concrete girder bridge under various seismic intensities. The improvement was more pronounced in the longitudinal direction than in the transverse direction. At the PGA of 0.3 g, the probabilities of slight, moderate, serious, and complete damage states of the pier in steel–concrete composite girder bridge were 60.5%, 56.4%, 60.9%, and 51.1% of those probabilities of the pier in concrete girder bridge, respectively, in the longitudinal direction.
The failure probabilities of the abutment in the steel composite girder bridge under four damage states decreased to 28.7%, 16.9%, 13.1%, and 9.1% of that of the abutment in the concrete girder bridge, respectively. When the PGA was 0.4 g, the probabilities of the four damage states of the steel–concrete composite girder bridge pier were 64.4%, 58.6%, 61.4%, and 49.0% respectively, compared to the pier of concrete girder bridge, the four damage probabilities of the abutment were 73.4%, 77.0%, 79.8%, and 93.4% of the four damage probabilities of the abutment in concrete girder bridge.
The seismic vulnerabilities of pier and abutment of steel–concrete composite girder bridge were less than those of concrete bridge. With the increase in structural damage degree, the seismic risk of the steel–concrete composite girder bridge pier decreased more obviously, which was significantly lower than that of concrete girder bridge pier.
The laminated bearings with PTFE at the 0# abutment and the plate laminated bearings at the 1# pier was selected for analysis. Using the seismic demand models of bearings in Table 2 and Table 3, the seismic vulnerability curves of bearings were calculated using Formula (5), as depicted in Figure 7.
At the PGA of 0.1 g, the slight damage probability of the laminated bearing in the longitudinal orientation of the steel–concrete composite girder bridge was 21.8%, while the laminated bearing of concrete girder bridge showed a slightly higher probability at 28.3%. The failure probability disparities of laminated bearings of the two bridges remained under 3% at other three damage states.
When the PGA was 0.1 g, the variations in failure probabilities of laminated bearings with PTFE of the two bridges all stayed below 1% at the four damage states. As the PGA increased, the difference between the seismic vulnerability of the bearings of the two girder bridges became more apparent. At PGAs of 0.2 g, 0.3 g, and 0.4 g, the probabilities of the four damage states of the bearings in the two girder bridges are listed in Table 5.
In the longitudinal direction, when the PGA reached 0.3 g, the probabilities of slight, moderate, serious, and complete damage of the laminated bearing in the steel–concrete composite girder bridge were 88.1%, 81.5%, 93.2%, and 99.3%, respectively, of that of the laminated bearing in the concrete girder bridge. Similarly, the four damage probabilities of laminated bearings with PTFE were 76.6%, 78.1%, 87.4%, and 95.1% of those bearings in the concrete girder bridge.
As the PGA increased to 0.4 g, the four damage probabilities of laminated bearing in the longitudinal direction of the steel–concrete composite girder bridge became 91.4%, 83.2%, 92.6%, and 98.3% of those of the concrete girder bridge. The laminated bearings with PTFE of the steel–concrete composite girder bridge exhibited failure probabilities of 81.4%, 76.6%, 83.7%, and 96.4% in comparison to the same bearing in the concrete girder bridge. The seismic performance of both bearing types of the steel–concrete composite girder bridge were better than those bearings in concrete bridge. However, the seismic improvement of the bearing in the two bridges was smaller compared to that of the pier. The alteration of the upper structure has minimal discernible impact on the seismic performance of the bearing.

3.5. Seismic Vulnerability of Bridge System

In order to study the seismic performance of the overall system of the girder bridge, according to the Formula (6), the vulnerability curves of the overall system of the steel-concrete composite bridge and the concrete bridge were established with the first-order boundary method (Figure 8).
At the PGA of 0.2 g, the system probabilities of slight, moderate, serious, and complete damage of the steel–concrete composite girder bridge in the longitudinal direction were 87.1%, 78.99%, 83.67%, and 96.7% respectively, of those of the concrete girder bridge.

4. Discussion

In the longitudinal direction, the difference between the complete damage probabilities of the steel–concrete composite girder bridge system and concrete girder bridge system was small. When the PGA increased to 0.3 g, the system probabilities of slight, moderate, serious, and complete damage of the steel–concrete composite girder bridge in the longitudinal direction were 96.1%, 80.13%, 80.13%, and 88.7%, respectively, of those of the concrete girder bridge. The difference between the slight damage probabilities in the steel-concrete composite girder bridge system and concrete girder bridge system was small. At the PGA of 0.4 g, the system probabilities of slight, moderate, serious, and complete damage of the steel–concrete composite girder bridge in the longitudinal direction were 99.2%, 86.3%, 83.45%, and 85.04%, respectively, of that of the concrete girder bridge. The slight damage probabilities of the steel–concrete composite girder bridge system and concrete girder bridge system were almost the same.
In the transverse direction, when the PGA was 0.2 g, the system probabilities of slight, moderate, serious, and complete damage of the steel–concrete composite girder bridge were 93.2%, 91.6%, 93.5%, and 112.5%, respectively, of that of the concrete girder bridge. The differences between the four damage probabilities of the steel–concrete composite girder bridge system and concrete girder bridge system were also small. When the PGA increased to 0.3 g, the system probabilities of slight, moderate, serious, and complete damage of the steel–concrete composite girder bridge were 98.6%, 87.9%, 87.3%, and 96.3%, respectively, of that of the concrete girder bridge. The slight damage probabilities as well as the complete damage probabilities of the two bridge systems were similar. At the PGA of 0.4 g, the system probabilities of slight, moderate, serious, and complete damage of the steel–concrete composite girder bridge in the longitudinal direction were 99.8%, 91.5%, 87.4%, and 89.1%, respectively, of that of the concrete girder bridge. The slight damage probabilities of the two bridge systems in the transverse direction were almost the same.
The seismic vulnerability of the steel–concrete composite bridge and concrete bridge was different under different earthquake intensity and different damage states. When the ground motion was small, the failure probabilities of the two bridges were close to each other. With the increase in the intensity of ground motion, the difference in failure probability between the two bridges showed a tendency of increasing first and then decreasing. In general, the seismic vulnerability of the composite bridge was lower than that of concrete bridges in both longitudinal and transverse directions.

5. Conclusions

Based on the probabilistic analysis theory, this study assessed the vulnerability of components and the overall system of the steel–concrete composite girder bridge and the reinforced concrete continuous girder bridges. The following conclusions were drawn:
(1)
At the PGA of 0.1 g, the difference between the seismic vulnerabilities in the steel–concrete composite girder bridge and the reinforced concrete girder bridge was small. As the PGA increased, the seismic vulnerability of piers, abutments, and bearings in steel–concrete composite girder bridges gradually decreased compared to reinforced concrete girder bridges, particularly for piers. In the longitudinal direction, at the PGA of 0.3 g, the probabilities of moderate and serious damage of the pier of steel–concrete composite girder bridges were only 54.6% and 60.9%, respectively, of that of the reinforced concrete girder bridge. At the PGA of 0.4 g, the probabilities of serious and complete damage of the piers of steel–concrete composite girder bridges were 61.4% and 49.0%, respectively, of that of the reinforced concrete girder bridge. In the transverse direction, the seismic vulnerabilities of piers in the steel–concrete composite girder bridge were also significantly lower than those of the concrete girder bridge. Replacing the upper reinforced concrete girder with a steel–concrete composite girder significantly improved the seismic safety of the existing bridge piers under strong earthquake intensity.
(2)
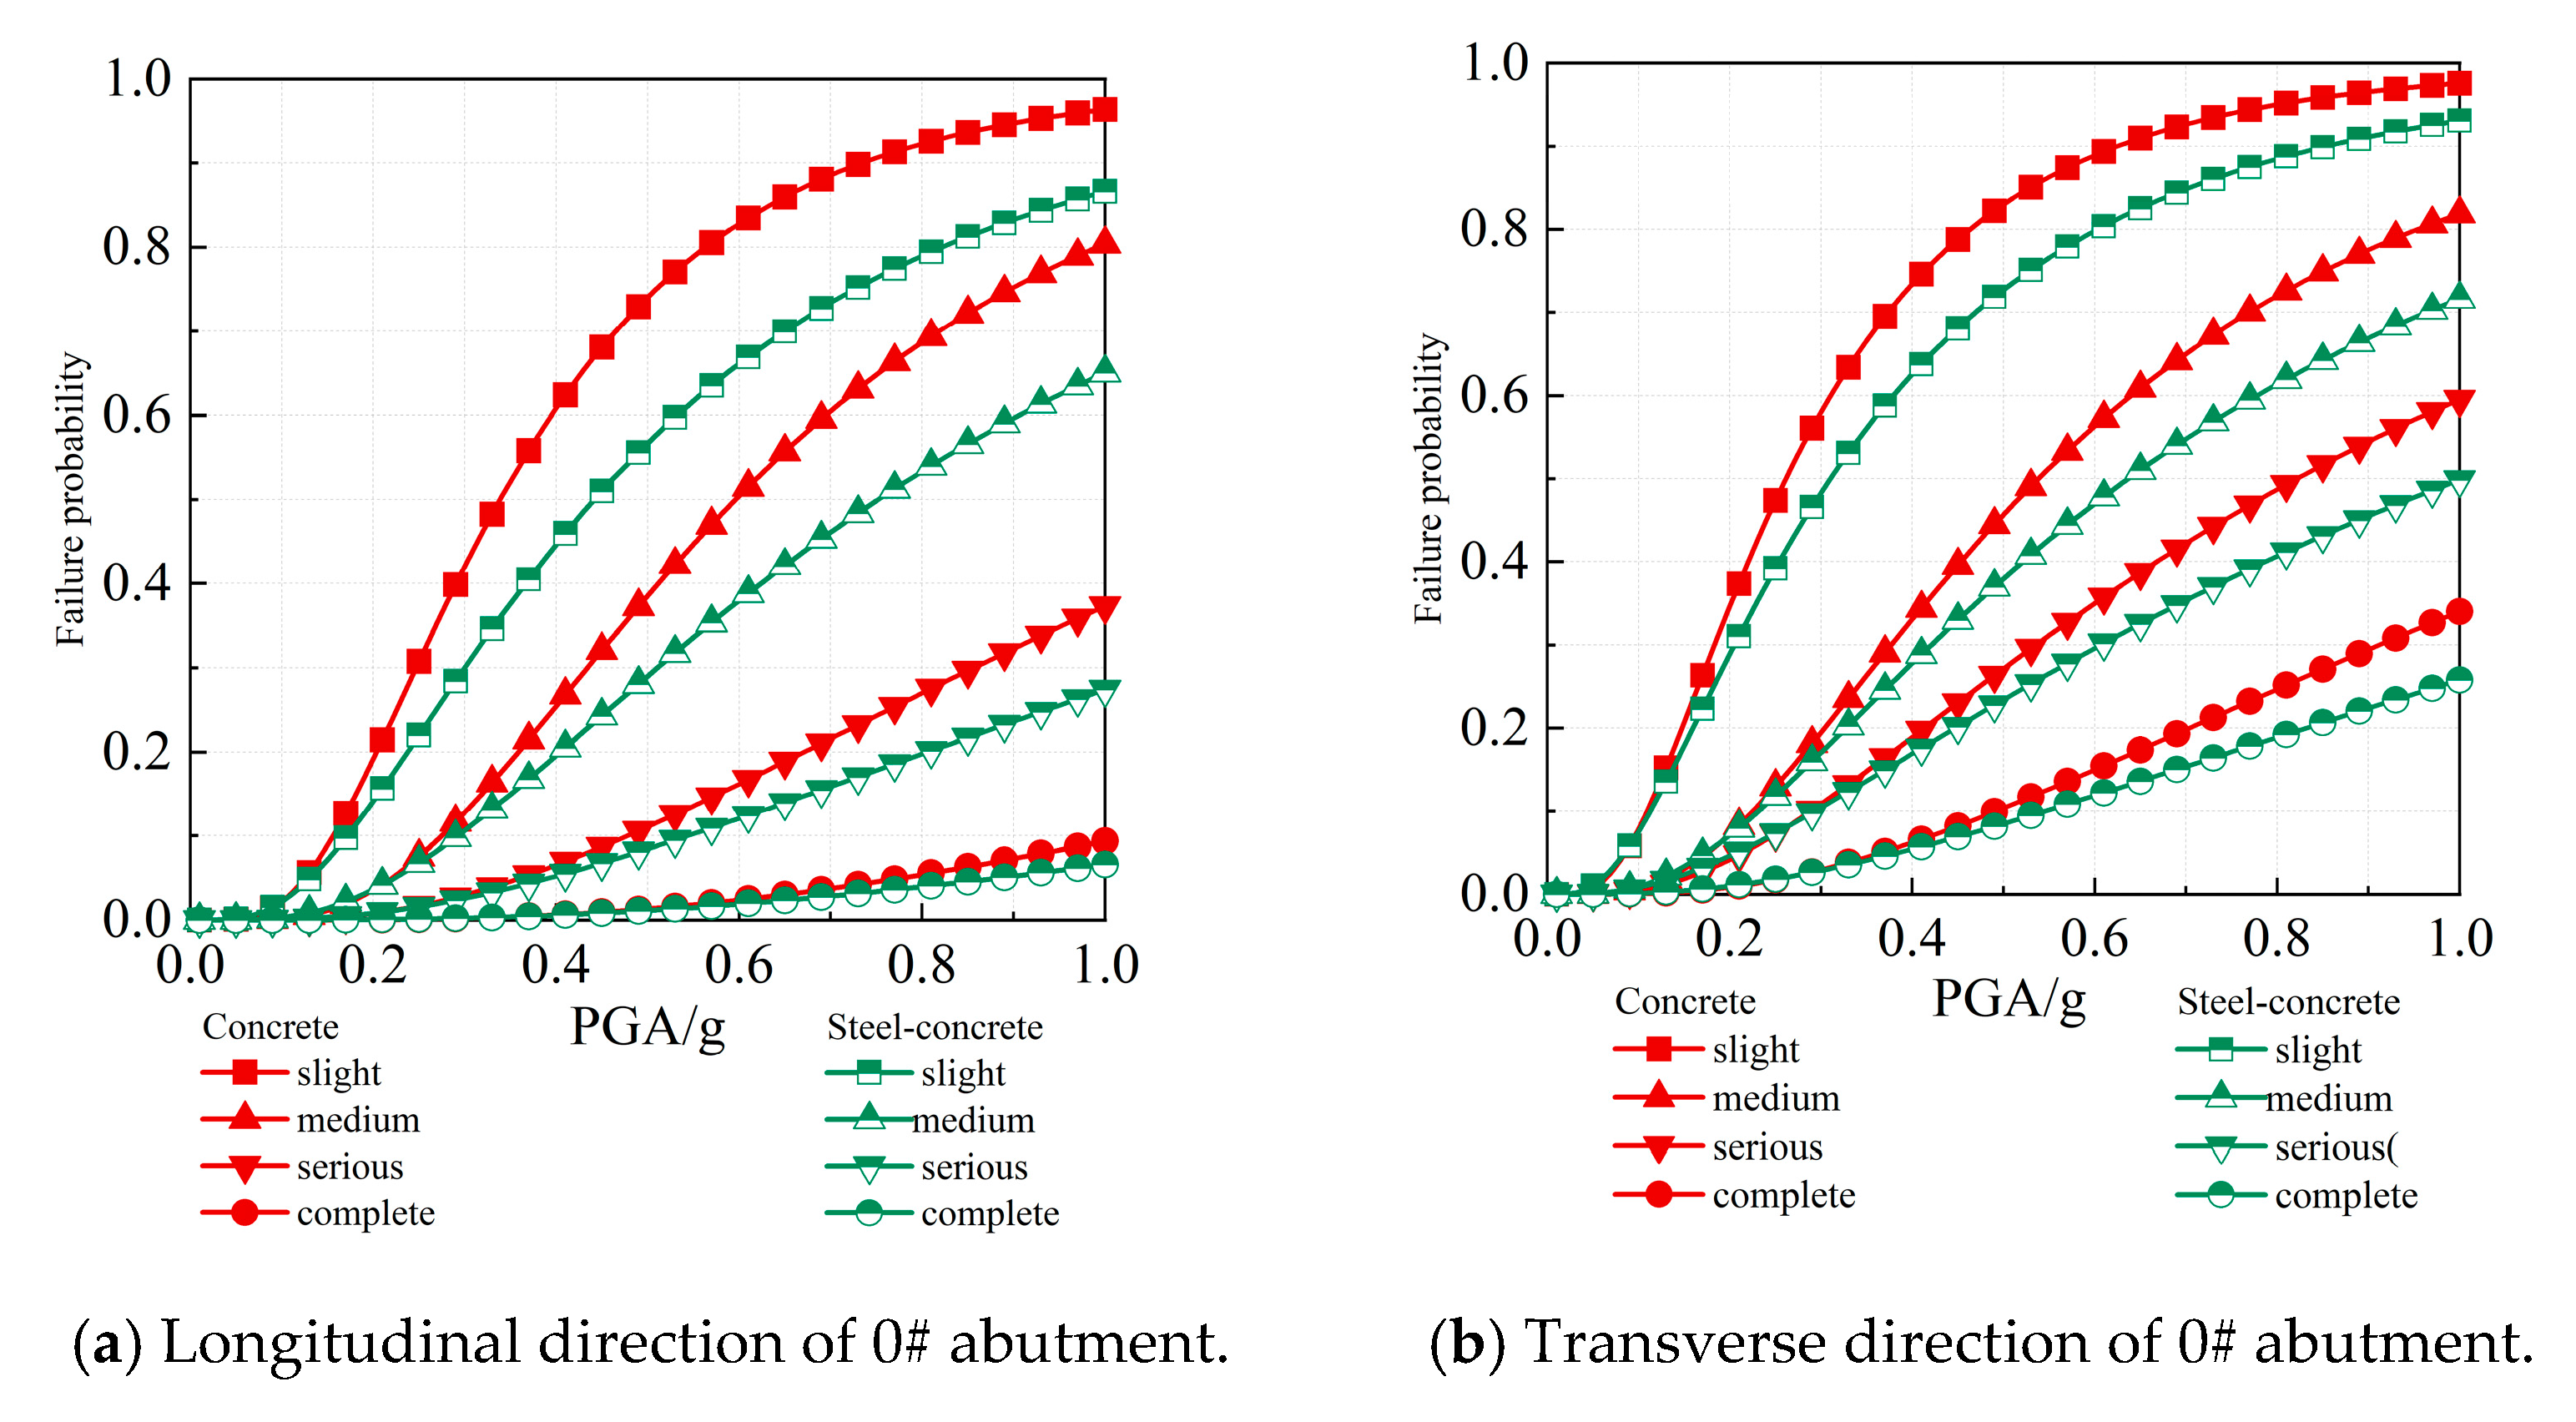
The seismic vulnerabilities of abutments and bearings in steel–concrete composite girder bridges were lower than those of the concrete girder bridge. The four damage probabilities of the abutment in steel–concrete composite girder bridge were 10%–25% lower than those of the abutment in concrete girder bridge. The damage probabilities of the laminated bearings and the laminated bearings with PTFE in steel–concrete composite girder bridge were generally 80%–100% of those of the bearings in concrete girder bridge. Replacing the upper reinforced concrete girder with a steel–concrete composite girder can improve the seismic performance of abutments and bearings, although the effect was not as significant as that observed in piers.
(3)
The overall bridge system of the steel–concrete composite girder bridge exhibited lower probabilities of slight, moderate, serious, and complete damage states compared to the reinforced concrete girder bridge. In the longitudinal direction, the damage probabilities of the steel–concrete composite girder bridge system were generally 80%–97% of the reinforced concrete girder bridge system. In the transverse direction, the damage probabilities of the steel–concrete composite girder bridge system were generally 85%–95% of the reinforced concrete girder bridge system. Therefore, replacing the reinforced concrete girder with a steel–concrete composite girder reduced the seismic vulnerability of the bridge system by about 20%.
The bridge system was composed of girders, bearings, piers, abutments, and other components. Under earthquakes, the bearings, piers, abutments, and other components form a whole system; these components interact with each other. First-order boundary method was used to calculate the system vulnerability of the two bridges in this study and the correlations among girders, bearings, piers, abutments, and other components were not considered. Further research is needed to explore the correlation among the seismic demands of components and the interaction of components in steel–concrete composite girder bridges and concrete girder bridges.

Author Contributions

Conceptualization, B.X. and S.S.; methodology, B.X., X.Z. and S.S.; validation, S.S.; formal analysis, X.Z., W.Z. and B.Z.; investigation, X.Z.; data curation, W.Z. and B.Z.; writing—original draft preparation, X.Z. and B.Z.; visualization, W.Z. and B.Z.; writing—review and editing, B.X., C.S. and S.S; funding acquisition, B.X., C.S. and S.S. All authors have read and agreed to the published version of the manuscript.

Funding

This research was funded by the “Suqian Sci & Tech Program”, grant number K202223.

Data Availability Statement

Data are contained within this article.

Conflicts of Interest

The authors declare no conflicts of interest.

References

  1. Song, S.; Liu, J.; Qian, Y.J.; Zhang, F.; Wu, G. Dependence analysis on the seismic demands of typical components of a concrete continuous girder bridge with the copula technique. Adv. Struct. Eng. 2018, 21, 1826–1839. [Google Scholar] [CrossRef]
  2. Zhou, T.; Li, A.Q. Seismic fragility assessment of highway bridges using D-vine copulas. Bull. Earthq. Eng. 2019, 17, 927–955. [Google Scholar] [CrossRef]
  3. Nie, J.G.; Wang, J.J.; Gou, S.K.; Zhu, Y.Y.; Fan, J.S. Technological development and engineering applications of novel steel-concrete composite structures. Front. Struct. Civ. Eng. 2019, 13, 1–14. [Google Scholar] [CrossRef]
  4. Suwaed, A.S.H.; Karavasilis, T.L. Demountable steel-concrete composite beam with full-interaction and low degree of shear connection. J. Constr. Steel Res. 2020, 171, 106152. [Google Scholar] [CrossRef]
  5. De Angelis, A.; Pecce, M.R.; Logorano, G. Evaluation of the plastic hinge length of steel-concrete composite beams under hogging moment. Eng. Struct. 2019, 191, 674–685. [Google Scholar] [CrossRef]
  6. Gao, Q.F.; Zhang, K.; Wang, T.; Peng, W.K.; Liu, C.Q. Numerical investigation of the dynamic responses of steel-concrete girder bridges subjected to moving vehicular loads. Meas. Control. 2021, 54, 465–484. [Google Scholar] [CrossRef]
  7. Nicoletti, R.S.; Rossi, A.; de Souza, A.S.C.; Martins, C.H. Numerical assessment of effective width in steel-concrete composite box girder bridges with partial interaction. Eng. Struct. 2021, 239, 112333. [Google Scholar] [CrossRef]
  8. Nie, X.; Fan, J.S.; Shi, Y.J. Seismic Behavior of A New Type of Steel-Concrete Composite Rigid Connection. J. Earthq. Tsunami. 2011, 5, 283–296. [Google Scholar] [CrossRef]
  9. Shao, X.D.; Deng, L.; Cao, J.H. Innovative steel-UHPC composite bridge girders for long-span bridges. Front. Struct. Civ. Eng. 2019, 13, 981–989. [Google Scholar] [CrossRef]
  10. Boller, C.; Starke, P.; Dobmann, G.; Kuo, C.M.; Kuo, C.H. Approaching the assessment of ageing bridge infrastructure. Smart Struct. Syst. 2015, 15, 593–608. [Google Scholar] [CrossRef]
  11. Beng, S.S.; Matsumoto, T. Survival analysis on bridges for modeling bridge replacement and evaluating bridge performance. Struct. Infrastruct. Eng. 2012, 8, 251–268. [Google Scholar] [CrossRef]
  12. Khan, M.S.A.; Etonyeaku, L.C.; Kabir, G.; Billah, M.; Dutta, S. Bridge infrastructure resilience assessment against seismic hazard using Bayesian best worst method. Can. J. Civ. Eng. 2022, 49, 1669–1685. [Google Scholar] [CrossRef]
  13. Qi, J.J.; Ye, Y.N.; Huang, Z.; Lv, W.R.; Zhou, W.B.; Liu, F.C.; Wu, J.D. Experimental Study and Theoretical Analysis of Steel-Concrete Composite Box Girder Bending Moment-Curvature Restoring Force. Sustainability 2023, 15, 6585. [Google Scholar] [CrossRef]
  14. Lin, Y.Z.; Bi, K.M.; Zong, Z.H.; Hao, H.; Lin, J.; Chen, Y.Y. Seismic Performance of Steel-Concrete Composite Rigid-Frame Bridge: Shake Table Test and Numerical Simulation. J. Bridge Eng. 2020, 25, 04020032. [Google Scholar] [CrossRef]
  15. Han, Q.; Du, X.L.; Liu, J.B.; Li, Z.X.; Li, L.Y.; Zhao, J.F. Seismic damage of highway bridges during the 2008 Wenchuan earthquake. Earthq. Eng. Eng. Vib. 2009, 8, 263–273. [Google Scholar] [CrossRef]
  16. Cao, S.S.; Jiang, L.Z.; Wei, B. Numerical and experimental investigations on the Park-Ang damage index for high-speed railway bridge piers with flexure failures. Eng. Struct. 2019, 201, 109851. [Google Scholar] [CrossRef]
  17. Mahboubi, S.; Shiravand, M.R. Failure assessment of skew RC bridges with FRP piers based on damage indices. Eng. Fail Anal. 2019, 99, 153–168. [Google Scholar] [CrossRef]
  18. Sun, Z.G.; Wang, D.S.; Guo, X.; Si, B.J.; Huo, Y. Lessons Learned from the Damaged Huilan Interchange in the 2008 Wenchuan Earthquake. J. Bridge Eng. 2012, 17, 15–24. [Google Scholar] [CrossRef]
  19. Song, S.; Tian, Z.; Zhao, Z.Y.; Li, X.; Zhao, J.F.; Xu, B.S. Experimental Study on Seismic Performance of CFRP-Strengthened Recycled Concrete Columns with Different Levels of Seismic Damage. Buildings 2023, 13, 1470. [Google Scholar] [CrossRef]
  20. Tazarv, M.; Sjurseth, T.; Greeneway, E.; Hart, K.; LaVoy, M.; Wehbe, N. Experimental Studies on Seismic Performance of Mechanically Spliced Precast Bridge Columns. J. Bridge Eng. 2022, 27, 04022102. [Google Scholar] [CrossRef]
  21. Chen, L.; Zhang, Y.A.; Zuo, R.; Yang, D.H.; Xiang, N.L. Experimental Study on Seismic Performance of External Socket Precast Bridge Pier-Footing Connections for Rapid Postearthquake Replacement. J. Bridge Eng. 2024, 29, 04024020. [Google Scholar] [CrossRef]
  22. Shi, F.; Wang, D.S.; Tong, L.; Tang, W.J. Numerical simulation on seismic pounding damage in a simply-supported steel bridge. Heliyon 2023, 9, e22297. [Google Scholar] [CrossRef]
  23. Wang, J.; Li, F.Y. Numerical Simulation Analysis of the Seismic Performance of Precast Bridge Piers. Math. Probl. Eng. 2022, 2022, 1–11. [Google Scholar] [CrossRef]
  24. Tubaldi, E.; Barbato, M.; Dall’Asta, A. Influence of Model Parameter Uncertainty on Seismic Transverse Response and Vulnerability of Steel-Concrete Composite Bridges with Dual Load Path. J. Struct. Eng. 2012, 138, 363–374. [Google Scholar] [CrossRef]
  25. Orcesi, A.; Cremona, C.; Ta, B. Optimization of Design and Life-Cycle Management for Steel-Concrete Composite Bridges. Struct. Eng. Int. 2018, 28, 185–195. [Google Scholar] [CrossRef]
  26. Matos, J.C.; Moreira, V.N.; Valente, I.B.; Cruz, P.J.S.; Neves, L.C.; Galvao, N. Probabilistic-based assessment of existing steel-concrete composite bridges Application to Sousa River Bridge. Eng. Struct. 2019, 181, 95–110. [Google Scholar] [CrossRef]
  27. Liu, Y.; Paolacci, F.; Lu, D.G. Seismic fragility of a typical bridge using extrapolated experimental damage limit states. Earthq. Struct. 2017, 13, 599–611. [Google Scholar] [CrossRef]
  28. Soleimani, F.; Mangalathu, S.; DesRoches, R. A comparative analytical study on the fragility assessment of box-girder bridges with various column shapes. Eng. Struct. 2017, 153, 460–478. [Google Scholar] [CrossRef]
  29. Shekhar, S.; Ghosh, J.; Ghosh, S. Impact of Design Code Evolution on Failure Mechanism and Seismic Fragility of Highway Bridge Piers. J. Bridge Eng. 2020, 25, 04019140. [Google Scholar] [CrossRef]
  30. Stefanidou, S.P.; Kappos, A.J. Methodology for the development of bridge-specific fragility curves. Earthq. Eng. Struct. Dyn. 2017, 46, 73–93. [Google Scholar] [CrossRef]
  31. Nielson, B.G.; DesRoches, R. Seismic fragility methodology for highway bridges using a component level approach. Earthq. Eng. Struct. Dyn. 2007, 36, 823–839. [Google Scholar] [CrossRef]
  32. Song, S.; Wu, Y.H.; Wang, S.; Lei, H.G. Important measure analysis of uncertainty parameters in bridge probabilistic seismic demands. Earthq. Struct. 2022, 22, 157–168. [Google Scholar] [CrossRef]
  33. Naseri, A.; Roshan, A.M.; Pahlavan, H.; Amiri, G.G. Numerical Analysis and Vulnerability Assessment of Horizontally Curved Multiframe RC Box-Girder and CFRP Retrofitting of Existing Bridges. Asce.-Asme. J. Risk Uncertain. Eng. Syst. Part A-Civ. Eng. 2022, 8, 157. [Google Scholar] [CrossRef]
  34. Cornell, C.A.; Jalayer, F.; Hamburger, R.O.; Foutch, D.A. Probabilistic basis for 2000 SAC federal emergency management agency steel moment frame guidelines. J. Struct. Eng. 2002, 128, 526–533. [Google Scholar] [CrossRef]
  35. Park, C.; Kim, N.H.; Haftka, R.T. The effect of ignoring dependence between failure modes on evaluating system reliability. Struct. Multidiscip. Optim. 2015, 52, 251–268. [Google Scholar] [CrossRef]
  36. Song, S.; Qian, Y.J.; Liu, J.; Xie, X.R.; Wu, G. Time-variant fragility analysis of the bridge system considering time-varying dependence among typical component seismic demands. Earthq. Eng. Eng. Vib. 2019, 18, 363–377. [Google Scholar] [CrossRef]
  37. Zhu, Z.; Quiel, S.E.; Khorasani, N.E. Bivariate structural-fire fragility curves for simple-span overpass bridges with composite steel plate girders. Struct. Saf. 2023, 100, 363–377. [Google Scholar] [CrossRef]
  38. Zhong, J.; Jiang, L.; Pang, Y.; Yuan, W. Near-fault seismic risk assessment of simply supported bridges. Earthq. Spectra 2020, 100, 102294. [Google Scholar] [CrossRef]
  39. Shekhar, S.; Ghosh, J. A metamodeling based seismic life-cycle cost assessment framework for highway bridge structures. Reliab. Eng. Syst. Saf. 2020, 195, 1645–1669. [Google Scholar] [CrossRef]
  40. Wu, W.P.; Li, L.F.; Shao, X.D. Seismic Assessment of Medium-Span Concrete Cable-Stayed Bridges Using the Component and System Fragility Functions. J. Bridge Eng. 2016, 21, 04016027. [Google Scholar] [CrossRef]
Figure 1. Overall layout of the two bridges (unit: cm).
Buildings 14 01768 g001
Figure 2. Finite element model of continuous girder bridges.
Buildings 14 01768 g002
Figure 3. Samples of the two bridges for seismic demand probabilistic analysis.
Buildings 14 01768 g003
Figure 4. Information summary of the selected ground motions.
Buildings 14 01768 g004
Figure 5. Probabilistic seismic demands of bridge components.
Buildings 14 01768 g005
Figure 6. Seismic vulnerability curves of piers and abutments.
Buildings 14 01768 g006aBuildings 14 01768 g006b
Figure 7. Seismic vulnerability curves of bearings.
Buildings 14 01768 g007aBuildings 14 01768 g007b
Figure 8. Seismic vulnerability curves of bridge systems.
Buildings 14 01768 g008aBuildings 14 01768 g008b
Table 1. Uncertain parameters of girder bridges.
Uncertainty ParametersDistribution PatternsMean ValuesCoefficients of Variation
Compressive strength of concrete/MPaNormal distribution40.00.12
Yield strength of steel bar/MPaLognormal distribution335.00.05
Ultimate strength of steel bar/MPaLognormal distribution420.00.05
Upper structure mass of steel–concrete composite bridge/(kN/m3)Normal distribution23.870.10
Upper structure mass of concrete bridge/(kN/m3)Normal distribution30.610.10
Damping ratioNormal distribution0.050.20
Concrete cover depth/mmNormal distribution35.00.20
Table 2. Probabilistic seismic demand models of reinforced concrete girder bridge.
ComponentslnabβpR2
LongitudinalTransverseLongitudinalTransverseLongitudinal TransverseLongitudinalTransverseLongitudinalTransverse
0# Abutment4.195.100.850.790.580.581.58 × 10−191.21 × 10−210.540.61
1# Pier0.670.440.870.710.630.451.25 × 10−211.52 × 10−250.610.67
2# Pier0.670.440.870.710.630.451.27 × 10−211.79 × 10−250.610.67
3# Abutment4.225.100.860.790.640.581.47 × 10−192.32 × 10−210.520.60
0# Bearing4.744.630.900.850.470.541.14 × 10−191.39 × 10−250.580.67
1# Bearing5.054.710.940.970.740.632.11 × 10−191.06 × 10−240.560.66
2# Bearing5.054.710.940.970.740.622.10 × 10−196.54 × 10−250.560.66
3# Bearing4.694.700.880.870.510.552.40 × 10−183.66 × 10−250.510.67
Table 3. Probabilistic seismic demand models of steel-concrete composite girder bridge.
ComponentslnabβpR2
Longitudinal Transverse Longitudinal Transverse Longitudinal Transverse Longitudinal Transverse LongitudinalTransverse
0# Abutment4.385.200.900.960.490.602.08 × 10−231.47 × 10−250.640.66
1# Pier1.040.701.010.840.610.439.08 × 10−275.83 × 10−320.690.61
2# Pier1.040.701.010.840.610.439.82 × 10−275.42 × 10−320.690.61
3# Abutment4.415.200.890.960.490.605.95 × 10−231.28 × 10−250.630.64
0# Bearing4.665.000.980.880.460.484.16 × 10−241.22 × 10−290.670.73
1# Bearing4.974.780.911.010.660.571.47 × 10−217.31 × 10−290.760.72
2# Bearing4.974.760.911.000.660.571.46 × 10−211.46 × 10−280.760.72
3# Bearing4.634.970.860.870.450.492.75 × 10−233.98 × 10−290.670.72
Table 4. Failure probabilities of piers and abutments under different seismic intensities.
ComponentsPGA/gSlight DamageModerate DamageSerious DamageComplete Damage
RCSCRatioRCSCRatioRCSCRatioRCSCRatio
1# PierLongitudinal0.218.8%11.0%58.4%9.0%5.1%57.1%7.1%4.5%63.3%0.8%0.4%56.6%
0.339.6%24.0%60.5%23.6%13.3%56.4%17.2%10.5%60.9%2.8%1.4%51.1%
0.457.1%36.8%64.4%39.0%22.9%58.6%28.2%17.3%61.4%6.2%3.0%49.0%
Transverse0.29.4%5.9%62.6%2.7%1.8%65.1%3.2%2.4%74.6%0.1%0.1%69.2%
0.326.4%15.8%59.9%10.8%6.2%57.2%9.0%6.0%66.8%0.6%0.4%58.7%
0.444.3%27.4%61.8%22.7%12.7%56.1%16.5%10.6%64.2%1.7%0.9%53.0%
0# AbutmentLongitudinal0.219.2%14.1%73.8%3.6%3.5%97.5%0.8%0.8%96.4%0.1%0.0%80.0%
0.342.0%30.0%71.3%12.8%10.6%83.1%3.0%2.6%86.9%0.2%0.2%90.9%
0.460.8%44.7%73.4%25.5%19.6%77.0%6.5%5.2%79.8%0.6%0.6%93.4%
Transverse0.234.7%28.9%83.3%7.3%7.1%98.2%4.7%4.2%89.7%1.0%0.9%86.0%
0.358.0%48.3%83.2%19.5%17.0%87.4%10.9%10.4%96.0%3.0%2.9%96.3%
0.473.4%62.6%85.3%33.1%27.8%84.0%18.9%16.9%89.5%6.3%5.4%86.9%
Notes: RC refers to the reinforced concrete bridge; SC refers to the steel–concrete composite bridge.
Table 5. Failure probabilities of bearings under different seismic intensities.
ComponentsPGA/gSlight DamageModerate DamageSerious DamageComplete Damage
RCSCRatioRCSCRatioRCSCRatioRCSCRatio
Laminated bearingsLongitudinal direction0.262.5%52.1%83.3%16.3%13.1%80.6%9.2%8.8%95.0%2.7%2.6%94.9%
0.379.9%70.4%88.1%32.2%26.3%81.5%18.9%17.6%93.2%6.7%6.7%99.3%
0.488.7%81.1%91.4%46.4%38.6%83.2%28.5%26.4%92.6%11.8%11.6%98.3%
Transverse direction0.241.8%30.1%71.9%4.6%4.6%98.7%2.8%2.7%97.5%0.6%0.5%87.3%
0.367.5%52.4%77.6%15.3%13.4%87.6%8.5%7.5%89.1%2.1%2.0%94.8%
0.482.2%68.2%83.0%28.9%24.4%84.2%16.1%13.8%85.8%4.8%4.4%92.5%
Laminated bearings with PTFE Longitudinal direction0.220.5%14.9%72.9%1.6%1.4%86.0%1.2%1.2%96.7%0.2%0.1%76.5%
0.347.5%36.4%76.6%8.2%6.4%78.1%4.8%4.2%87.4%0.8%0.8%95.1%
0.468.3%55.6%81.5%19.8%15.2%76.6%10.5%8.8%83.7%2.3%2.2%96.4%
Transverse direction0.241.8%33.7%80.6%6.9%5.6%80.1%2.9%2.2%76.0%0.7%0.6%84.9%
0.367.4%56.6%84.0%20.5%15.7%76.4%8.4%6.2%74.0%2.5%2.0%78.3%
0.482.0%71.9%87.7%36.0%27.7%76.8%15.5%11.5%73.8%5.5%4.2%76.0%
Notes: RC refers to the reinforced concrete bridge; SC refers to the steel–concrete composite bridge.
Disclaimer/Publisher’s Note: The statements, opinions and data contained in all publications are solely those of the individual author(s) and contributor(s) and not of MDPI and/or the editor(s). MDPI and/or the editor(s) disclaim responsibility for any injury to people or property resulting from any ideas, methods, instructions or products referred to in the content.

