A Statistical Study of the Pedestrian Distribution in a Commercial Wholesale Centre Based on the Traffic Spatial Structure


Abstract
:1. Introduction
- First, multivariate data-based urban street network analysis. Li Qian took the street network of Chengdu, China, as the unit of analysis, combined taxis, shared bicycle trajectories, user comments, cultural facilities, and points of interest with multi-source data for spatial identification, and mined the centres of high social, economic, and cultural vitality through the establishment of a multivariate regression model [29]. Andres Sevtsuk synthesised existing and proposed environments to predict pedestrian volumes using an intermediate exponential model of network analysis, which was effectively validated in community planning and large-scale development projects and provided a guiding direction for pedestrian amenity improvements and public investment [30].
- Second, the comprehensive study of urban three-dimensional spatial networks. Spatial design network analysis (sDNA) was used to analyse urban vertical multi-storey road networks to predict social behaviour and traffic flow characteristics [31]. Srilalitha Gopalakrishnan used a spatial network spatial analysis framework to carry out a connectivity analysis of vertical open spaces and high-rise infrastructure in Singaporean cities to study the promotion of the efficient integration of vertical public spaces on enhancing the social and public spatial benefits [32]. Ian Harvey and Scott Orford combined multiple hybrid spatial design network analysis (MH-sDNA) to carry out the modelling of urban population change, pioneering the prediction and validation of the migration of an urban functional layout over time [33].
- Third, the synthesis of spatial syntax and related methods. Mahbub Rashid sampled the street networks of 25 independent UK cities and found that urban compactness based on spatial network descriptions correlated with social equity indicators, with large differences in the correlations between different types of cities [34]. In addition, SeoJin Ha and SuJin Jang synthesised the space syntax and eigenvector ratio of the adjacency matrix to study the status of the association between the indoor commercial space characteristics of large-scale commercial centres and the efficiency of revenue generation [35]. Andi synthesised space syntax and VGA maps to consider the factors of pedestrian flow, horizontal traffic complexity, vertical traffic complexity, tenant type distribution, visual quality, retail layout, and the anchor layout of shopping centres and proposed spatial layout adjustments to optimise the shopping experience in shopping centres [36].
2. Materials and Methods
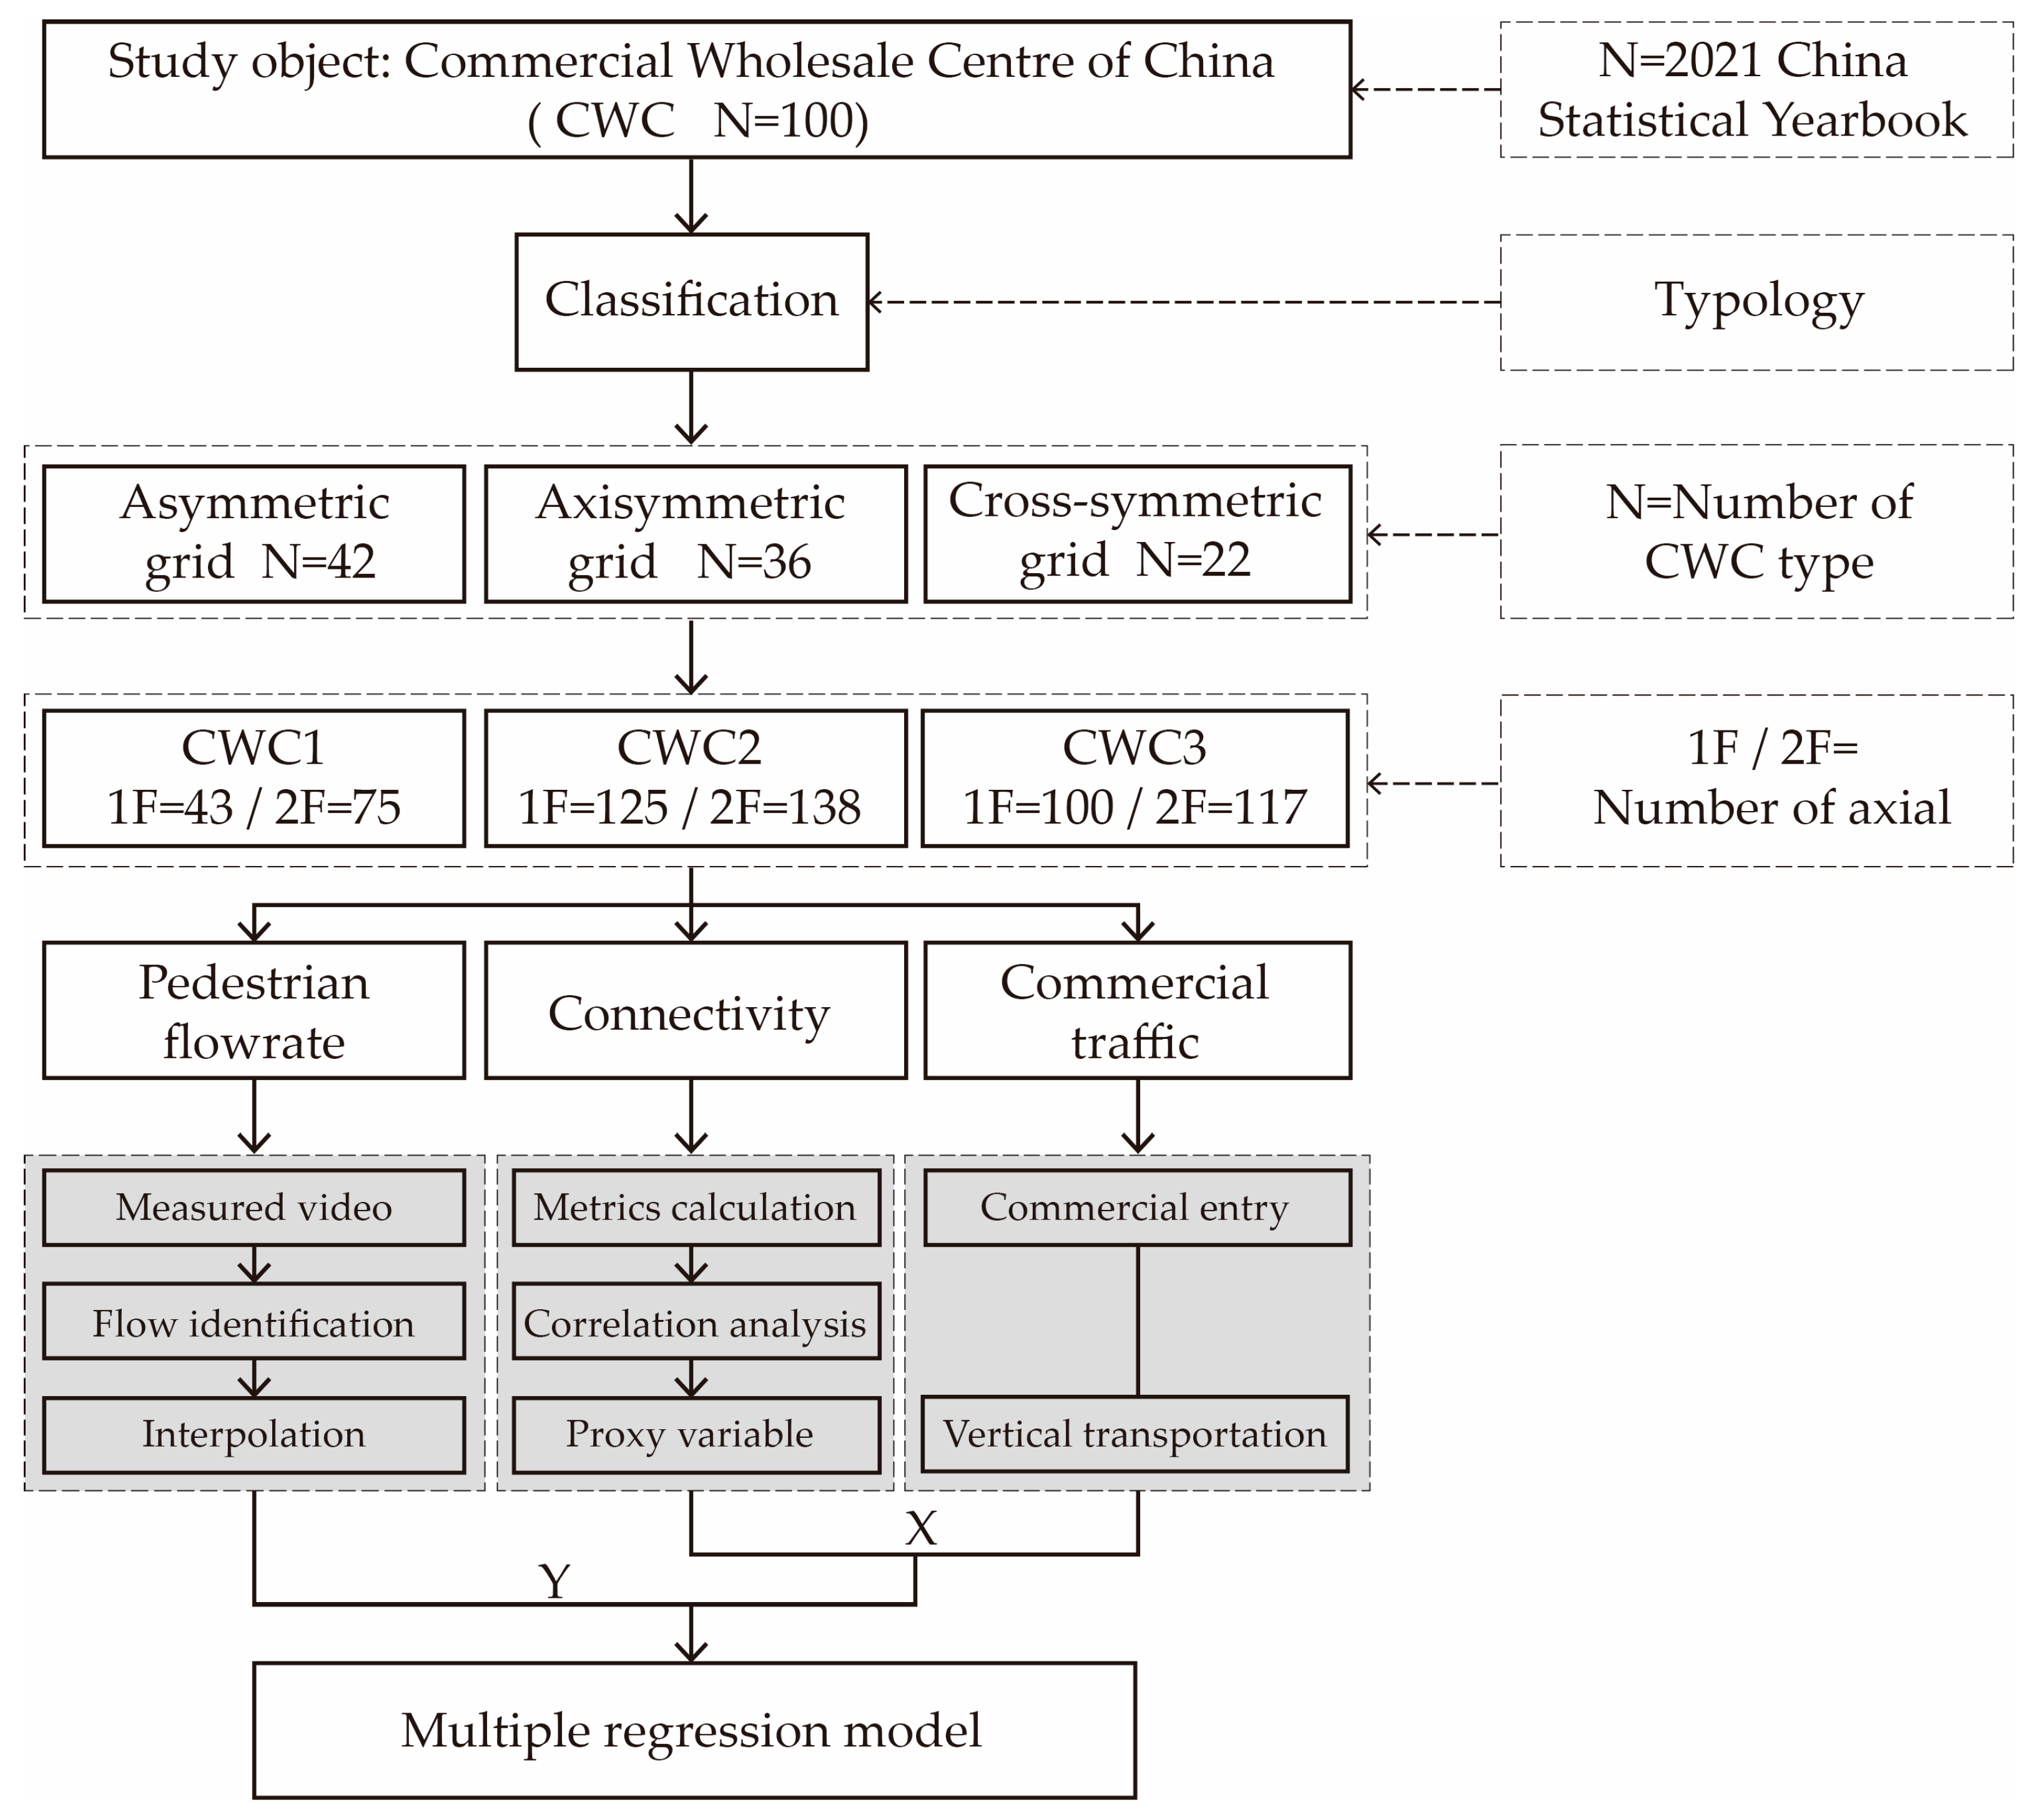
2.1. Research Unit
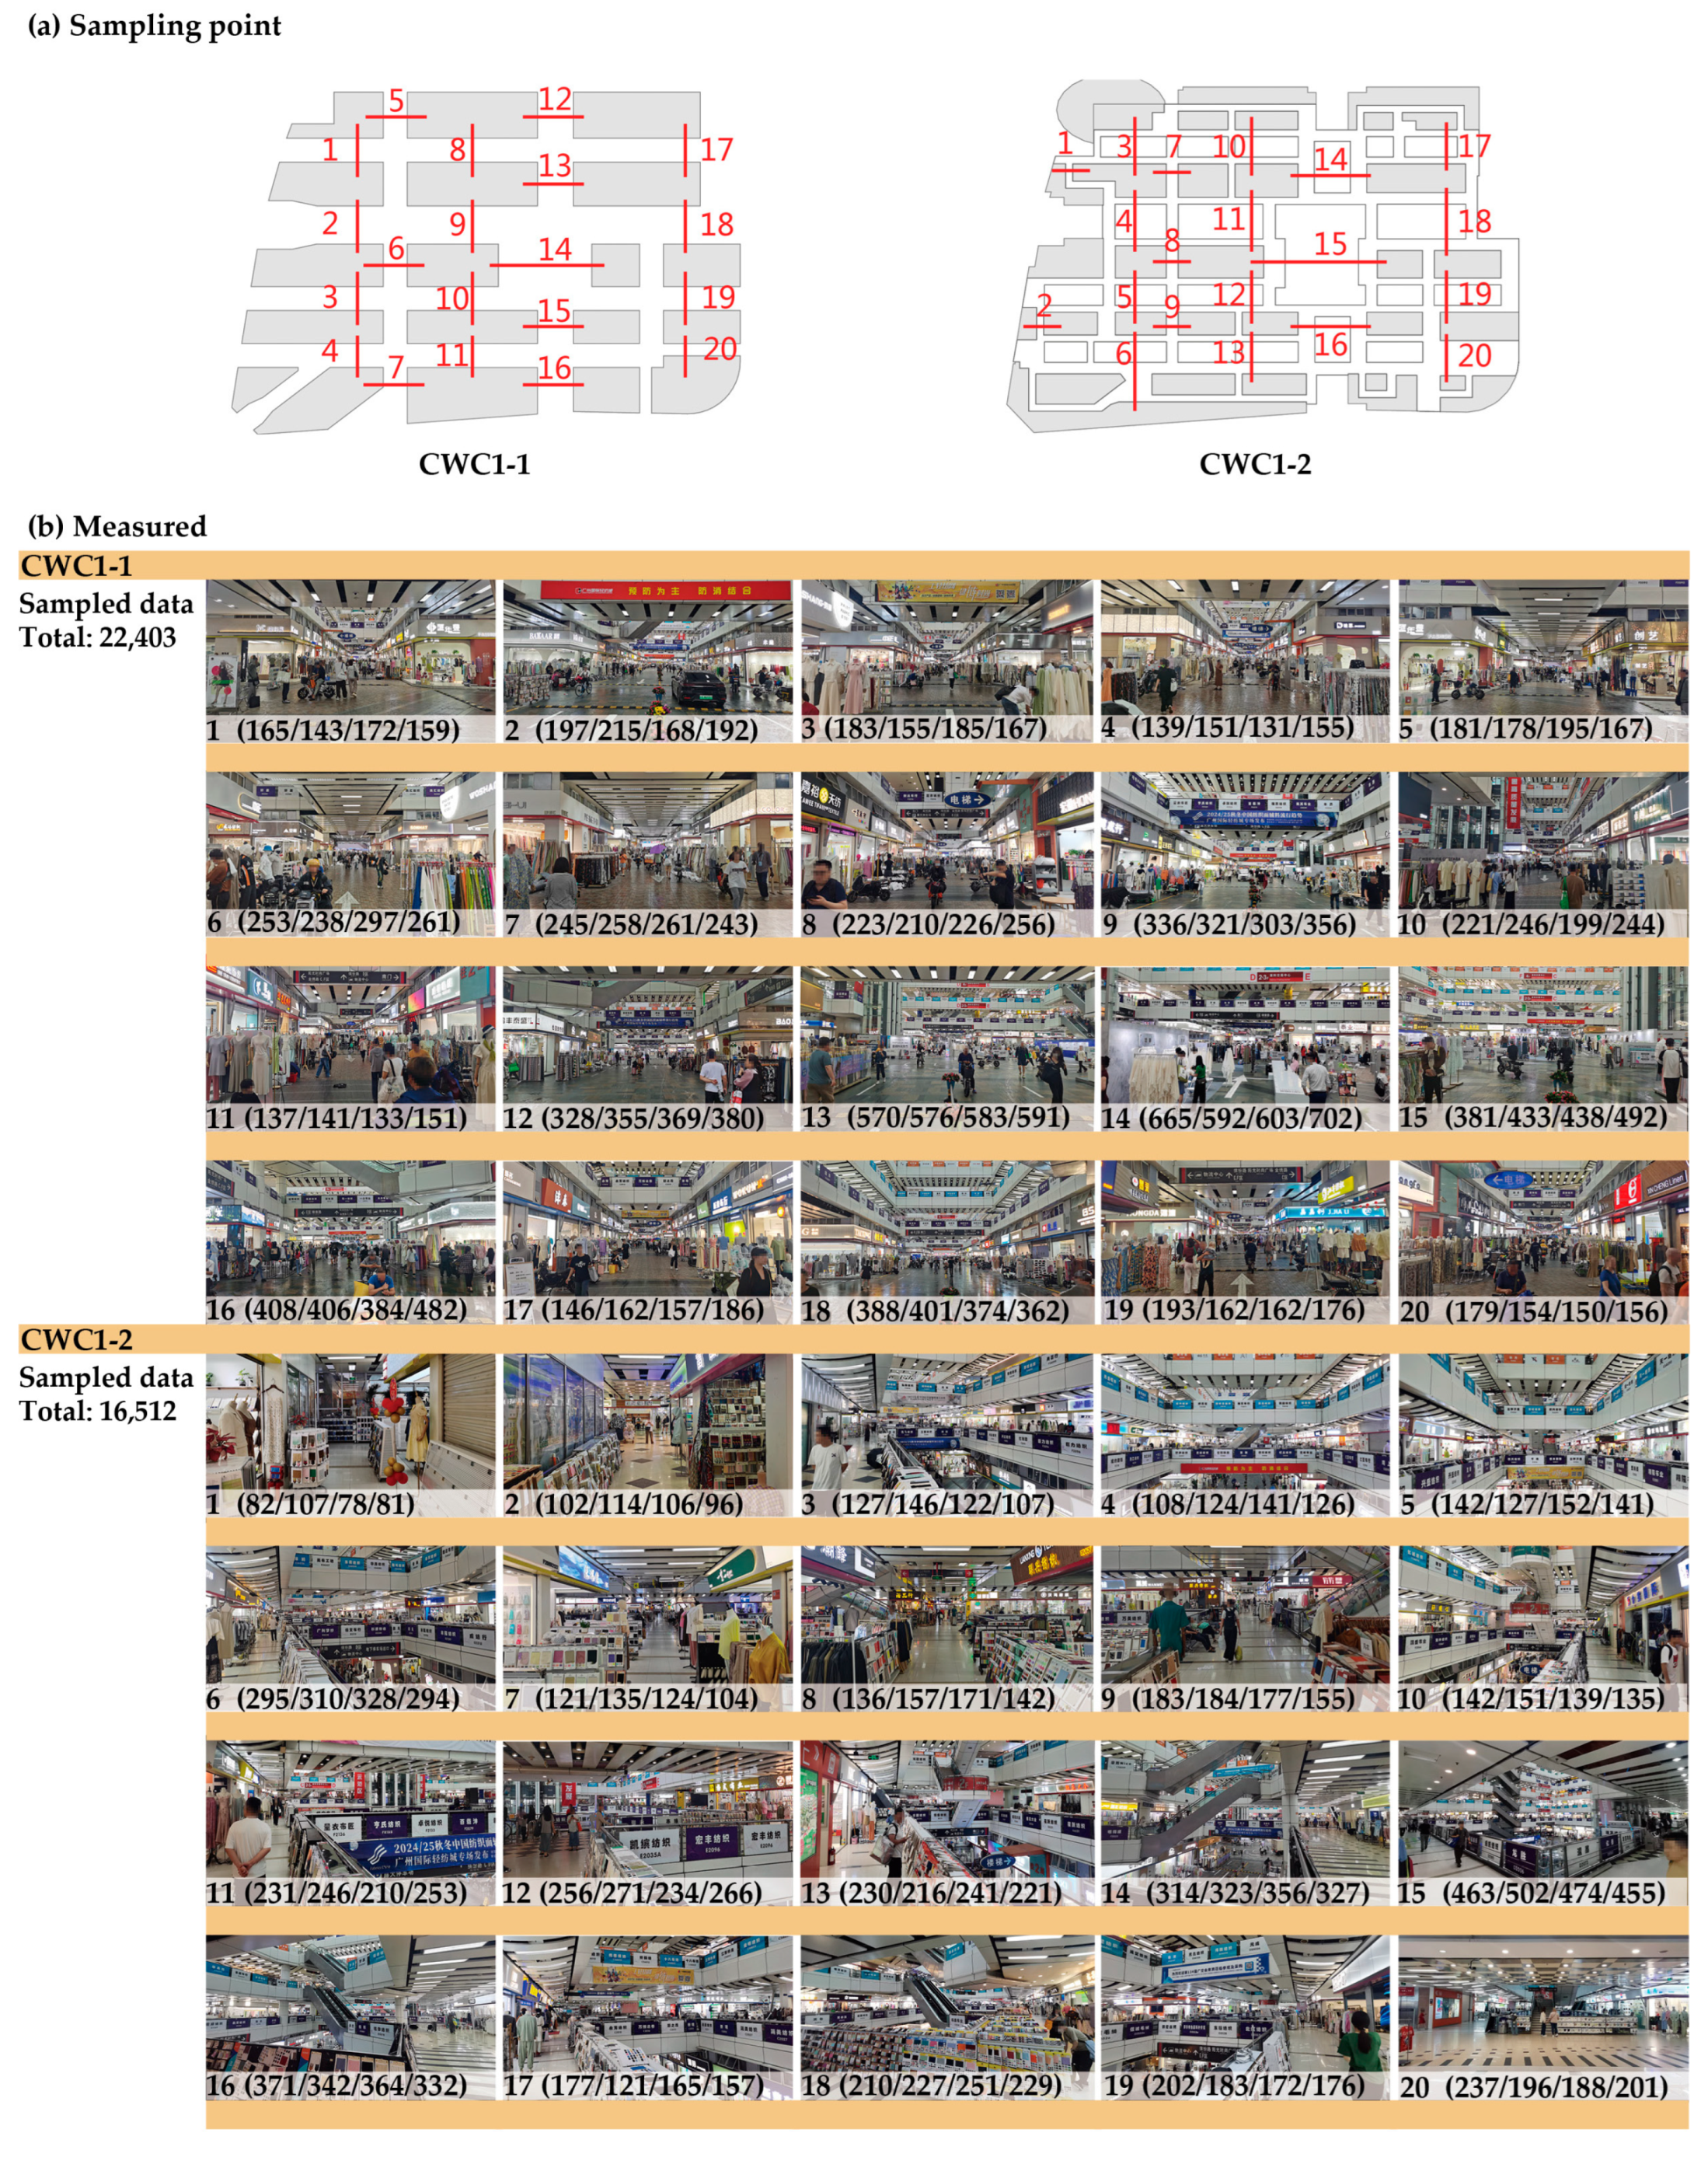
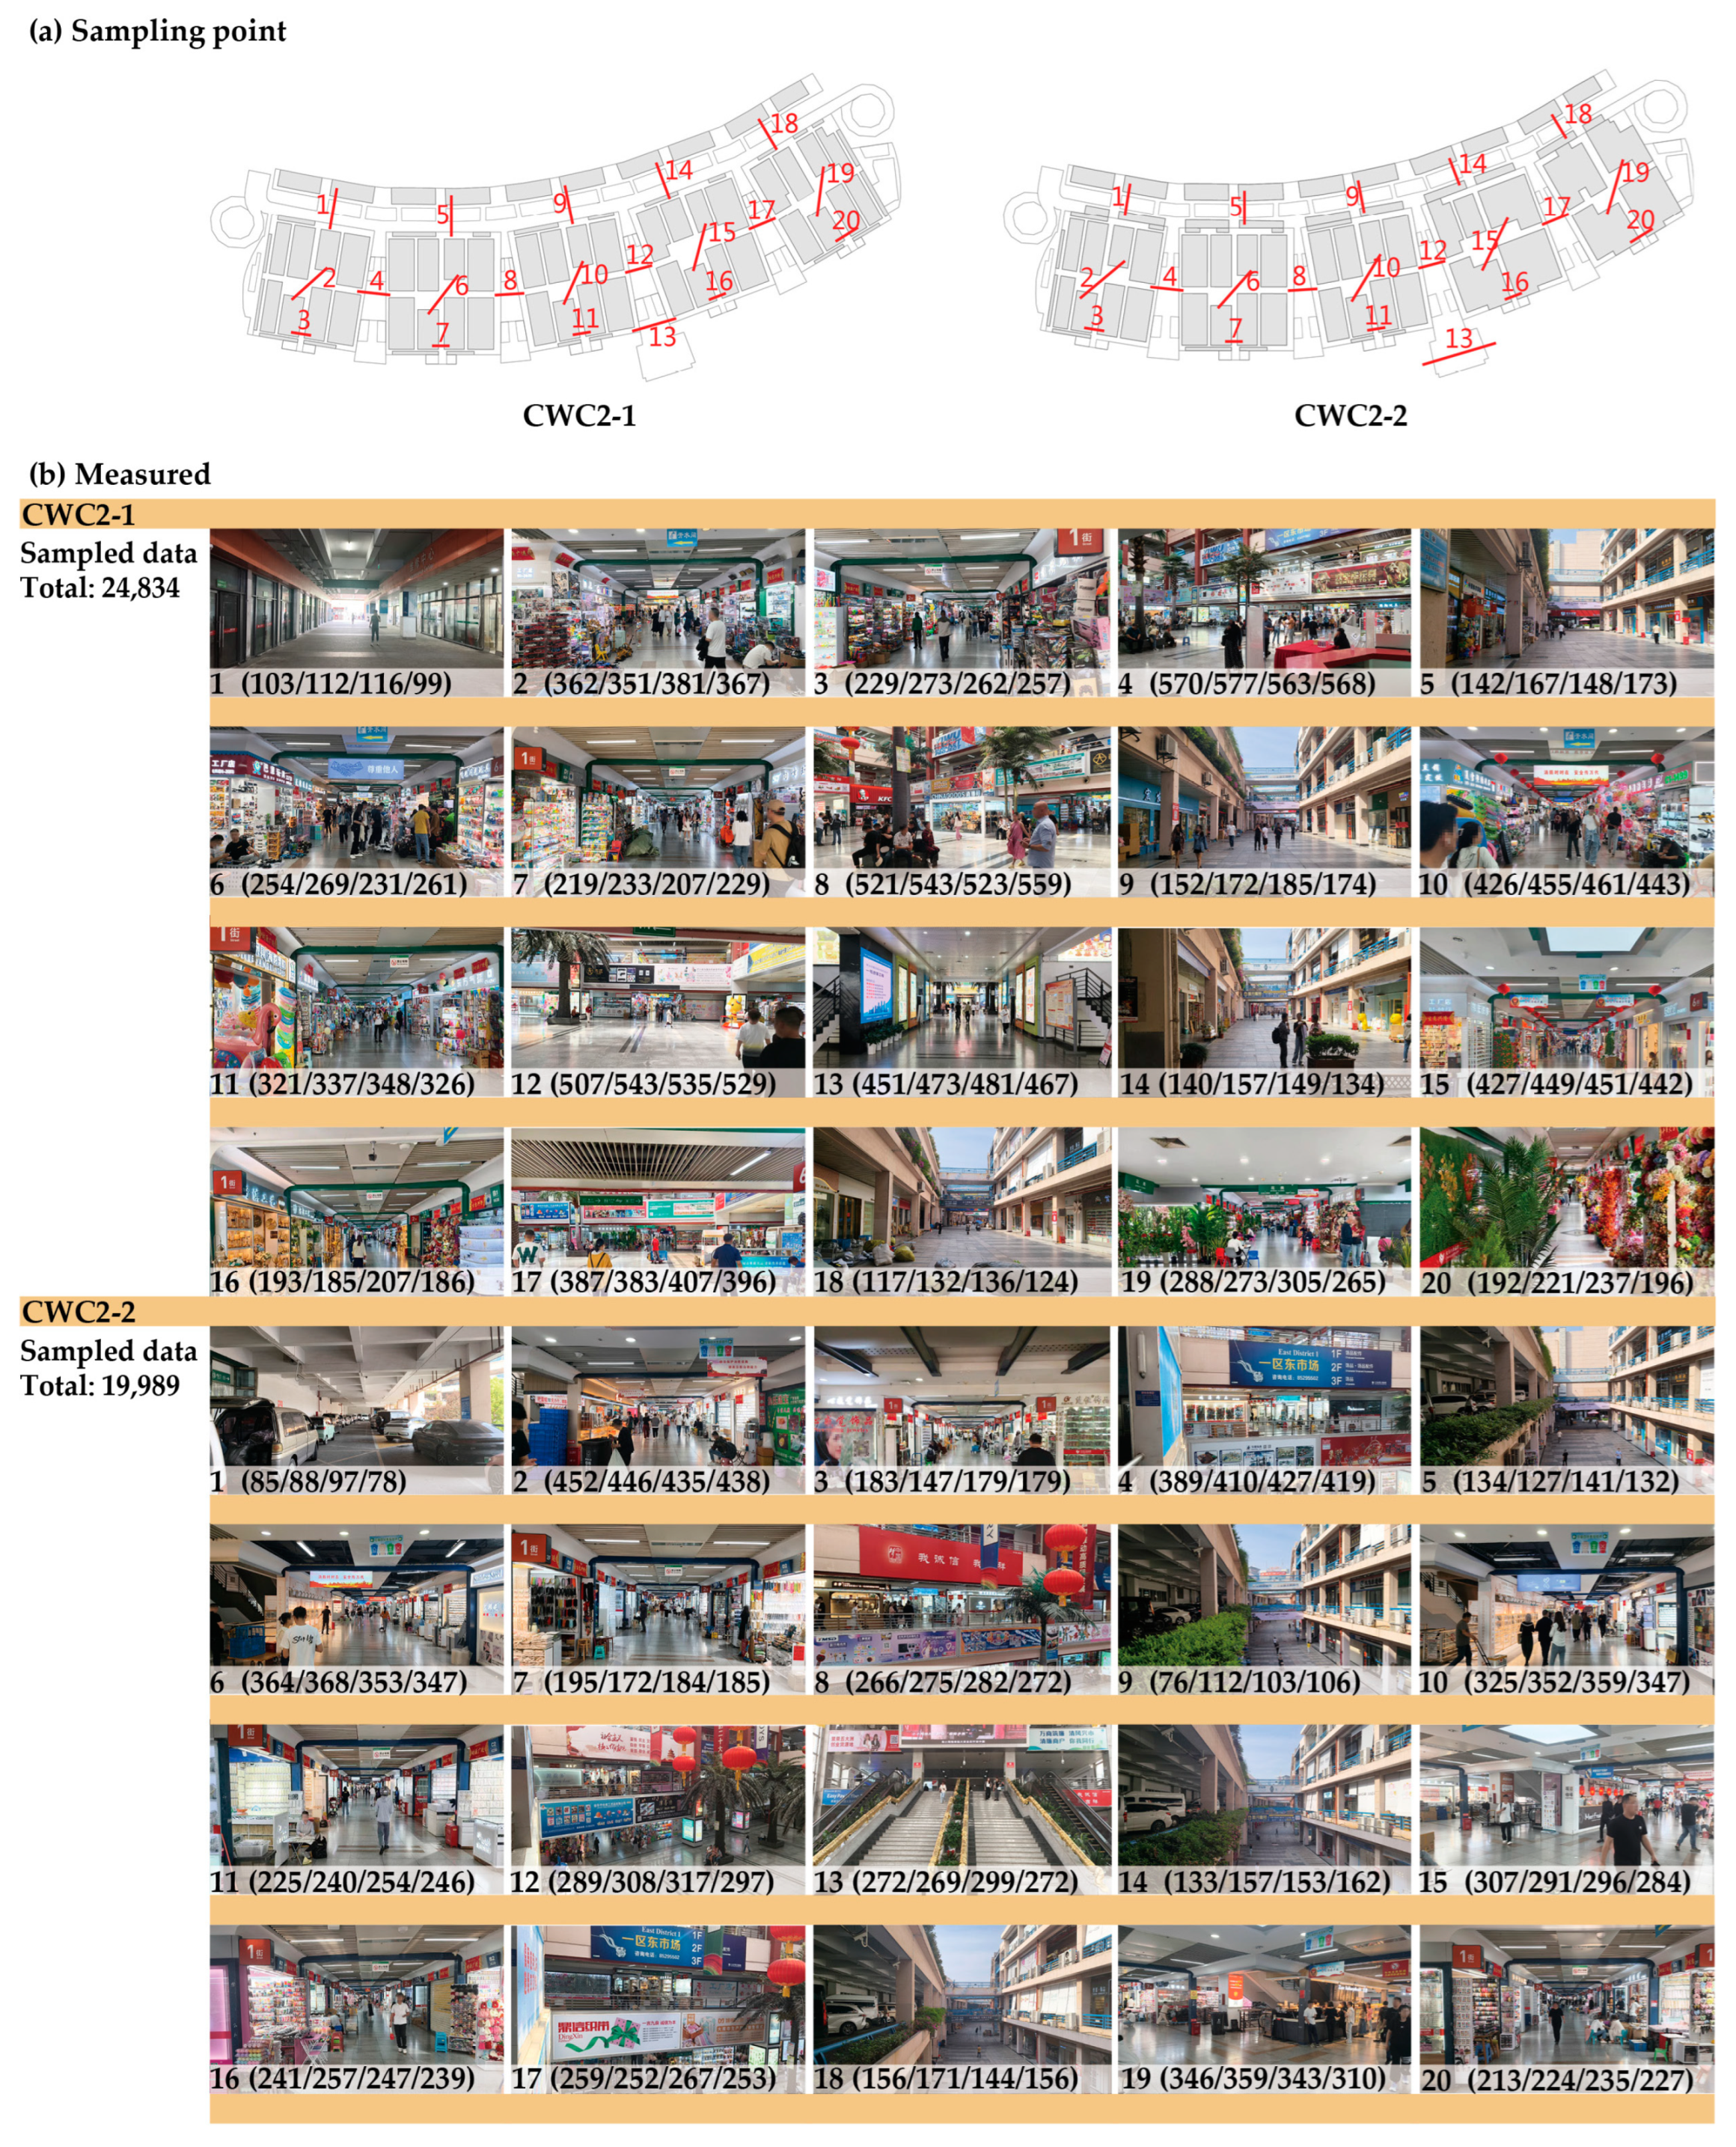
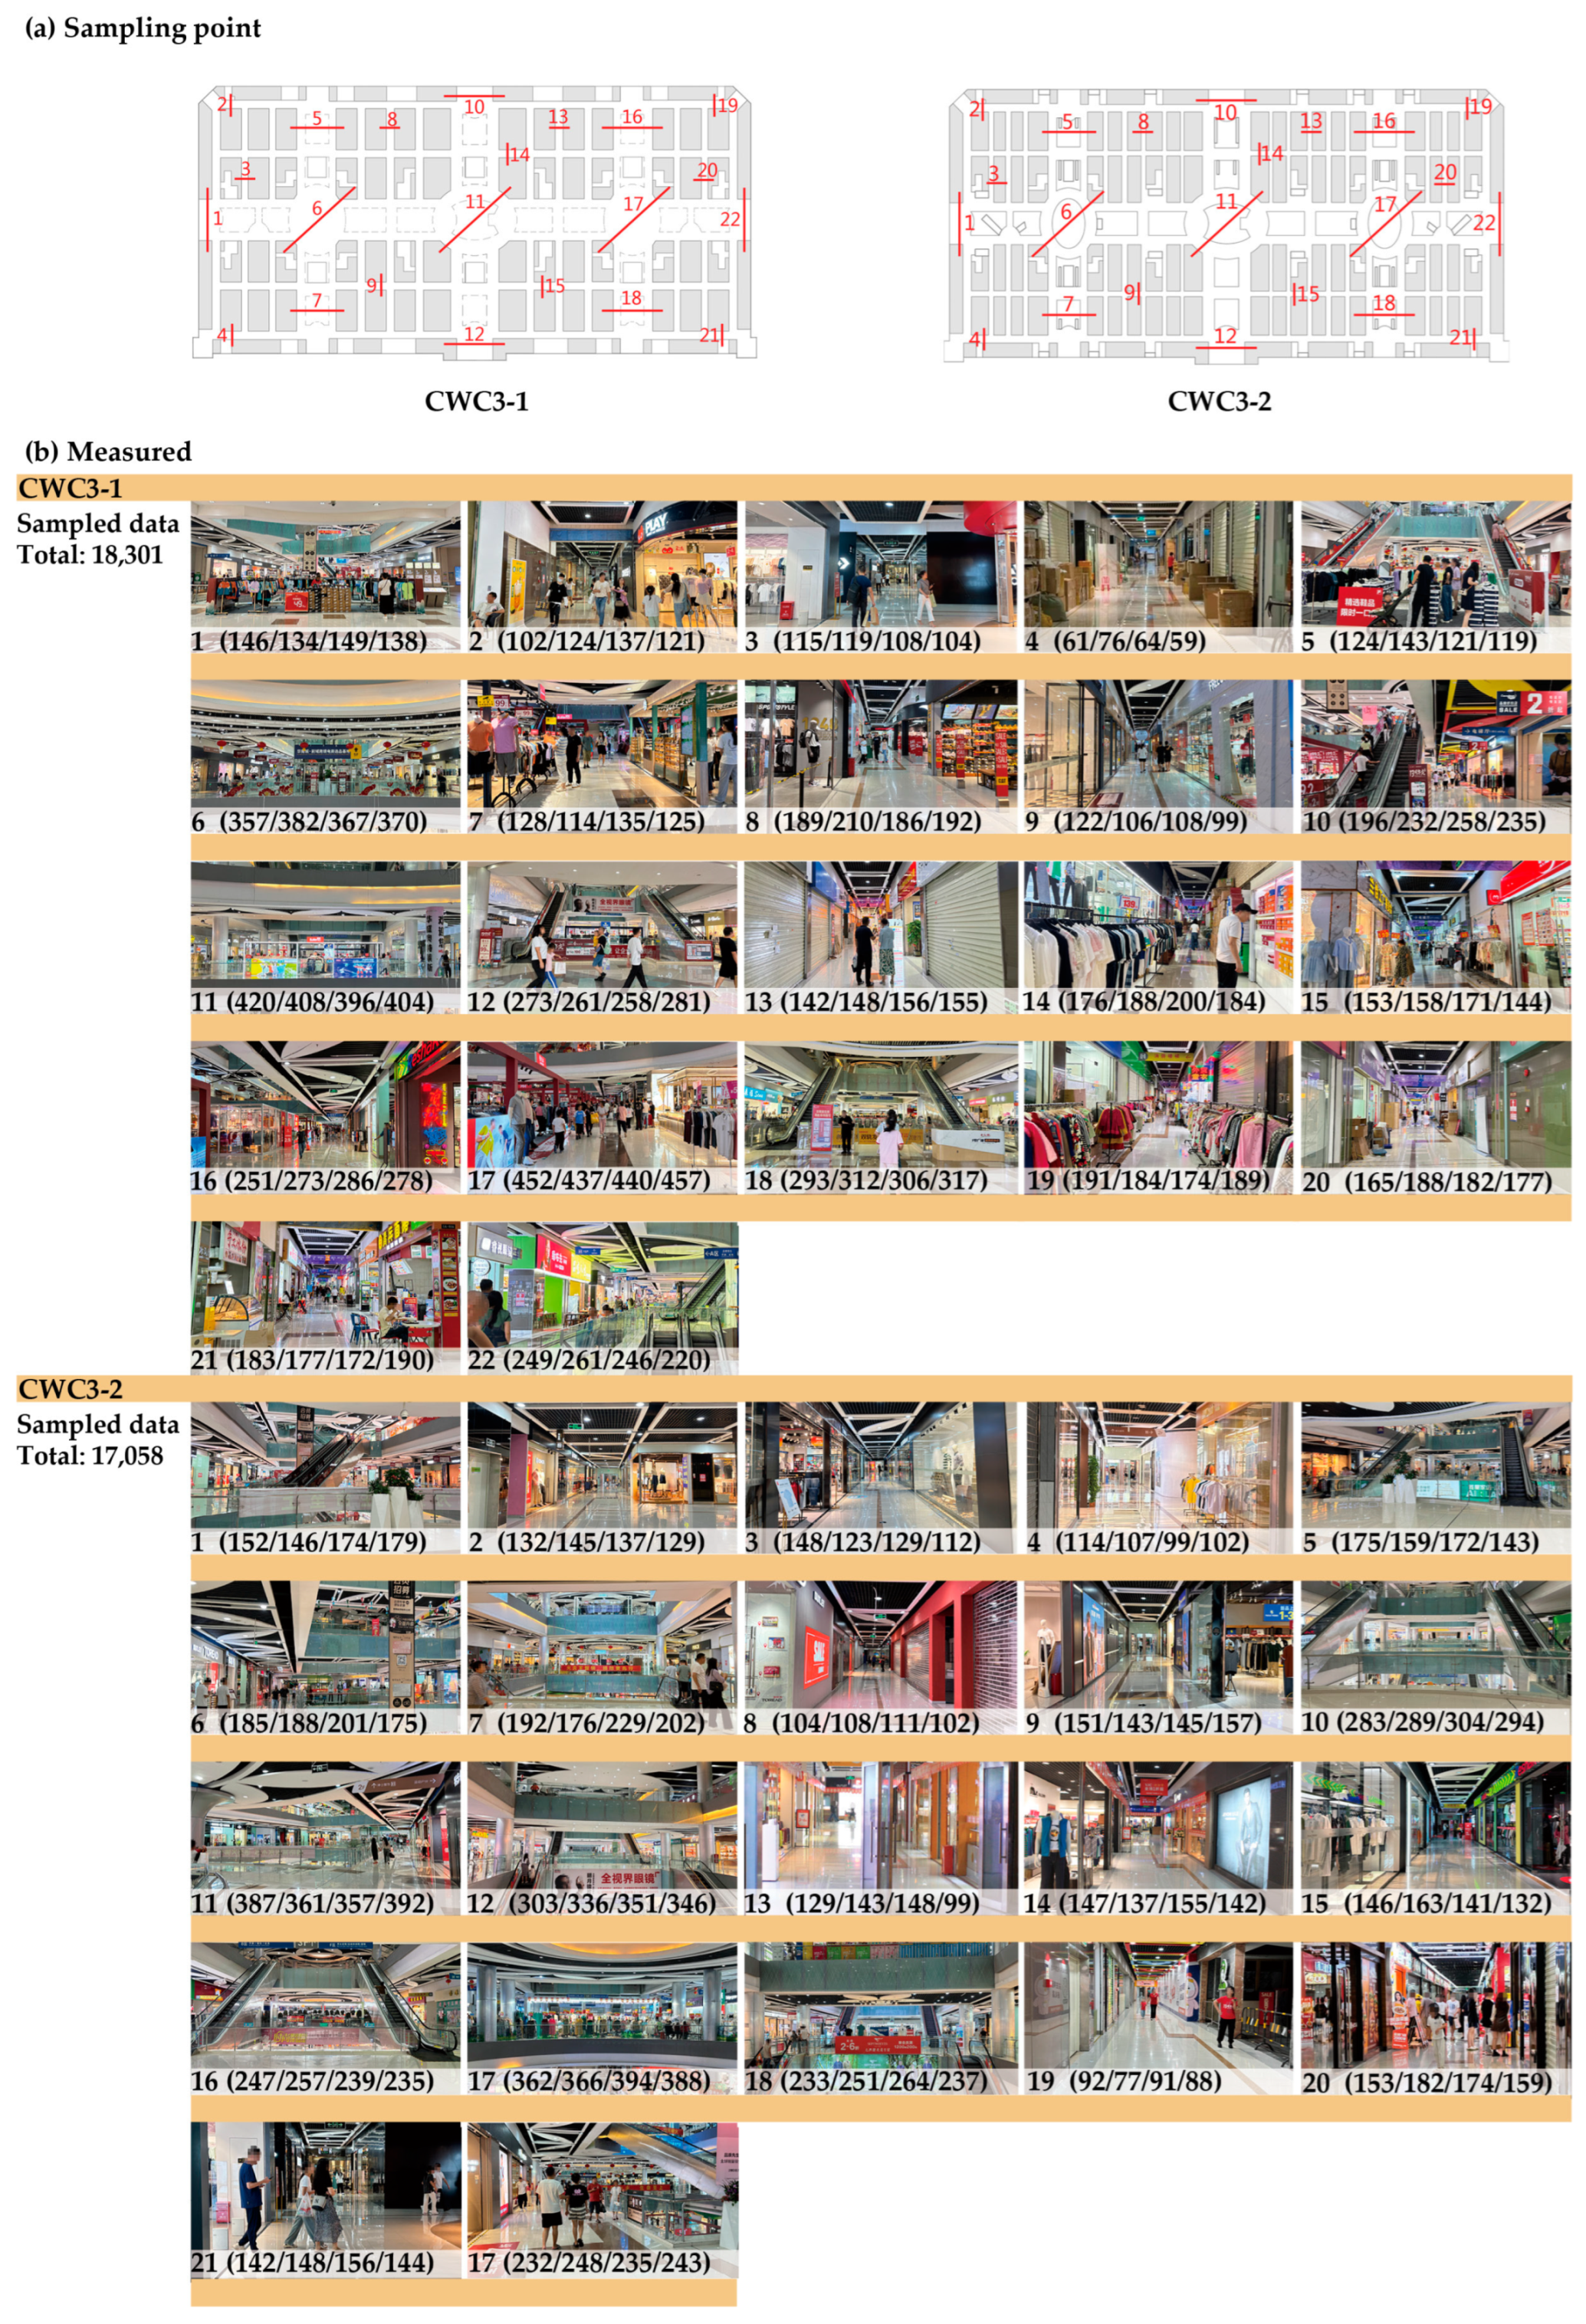
2.2. Data Acquisition
3. Results
3.1. Descriptive Statistics Analysis
3.2. Correlation Analysis
3.3. Multiple Regression
4. Discussion
5. Conclusions
- The influence of the spatial grouping relationship on the spatial accessibility and comprehensibility is more significant. When the grouping relationship of a CWC is more concise and the morphology is more unified, it effectively guides consumers to specific commercial behaviours in different spatial environments.
- The spatial asymmetry of the commercial interior, through local space perception, helps to make clear the pedestrian’s location and to establish a psycho-spatial map that matches the actual situation; hence, it is easier for pedestrians to obtain spatial information.
- In areas that are more difficult for people to reach, the installation of vertical transport facilities, such as escalators, lifts, and stairs, is conducive to enhancing their spatial accessibility, supplementing the flow of people, and balancing the distribution of commercial value.
Author Contributions
Funding
Data Availability Statement
Acknowledgments
Conflicts of Interest
Appendix A

| Number | Commercial Wholesale Centres | Forms |
|---|---|---|
| 1 | Zhejiang Yiwu Xiaoshangpin Market | Axisymmetric grid |
| 2 | Zhejiang Shaoxin Qingfang Centre | Axisymmetric grid |
| 3 | Wuhan Hankou Guoji Shangpin Centre | Axisymmetric grid |
| 4 | Changsha Gaoqiao Market | Asymmetric grid |
| 5 | Baiding Baigouzhen Market | Axisymmetric grid |
| 6 | Suzhou Dongfang Sichou Market | Asymmetric grid |
| 7 | Haining Pige Centre | Axisymmetric grid |
| 8 | Changshu Fuzhuang Centre | Cross-symmetric grid |
| 9 | Tongxiang Puyuan Yaomaoshan Market | Asymmetric grid |
| 10 | Xinfadi Nongfu Chanpin Market | Cross-symmetric grid |
| 11 | Jintian Yangguang liansuo Market | Asymmetric grid |
| 12 | Yuyao Suliao Centre | Asymmetric grid |
| 13 | Nanjing Nongfuchangping Centre | Axisymmetric grid |
| 14 | Shenzhen Huaqiang Dianzi Centre | Asymmetric grid |
| 15 | Nantong Dieshiqiao Guoji Jiafang Centre | Cross-symmetric grid |
| 16 | Chengdu Guoji Shangmao Centre | Axisymmetric grid |
| 17 | Zhoushan Guoji Shuichang Centre | Asymmetric grid |
| 18 | Changzhou Dongshou Shangmao Centre | Cross-symmetric grid |
| 19 | Xinfadi Nongfuchangpin Wuliu Market | Axisymmetric grid |
| 20 | Shandong Kaisheng Nongchangpin Centre | Asymmetric grid |
| 21 | Shenzhen Chayue Centre | Axisymmetric grid |
| 22 | Zhenhai Dazhong Jiaoyi Centre | Asymmetric grid |
| 23 | Changsha Hongxin Market | Axisymmetric grid |
| 24 | Yongkang Keji WujinCentre | Asymmetric grid |
| 25 | Shangqu Zhongxin Market | Cross-symmetric grid |
| 26 | Wantian Jiancha Shanmao Centre | Asymmetric grid |
| 27 | Weierkang Roulei Shuichang Market | Asymmetric grid |
| 28 | Liaoning Xiliu Fuzhuang Centre | Cross-symmetric grid |
| 29 | Wuxi Buxiugang Wuliu Centre | Asymmetric grid |
| 30 | Xuzhou Xuanwu Market | Cross-symmetric grid |
| 31 | Hangzhou Yifa Fushi Centre | Asymmetric grid |
| 32 | Anqing Guangcai Market | Axisymmetric grid |
| 33 | Hunan Gangcai Market | Asymmetric grid |
| 34 | Shaoxin Yuezhou Qingfang Market | Axisymmetric grid |
| 35 | Jiangsu Lingjiatang Market | Cross-symmetric grid |
| 36 | Tangshan Yahongqiang Market | Axisymmetric grid |
| 37 | Ningbo Huadong Wuzi Centre | Asymmetric grid |
| 38 | Wuxi Wuzhou Guoji Zhuangshi Centre | Cross-symmetric grid |
| 39 | Lianyungang Donghai Shuijing Centre | Asymmetric grid |
| 40 | Haiwaihai Hangzhou Qiche Centre | Axisymmetric grid |
| 41 | Zhuji Huadong Guoji Zhubao Centre | Cross-symmetric grid |
| 42 | Dongyang Mudiao Centre | Axisymmetric grid |
| 43 | Weifang Haode Maoyi Market | Axisymmetric grid |
| 44 | Jinan Likou Fuzhuang Centre | Asymmetric grid |
| 45 | Qianqing Qingfang Yuanliao Centre | Axisymmetric grid |
| 46 | Langfang Huancheng Guoji Qiche Centre | Axisymmetric grid |
| 47 | Haozhou Zhongyaocai Market | Cross-symmetric grid |
| 48 | Guiyang Xinan Shanmao Centre | Asymmetric grid |
| 49 | Dongyang Huamu Jiaju Centre | Asymmetric grid |
| 50 | Changzhou Zhouqu Dengju Market | Asymmetric grid |
| 51 | Liaocheng Guangcai Market | Axisymmetric grid |
| 52 | Zhejiang Datang Qingfang Centre | Cross-symmetric grid |
| 53 | Wenzhou Yide Xiebo Centre | Cross-symmetric grid |
| 54 | Guangzhou Jiangnan Guocai Market | Asymmetric grid |
| 55 | LuQiao Riyongpin Market | Cross-symmetric grid |
| 56 | Wuxi Jinshu Cailiao Market | Axisymmetric grid |
| 57 | Shenzhen Shuibei Zhubao Centre | Asymmetric grid |
| 58 | Zhejiang Linhang Jinshu Centre | Asymmetric grid |
| 59 | Weifang Qingzhou Huahui Centre | Axisymmetric grid |
| 60 | Wuxi Chaoyang Market | Axisymmetric grid |
| 61 | Ningbo Shihua Changping Market | Asymmetric grid |
| 62 | Shenzhen Haijixing Wuliu Centre | Axisymmetric grid |
| 63 | Zibo Shafa Jiaju Market | Axisymmetric grid |
| 64 | Ningbo Shihua Changpin Market | Asymmetric grid |
| 65 | Linzhe Ruixin Qimo Centre | Axisymmetric grid |
| 66 | Guangzhou Baima Fuzhuang Market | Asymmetric grid |
| 67 | Ningbo Yetihuagong Jiaoyi Market | Axisymmetric grid |
| 68 | Qingdao Jimo Fuzhuang Market | Axisymmetric grid |
| 69 | Handan Yongnian Biaozhunjian Market | Axisymmetric grid |
| 70 | Hangzhou Liangyou Wuliu Market | Cross-symmetric grid |
| 71 | Suzhou Nanhuanqiao Pifa Market | Cross-symmetric grid |
| 72 | Changsha Huangxin Nongchangpin Market | Axisymmetric grid |
| 73 | Zhejiang Jili Tongzhuang Market | Cross-symmetric grid |
| 74 | Zhexin Huamu Centre | Asymmetric grid |
| 75 | Shandong Taishan Gangcai Market | Asymmetric grid |
| 76 | Jiaxin Changsichou Market | Cross-symmetric grid |
| 77 | Jiangsu Huagongpin Jiaoyi Market | Asymmetric grid |
| 78 | Shenzhen Huanan Cheng | Cross-symmetric grid |
| 79 | Tengzhou Nongfu Changpin Centre | Asymmetric grid |
| 80 | Jiangsu Huadong Wujin Centre | Axisymmetric grid |
| 81 | Dezhou Haitao Shangcheng Company | Axisymmetric grid |
| 82 | Zhejiang Ruian Centre | Cross-symmetric grid |
| 83 | Dongyue Guoji Huamu Centre | Asymmetric grid |
| 84 | Dongguang Xinli Guoji Maoyi Centre | Asymmetric grid |
| 85 | Jinan Zhongheng Centre | Axisymmetric grid |
| 86 | Pinghu Fuzhuang Centre | Axisymmetric grid |
| 87 | Jinxiang Dasuan Guoji Jiaoyi Market | Cross-symmetric grid |
| 88 | Guangzhou Guoji Qingfang Centre | Asymmetric grid |
| 89 | Xintai Qinghe Yangrong Centre | Asymmetric grid |
| 90 | Hangzhou Xinshidai Jiaju Centre | Asymmetric grid |
| 91 | Jiangyin Guangzhuan Jingsu Market | Asymmetric grid |
| 92 | ZhangJiagang Fangzi Yuanliao Market | Asymmetric grid |
| 93 | Linzhe Xiaoshangpin Centre | Axisymmetric grid |
| 94 | Linpin Jiangnan Guoji Sichou Centre | Axisymmetric grid |
| 95 | Changzhou Xiaxi Huamu Market | Asymmetric grid |
| 96 | Tengzhou Jiayu Shangmao Centre | Asymmetric grid |
| 97 | Shijiazhuang Xinji Pige Centre | Axisymmetric grid |
| 98 | Chongqin Yuzhong Daronghui | Asymmetric grid |
| 99 | Haining Jiafang Centre | Cross-symmetric grid |
| 100 | Zhejiang Nanxun Jiancai Market | Asymmetric grid |
Appendix B
References
- Wang, H.; Dong, X.; Rozelle, S.; Huang, J.; Reardon, T. Producing and Procuring Horticultural Crops with Chinese Characteristics: The Case of Northern China. World Dev. 2009, 37, 1791–1801. [Google Scholar] [CrossRef]
- Fang, Y.; Mao, J.; Liu, Q.; Huang, J. Exploratory space data analysis of spatial patterns of large-scale retail commercial facilities: The case of Gulou District, Nanjing, China. Front. Archit. Res. 2021, 10, 17–32. [Google Scholar] [CrossRef]
- Lin, M.-F.; Perng, Y.-H. Exploration of key commercial space design indicators. IOP Conf. Ser. Mater. Sci. Eng. 2019, 652, 012067. [Google Scholar] [CrossRef]
- Lam, B.Y.M.; Chau, K.W. Explaining the variations in the pedestrian flow values of shopping centres. Facilities 2012, 30, 164–176. [Google Scholar] [CrossRef]
- Stienmetz, J.L.; Fesenmaier, D.R. Destination Value Systems: Modeling Visitor Flow Structure and Economic Impact. J. Travel Res. 2018, 58, 1249–1261. [Google Scholar] [CrossRef]
- Gan, X.; Huang, L.; Wang, H.; Mou, Y.; Wang, D.; Hu, A. Optimal Block Size for Improving Urban Vitality: An Exploratory Analysis with Multiple Vitality Indicators. J. Urban Plan. Dev. 2021, 147, 04021027. [Google Scholar] [CrossRef]
- Othman, F.; Yusoff, Z.M.; Salleh, S.A. Assessing the visualization of space and traffic volume using GIS-based processing and visibility parameters of space syntax. Geo-Spat. Inf. Sci. 2020, 23, 209–221. [Google Scholar] [CrossRef]
- Chen, Z.; Gong, Z.; Yang, S.; Ma, Q.; Kan, C. Impact of extreme weather events on urban human flow: A perspective from location-based service data. Comput. Environ. Urban Syst. 2020, 83, 101520. [Google Scholar] [CrossRef]
- Martani, C.; Stent, S.; Acikgoz, S.; Soga, K.; Bain, D.; Jin, Y. Pedestrian monitoring techniques for crowd-flow prediction. Proc. Inst. Civ. Eng. Smart Infrastruct. Constr. 2017, 170, 17–27. [Google Scholar] [CrossRef]
- Molyneaux, N.; Scarinci, R.; Bierlaire, M. Design and analysis of control strategies for pedestrian flows. Transportation 2020, 48, 1767–1807. [Google Scholar] [CrossRef]
- Vanumu, L.D.; Ramachandra Rao, K.; Tiwari, G. Fundamental diagrams of pedestrian flow characteristics: A review. Eur. Transp. Res. Rev. 2017, 9, 17. [Google Scholar] [CrossRef]
- Khare, A.; Awasthi, G.; Shukla, R.P. Do mall events affect mall traffic and image? A qualitative study of Indian mall retailers. Asia Pac. J. Mark. Logist. 2019, 32, 343–365. [Google Scholar] [CrossRef]
- Hahm, Y.; Yoon, H.; Choi, Y. The effect of built environments on the walking and shopping behaviors of pedestrians; A study with GPS experiment in Sinchon retail district in Seoul, South Korea. Cities 2019, 89, 1–13. [Google Scholar] [CrossRef]
- Yuan, Y.; Liu, G.; Dang, R.; Lau, S.S.Y.; Qu, G. Architectural design and consumer experience: An investigation of shopping malls throughout the design process. Asia Pac. J. Mark. Logist. 2021, 33, 1934–1951. [Google Scholar] [CrossRef]
- Liu, F.; Liu, J.; Yin, Y.; Wang, W.; Hu, D.; Chen, P.; Niu, Q. Survey on WiFi-based indoor positioning techniques. IET Commun. 2020, 14, 1372–1383. [Google Scholar] [CrossRef]
- Subedi, S.; Pyun, J.Y. A Survey of Smartphone-Based Indoor Positioning System Using RF-Based Wireless Technologies. Sens. 2020, 20, 7230. [Google Scholar] [CrossRef] [PubMed]
- Alam, F.; Faulkner, N.; Parr, B. Device-Free Localization: A Review of Non-RF Techniques for Unobtrusive Indoor Positioning. IEEE Internet Things J. 2021, 8, 4228–4249. [Google Scholar] [CrossRef]
- Ding, X.; Liu, Z.; Xu, H. The passenger flow status identification based on image and WiFi detection for urban rail transit stations. J. Vis. Commun. Image Represent. 2019, 58, 119–129. [Google Scholar] [CrossRef]
- Ma, C.; Dai, G.; Zhou, J. Short-Term Traffic Flow Prediction for Urban Road Sections Based on Time Series Analysis and LSTM_BILSTM Method. IEEE Trans. Intell. Transp. Syst. 2022, 23, 5615–5624. [Google Scholar] [CrossRef]
- Xiao, F.; Guo, Z.; Ni, Y.; Xie, X.; Maharjan, S.; Zhang, Y. Artificial Intelligence Empowered Mobile Sensing for Human Flow Detection. IEEE Netw. 2019, 33, 78–83. [Google Scholar] [CrossRef]
- Huang, Y.-Q.; Zheng, J.-C.; Sun, S.-D.; Yang, C.-F.; Liu, J. Optimized YOLOv3 Algorithm and Its Application in Traffic Flow Detections. Appl. Sci. 2020, 10, 3079. [Google Scholar] [CrossRef]
- Ren, W.; Wang, X.; Tian, J.; Tang, Y.; Chan, A.B. Tracking-by-Counting: Using Network Flows on Crowd Density Maps for Tracking Multiple Targets. IEEE Trans. Image Process. 2021, 30, 1439–1452. [Google Scholar] [CrossRef] [PubMed]
- Lu, Y.; Musalem, A.; Olivares, M.; Schilkrut, A. Measuring the Effect of Queues on Customer Purchases. Manag. Sci. 2013, 59, 1743–1763. [Google Scholar] [CrossRef]
- Wei, Z.; Mukherjee, S. Analyzing and forecasting service demands using human mobility data: A two-stage predictive framework with decomposition and multivariate analysis. Expert Syst. Appl. 2024, 238, 121698. [Google Scholar] [CrossRef]
- Xu, Y.; Chen, X. Quantitative analysis of spatial vitality and spatial characteristics of urban underground space (UUS) in metro area. Tunn. Undergr. Space Technol. 2021, 111, 103875. [Google Scholar] [CrossRef]
- Sun, G.; Webster, C.; Zhang, X. Connecting the city: A three-dimensional pedestrian network of Hong Kong. Environ. Plan. B Urban Anal. City Sci. 2019, 48, 60–75. [Google Scholar] [CrossRef]
- Porta, S.; Crucitti, P.; Latora, V. The Network Analysis of Urban Streets: A Primal Approach. Environ. Plan. B Plan. Des. 2016; 33, 705–725. [Google Scholar] [CrossRef]
- Glaeser, E.L.; Ponzetto, G.A.M.; Zou, Y. Urban networks: Connecting markets, people, and ideas. Pap. Reg. Sci. 2016, 95, 17–59. [Google Scholar] [CrossRef]
- Li, Q.; Cui, C.; Liu, F.; Wu, Q.; Run, Y.; Han, Z. Multidimensional Urban Vitality on Streets: Spatial Patterns and Influence Factor Identification Using Multisource Urban Data. ISPRS Int. J. Geo-Inf. 2021, 11, 2. [Google Scholar] [CrossRef]
- Sevtsuk, A. Estimating Pedestrian Flows on Street Networks. J. Am. Plan. Assoc. 2021, 87, 512–526. [Google Scholar] [CrossRef]
- Cooper, C.H.V.; Chiaradia, A.J.F. sDNA: 3-d spatial network analysis for GIS, CAD, Command Line & Python. SoftwareX 2020, 12, 100525. [Google Scholar] [CrossRef]
- Gopalakrishnan, S.; Wong, D.; Chin, B.; Srikanth, A.D.; Manivannan, A.; Bouffanais, R.; Schroepfer, T. Vertical Cities: Emergent Patterns of Movement and Space Use in Dense Vertically Integrated Urban Built Environments. Int. J. Smart Sustain. Cities 2023, 1, 2340005. [Google Scholar] [CrossRef]
- Cooper, C.H.V.; Harvey, I.; Orford, S.; Chiaradia, A.J.F. Using multiple hybrid spatial design network analysis to predict longitudinal effect of a major city centre redevelopment on pedestrian flows. Transportation 2019, 48, 643–672. [Google Scholar] [CrossRef]
- Rashid, M. On Spatial Mechanisms of Social Equity: Exploring the Associations between Street Networks, Urban Compactness, and Social Equity. Urban Sci. 2022, 6, 52. [Google Scholar] [CrossRef]
- Ha, S.; Jang, S.; Yang, K.; Ro, S. ERAM as a complementary method of Spatial Syntax: Comparison of methodologies by linking spatial analysis with income-producing efficiency for a retail outlet in South Korea. Int. J. Urban Sci. 2020, 24, 516–531. [Google Scholar] [CrossRef]
- Andi, A.; Abednego, I.A.; Gultom, B.J.B. Space Syntax Guide to Optimize Shopping Mall. Int. J. Environ. Archit. Soc. 2021, 1, 19–30. [Google Scholar] [CrossRef]
- Pafka, E.; Dovey, K.; Aschwanden, G.D.P.A. Limits of space syntax for urban design: Axiality, scale and sinuosity. Environ. Plan. B Urban Anal. City Sci. 2018, 47, 508–522. [Google Scholar] [CrossRef]
- Ota, A.; Mizuno, R.; Uriel Garrido, G.; Kaneda, T. Analysis of the Correlation Between Underground Spatial Configurations and Pedestrian Flows Using Space Syntax Measures: A Case Study of the Sakae District Underground Mall Complex. In Downtown Dynamics. Agent-Based Social Systems; Springer: Tokyo, Japan, 2020; pp. 65–83. [Google Scholar]
- Sharmin, S.; Kamruzzaman, M. Meta-analysis of the relationships between space syntax measures and pedestrian movement. Transp. Rev. 2017, 38, 524–550. [Google Scholar] [CrossRef]
- Batty, M. Integrating space syntax with spatial interaction. Urban Inform. 2022, 1, 4. [Google Scholar] [CrossRef]
- Nag, D.; Sen, J.; Goswami, A.K. Measuring Connectivity of Pedestrian Street Networks in the Built Environment for Walking: A Space-Syntax Approach. Transp. Dev. Econ. 2022, 8, 34. [Google Scholar] [CrossRef]
- Yamu, C.; van Nes, A.; Garau, C. Bill Hillier’s Legacy: Space Syntax—A Synopsis of Basic Concepts, Measures, and Empirical Application. Sustainability 2021, 13, 3394. [Google Scholar] [CrossRef]
- Huang, Y.; Zhang, Z.; Fei, J.; Chen, X. Optimization Strategies of Commercial Layout of Traditional Villages Based on Space Syntax and Space Resistance Model: A Case Study of Anhui Longchuan Village in China. Buildings 2023, 13, 1016. [Google Scholar] [CrossRef]
- Kelkoul, L.R.; Chougui, A. Structural qualities of urban space revealed by spatial representation and intelligibility readings: The case of Setif City, Algeria. URBE Rev. Bras. De Gestão Urbana 2022, 14, e20210393. [Google Scholar] [CrossRef]
- Fan, P.Y.; Chun, K.P.; Mijic, A.; Tan, M.L.; Liu, M.S.; Yetemen, O. A framework to evaluate the accessibility, visibility, and intelligibility of green-blue spaces (GBSs) related to pedestrian movement. Urban For. Urban Green. 2022, 69, 127494. [Google Scholar] [CrossRef]
- Asriana, N.; Koerniawan, M.D.; Tambunan, L.; Paramita, B. The Effects Street-Network Configuration in Modelling Walkability through Space Syntax. DIMENSI (J. Archit. Built Environ.) 2023, 50, 13–20. [Google Scholar] [CrossRef]
- Blanchard, P.; Volchenkov, D. Intelligibility and first passage times in complex urban networks. Proc. R. Soc. A: Math. Phys. Eng. Sci. 2008, 464, 2153–2167. [Google Scholar] [CrossRef]
- Neumann, O.; Guirguis, K.; Steiner, R. Exploring artificial intelligence adoption in public organizations: A comparative case study. Public Manag. Rev. 2022, 26, 114–141. [Google Scholar] [CrossRef]
- Yu, J.-Y.; Kim, Y.; Kim, Y.-G. Intelligent Video Data Security: A Survey and Open Challenges. IEEE Access 2021, 9, 26948–26967. [Google Scholar] [CrossRef]
| Forms | Asymmetric Grid | Axisymmetric Grid | Cross-Symmetric Grid |
|---|---|---|---|
| Topology graphics |  |  |  |
| Sample |  |  |  |
| CWC1 | CWC2 | CWC3 | |
| Guangzhou Guojiqingfang | Yiwu Guoji Shangmao | Shenzhen Huanan Centre |
| Forms | Asymmetric Grid | Axisymmetric Grid | Cross-Symmetric Grid |
|---|---|---|---|
| First floor |  CWC1-1 |  CWC2-1 |  CWC3-1 |
| Second floor |  |  |  |
| CWC1-2 | CWC2-2 | CWC3-2 | |
 | |||
| Item | CWC1 | CWC2 | CWC3 |
|---|---|---|---|
| First floor |  |  |  |
| Second floor |  |  |  |
| Item | CWC1 | CWC2 | CWC3 |
|---|---|---|---|
| First floor |  | 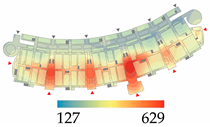 |  |
| Second floor |  | 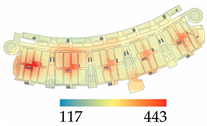 | 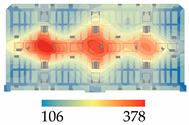 |
 | |||
| Item | CWC1 | CWC2 | CWC3 |
|---|---|---|---|
| First floor |  | 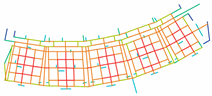 | 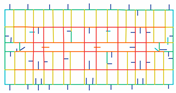 |
| Second floor | 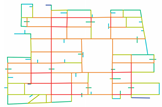 | 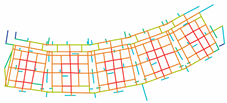 |  |
| Rn value |  | ||
| Item | Floor | Metrics | Min | Max | Average | Std Dev | Median |
|---|---|---|---|---|---|---|---|
| CWC1 (N = 118) | 1F (N = 43) | Rn | 0.742 | 2.491 | 1.428 | 0.461 | 1.267 |
| Cn | 1 | 9 | 2.967 | 2.389 | 2 | ||
| Mn | 2.033 | 4.467 | 2.987 | 0.601 | 3.006 | ||
| Ch | 0.003 | 0.466 | 0.094 | 0.115 | 0.046 | ||
| 2F (N = 75) | Rn | 1.048 | 2.987 | 1.602 | 0.386 | 1.532 | |
| Cn | 1 | 15 | 3.718 | 3.003 | 3 | ||
| Mn | 2.229 | 4.501 | 3.414 | 0.534 | 3.412 | ||
| Ch | 0.002 | 0.661 | 0.066 | 0.108 | 0.038 | ||
| CWC2 (N = 263) | 1F (N = 125) | Rn | 0.767 | 2.431 | 1.627 | 0.367 | 1.599 |
| Cn | 1 | 13 | 5.673 | 3.029 | 5 | ||
| Mn | 2.691 | 6.361 | 3.665 | 0.644 | 3.561 | ||
| Ch | 0.003 | 0.296 | 0.063 | 0.071 | 0.0317 | ||
| 2F (N = 138) | Rn | 0.784 | 2.547 | 1.615 | 0.332 | 1.521 | |
| Cn | 1 | 13 | 5.261 | 3.034 | 5 | ||
| Mn | 2.681 | 6.464 | 3.772 | 0.611 | 3.816 | ||
| Ch | 0.003 | 0.359 | 0.058 | 0.072 | 0.036 | ||
| CWC3 (N = 217) | 1F (N = 100) | Rn | 1.794 | 3.848 | 2.383 | 0.631 | 2.137 |
| Cn | 1 | 28 | 6.012 | 5.282 | 5 | ||
| Mn | 1.987 | 3.117 | 2.689 | 0.361 | 2.784 | ||
| Ch | 0.002 | 0.391 | 0.052 | 0.072 | 0.032 | ||
| 2F (N = 117) | Rn | 1.521 | 3.918 | 2.336 | 0.632 | 2.241 | |
| Cn | 1 | 30 | 4.871 | 5.783 | 5 | ||
| Mn | 2.062 | 3.734 | 2.896 | 0.455 | 2.695 | ||
| Ch | 0.002 | 0.306 | 0.035 | 0.058 | 0.026 |
| Item | CWC1 | CWC2 | CWC3 |
|---|---|---|---|
| First floor |  |  |  |
| Second floor |  |  |  |
| Rn value |  | ||
| Forms | Metrics | Rn | Cn | Mn | Ch | Pedestrian Flowrate |
|---|---|---|---|---|---|---|
| CWC1-1 | Rn | 1 | 0.829 ** | −0.981 ** | 0.858 ** | 0.829 ** |
| Cn | 0.829 ** | 1 | −0.803 ** | 0.806 ** | 0.645 * | |
| Mn | −0.981 ** | −0.803 ** | 1 | −0.889 ** | −0.732 * | |
| Ch | 0.858 ** | 806 ** | −0.889 ** | 1 | 0.619 | |
| Pedestrian Flowrate | 0.829 ** | 0.645 * | −0.732 * | 0.619 | 1 | |
| CWC1-2 | Rn | 1 | 0.869 ** | −0.977 ** | 0.893 ** | 0.863 ** |
| Cn | 0.869 ** | 1 | −0.909 ** | 0.689 ** | 0.621 | |
| Mn | −0.977 ** | −0.909 ** | 1 | −0.821 ** | −0.804 ** | |
| Ch | 893 ** | 0.689 ** | −0.821 ** | 1 | 0.806 ** | |
| Pedestrian Flowrate | 0.863 ** | 0.621 | −0.804 ** | 0.806 ** | 1 | |
| CWC2-1 | Rn | 1 | 0.780 ** | −0.993 ** | 0.740 * | 0.691 * |
| Cn | 0.780 ** | 1 | −0.776 ** | 0.745 * | 0.510 | |
| Mn | −0.993 ** | −0.776 ** | 1 | −0.695 * | −0.683 * | |
| Ch | 0.740 * | 0.745 * | −0.695 * | 1 | 0.621 * | |
| Pedestrian Flowrate | 0.691 * | 0.510 | −0.683 * | 0.621 * | 1 | |
| CWC2-2 | Rn | 1 | 0.289 | −0.997 ** | 0.801 ** | 0.657 * |
| Cn | 0.289 | 1 | −0.272 | 0.576 | 0.592 | |
| Mn | −0.997 ** | −0.272 | 1 | −0.793 ** | −0.655 * | |
| Ch | 0.801 ** | 0.176 | −0.793 ** | 1 | 0.641 * | |
| Pedestrian Flowrate | 0.657 * | 0.592 | −0.655 * | 0.641 * | 1 | |
| CWC3-1 | Rn | 1 | 0.503 | −0.994 ** | 0.859 * | 0.623 |
| Cn | 0.503 | 1 | −0.490 | 0.588 | 0.509 | |
| Mn | −0.994 ** | −0.490 | 1 | −0.843 ** | −0.619 | |
| Ch | 0.859 * | 0.588 | −0.843 ** | 1 | 0.819 ** | |
| Pedestrian Flowrate | 0.623 | 0.509 | −0.619 | 0.819 ** | 1 | |
| CWC3-2 | Rn | 1 | 0.529 | −0.735 * | 0.890 ** | 0.656 * |
| Cn | 0.529 | 1 | −0.630 | 0.649 * | 0.542 | |
| Mn | −0.735 * | −0.630 | 1 | −0.926 ** | −0.637 * | |
| Ch | 0.890 ** | 0.649 * | −0.926 ** | 1 | 0.629 * | |
| Pedestrian Flowrate | 0.656 * | 0.542 | −0.637 * | 0.629 * | 1 |
| Sample | Variable | B | t | p | VIF | Sig. | R2 | Durbin–Watson |
|---|---|---|---|---|---|---|---|---|
| CWC1-1 | X1 | 6.838 | 1.100 | 0.297 | 2.201 | 0.000 | 0.844 | 2.121 |
| X2 | 19.849 | 4.513 | 0.001 | 1.102 | ||||
| X3 | 29.881 | 2.292 | 0.045 | 2.071 | ||||
| CWC1-2 | X1 | 2.097 | 0.541 | 0.601 | 1.027 | 0.001 | 0.806 | 1.748 |
| X2 | 8.027 | 2.259 | 0.047 | 1.724 | ||||
| X3 | 10.592 | 3.113 | 0.011 | 1.729 | ||||
| CWC2-1 | X1 | 5.074 | 1.873 | 0.075 | 1.304 | 0.000 | 0.726 | 2.321 |
| X2 | 9.899 | 3.456 | 0.002 | 1.270 | ||||
| X3 | 12.444 | 3.007 | 0.007 | 1.348 | ||||
| CWC2-2 | X1 | 6.636 | 3.310 | 0.000 | 1.482 | 0.000 | 0.781 | 2.297 |
| X2 | 4.199 | 2.463 | 0.003 | 1.461 | ||||
| X3 | 4.688 | 3.344 | 0.109 | 1.964 | ||||
| CWC3-1 | X1 | 0.331 | 1.631 | 0.017 | 2.535 | 0.001 | 0.604 | 1.941 |
| X2 | 5.744 | 1.318 | 0.020 | 3.001 | ||||
| X3 | 5.174 | 0.599 | 0.055 | 1.307 | ||||
| CWC3-2 | X1 | 10.133 | 2.239 | 0.035 | 1.379 | 0.000 | 0.615 | 2.135 |
| X2 | 6.192 | 2.298 | 0.031 | 1.486 | ||||
| X3 | 6.807 | 2.529 | 0.019 | 1.651 |
Disclaimer/Publisher’s Note: The statements, opinions and data contained in all publications are solely those of the individual author(s) and contributor(s) and not of MDPI and/or the editor(s). MDPI and/or the editor(s) disclaim responsibility for any injury to people or property resulting from any ideas, methods, instructions or products referred to in the content. |
© 2024 by the authors. Licensee MDPI, Basel, Switzerland. This article is an open access article distributed under the terms and conditions of the Creative Commons Attribution (CC BY) license (https://creativecommons.org/licenses/by/4.0/).
Share and Cite
Zhou, W.; Guo, H.; Hou, X.; Lai, W.; Yao, L. A Statistical Study of the Pedestrian Distribution in a Commercial Wholesale Centre Based on the Traffic Spatial Structure. Buildings 2024, 14, 1782. https://doi.org/10.3390/buildings14061782
Zhou W, Guo H, Hou X, Lai W, Yao L. A Statistical Study of the Pedestrian Distribution in a Commercial Wholesale Centre Based on the Traffic Spatial Structure. Buildings. 2024; 14(6):1782. https://doi.org/10.3390/buildings14061782
Chicago/Turabian StyleZhou, Weiqiang, Haoxu Guo, Xiana Hou, Wenbo Lai, and Lihao Yao. 2024. "A Statistical Study of the Pedestrian Distribution in a Commercial Wholesale Centre Based on the Traffic Spatial Structure" Buildings 14, no. 6: 1782. https://doi.org/10.3390/buildings14061782