
Research on the Spatial Structure of the Beijing–Tianjin–Hebei Urban Agglomeration Based on POI and Impervious Surface Coverage
Abstract
1. Introduction
2. Materials and Methods
2.1. Study Area Overview and Data Sources
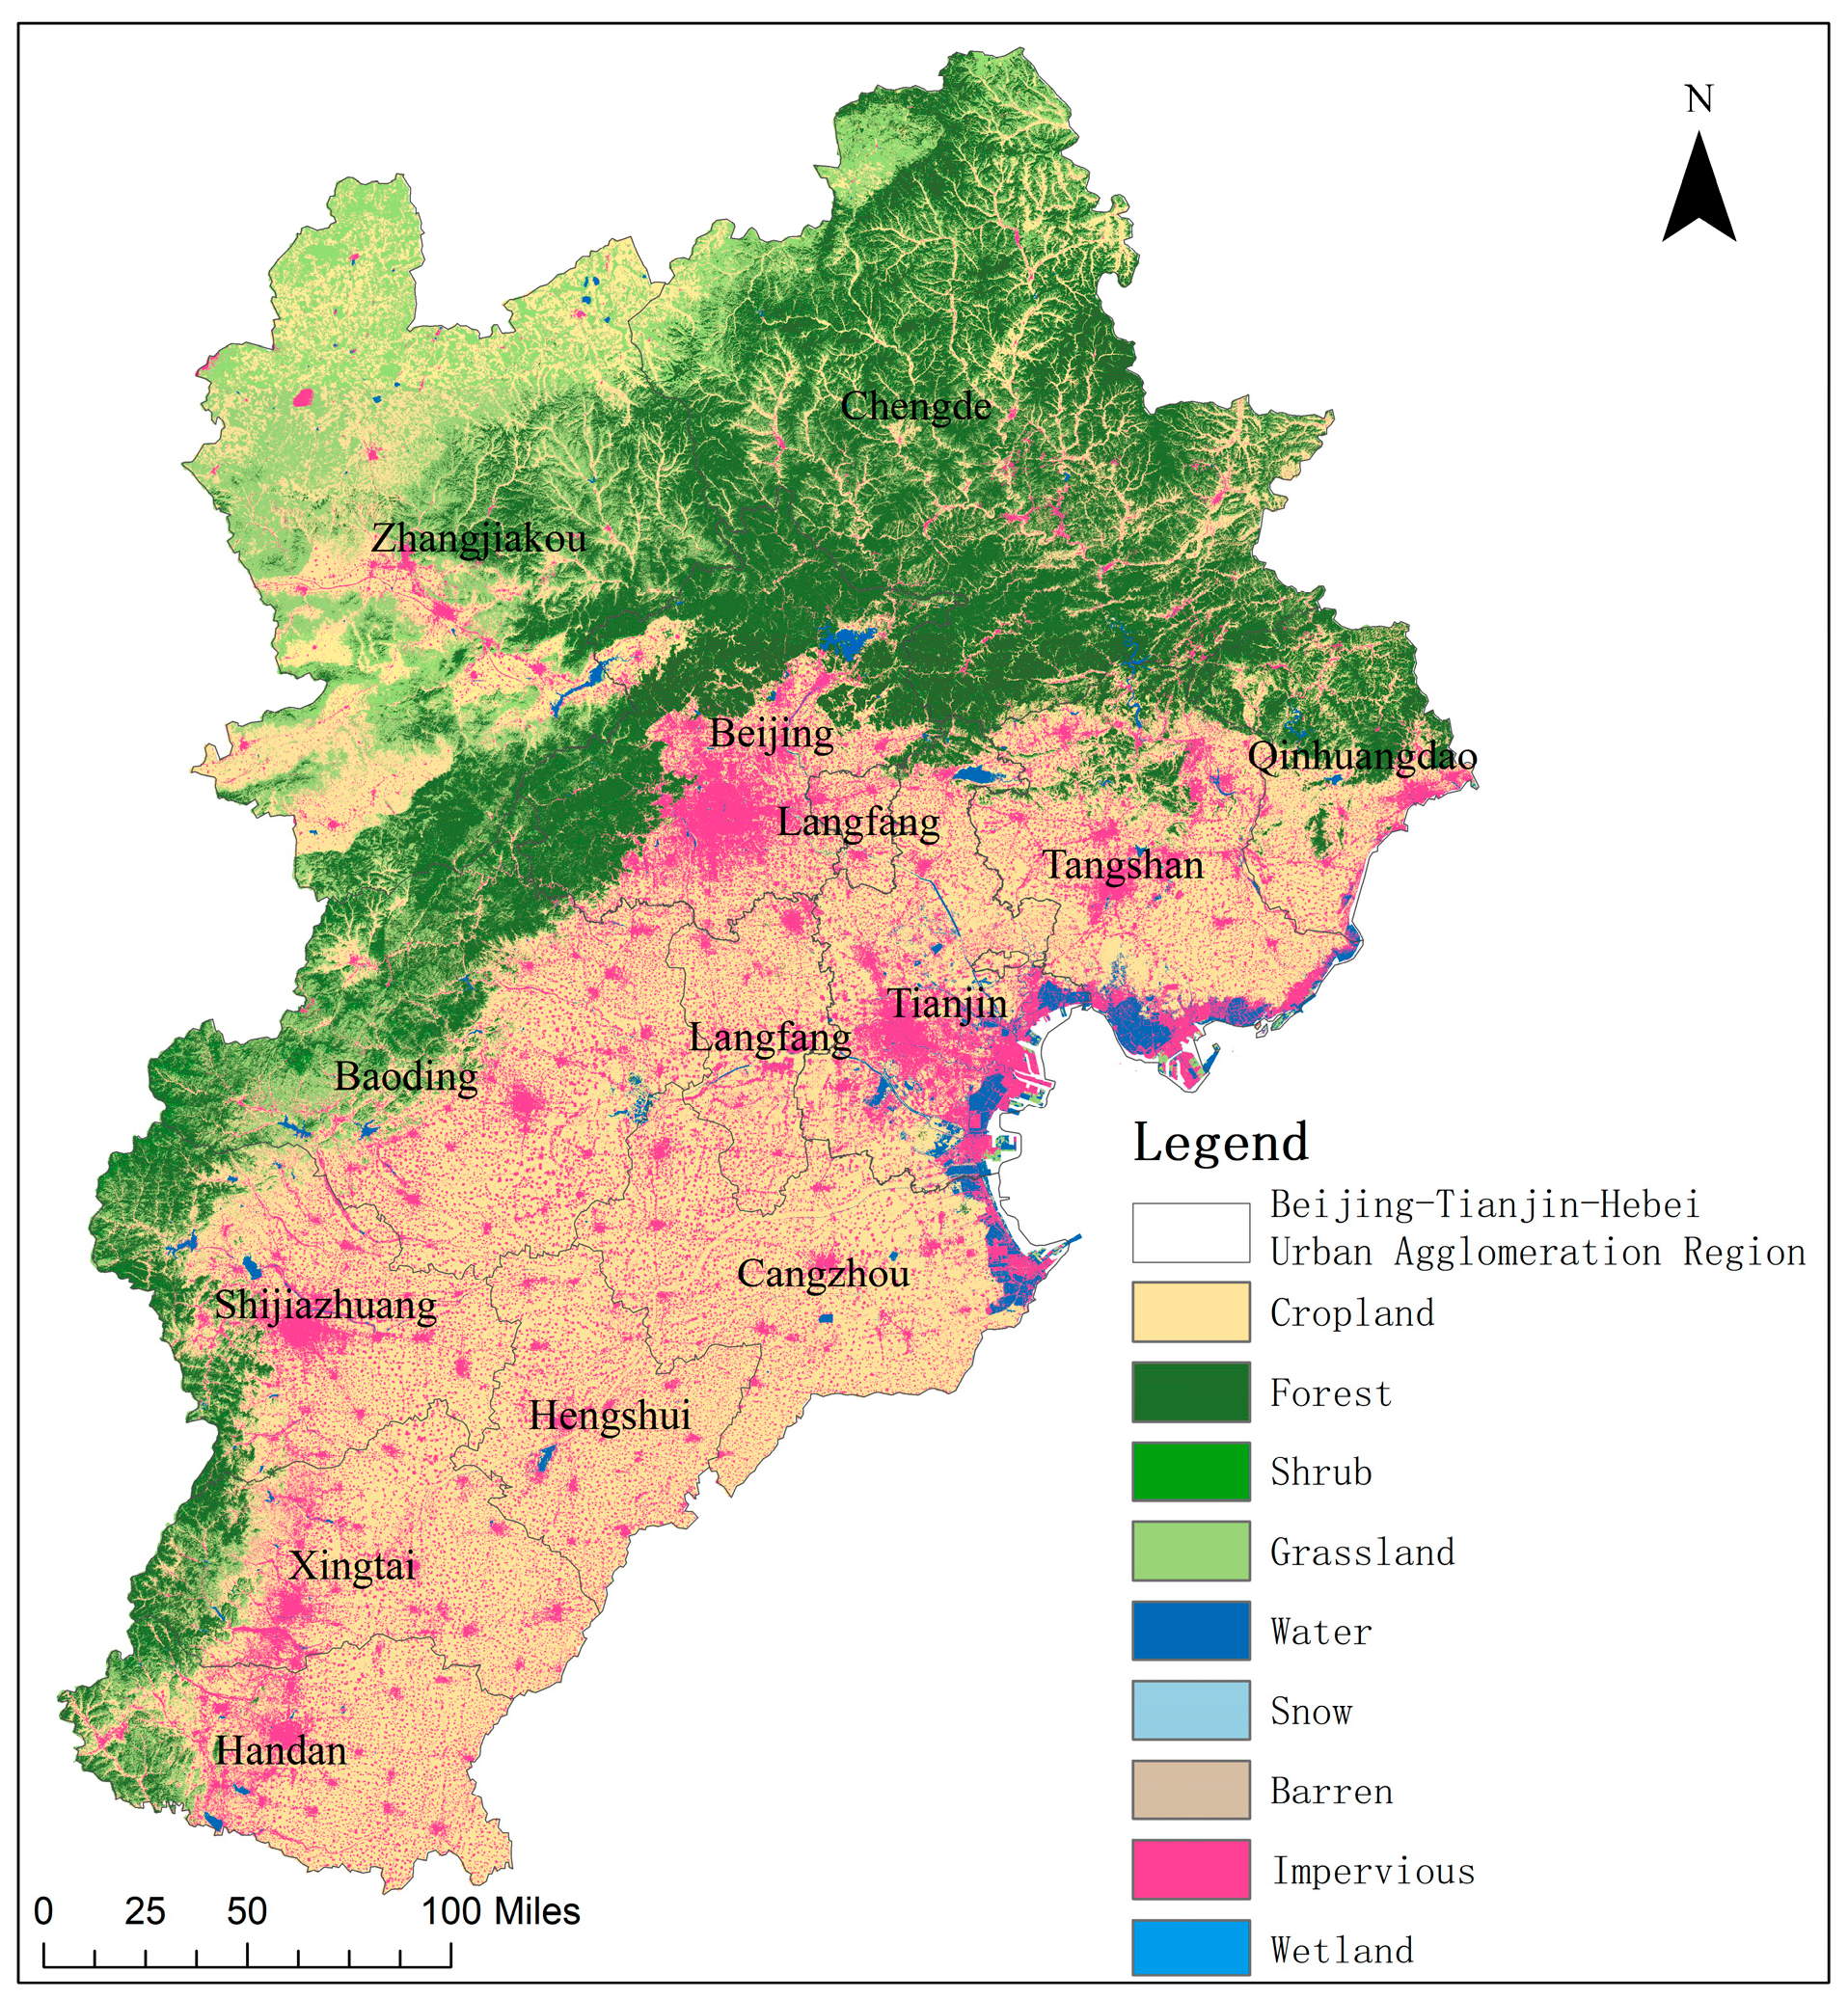
2.1.1. Study Area Overview
2.1.2. Data Sources
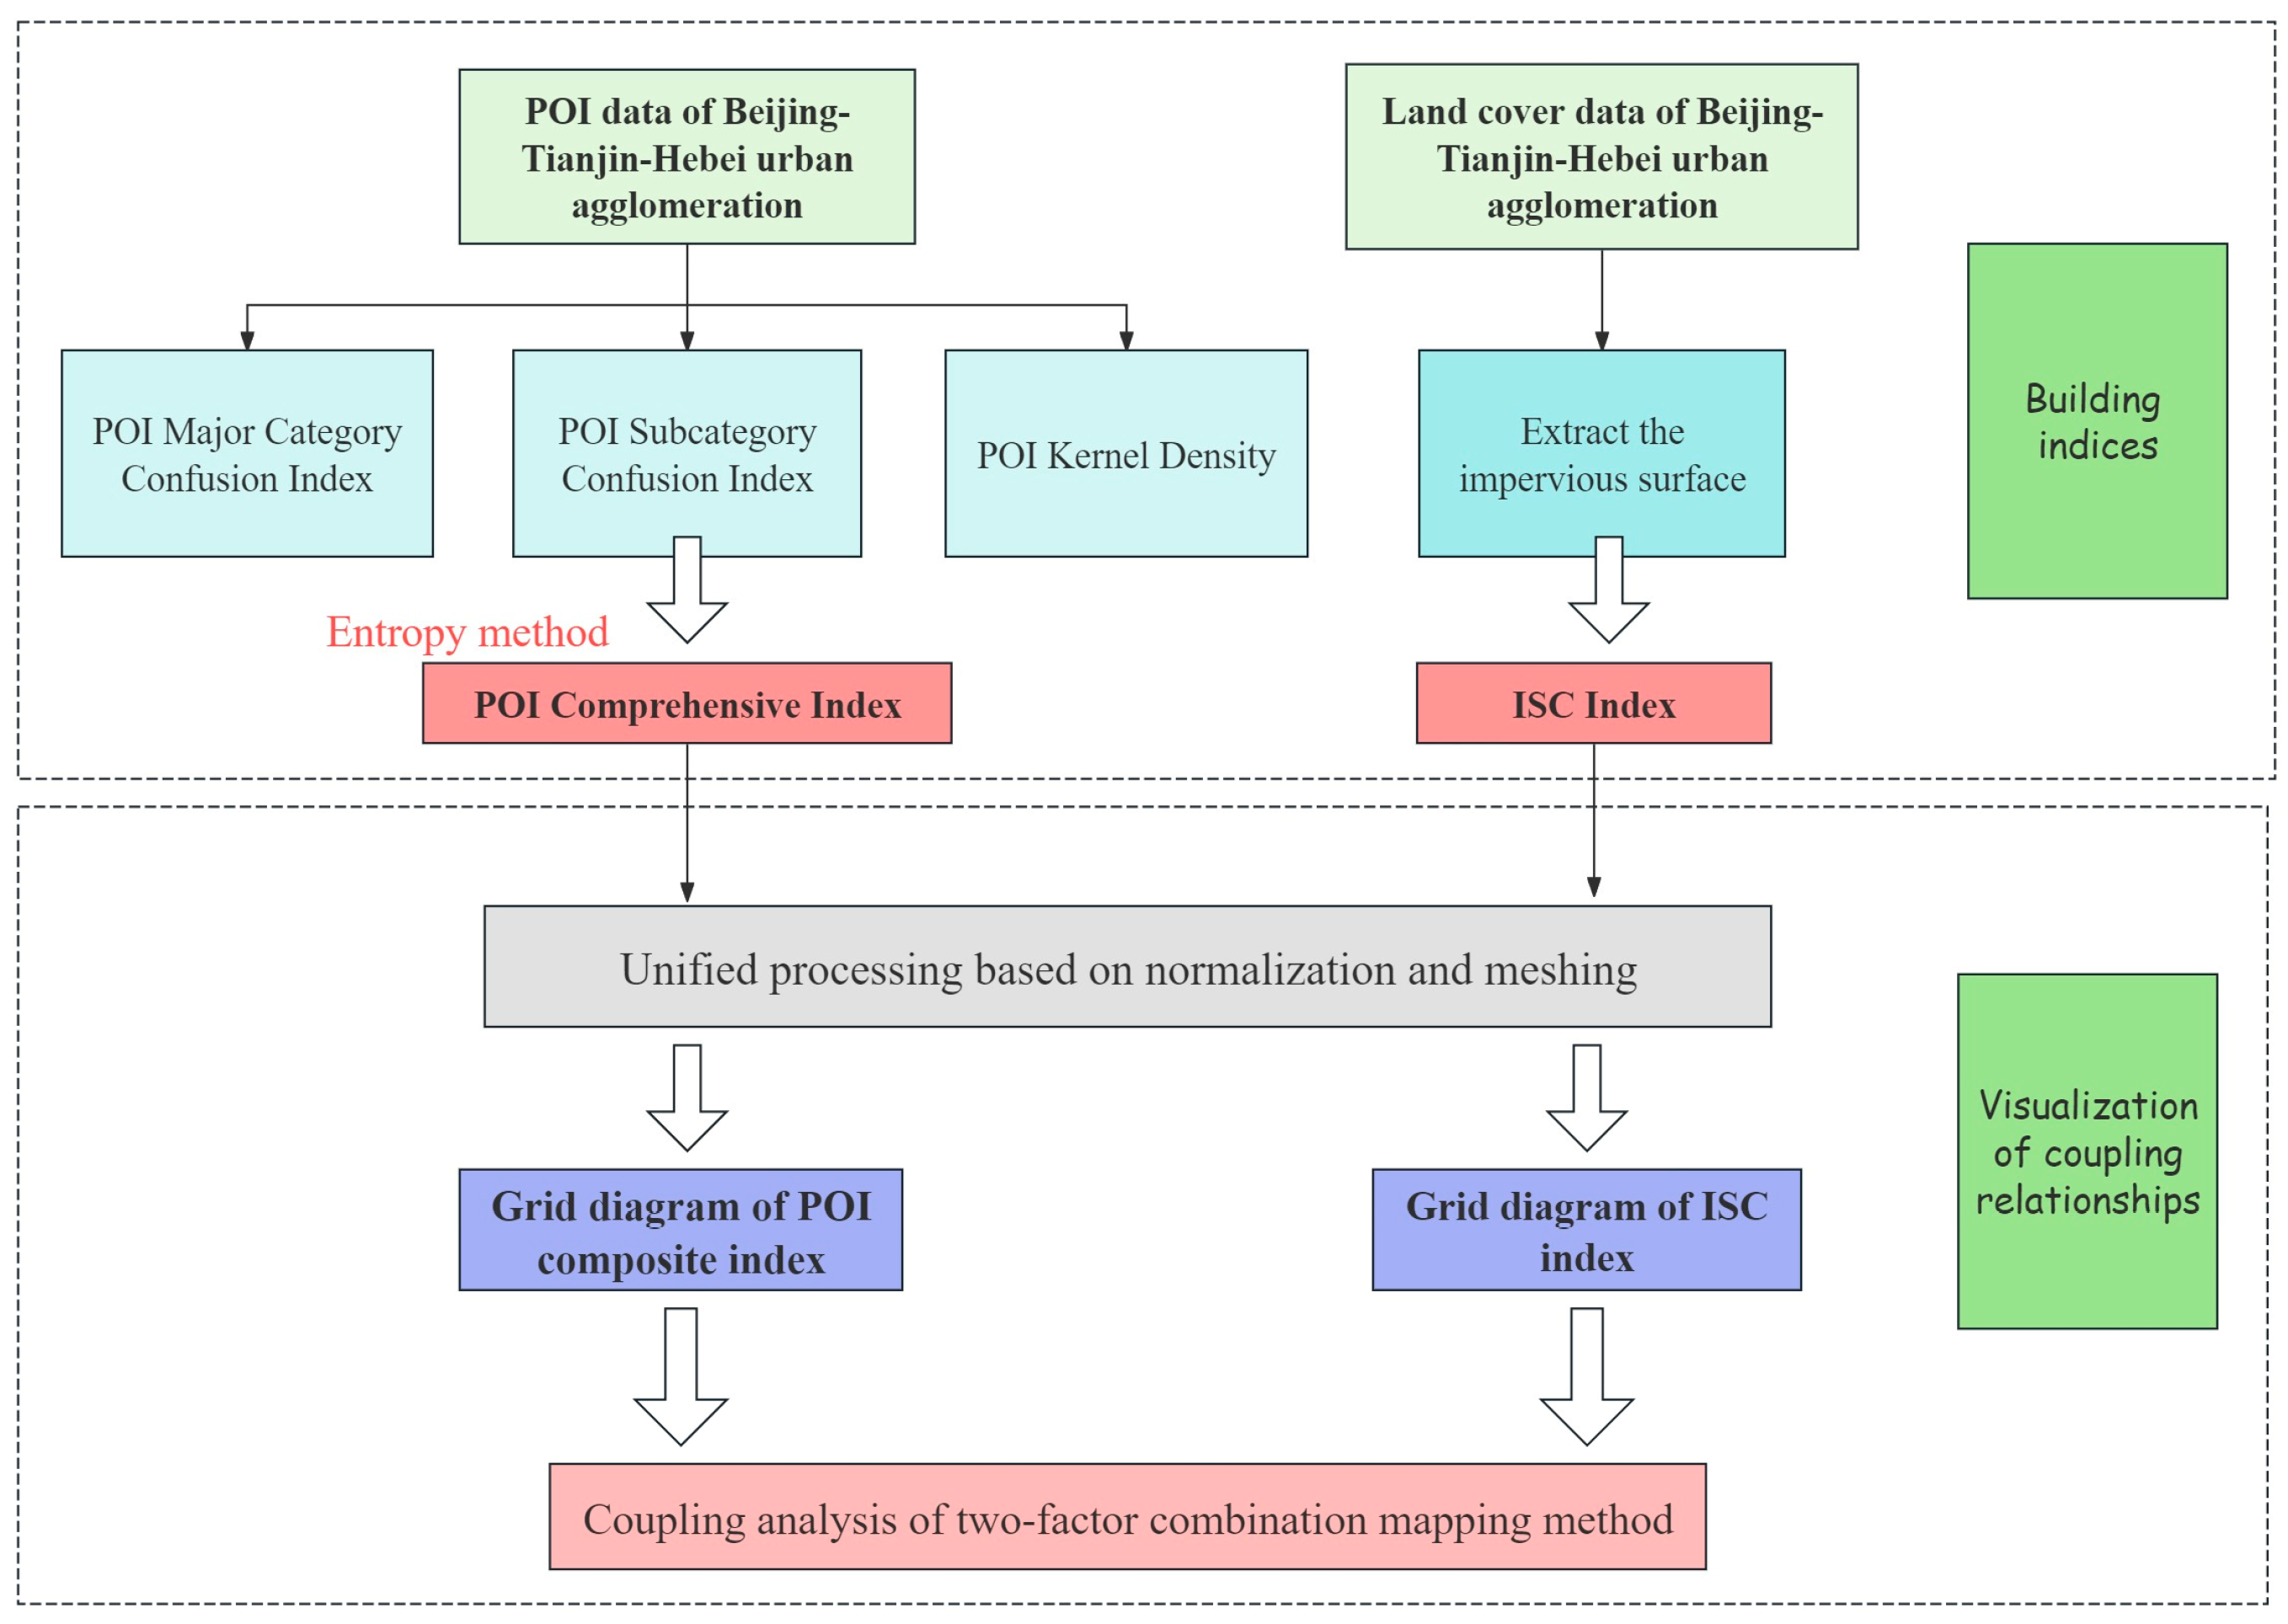
2.2. Spatial Coupling Research Methods
2.2.1. Construction of Data Indicators
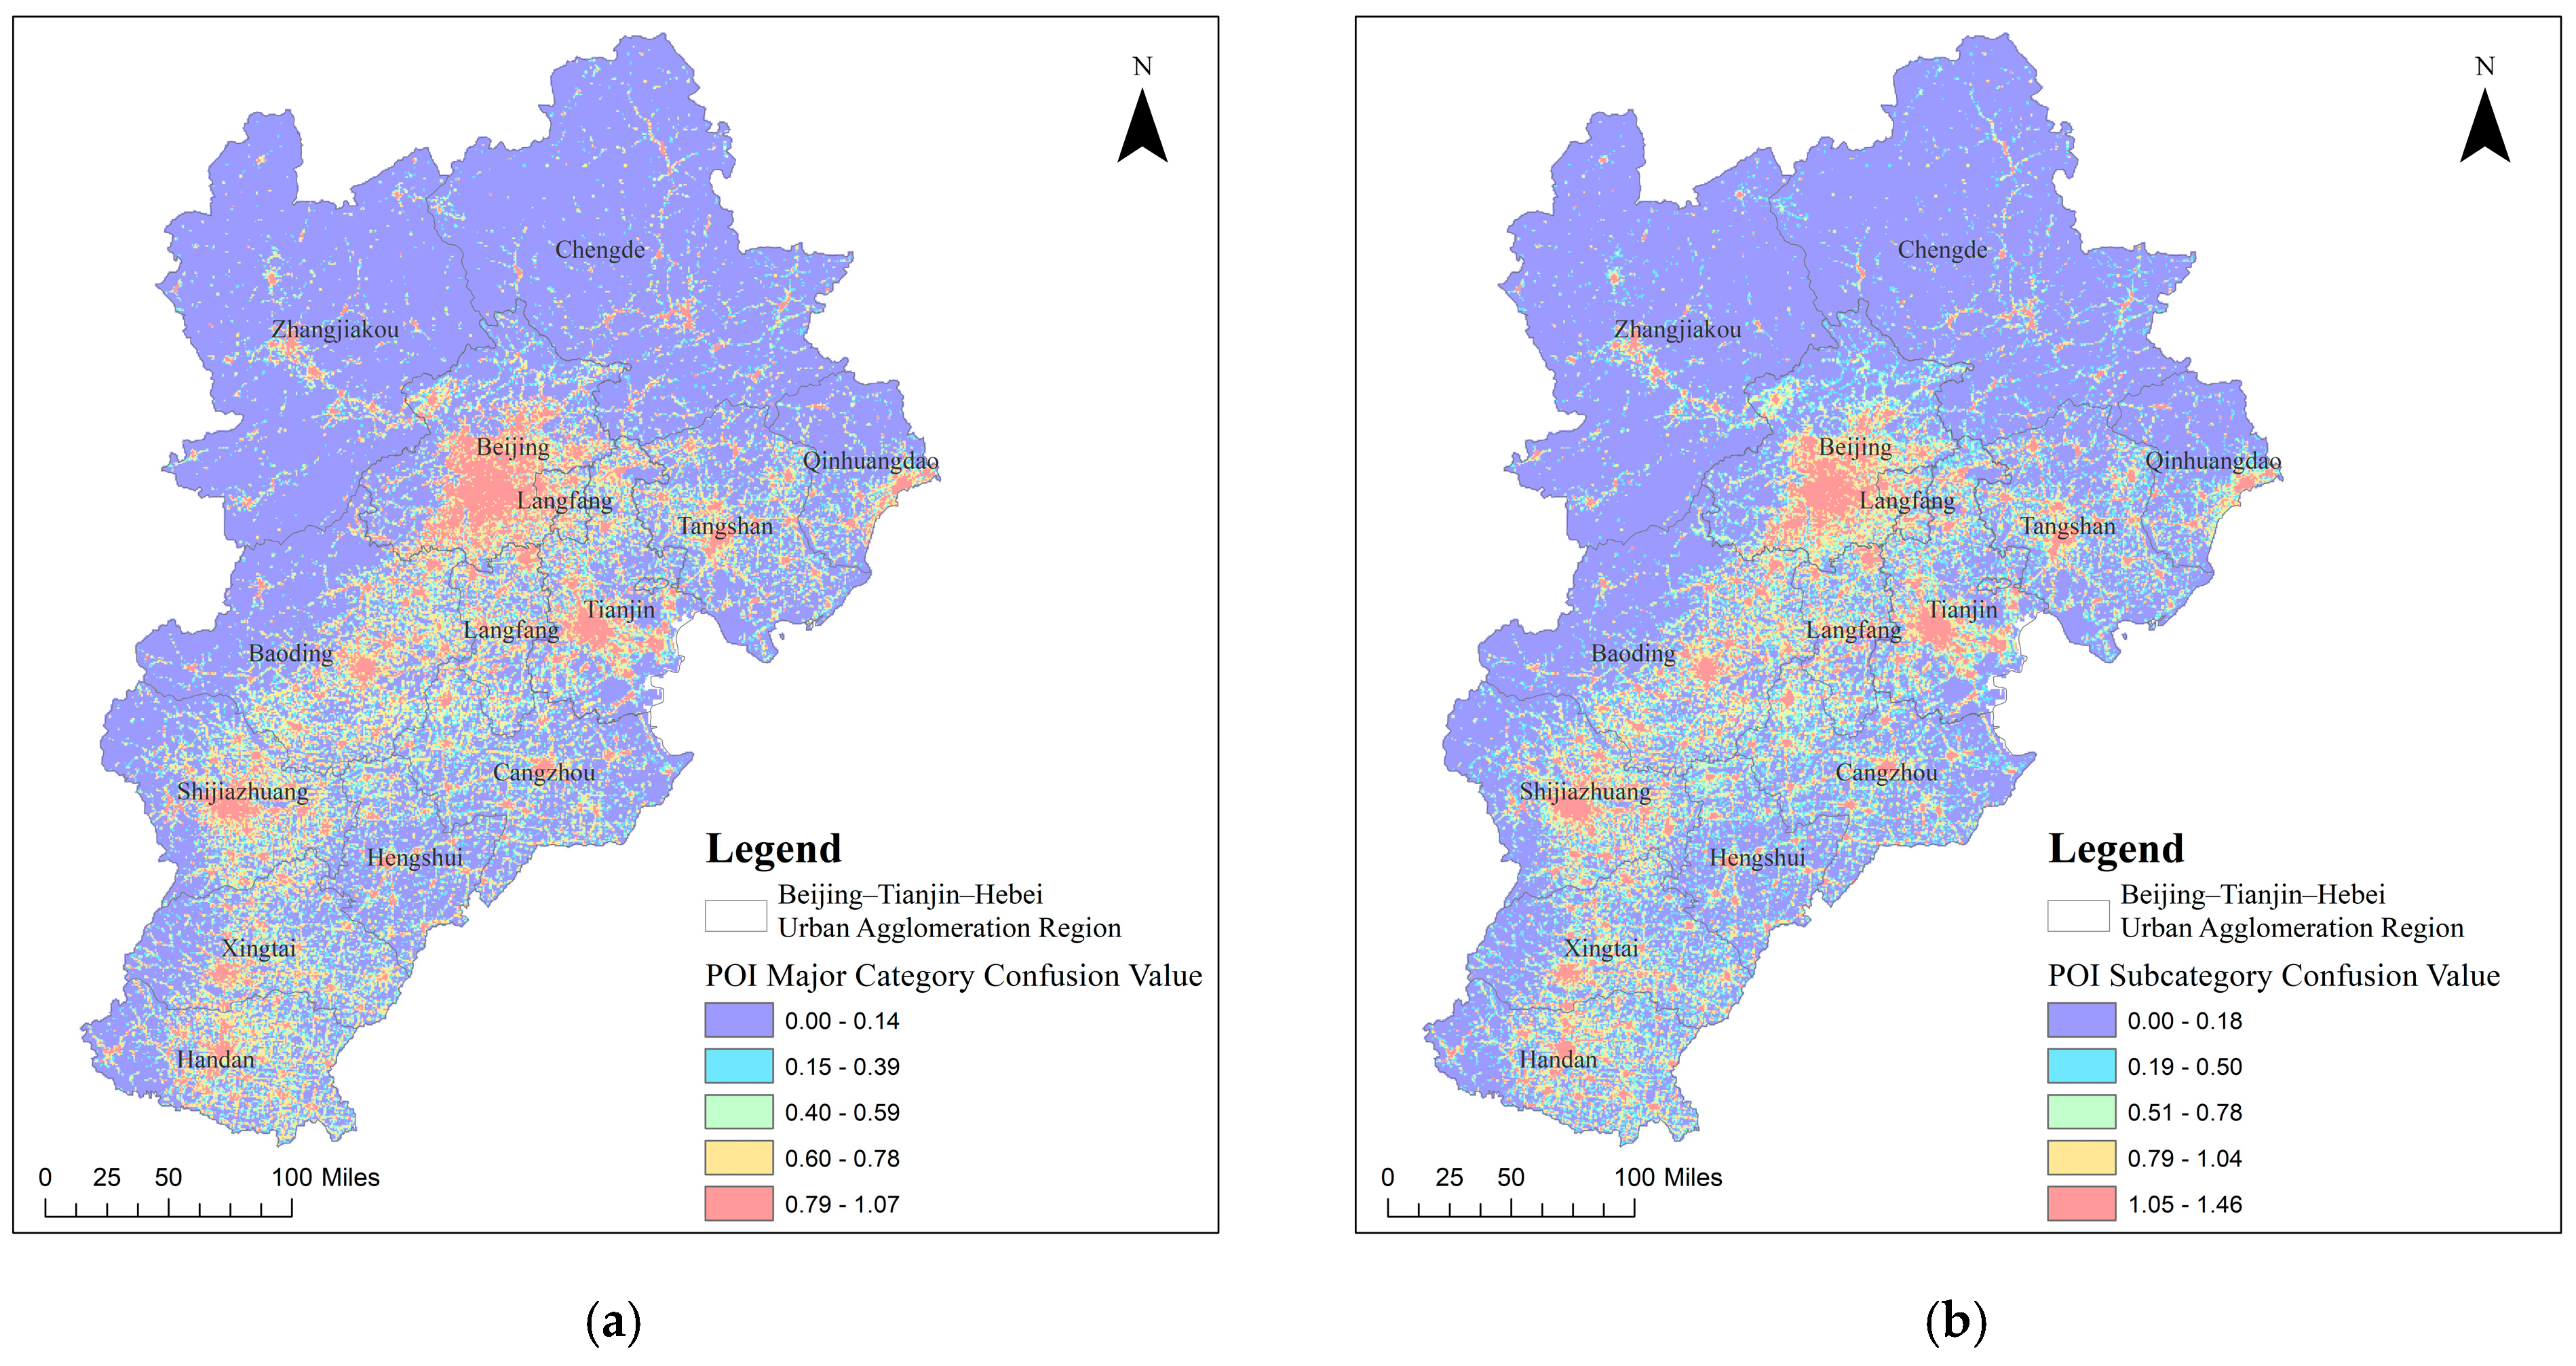
- POI Confusion Index
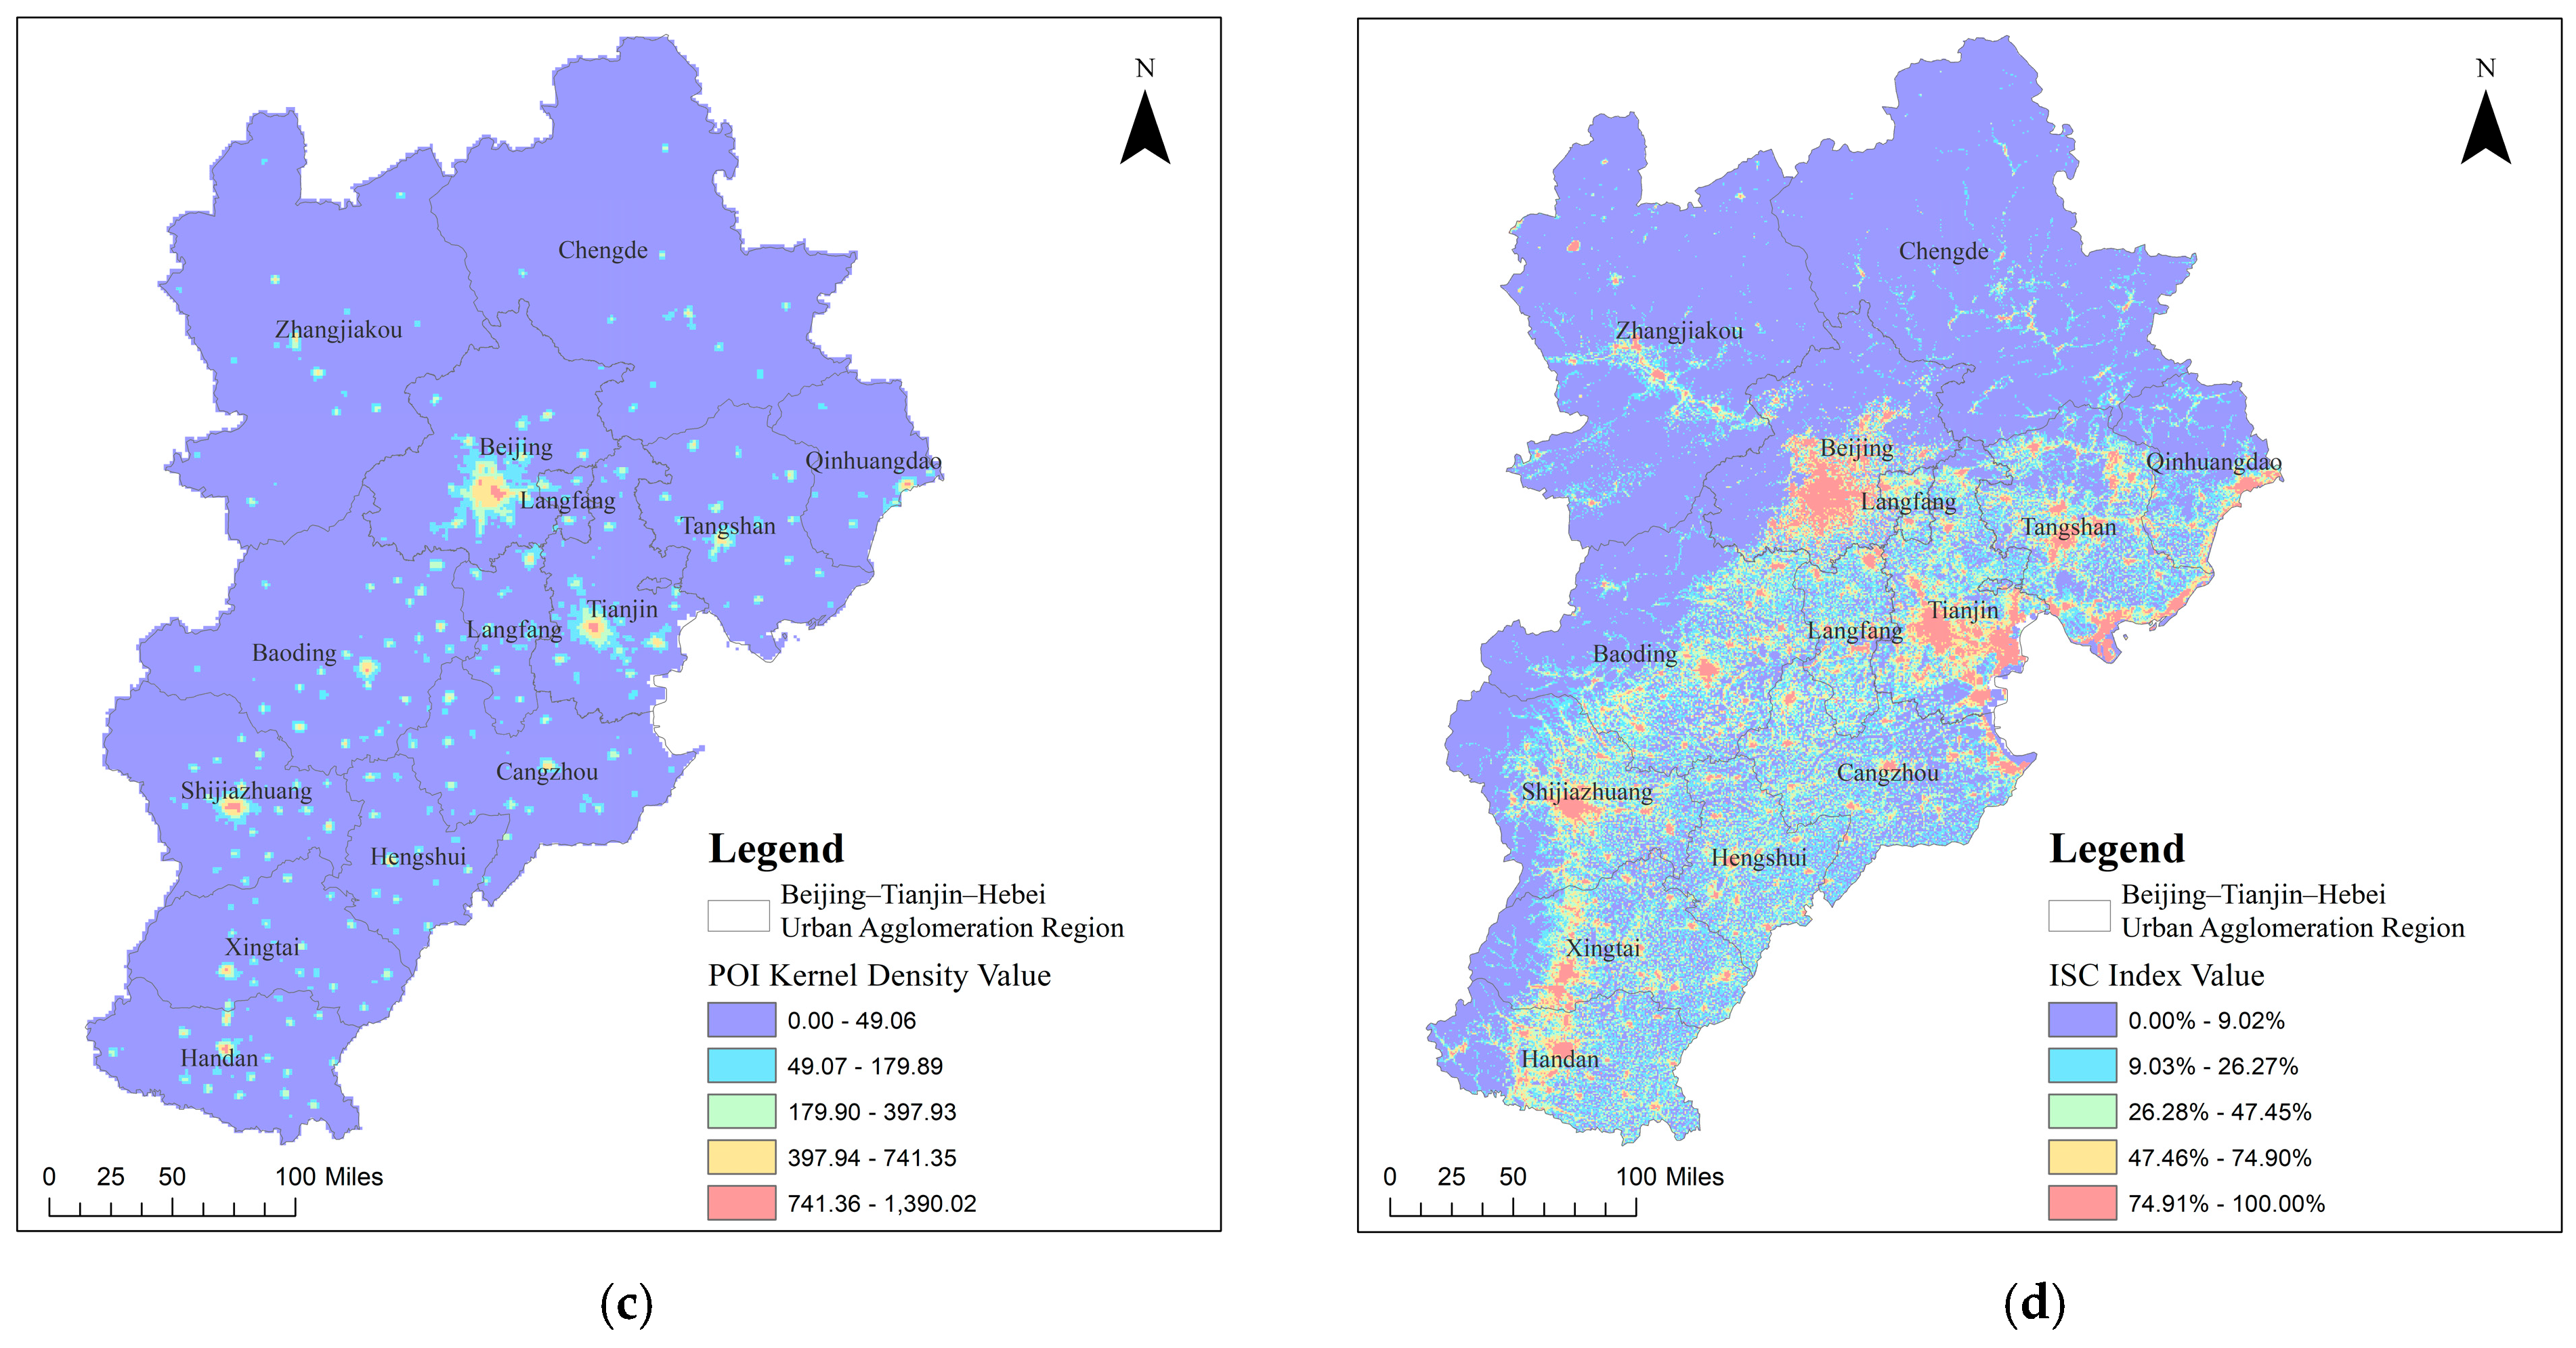
- POI Kernel Density
- Impervious Surface Coverage Index
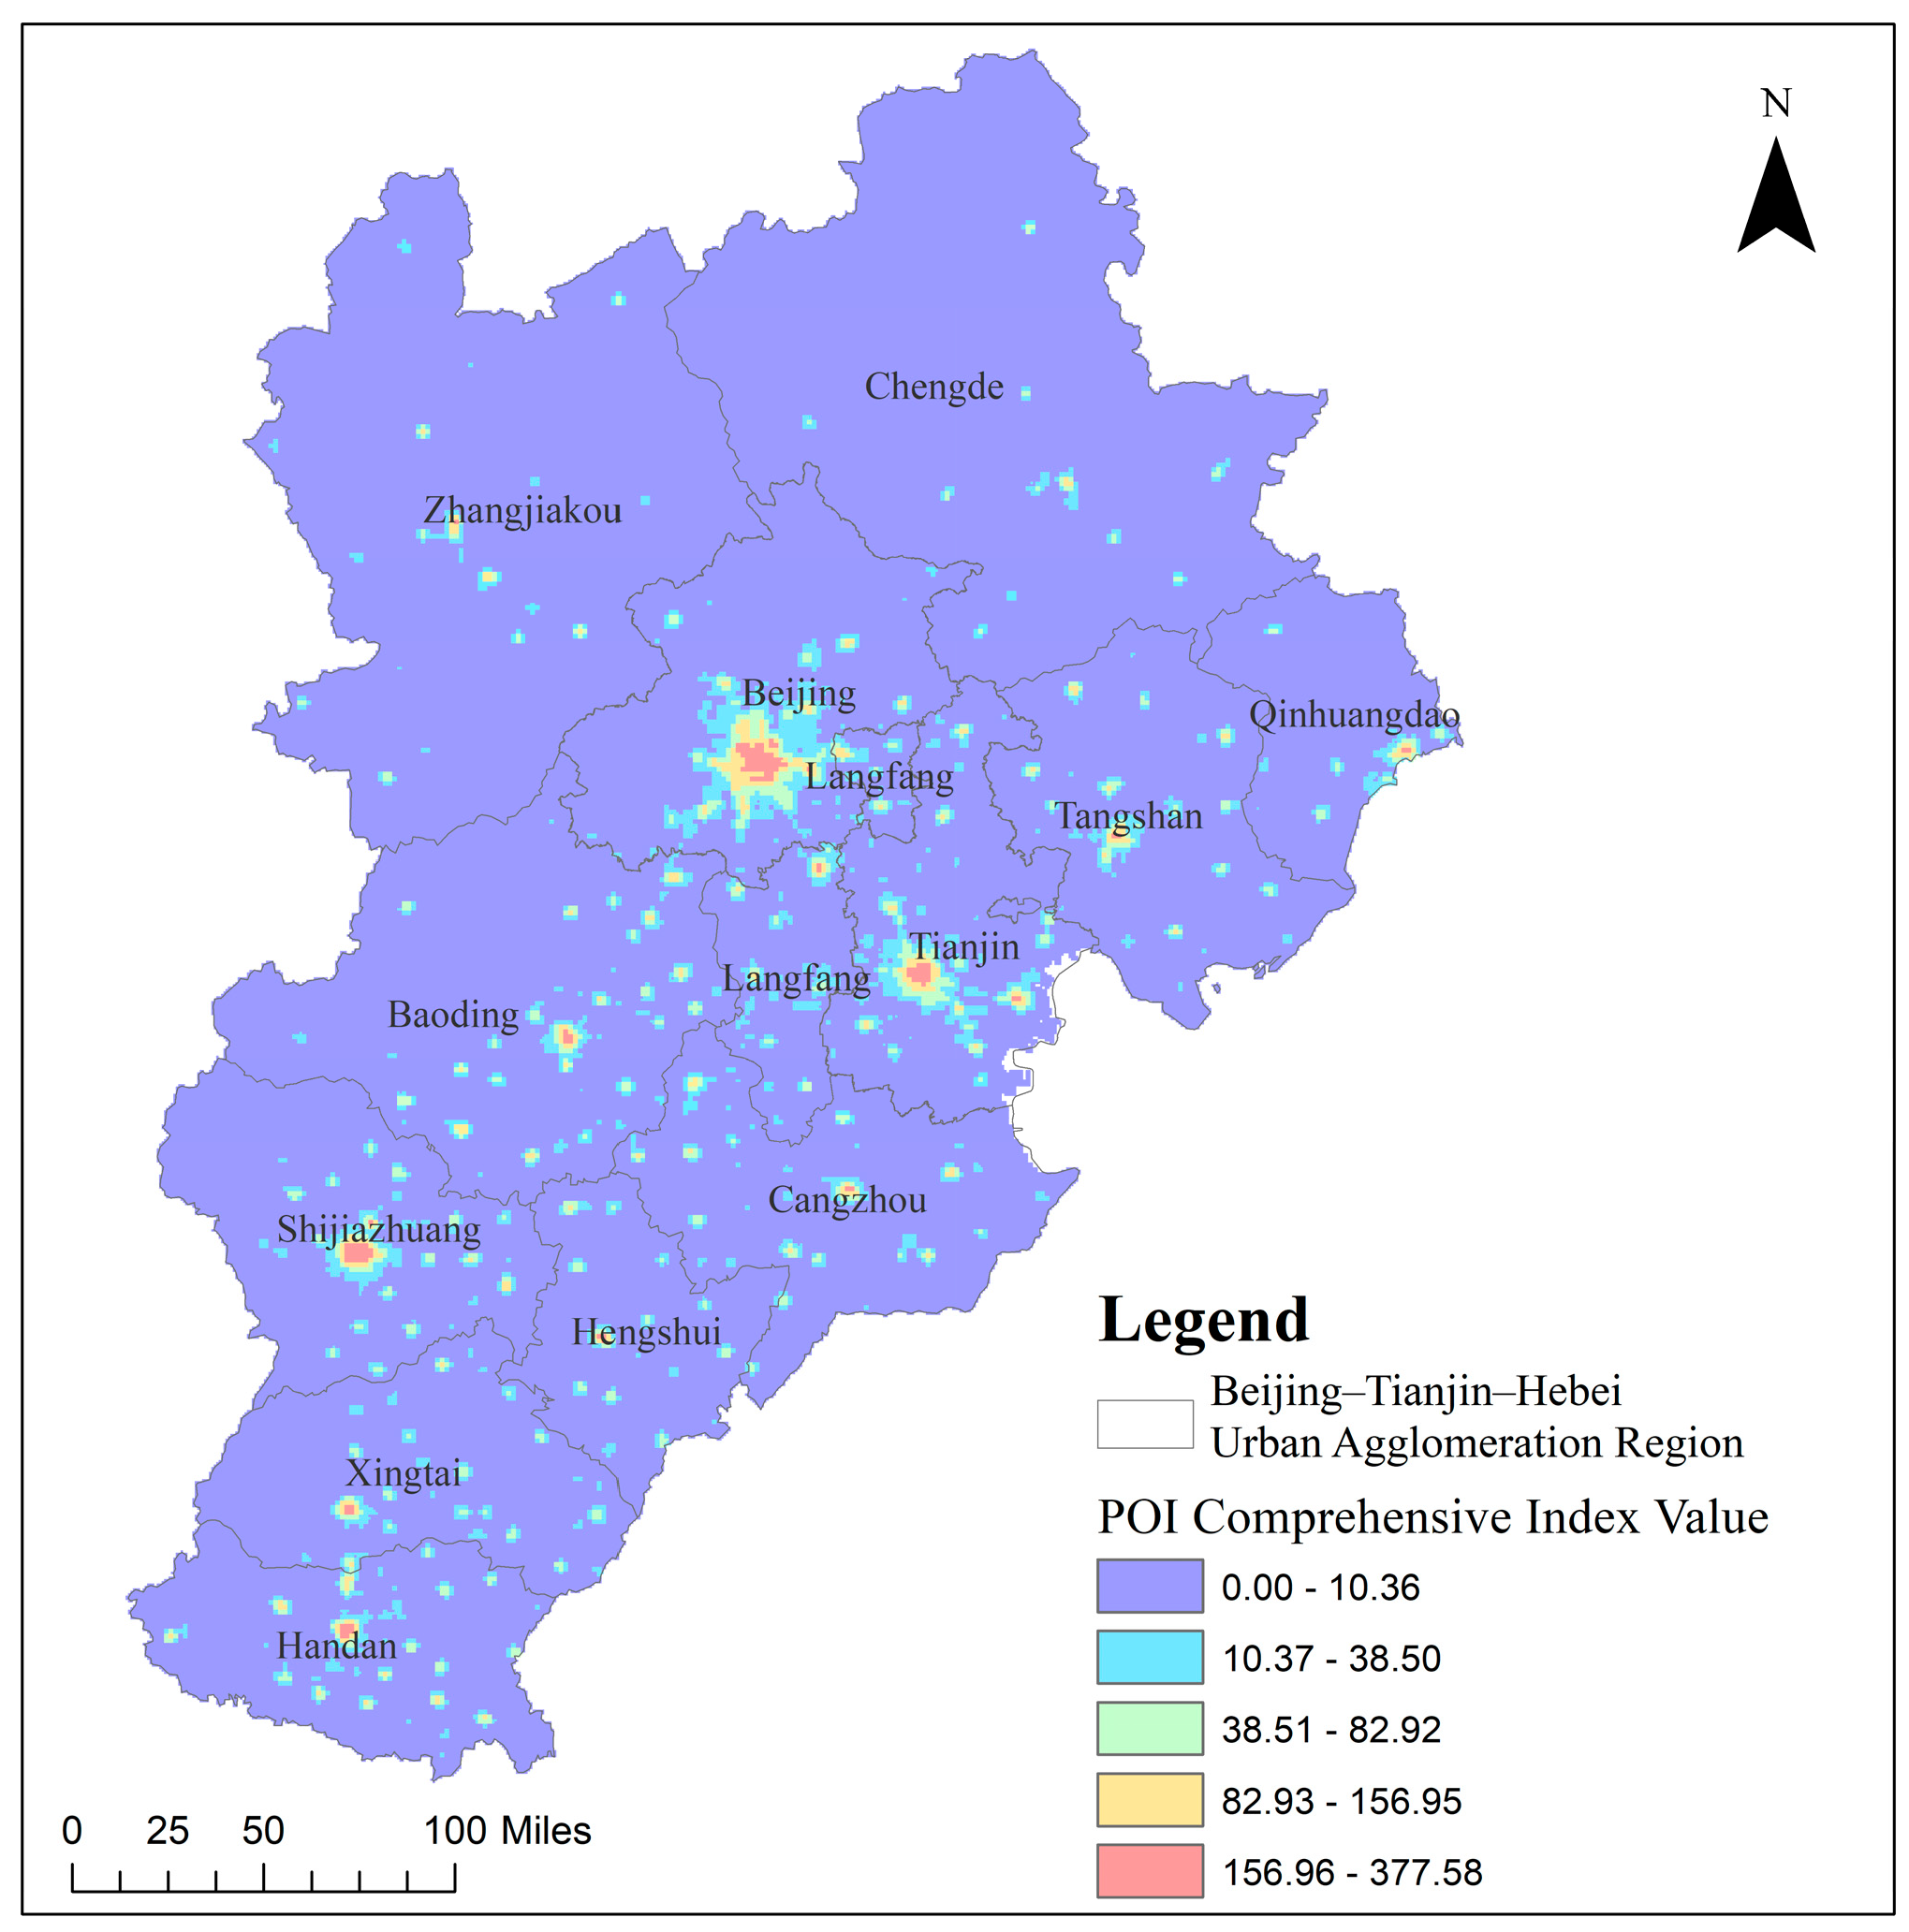
2.2.2. Construction of POI Comprehensive Indicators
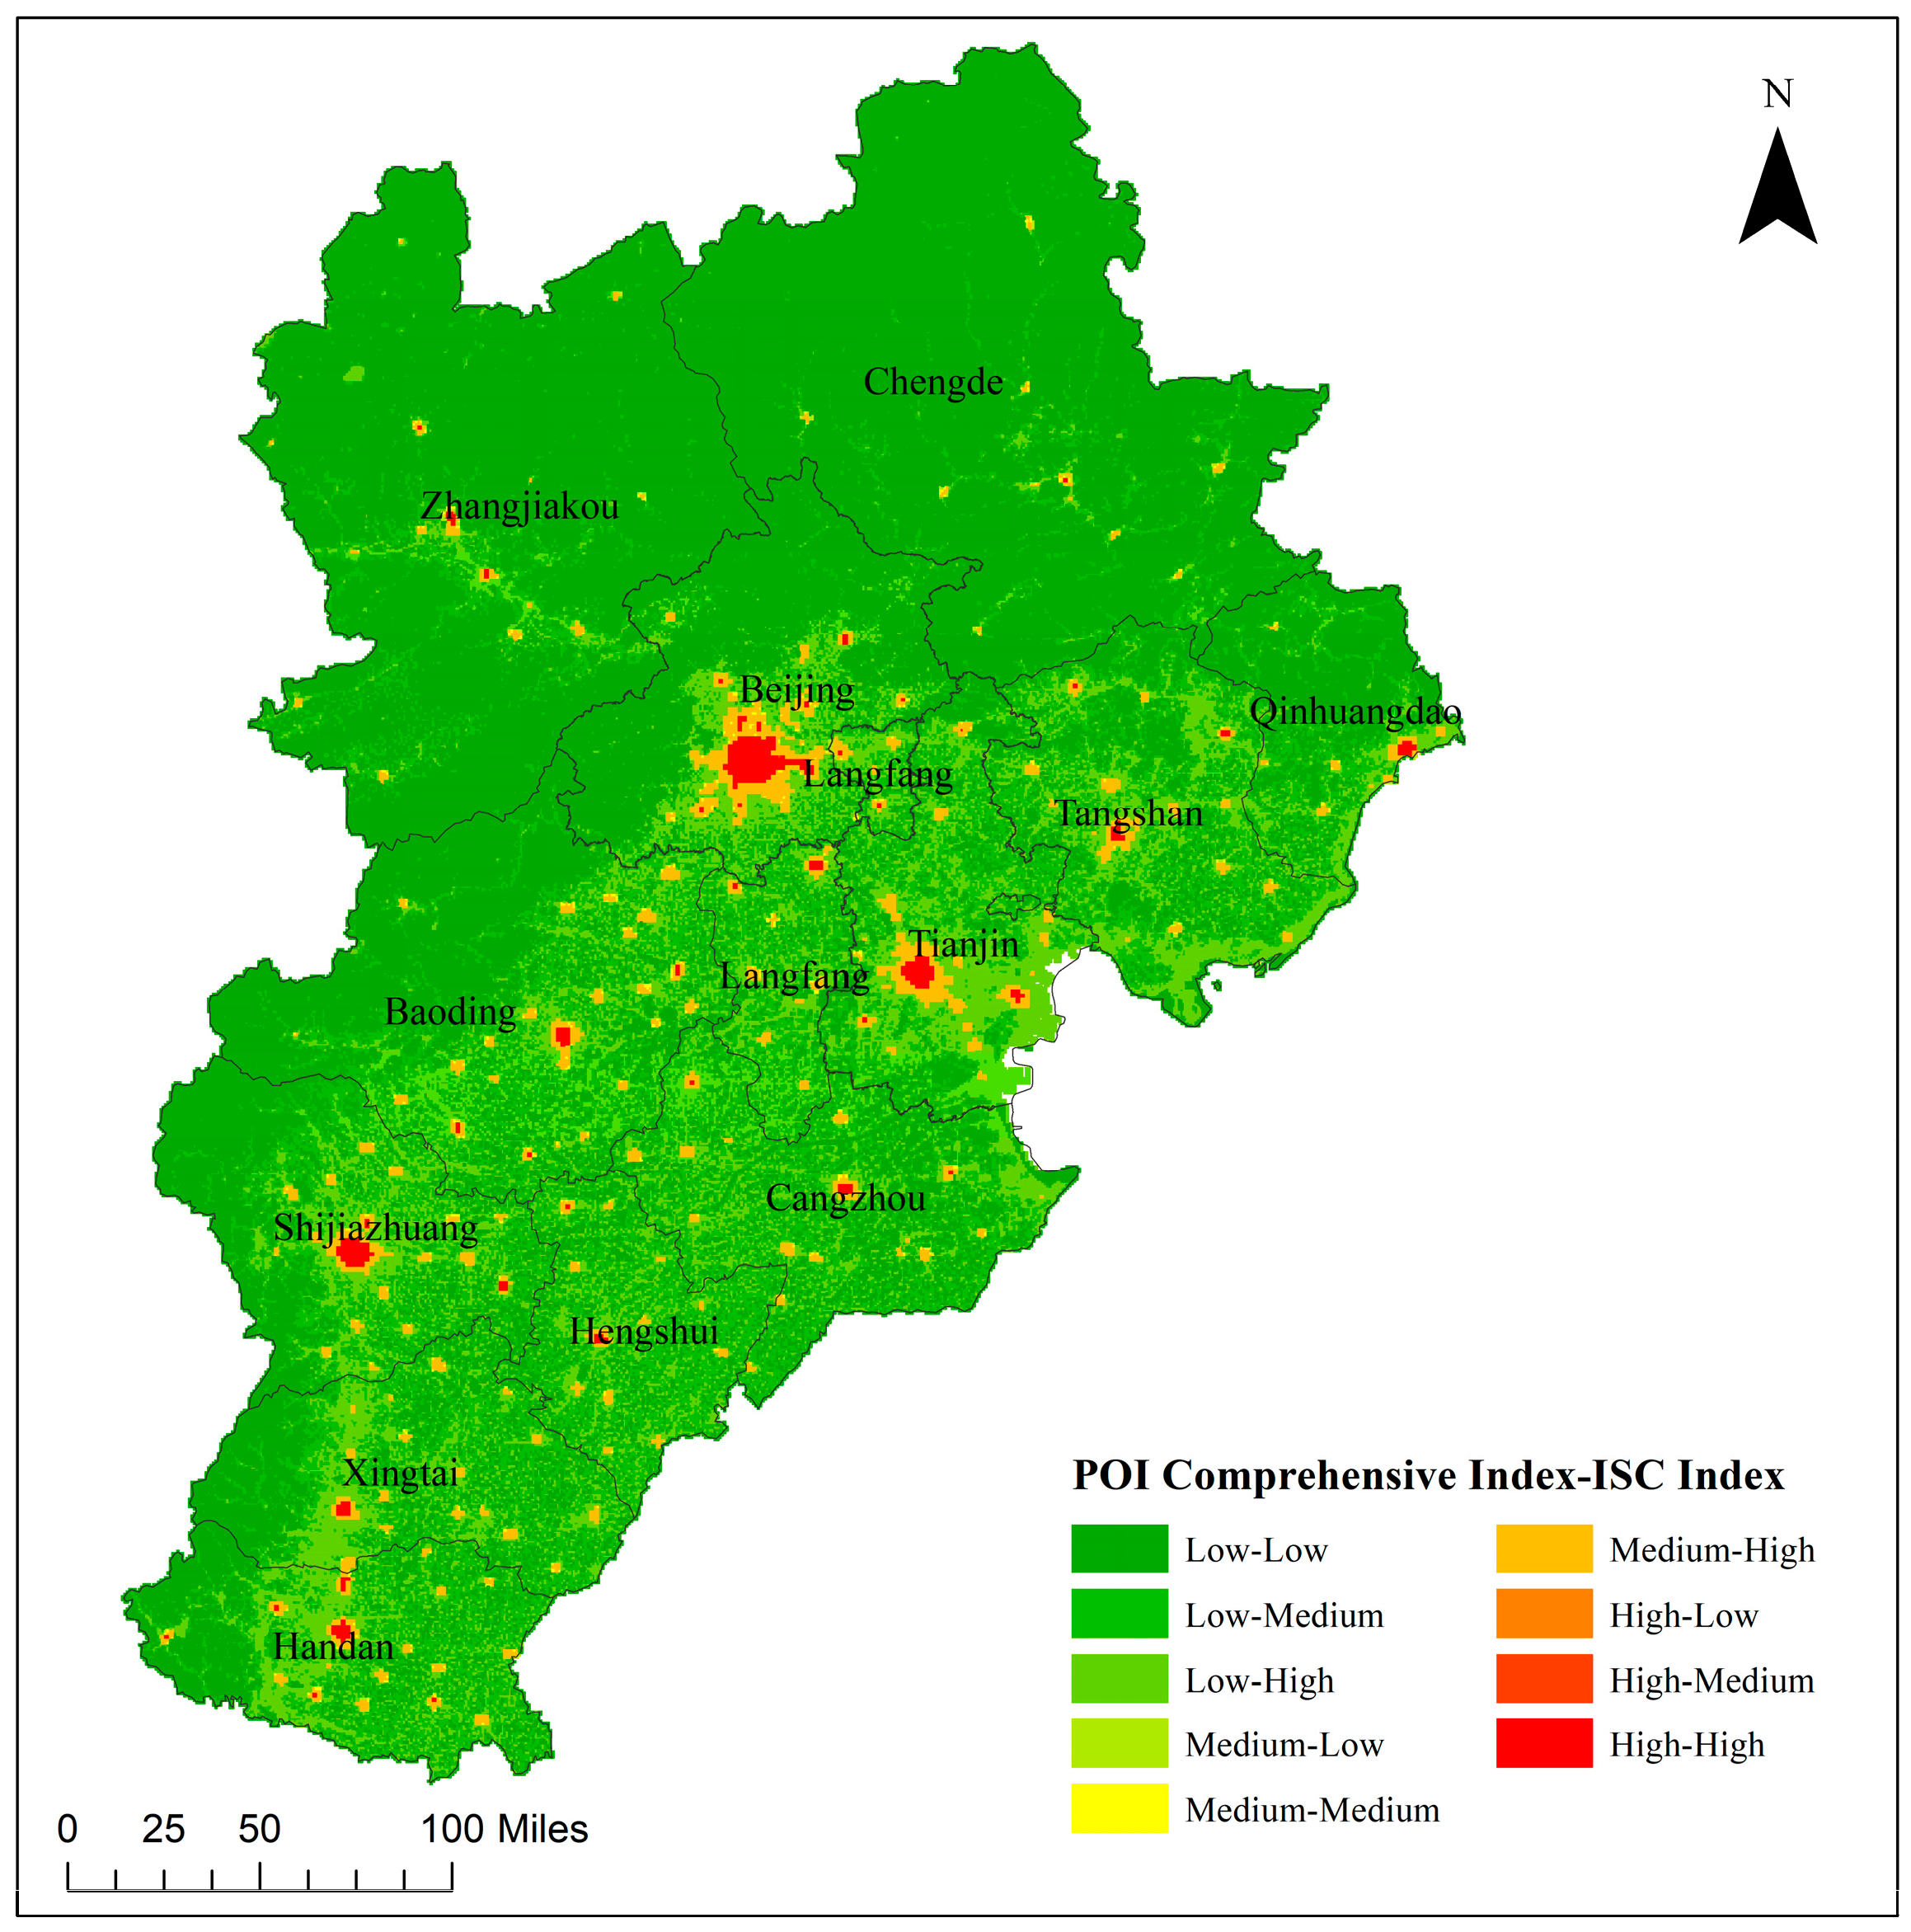
2.2.3. Two-Factor Combination Mapping
- Data Normalization Process
- Principle of Two-Factor Combination Mapping
3. Spatial Coupling Analysis Results
3.1. Spatial Coupling Analysis Results
3.2. Analysis of Typical Urban Coupling Relationships
3.2.1. Analysis of Spatial Structures in Cities with Similar Coupling
3.2.2. Analysis of Spatial Structures in Cities with Different Coupling
- 1.
- Areas where the POI comprehensive index was lower than the impervious surface coverage
- 2.
- Areas where the POI comprehensive index was higher than the impervious surface coverage
4. Conclusions
- (1)
- The relationship between the comprehensive POI index and impervious surface coverage was consistent and aligned well, as demonstrated by the use of information entropy and entropy weight methods. Across the Beijing–Tianjin–Hebei urban agglomeration, the overall spatial distribution patterns of both datasets remained consistent, with regions demonstrating identical spatial coupling relationships accounting for 69.19% of the total area. Specifically, in Beijing, these regions represented 73.39% of the total area, while in Tianjin and Shijiazhuang, they represented 64.37% and 63.78%, respectively. This effectively delineated the spatial morphology of urban cores and surrounding towns in each city, thereby confirming the utility of the comprehensive POI index in analyzing urban spatial structures.
- (2)
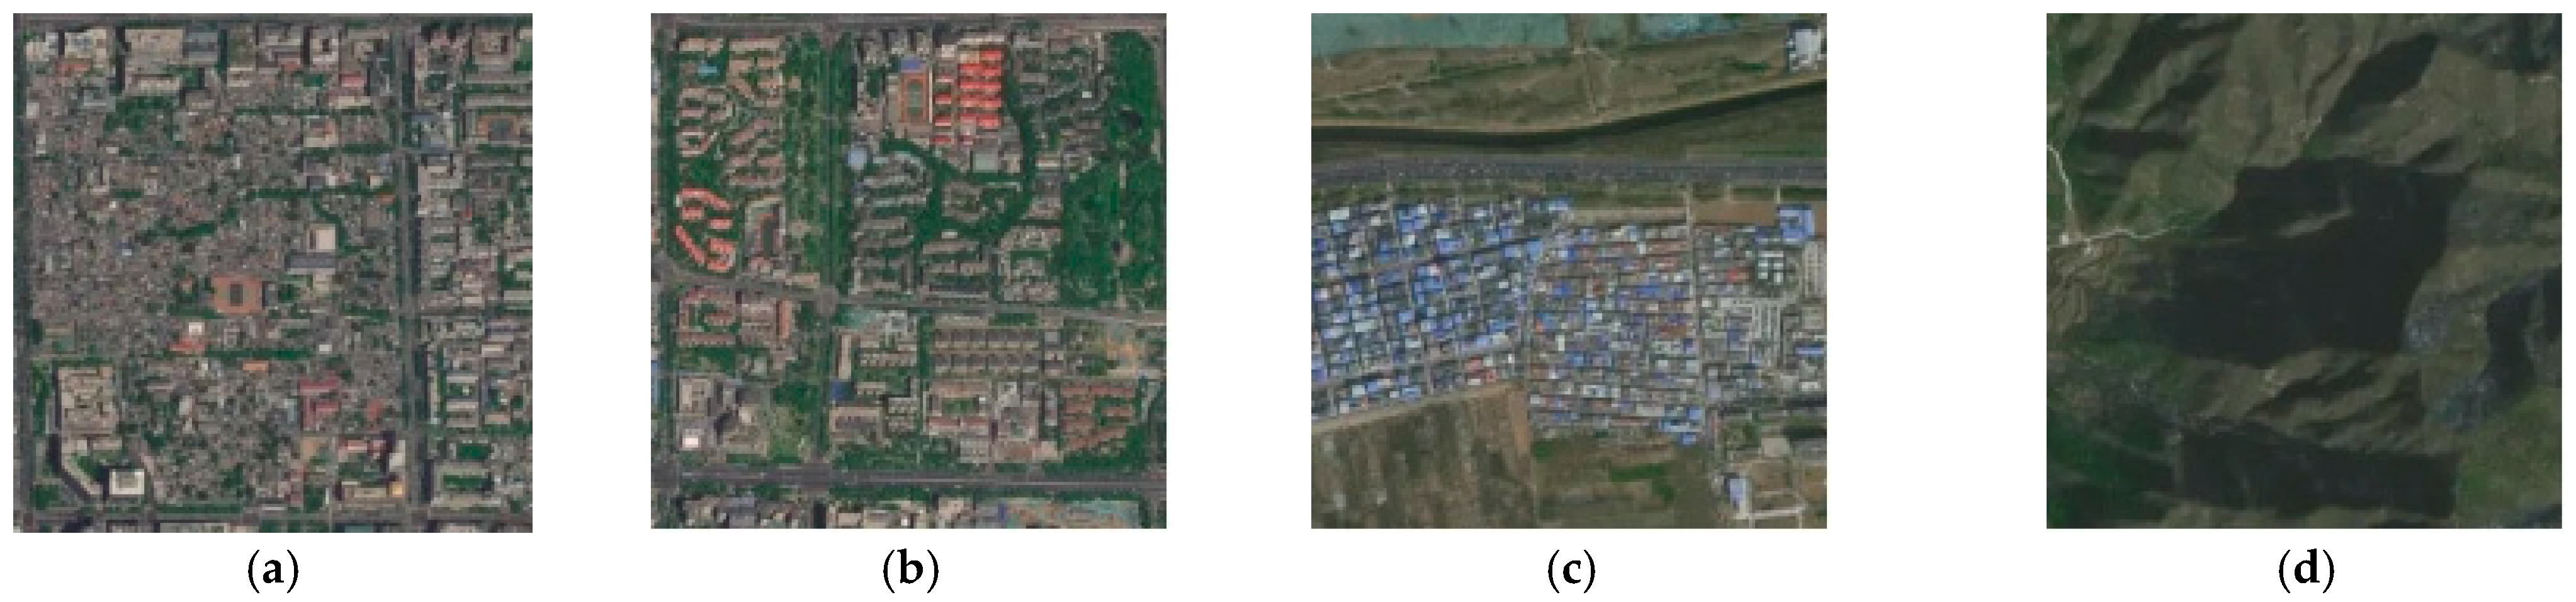
- The regions where the comprehensive POI index was lower than impervious surface coverage, displaying spatial disparities, could effectively delineate the spatial characteristics of specific urban structures, such as expansive homogeneous zones, urban peripheries, suburban areas, and town centers and their respective levels of urbanization. There were discernible disparities in the spatial attributes of the two datasets: POI data exhibited a relatively sparse distribution in economic development zones, emerging urban areas, airports, ports, etc., but demonstrated a certain degree of presence in suburban areas and town centers. Conversely, impervious surface coverage demonstrated heightened intensity in urban core areas, economic development zones, airports, ports, and other regions boasting well-established infrastructure.
- (3)
- The spatially distinct areas where the comprehensive POI index surpassed impervious surface coverage were less common within urban structures, consistent with the pattern where infrastructure development precedes economic progress in urban areas. These zones were typically found in areas characterized by larger expanses of green space, farmland, bodies of water, parks, mountains, and scenic areas.
Author Contributions
Funding
Data Availability Statement
Conflicts of Interest
References
- Elmqvist, T.; Andersson, E.; McPhearson, T.; Bai, X.; Bettencourt, L.; Brondizio, E.; Colding, J.; Daily, G.; Folke, C.; Grimm, N.; et al. Urbanization in and for the Anthropocene. NPJ Urban Sustain. 2021, 1, 6. [Google Scholar] [CrossRef]
- Qu, Y.; Zhan, L.; Jiang, G.; Ma, W.; Dong, X. How to Address “Population Decline and Land Expansion (PDLE)” of rural residential areas in the process of Urbanization:A comparative regional analysis of human-land interaction in Shandong Province. Habitat Int. 2021, 117, 102441. [Google Scholar] [CrossRef]
- Liu, X.; Li, X.; Yang, J.; Fan, H.; Zhang, J.; Zhang, Y. How to resolve the conflicts of urban functional space in planning: A perspective of urban moderate boundary. Ecol. Indic. 2022, 144, 109495. [Google Scholar] [CrossRef]
- Hu, Q.; Shen, W.; Zhang, Z. How does urbanisation affect the evolution of territorial space composite function? Appl. Geogr. 2023, 155, 102976. [Google Scholar] [CrossRef]
- Yanbo, Q.; Shilei, W.; Yaya, T.; Guanghui, J.; Tao, Z.; Liang, M. Territorial spatial planning for regional high-quality development–An analytical framework for the identification, mediation and transmission of potential land utilization conflicts in the Yellow River Delta. Land Use Policy 2023, 125, 106462. [Google Scholar] [CrossRef]
- Zhou, L.; Wei, L.; López-Carr, D.; Dang, X.; Yuan, B.; Yuan, Z. Identification of irregular extension features and fragmented spatial governance within urban fringe areas. Appl. Geogr. 2024, 162, 103172. [Google Scholar] [CrossRef]
- Liu, X.; Li, X.; Zhang, Y.; Wang, Y.; Chen, J.; Geng, Y. Spatiotemporal evolution and relationship between construction land expansion and territorial space conflicts at the county level in Jiangsu Province. Ecol. Indic. 2023, 154, 110662. [Google Scholar] [CrossRef]
- Xiao, R.; Yu, X.; Xiang, T.; Zhang, Z.; Wang, X.; Wu, J. Exploring the coordination between physical space expansion and social space growth of China’s urban agglomerations based on hierarchical analysis. Land Use Policy 2021, 109, 105700. [Google Scholar] [CrossRef]
- Lu, B. Urbanization, Spatial Planning and Reproduction of Urban-Rural Relationship: A Case Study of a Suburban Village in China. Chin. J. Sociol. 2024, 44, 98–124. [Google Scholar] [CrossRef]
- Zheng, J.F.; Chen, Q.H. Monocentricity or Polycentricity: On Urban Internal Spatial Structure of Chinese Cities. China Econ. Stud. 2019, 2, 93–105. [Google Scholar] [CrossRef]
- Liu, X.; Li, Y.; Zhang, S.; Niu, Q. Spatiotemporal patterns, driving mechanism, and multi-scenario simulation of urban expansion in Min Delta Region, China. Ecol. Indic. 2024, 158, 111312. [Google Scholar] [CrossRef]
- Wang, H.; Gong, X.; Wang, B.; Deng, C.; Cao, Q. Urban development analysis using built-up area maps based on multiple high-resolution satellite data. Int. J. Appl. Earth Obs. Geoinf. 2021, 103, 102500. [Google Scholar] [CrossRef]
- Peng, J.; Zhao, S.; Liu, Y.; Tian, L. Identifying the urban-rural fringe using wavelet transform and kernel density estimation: A case study in Beijing City, China. Environ. Model. Softw. 2016, 83, 286–302. [Google Scholar] [CrossRef]
- Liang, J.Z.; Xu, Z. Spatial Division in Yangtze River Delta Urban Agglomerations and Expansion Feature Analysis of Rural-Urban Fringe Area. J. Huaqiao Univ. (Nat. Sci.) 2022, 4301, 102–110. [Google Scholar] [CrossRef]
- Ding, X.; Shao, X.; Deng, R.; Peng, S.; Wang, J. Spatiotemporal Dynamics and Driving Forces of Impervious Surfaces in the Central Yunnan Urban Agglomeration from 2000 to 2020. Res. Soil Water Conserv. 2024, 31, 364–373. [Google Scholar] [CrossRef]
- Zhou, X.C.; Liu, Y.M.; Yang, H.J. Spatial recognition and boundary region division of urban fringe area in Xi’an City. J. Geo-Inf. Sci. 2017, 19, 1327–1335. [Google Scholar] [CrossRef]
- Huang, L.; Gu, D.; Liu, Y. Spatiotemporal Evolution of Impervious Surface and the Driving Factors in the Central Urban Area of Chongqing. J. Southwest Univ. 2023, 45, 155–165. [Google Scholar] [CrossRef]
- Yin, Z.; Zhou, T.; Li, H.; Xie, S.; Ren, Y. Study on Impervious Surface Change and Urban Expansion of the Guangdong-Hong Kong-Macao Greater Bay Area. Geogr. Geo-Inf. Sci. 2021, 37, 106–113. [Google Scholar]
- Zhao, H.B.; Yu, D.F.; Miao, C.H.; Li, G.; Feng, Y.; Bie, Q. The Location Distribution Characteristics and Influencing Factors of Cultural Facilities in Zhengzhou Based on POI Data. Sci. Geogr. Sin. 2018, 38, 1525–1534. [Google Scholar]
- Xu, Z.; Gao, X. A novel method for identifying the boundary of urban built-up. Acta Ecol. Sin. 2016, 71, 928–939. [Google Scholar] [CrossRef]
- Tang, C.; Chen, J.; Xie, Y.; Tang, J.; Zhou, C. Integrated Identification and Spatial Differentiation Mechanism of Urban Built-up Area in Changsha-Zhuzhou-Xiangtan Urban Agglomeration Based on the Multi-source Big Data. Econ. Geogr. 2024, 44, 66–76. [Google Scholar] [CrossRef]
- Long, Y.; Luo, S.; Liu, X.; Luo, T.; Liu, X. Research on the Dynamic Evolution of the Landscape Pattern in the Urban Fringe Area of Wuhan from 2000 to 2020. ISPRS Int. J. Geo-Inf. 2022, 11, 483. [Google Scholar] [CrossRef]
- Wang, W.; Gu, Y.; Zhang, C.; Kang, Q.; Yin, W.; Xin, J.; Liao, X. Study on the distribution of urban-rural ecotone in Xianfeng County based on POI and kernel density analysis. Resour. Environ. Eng. 2022, 36, 117–123. [Google Scholar] [CrossRef]
- Sun, X.; Liu, X.; Zhou, Y. Delineating Peri-Urban Areas Using Multi-Source Geo-Data: A Neural Network Approach and SHAP Explanation. Remote Sens. 2023, 15, 4106. [Google Scholar] [CrossRef]
- Zhan, W.; Ban, P.; Yuan, Q. Guangzhou-Foshan Cross-boundary City Zoning Based on Multi-source Data. South Archit. 2022, 10–17. [Google Scholar] [CrossRef]
- Duan, Y.M.; Liu, Y.; Liu, X.H.; Wang, H.L. Identification of Polycentric Urban Structure of Central Chongqing Using Points of Interest Big Data. J. Nat. Resour. 2018, 33, 788–800. [Google Scholar] [CrossRef]
- Jiang, Y.Q.; Zhao, X.Z.; Li, P.Q.; Xiang, L.; Zhang, D.K. Quantitative identification method of urban multi-center based on multi-source open data. J. Geo-Inf. Sci. 2024, 26, 1212–1228. [Google Scholar] [CrossRef]
- Dong, R.C.; Jiang, T.Q.; Li, H.H.; Li, S.Y.; Zhang, Y.L.; Fu, X. Service radii analysis of green space based on electronic navigation map POI in Beijing urban area. Acta Ecol. Sin. 2018, 38, 8536–8543. [Google Scholar] [CrossRef]
- Zhang, X.; Sun, Y.; Zheng, A.; Wang, Y. A New Approach to Refining Land Use Types: Predicting Point-of-Interest Categories Using Weibo Check-in Data. ISPRS Int. J. Geo-Inf. 2020, 9, 124. [Google Scholar] [CrossRef]
- Wu, Z.; Wei, X.; He, X.; Gao, W. Identifying Urban Built-Up Areas Based on Spatial Coupling between Nighttime Light Data and POI: A Case Study of Changchun. Buildings 2023, 14, 19. [Google Scholar] [CrossRef]
- Zhang, J.; Yuan, X.-D.; Lin, H. The Extraction of Urban Built-up Areas by Integrating Night-time Light and POI Data—A Case Study of Kunming, China. IEEE Access 2021, 9, 22417–22429. [Google Scholar]
- Gao, Y.; Xing, H.; Zhang, H. Urban spatial structure based on spatial coupling between nighttime light data and POI: A case study of Shenzhen. J. Guilin Univ. Technol. 2022, 42, 122–130. [Google Scholar] [CrossRef]
- Chen, B.; Xu, S.Z.; Zhang, Y.Y.; Xu, F.L.; Wang, H.Z. Analysis of urban spatial structure based on spatial coupling between POI and nighttime data: A case study of main urban region in Wuhan. Bull. Surv. Mapp. 2020, 7, 70–75. [Google Scholar]
- Cheng, S.; Yang, L.; Sun, A. Analysis of urban spatial structure under coupling relationship between night-light data and POI. Mod. Bus. Trade Ind. 2022, 43, 235–237. [Google Scholar] [CrossRef]
- Wang, Y.; Wang, Z.; Deng, Z.; Cheng, P.; Li, Y. Spatial Coupling Analysis Between POI, Luminous Remote Sensing and Weibo Sign-in Data: A Case Study of Beijing. Remote Sens. Inf. 2019, 34, 18–26. [Google Scholar] [CrossRef]
- Yu, B.C.; Liu, Y.X.; Chen, G. Urban spatial structure of port city in South China Sea based on spatial coupling between nighttime light data and POI. J. Geo-Inf. Sci. 2018, 20, 854–861. [Google Scholar] [CrossRef]
- Yuan, X.; Chen, B.; He, X.; Zhang, G.; Zhou, C. Spatial Differentiation and Influencing Factors of Tertiary Industry in the Pearl River Delta Urban Agglomeration. Land 2024, 13, 172. [Google Scholar] [CrossRef]


| Feature | Data | Data Type | Data Source |
|---|---|---|---|
| Basic Geographic Data | MAP | Polygon Vector Data | National Geomatics Center of China (http://www.ngcc.cn/ngcc/, accessed on 5 December 2023) |
| Social–Economic Data | POI | Point Vector Data | Gaode Map (https://lbs.amap.com/, accessed on 5 February 2024) |
| Land Use Data | CLCD | Raster Data | The 30 m Annual Land Cover Datasets and their Dynamics in China from 1985 to 2022 [Dataset] (https://doi.org/10.5281/zenodo.8176941, accessed on 5 July 2023) |
| ID | Major Categories | Subcategories | Quantity | Proportion |
|---|---|---|---|---|
| 01 | Transport Facilities | Parking Lots, Bus Stops, etc. | 174,859 | 5.91% |
| 02 | Leisure and Sports | KTV, Theaters, etc. | 38,051 | 1.29% |
| 03 | Companies and Enterprises | Companies, Factories, etc. | 283,411 | 9.58% |
| 04 | Healthcare | Specialized Hospitals, etc. | 145,849 | 4.93% |
| 05 | Business Residences | Industrial Parks, etc. | 81,551 | 2.76% |
| 06 | Tourist Attractions | Scenic Spots, Parks, etc. | 25,235 | 0.85% |
| 07 | Automotive-Related | Charging Stations, etc. | 147,017 | 4.97% |
| 08 | Daily Services | Agencies, etc. | 368,178 | 12.45% |
| 09 | Education and Culture | Universities, etc. | 151,576 | 5.13% |
| 10 | Consumption | Convenience Stores, etc. | 909,631 | 30.76% |
| 11 | Sports and Fitness | Gyms, Sports Centers, etc. | 38,366 | 1.30% |
| 12 | Hotel Accommodation | Hotels, Motels, etc. | 62,020 | 2.10% |
| 13 | Financial Institutions | Insurance, Banks, etc. | 51,582 | 1.74% |
| 14 | Catering Industry | Restaurants, Cafes, etc. | 480,251 | 16.24% |
Disclaimer/Publisher’s Note: The statements, opinions and data contained in all publications are solely those of the individual author(s) and contributor(s) and not of MDPI and/or the editor(s). MDPI and/or the editor(s) disclaim responsibility for any injury to people or property resulting from any ideas, methods, instructions or products referred to in the content. |
© 2024 by the authors. Licensee MDPI, Basel, Switzerland. This article is an open access article distributed under the terms and conditions of the Creative Commons Attribution (CC BY) license (https://creativecommons.org/licenses/by/4.0/).
Share and Cite
Zhang, T.; Zhu, X.; Liu, Y.; Jia, C.; Bai, H. Research on the Spatial Structure of the Beijing–Tianjin–Hebei Urban Agglomeration Based on POI and Impervious Surface Coverage. Buildings 2024, 14, 1793. https://doi.org/10.3390/buildings14061793
Zhang T, Zhu X, Liu Y, Jia C, Bai H. Research on the Spatial Structure of the Beijing–Tianjin–Hebei Urban Agglomeration Based on POI and Impervious Surface Coverage. Buildings. 2024; 14(6):1793. https://doi.org/10.3390/buildings14061793
Chicago/Turabian StyleZhang, Tiange, Xia Zhu, Yuanping Liu, Cui Jia, and Huimin Bai. 2024. "Research on the Spatial Structure of the Beijing–Tianjin–Hebei Urban Agglomeration Based on POI and Impervious Surface Coverage" Buildings 14, no. 6: 1793. https://doi.org/10.3390/buildings14061793
APA StyleZhang, T., Zhu, X., Liu, Y., Jia, C., & Bai, H. (2024). Research on the Spatial Structure of the Beijing–Tianjin–Hebei Urban Agglomeration Based on POI and Impervious Surface Coverage. Buildings, 14(6), 1793. https://doi.org/10.3390/buildings14061793