Article

The Axial Compressive Properties of Long Columns of In-Service Brick Masonry Reinforced by Channel Steel

School of Civil Engineering, Changsha University of Science and Technology, Changsha 410114, China
*
Author to whom correspondence should be addressed.
Buildings 2024, 14(6), 1794; https://doi.org/10.3390/buildings14061794
Submission received: 9 May 2024 / Revised: 3 June 2024 / Accepted: 4 June 2024 / Published: 13 June 2024

Abstract

:
Channel steel-reinforced brick column technology has gained significant popularity in rural China due to its convenience and cost effectiveness. However, current research on channel steel reinforcement is sparse, and engineering applications often rely solely on construction experience. This reliance leads to significant construction errors, inconsistent reinforcement effects, and, in some cases, tragedies such as the collapse of Changsha’s “4.29” self-built houses. Therefore, in this paper, experimental and simulation studies on brick columns reinforced with external channel steel were conducted, and the results show that channel steel reinforcement can significantly enhance the axial load capacity of brick columns. However, increased initial stress levels and height-to-thickness ratios substantially reduce the reinforcement effect. Under axial pressure, the outer channel steel fails mainly through bending and buckling instability. Still, due to its good ductility, its failure occurs later than the brick column after being restrained by sufficient wall screws. Based on the experimental and simulation results, a method for calculating the axial compressive bearing capacity of the reinforced column is proposed, providing theoretical support and engineering guidance for applying this reinforcement method.

1. Introduction

Many old buildings constructed in the last century may have used low-quality raw materials and have been subjected to chemical corrosion [1]. They have also experienced natural disasters such as earthquakes and other historical and current factors [2], severely compromising their structural health. Due to the inherent material characteristics of masonry structures, they are frequently seriously damaged, necessitating urgent strengthening to improve their bearing capacity [3]. Currently, the primary methods for reinforcing masonry structures include UHPC and UHDC reinforcement, encapsulated fiber-reinforced polymer (FRP) reinforcement, reinforcing mesh cement mortar reinforcement, encapsulated steel section reinforcement, and so on.
Countries have made significant advancements in the study of various reinforcement methods. Niasar et al. [4] conducted low-cycle repeated tests on undamaged and damaged brick walls reinforced with a UHPC surface layer. The results indicated that the UHPC surface layer had strong adhesion to the brick wall, effectively constrained both undamaged and damaged brick walls, limited wall cracking and damage, and improved shear strength, ductility, and energy dissipation capacity as well as altered the failure mode from shear failure to bending failure. Park [5] investigated the seismic performance of UHPC surface-reinforced masonry walls. The test results revealed substantial improvements in bearing and deformation capacity, stiffness degradation, and energy dissipation capacity. A strength model was proposed to estimate the lateral strength of masonry walls reconstructed from prefabricated panels. Dong et al. [6] experimentally examined the shear resistance, hysteresis behavior, stiffness, and ductility of UHDC surface-reinforced masonry structures. The findings showed that UHDC surface layer reinforcement significantly enhances the masonry slab’s ductility, stiffness, and energy dissipation, transforming its brittle failure mode into a more ductile mode. Deng [7] and Zhang [8] conducted experimental studies on masonry structures’ bearing capacity and seismic performance reinforced with a UHDC surface layer. The results demonstrated significant improvements in the bearing capacity and deformation capacity of the reinforced specimens, and a calculation method for the axial compressive bearing capacity of UHDC surface-reinforced brick columns was provided. Based on the experiment, Zhang [9] used Automated neural network search (ANS) to establish a model illustrating the relationship between fiber properties of FRC, such as aspect ratio (length/diameter), fiber content, compressive strength, flexural strength, and splitting strength.
Nezhad et al. [10] utilized a shaking table to simulate real earthquakes to study the mechanical performance of GFRP-reinforced walls. The tests showed enhanced shear strength and hysteresis dissipation energy and significantly improved out-of-plane performance, effectively boosting seismic performance. Gilstrap et al. [11] showed that FRP reinforcement improves the bearing capacity of masonry and enhances the structure’s deformation capacity. Carloni et al. [12] conducted an experimental study on the bonding properties at the FRP–masonry interface, revealing that the fracture process depends on the constituent materials’ characteristics and the masonry’s geometry. They employed the energy balance method to establish the relationship between the bonding properties and the characteristics at the FRP–masonry interface.
Sneed et al. [13] investigated the mechanical performance of masonry columns after SRG reinforcement, finding that SRG reinforcement could improve compressive strength, ultimate strain, and energy absorption rate. Some FRP-constrained masonry models [14,15,16] demonstrated good applicability in predicting the increase in SRG sheath strength. Estevan et al. [17] conducted an experimental study on the effectiveness of reinforced mesh textile reinforced mortar (TRM) under high-temperature fire conditions. The results showed that TRM provides effective protection against masonry cracking due to fire, and even for damaged walls, TRM surface reinforcement can double the shear strength and improve ductility and energy dissipation capacity.
Murtyl et al. [18] conducted an experimental study on the seismic performance of masonry houses reinforced with outer steel, finding that despite repeated earthquake damage, the seismic performance improved compared to the original house after reinforcement with outer angle steel. Azandariani et al. [19] conducted a numerical study on the seismic performance of outer steel-reinforced masonry walls with openings. Their study indicated that the opening size significantly affects the reinforcement effect of the outer steel. Based on the simulation results, they proposed a formula for calculating the shear bearing capacity and lateral stiffness of outer steel-reinforced masonry walls with openings, considering the interaction between the outer steel and the masonry wall.
The results indicate that various reinforcement methods can achieve significant reinforcement effects. However, the construction period is often extended, resulting in a prolonged interval between identifying the need for reinforcement and completing the process, during which the structure may incur further damage. The advantage of using external channel steel to reinforce brick columns, which is widely adopted in rural areas of China, lies in its simplicity. This method involves using wall screws to secure the channel steel to the column, ensuring that the upper and lower parts are strengthened after being tightened and stressed. Consequently, the construction period is extremely short, preventing further structural damage. Figure 1 illustrates an actual project. Currently, studies on external channel steel are limited, and practical engineering applications often rely solely on construction experience. This reliance can lead to significant construction errors, uneven reinforcement effects, and catastrophic failures, such as the collapse of self-built houses in Changsha on April 29.
Therefore, the reinforcement effect of external channel steel on brick columns should be explored to prevent tragedies resulting from improper reinforcement. This paper considers the influence of the initial stress level of the column and the height-to-thickness ratio on the column’s bearing capacity in actual projects [20]. The study tests the axial compressive performance of twelve brick columns and uses finite-element analysis software for numerical simulation of brick columns reinforced with channel steel. The research examines the failure process and characteristics of these reinforced brick columns. It proposes a method for calculating their axial compressive bearing capacity, considering the initial stress level. This provides theoretical support and engineering guidance for applying channel steel-reinforced brick columns.

2. Axial Compression Test

2.1. Specimen Design

A total of 12 brick columns were designed for this test: four with a height of 1080 mm (Z1–Z4), four with a height of 1440 mm (Z5–Z8), and four with a height of 1800 mm (Z9–Z12). Each column was constructed using 220 mm × 100 mm × 60 mm sintered ordinary brick masonry to improve the height-to-thickness ratio. The cross-sectional size of each column was 220 mm × 220 mm. In addition, it is considered that in the axial test of masonry columns, the initial defects will impact the scattering of experimental values [21]. In specimen fabrication, the quality of masonry materials and masonry operations is strictly controlled to reduce the influence of defects on the scattering of experimental values.
The size and reinforcement details of the specimens are shown in Figure 2. Specimens Z1, Z5, and Z9 were used as comparison specimens. The test protocol involved applying reinforcement after the preload reached a specific stress state to study the influence of initial stress levels and the height-to-thickness ratio on the reinforcement effect. Details of the 12 specimen numbers and test protocols are provided in Table 1.

2.2. Mechanical Properties of Materials

2.2.1. Masonry Materials

This study used sintered ordinary bricks with a strength grade of M20. Ten bricks were selected for individual compressive testing according to the “Test Method for Wall Bricks” (GB/T2542-2012) [22]. These bricks’ average ultimate compressive strength was recorded as 21.27 MPa, with a coefficient of variation of 0.12.
The test mortar, with a design strength grade of M5, was manually mixed on site using M32.5 ordinary Portland cement, medium coarse sand, and water. The brick column was constructed in two stages, with six 70.7 mm × 70.7 mm × 70.7 mm mortar cube test blocks reserved for each stage. Following a standard curing period of 28 days, as specified by the “Standard for Basic Performance Test Methods for Building Mortar” (JGJ/T 70-2009) [23], the average ultimate compressive strength of the mortar was found to be 5.32 MPa, with a coefficient of variation of 0.09.

2.2.2. Steel

The test was reinforced with # 5 national standard channel steel marked Q235B. Portions of the channel steel web and flange were selected to make standard specimens. These standard tensile specimens were tested according to the tensile test of tensile test metal materials. Part 1: Test method at room temperature (GB/T 228.1-2021) [24]. The measured yield strength was 277.2 MPa, and the ultimate tensile strength was 327.6 MPa. The average yield strength of the 4.8-grade M6 wall screws used in the fixed channel steel is 408.3 MPa, and the average tensile strength is 473.2 MPa. The elastic modulus of the steel is 202 GPa, and the yield strain is 2.04 × 10³.

2.3. Axial Compressive Loading and Test Content

The test was conducted using a 5000 kN microcomputer-controlled electro-hydraulic servo long column pressure testing machine. Displacement control loading was employed at a loading speed of 0.5 mm/min. The loading specimen is shown in Figure 3. Dial gauges were positioned at both ends of the steel backing plate atop each specimen to measure vertical displacement. Load–displacement curves were generated for each specimen. Additionally, strain gauges were affixed to the midpoint of the channel steel and the wall screw to measure its strain. In addition, at the 1/2 height points of specimens measuring 1440 mm and 1800 mm in height, three vibrating wire strain gauges were affixed along the east, south, and north directions of the column. Three dial gauges were installed to measure the vertical strain and lateral displacement of the brick column. The XDIC two-dimensional full-field strain measurement system was utilized to monitor deformation during testing on the west side of the brick column.

3. Analysis of the Axial Compression Test Results
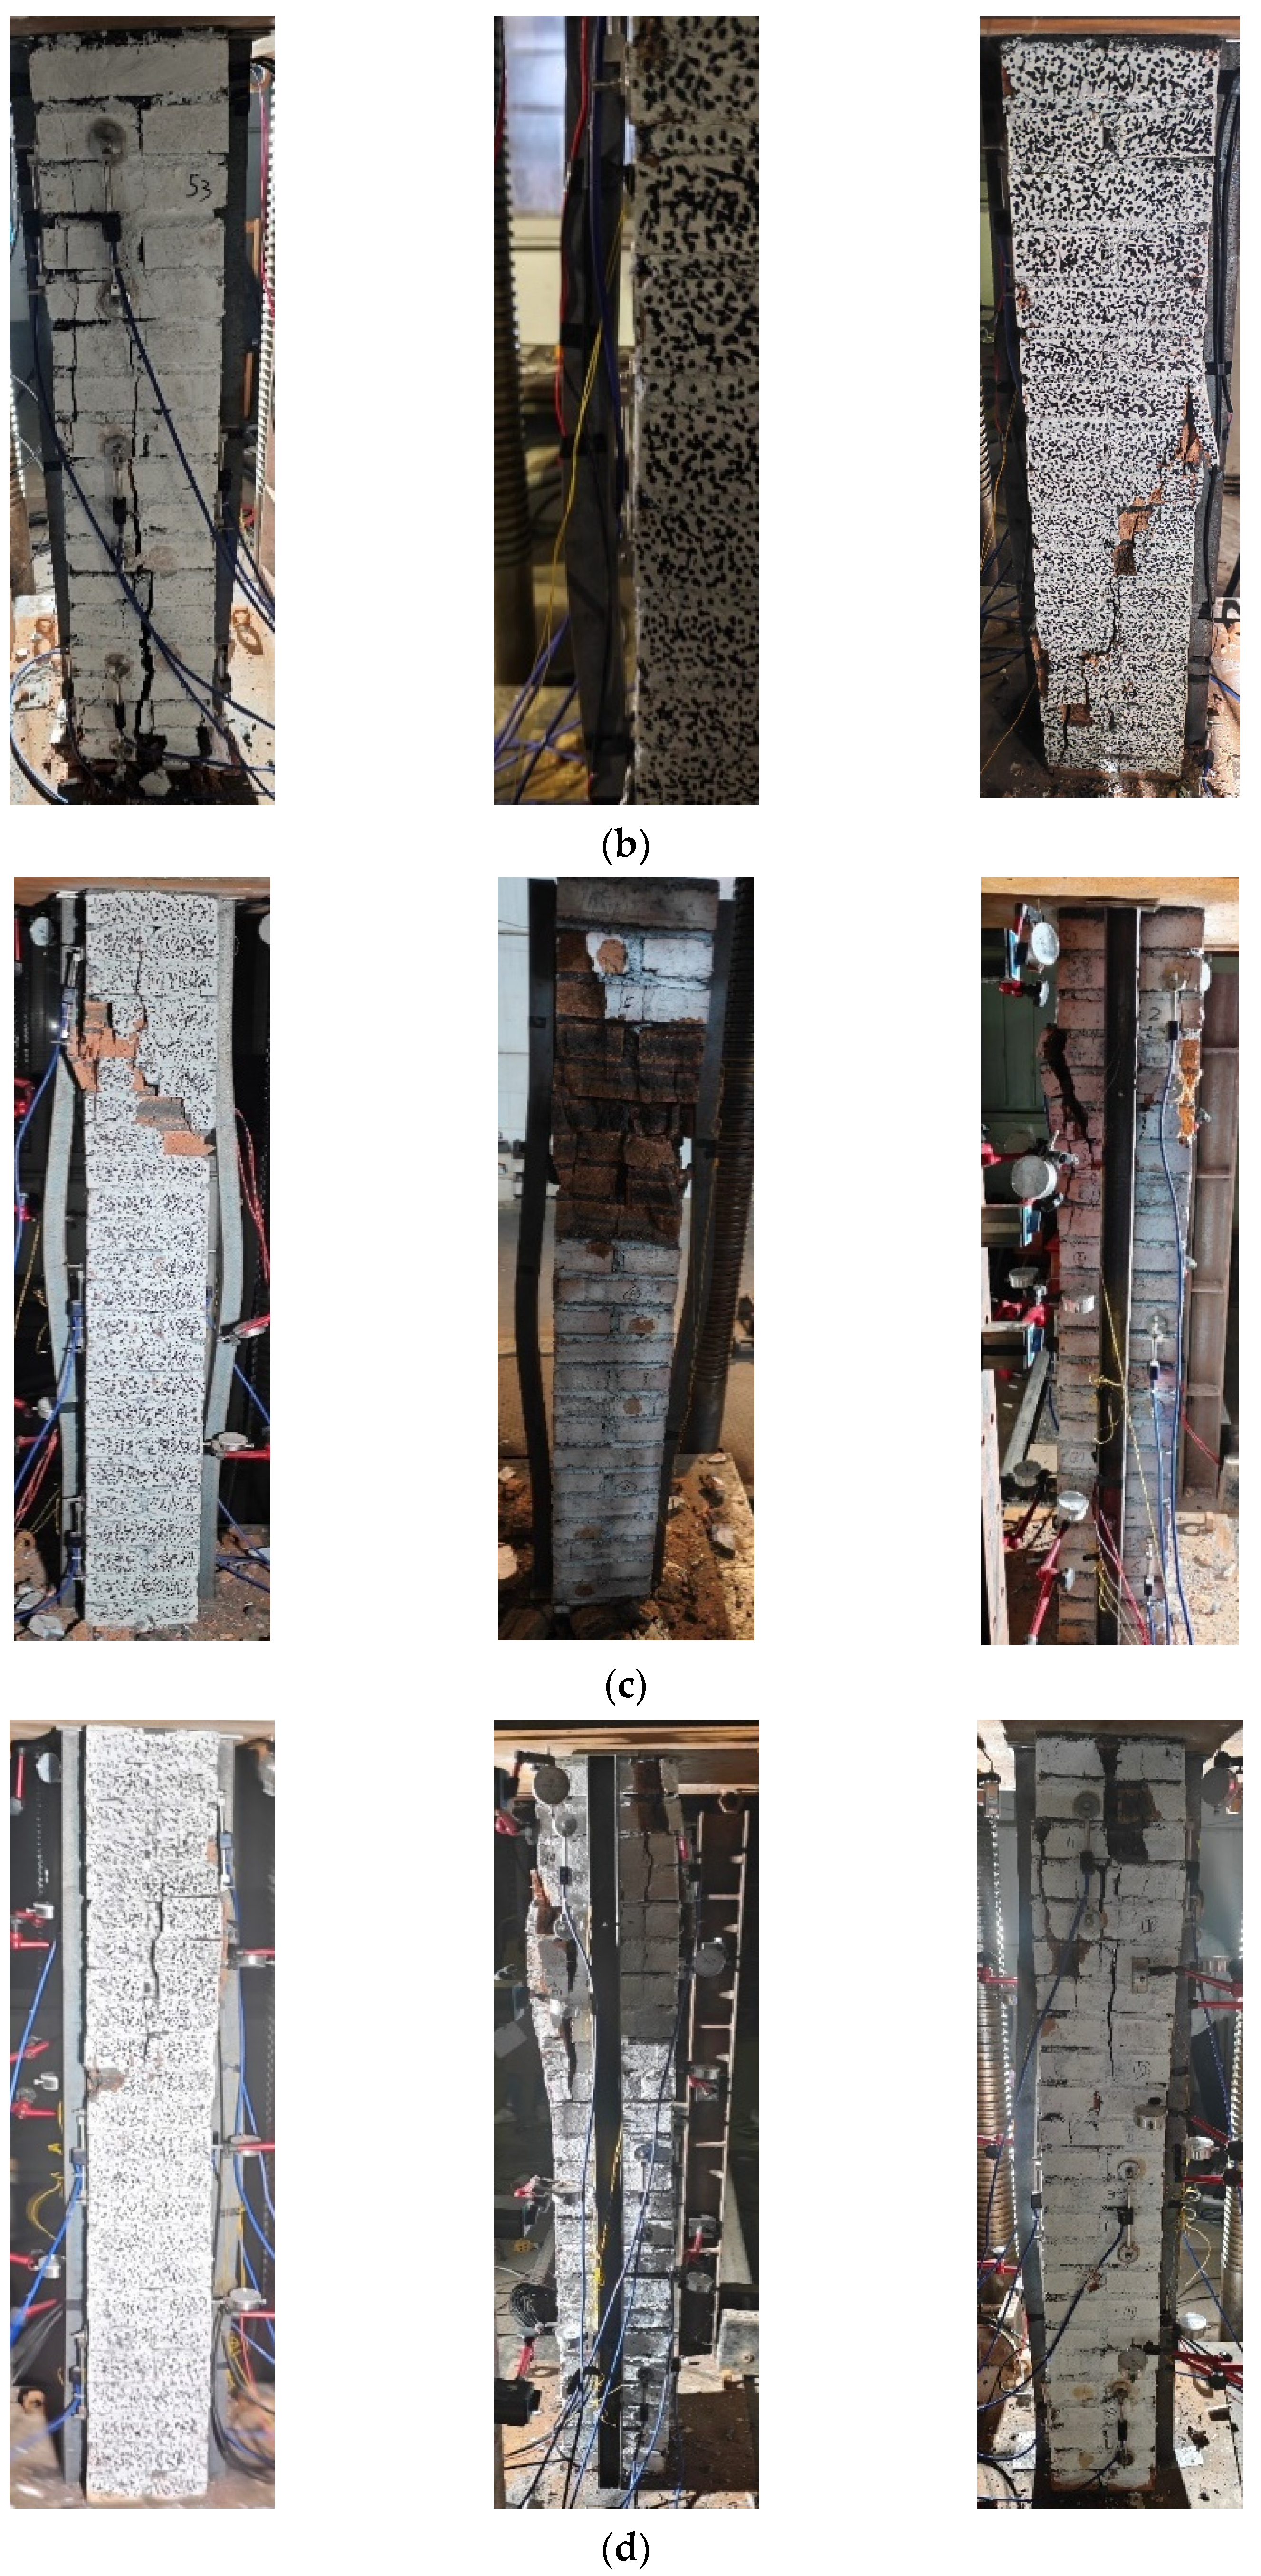
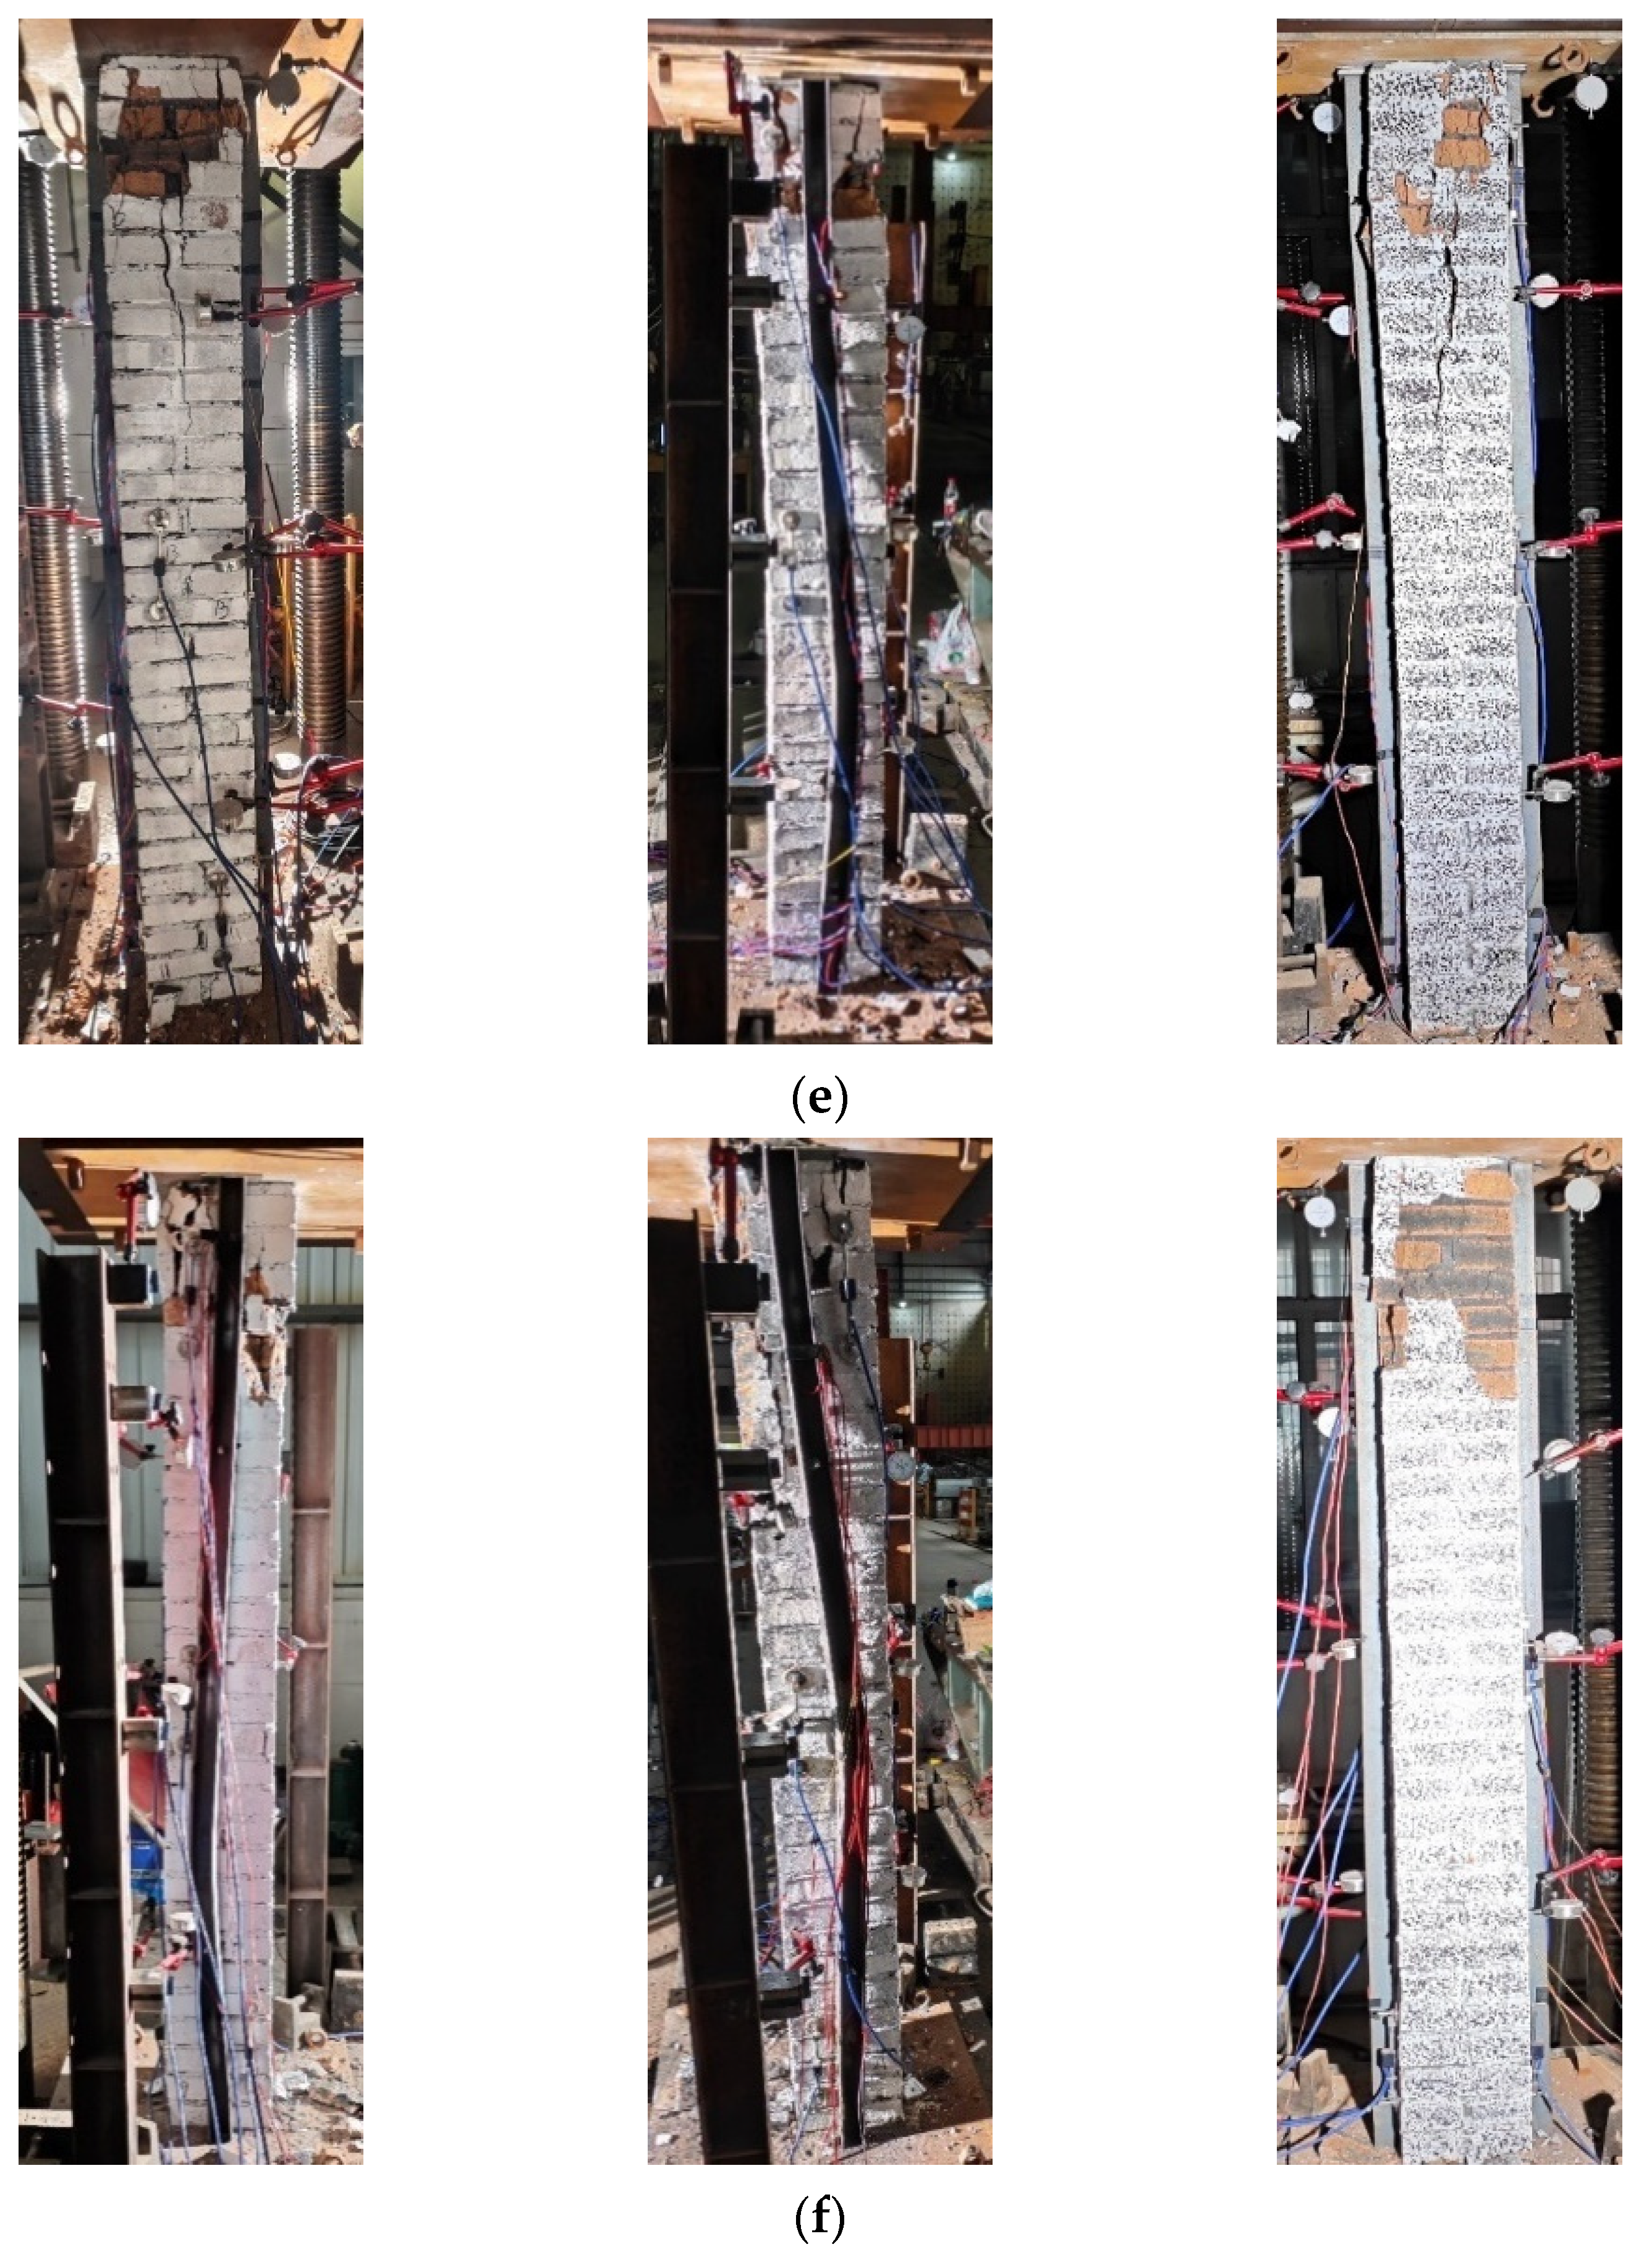
3.1. Failure Modes

3.1.1. Unreinforced Brick Columns

Z1, Z5, and Z9 are unreinforced brick columns with heights of 1080 mm, 1440 mm, and 1800 mm, respectively. The upper failure patterns of 1440 mm and 1800 mm columns are similar to those of 1080 mm columns, while the lower sections remain mostly intact. During the experiment, the first fine crack appeared in the specimen when the load was about 60–70% of the peak load. As loading continued, the crack lengthened and widened, and additional cracks formed. When the load reached 80–90% of the peak load, the crack development accelerated, leading to continuous debris detachment. After the peak load was reached, the cracks interconnected, causing parts of the surface layer to protrude and detach. The brick column was then divided into several independent blocks, some of which were crushed or became unstable and fell, ultimately failing. This process exhibited clear brittle failure characteristics.

3.1.2. The 20% Initial Stress Reinforcement

Z2, Z6, and Z10 were first loaded to 20% of the peak load and then reinforced with channel steel. The failure mode of the reinforced brick column is similar to that of the unreinforced brick column. When loaded to the peak load, the channel steel bent and buckled with continued loading, and the deformation of the channel steel increased, while the wall screw did not exhibit significant deformation.

3.1.3. The 40% Initial Stress Reinforcement

Z3, Z7, and Z11 were first loaded to 40% of the peak load and then reinforced with channel steel. The failure mode of the reinforced brick columns was similar to that of the unreinforced brick columns. The channel steel did not buckle when the displacement corresponding to the peak load of the unreinforced column specimen was reached. However, bending and buckling occurred in the channel steel with continued loading. The deformation of the channel steel gradually increased with the increasing displacement of the press, while the wall screw did not show significant deformation.

3.1.4. The 60% Initial Stress Reinforcement

Z4, Z8, and Z12 were first loaded to 60% of the peak load and then reinforced with channel steel. The failure mode of the reinforced brick columns is similar to that of the unreinforced ones. The channel steel does not buckle when the displacement of the unreinforced column specimen reaches the peak load. Bending buckling occurs in the continuously loaded channel steel, but the loading displacement was larger than the initial stress level of 40% when buckling occurred. Additionally, the wall screw showed no obvious deformation.
The comprehensive analysis shows that with the increase in column height, the main bending and buckling mode of channel steel changes from in-plane instability to out-of-plane instability.
The typical failure modes of each specimen are shown in Figure 4.

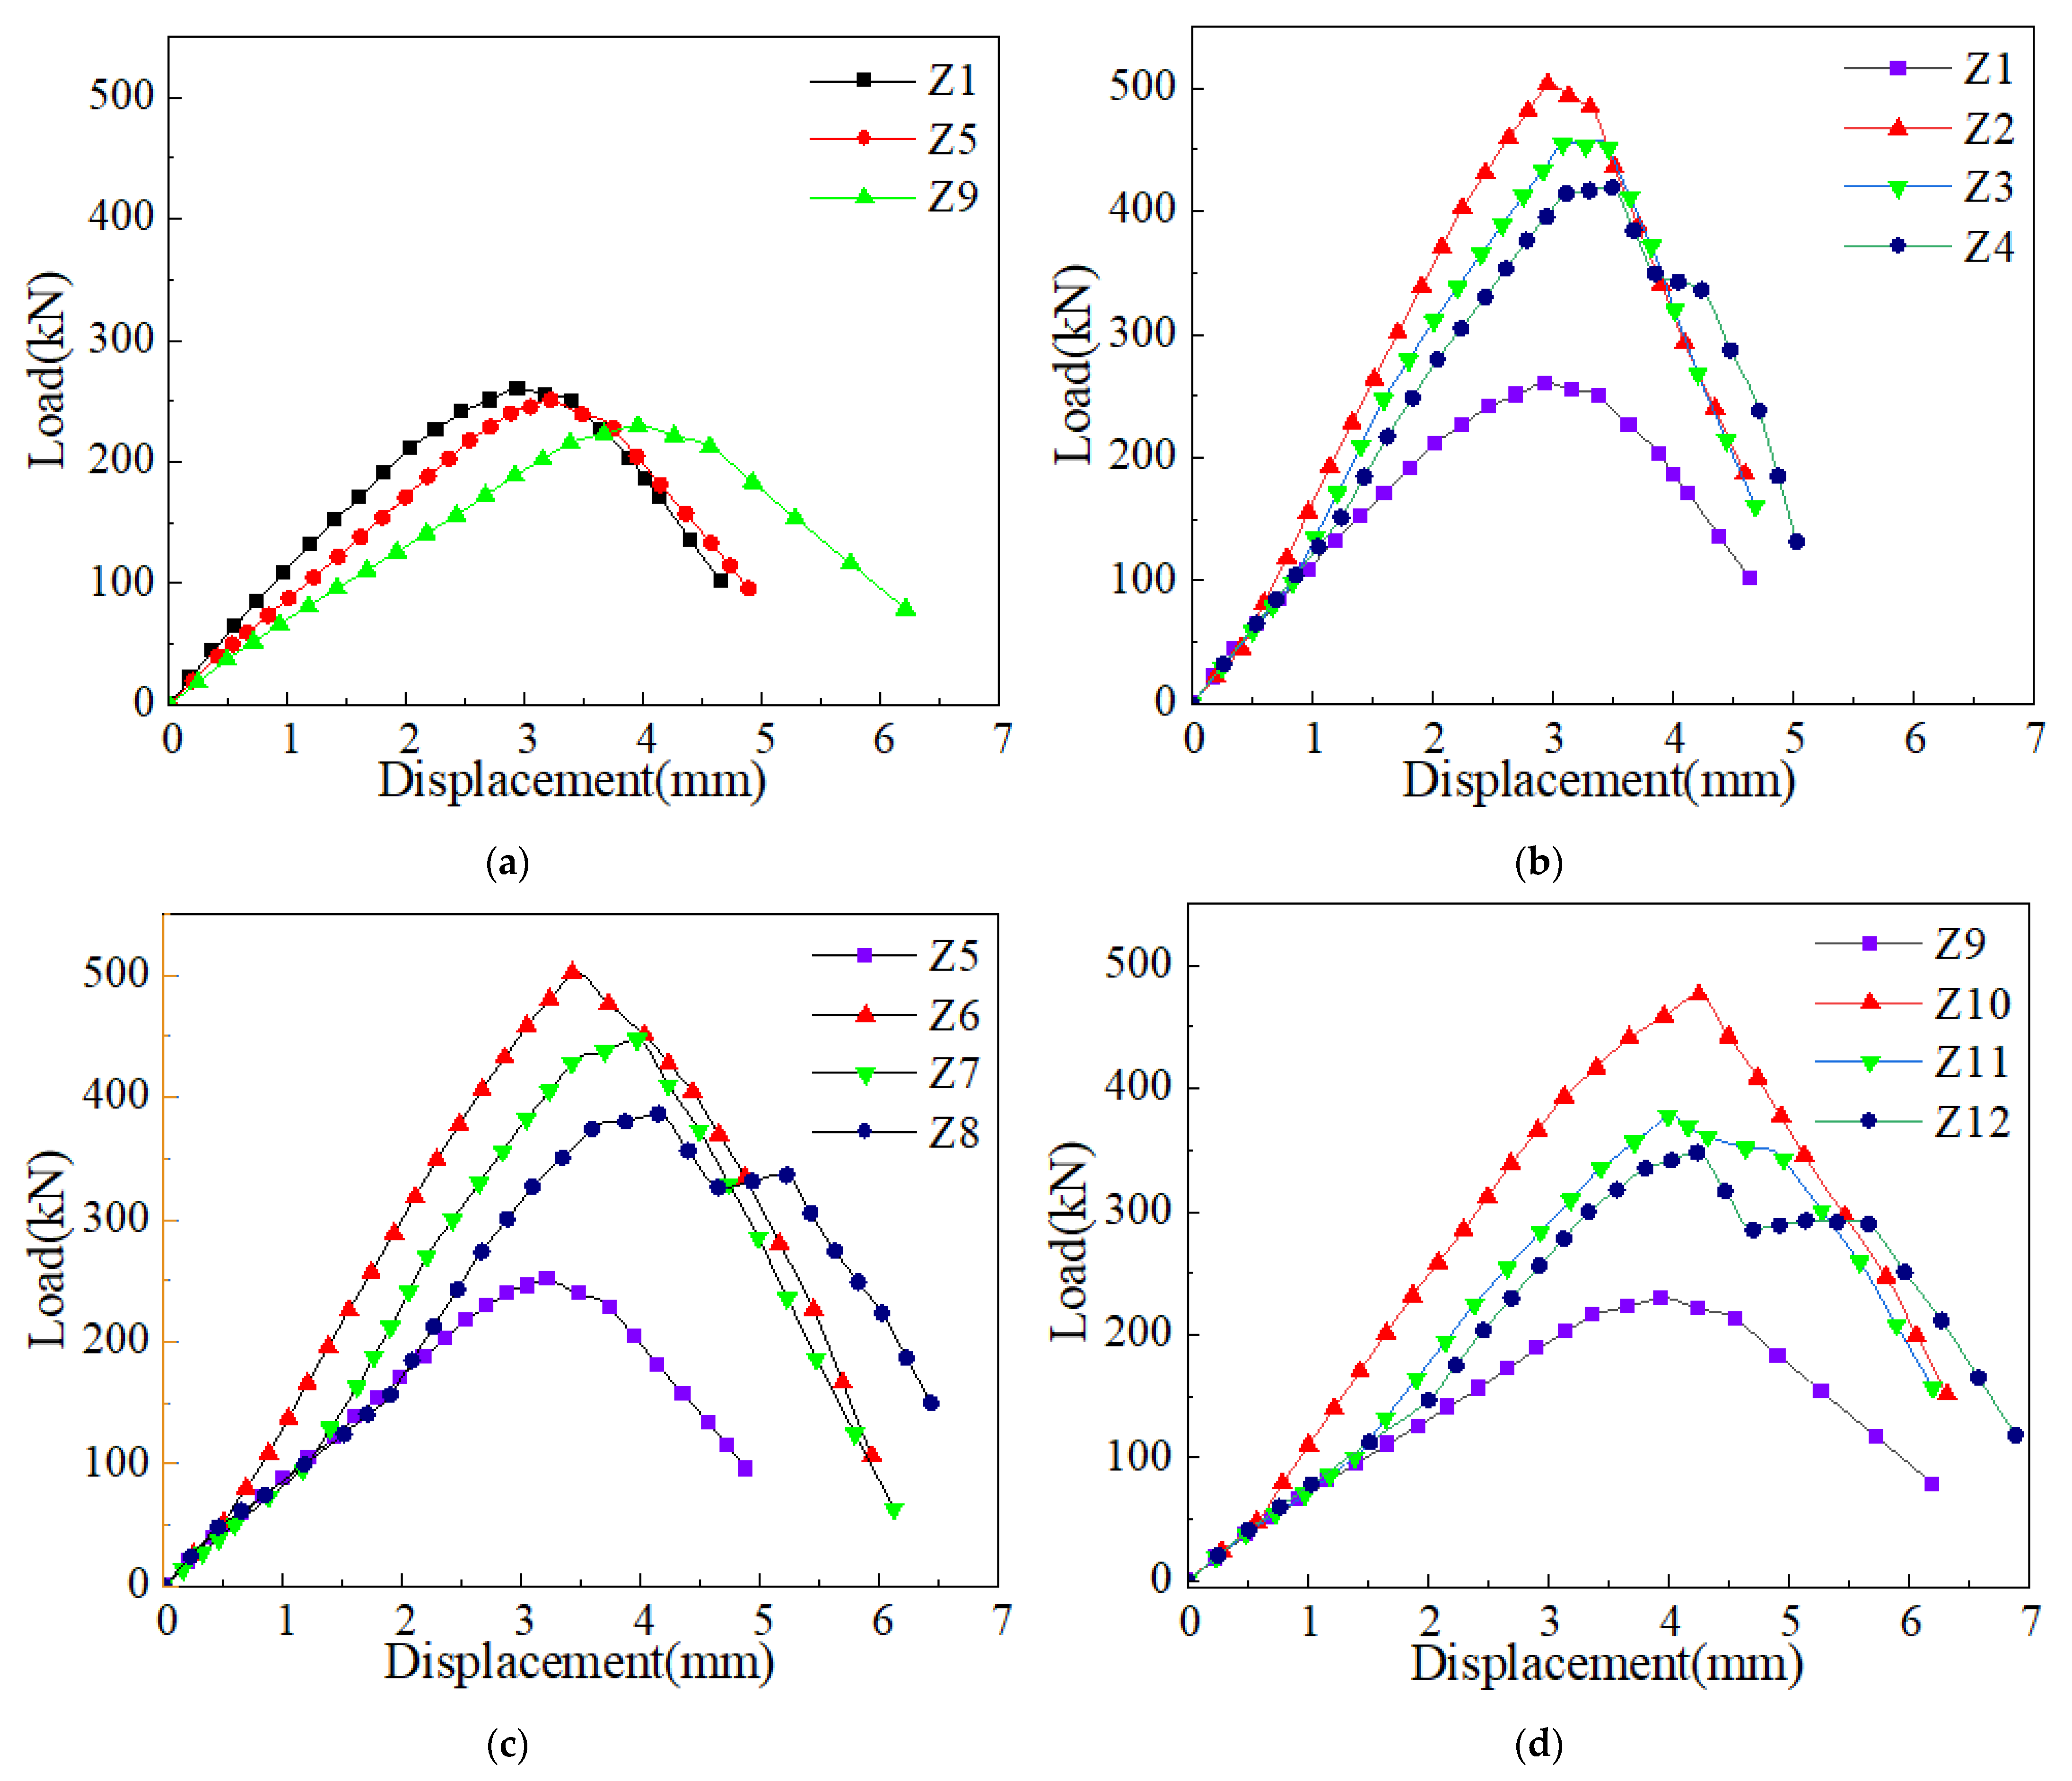
3.2. Load–Displacement Curve

As shown in Figure 5, the load–displacement curve increases linearly at the beginning of loading, but the stiffness of the specimen begins to decrease; the slope of the curve decreases as the loading continues to the cracks, and the stiffness of the specimen decreases; the slope of the curve decreases as the loading continues, and the curve begins to decline after the peak load is reached.
The load–displacement curve of the reinforced specimen increases linearly before reinforcement, and the slope of the curve increases immediately after reinforcement due to the participation of channel steel in the work to improve the overall stiffness of the specimen. When the curve of the unreinforced specimen enters the descending section, the 20% initial stress level reinforced specimen also enters the descending section, but the slope of the curve of the 40% initial stress state and 60% initial stress horizontal reinforcement specimens only decreases but is still greater than 0 because the channel steel has not yet entered the yield stage. With the continuous loading, due to the acceleration of the decreasing rate of the bearing capacity of the brick column, the reinforced specimens with 40% initial stress level and 60% initial stress level also entered the descending section, but the reduction rate was slow. In specimens with higher initial stress levels, the bearing capacity dropped rapidly after the peak load due to the rapid damage stage of the brick column. As the brick column damage stabilized, its bearing capacity declined more slowly. Meanwhile, the channel steel had not yet reached its yield strength, so the stress in the channel steel continued to increase with continued loading. Consequently, the load–displacement curve shows an increase in bearing capacity after the peak load.
The comprehensive analysis shows that with the increase of the initial stress level, the hysteresis effect of the reinforcement gradually increases, and the peak bearing capacity of the reinforcement specimen decreases.
Comparing the compressive load–displacement curves of specimens with different height-to-thickness ratios, it was found that with the increase of the height-to-thickness ratio, the peak load of the specimen decreases gradually, and the corresponding displacement of the peak load gradually increases; that is, the slope of the curve is inversely proportional to the height/thickness ratio of the specimen.

3.3. Ultimate Loads

As shown in Figure 6a, compared with the unreinforced column, the peak load of the reinforced column with initial stress levels of 20%, 40%, and 60% increased by 100%, 73%, and 56%, respectively. This indicates that channel reinforcement can significantly improve the compressive bearing capacity of the brick column. However, an increase in the initial stress state reduces the compressive bearing capacity of the brick column. As shown in Figure 6b, compared with the 1080 mm high unreinforced brick column, the peak load of 1080 mm, 1440 mm, and 1800 mm high specimens was increased by 61%, 48%, and 34%, respectively. This indicates that an increase in the height/thickness ratio also reduces the compressive bearing capacity of the channel steel-reinforced brick column. In comparison, the initial stress level has a greater impact on the compressive bearing capacity of the reinforcement than the height-to-thickness ratio.

3.4. Axial Strain

Table 2 shows that the axial ultimate strain and peak strain of the reinforced specimens do not change significantly under the axial load, indicating that external channel reinforcement does not improve the deformation capacity of the masonry column.
The main test results of the compression column are shown in Table 2, while Figure 6 illustrates the influence of the initial stress level and the height/thickness ratio on the compressive bearing capacity and axial strain (values in parentheses indicate the change in the bearing capacity of the reinforced specimen compared to the unreinforced specimen).

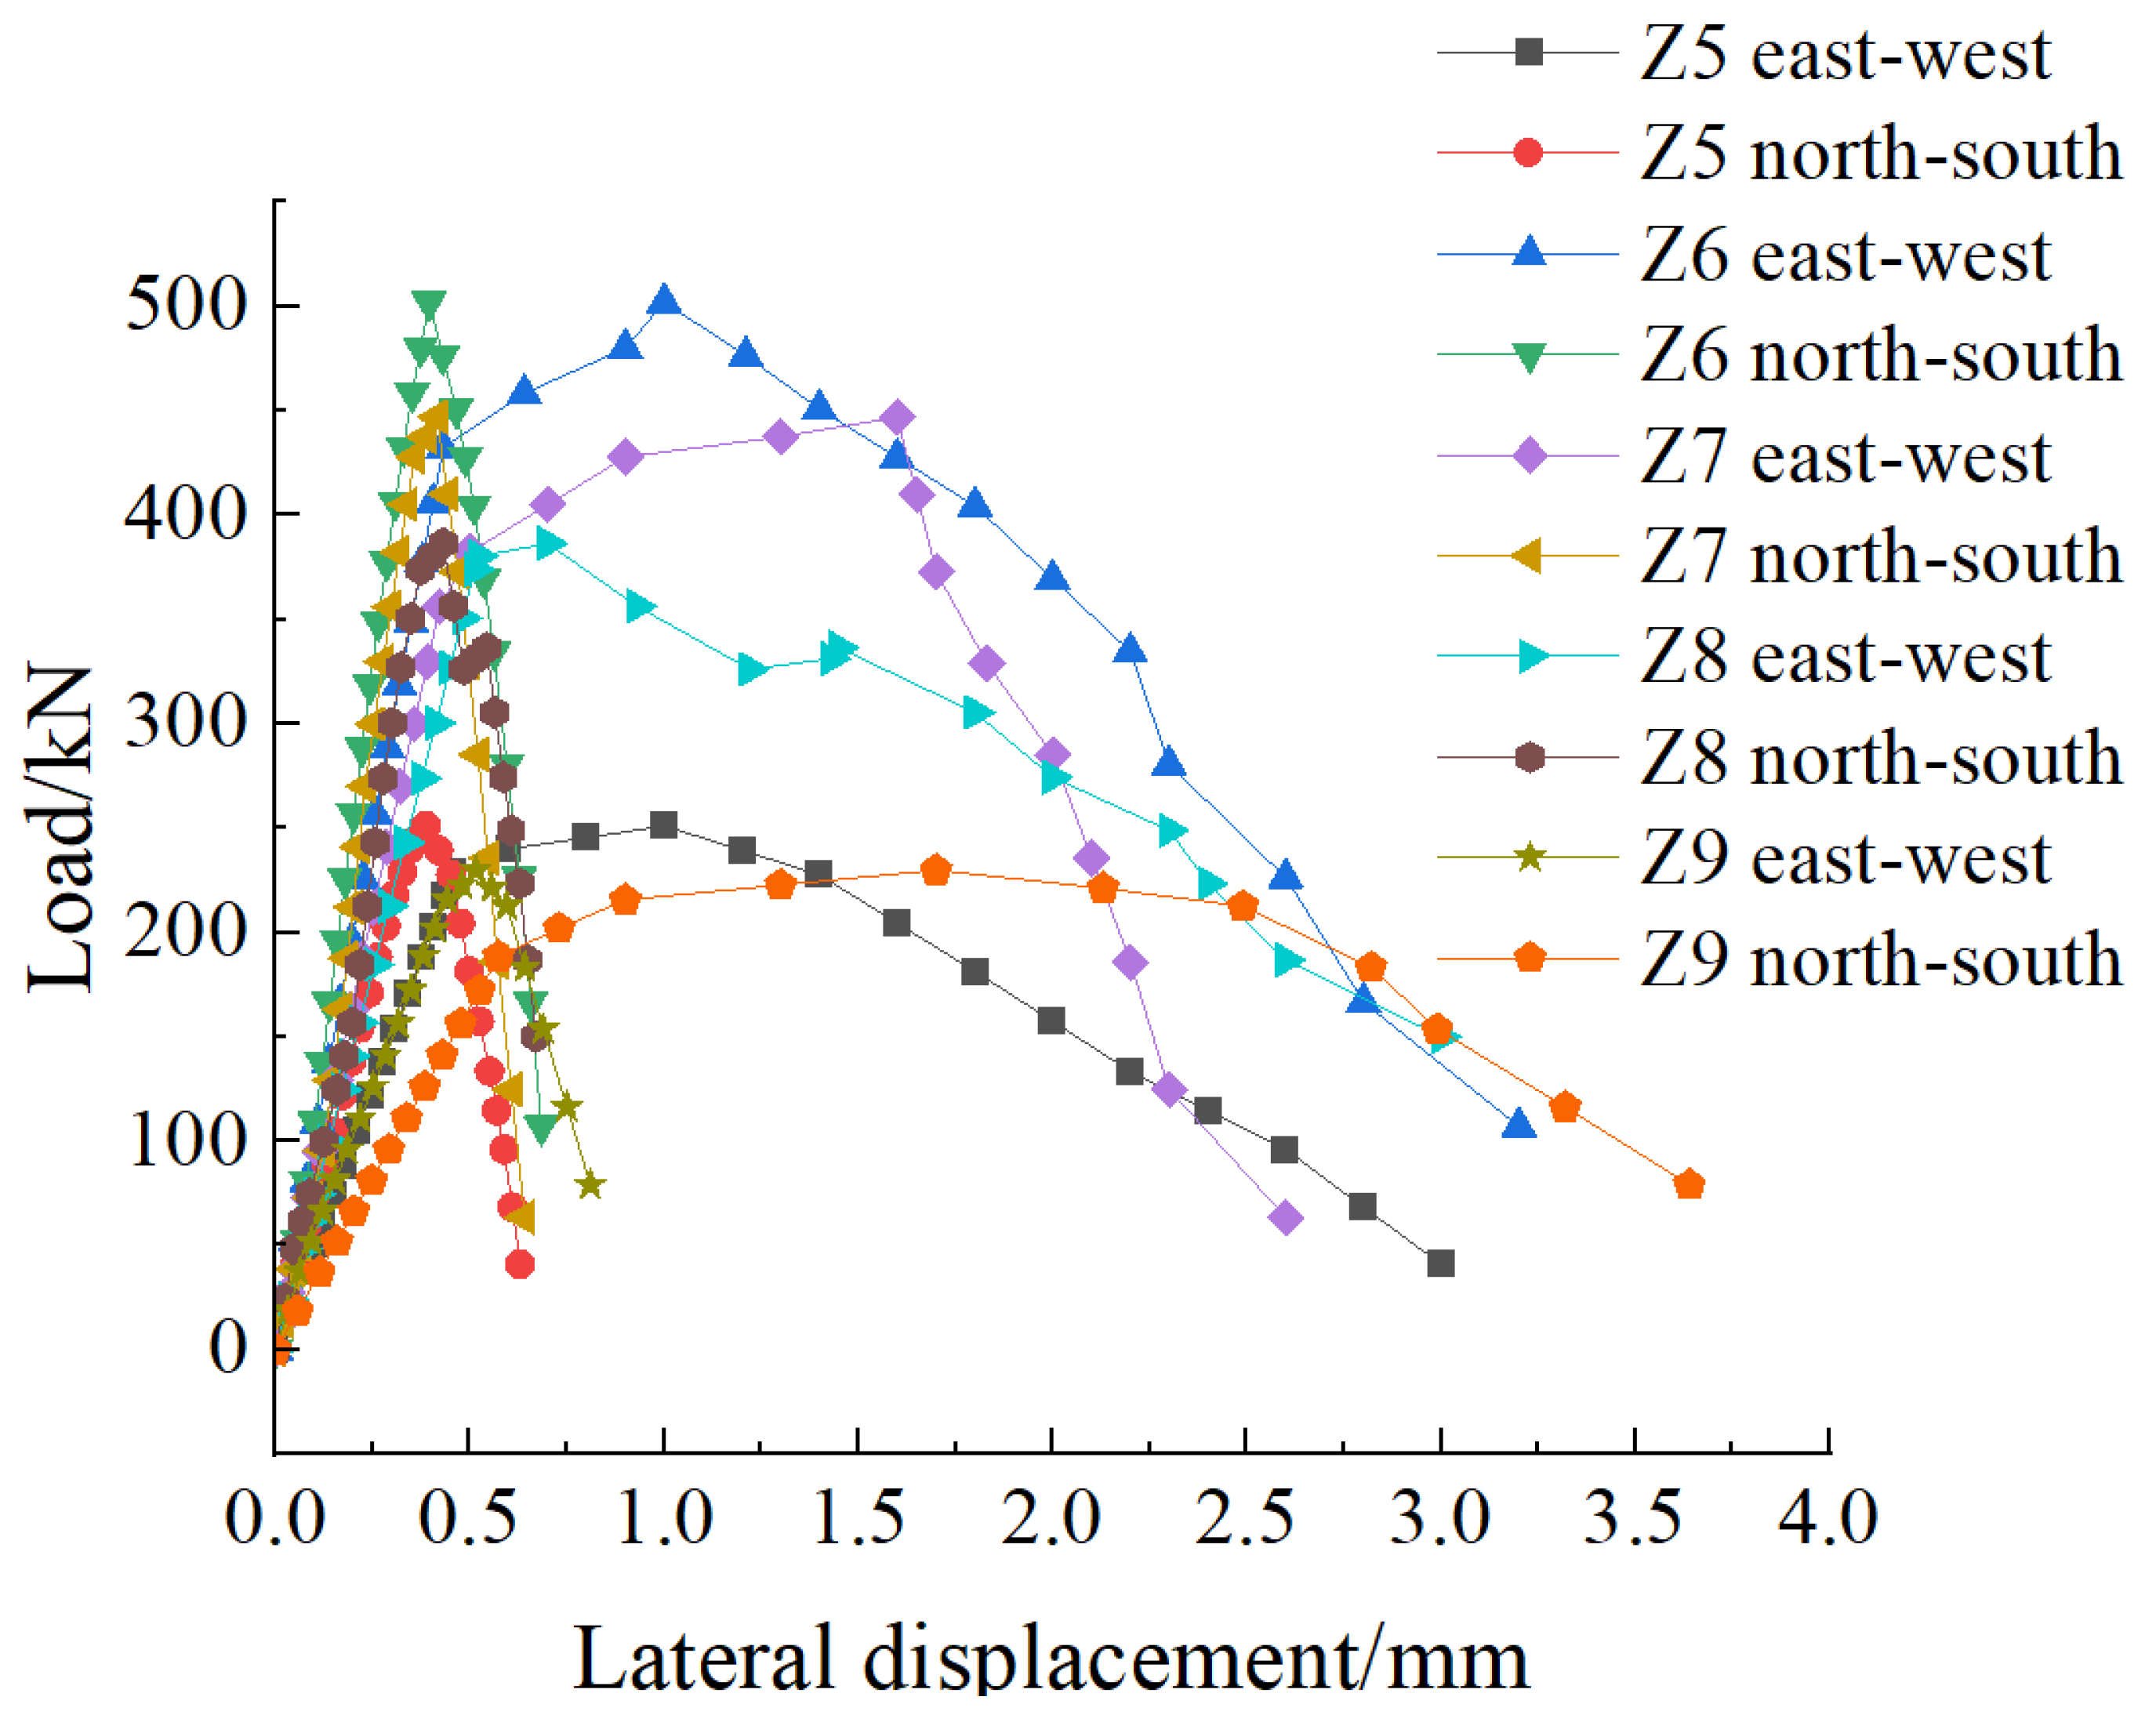
3.5. Lateral Displacement

Under the axial load, due to the accidental load eccentricity and uneven material properties, combined compression and bending occur from the beginning of loading, resulting in lateral displacement. As shown in Figure 7, the lateral displacement changes very little at the initial loading stage, but when the load approaches the ultimate load, the displacement in one of the east–west and north–south directions increases rapidly. Compared to the unreinforced specimen, the channel steel installed on the north and south sides increases the cross-sectional moment of inertia in this direction, causing the maximum lateral displacement of the brick column to occur only in the east–west direction. In contrast, the unreinforced column may experience displacement in all directions. However, since the brick column and the channel steel are connected only by wall screws, the lateral displacement of the brick column in the east–west direction is not effectively constrained, changing the direction of the maximum lateral displacement but not reducing it.

3.6. Steel Strain

The relationship between the strain in the middle part of the channel steel and the wall screw load strain of each specimen is shown in Table 3 (The strain values in the table are averaged from the data measured during the test).
From the above table, it is evident that the channel steel in each reinforced specimen has not yet reached its ultimate strain when the specimen reaches its peak load. As the initial stress level increases, the channel strain corresponding to the peak load gradually decreases. Moreover, when the channel steel reaches the ultimate strain, the load on the specimen gradually decreases due to the increase in the degree of failure of the brick column. The load sustained by the channel steel at its ultimate strain progressively decreases due to the heightened degree of failure of the brick column. During the test, the strain experienced by the wall screw remains minimal, failing to reach its yield strain. However, as the channel strain approaches its limit, the strain on the wall screw rapidly increases.

4. Finite-Element Calculating

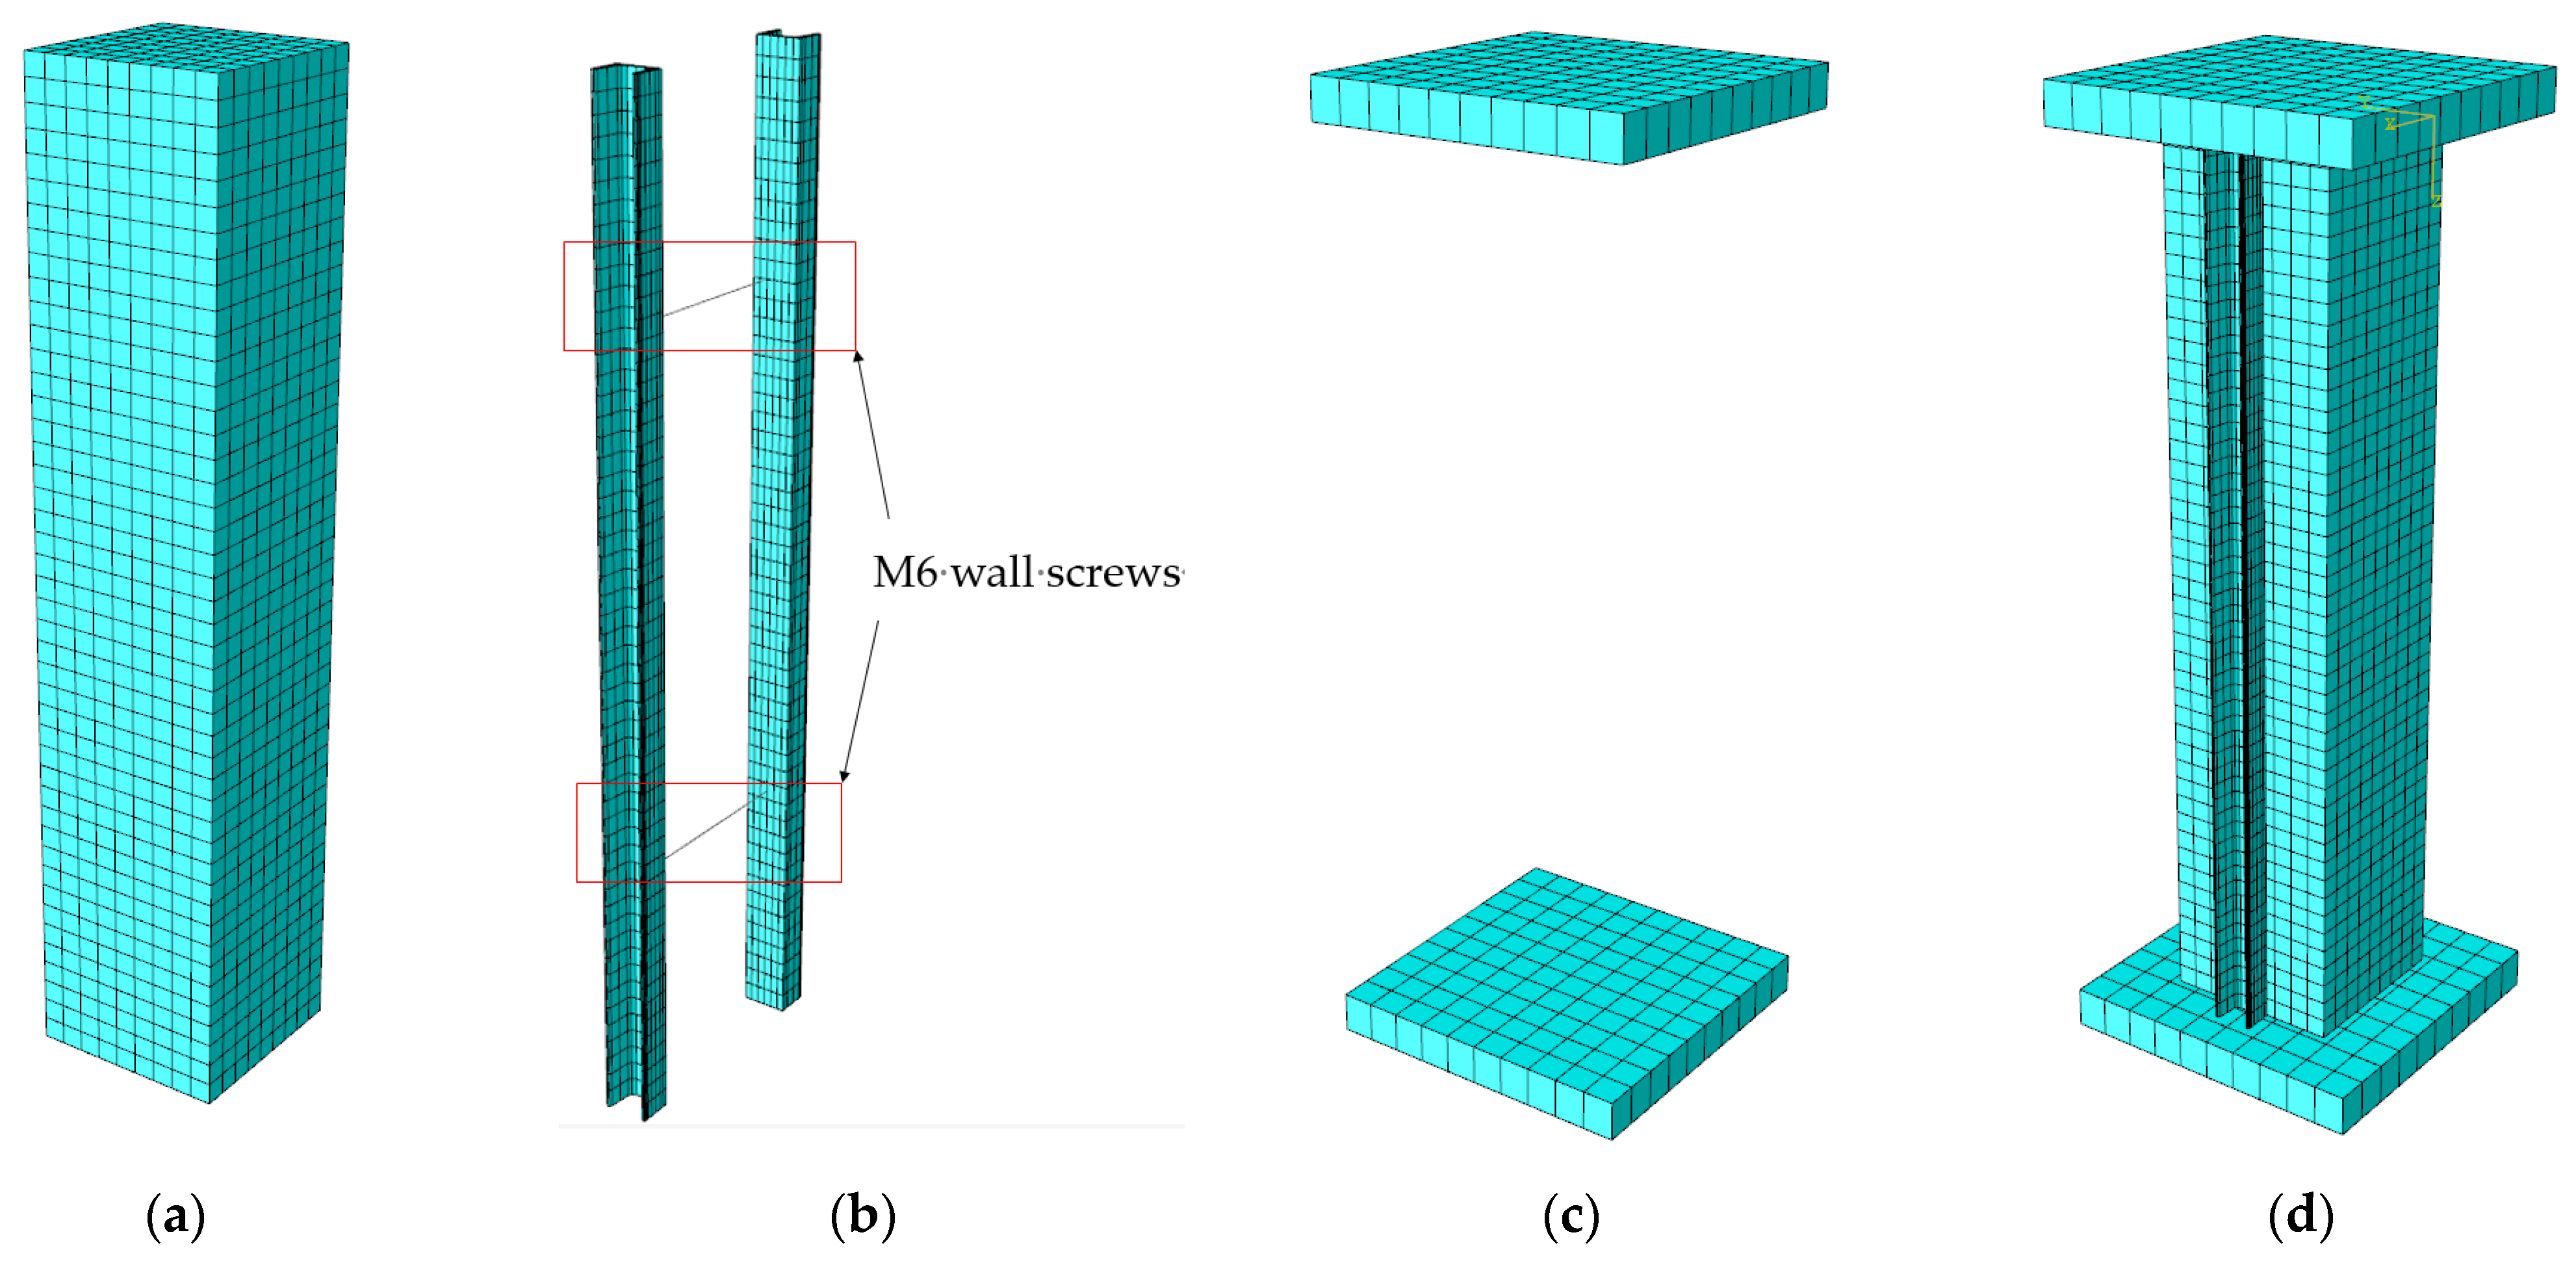
4.1. Finite-Element Model

From the analysis of the test results, it is evident that the difference in the initial stress state and the height/thickness ratio of the column results in significant variations in the bearing capacity of the brick column after channel steel reinforcement. To further investigate the changes in the bearing capacity of brick columns influenced by different initial stress states, column height/thickness ratios, and other factors, the general finite-element software was used to establish a finite-element model of channel steel-reinforced brick columns for analysis.
Masonry structure modeling is primarily divided into two types: detached and monolithic. The detached model refers to finite-element analysis of masonry structures, treating blocks and mortar as two independent materials and assigning them different elements and corresponding material properties. Lee et al. [25] introduced the actual stress-strain relationship between mortar and block into the model.
The monolithic model refers to the finite-element analysis of masonry structures based on the assumption of continuity and homogenization. In this model, mortar is distributed throughout the unit, and the mortar and block are considered a uniform and isotropic (or anisotropic) continuum, ignoring interface details between them. Consequently, there is no need to consider the interaction between the block and the mortar.
In summary, for the study of bearing capacity under axial compression in this paper, considering computational efficiency and the convenience of model construction, the integral model is appropriate for numerical simulation. The established finite-element model, shown in Figure 8, simulates brick columns, channel steel, and upper and lower-end plates using solid element C3D8R. Due to the smaller size of the through-wall screws compared to the overall structural size, line element B31 was used for their simulation. The grid size was set to 0.024 for brick columns, channel steel, and through-wall screws and 0.06 for base plates.
The compressive and tensile behavior of masonry was simulated by using the concrete plastic damage model in ABAQUS 2021 [26]. The elastic modulus of masonry was calculated from the test data in Section 2.2 and ref. [27], and the Poisson’s ratio of masonry was selected as 0.15 according to ref. [28], while the plastic parameters were imported from Wang [29]. The constitutive models for compressive and tensile behavior of masonry columns follow the constitutive relationship for masonry compression proposed by Yang [30]:
σ f m = 1.633 1 + 0.633 ( ε / ε m ) 1.633 / 0.633 ε ε m
where f m and ε m are the strain values and stress values corresponding to the average value of the axial compressive strength of the masonry.
The tensile stress–strain relationship proposed by Zheng [31] is as follows:
σ f t m = ε ε t m ( ε / ε t m 1 ) ε / ε t m 2 ( ε / ε t m 1 ) 1.7 + ε / ε t m ( ε / ε t m > 1 )
where f t m and ε t m are the strain values and stress values corresponding to the average value of the axial tensile strength of the masonry.
The stress–strain relationship curves for channel steel and wall screws were modeled using a double-polyline model.
In the model, general contact is defined between component interfaces, with hard contact in the normal direction and a penalty function in the tangential direction. The channel steel and the wall screw were connected via binding constraints. To facilitate the loading and reading of data, a reference point was established at the upper end, and coupling constraints were applied. Only the axial translational degrees of freedom were released, with axial displacement applied to the reference point of the upper-end plate. Fixed constraints were applied to the lower-end plate to load the specimen and simulate boundary conditions. Initial stress was introduced by applying predefined fields.

4.2. Finite-Element Model Verification

4.2.1. Comparison of Ultimate Bearing Capacity

To verify the accuracy of the finite-element model, the results of finite-element analysis were compared with the test results. The ultimate bearing capacity obtained from the test was compared with the predicted bearing capacity from finite elements. As shown in Table 4, there is a small deviation between the simulated values of each specimen and the measured results. The average value of the measured value/simulated value is 1.02, and the coefficient of variation is 0.059, as shown in Table 4:

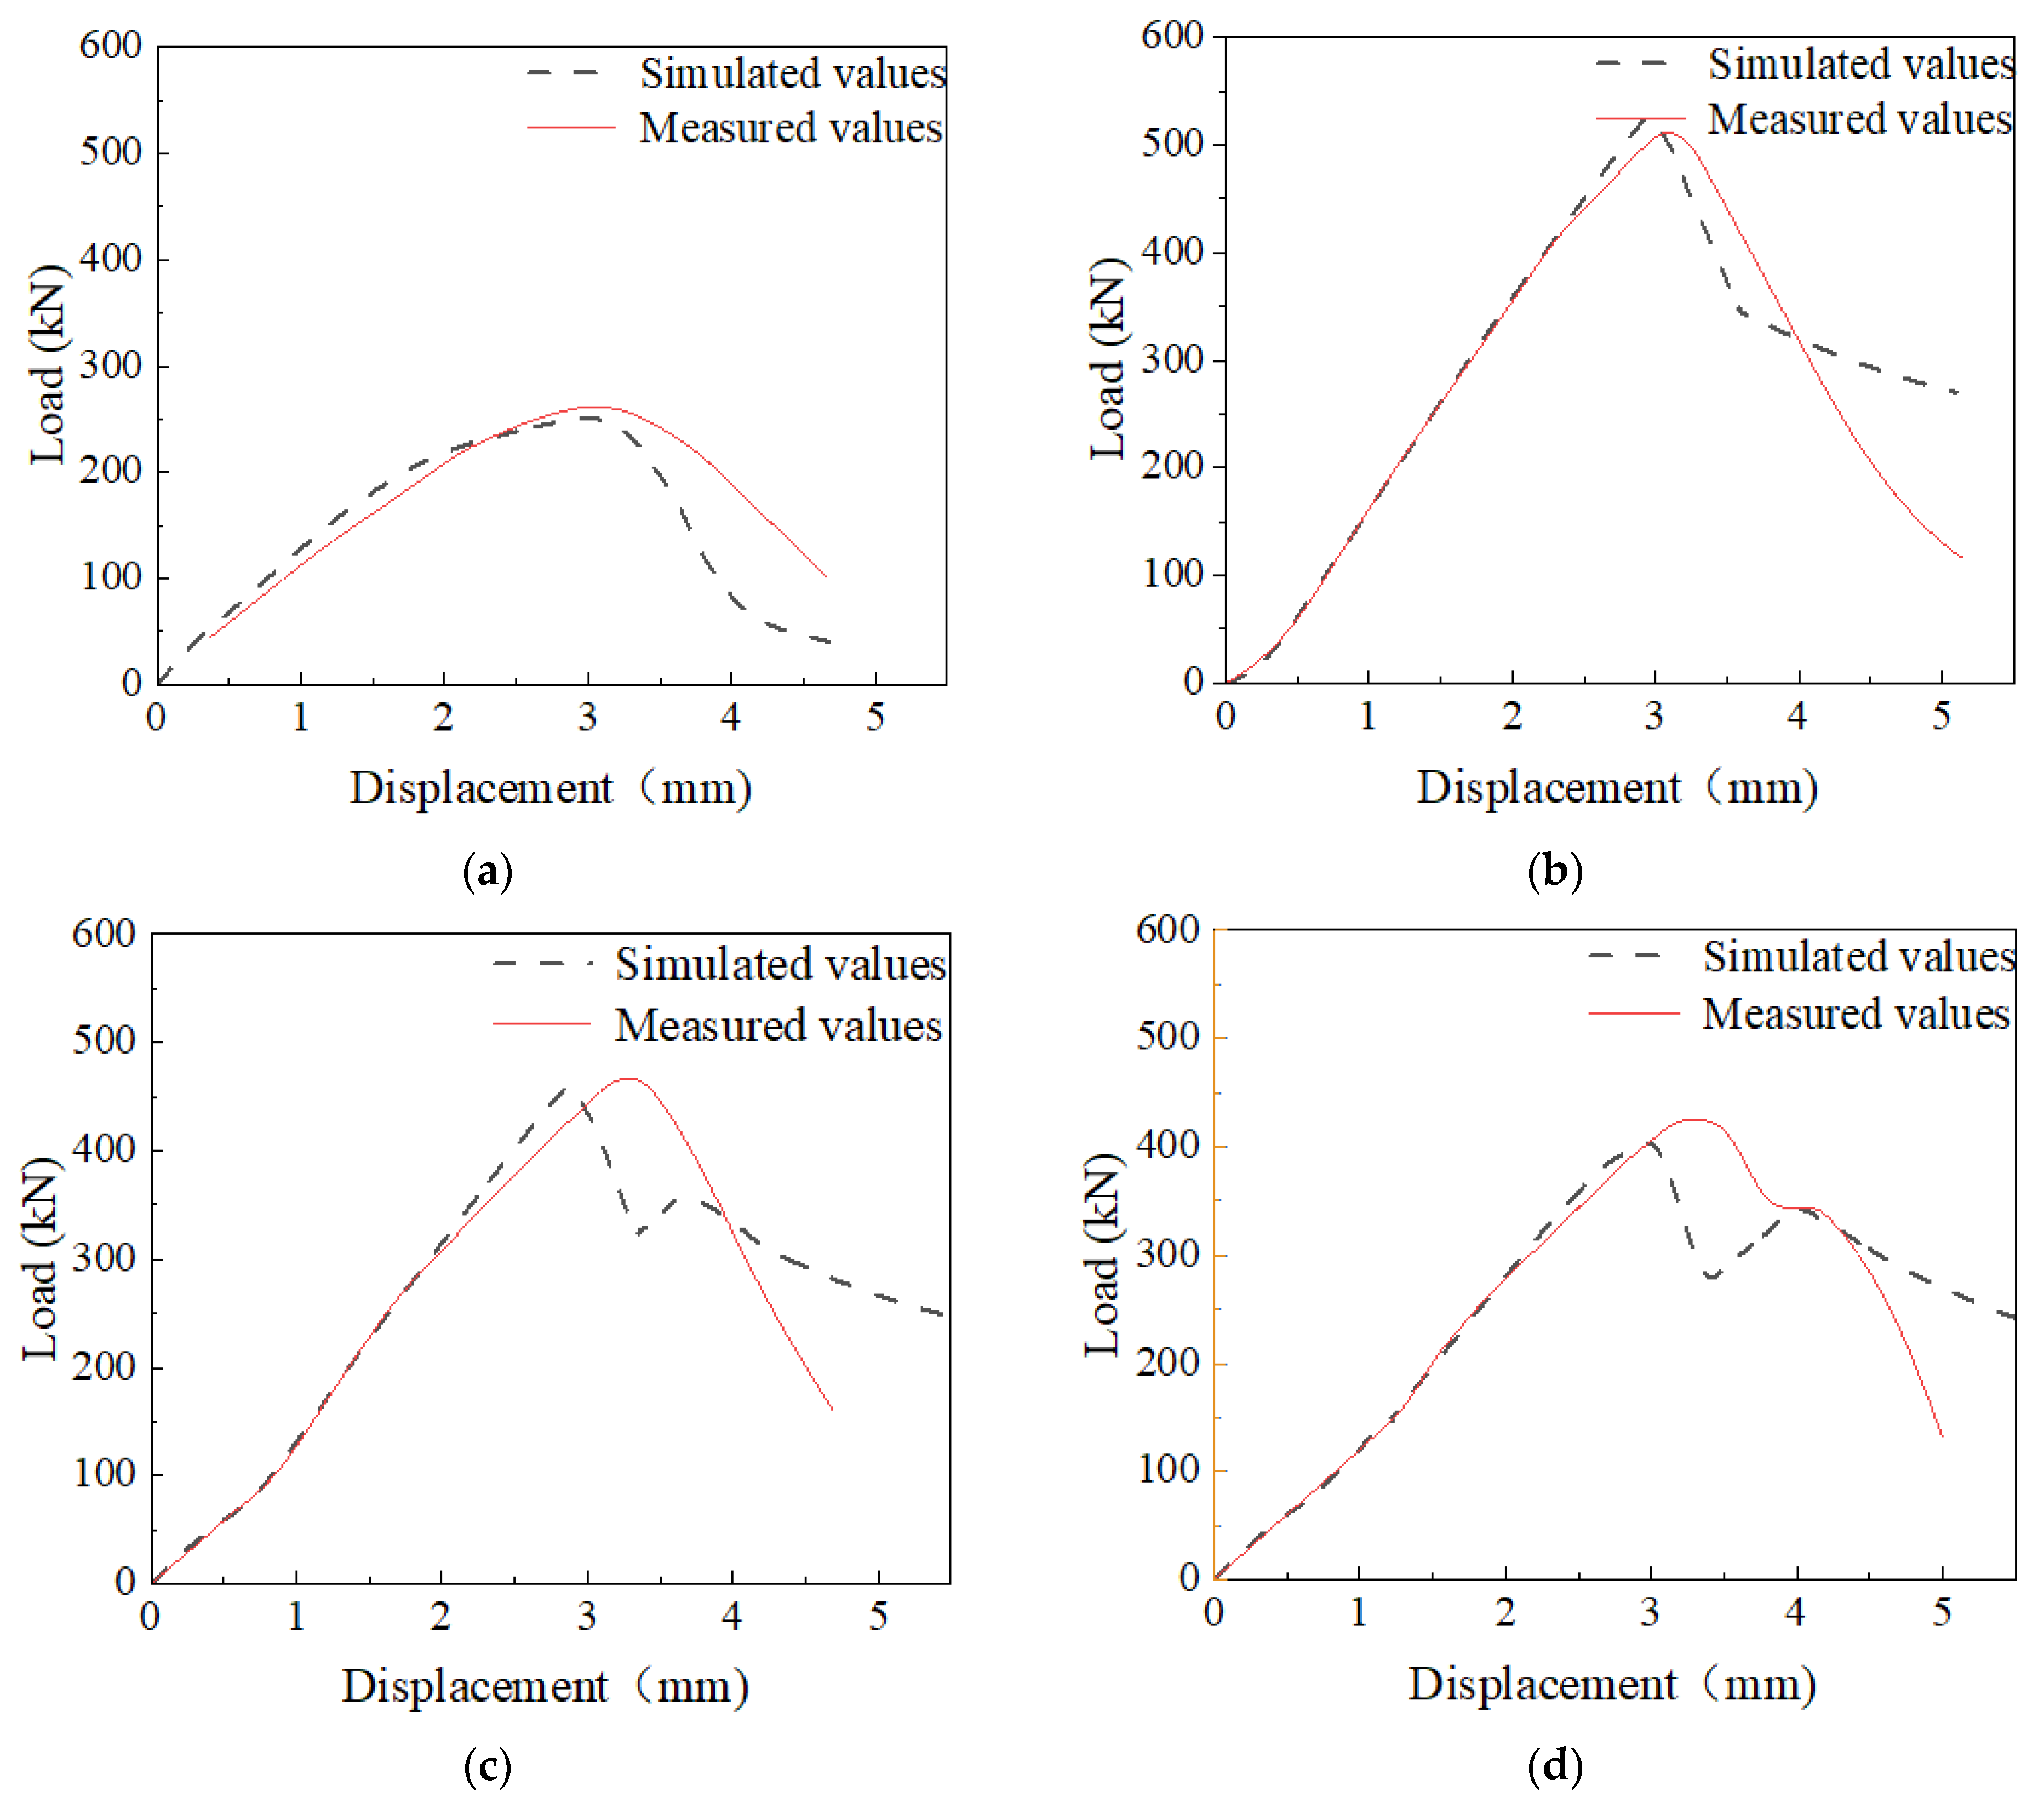
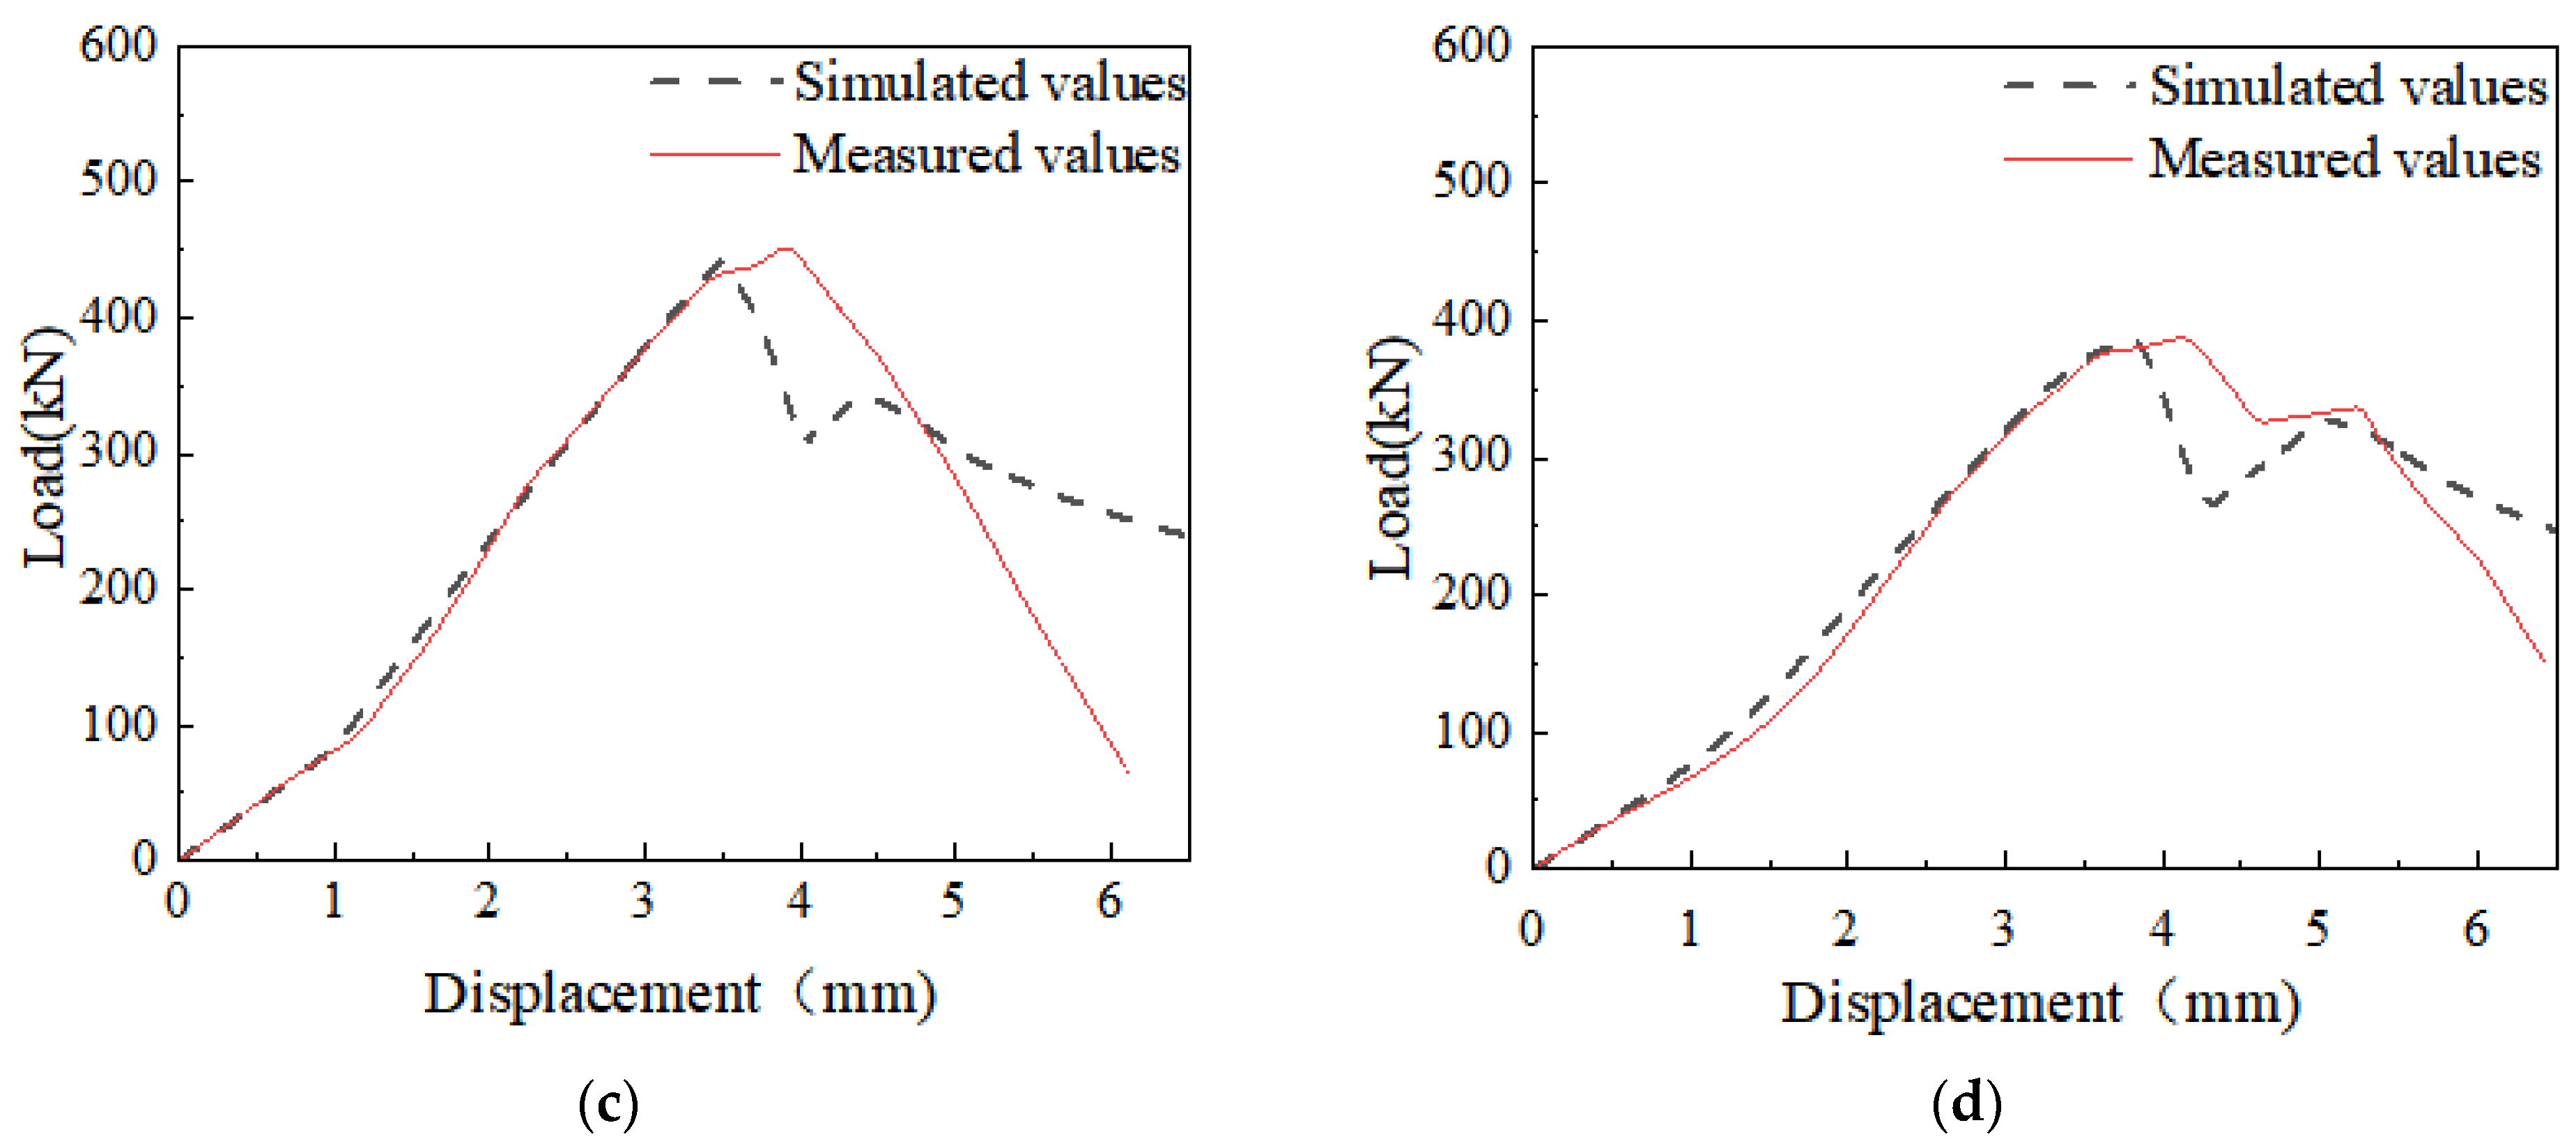
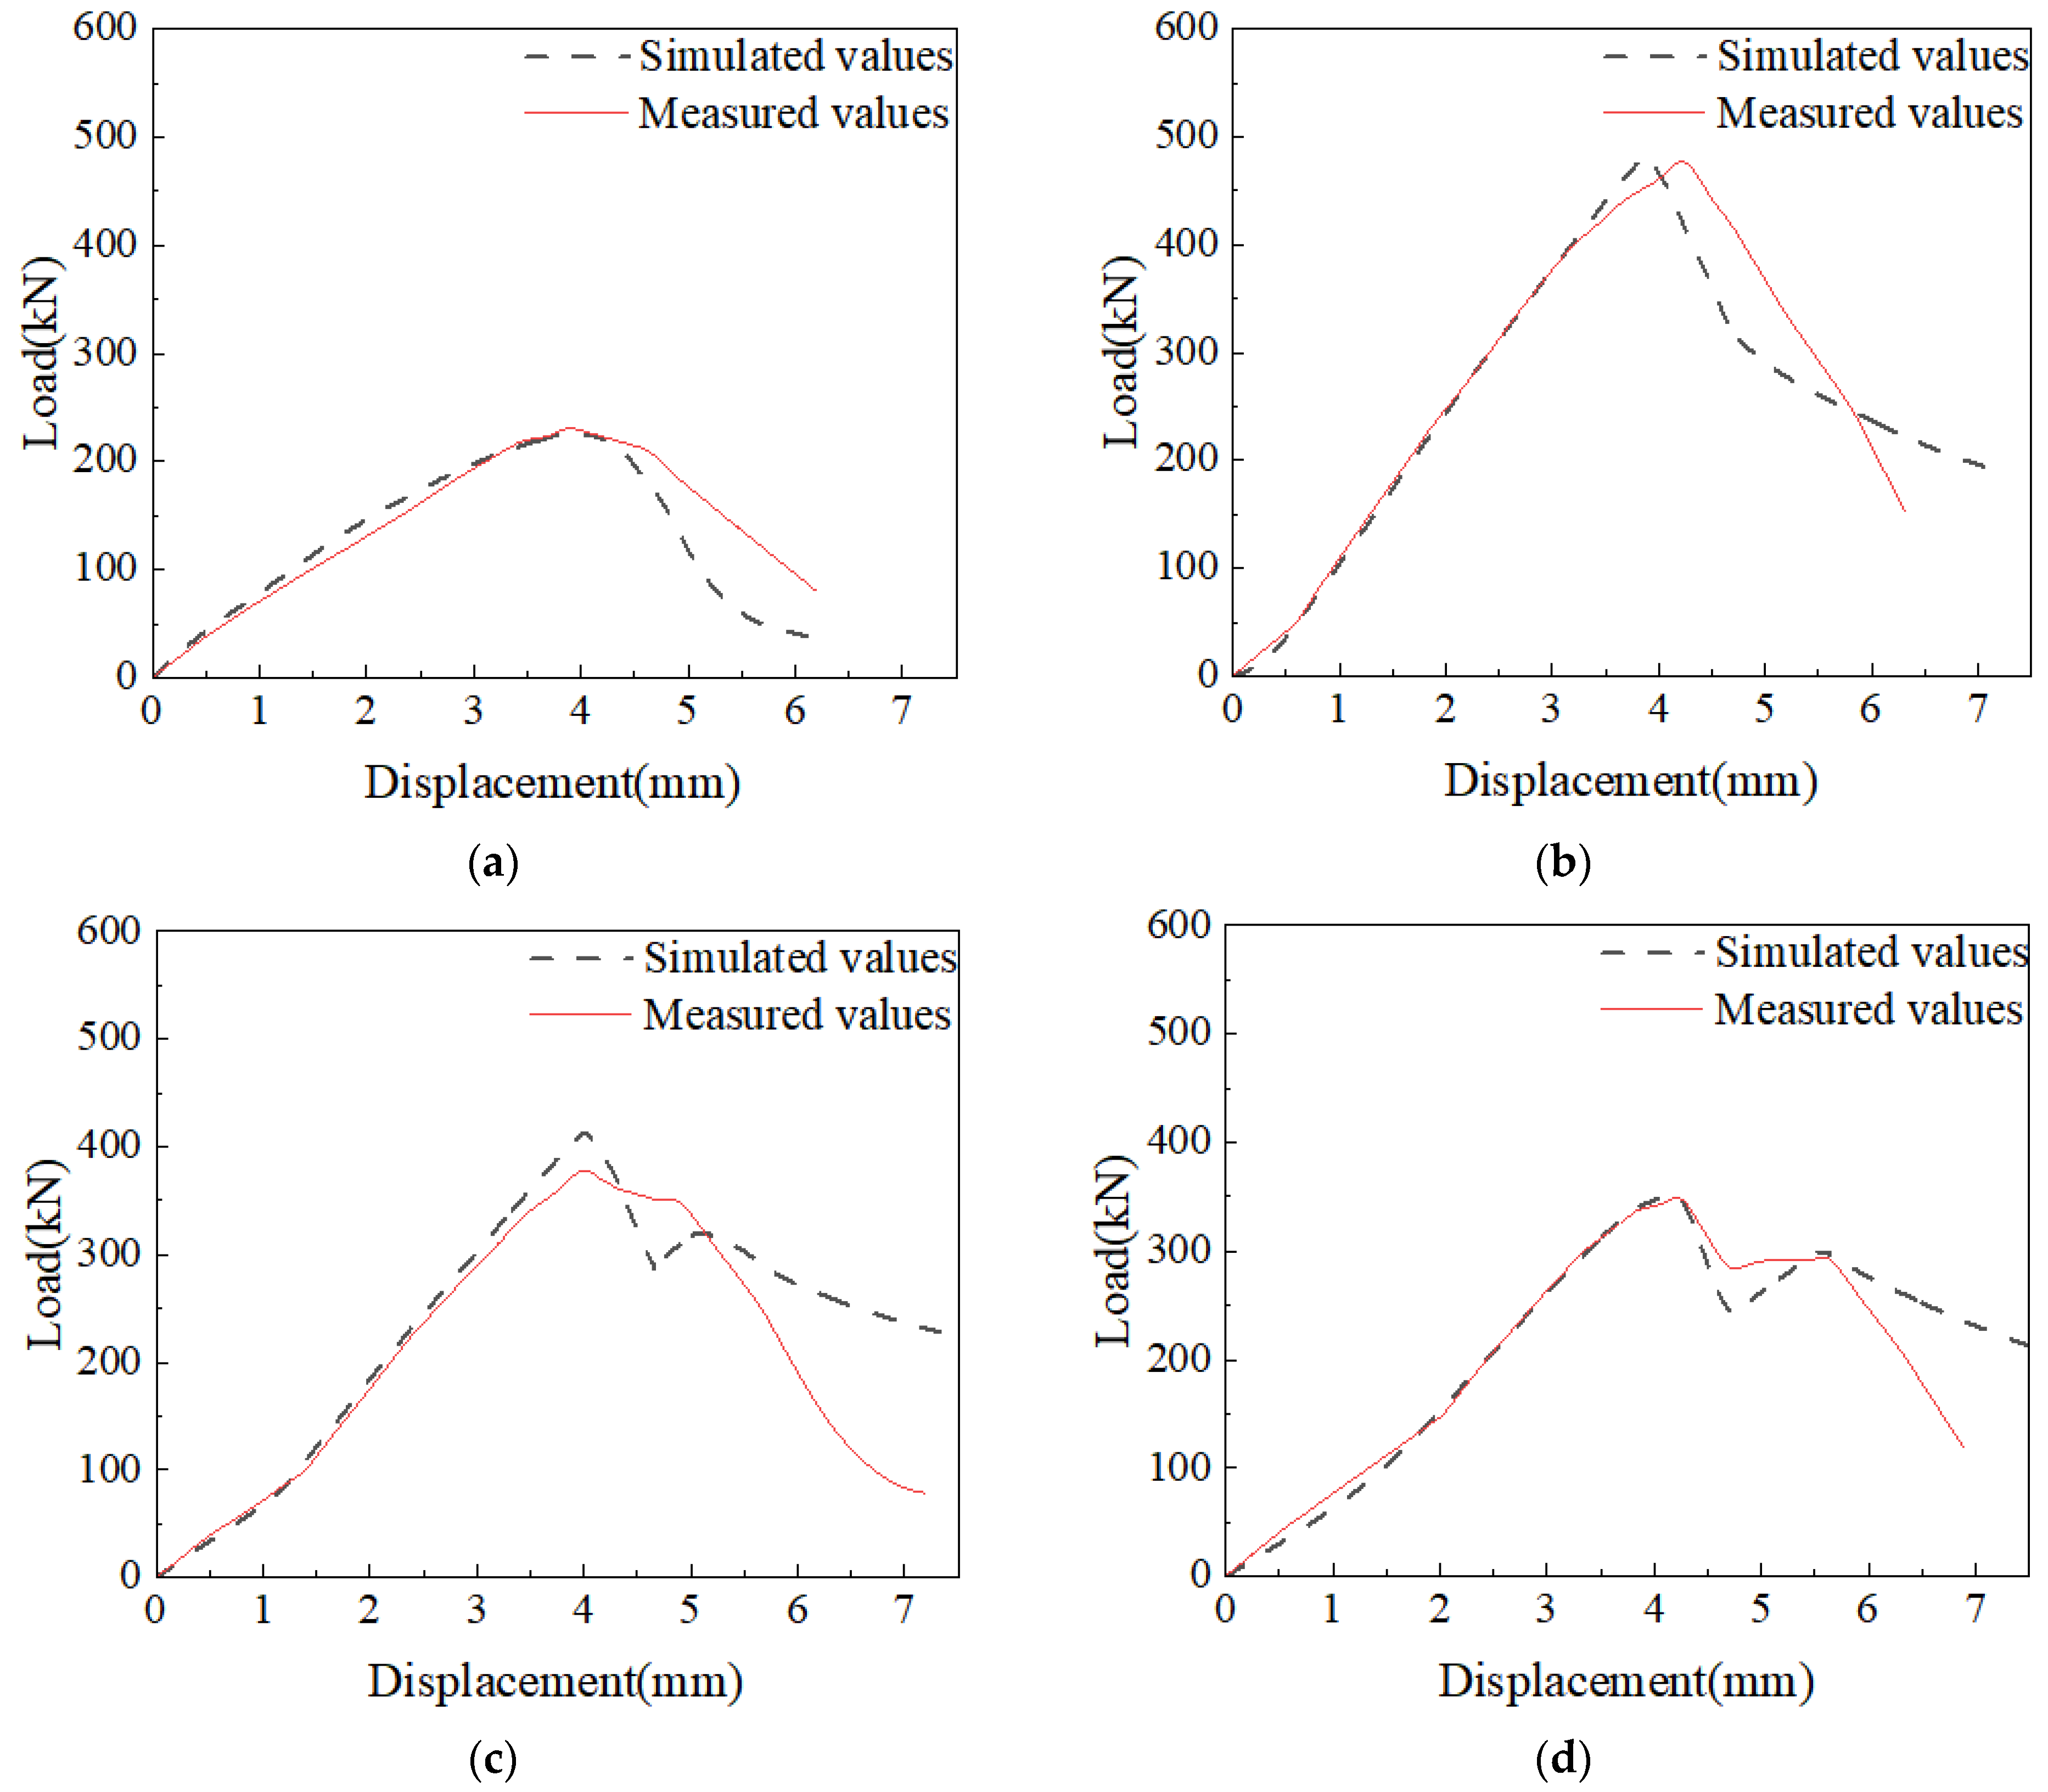
4.2.2. Comparison of Load–Displacement Curves

To validate the finite-element model, the load–displacement curves obtained from the finite-element simulation and the experimental test were compared, as illustrated in the following Figure 9, Figure 10 and Figure 11:
It was observed that the variation pattern of the two curves is similar. It is evident that the channel steel has not reached its limit after the failure of the brick column, with an initial stress levels of 40% and 60%. Consequently, the load–displacement curve shows an increase in load-carrying capacity after the peak load. Comprehensive analysis indicates that the rising section of the curve predicted by the finite-element model aligns well with the measured test results. However, the falling section shows slight differences due to three main reasons:
  • The viscous parameters in the concrete and plastic damage constitutive model were simulated to be small to meet accuracy requirements, causing the bearing capacity of the brick column to decrease faster than in the test;
  • In the finite-element simulation, the “life and death element method” was not used, so the masonry elements were not deleted after reaching ultimate strength and continued to participate in the overall structure’s calculation;
  • Accidental eccentricity of the load in the test, initial bending of the specimen, uneven material properties, and other factors caused the channel steel to buckle faster. As a result, some specimens did not show an increase in load-carrying capacity after the peak load.

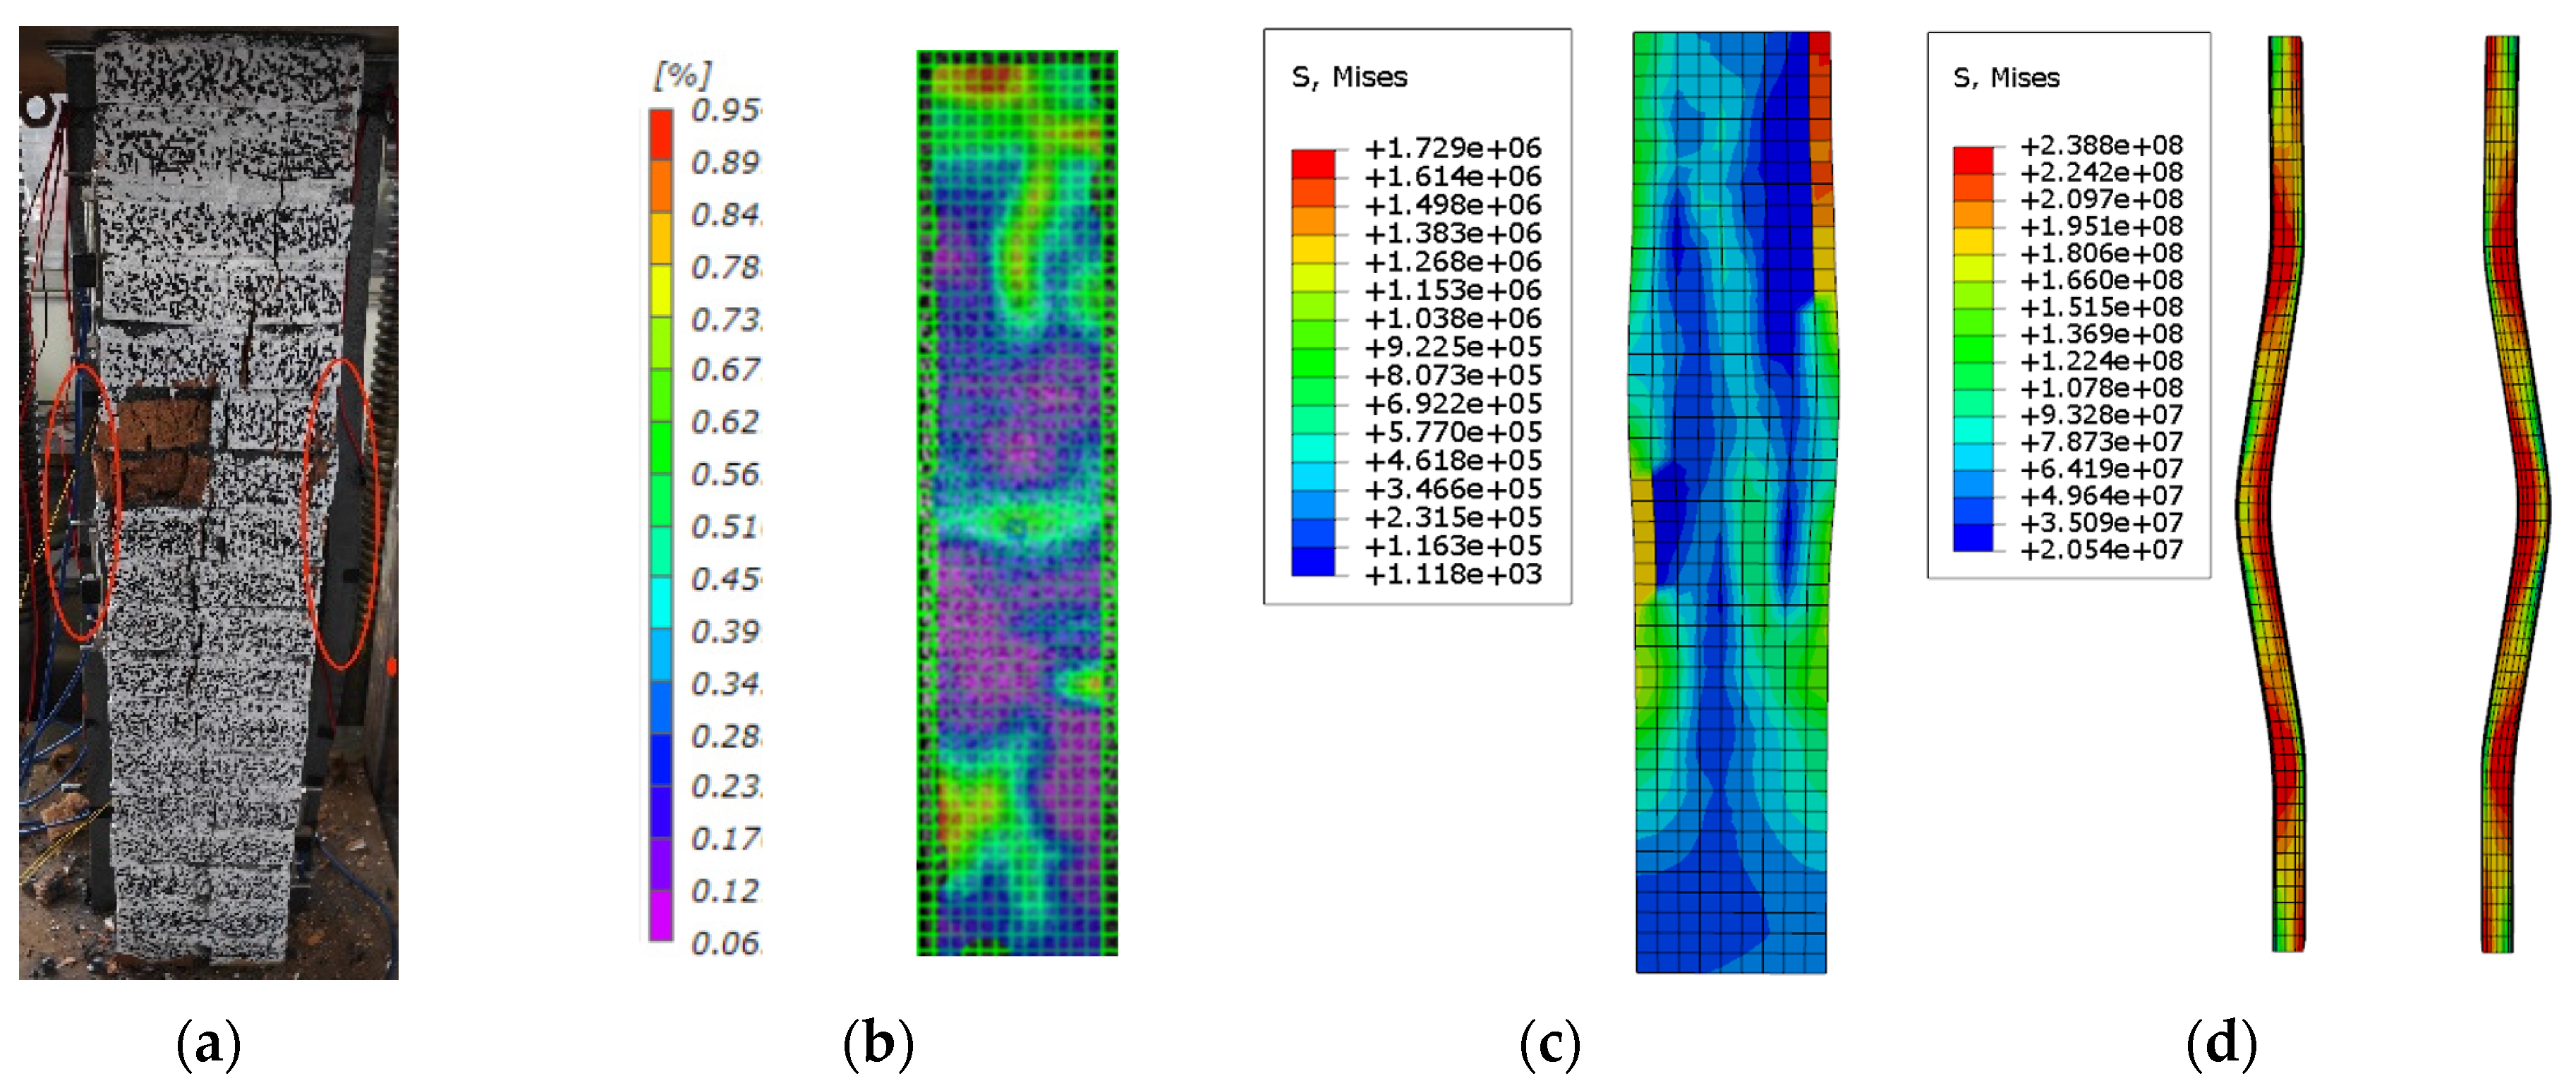
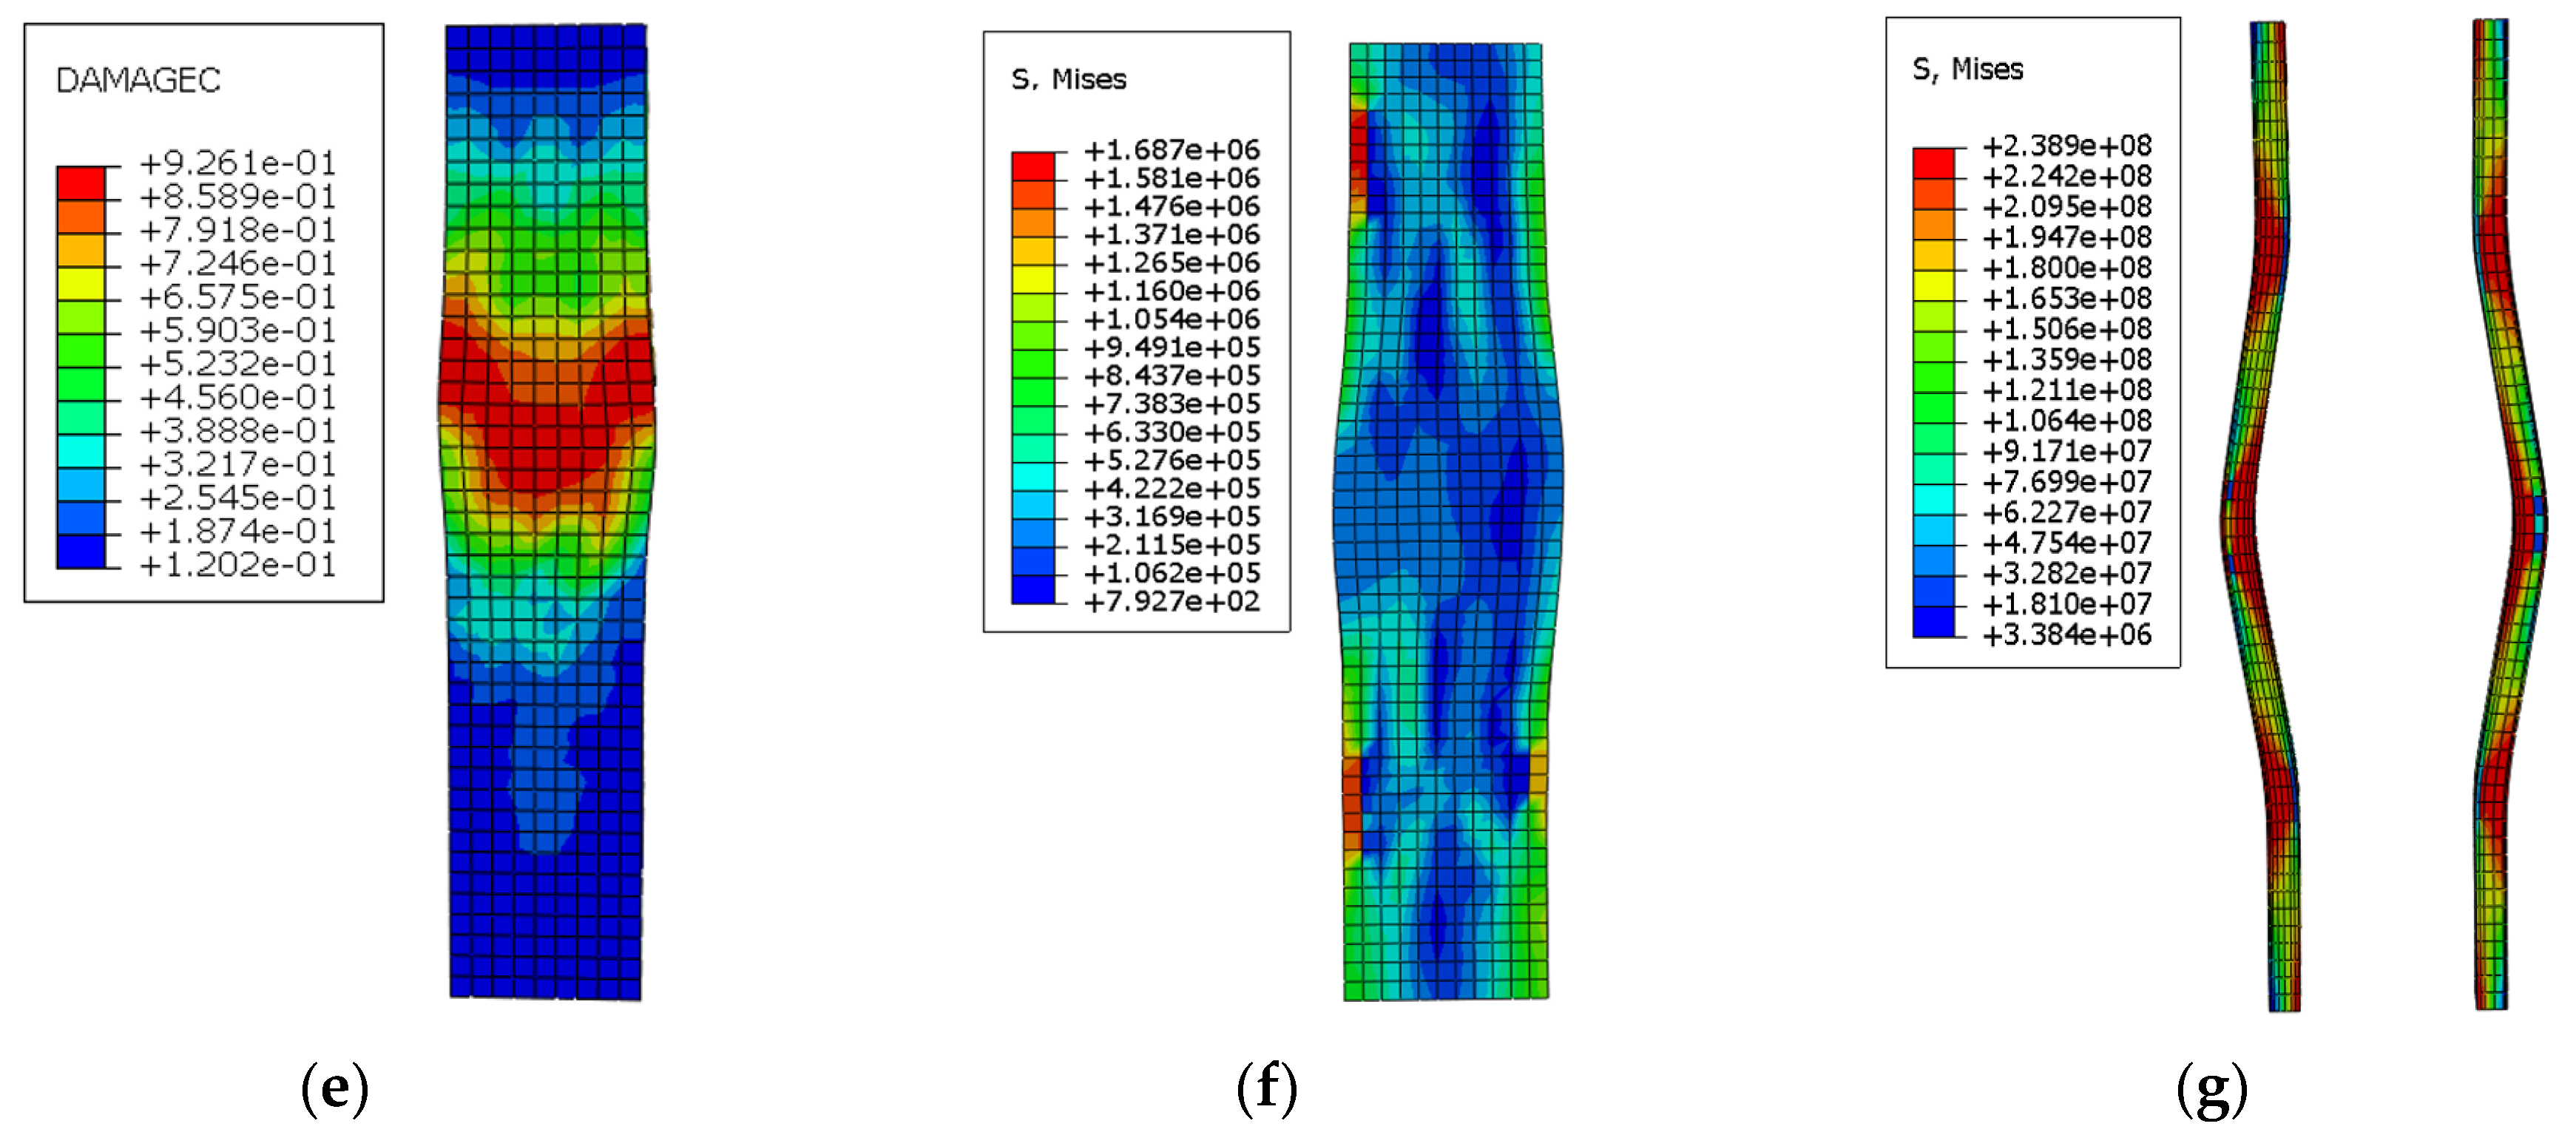
4.2.3. Comparison of Cloud Images

The contour diagram obtained from finite-element simulation is the most intuitive indicator of its accuracy. To further verify the finite-element model, contour maps from the finite-element simulation were compared with experimental and DIC monitoring results. A finite-element model with a grid size of 0.02 was established for a brick column, channel steel, and wall screw. The stress contour diagrams were then compared and analyzed, as shown in Figure 12 and Figure 13.
The analysis of the stress contours shows that the contour diagram obtained from finite-element simulation aligns with the failure phenomenon of the brick column and the deformation of the channel steel observed in the test. Comparing different mesh sizes revealed that the difference in the stress contours is minimal, indicating that the stress level remains unchanged when the mesh size is reduced.
Based on the analysis of the ultimate bearing capacity comparison, load–displacement curve comparison, and specimen contour analysis results, it is evident that the model presented in this paper is effective. Therefore, the proposed finite-element model can be utilized to examine the axial compressive performance of channel steel-reinforced brick columns in service further.

4.3. Finite-Element Extended Parameter Analysis Results

Based on the validated finite-element model, the parameters were studied to obtain more numerical data on the channel-reinforced brick column under axial pressure. This study covers a wider range of brick columns and channel steel sizes to further verify the formula. Table 5 presents the geometric information of each model and the axial bearing capacity results of different brick columns, channel steel sizes, and initial stress states obtained through finite-element simulation. The material properties of each component in the table are based on the measured results in Section 2.2.

5. Theoretical Analysis of the Calculation Method of Axial Compressive Bearing Capacity of Channel Steel-Reinforced Column

5.1. Influencing Factors of Bearing Capacity of Reinforced Structures

  • The reinforcement structure comprises a composite configuration where the external load is shared between the original masonry and the newly introduced channel steel. However, there arises an issue of cohesive interaction between the two components;
  • The stiffness of the composite structure, formed post channel reinforcement, is significantly enhanced in comparison to the original structure;
  • The reinforcement structure is a secondary stress-bearing system wherein the original column initially carries a load prior to reinforcement, leading to a certain level of strain accumulation. The strain in the newly added channel steel lags behind the cumulative strain of the masonry. Consequently, even as the masonry undergoes damage, the channel steel has yet to surpass its yield limit, buckling only after sustained loading;
  • Given the considerable height and thickness of the reinforced structure, the stability aspect warrants careful consideration;
  • Although external channel steel imposes lateral constraints on the masonry column, it does not subject the column to triaxial compression. Thus, while the channel steel’s constraint mildly affects the masonry strength, the impact is deemed negligible and hence omitted from consideration.

5.2. Formula for Calculating Bearing Capacity

5.2.1. Basic Assumptions

After reinforcement, the whole component can still deform relatively synchronously. The brick column, the external channel steel, and the wall screw do not slip and can bear the load together. The cross-section still conforms to the flat cross-section assumption, the axial force of each parallel cross-section remains consistent, and the material adheres to the stress–strain relationship mentioned above.

5.2.2. Derivation of the Formula for Calculating Bearing Capacity

The reinforced structure studied in this paper is an in-service reinforced column that is a secondary stressed structure with an initial load. The designed bearing capacity of the reinforced member comprises two parts: the initial load N 0 and the axial force N 1 of the reinforced secondary stressed composite structure.
N = N 0 + N 1
Upon completion of the reinforcement, the structure consists of two parts: the brick column and the channel steel. Therefore, the design value of the bearing capacity comprises the axial force borne by the secondary stressed brick column after reinforcement and the axial force obtained by the channel steel. From the above analysis, it is evident that when calculating the bearing capacity of the reinforced components, the external force borne by the external channel steel and the original components should be distributed according to their respective stiffness proportions and then calculated separately. This approach refers to the calculation method for the axial bearing capacity of the outer section steel-reinforced brick columns in the Code for the Design of Masonry Structure Reinforcement (GB 50702-2011) [32]. The following formula is obtained:
N m 1 = E m 0 A m 0 E m 0 A m 0 + E a A a N 1
N s a = N 1 N m 1
where E m and E a are the elastic modulus of the original masonry and the new channel steel, respectively; A m and A a are the full cross-sectional area of the original masonry and the new section steel, respectively.
From the results of the above test and finite-element analysis, it is evident that when the reinforced structure is damaged, the stress in the original column masonry reaches its design value f m , and the load reaches the design value of the axial force of the bearing capacity N m . However, the axial force N s a in the channel steel is less than its designed bearing capacity N 1 . This indicates that the axial force N m 1 of the secondary force after reinforcement is determined by Z, so it can be obtained as follows:
N 1 = E m A m + E s A s E m A m N m 1
Substituting Equation (6) into Equation (3) yields the following:
N = N m 0 + E m A m + E s A s E m A m N m 1
The simplification yields the following:
N = N m + E s A s E m A m N m 1
Let α N = N m 0 / N m be the ratio of the initial load N 0 of the original masonry column to the design value of the original bearing capacity N m to the following:
N N m + ( 1 α N ) E s A s E m A m N m
If the axial force N s a in the channel steel reaches its design bearing capacity N s before the failure of the reinforced structure, and the channel steel is in the yield stage, it is clear that the ductility of the channel steel is much greater than that of the brick column. The strain in the channel steel is far from the required strain for strengthening when it is continuously loaded until the brick fails. Therefore, it can be considered that the limit is the yield strength. Consequently, the axial force N s a limit of the channel steel is the design value of the bearing capacity N s , which is obtained as follows:
N = N m + N s
The design value N m of the bearing capacity of the original masonry column is expressed as given:
N m = φ f m A m
where φ is the influence coefficient of the bearing capacity of the compressive member of the masonry structure, calculated according to the Code for the Design of Masonry Structure (GB5003-2011) [27]; f m is the design value of the compressive strength of the masonry, and the average values of the compressive strength of the masonry are taken in this paper, and it is calculated as follows:
f m = 0.78 f 1 0.5 ( 1 + 0.07 f 2 )
Among them, f 1 and f 2 were taken from the measured compressive strength of bricks and mortar in this test, respectively; A m is the cross-sectional area of the masonry column.
The design value N s of the bearing capacity of the external channel steel is expressed as follows:
N s = φ s f s A s
φ s is the influence coefficient of the compressive bearing capacity of the channel steel (take the smaller of the stability coefficients of the two main axes of the cross-section) according to the slenderness ratio of the component (or the converted slenderness ratio) and the yield strength of the steel and the cross-section classification in the “Steel Structure Design Standard” (GB50017-2017) [33].
The slenderness ratio λ should be calculated according to its instability mode, and the instability mode of the channel steel can be known from the test and finite-element analysis results. When the bending buckling is calculated, the slenderness ratio λ is calculated according to the following formula:
λ x = l 0 x i x
λ y = l 0 y i y
where l 0 x and l 0 y are the calculated lengths (mm) of the channel steel to the cross-section spindle x and y, respectively; from the test and finite-element analysis results, it can be seen that when the channel steel is bent and buckled around the x-axis due to the constraint of the wall screw and the brick column; it only occurs between the wall screws, so l 0 x is taken as the wall screw spacing. When the channel steel is bent and buckled around the y-axis and when the number of wall screws is two, l 0 y is the length of the channel steel; when the number of wall screws is greater than two, the buckling form is analyzed [34], and l 0 y is twice the wall screw spacing; i x and i y are, respectively, the channel steel cross-section to the spindle x and y radius of rotation (mm); f s is the design value of compressive strength of channel steel; A s is the cross-sectional area of the channel steel.
To summarize, the calculation formula of the bearing capacity of the in-service brick column reinforced by channel steel is obtained:
N = N m + ( 1 α N ) E s A s E m A m N m N s a N s N m + φ s f s A s N s a > N s
N s a = ( 1 α N ) E s A s E m A m N m

6. Theoretical Calculation of Axial Compressive Capacity Compared with Test and Finite-Element Calculation

To verify the practical calculation formula proposed in this paper, the theoretical calculation results were compared with experimental and finite-element simulation results, as shown in Table 5 and Table 6. The average value of the ratio of the experimental value to the theoretical value is 1.06, and the coefficient of variation is 0.051. The average ratio of the simulated value to the theoretical value is 0.99, and the coefficient of variation is 0.043.
The correlation between different initial stress levels and the theoretical bearing capacity corresponding to the height-to-thickness ratio is obtained by Equation (16). The calculation results, test results, and finite-element simulation results are compared in Table 6, demonstrating that the theoretical values closely match the experimental and simulation values, thereby validating the formula. At the same time, the calculation results are drawn into three-dimensional scatter plots for comparison, as shown in Figure 14, the results show that the theoretical values are in good agreement with the experimental values and the finite element simulation values, which further proves the correctness of the formula.

7. Discussion and Outlook

Research on the technology of channel steel reinforcement of brick columns is still in its initial stage, with limited research and insufficient test volume.
The results indicate a negative correlation between the initial stress level and the height-thickness ratio of the column with the axial compressive performance of the reinforced column. The initial stress level has a more significant impact on the axial compressive performance than the height/thickness ratio. The paper provides a calculation formula for the bearing capacity of the long column of in-service brick masonry reinforced with channel steel.
Due to time and resource conditions, this paper focuses solely on the axial compressive capacity of the reinforced column. However, considering the stress characteristics and structural features of reinforced columns, future research should include eccentric compression and seismic studies.
The author believes that extending research to analyze the performance of channel-reinforced brick columns under eccentric compression and their response and failure mechanisms under seismic conditions will enhance the application of channel steel-reinforced brick column technology in a broader range of engineering scenarios.

8. Conclusions

Through the axial compressive performance test of 12 brick columns and the finite-element simulation study of 26 brick columns, the following conclusions can be drawn:
  • The use of channel steel to reinforce brick columns significantly enhances their axial load capacity. In the tests, the load-bearing capacity of the specimens increased by 107% and 51.3% at maximum and minimum, respectively. The initial stress level and the height-to-thickness ratio significantly affect the bearing capacity of the reinforced specimens. The ultimate load of the specimens decreases as these two factors increase. The initial stress level has a greater impact on the reinforcement effect than the height-to-thickness ratio;
  • The failure mode of the external channel steel is bending buckling instability. However, due to the good ductility of the channel steel, it fails later than the brick column. This indicates that channel steel reinforcement does not pose a danger to the masonry column due to its own instability, further proving the effectiveness of the external channel reinforcement method;
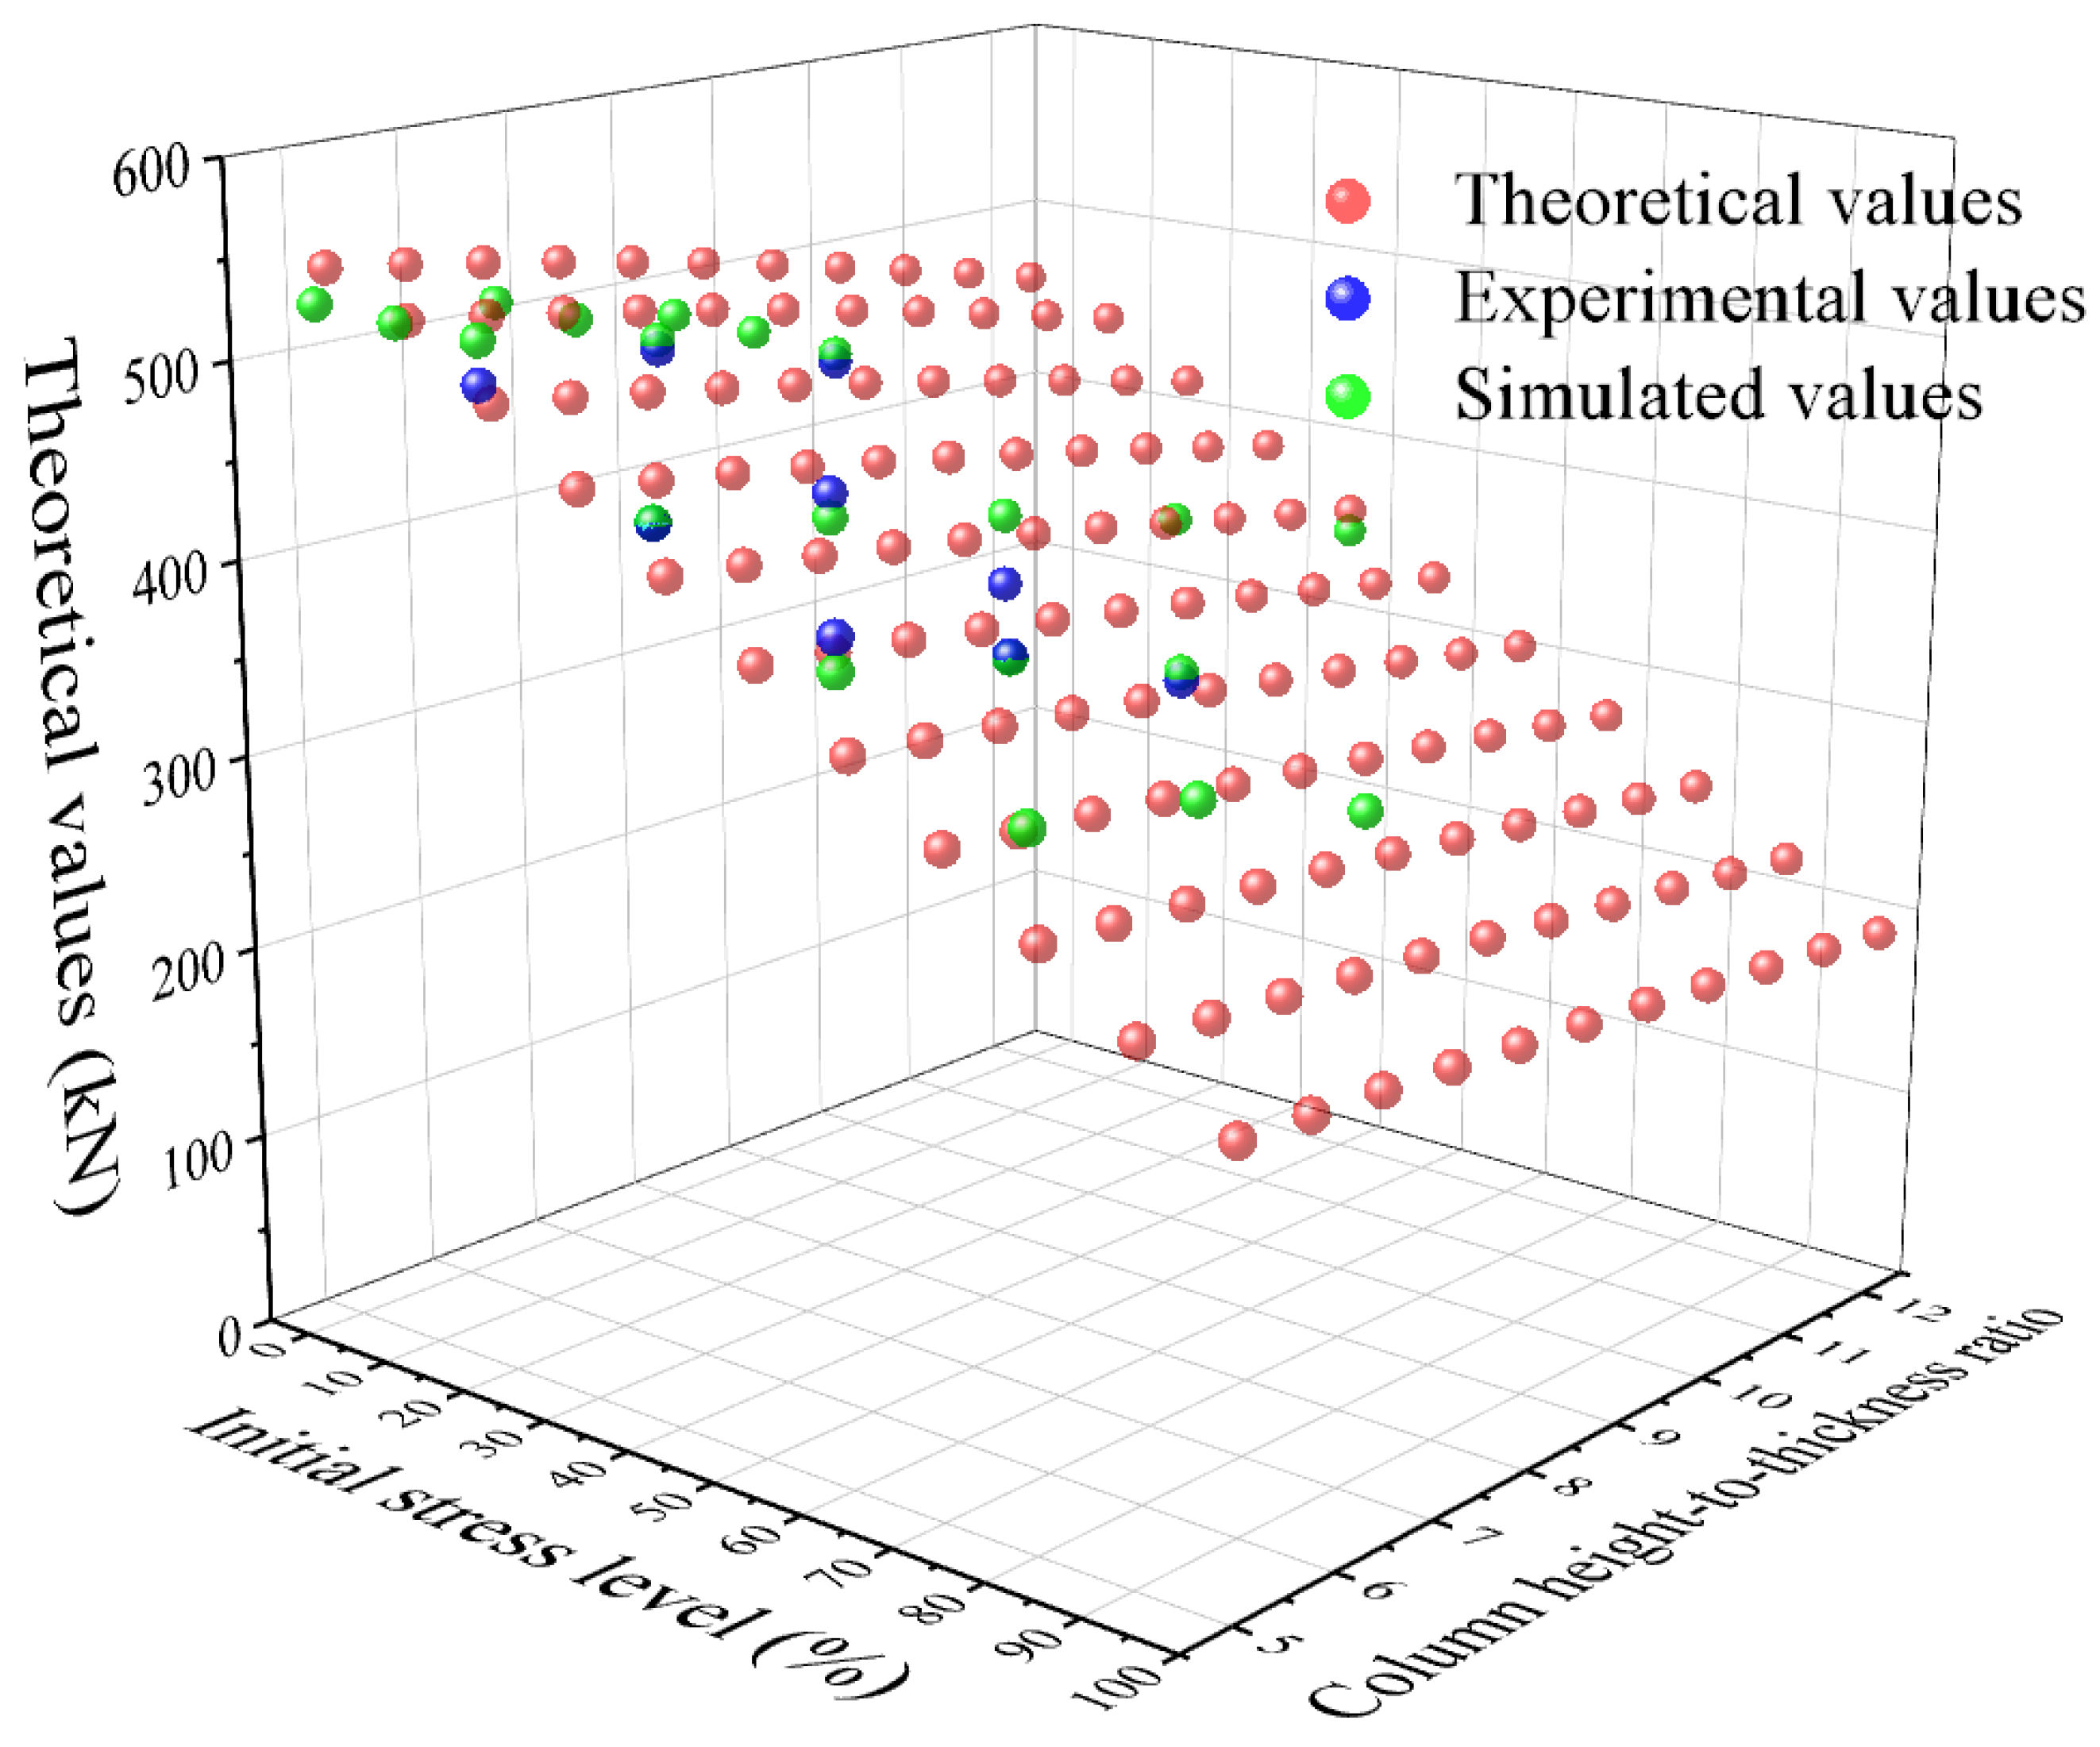
  • A calculation method for the axial compressive bearing capacity of reinforced brick columns with external channel steel, considering the initial stress state, is proposed based on the axial compressive bearing capacity calculation theory of the outer section steel reinforcement method. When compared with test and finite-element simulation results, the average ratio between the experimental value and the theoretical value is 1.06 with a coefficient of variation of 0.051. The average ratio of the simulated value to the theoretical value is 0.99, with a coefficient of variation of 0.029.

Author Contributions

Conceptualization, K.C.; methodology, K.C.; software, Y.A.; validation, K.C. and Y.A.; formal analysis, K.C. and Y.A.; investigation, K.C. and Y.A.; resources, K.C. and Y.A.; data curation, K.C. and Y.A.; writing—original draft preparation, K.C.; writing—review and editing, K.C.; visualization, K.C. and J.L.; supervision, Y.A. and J.L.; project administration, K.C. All authors have read and agreed to the published version of the manuscript.

Funding

This research was funded by the Young Teacher Development Program of Changsha University of Science and Technology, grant number 3020102|122500103.

Data Availability Statement

The manuscript data used to support the findings of this study are available from the corresponding author upon request.

Conflicts of Interest

The authors declare no conflicts of interest.

References

  1. Zhang, Z.; Ren, X.; Niu, Q.; Zhang, Y.; Zhao, B. Durability degradation simulation of RC structure based on gamma process considering two-dimensional chloride diffusion and life probabilistic prediction. Structures 2022, 48, 159–171. [Google Scholar] [CrossRef]
  2. Zhang, Z.; Cao, F.; Yang, J.; He, Z. Experiment on Natural Frequency Change of Reinforced Concrete Members under Low Cycle Loading. Shock Vib. 2018, 6504519. [Google Scholar] [CrossRef]
  3. Sathiparan, N. Mesh type seismic retrofitting for masonry structures: Critical issues and possible strategies. Eur. J. Environ. Civ. Eng. 2015, 19, 1136–1154. [Google Scholar] [CrossRef]
  4. Niasar, A.N.; Alaee, F.J.; Zamani, S.M. Experimental investigation on the performance of unreinforced masonry wall, retrofitted using engineered cementitious composites. Constr. Build. Mater. 2020, 239, 117788. [Google Scholar] [CrossRef]
  5. Park, S.-H.; Dinh, N.H.; Kim, S.-H.; Hwang, J.-W.; Pham, H.H.; Lee, S.-J.; Choi, K.-K. Seismic retrofit of unreinforced masonry walls using precast panels of fiber-reinforced cementitious composite. J. Build. Eng. 2022, 53, 104548. [Google Scholar] [CrossRef]
  6. Dong, F.; Wang, H.; Jiang, F.; Xing, Q.; Yu, J. In-plane shear behavior of masonry panels strengthened with ultra-high ductile concrete (UHDC). Eng. Struct. 2022, 252, 113609. [Google Scholar] [CrossRef]
  7. Deng, M.; Li, T.; Fan, X. Experimental investigation on axial compression of brick columns strengthened with HDC. Eng. Mech. 2019, 36, 92–99. [Google Scholar]
  8. Zhang, S. Research on Mechanical Performance of Ultra-High Ductility Concrete Reinforced Masonry Structure; University of Jinan: Jinan, China, 2022. [Google Scholar]
  9. Zhang, Z.; Paul, C.P.; Panda, B.; Huang, Y.; Garg, A.; Zhang, Y.; Garg, A.; Zhang, W. Assessment of flexural and splitting strength of steel fiber reinforced concrete using automated neural network search. Adv. Concr. Constr. 2020, 10, 81–92. [Google Scholar]
  10. Nezhad, R.S.; Kabir, M.Z. Experimental investigation on out-of-plane behavior of GFRP retrofitted masonry panels. Constr. Build. Mater. 2017, 131, 630–640. [Google Scholar] [CrossRef]
  11. Gilstrap, J.M.; Dolan, C.W. Out-of plane bending of FRP-reinforced masonry walls. Compos. Sci. Technol. 1998, 58, 1277–1284. [Google Scholar] [CrossRef]
  12. Carloni, C.; Focacci, F. FRP-masonry interfacial debonding: An energy balance approach to determine the influence of the mortar joints. Eur. J. Mech. A/Solids 2016, 55, 122–133. [Google Scholar] [CrossRef]
  13. Sneed, L.H.; Baietti, G.; Fraioli, G.; Carloni, C. Compressive behavior of brick masonry columns confined with steel-reinforced grout jackets. J. Compos. Constr. 2019, 23, 04019037. [Google Scholar] [CrossRef]
  14. Di Ludovico, M.; D’ambra, C.; Prota, A.; Manfredi, G. FRP confinement of tuff and clay brick columns: Experimental study and assessment of analytical models. J. Compos. Constr. 2010, 14, 583–596. [Google Scholar] [CrossRef]
  15. Soudki, K.; Alkhrdaji, T. Guide for the design and construction of externally bonded FRP systems for strengthening concrete structures (ACI 440.2 R-02). In Proceedings of the Structures Congress 2005: Metropolis and Beyond, New York, NY, USA, 20 April 2005; pp. 1–8. [Google Scholar]
  16. Fossetti, M.; Minafò, G. Comparative experimental analysis on the compressive behavior of masonry columns strengthened by FRP, BFRCM or steel wires. Compos. Part B Eng. 2017, 112, 112–124. [Google Scholar] [CrossRef]
  17. Estevan, L.; Torres, B.; Baeza, F.; Varona, F.; Ivorra, S. Masonry walls strengthened with Textile Reinforced Mortars (TRM) and subjected to in-plane cyclic loads after real fire exposure. Eng. Struct. 2023, 296, 116922. [Google Scholar] [CrossRef]
  18. Murtyl, C.V.R.; Dutta, J.; Agrawal, S.K. Twin Lintel belt in steel for seismic strengthening of brick masonry building. Earthq. Eng. Eng. Vib. 2004, 32, 327–334. [Google Scholar] [CrossRef]
  19. Azandariani, M.G.; Mohebkhah, A. A multi-strut model for the hysteresis behavior and strength assessment of masonry-infilled steel frames with openings under in-plane lateral loading. Eng. Struct. 2024, 302, 117433. [Google Scholar] [CrossRef]
  20. Zhang, X.; Zhang, Y.; Shan, R.; Bai, Y.; Zhang, Z. Application on bending performance of annular concrete-filled steel tube stent. J. Constr. Steel Res. 2020, 168, 105984. [Google Scholar] [CrossRef]
  21. Gregori, A.; Mercuri, M.; Angiolilli, M.; Pathirage, M. Simulating defects in brick masonry panels subjected to compressive loads. Eng. Struct. 2022, 263, 114333. [Google Scholar] [CrossRef]
  22. GB/T 2542-2012; Test Method for Wall Bricks. China Federation of Building Materials, Standards Press of China: Beijing, China, 2012. (In Chinese)
  23. JGJ/T 70-2009; Standard for Basic Performance Test Methods of Building Mortar. Ministry of Housing and Urban-Rural Development of the People’s Republic of China, China Architecture & Building Press: Beijing, China, 2009. (In Chinese)
  24. GB/T 228.1-2021; Metal Materials Tensile Test Part 1: Room Temperature Test Method. National Steel Standardization. Technical Committee, Standards Press of China: Beijing, China, 2021. (In Chinese)
  25. Lee, J.; Pande, G.; Middleton, J.; Kralj, B. Numerical modeling of brick masonry Panels subject to lateral loading. Comput. Struct. 1996, 61, 735–745. [Google Scholar] [CrossRef]
  26. Smith, M. ABAQUS/Standard User’s Manual; Providence: Dassault Systèmes Simulia Corp: Paris, France, 2002. [Google Scholar]
  27. GB 50003-2011; Code for the Design of Masonry Structures. Ministry of Housing and Urban-Rural Development of the People’s Republic of China, China Architecture & Building Press: Beijing, China, 2011. (In Chinese)
  28. Liu, G.Q. The Research on the Basic Mechanical Behavior of Masonry Structure; Hunan University: Changsha, China, 2005. [Google Scholar]
  29. Wang, B.; Dong, J. Nonlinear finite element analysis of masonry wall using damaged plasticity mode. J. Disaster Prev. Mitig. Eng. 2014, 34, 216–222. [Google Scholar]
  30. Yang, W. Constitutive relationship model for masonry materials in compression. Build. Struct. 2008, 10, 80–82. [Google Scholar]
  31. Zheng, N. Research on Seismic Behavior of Masonry Structures with Fabricated Tie-Columns; Chongqing University: Chongqing, China, 2010. [Google Scholar]
  32. GB 50702-2011; Code for Design of Masonry Structure Reinforcement. Ministry of Housing and Urban-Rural Development of the People’s Republic of China, China Architecture & Building Press: Beijing, China, 2011. (In Chinese)
  33. GB 50017-2017; Steel Structure Design Standard. Ministry of Housing and Urban-Rural Development of the People’s Republic of China, China Architecture & Building Press: Beijing, China, 2011. (In Chinese)
  34. Muvdi, B.B.; Elhouar, S. Mechanics of Materials; Taylor and Francis: Oxford, UK, 2015. [Google Scholar]
Figure 1. External channel steel reinforcement in actual engineering.
Buildings 14 01794 g001
Figure 2. Schematic diagram of typical compressive specimen size and reinforcement (unit/mm).
Buildings 14 01794 g002
Figure 3. (a) Field diagram of 1080 mm column loading device; (b) schematic diagram of 1080 mm column loading device.
Buildings 14 01794 g003
Figure 4. Typical specimen failure diagram: (a) Z1; (b) Z4; (c) Z5; (d) Z7; (e) Z10; (f) Z12.
Buildings 14 01794 g004aBuildings 14 01794 g004bBuildings 14 01794 g004c
Figure 5. Load–displacement curve: (a) unreinforced columns; (b) 1080 mm column; (c) 1440 mm column; (d) 1800 mm column.
Buildings 14 01794 g005
Figure 6. (a) Effect of the initial stress level on the peak load; (b) effect of column height/thickness ratio on peak loads.
Buildings 14 01794 g006
Figure 7. Load–lateral displacement curve.
Buildings 14 01794 g007
Figure 8. Finite-element model of 1080 mm reinforced column: (a) brick columns; (b) steel members for reinforcement; (c) pad; (d) reinforcement of the entire column.
Buildings 14 01794 g008
Figure 9. Comparison of the whole process of axial compression of 1080 mm column: (a) Z1; (b) Z2; (c) Z3; (d) Z4.
Buildings 14 01794 g009
Figure 10. Comparison of the whole process of axial compression of 1440 mm column: (a) Z5; (b) Z6; (c) Z7; (d) Z8.
Buildings 14 01794 g010aBuildings 14 01794 g010b
Figure 11. Comparison of the whole process of axial compression of 1800 mm column: (a) Z9; (b) Z10; (c) Z11; (d) Z12.
Buildings 14 01794 g011
Figure 12. Comparison of Z2 contour: (a) trial; (b) DIC; (c) brick columns stress contour; (d) channel steel stress contour; (e) brick column damage contour; (f) 0.02 grid size brick column stress contour; (g) 0.02 grid size channel stress contour.
Buildings 14 01794 g012aBuildings 14 01794 g012b
Figure 13. Comparison of Z4 contour: (a) trial; (b) DIC; (c) brick columns stress contour; (d) channel steel stress contour; (e) brick column damage contour; (f) 0.02 grid size brick column stress contour; (g) 0.02 grid size channel stress contour.
Buildings 14 01794 g013
Figure 14. Comparison of the theoretical and experimental and simulation results of the bearing capacity corresponding to different initial stress levels and height-to-thickness ratios.
Buildings 14 01794 g014
Table 1. The design scheme of test members.
Specimen NumberHeight/(mm)Initial Stress Level
Z11080Unreinforced, comparison specimens
Z2108020%
Z3108040%
Z4108060%
Z51440Unreinforced, comparison specimens
Z6144020%
Z7144040%
Z8144060%
Z91800Unreinforced, comparison specimens
Z10180020%
Z11180040%
Z12180060%
Table 2. Compression column test results.
Specimen NumberUltimate Load/(kN)Increase in Magnitude
/(%)
Peak Pressure Strain/(με)Increase in Magnitude/(%)Ultimate Pressure Strain/(με)Increase in Magnitude/(%)
Z1260/1865/2435/
Z250393.51739−6.82335−4.1
Z345474.620359.125986.7
Z441961.21824−2.22381−2.2
Z5251/1637/2112/
Z6502100.017527.021833.4
Z744778.1187514.522496.5
Z838653.8180610.32309i9.3
Z9230/1969/2418/
Z10476107.01771−10.12237−7.5
Z1137864.31761−10.62296−5.0
Z1234851.31812−8.024400.9
Table 3. The strain relationship between the middle part of the channel steel and the wall screw.
Specimen NumberTypes of Steel MembersPeak Loads Corresponding to Strains/(με)Extreme Strain/(με)Corresponding Loads/(kN)
Z2Channel15431666484
Wall screws761828
Z3Channel11061756451
Wall screws215861
Z4Channel7231671336
Wall screws315706
Z6Channel15841686476
Wall screws758914
Z7Channel10681780775
Wall screws241852
Z8Channel6981846336
Wall screws186928
Z10Channel16181700408
Wall screws686840
Z11Channel11581834342
Wall screws148762
Z12Channel7381646290
Wall screws282784
Table 4. Comparison results between measured and simulated measurements.
Specimen NumberMeasured Values
/kN
Simulated Values/kNMeasured Value/Simulated Value
Z1260232.11.12
Z2503524.80.96
Z3454454.11.00
Z4419402.81.04
Z5251224.91.11
Z6502506.70.99
Z7447434.91.03
Z8386385.21.00
Z9230216.71.06
Z10476480.10.99
Z11378413.20.91
Z12348352.30.99
Table 5. Parameters expansion analysis results of channel steel-reinforced brick columns.
Specimen NumberH/mmh × b/mmChannel Steel NumberInitial StressSimulated Values/kNTheoretical Values/kNSimulated Values/Theoretical Values
ZM11080220 × 220//232.1239.10.97
ZM21080220 × 220#50527.3545.00.97
ZM31080220 × 220#510525.6526.31.00
ZM41080220 × 220#580290.0296.00.98
ZM51440220 × 220//224.9224.70.94
ZM61440220 × 220#50510.6530.60.96
ZM71440220 × 220#510509.3512.30.99
ZM81440220 × 220#580274.6288.60.95
ZM91800220 × 220//216.7217.30.96
ZM101800220 × 220#50485.1513.20.95
ZM111800220 × 220#510483.6495.60.98
ZM121800220 × 220#580236.4279.10.92
ZM132200220 × 220#540386.9385.41.00
ZM142640220 × 220#540353.7364.50.94
ZM153300240 × 370//330.8341.80.91
ZM163300240 × 370#520576.5551.81.04
ZM173300240 × 370#540525.1499.31.05
ZM183300240 × 370#560461.1446.81.03
ZM193300240 × 370#820672.1652.21.03
ZM203300240 × 370#840605.8574.61.05
ZM213300240 × 370#860504.5497.01.02
ZM224200480 × 480//1002.61020.90.97
ZM234200480 × 480#8201403.81378.31.02
ZM244200480 × 480#8401355.61288.91.05
ZM254200480 × 480#8601238.21199.61.03
ZM264200480 × 480#12201597.81556.91.03
ZM274200480 × 480#12401481.91422.91.04
ZM284200480 × 480#12601309.61288.91.02
Table 6. Comparison results between experimental and theoretical values.
Specimen NumberExperimental ValuesTheoretical ValuesExperimental Values/Theoretical Values
Z1260239.11.09
Z2503493.41.02
Z3454428.01.06
Z4419362.71.16
Z5251224.71.12
Z6502478.11.05
Z7447414.81.08
Z8386351.41.10
Z9230217.31.06
Z10476462.41.03
Z11378401.10.94
Z12348339.81.02
Disclaimer/Publisher’s Note: The statements, opinions and data contained in all publications are solely those of the individual author(s) and contributor(s) and not of MDPI and/or the editor(s). MDPI and/or the editor(s) disclaim responsibility for any injury to people or property resulting from any ideas, methods, instructions or products referred to in the content.

