

Research on the Production Capacity Evaluation of Prefabricated Component Manufacturing Enterprises
Abstract
:1. Introduction
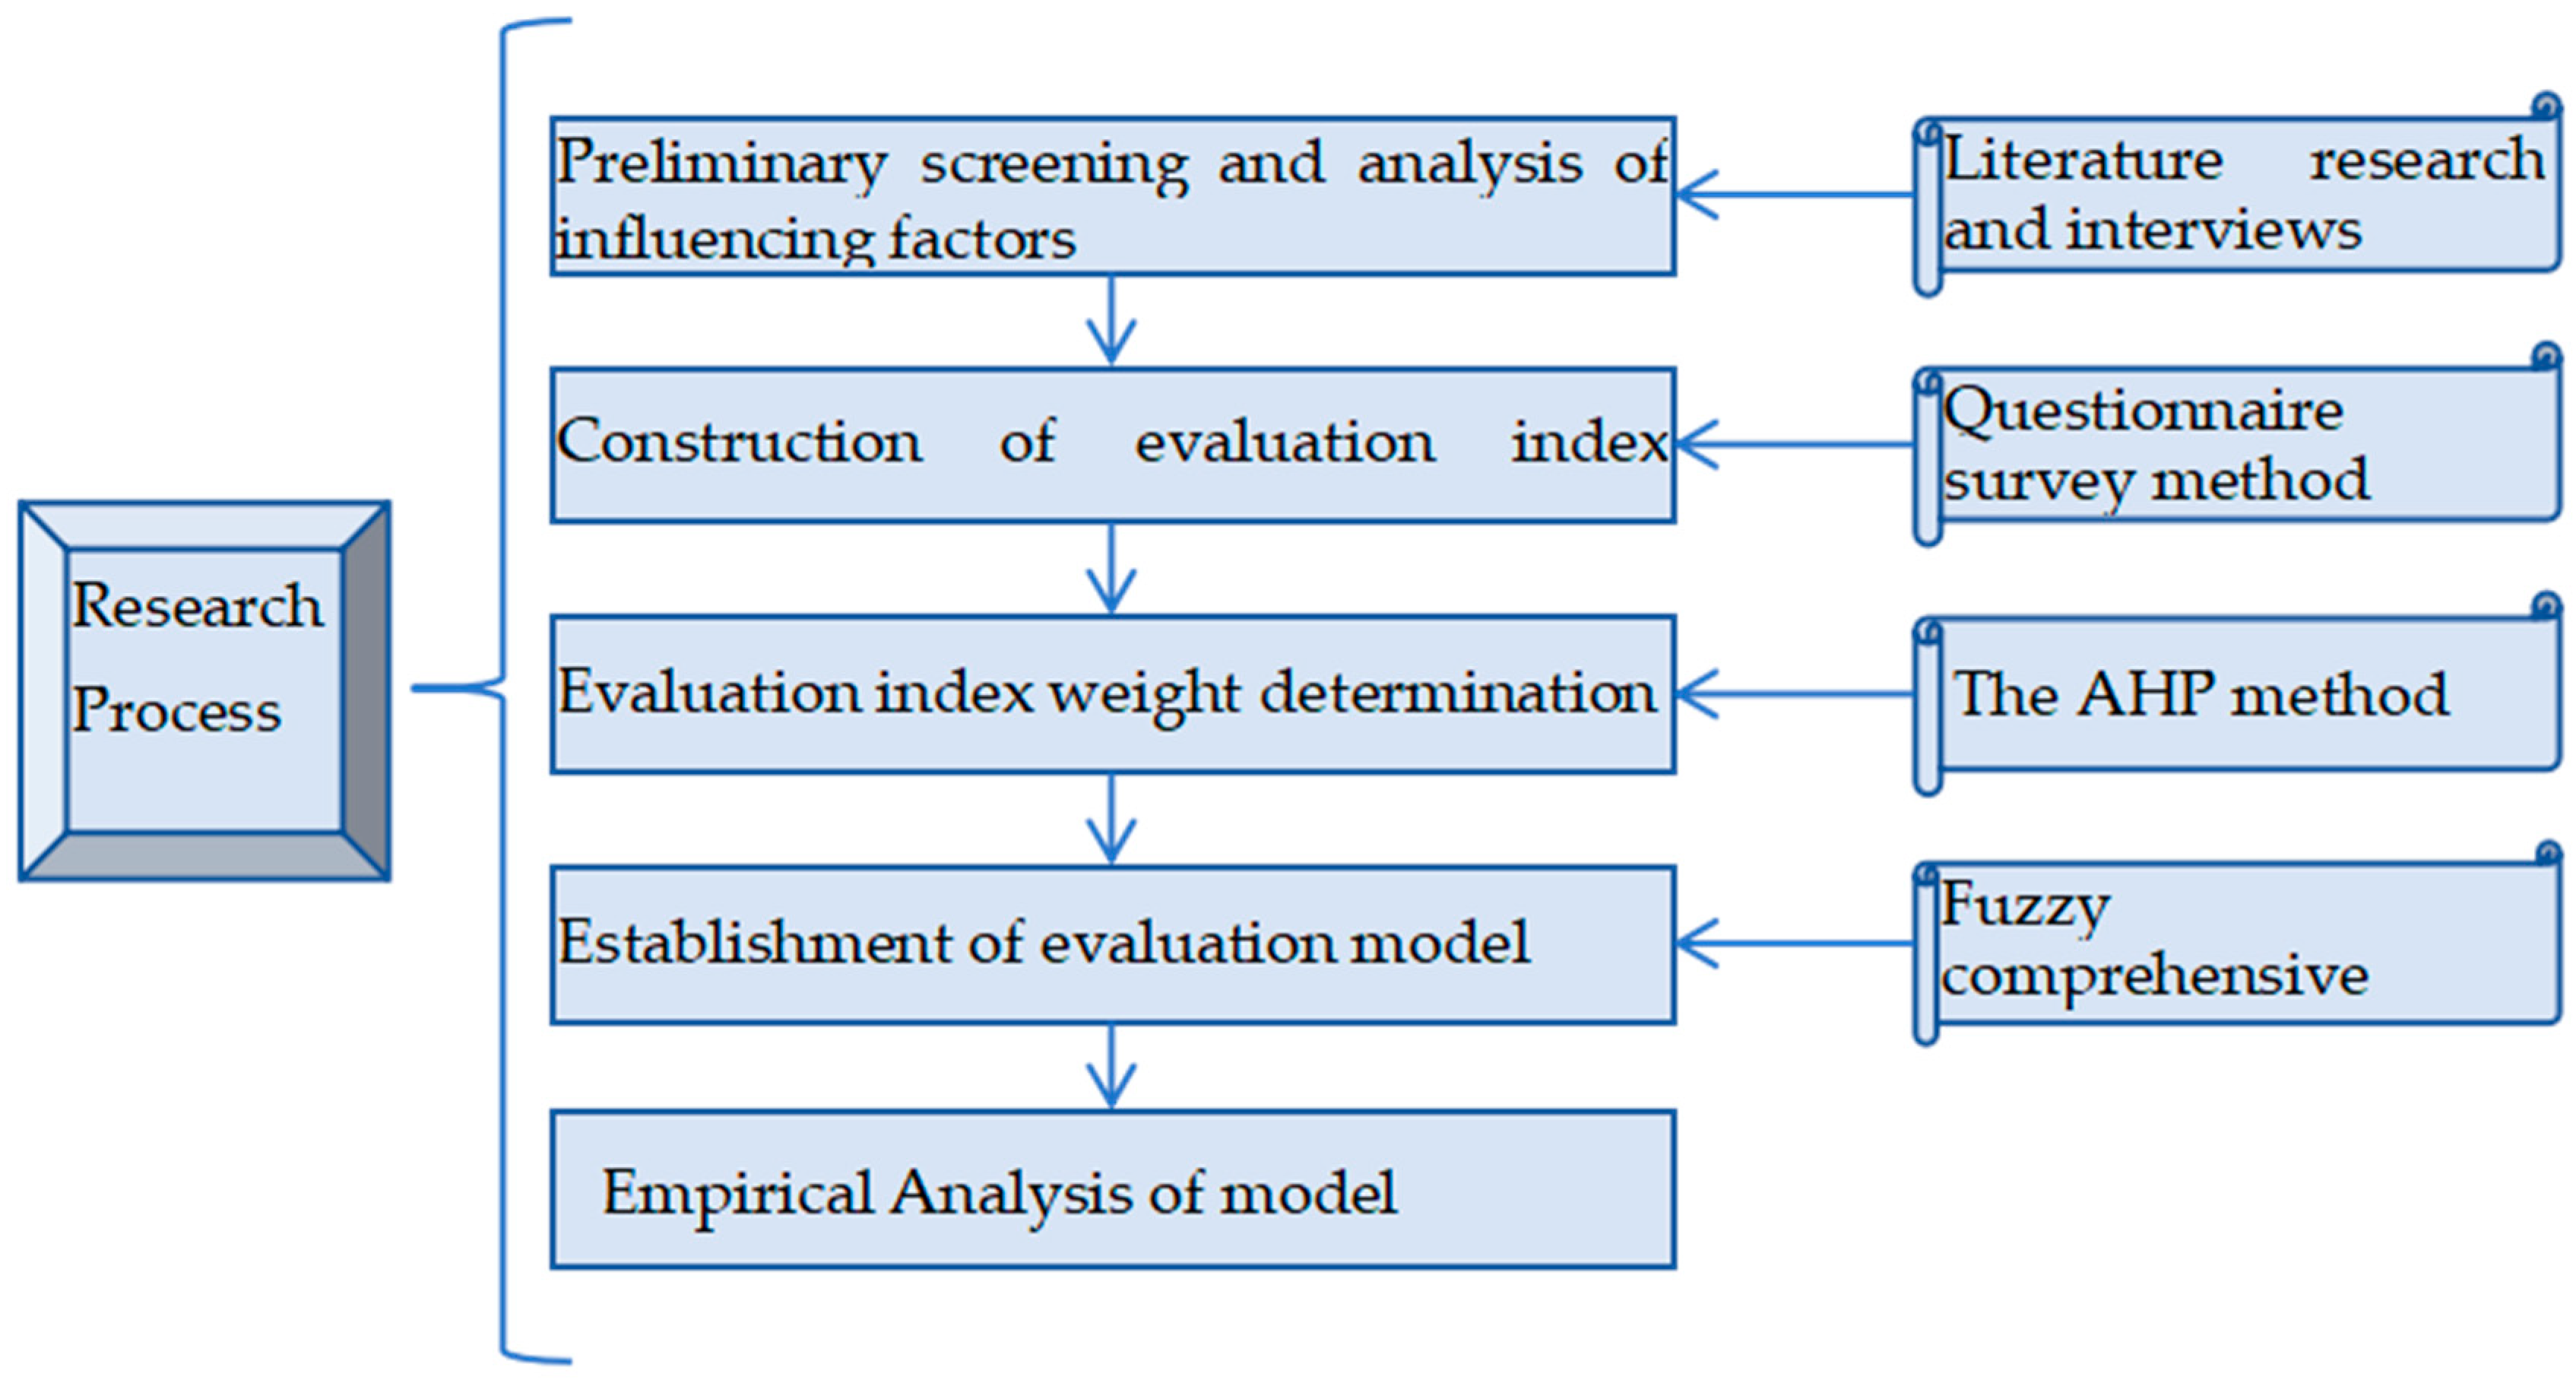
2. Methods
2.1. Preliminary Determination of Indicators
- (1)
- Academic literature: monographs, journals, research papers, and dissertations. To systematically search the relevant database, some keywords such as “prefabricated building”, “prefabricated component”, “production capacity”, and “index system” are utilized.
- (2)
- Enterprise and industry reports: PC-related research reports that are issued by enterprises or organizations, such as the China Prefabricated Building Development Report.
- (3)
- Industry guidelines: relevant technical guidelines and manuals that are issued by organizations such as the China Real Estate Research Society, the China Civil Engineering Society, the Housing Industry Development and Technology Committee, the Engineering Management Association, and the Building Industrialization Association. One such document is the “Prefabricated Construction Technical Manual (Concrete Structure Volume Production Part)”.
- (4)
- Government documents and standards: relevant statistical data, conference reports, technical standards, norms, and procedures that are issued by provincial housing and urban–rural development departments and provincial construction project cost management stations. One such document is the “Production of precast concrete components of prefabricated buildings standardized Management Regulations”.
2.2. Index Optimization Screening
2.3. Index Optimization Screening
2.4. Index Weight Determination
- (1)
- Specify the basis for the assignment
- (2)
- Design score table
- (1)
- X denotes the score pertaining to the importance of P1 compared with that of P2;
- (2)
- Z1 denotes the sum of the scores that are listed in Row P1;
- (3)
- The scenario in which P1 is more important than P2, P2 is more important than P3, and P3 is more important than P1 should be avoided.
- (3)
- Score by experts
- (4)
- Calculation and processing
- (1)
- Constructing the judgment matrix
- (2)
- Calculate according to Matrix B:
- (3)
- Calculate the n roots of , is :
- (4)
- Computational feature vector: :
- (5)
- Calculate the eigenvalues of Matrix B:
- (6)
- Consistency test
- (7)
- Calculate the average weight of the indicators
2.5. Comprehensive Evaluation Method
- (1)
- The construction of factor set U and evaluation set VEvaluation objective: PCP Grade B of the PCME
- (1)
- Establish factor set U
First-level indicators:B = {P1,P2,P3,P4,P5,P6,P7}Secondary indicators:P1 = {Q1,Q2,Q3,Q4,Q5}P2 = {Q6,Q7,Q8,Q9,Q10,Q11}P3 = {Q12,Q13,Q14,Q15,Q16}P4 = {Q17,Q18,Q19}P5 = {Q20,Q21}P6 = {Q22,Q23,Q24,Q25}P7 = {Q26,Q27,Q28,Q29}- (2)
- Establish evaluation set V
- (2)
- Construct the fuzzy evaluation matrix
- (3)
- Fuzzy comprehensive evaluation
3. Research Results
3.1. Index Screening Analysis
3.2. Index System
3.3. Indicator Weight Value
4. Empirical Analysis
4.1. Enterprise Research
4.2. Statistical Analysis
- (1)
- With respect to the PCME, the evaluation vectors of each PCP index level were calculated as per Formula (9), where is expressed as follows:
- (2)
- Subsequently, to calculate the corresponding PCP evaluation vector C, we substituted the preceding calculation results into Formula (11):
- (3)
- As per Formula (12), we calculated .
4.3. Model Evaluation
5. Discussion
6. Conclusions
6.1. Main Conclusions and Innovations
- (1)
- Establish an index system to evaluate the ability of the PCME. First, through literature reviews and site visits, 33 PCP influencing factors were preliminarily determined. Subsequently, after performing an investigation and obtaining expert advice, the PCP evaluation index system was constructed, and it included seven first-level indexes, namely “enterprise organization management level”, “level of personnel”, “mechanical equipment level”, “materials and supplies”, “product quality level”, “level of technical competence”, and “production environment”. Because four influencing factors were eliminated, this index system comprised 29 secondary indexes.
- (2)
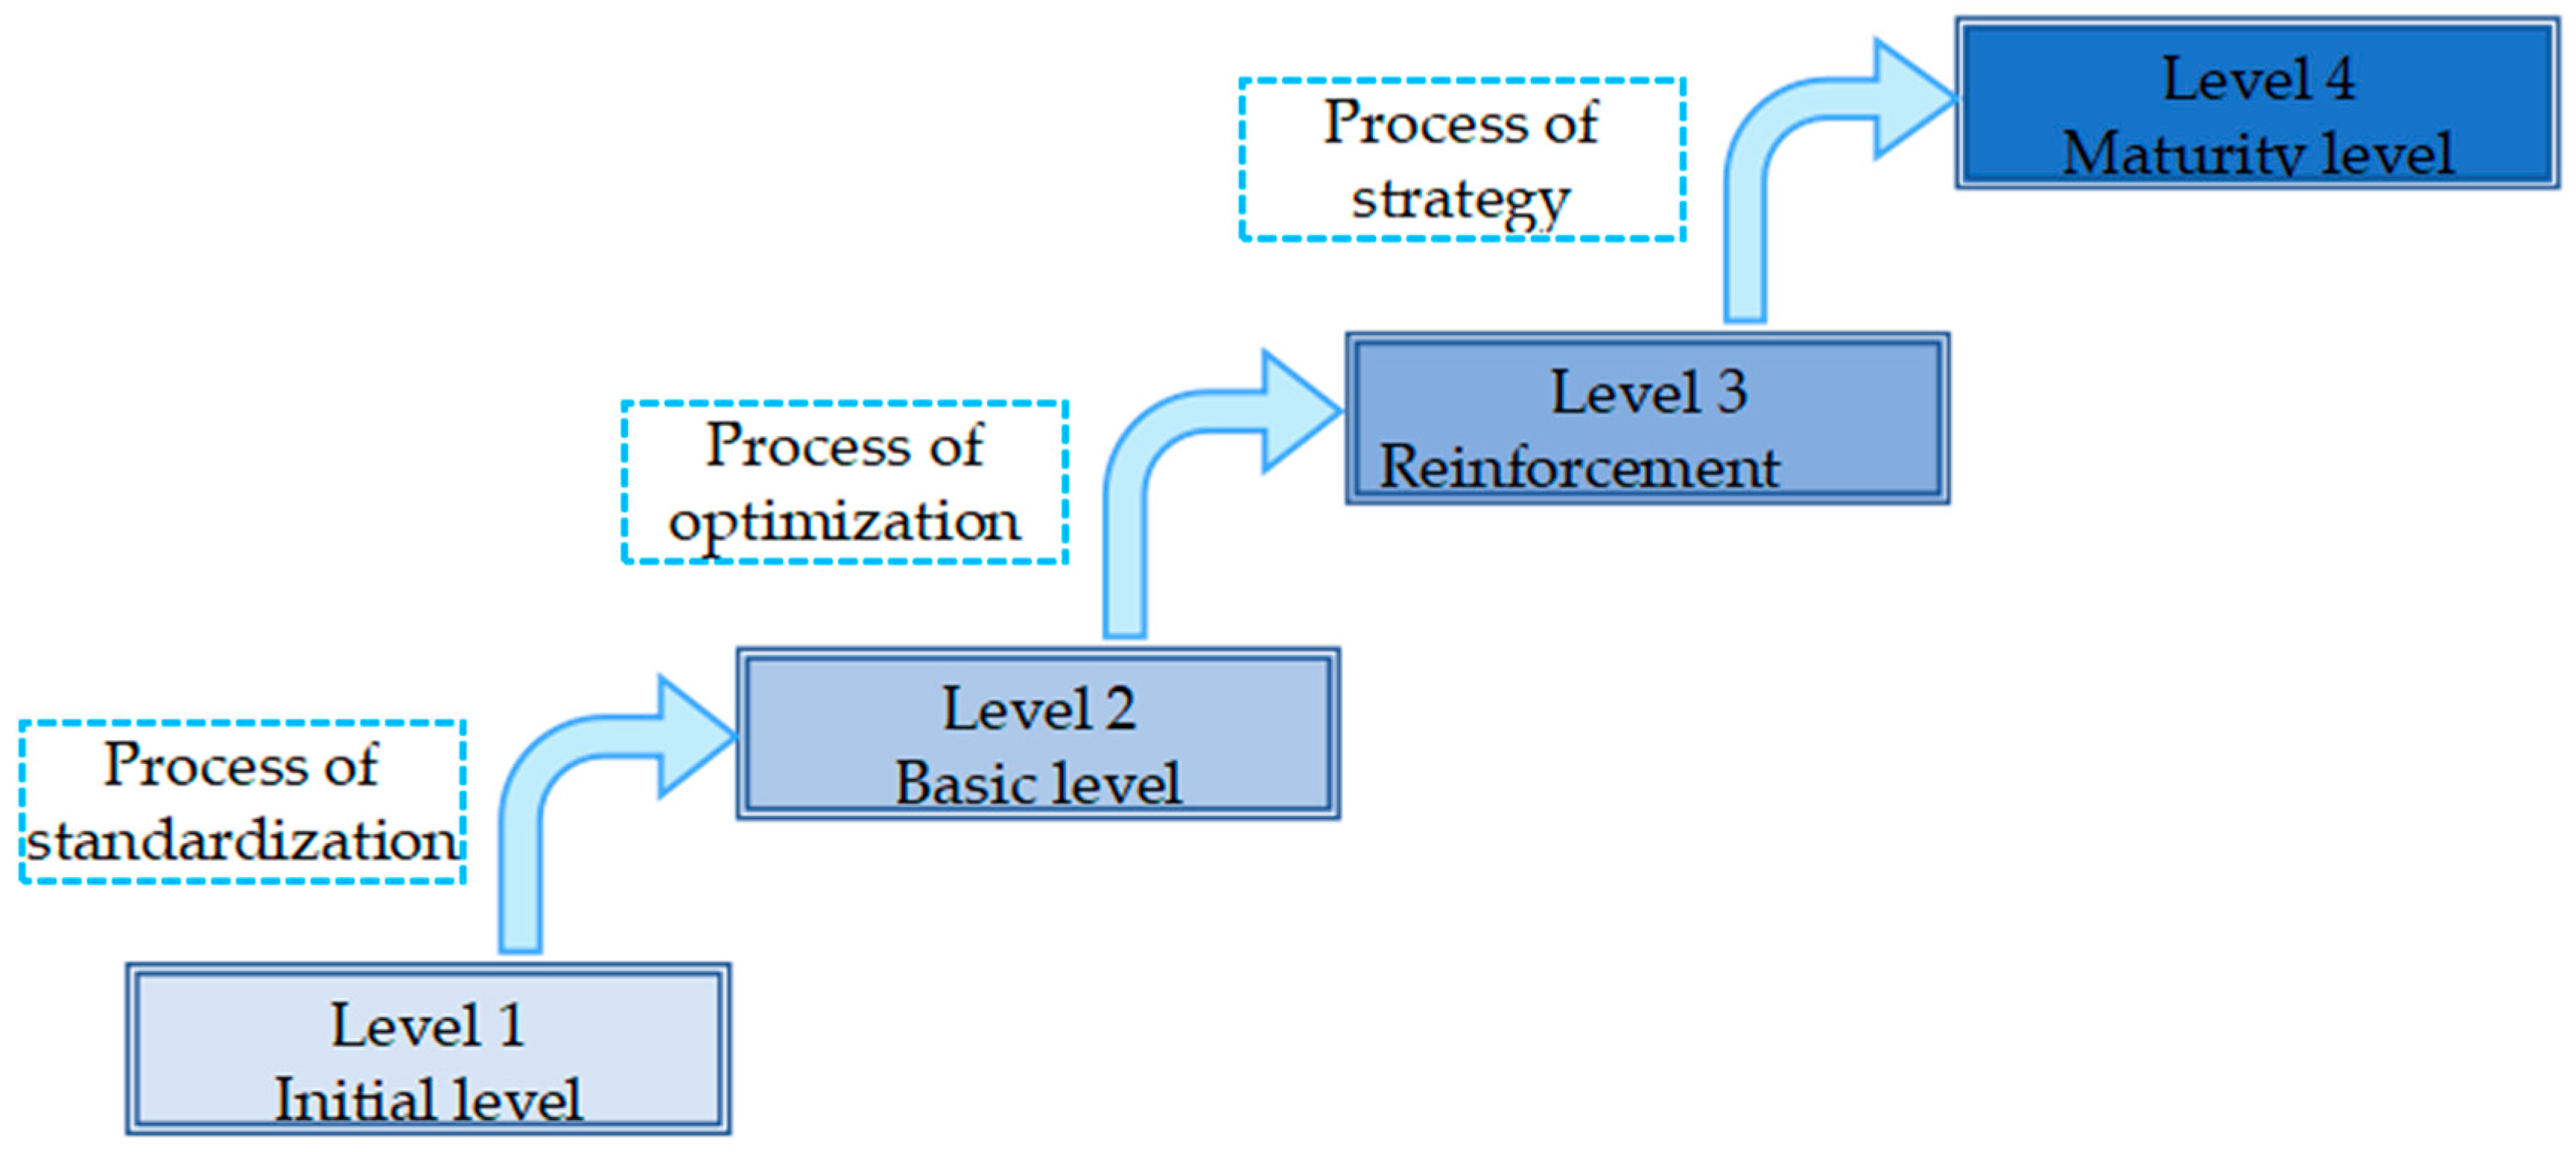
- The PCP evaluation model was established. First, to determine the weight of each evaluation index, the AHP method is utilized; subsequently, the PCP grades pertaining to “initial level”, “basic level”, “reinforcement level “and “maturity level “are applied. Finally, to construct the PCP model for evaluating the PCME, fuzzy comprehensive evaluation is utilized.
- (3)
- With respect to the model constructed herein, an empirical analysis was performed, and it was observed that the constructed model was rational and feasible. First, we conducted a survey that considered Zhongnan Construction Group Co., Ltd. Based on the data that were obtained from the survey, the PCP evaluation model was utilized for calculation and analysis; furthermore, we noted that the company’s PCP grade matched the reinforcement level. Subsequently, to facilitate PCP grade evaluation, standard quota research institutions pertaining to each province were invited. As per the statistical evaluation results, 18 institutions indicated that the enterprise exhibited the reinforcement level, which was the most prevalent PCP grade. The evaluation results are consistent with the model’s empirical results; thus, the constructed model is rational and feasible.
6.2. Limitations and Further Recommendations
- (1)
- This study utilizes the opinions of experts who are involved in the determination of relevant indicators and relevant weights; thus, it exhibits subjectivity, which may affect its scientific nature. More objective methods should be adopted in future research; alternatively, the influence of sample subjectivity on the scientific results should be reduced by expanding the number of experts and ensuring their diversity.
- (2)
- In regard to the empirical analysis, the staff that represent all the levels pertaining to PCT production were invited to fill the questionnaire; we assumed that the employees who work for the enterprise comprehend its state. However, due to the employees’ personal feelings towards the enterprise, the results may not be objective; thus, the final results are affected. In future studies, it may be possible to avoid the aforementioned problems by utilizing a more confidential approach or by inviting non-company employees who have no conflicts of interest to perform the evaluation.
- (3)
- Although this study determines the factors that influence the PCP of PCMEs, due to the level of progress that the society exhibits, the production technology and management mode is likely to change; thus, the developed PCP evaluation index system is imperfect. Therefore, researchers should consider how they can build an enriched and optimized system, which may necessitate the reestablishment of the indicator system by the addition, removal, and combination of indicators.
- (4)
- Although this study has built a PCP model method that can evaluate the production level of PCMEs, it has not performed an in-depth analysis of the consequential work, which entails investigating the following issues: the methods of determining the main factors that affect the current production capacity level; the methods that can optimize the different factors; and the methods of optimizing the model. Therefore, researchers should further explore methods of analyzing the development factors that should be enhanced (as per the evaluation results), formulate enterprise development strategies, and continue to explore the construction of a comprehensive and rational PCP optimization model.
Author Contributions
Funding
Data Availability Statement
Acknowledgments
Conflicts of Interest
Appendix A

| Dear Sir/Madam, Hello! Thank you for filling out this questionnaire. This questionnaire is aimed at providing a basis for the production capacity evaluation of prefabricated precast manufacturing enterprises, completing the compilation of the production capacity evaluation model of prefabricated precast manufacturing enterprises, and promoting the development of prefabricated buildings. The questionnaire has no adverse purpose and only provides data support for the study. Therefore, please take the time to fill in the questionnaire. Thanks again for your participation and support! If you are interested or have different opinions, please contact us at [email protected]. Thanks! Best wishes! | |||||||
| 1. Your occupation/organization: | |||||||
| ◯ Research institutes/universities | ◯ Construction units | ◯ design units | |||||
| ◯ Prefabricated component Manufacturer | ◯ Government Department | ◯ Supervision Unit | ◯ Others | ||||
| 2. The nature of your work in the unit: | |||||||
| ◯ Senior management | ◯ Middle management | ◯ Technical personnel | ◯ Administrative personnel | ◯ Others | |||
| 3. Your years of service: | |||||||
| ◯ 5 years or less | ◯ 5–10 years | ◯ 10–15 years | ◯ 15–20 years | ◯ More than 20 years | |||
| 4. In your opinion, the impact of the following factors on the production capacity of the manufacturer is (please tick √ after the corresponding options). | |||||||
| number | Factor of influence | Degree of importance | |||||
| most | more | general | minimum | ||||
| 1 | Perfection of internal incentive mechanism | ||||||
| 2 | Management system (e.g., inspection and measurement) soundness | ||||||
| 3 | Reasonable degree of decomposition of production organization | ||||||
| 4 | Level of coordination and communication between departments | ||||||
| 5 | Operator training and education level | ||||||
| 6 | The advanced level of production machinery | ||||||
| 7 | The number of production machines | ||||||
| 8 | Mechanical-equipment-utilization level | ||||||
| 9 | The complete degree of production machinery | ||||||
| 10 | Application of machinery to field conditions | ||||||
| 11 | Mechanical-equipment-deployment level | ||||||
| 12 | The degree of completeness of process procedures | ||||||
| 13 | Feasibility of production plan and technical measures | ||||||
| 14 | Whether the technology research and development center are established or not | ||||||
| 15 | Enterprise technical level accumulation degree | ||||||
| 16 | The level of leadership, organization, and control of management personnel | ||||||
| 17 | Reasonable on-site personnel allocation | ||||||
| 18 | Employee’s understanding of component knowledge and production process | ||||||
| 19 | Employee awareness of component quality | ||||||
| 20 | Skill level of production personnel | ||||||
| 21 | Proficiency of production and operation personnel | ||||||
| 22 | Team cooperation level | ||||||
| 23 | The labor enthusiasm of production and operation personnel | ||||||
| 24 | Operating site-environment comfort | ||||||
| 25 | Reasonable layout of functional areas | ||||||
| 26 | Production preparation is sufficient | ||||||
| 27 | Reasonableness of working-face distribution | ||||||
| 28 | Power-supply level | ||||||
| 29 | Product-pass rate | ||||||
| 30 | Precision of product | ||||||
| 31 | Reasonable placement of materials | ||||||
| 32 | Procurement and supply level of materials and materials | ||||||
| 33 | Quality level of raw materials and collaboration materials | ||||||
| If you have any further questions about this study, please feel free to comment below: The questionnaire has been completed. Thank you very much for your cooperation and assistance. | |||||||
Appendix B
| Dear Sir/Madam, Hello! Thank you for filling out this questionnaire. This questionnaire is aimed at providing a basis for the production capacity evaluation of prefabricated precast manufacturing enterprises, completing the compilation of the production capacity evaluation model of prefabricated precast manufacturing enterprises, and promoting the development of prefabricated buildings. This questionnaire has no adverse purpose and only provides data support for the study. Therefore, please take the time to fill in the questionnaire. Thanks again for your participation and support! If you are interested or have different opinions, please contact us at [email protected]. Thanks! Best wishes! | ||||
| 1.Your workplace: | ||||
| 2.Your department: | ||||
| 3.The nature of the work you undertake in this unit: | ||||
| ◯ Top management | ◯ Middle manager | ◯ Technical personnel | ◯ Administrative personnel | ◯ other |
| 4.Your years of service: | ||||
| ◯ ≤ 5 years | ◯ 5–10 years | ◯ 10–15 years | ◯ 15–20 years | ◯ >20 years |
| 5.In your opinion, the component production capacity level of your enterprise in the following aspects is (Please put an √ after the corresponding option). | ||||
| first-level index | second-level index | Production capacity grade of component manufacturing enterprise | ||
| Enterprise organization management level (P1) | Perfection of internal incentive mechanism (Q1) | Initial level: Not formed or formed but not executed ( ) Basic level: It’s a reasonable system but it’s just starting to work ( ) Reinforcement level: The system is exceedingly reasonable, feasible and relatively smooth ( ) Maturity level: The system is exceedingly reasonable, feasible and works well ( ) | ||
| Management system (e.g., inspection, measurement, etc.) soundness (Q2) | Initial level: No management system ( ) Basic level: Just meet normal production ( ) Reinforcement level: Sound management system ( ) Maturity level: The management system is quite sound and smoothly implemented ( ) | |||
| Reasonable degree of decomposition of production organization (Q3) | Initial level: The breakdown of production organization is not reasonable ( ) Basic level: The decomposition of production organization is unreasonable ( ) Reinforcement level: The decomposition of production organization is more reasonable ( ) Maturity level: Reasonable decomposition of production organization ( ) | |||
| Level of coordination and communication between departments (Q4) | Initial level: There is limited coordination and communication ( ) Basic level: Not much coordination and communication ( ) Reinforcement level: Frequent coordination and communication ( ) Maturity level: Long-term coordination and communication and the effect is obvious ( ) | |||
| Operator training and education level (Q5) | Initial level: Basically, no training ( ) Basic level: Trained several times ( ) Reinforcement level: Regular training ( ) Maturity level: Long-term training and the effect is apparent ( ) | |||
| Level of personnel (P2) | The level of leadership, organization, control, etc., of management personnel (Q6) | Initial level: Inability to effectively manage and organize production ( ) Basic level: General management ability, able to organize normal production ( ) Reinforcement level: Strong management ability and can effectively organize production ( ) Maturity level: A highly qualified management team that can effectively developand ( ) | ||
| Reasonable on-site personnel allocation (Q7) | Initial level: Personnel allocation is not reasonable, cannot ensure normal production ( ) Basic level: General staffing and low production efficiency ( ) Reinforcement level: More reasonable and efficient personnel allocation for production ( ) Maturity level: The personnel allocation is quite reasonable and can perform ( ) | |||
| Employee awareness of component quality (Q8) | Initial level: Employees have low awareness of component quality ( ) Basic level: Employees have general awareness of component quality ( ) Reinforcement level: Employees have strong awareness of component quality ( ) Maturity level: Employees have strong awareness of component quality ( ) | |||
| Skill level of production personnel (Q9) | Initial level: The technical level of the operators is poor ( ) Basic level: The technical level of the operators is average ( ) Reinforcement level: The technical level of the operators is high ( ) Maturity level: The technical level of the operators is quite high ( ) | |||
| Team cooperation level (Q10) | Initial level: Team coordination is poor ( ) Basic level: Team cooperation is not good ( ) Reinforcement level: Team cooperation is tacit ( ) Maturity level: The team cooperated quite well ( ) | |||
| The labor enthusiasm of production and operation personnel (Q11) | Initial level: Labor enthusiasm is not high ( ) Basic level: General enthusiasm for labor ( ) Reinforcement level: High enthusiasm for labor ( ) Maturity level: The labor enthusiasm is quite high ( ) | |||
| Mechanical equipment level (P3) | The advanced level of production machinery (Q12) | Initial level: Backward production machinery, cannot ensure normal production ( ) Basic level: The level of production machinery is normal, and can produce normally ( ) Reinforcement level: The level of production machinery is relatively advanced, which can smoothly conduct the production work ( ) Maturity level: The level of production machinery is quite advanced, which can perform the production work quickly and efficiently ( ) | ||
| The number of production machines (Q13) | Initial level: The number of production machinery is small, unable to produce normally ( ) Basic level: The number of production machinery is not large, and the production can be normal ( ) Reinforcement level: Sufficient production machinery, the production work is smooth ( ) Maturity level: The production machinery is quite sufficient and the production work is quite smooth ( ) | |||
| The complete degree of production machinery (Q14) | Initial level: Production machinery is not complete, cannot guarantee normal production ( ) Basic level: The production machinery is generally complete, and the production efficiency is not high ( ) Reinforcement level: More complete production machinery, more efficient production ( ) Maturity level: Production machinery is quite complete, and production components are barrier-free ( ) | |||
| Application of machinery to field conditions (Q15) | Initial level: Machinery is not suitable for field conditions ( ) Basic level: Machinery is generally suitable for field conditions ( ) Reinforcement level: The machinery can more optimally adapt to the site conditions ( ) Maturity level: The machinery is quite suitable for field conditions ( ) | |||
| Mechanical equipment deployment level (Q16) | Initial level: The deployment of mechanical equipment is confused ( ) Basic level: The allocation of mechanical equipment is basically normal ( ) Reinforcement level: Mechanical equipment deployment is timely ( ) Maturity level: Smooth deployment of mechanical equipment ( ) | |||
| Materials and supplies (P4) | Reasonable placement of materials (Q17) | Initial level: Improper placement of materials ( ) Basic level: The reasonable placement of materials is general ( ) Reinforcement level: The placement of materials is more reasonable ( ) Maturity level: The arrangement of materials is quite reasonable ( ) | ||
| Procurement and supply level of materials and materials (Q18) | Initial level: The procurement and supply level of materials and materials is low, which cannot guarantee normal production ( ) Basic level: The procurement and supply level of materials and materials is general, which can guarantee the basic production ( ) Reinforcement level: High level of procurement and supply of materials ( ) Maturity level: The procurement and supply level of materials is exceedingly high, which can ensure efficient production ( ) | |||
| Quality level of raw materials and collaboration materials (Q19) | Initial level: Poor quality of raw materials and collaboration materials ( ) Basic level: The quality of raw materials and collaborative components is average ( ) Reinforcement level: The quality of raw materials and collaborative components is more optimal ( ) Maturity level: The quality of raw materials and collaboration materials is excellent ( ) | |||
| Product quality level (P5) | Product pass rate (Q20) | Initial level: The qualified rate of the produced products is quite low ( ) Basic level: The qualified rate of the produced products is average ( ) Reinforcement level: Higher qualified rate of produced ( ) Maturity level: The production product qualified rate is quite high ( ) | ||
| Precision of product (Q21) | Initial level: The produced products are more crude ( ) Basic level: The precision of the products can meet the requirements ( ) Reinforcement level: High precision of the produced products ( ) Maturity level: The produced products are of high precision ( ) | |||
| Level of technical competence (P6) | The degree of completeness of process procedures (Q22) | Initial level: No process regulation ( ) Basic level: There are simple process procedures ( ) Reinforcement level: Relatively complete technological procedures ( ) Maturity level: Complete process regulation system ( ) | ||
| Feasibility of production plan and technical measures (Q23) | Initial level: Production plan and technical measures are not feasible ( ) Basic level: Production schemes and technical measures are partially feasible ( ) Reinforcement level: The production plan and technical measures are more feasible ( ) Maturity level: The production plan and technical measures are quite feasible ( ) | |||
| Enterprise technical level accumulation degree (Q24) | Initial level: No technology research and development center ( ) Basic level: The establishment of technology research and development center but investment is not robust ( ) Reinforcement level: Establish a technology research and development center and invest heavily ( ) Maturity level: Establish a technology research and development center with immense investment ( ) | |||
| Whether the technology research and development center are established or not (Q25) | Initial level: The ability to accumulate technical level is weak ( ) Basic level: Technical level accumulation ability is average ( ) Reinforcement level: A satisfactory ability to accumulate technical level ( ) Maturity level: Technical level accumulation ability is quite satisfactory ( ) | |||
| Production environment (P7) | Operating site environment comfort (Q26) | Initial level: The operation site is uncomfortable ( ) Basic level: The operation site environment is normal ( ) Reinforcement level: The site environment is comfortable ( ) Maturity level: The site environment is exceedingly comfortable ( ) | ||
| Reasonable layout of functional areas (Q27) | Initial level: The layout of functional areas is not reasonable ( ) Basic level: The layout of functional areas is general ( ) Reinforcement level: The layout of functional areas is reasonable ( ) Maturity level: The layout of functional areas is quite reasonable ( ) | |||
| Production preparation is sufficient (Q28) | Initial level: The production preparation is not sufficient ( ) Basic level: The production preparation is not quite sufficient ( ) Reinforcement level: Adequate preparation for production ( ) Maturity level: The production preparation is quite full ( ) | |||
| Power supply level (Q29) | Initial level: Power supply cannot achieve normal production ( ) Basic level: Power supply level is general and can support basic production ( ) Reinforcement level: The high power-supply level can meet the high production requirements ( ) Maturity level: The power-supply level is quite high to meet the needs of efficient production ( ) | |||
| If you have any further questions pertaining to this study, please feel free to comment below: The questionnaire has been completed. Thank you very much for your cooperation and assistance! | ||||
References
- Yin, S.; Dong, T.; Li, B.Z.; Gao, S. Developing a Conceptual Partner Selection Framework: Digital Green Innovation Management of Prefabricated Construction Enterprises for Sustainable Urban Development. Buildings 2022, 12, 721. [Google Scholar] [CrossRef]
- Xu, J. Research on Green and Low-carbon Development Path of prefabricated Building Business of Construction Enterprises under Double Carbon Background. Value Eng. 2002, 41, 165–168. [Google Scholar]
- Cheng, Y.R.; Zheng, S.Q.; Liu, J.H. Analysis of Constraints on the development of prefabricated buildings. J. Shandong Jianzhu Univ. 2021, 11, 54–61. [Google Scholar]
- Xue, H. Study on Stakeholder Cooperation Mechanism of Prefabricated Construction Project under Construction Cost Orientation. Ph.D. Thesis, Harbin Institute of Technology, Harbin, China, 2020. [Google Scholar]
- Xu, Z.; Xie, Z.; Wang, X.R.; Niu, M. Automatic Classification and Coding of Prefabricated Components Using IFC and the Random Forest Algorithm. Buildings 2022, 12, 688. [Google Scholar] [CrossRef]
- Lu, Q.F.; Jin, W.W.; Zhang, J.; Sun, C.J. Present Situation and Countermeasures of the Development of Chinese Construction Industrialization. Chief Engineer Working Committee of China Civil Engineering Society. In Proceedings of the China Civil Engineering Society Chief Engineer Working Committee 2021 Annual Conference, Nanchang, China, 4–5 December 2021. [Google Scholar]
- Wang, H.Z. Study on Influencing Factors of Prefabricated Construction Cost under EPC General Contracting Mode Based on SEM. Master’s Thesis, Jiangxi University of Science and Technology, Ganzhou, China, 2022. [Google Scholar]
- Liu, K.N.; Su, Y.K.; Zhang, S.J. Optimization of the Supplier Selection Process in Prefabrication Using BIM. Buildings 2019, 9, 222. [Google Scholar] [CrossRef]
- Qin, X.; Fang, Z.H.; Zhang, Z.X. Multi-objective Production Scheduling Optimization of Prefabricated Components Considering Resource Constraints. Comput. Integr. Manuf. Syst. 2021, 27, 2248–2259. [Google Scholar]
- Du, J.; Dong, P.; Sugumaran, V. Dynamic Production Scheduling for Prefabricated Components Considering the Demand Fluctuation. Intell. Autom. Soft Comput. 2020, 26, 715–723. [Google Scholar] [CrossRef]
- Chen, X.B.; Yu, F.F.; Zhou, H.Y.; Li, Z.D.; Wu, K.J.; Qian, X.K. Mixed Production Line Optimization of Industrialized Building Based on Ant Colony Optimization Algorithm. Adv. Civ. Eng. 2022, 2022, 2411458. [Google Scholar] [CrossRef]
- Chang, C.G.; Han, M.Y. Production Scheduling Optimization of Prefabricated Building Components Based on DDE Algorithm. Math. Probl. Eng. 2021, 2021, 6672753. [Google Scholar] [CrossRef]
- Du, J.; Dong, P.; Sugumaran, V.; Castro-Lacouture, D. Dynamic decision support framework for production scheduling using a combined genetic algorithm and multiagent model. Expert Syst. 2021, 38, e12533. [Google Scholar] [CrossRef]
- Wang, H.P.; Zhao, D.Y.; Chen, M.K.; Li, Y. Research on Job Assignment Optimization of PC Component Mixed-Flow Production Based on MO-CGJaya/D Algorithm. Manag. Sci. China 2022, 3, 1–14. [Google Scholar]
- Zuo, J. Study on Lean Construction Process Optimization of Precast Concrete Components in Prefabricated Buildings. Master’s Thesis, Guilin University of Technology, Guilin, China, 2022. [Google Scholar]
- Zhong, H.; Meng, X.Y.; Sun, H.; Zhang, K.; Geng, R.; Li, D. Research on Data Generation Technology of BIM Component Concrete pouring Control. In Proceedings of the 2019 Chinese Automation Congress, Hangzhou, China, 22–24 November 2019; pp. 79–83. [Google Scholar]
- Ding, Z.K.; Liu, S.; Luo, L.W.; Liao, L.H. A building information modeling-based carbon emission measurement system for prefabricated residential buildings during the materialization phase. J. Clean. Prouction 2020, 264, 121728. [Google Scholar] [CrossRef]
- Xu, Z.; Wang, S.Z.; Wang, E.D. Integration of BIM and Energy Consumption Modelling for Manufacturing Prefabricated Components: A Case Study in China. Adv. Civ. Eng. 2019, 2019, 1609523. [Google Scholar] [CrossRef]
- Qi, B.; Chen, K.; Costin, A. RFID and BIM-Enabled Prefabricated Component Management System in Prefabricated Housing Production. In Proceedings of the Construction Research Congress 2018: Construction Information Technology, New Orleans, LA, USA, 2–4 April 2018; pp. 591–601. [Google Scholar]
- Gao, Q.Y.; Gao, X.S. Research on Production Information Model of Prefabricated Components based on IFC Standard. Acta Graph. Sin. 2018, 39, 538–546. [Google Scholar]
- Yu, Y.P. Production Process Optimization and MES System Development of PC Components for Prefabricated Buildings. Master’s Thesis, Shandong Jianzhu University, Jinan, China, 2022. [Google Scholar]
- Fu, L.; Yong, J.; Wang, X.J. On Component-Based Industrialization Construction Costs Valuation. AER-Adv. Eng. Res. 2017, 118, 24–30. [Google Scholar]
- Lin, X.; Lu, Y.N. Research on Mathematical Model of Cost Budget in the Early Stage of Assembly Construction Project Based on Improved Neural Network Algorithm. Math. Probl. Eng. 2021, 10, 3674929. [Google Scholar] [CrossRef]
- Tang, J.L. Analysis of incremental cost in the whole construction process of prefabricated concrete buildings. Constr. Econ. 2022, 43, 156–160. [Google Scholar]
- Liu, C.; Liu, J.J.; Liu, F.J. Research on Influencing Factors and Control measures of Precast component cost based on AHP method. Proj. Manag. Technol. 2022, 20, 15–20. [Google Scholar]
- Li, N.; Liu, Z. Analysis of Influencing Factors of PC component cost based on ISM Model. Shanghai Energy Conserv. 2022, 2, 139–144. [Google Scholar]
- Chen, W.; Chen, A.Q.; Liu, J.; Deng, S.Y. Research on Production Cost Optimization of PC Exterior Wall Panel Based on Hybrid Genetic Algorithm. In Proceedings of the ICCREM 2021: Challenges of The Constructon Industry under The Pandmic, Beijing, China, 16–17 October 2021; pp. 687–693. [Google Scholar]
- Li, N.; Fan, Z.F. Impact Evaluation of Prefabricated Buildings Cost on Game Theory-Cloud Model. J. Math. 2022, 10, 3635009. [Google Scholar] [CrossRef]
- Ye, M.Z. Research on Influencing Factors of Prefabricated Construction Cost Based on System Dynamics. Master’s Thesis, Guangxi University, Nanning, China, 2022. [Google Scholar]
- Yu, H.A.; Shang, Z.F.; Liu, Q.W.; Wang, F.L. Research on Production cost accounting of Prefabricated components in Prefabricated Buildings based on TDABC. Build. Econ. 2021, 42, 35–39. [Google Scholar]
- Xu, J.W. Research on Prefabricated Component Pricing Model. Master’s Thesis, Dongbei University of Finance and Economics, Dalian, China, 2021. [Google Scholar]
- Xie, W.W.; Deng, B.C.; Yin, Y.L.; Lv, X.D.; Deng, Z.J. Critical Factors Influencing Cost Overrun in Construction Projects: A Fuzzy Synthetic Evaluation. Buildings 2022, 12, 2028. [Google Scholar] [CrossRef]
- Ji, F.R.; Shi, J.L.; Zhu, T.L.; Hu, X.C. Risk Assessment in the Industry Chain of Industrialized Construction: A Chinese Case Study. Buildings 2022, 12, 1688. [Google Scholar] [CrossRef]
- Wei, H.L.; Niu, C.L.; Liu, F.J.; Wu, X.R.; Qi, S.W. Analysis of Influence Factors on Cost of prefabricated building components based on DEMATEL-AISM Method. Archit. Econ. 2021, 42, 83–88. [Google Scholar]
- Shi, X.B.; Ren, J.; Liu, C.C. Construction of Evaluation index system for Prefabricated building component suppliers. Build. Econ. 2019, 40, 92–97. [Google Scholar]
- Han, S. Competitiveness Evaluations and Predictions of Logistics Enterprises Based on Supply Chains. In Basic & Clinical Pharmacology & Toxicology; Wiley: Hoboken, NJ, USA, 2020; p. 126. [Google Scholar]
- Marzouk, M.M.; Gaid, E.F. Assessing Egyptian construction projects performance using principalcomponent analysis. Int. J. Product. Perform. Manag. 2018, 67, 1727–1744. [Google Scholar] [CrossRef]
- Bo, D.H.; Kong, L.J.; Xu, X.F. Research on Production capacity of Manufacturing Enterprise Based on System Dynamics. J. Qingdao Univ. (Nat. Sci. Ed.) 2009, 22, 71–77. [Google Scholar]
- Saaty, T.L. A scaling method for priorities in hierarchical structures. J. Math. Psychol. 1977, 15, 234–281. [Google Scholar] [CrossRef]
- Hwang, C.L.; Yoon, K. Multiple Attribute Decision Making; Springer: Berlin, Germany, 1981; pp. 58–191. [Google Scholar]
- Wang, M. Research on the Competitiveness Evaluation of Chinese Construction Enterprises. Master’s Thesis, Beijing University of Civil Engineering and Architecture, Beijing, China, 2022. [Google Scholar]
- Fu, L.L.; Mao, X.H.; Mao, X.B.; Cai, R.X. Evaluation of comprehensive grain production capacity in Zhejiang Province during 2013–2018. Acta Agric. Zhejiangensis 2021, 33, 1748–1758. [Google Scholar]
- Jiang, X.X.; Li, S.L. Research on the Selection of Components Manufacturers in prefabricated construction industry Chain. Constr. Econ. 2020, 41, 46–50. [Google Scholar]
- Bai, Y.T.; Lin, Q.W. Grey correlation analysis of agricultural resources Utilization and comprehensive grain production capacity: A case study of Hebei Province. China Agric. Resour. Reg. Plan. 2016, 37, 57–61. [Google Scholar]
- Aksoy, A.; Oztiirk, N. Supplier selection and performance evaluation in just-in-time production environments. Expert Syst.-Appl. 2011, 38, 6351–6359. [Google Scholar] [CrossRef]
- Lee, Y.S.; Kim, J.J.; Lee, T.S. Topological Competiveness Based on Social Relationships in the Korean Construction-Management Industry. J. Constr. Eng. Manag. 2016, 142, 05016014. [Google Scholar] [CrossRef]
- Liang, W.Z.; Zhao, G.Y.; Hong, C.S. Performance assessment of circular economy for phosphoruschemical firms based on VIKOR-QUALIFLEX method. J. Clean. Prod. 2018, 196, 1365–1378. [Google Scholar] [CrossRef]
- Guo, H.Y. Research on Enterprise Production Capacity Evaluation Sharing System Based on Block Chain. Master’s Thesis, Guangdong University of Technology, Guangzhou, China, 2020. [Google Scholar]
- Gao, Q.; Li, Y.; Xu, Y.Q. Analysis on Influencing Factors of Construction industrialization Development. J. Eng. Manag. 2017, 31, 14–18. [Google Scholar]
- Prefabricated Building the 13th Five-Year Plan Development Research Group. Innovation and Development of Prefabricated Buildings; China Architecture and Building Press: Beijing, China, 2017. [Google Scholar]
- Hu, Y.P.; Xie, Z.Z.; Tong, M.D.; Zou, S.; Li, H.; Chen, X.Q. Research on the planning and location of prefabricated components production base for prefabricated buildings. Constr. Econ. 2018, 39, 22–25. [Google Scholar]
- Zhang, J.S.; Wang, C.C.; Liu, X.C. Production and Management of Precast Concrete Components for Prefabricated Buildings, 2nd ed.; China Architecture and Building Press: Beijing, China, 2022. [Google Scholar]
- Tan, G.W.; Jian, X.S. Production of Prefabricated Precast Concrete Building Components; Science Press: Beijing, China, 2021. [Google Scholar]
- Wu, Y.Q.; Lu, W.Q. Fabrication and Transportation of Prefabricated Concrete Member; Yellow River Water Conservancy Press: Zhengzhou, China, 2017. [Google Scholar]
- Hu, J.L.; Wang, F.R. Manufacturing Technology of Prefabricated Concrete Precast Member; Central South University Press: Changsha, China, 2020. [Google Scholar]
- Fang, S.L.; Feng, D.K. Production and Installation of Precast Components; China Architecture and Building Press: Beijing, China, 2020. [Google Scholar]
- Ye, H.W. Production Technical Guide of Precast Concrete Member; China Architecture and Building Press: Beijing, China, 2016. [Google Scholar]
- Science, Technology and Industrialization Development Center; Ministry of Housing and Urban-Rural Development/Housing Industrialization Promotion Center; Ministry of Housing and Urban-Rural Development. China Prefabricated Building Development Report (2017); China Architecture and Building Press: Beijing, China, 2017. [Google Scholar]
- Shenzhen Construction Industry Association/Shenzhen Housing and Construction Bureau. Development Report of Prefabricated Buildings in Shenzhen during the 13th Five-Year Plan; China Architecture and Building Press: Beijing, China, 2022. [Google Scholar]
- Jiangsu Provincial Department of Housing and Urban-Rural Development/Jiangsu Provincial Department of Housing and Urban-Rural Development Science and Technology Development Center. Prefabricated Building Development Report of Jiangsu Province (2018); China Architecture and Building Press: Beijing, China, 2019. [Google Scholar]
- Wang, J. Development Status and Thinking of Construction industrialization in China. Journal of Civil Engineering—2017 "Forum" Compilation; China Academy of Building Science: Beijing, China, 2017; pp. 25–47. [Google Scholar]
- Asia Pacific Institute of Construction Technology Information Co, Ltd. Lauguesi Application Development of Prefabricated Buildings Construction Technology Magazine. In Proceedings of the 2019 National Exchange Meeting on New Technology of Construction, Beijing, China, November 2019; pp. 85–86. [Google Scholar]
- Jiangsu Provincial Department of Housing and Urban-Rural Development. Prefabricated Building Technical Manual (Concrete Structure Volume Production Chapter); China Architecture and Building Press: Beijing, China, 2021. [Google Scholar]
- Jiangsu Provincial Department of Housing and Urban-Rural Development/Jiangsu Provincial Department of Housing and Urban-Rural Development Science and Technology Development Center. Prefabrication and Installation Technology of Prefabricated Concrete Building Components; Southeast University Press: Nanjing, China, 2021. [Google Scholar]
- TY01-01(01)-2016; Prefabricated Construction Engineering Consumption Quota. China Planning Press: Beijing, China, 2017.
- DBJ51/T088-2017; Sichuan Province Prefabricated Concrete Building Precast Component Production and Construction Information Technology Standard. Sichuan Provincial Department of Housing and Urban-Rural Development: Chengdu, China, 2018.
- T/BIAS 5-2019; Code for Fabrication and Inspection of Precast Concrete Components. Shenzhen Building Industrialization Association: Shenzhen, China, 2020.
- T/LESC 01-2021; Production Standardization of Precast Concrete Components for Prefabricated Buildings. Shandong Engineering Construction Standard Cost Association: Jinan, China, 2021.
- Mudiyanselage, S.E.; Nguyen, P.H.D.; Rajabi, M.S.; Akhavian, R. Automated workers’ ergonomic risk assessment in manual material handling using sEMG wearable sensors and machine learning. Electronice 2021, 10, 2558. [Google Scholar] [CrossRef]
- Schober, P.; Estiri, S.N.; Aygun, S.; Jalilvand, A.H.; Najafi, M.H.; Taheri Nejad, N. Stochastic Computing Design and Implementation of a Sound Source Localization System. IEEE J. Emerg. Sel. Top. Circuits Syst. 2023, 13, 3243604. [Google Scholar] [CrossRef]
- Estiri, S.N.; Jalilvand, A.H.; Naderi, S.; Najafi, M.H.; Fazeli, M. A Low-Cost Stochastic Computing-based Fuzzy Filtering for Image Noise Reduction. In Proceedings of the 2022 IEEE 13th International Conference on Green And Sustainable Computing (IGSC), Electrician Network, Pittsburgh, PA, USA, 24–25 October 2022. [Google Scholar]
- Rabiee, F.; Kajouyan, M.; Estiri, N.; Fluech, J.; Fazeli, M.; Patooghy, A. Enduring non-volatile L1 cache using low-retention-time STTRAM cells. In Proceedings of the 2020 IEEE Computer Society Annual Symposium on Vlsi (ISVLSI 2020), Electrician Network, Limassol, Cyprus, 6–8 July 2020. [Google Scholar]
- Ghasemi, M.; Rajabi, M.S.; Rezaeiashtiani, M.; Ourang, S. Automation of Multi-Tower Crane Location Optimization in Pre-Fabricated Construction Sites: An Application Programming Interface Approach. In Proceedings of the 2nd Joint Conference of the Construction Research Congress (CRC), Iowa State Univ, Des Moines, IA, USA, 26 April 2024. [Google Scholar]
- Ma, W.M.; Almasifar, N.; Amini, R.; Ourang, A.; Mahariq, I.; Alhoee, J. Crashworthiness evaluation and optimization of full polypropylene sandwich tubes under low-velocity impact based on machine learning algorithms. Structures 2024, 60, 105901. [Google Scholar] [CrossRef]
- Ourang, A.; Pilehvar, S.; Mortezaei, M.; Damircheli, R. Effect of aluminum doped iron oxide nanoparticles on magnetic properties of the polyacrylonitrile nanofibers. J. Polym. Eng. 2017, 37, 1515. [Google Scholar] [CrossRef]
- Shiva, O.; Armin, O. Optimizing Power Balance and Communication links in Microgrids: A Clustering Approach Using Particle Swarm Optimization. Asian J. Soc. Sci. Manag. Technol. 2023, 5, 6. [Google Scholar]
- Naderi, H.; Heydari, M.H.; Jalal, M.P. Risk Analysis in Implementing Building Energy Performance Projects: Hybrid DANP-VIKOR Model Analysis—A Case Study in Iran. Buildings 2023, 13, 2066. [Google Scholar] [CrossRef]
- Wang, S.X.; Yuan, X.J. Field Selection Index System of Highway Engineering Construction Quota Determination based on AHP. J. Chang. Univ. Sci. Technol. (Nat. Sci. Ed.) 2012, 9, 15–18. [Google Scholar]
- Zhang, B.J. Analytic Hierarchy Process and Its Application Cases; Electronic Industry: Beijing, China, 2014. [Google Scholar]
- Zhang, Z.; Wang, R.H.; Huang, P.F.; Wang, X.L.; Wang, S.H. Risk evaluation of large-scale seawater desalination projects based on an integrated fuzzy comprehensive evaluation and analytic hierarchy process method. Desalination 2020, 478, 114286. [Google Scholar] [CrossRef]
- Zhang, J.J.; Zeng, X.Y.; Dong, M.; Yuan, H. A New Consumer Profile Definition Method Based on Fuzzy Technology and Fuzzy AHP. Autex Res. J. 2022, 22, 0027. [Google Scholar] [CrossRef]
- Plebankiewicz, E.; Kubek, D. Multicriteria Selection of the Building Material Supplier Using AHP and Fuzzy AHP. J. Constr. Eng. Manag. 2016, 142, 1033. [Google Scholar] [CrossRef]
- Sharma, M.K. Priorition of Overall Sustainability Factors of Cloud Manufacturing through AHP And Fuzzy AHP Approach. Sci. J. Silesian Univ. Technol. Ser. Transp. 2023, 119, 3. [Google Scholar]
- Agrawal, N.; Kant, S. Supplier Selection Using Fuzzy-AHP: A Case Study. In Proceedings of the Trends in Manufacturing Processes: Select Proceedings of ICFTMM 2020, Delhi Tech Campus, Noida, India, 29 September 2020; Volume 10, p. 1007. [Google Scholar]
- Jayawickrama, H.M.M.M.; Kulatunga, A.K.; Mathavan, S. Fuzzy AHP based Plant Sustainability Evaluation Method. In Proceedings of the 14th Global Conference on Sustainable Manufacturing, GCSM 2016, Stellenbosch, South Africa, 3–5 October 2016; Volume 8, p. 073. [Google Scholar]
- Saucedo-Martínez, J.A.; Salais-Fierro, T.E.; Rodriguez-Aguilar, R.; Marmolejo-Saucedo, J.A. Selecting the Distribution System using AHP and Fuzzy AHP Methods. Mob. Netw. Appl. 2024, 10, 1007. [Google Scholar] [CrossRef]
- Meshram, S.G.; Alvandi, E.; Singh, V.P.; Meshram, C. Comparison of AHP and fuzzy AHP models for prioritization of watersheds.8. Soft Comput. 2019, 23, 03900. [Google Scholar] [CrossRef]
- Du, T.; Song, Y.H.; Li, Z.Y.; Zhang, J.L. Construction safety evaluation of building project based on fuzzy comprehensive evaluation method. J. Civ. Eng. Manag. 2019, 6, 61–66+78. [Google Scholar]
- Song, Y.H.; Wang, J.W.; Guo, F.; Lu, J.Q.; Liu, S. Research on Supplier Selection of Prefabricated Building Elements from the Perspective of Sustainable Development. Sustainability 2021, 13, 6080. [Google Scholar] [CrossRef]
- Linnel, M.S.B.; Shiva, O.; Jennifer, P.; Karin, K. Increasing safety in residential construction through simplified earthquake- and typhoon-resistant guidelines. J. Future Sustain. 2023, 10, 5267. [Google Scholar]
- Tao, L.Y.; Li, Z.D.; Zhang, M. The Establishment of Production Capacity Evaluation Indicator System Based on R-Cluster and Coefficient of Variation. Appl. Mech. Mater. 2014, 397–400, 2565. [Google Scholar] [CrossRef]
- He, J.B.; Gu, X.J.; Zhang, J. Supply and Demand Matching for Production Capacity Sharing. Comput. Integr. Manuf. Syst. 2022, 28, 880–891. [Google Scholar]
- Jiang, P.; Ding, J.L.; Guo, Y. Application and dynamic simulation of improved genetic algorithm in poduction workshop scheduling. Int. J. Simul. Modeing 2018, 17, 159–169. [Google Scholar] [CrossRef]
- Ahmed, W.; Ashraf, M.S.; Khan, S.A.; Kusi-Sarpong, S.; Arhin, F.K.; Kusi-Sarpong, H.; Najmi, A. Analyzing the impact of environmental collaboration among supply chain stakeholders on a firm’s sustainable performance. Oper. Manag. Res. 2020, 13, 4–21. [Google Scholar] [CrossRef]
- Xu, X.H.; Ren, Y. Cycle Model and Fuzzy Evaluation of Enterprise Real-time Customized Production Capacity. China Mech. Eng. 2007, 12, 1465–1470. [Google Scholar]
| Evaluation Score Value | Basis of Scoring |
|---|---|
| 0 | Does not matter |
| 1 | Of equal importance |
| 9 | Very/Quite important |
| 2, 3, 4, 5, 6, 7, 8 | In the middle of the above importance degrees, the importance degree increases in turn |
| B | P1 | P2 | P3 | P4 | P5 | P6 | P7 | Integral |
|---|---|---|---|---|---|---|---|---|
| P1 | 1 | X | Z1 | |||||
| P2 | 1 | Z2 | ||||||
| P3 | 1 | Z3 | ||||||
| P4 | 1 | Z4 | ||||||
| P5 | 1 | Z5 | ||||||
| P6 | 1 | Z6 | ||||||
| P7 | 1 | Z7 |
| Category | Number |
|---|---|
| Enterprise senior management personnel | 1 |
| Professor of assembly research at university | 2 |
| Professional and technical personnel | 1 |
| Standard quota by industry experts | 2 |
| n | 1 | 2 | 3 | 4 | 5 | 6 | 7 | 8 | 9 |
|---|---|---|---|---|---|---|---|---|---|
| RI | 0 | 0 | 0.58 | 0.90 | 1.12 | 1.24 | 1.32 | 1.41 | 1.45 |
| Level | Instructions |
|---|---|
| Initial level | The production is chaotic, the accuracy of the components produced meet only the minimum standard, and the production skills are rough. |
| Basic level | The production is orderly, and the qualified rate pertaining to the precision of the components produced not only meets the minimum requirements, but the production skills also belong to the average level of the whole PCME. |
| Reinforcement level | The production is orderly, the precision of the components produced is at a higher level, and the production skills are relatively mature. The component production units belonging to this stage attach importance to the improvement of technology. |
| Maturity level | In the superior production state, the precision qualified rate of the components produced is the highest standard in the industry, forming quite a perfect PCP upgrading structure. |
| Method | Advantage | Disadvantage |
|---|---|---|
| Analytic hierarchy process | Structured to solve complex problems, and able to consider qualitative and quantitative factors | Numerous judgment matrices are required, and the consistency of judgment is necessary |
| Fuzzy comprehensive evaluation method | Suitable for a fuzzy and uncertain decision-making environment. | It may be more difficult address some problems that require higher accuracy |
| Data envelopment analysis | Ability to process multiple input and output variables without prior information | It is sensitive to outliers, and the calculation is relatively complex. |
| BP neural network method | Suitable for solving problems with complex internal mechanism (i.e., miscellaneous problems) | The required sample size is large, and the evaluation accuracy is not high |
| Grey relational degree method | Low data requirements, simple operation, and reliable results | Strong subjectivity |
| Number | Factor of Influence | Degree of Importance | |||
|---|---|---|---|---|---|
| Most | More | General | Minimum | ||
| 1 | Perfection of the internal incentive mechanism | 982 | 216 | 205 | 89 |
| 2 | Management system (e.g., inspection and measurement) soundness | 716 | 462 | 197 | 117 |
| 3 | Reasonable degree of decomposition of the production organization | 903 | 321 | 200 | 68 |
| 4 | Level of coordination and communication between departments | 781 | 298 | 318 | 95 |
| 5 | Operator training and education level | 703 | 549 | 177 | 63 |
| 6 | The advanced level of production machinery | 791 | 466 | 125 | 110 |
| 7 | The number of production machines | 681 | 424 | 273 | 114 |
| 8 | Mechanical equipment utilization level | 486 | 411 | 378 | 217 |
| 9 | The complete degree of production machinery | 791 | 416 | 152 | 133 |
| 10 | Application of machinery to field conditions | 893 | 399 | 104 | 96 |
| 11 | Mechanical equipment deployment level | 721 | 387 | 278 | 106 |
| 12 | The degree of completeness of process procedures | 786 | 391 | 203 | 112 |
| 13 | Feasibility of production plan and technical measures | 692 | 551 | 139 | 110 |
| 14 | Whether the technology research and development center are established or not | 663 | 416 | 311 | 102 |
| 15 | Enterprise technical level accumulation degree | 721 | 456 | 222 | 93 |
| 16 | The level of leadership, organization, and control of management personnel | 815 | 401 | 185 | 91 |
| 17 | Reasonable on-site personnel allocation | 640 | 445 | 292 | 115 |
| 18 | Employee’s understanding of component knowledge and the production process | 482 | 458 | 377 | 175 |
| 19 | Employee awareness of component quality | 627 | 535 | 211 | 119 |
| 20 | Skill level of production personnel | 679 | 512 | 210 | 91 |
| 21 | Proficiency of production and operation personnel | 480 | 492 | 257 | 263 |
| 22 | Team cooperation level | 621 | 467 | 280 | 124 |
| 23 | The labor enthusiasm of production and operation personnel | 815 | 401 | 185 | 91 |
| 24 | Operating site environment comfort | 640 | 445 | 292 | 115 |
| 25 | Reasonable layout of functional areas | 681 | 424 | 273 | 114 |
| 26 | Production preparation is sufficient | 627 | 535 | 211 | 119 |
| 27 | Reasonableness of working face distribution | 480 | 492 | 257 | 263 |
| 28 | Power supply level | 621 | 467 | 280 | 124 |
| 29 | Product pass rate | 679 | 512 | 210 | 91 |
| 30 | Precision of product | 815 | 401 | 185 | 91 |
| 31 | Reasonable placement of materials | 640 | 445 | 292 | 115 |
| 32 | Procurement and supply level of materials and materials | 681 | 424 | 273 | 114 |
| 33 | Quality level of raw materials and collaboration materials | 627 | 535 | 211 | 119 |
| Number | Factor of Influence | Importance Index |
|---|---|---|
| 1 | Perfection of internal incentive mechanism | 88.03 |
| 2 | Management system (e.g., inspection and measurement) soundness | 83.82 |
| 3 | Reasonable degree of decomposition of production organization | 87.60 |
| 4 | Level of coordination and communication between departments | 83.66 |
| 5 | Operator training and education level | 85.36 |
| 6 | The advanced level of production machinery | 85.98 |
| 7 | The number of production machines | 82.41 |
| 8 | Mechanical equipment utilization level | 75.63 |
| 9 | The complete degree of production machinery | 85.00 |
| 10 | Application of machinery to field conditions | 88.00 |
| 11 | Mechanical equipment deployment level | 83.10 |
| 12 | The degree of completeness of process procedures | 84.81 |
| 13 | Feasibility of production plan and technical measures | 84.46 |
| 14 | Whether the technology research and development center are established or not | 81.98 |
| 15 | Enterprise technical level accumulation degree | 84.20 |
| 16 | The level of leadership, organization, and control of management personnel | 86.01 |
| 17 | Reasonable on-site personnel allocation | 81.58 |
| 18 | Employee’s understanding of component knowledge and production processes | 76.72 |
| 19 | Employee awareness of component quality | 82.39 |
| 20 | Skill level of production personnel | 83.85 |
| 21 | Proficiency of production and operation personnel | 75.94 |
| 22 | Team cooperation level | 81.25 |
| 23 | The labor enthusiasm of production and operation personnel | 86.01 |
| 24 | Operating site environment comfort | 81.58 |
| 25 | Reasonable layout of functional areas | 82.41 |
| 26 | Production preparation is sufficient | 82.39 |
| 27 | Reasonableness of working face distribution | 75.94 |
| 28 | Power supply level | 81.25 |
| 29 | Product pass rate | 83.85 |
| 30 | Precision of product | 86.01 |
| 31 | Reasonable placement of materials | 81.58 |
| 32 | Procurement and supply level of materials and materials | 82.41 |
| 33 | Quality level of raw materials and collaboration materials | 82.39 |
| Target Layer | First-Level Index | Second-Level Index |
|---|---|---|
| component production capacity of manufacturing enterprises | Enterprise organization management level (P1) | Perfection of internal incentive mechanism (Q1) |
| Management system (e.g., inspection and measurement) soundness (Q2) | ||
| Reasonable degree of decomposition of production organization (Q3) | ||
| Level of coordination and communication between departments (Q4) | ||
| Operator training and education level (Q5) | ||
| Level of personnel (P2) | The level of leadership, organization, and control of management personnel (Q6) | |
| Reasonable on-site personnel allocation (Q7) | ||
| Employee awareness of component quality (Q8) | ||
| Skill level of production personnel (Q9) | ||
| Team cooperation level (Q10) | ||
| The labor enthusiasm of production and operation personnel (Q11) | ||
| Mechanical equipment level (P3) | The advanced level of production machinery (Q12) | |
| The number of production machines (Q13) | ||
| The complete degree of production machinery (Q14) | ||
| Application of machinery to field conditions (Q15) | ||
| Mechanical equipment deployment level (Q16) | ||
| Materials and supplies (P4) | Reasonable placement of materials (Q17) | |
| Procurement and supply level of materials and materials (Q18) | ||
| Quality level of raw materials and collaboration materials (Q19) | ||
| Product quality level (P5) | Product pass rate (Q20) | |
| Precision of product (Q21) | ||
| Level of technical competence (P6) | The degree of completeness of process procedures (Q22) | |
| Feasibility of production plan and technical measures (Q23) | ||
| Enterprise technical level accumulation degree (Q24) | ||
| Whether the technology research and development center are established or not (Q25) | ||
| Production environment (P7) | Operating site environment comfort (Q26) | |
| Reasonable layout of functional areas (Q27) | ||
| Production preparation is sufficient (Q28) | ||
| Power-supply level (Q29) |
| B | W | λmax | ||||||
|---|---|---|---|---|---|---|---|---|
| B1 | 0.074 | 0.186 | 0.124 | 0.012 | 0.346 | 0.221 | 0.037 | 6.909 |
| B2 | 0.073 | 0.256 | 0.134 | 0.037 | 0.377 | 0.112 | 0.012 | 6.985 |
| B3 | 0.011 | 0.067 | 0.244 | 0.033 | 0.344 | 0.145 | 0.156 | 7.644 |
| B4 | 0.259 | 0.119 | 0.162 | 0.011 | 0.335 | 0.082 | 0.032 | 6.906 |
| B5 | 0.070 | 0.110 | 0.170 | 0.010 | 0.350 | 0.250 | 0.040 | 6.924 |
| First-Level Index | Value of Weight | Second-Level Index | Value of Weight | Second-Level Index | Value of Weight | Second-Level Index | Value of Weight | Second-Level Index | Value of Weight |
|---|---|---|---|---|---|---|---|---|---|
| P1 | 0.097 | Q1 | 0.2 | Q2 | 0.14 | Q3 | 0.3 | Q4 | 0.14 |
| Q5 | 0.22 | ||||||||
| P2 | 0.148 | Q6 | 0.11 | Q7 | 0.24 | Q8 | 0.05 | Q9 | 0.25 |
| Q10 | 0.2 | Q11 | 0.15 | ||||||
| P3 | 0.167 | Q12 | 0.2 | Q13 | 0.12 | Q14 | 0.23 | Q15 | 0.2 |
| Q16 | 0.25 | ||||||||
| P4 | 0.021 | Q17 | 0.41 | Q18 | 0.29 | Q19 | 0.3 | ||
| P5 | 0.35 | Q20 | 0.5 | Q21 | 0.5 | ||||
| P6 | 0.162 | Q22 | 0.18 | Q23 | 0.23 | Q24 | 28 | Q25 | 0.31 |
| P7 | 0.055 | Q26 | 0.13 | Q27 | 0.39 | Q28 | 0.29 | Q29 | 0.19 |
| Index of Evaluation | Initial Level | Basic Level | Reinforcement Level | Maturity Level |
|---|---|---|---|---|
| Q1 | 0 | 0.2 | 0.5 | 0.3 |
| Q2 | 0 | 0.5 | 0.4 | 0.1 |
| Q3 | 0 | 0.3 | 0.5 | 0.2 |
| Q4 | 0.1 | 0.4 | 0.4 | 0.1 |
| Q5 | 0 | 0.3 | 0.4 | 0.3 |
| Q6 | 0 | 0.4 | 0.5 | 0.1 |
| Q7 | 0.1 | 0.2 | 0.6 | 0.1 |
| Q8 | 0.6 | 0.3 | 0.1 | 0 |
| Q9 | 0 | 0.2 | 0.4 | 0.4 |
| Q10 | 0.1 | 0.4 | 0.3 | 0.2 |
| Q11 | 0.1 | 0.4 | 0.4 | 0.1 |
| Q12 | 0.4 | 0.3 | 0.3 | 0 |
| Q13 | 0.2 | 0.4 | 0.3 | 0.1 |
| Q14 | 0.1 | 0.5 | 0.4 | 0 |
| Q15 | 0.3 | 0.4 | 0.2 | 0.1 |
| Q16 | 0.3 | 0.4 | 0.3 | 0 |
| Q17 | 0.3 | 0.5 | 0.2 | 0 |
| Q18 | 0 | 0.2 | 0.6 | 0.2 |
| Q19 | 0 | 0.6 | 0.3 | 0.1 |
| Q20 | 0 | 0.2 | 0.5 | 0.3 |
| Q21 | 0 | 0.3 | 0.5 | 0.2 |
| Q22 | 0.1 | 0.2 | 0.6 | 0.1 |
| Q23 | 0 | 0.3 | 0.7 | 0 |
| Q24 | 0.2 | 0.5 | 0.3 | 0 |
| Q25 | 0.1 | 0.4 | 0.4 | 0.1 |
| Q26 | 0 | 0.2 | 0.5 | 0.3 |
| Q27 | 0.1 | 0.4 | 0.4 | 0.1 |
| Q28 | 0 | 0.4 | 0.5 | 0.1 |
| Q29 | 0 | 0 | 0.7 | 0.3 |
| Level of Production Capacity | Initial Level | Basic Level | Reinforcement Level | Maturity Level |
|---|---|---|---|---|
| number | 3 | 7 | 18 | 6 |
| proportion | 0.088 | 0.206 | 0.529 | 0.177 |
Disclaimer/Publisher’s Note: The statements, opinions and data contained in all publications are solely those of the individual author(s) and contributor(s) and not of MDPI and/or the editor(s). MDPI and/or the editor(s) disclaim responsibility for any injury to people or property resulting from any ideas, methods, instructions or products referred to in the content. |
© 2024 by the authors. Licensee MDPI, Basel, Switzerland. This article is an open access article distributed under the terms and conditions of the Creative Commons Attribution (CC BY) license (https://creativecommons.org/licenses/by/4.0/).
Share and Cite
Cao, L.; Cong, W.; Su, Y.; Zheng, Z. Research on the Production Capacity Evaluation of Prefabricated Component Manufacturing Enterprises. Buildings 2024, 14, 1816. https://doi.org/10.3390/buildings14061816
Cao L, Cong W, Su Y, Zheng Z. Research on the Production Capacity Evaluation of Prefabricated Component Manufacturing Enterprises. Buildings. 2024; 14(6):1816. https://doi.org/10.3390/buildings14061816
Chicago/Turabian StyleCao, Lifei, Weiyi Cong, Yikun Su, and Zhizhe Zheng. 2024. "Research on the Production Capacity Evaluation of Prefabricated Component Manufacturing Enterprises" Buildings 14, no. 6: 1816. https://doi.org/10.3390/buildings14061816