Abstract
Personal Comfort Systems (PCSs) have emerged as an innovative solution to address variable individual conditions that traditional comfort models excluded. This study investigates the impact of the simultaneous application and use of three PCSs in real office environments on an occupant’s thermal, light, and air quality perception and seeks to understand different environmental stimuli behind personal actions and behaviors. It uses qualitative and quantitative monitoring of specific environmental conditions and individual actions of 72 participants in four office buildings in different climatic zones of Chile in summer and winter. The PCSs tested differ in their costs, technological level, usability, and portability. The results show that 85.5% improved their perceived comfort by using the PCSs, although not from simultaneous use, but rather from the use of one system over another. The desk fan stands out as having the highest acceptance and utilization rate. However, certain environmental conditions cause opposite actions: limited lighting control or little daylight causes the fan to be turned on. The present study’s data could contribute to a new environmental comfort model for shared office spaces, fostering significant improvements in occupant satisfaction and energy efficiency. This practical and scientific research is of interest to architects, designers, and stakeholders from the construction production field.
1. Introduction
In response to the premise that thermal comfort is a fundamental goal in building design to improve occupant satisfaction, health, and productivity [1,2], different models have been developed to learn and predict people’s comfort requirements (e.g., the adaptive model and the PMV/PPD—Predictive Mean Vote and Predicted Percentage of Dissatisfied). Both only predict the needs of a general population through the average response of a group of people under static (“neutral”) conditions [3,4,5,6].
However, these standards lack predictive power at an individual level and disregard the diversity of inter—(between one individual and another) and intra (the same individual in the same environment in different circumstances)—individual requirements and expectations [7,8,9,10]. On the other hand, investigations such as Zhanget et al. [11] and Veselý et al. [12] state that users tolerate and accept temperatures outside the range stipulated by the standards under certain conditions and that short-term temperature fluctuations (i.e., when moving from one office to another) quickly affect the occupants’ thermal comfort. Feeling dissatisfied drives certain occupant responses or actions to satisfy their thermal, visual, acoustic, and air quality needs in a given space and time (“right here, right now”).
Likewise, environmental differences between workstations are recorded in environments with the same physical conditions (open-plan offices) and equally configured HVAC systems [13], highlighting two main problems. First, they are designed to condition entire spaces, regardless of whether these are partially or fully occupied, wasting large amounts of energy [14]. Secondly, despite being regulated and set up following standards governed by optimal comfort criteria, they fail to satisfy occupants’ comfort requirements, mainly due to the variability that characterizes each individual and that does not fit the average used to define the criterion.
In recent years, the use of Personal Comfort Systems (PCSs) has been investigated as an alternative to conventional systems, especially in office spaces [1,15].
Personal Comfort Control
PCSs allow individuals to adjust, control, and tailor their environment without altering the other occupants’ environments [15]. This flexibility significantly impacts their comfort tolerance, increasing satisfaction [16,17,18] and benefiting the occupant’s physical, psychological, and psychological well-being [1,4,9,14,16]. In thermal terms, this phenomenon is known as “thermal alliesthesia”, which, when applied to buildings, is defined as a thermal sensation that generates pleasure without adjusting to thermal neutrality that may not be necessary or desirable [17].
Moreover, PCSs are more efficient than generalized HVAC systems, as energy is used where and when needed [18]. Parameters such as HVAC setpoints play a fundamental role in this regard. Generally, these are set depending on the location and use of the building. Indeed, using the requirements and preference data of users generated by PCSs will reduce the need for HVAC systems, and consequently, energy consumption will be reduced without lowering satisfaction levels [2,12,19,20,21,22,23].
PCSs can be categorized by (1) their portability (wearable or non-wearable) [24], (2) the heat transfer method [25], or (3) their individual thermal effect (large-area air conditioning of different parts of the body or local air conditioning of one part of the body) [23].
Different devices and technologies have been used in the literature, such as (i) the heated/cooled chair [22,26,27,28,29], which significantly influences people’s experience regarding their thermal sensation, improving thermal comfort and perceived air quality; (ii) footwarmers [16,20,30], which provide individual heating control over a segment of the body that strongly influences the perception of comfort when one is cold in general and which influence energy consumption, since they are used and accepted with a lower ambient heating setpoint; (iii) dynamic wearable PCSs, like a wrist cooling/warming device [31,32,33], used on the wrist to provide cooling or warming in the form of dynamic waves, improving the perception of thermal comfort and pleasure throughout the body, but with a more significant effect in that area of the arm.
This study aims to assess whether the simultaneous use of the three PCSs significantly impacts human subjects’ thermal, light, and Indoor Environment Quality (IEQ) perception in real occupation conditions. It also seeks to understand the synergistic and/or antagonistic interaction of environmental stimuli that drive individuals’ personal control actions.
2. Materials and Methods
The methodology is mixed convergent, where experimental and qualitative–quantitative information is integrated to understand the phenomenon under study [34], in this case, in a real context. Compared with an experiment in a climate-controlled chamber, there may be issues with the sample quantity and the analysis [35]. However, it allows an occupant to see how having different but integrated routines can relate to the space and devices, bringing the experimental findings closer to the reality of the building’s users.
2.1. PCS Devices
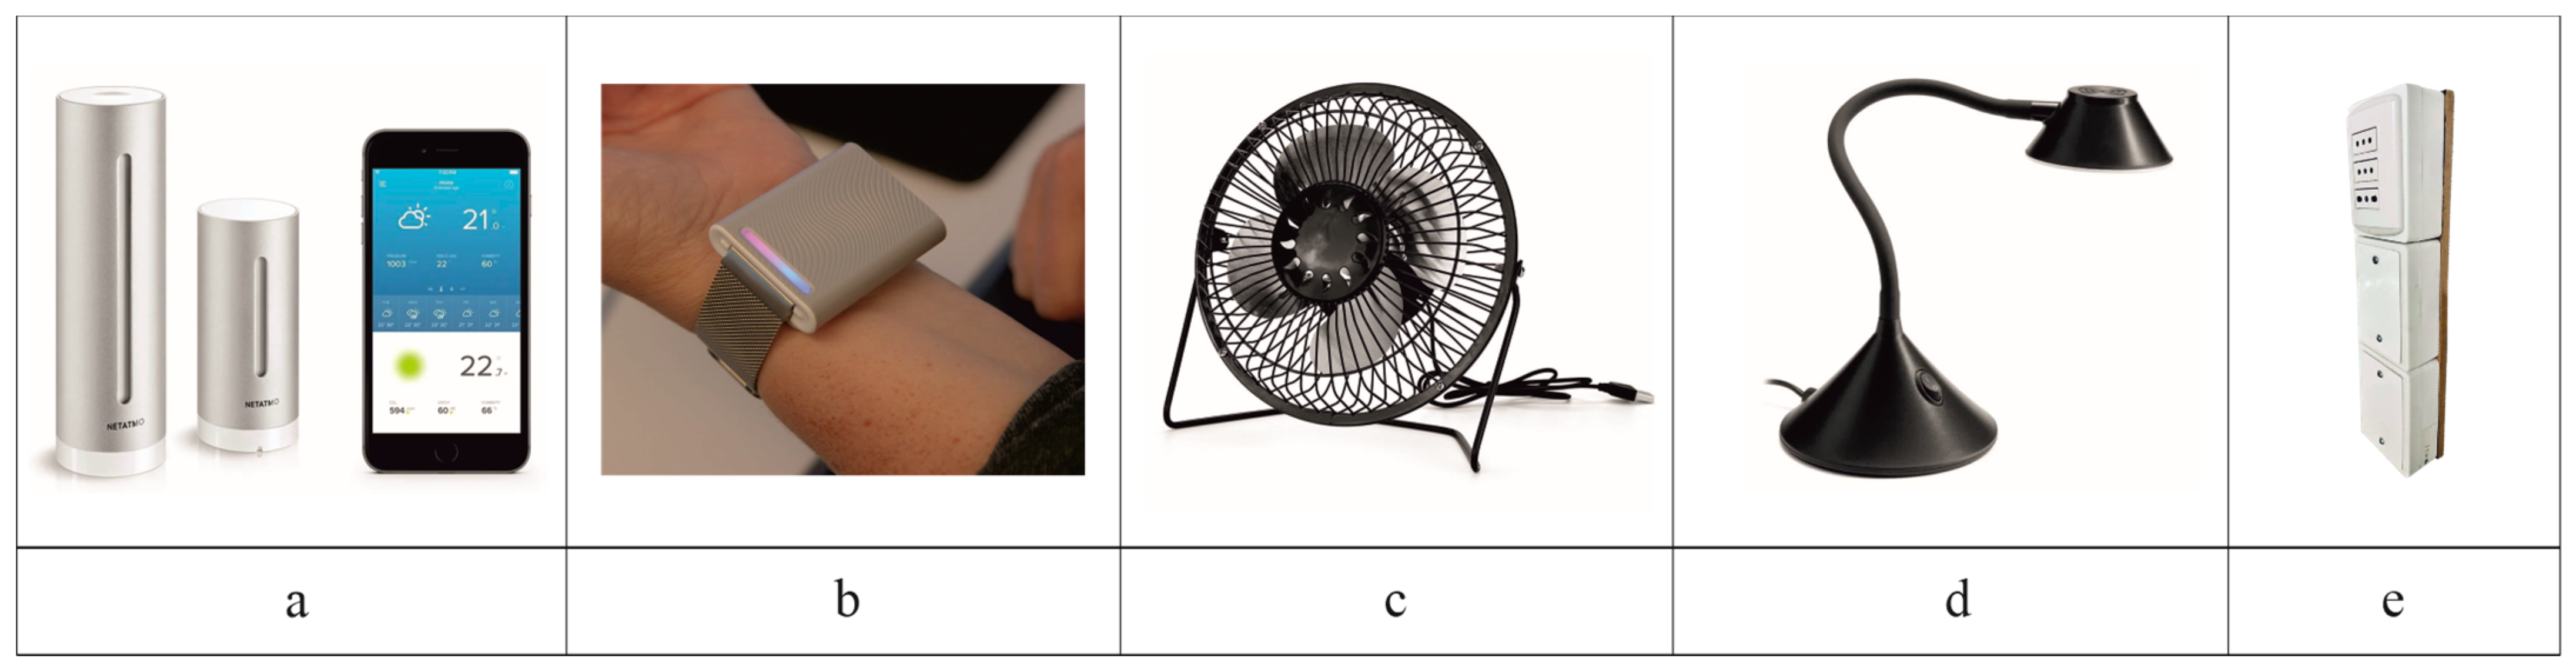
To understand the thermal, humidity, and air quality performance at each workstation and outside, domestic weather stations, Netatmo smart home weather stations (Figure 1a), are installed, which provide data at a 5 min interval with an uncertainty level of ±0.3 °C and ±0.3%.

Figure 1.
The devices implemented in this field study. Smart Home Weather Stations (a), Embre waves (b), Desk Fun (c), Lamp Fan (d), Plug stores information (e).
The PCSs provided are from two categories: wearables and limited mobility. The first is an Embr Wave thermal wristband [36] (Figure 1b), mainly composed of aluminum, a popular material used for heat exchange. Inside the PCS and touching the skin is a thermoelectric tile made of materials that change temperature when exposed to an electrical current. This is worn on the inside of the wrist, where temperature-sensitive thermoreceptors receive rhythmic cooling or warming waves and stimulate parts of the brain that, in turn, balance the body’s autonomic nervous system to create a sense of thermal well-being [5]. During use, the subject can control the average temperature within a range of 31–42 °C for heating and 25–30 °C for cooling, based on the recognized thermal sensitivity of the skin’s warm and cold thermoreceptors [37]. The Embr Wave is linked to a single person on a mobile app and is paired daily. As for the operation, the user is free to start, pause, and/or turn off the device whenever necessary, either directly on their wristband or from the app.
The use of a standard desk fan and desk lamp is defined within the second category, limited mobility. The small 2.5 W 4-metal blade inclined fan (Figure 1c) faces the person’s upper trunk at the desk so that, preferably, the fresh air supply is directed toward the occupant’s breathing area and improves the inhaled air quality [23]. Using a switch, the user can turn the fan on and off as they like. Also, they can move the fan’s position on the desk if needed. The desk lamp is an LED lamp (power 3.2 W, 4000 K temperature range, and 240 lm luminous flux) (Figure 1d) and has the same on/off and mobility options as the fan.
Both limited mobility PCSs are connected to a socket designed exclusively for this study (Figure 1e). The plug stores information regarding the switching on and off of the devices and the power required. If there is power in the plug, it must take at least 5 s to ensure that the algorithm detects the change in consumption and records the event in the MicroSD memory card. These data include the date and exact time. To avoid opening the plug’s boxes to remove the MicroSD memory card, an Android application (APK) was developed to communicate the data via Bluetooth.
2.2. Test Protocol
The present study was conducted in real shared office spaces in four buildings in different cities of Chile. The buildings were designed specifically for this use, so the Chilean Regulation on Basic Sanitary and Environmental Conditions requirements in Workplaces were considered. It is important to note that no interventions were made for ventilation rates, room temperature, or air conditioning (AC) periods, and although all of the cases have HVAC systems, not all of them keep it on continuously. The field data were collected over 5–6 days during summer in December 2021 and January 2022 and winter in July and August 2022.
To begin with, the participants were invited to answer an initial questionnaire and were trained in using the devices without altering how they usually dress and use the place. In addition, two assistants were available daily to clarify doubts and download the information at the end of the working day. At the end of the field study, an individual interview was conducted with each participant.
2.3. Survey and Interview
The survey was developed and validated for this study [13] as an alternative to paid surveys that include more holistic approaches, for example, those of the WELL Building Standard certification system. This survey aims to estimate the relationships between variables that positively and negatively affect the user’s perception, in addition to distinguishing factors contributing to the differences in occupant satisfaction, comfort, health, and well-being. The tool (Appendix A) is a general and exhaustive evaluation type which focuses on occupant characterization and provides long-term recognition [34]. It applies to buildings with and without HVAC systems, as well as to those that do not have exclusive energy efficiency and/or “green certifications”.
The final interview aims to understand the personal appreciation of the device-using experience and thus expand upon the interpretation of the PCS use results measured. Although this type of consultation details the interactions between occupants and their physical environment in a technical sense, it is also useful to interpret these interactions as each occupant evaluates the consequences and reflects on other issues, revealing problems that they find beneath the surface of the more technical analyses of buildings [38].
Thus, the reasons for the usage frequency of the devices and how the use impacts the occupant’s thermal, Indoor Air Quality (IAQ), and light perception satisfaction can be known. The interview considers closed and open questions. First, on a scale of 1–7, it asks to what extent the PCSs were used to adjust comfort, where 1 is “never”, and 7 is “always”. Then, open-ended questions are asked to understand the reasons for using the devices related to moments of use, continuity of use, perception, etc.
The interviews took place at the end of the working day on the last day of the study and lasted approximately 15 min. Unlike the survey, where each occupant answered alone, this was carried out by a research assistant who recorded and noted down the answers.
2.4. Data Collection
The cities where the fieldwork was carried out are Los Ángeles (case A), Rancagua (case B), Talcahuano (case C), and Concepción (case D) (Table 1). Although the latter two are separated by 15 km and have the same climate classification, there are significant differences in their microclimate.

Table 1.
Climatic characteristics of the case studies.
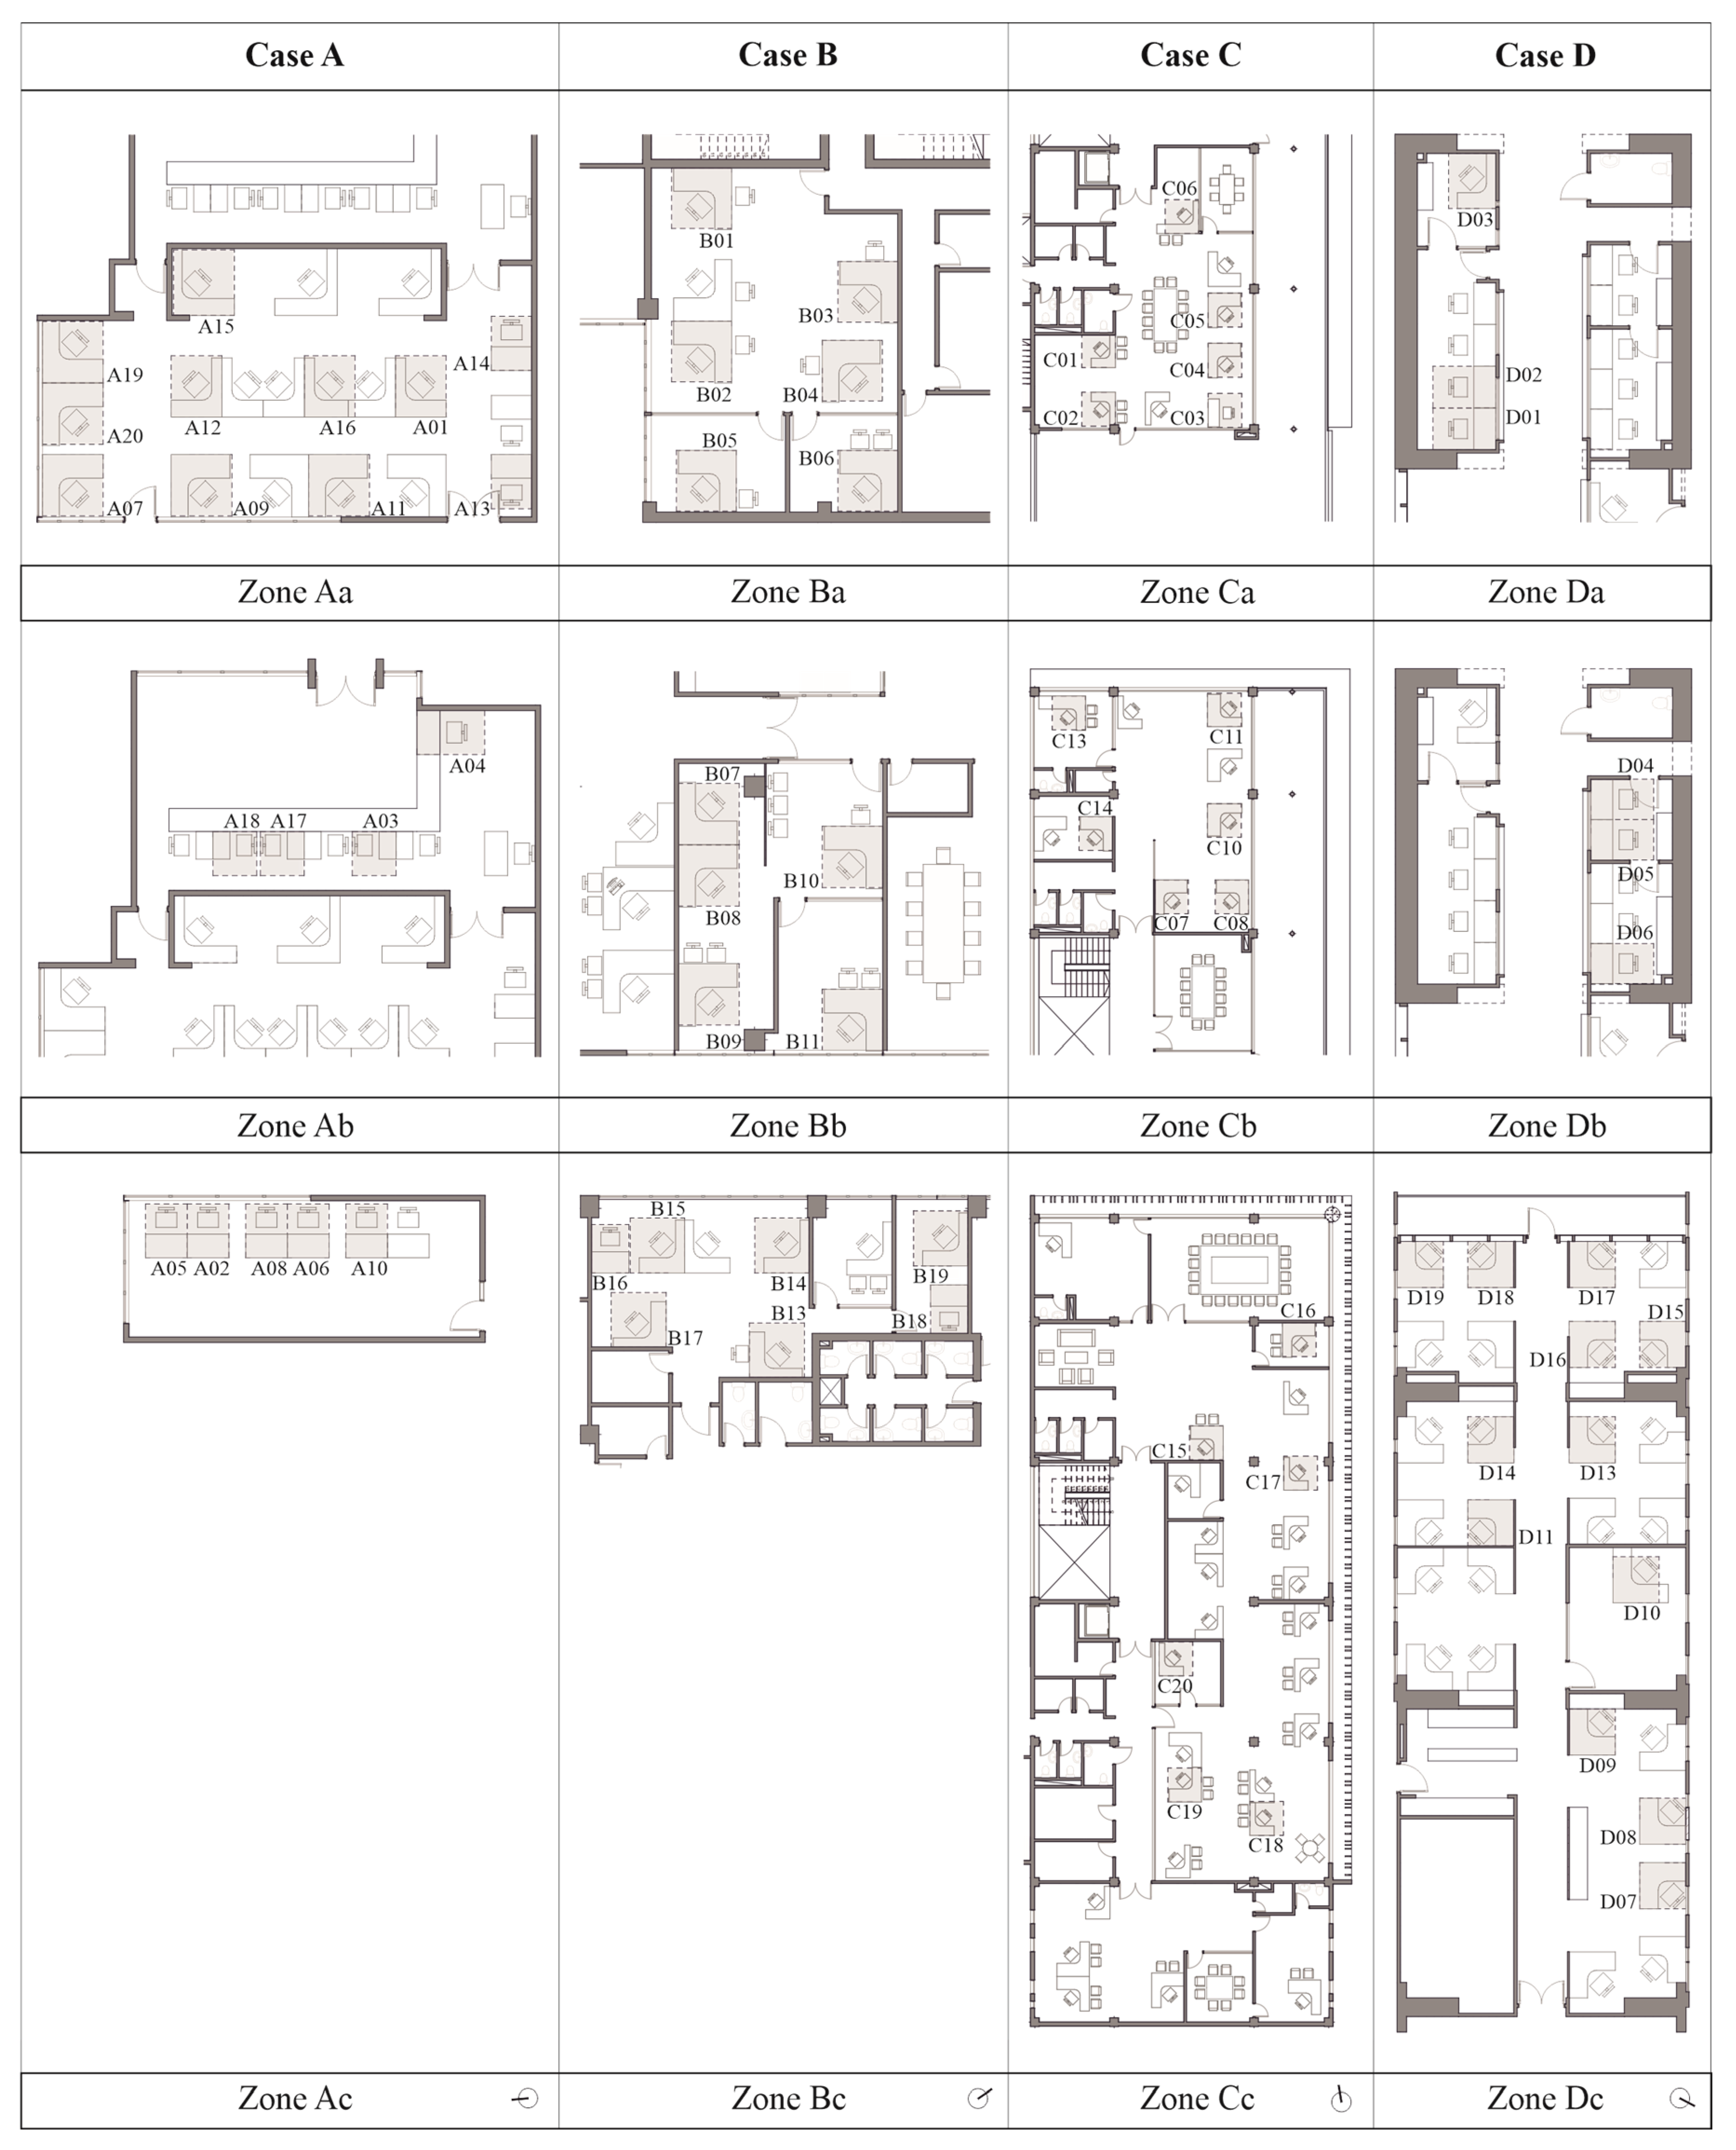
The study involved 72 individuals (19 men, 43 women, and 10 who did not answer). The location of the participants’ workstations in the offices is a fundamental aspect of the research, as their interaction with the PCSs is evaluated considering the spatial conditions. The occupants’ characteristics are shown in Appendix B, together with their responses on thermal, IAQ, and light comfort. The location is illustrated in Figure 2.
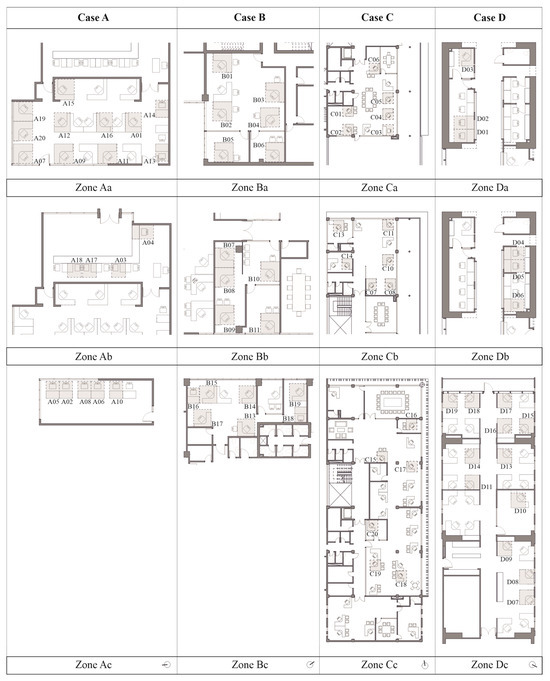
Figure 2.
The location of the participating occupants in the case study offices.
2.5. Data Analysis
The analysis consists of two parts. First, the most representative responses of the survey applied at the beginning of the study are analyzed, focusing on those aspects related to PCS usage. Then, an exhaustive analysis of the interaction of each occupant with the three PCSs provided is carried out, which allows the authors to determine when and how they use these devices. This information is related to the temperature, CO2, and lighting level measurements collected on-site and in simulated scenarios and the answers obtained in the final interview. The days on which the study was carried out are simulated using the Velux tool (ISO outline and False Color) to obtain the lighting level in each workspace.
In the analysis here, priority is given to the correlation between the perception of comfort, satisfaction, control, and interaction with the devices, specific data, and user opinion regarding the use of PCSs. This is fundamental, as it is known that occupants often declare contradictory aspects when being surveyed or interviewed for reasons such as appearance or ignorance [7].
The attendance of occupants at work is essential data, as it allows for the analysis of whether an occupant did not use the devices due to a lack of need or their absence on that specific day. Therefore, each dataset collected is analyzed based on the actual occupation time at the workplace.
The statistical analysis is divided into two parts: a descriptive analysis and a correlation analysis. The descriptive analysis aims to identify when devices are used and what characteristics each person has. The Pearson method (rho correlation coefficient) allows for quantifying the linear relationship between two continuous variables and is used for the correlation analysis, in this case, the hours of use of each device versus temperature, CO2, the control of several aspects, and satisfaction.
3. Results
3.1. Initial Surveys
In the first analysis of this fieldwork [13], differences of up to 3 °C and 500 ppm were observed between desks in the same office. This was also reflected in the responses regarding the perceived temperature, thermal, and light satisfaction (Appendix B).
The four case studies have different office layouts. Some are larger but shared by many people (Aa being the most representative, with 19 people), while others have fewer occupants on significantly reduced surfaces (Ac, Bc, Da, and Db). In the former, the differences in perception between users of the same space regarding the temperature, daylight, and comfort manifested in temperature and lighting are evident, and the same happens with the opportunities they feel they have to control their environmental conditions. There is a relationship between the proximity to windows and the perceived control, where if the distance is shorter, the control is greater. A total of 59.5% of people under 4 m from the window have complete control over solar protection in their workspace. Having greater control positively affects thermal and light satisfaction, although not for IAQ, where perceived control has no influence. This trend is observed in three cases, though case D is different. Satisfaction is not related to the perceived control of temperature and lighting. However, it is related to IAQ, where the greater the control, the greater the occupants’ satisfaction. Distance from the window has an average association with dizziness or lightheadedness symptoms but not with other negative health-related symptoms.
There are marked differences between the occupants of private and shared offices. There is less control in shared offices than in private offices, and only a few have it (those close to windows or in an age range between 35 and 54). In private offices, satisfaction increases with a greater perception of having control over environmental conditions.
The orientation of the offices and their windows to the outside does not affect satisfaction regarding lighting. In some cases, the orientation is unfavorable, with little daylight, but the occupants say they are satisfied (for example, office Bb). It is understood that excessively used artificial lighting may be influencing these responses. In the case studies, artificial lighting at the ceiling level is not installed efficiently; therefore, if an occupant wants to illuminate their desk, they must turn on the system of the entire office, positively or negatively affecting the rest of the group. Regarding the relationship between orientation and satisfaction compared to indoor temperature, an average association is seen if it is cold outside, with satisfaction decreasing in east- or west-facing offices. This is not the case in the other window orientation categories.
There is also a high (statistically significant) association between the type of grouping and ergonomic satisfaction in the workspace. This association is indirect, i.e., you tend to be dissatisfied when you move from an isolated desk to one attached to another. On the contrary, when you move from an attached to an isolated one, ergonomic satisfaction increases.
Contrary to what is assumed when the users’ interventions at the AC outlets are seen, there is no association between direct AC and thermal satisfaction in the workspace. There is also no significant association between body mass index (BMI) and satisfaction with environmental conditions.
3.2. Interaction with PCSs
In all cases, it is seen that the CO2 concentration exceeds 1000 ppm in most of the workstations, a reference value indicated by MacNaughton et al. [39] as a limit to avoid high heart rate and negative health symptoms. It also exceeds the limit of 700 ppm proposed by ASHRAE 61.2 [40] for indoor spaces. Of the desks evaluated according to these terms, for winter, 91% have concentrations greater than 700 ppm and 41.8% greater than 1000 ppm on average, while in summer, the situation improves a little: 49.3% of the workplaces have CO2 concentrations above 700 ppm and only 1.4% are above or equal to 1000 ppm. However, from the PCS use measurements, these environmental conditions partially influence the need to turn on a device. A sensitivity analysis in this regard has been made in Section 3.2.4.
Table 2 shows the measured use, the reported use, and the number of people who would continue to use the tested PCSs. This information is obtained from the final interview. The fan is the most used instrument, followed by the EMBR and the lamp. However, from the reported use, the occupants indicate using the EMBR to a greater extent, although it is the PCS that they would continue to adopt the least. Therefore, there is a contradiction between what is measured objectively and what is obtained from subjective responses. Regarding the future use of the lamp, it is observed that using it a little does not necessarily mean that they would not continue using it, with the PCS being able to help achieve comfort or satisfaction based on specific requirements of the day.
Table 2.
Measured use, reported use, and the number of people who would continue using the PCSs.
The differences between cases show that the fan and the lamp are the most used devices in the hottest climates (cases A and C). The latter can be used because some occupants close their blinds, affecting every occupant with access to daylight. On the other hand, in cases B and D, where the climate is more temperate and permanent blocking of solar entry is not required, the lamp is used less.
When comparing the cases, it is observed that some occupants use two PCSs simultaneously for longer, highlighting the use of the fan and the lamp and, to a lesser extent, the EMBR and the lamp. In terms of future preference, the fan is the PCS that most users plan to continue using (53.6%), followed by the EMBR (42%), and finally, the lamp (30.4%).
Regarding the perception of comfort improvement, 85.5% indicate that their comfort improves when using one or more devices, and 13% do not feel it does.
Regarding differences in use by gender, women tend to use the fans and the EMBR more than men, while the use of lamps is practically the same in both genders. Of the total use of the three PCSs, women use the fan more, both in winter (62%) and in summer (50%), while men use the EMBR more in winter (50%) and the EMBR and the fan in the same proportion in summer (45%).
For age range and the interaction with the PCSs, it is seen that in winter, the EMBR tends to be more used by people up to 54 years old, after which its use decreases drastically. There are no significant differences in summer.
In summer, the fan and lamp are used more in east- and west-facing positions, while the EMBR is used more in southeast- and east-facing ones. Meanwhile, in winter, the fan and lamp are used more in offices facing north and northeast.
The position of the seated occupant, considering the window, significantly influences the use of the lamp and the fan in winter. When the window is behind the occupant, they turn on the lamp more; on the other hand, when the window is in front of the occupant, they use the fan more.
When differentiating the use of the three PCSs provided by office type, shared offices are where the devices are most used in both seasons. Of the total use, 80% is from occupants in shared offices. In winter, the fan is most commonly used in the shared office, and the EMBR is used most in the private office. On the other hand, in summer, the EMBR is used to a greater extent in both types of offices. However, this may be because this is the first season of the case study, and the thermal bracelet technology is more novel for the occupants, capturing their attention and causing greater interaction. This is why in winter, the use of this device decreases, and the other low-tech PCS becomes more effective and used.
3.2.1. Evaluation of the Use of the EMBR
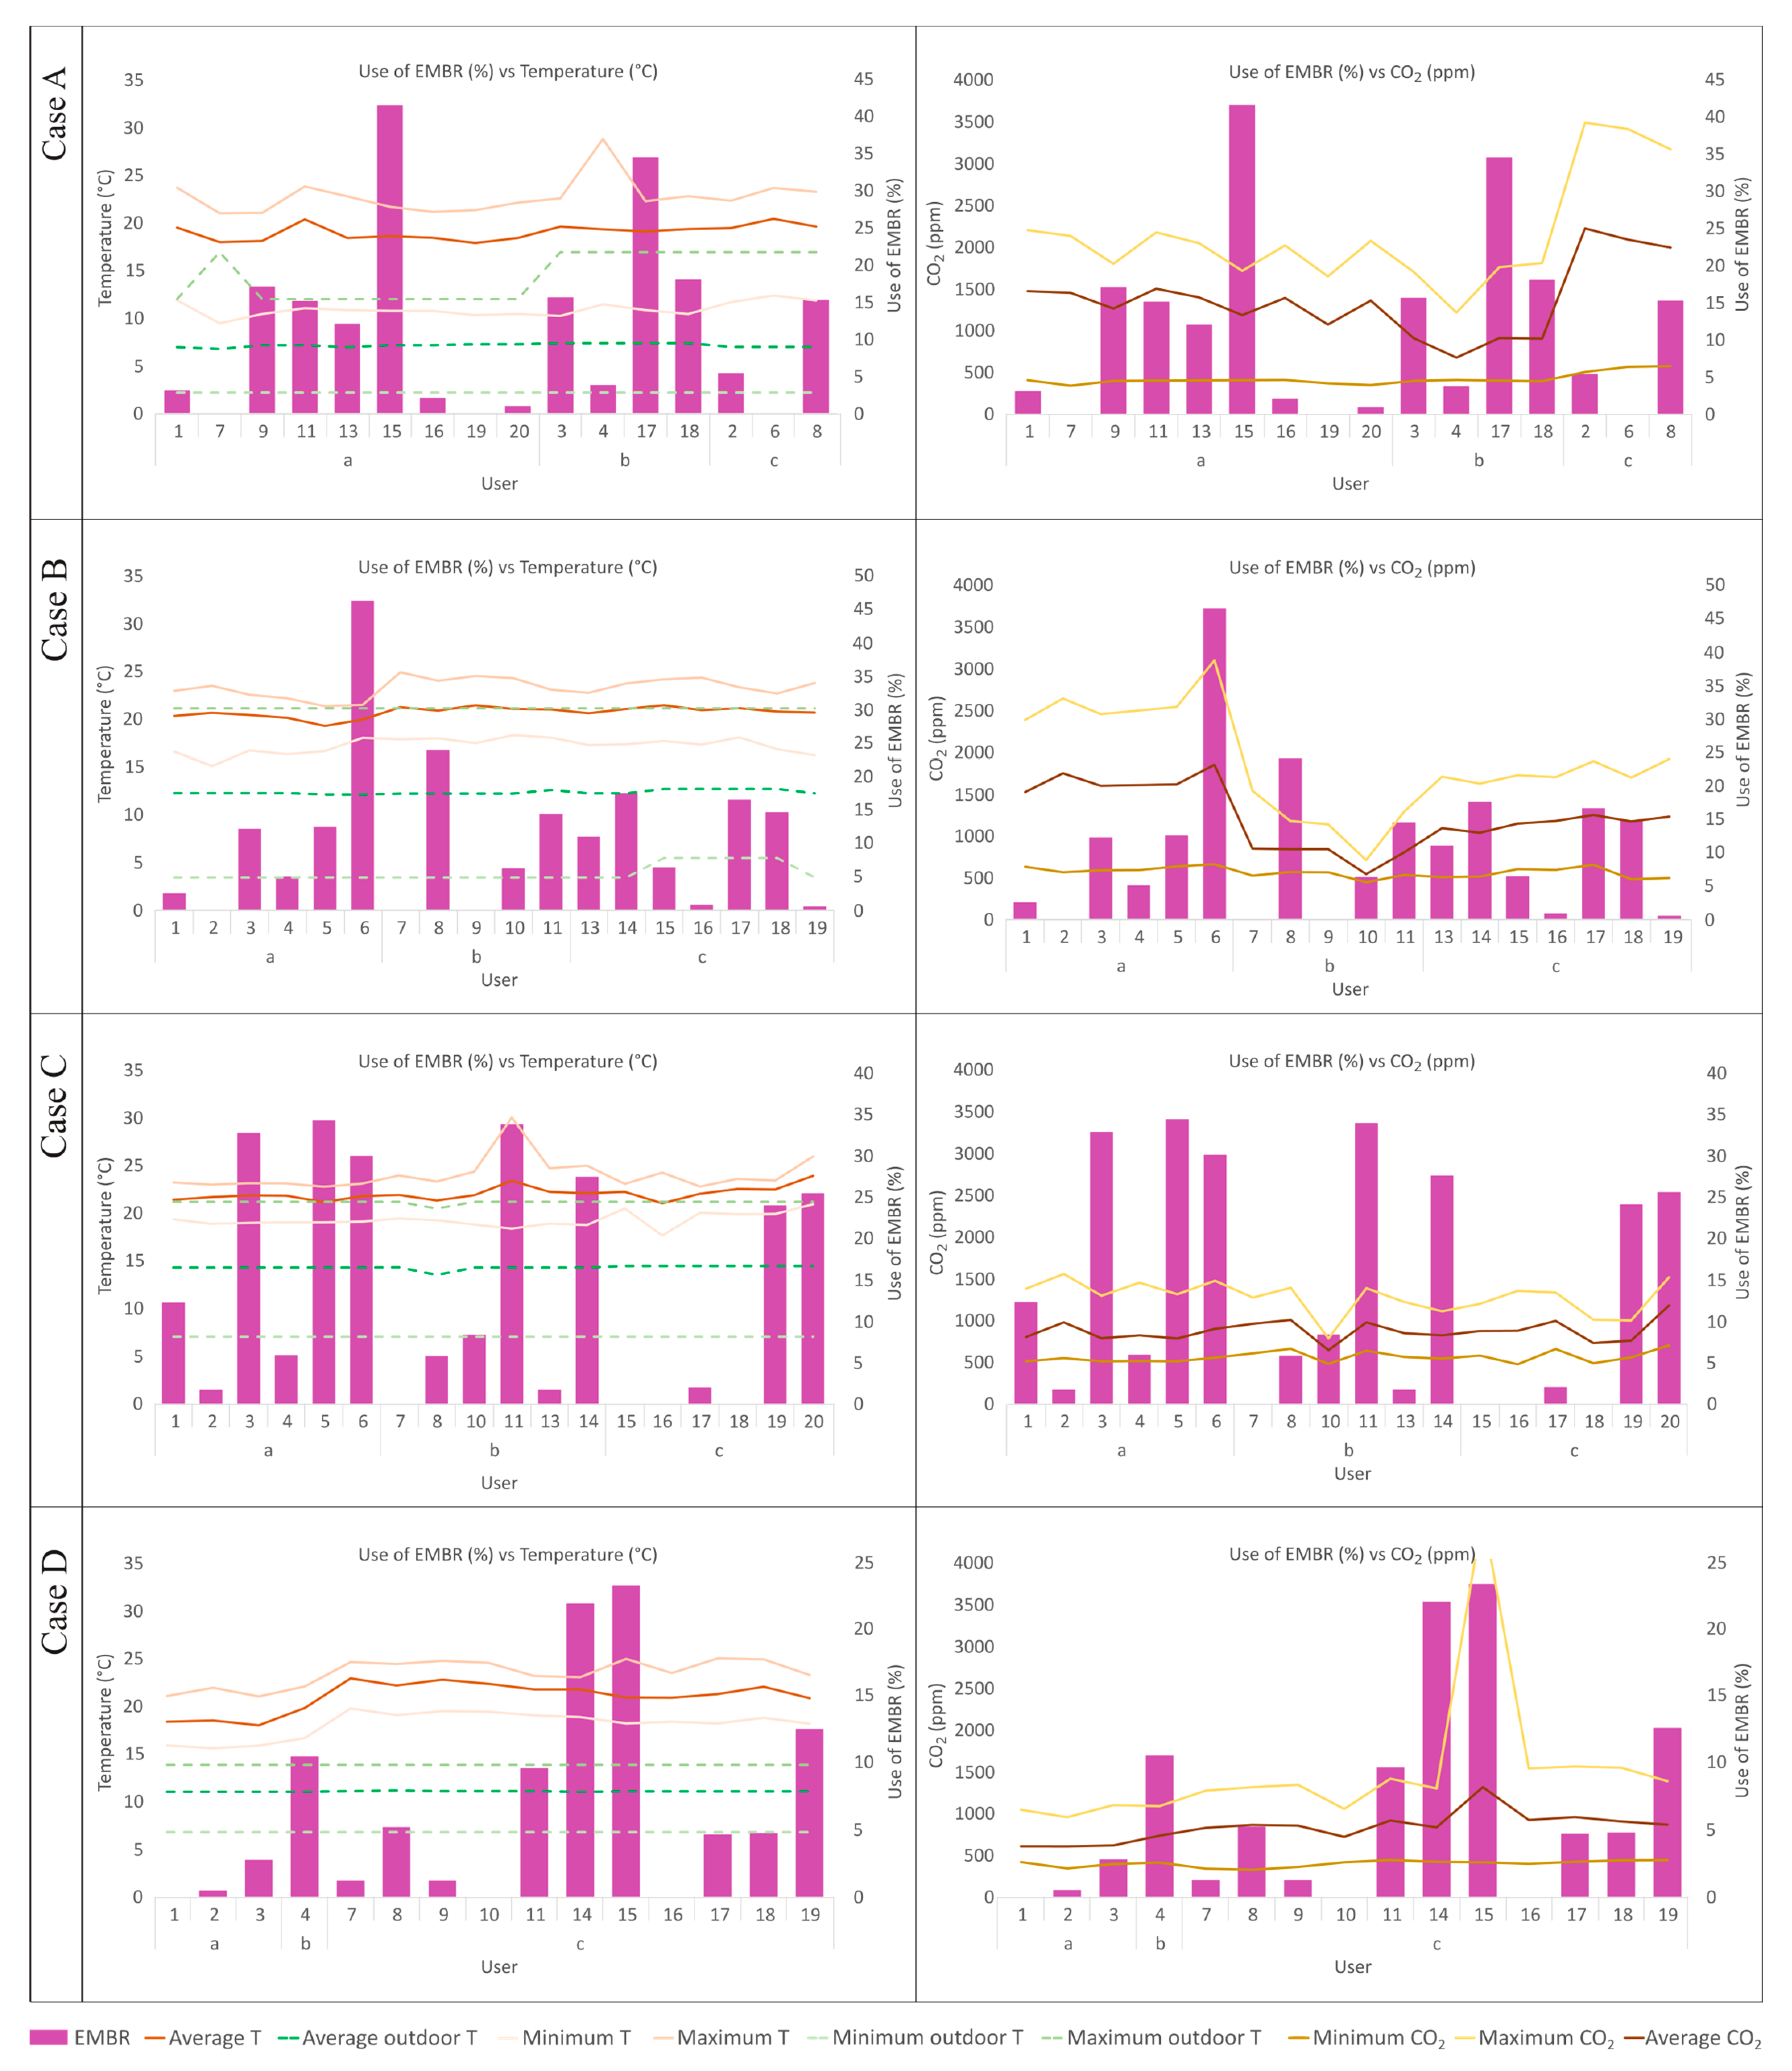
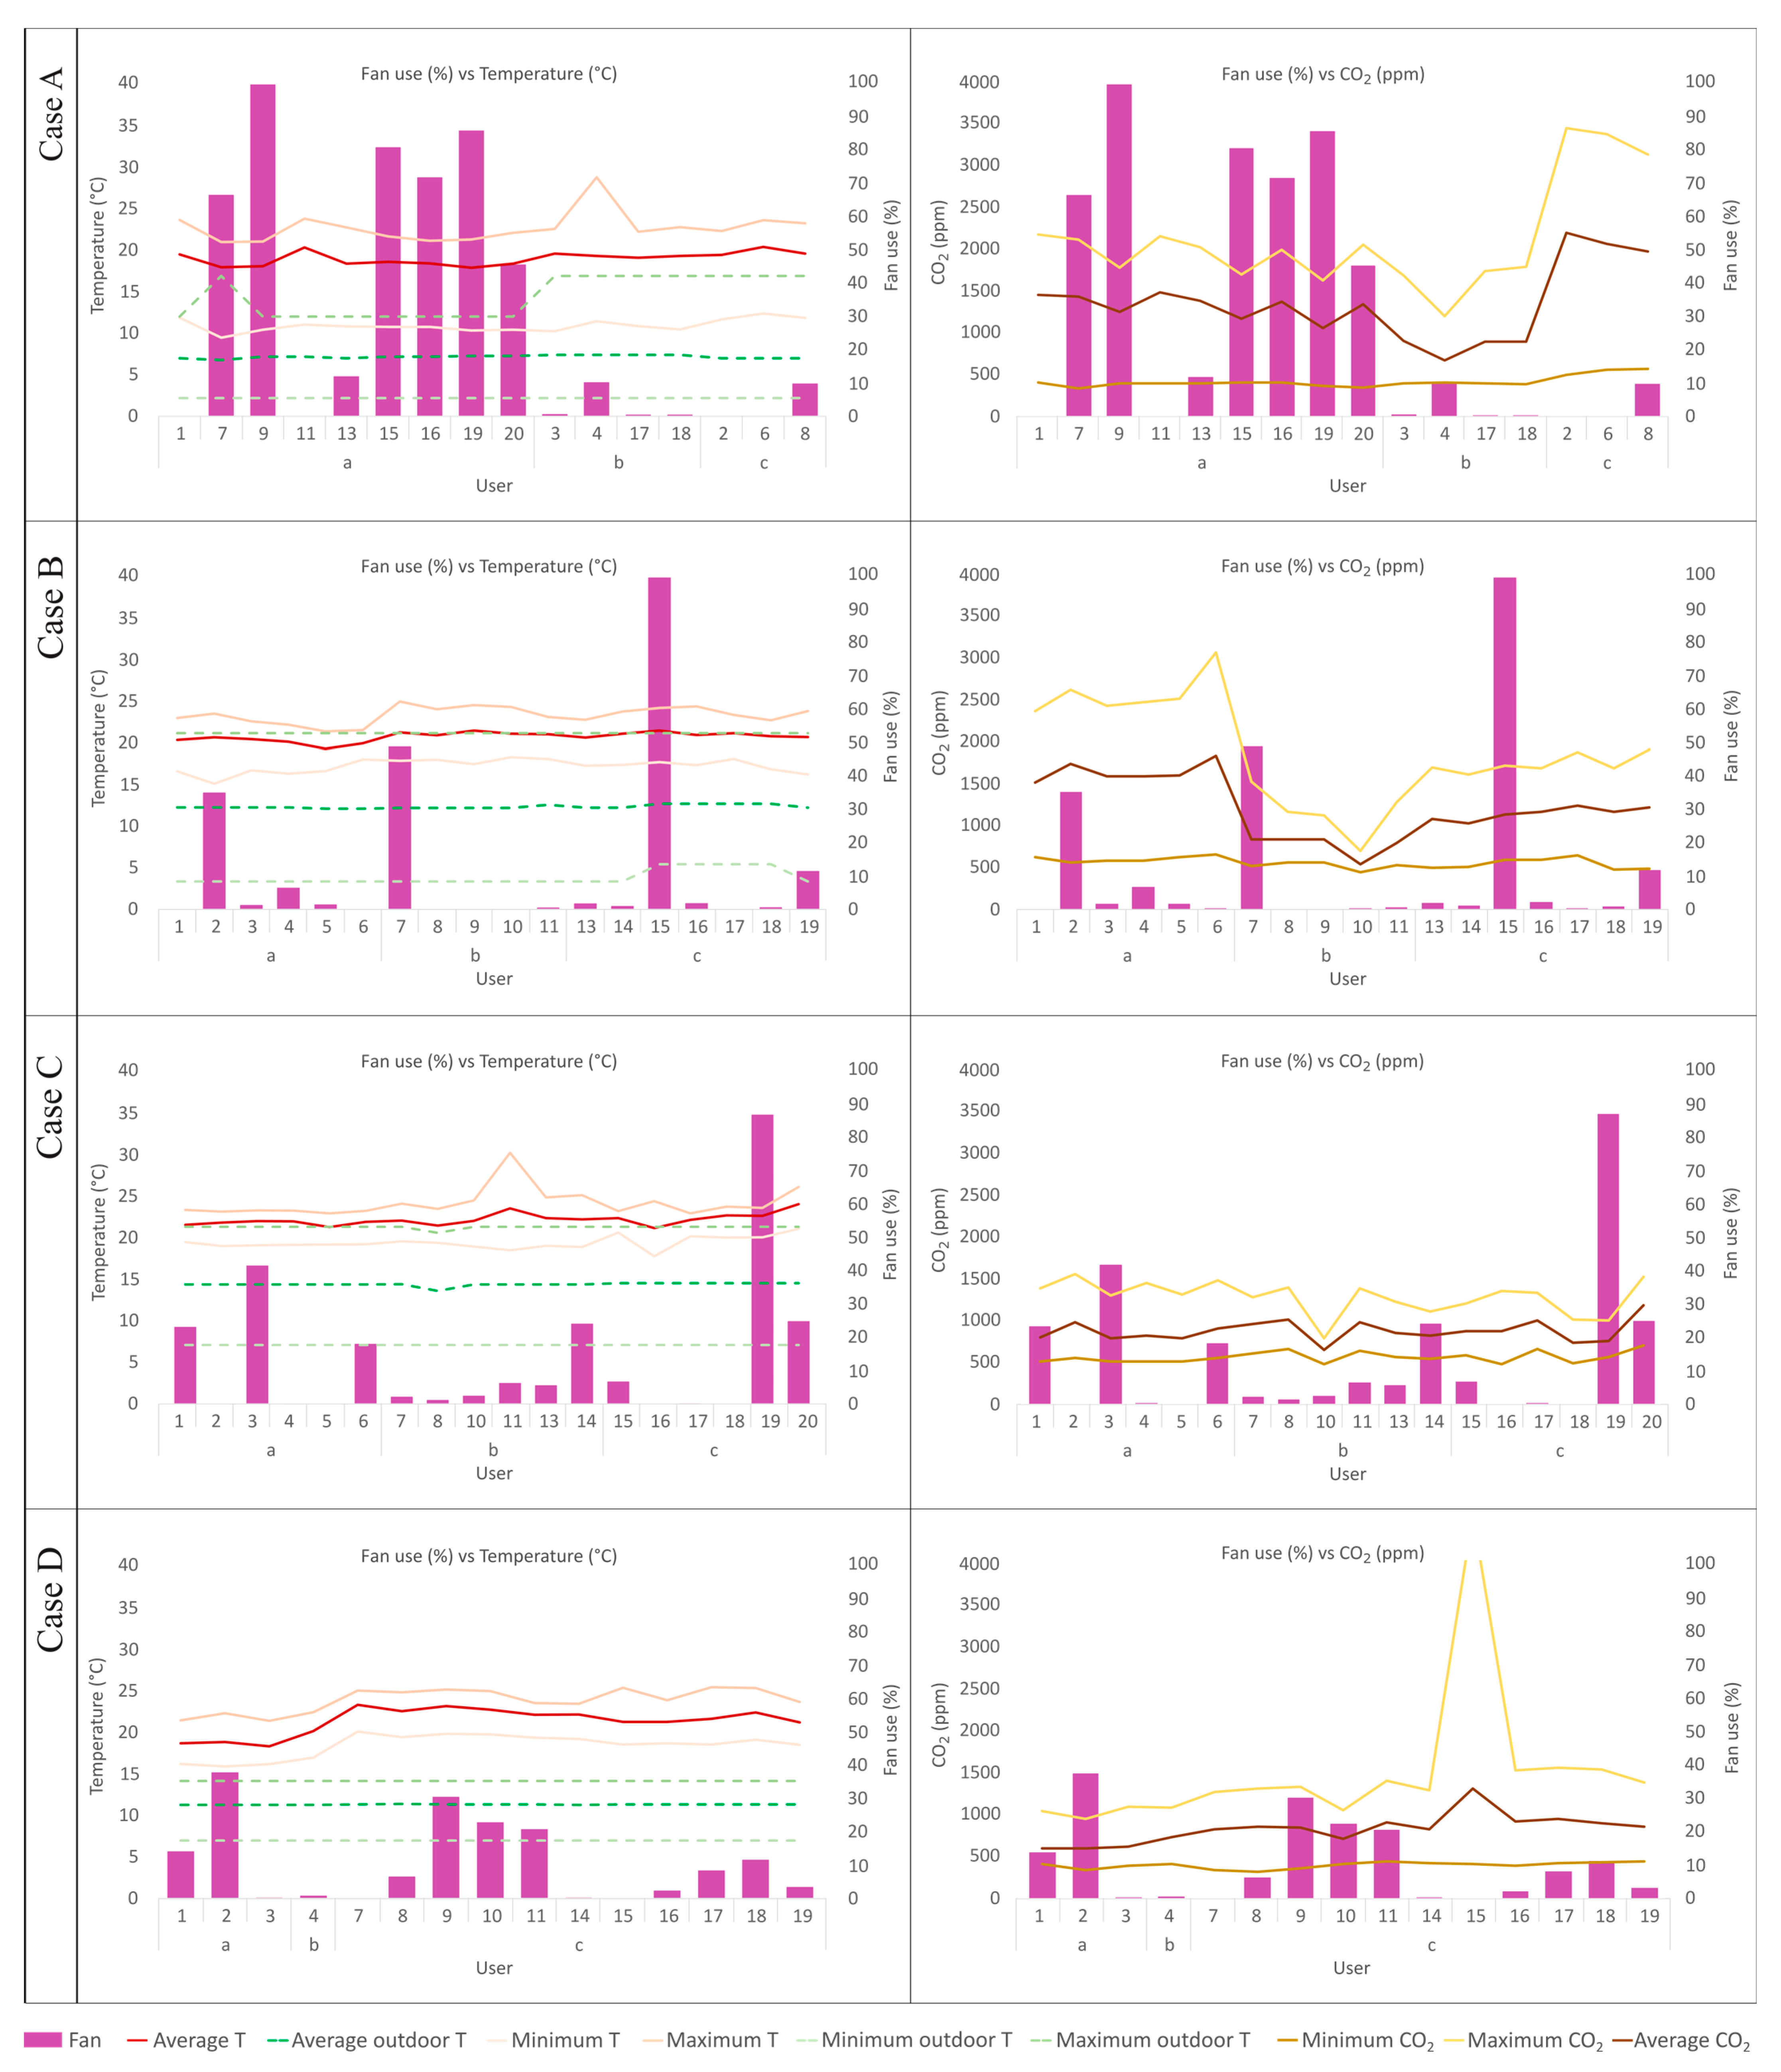
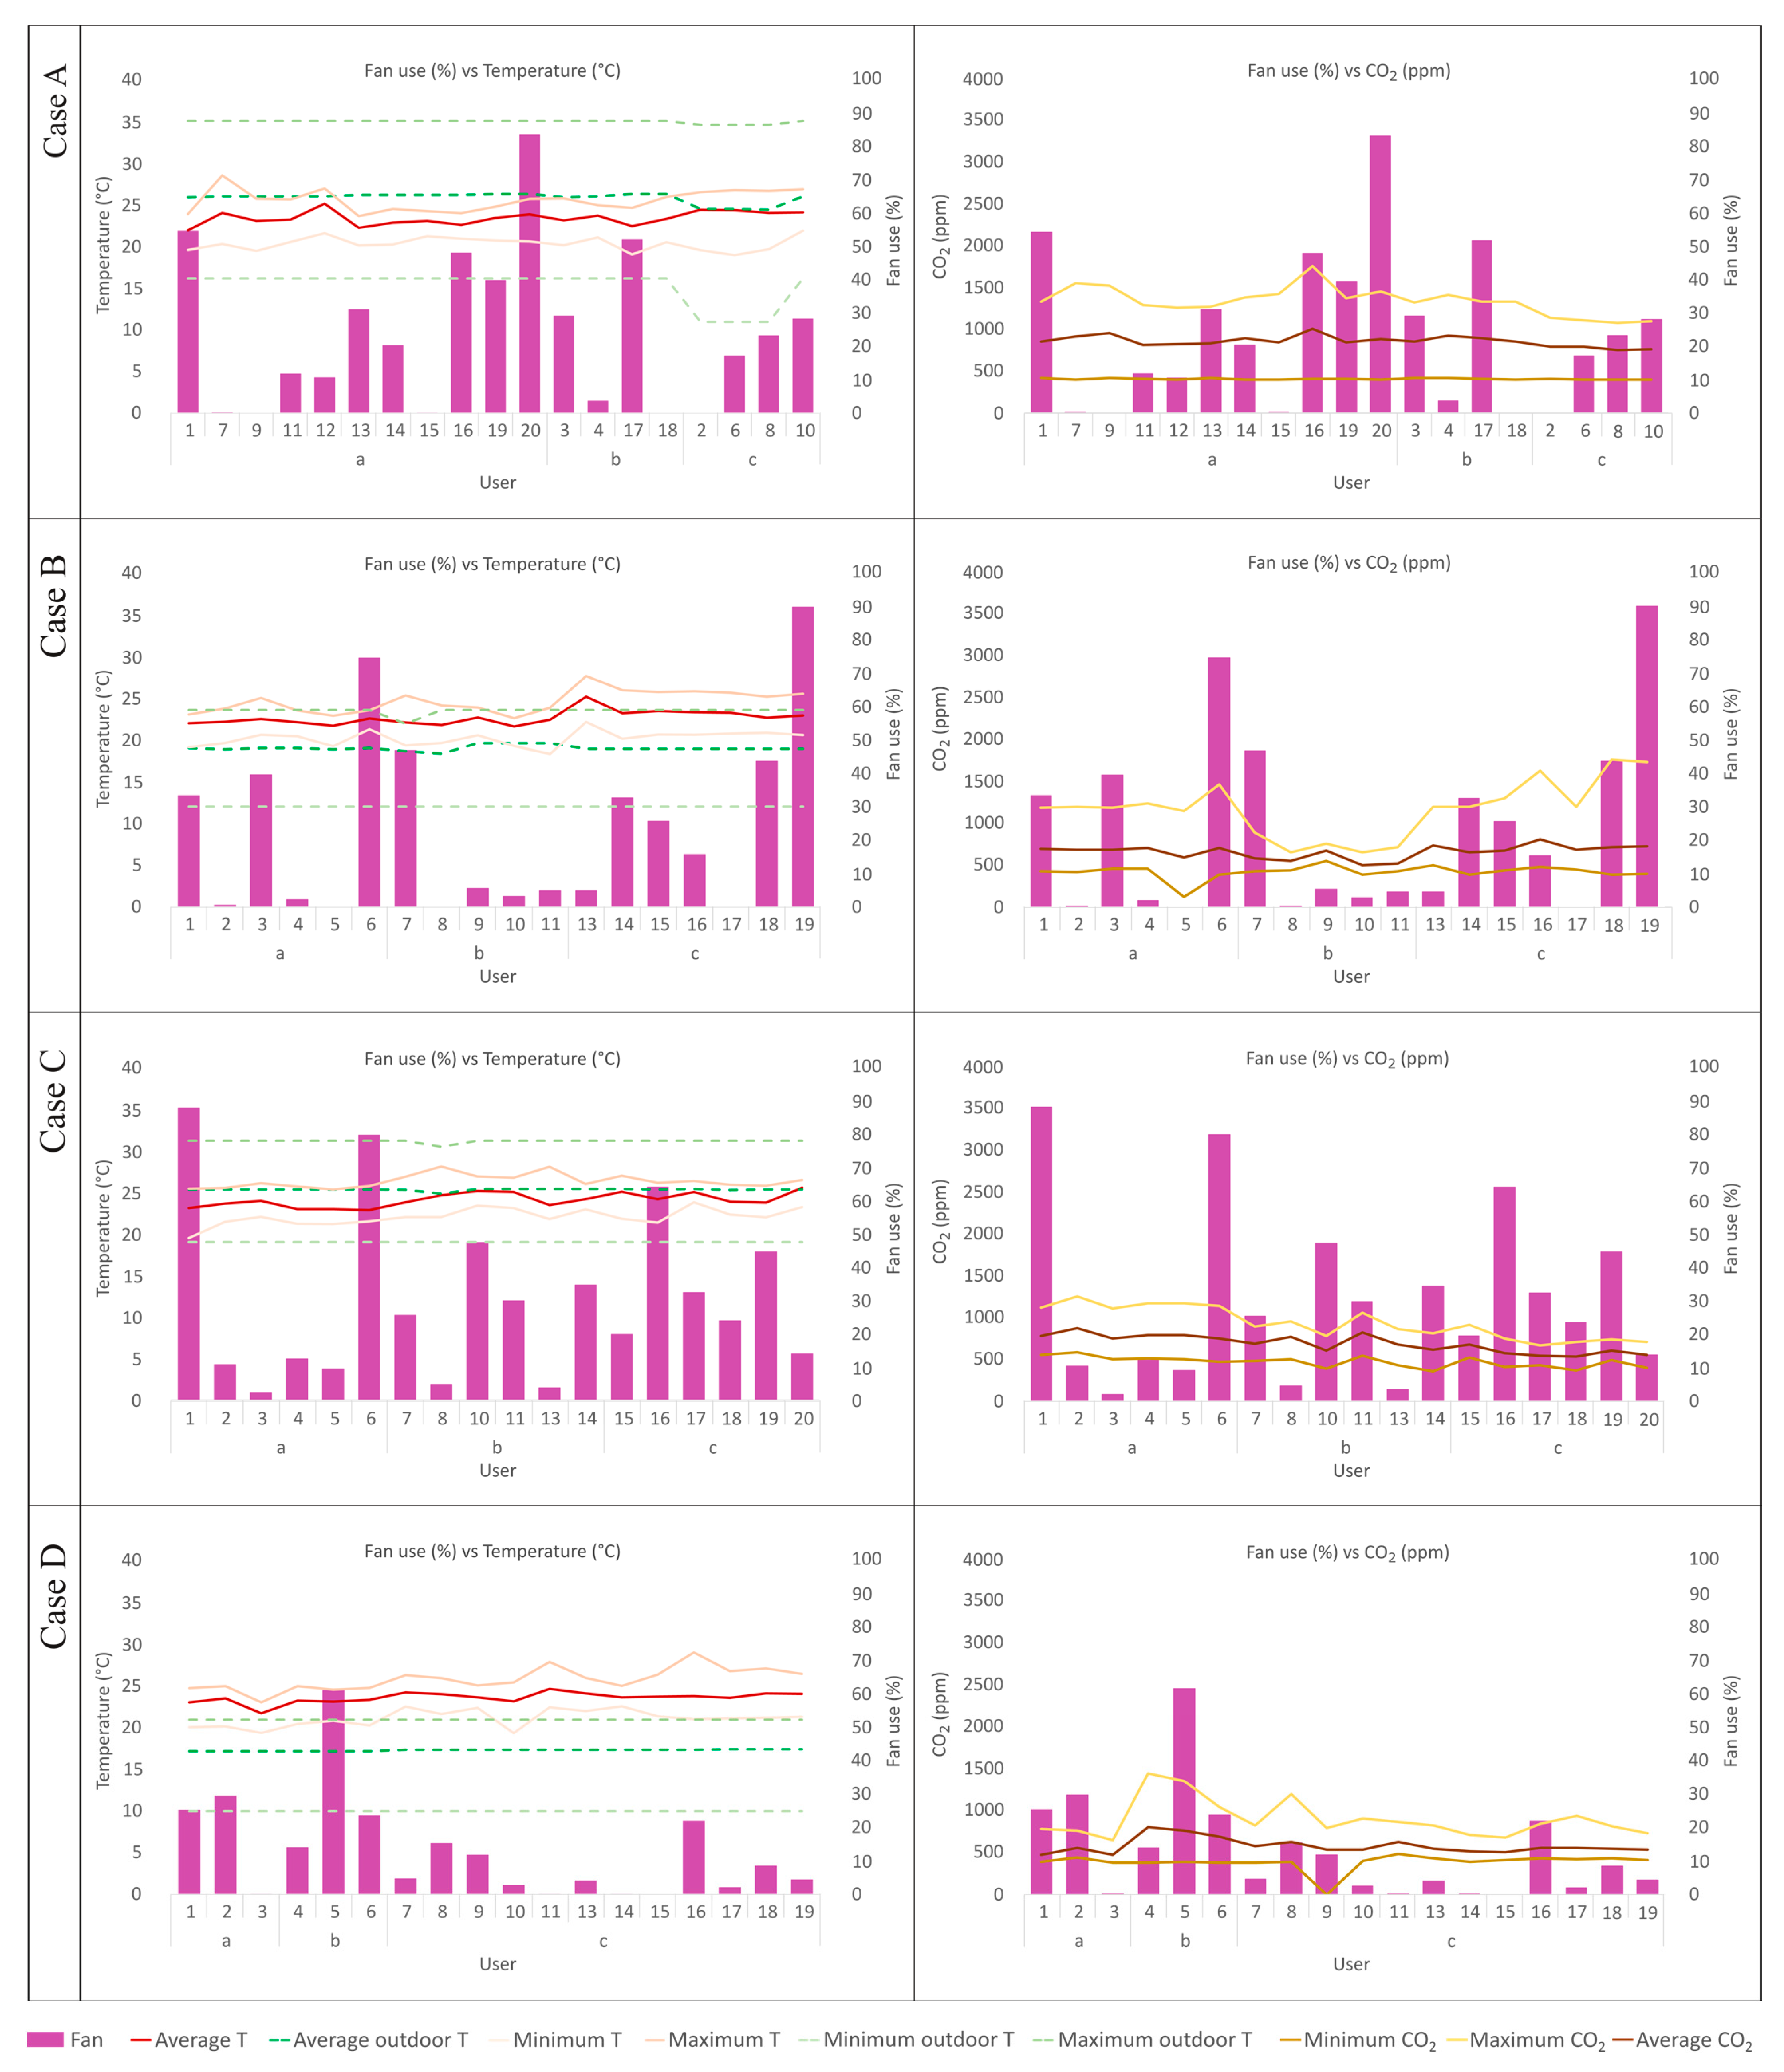
Figure 3 and Figure 4 show the results for each case (sub-case and user shown in Figure 2) and season, including the time during which occupants used the EMBR thermal wristband compared to the time the person was actually at their workplace for, the minimum, maximum, and average outdoor and indoor temperatures (in each workplace), and the minimum, maximum, and average CO2 levels measured at their desks.
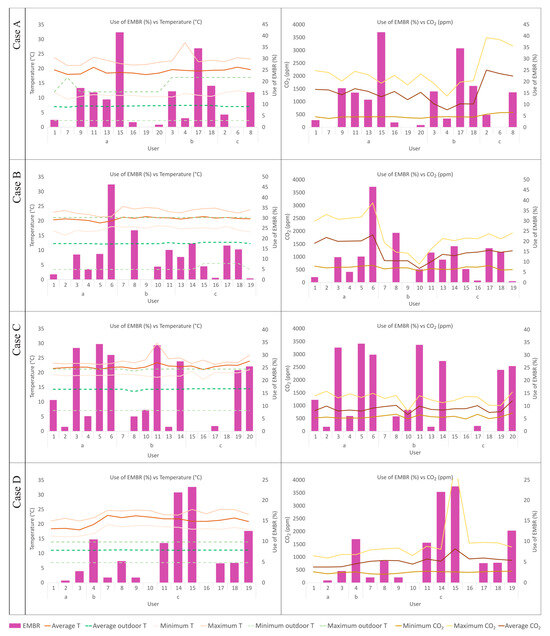
Figure 3.
Use of EMBR in winter by temperature (left column) and CO2 (right column).
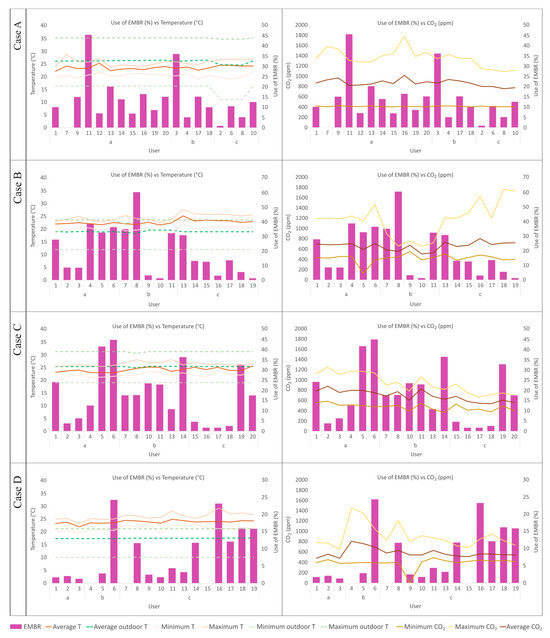
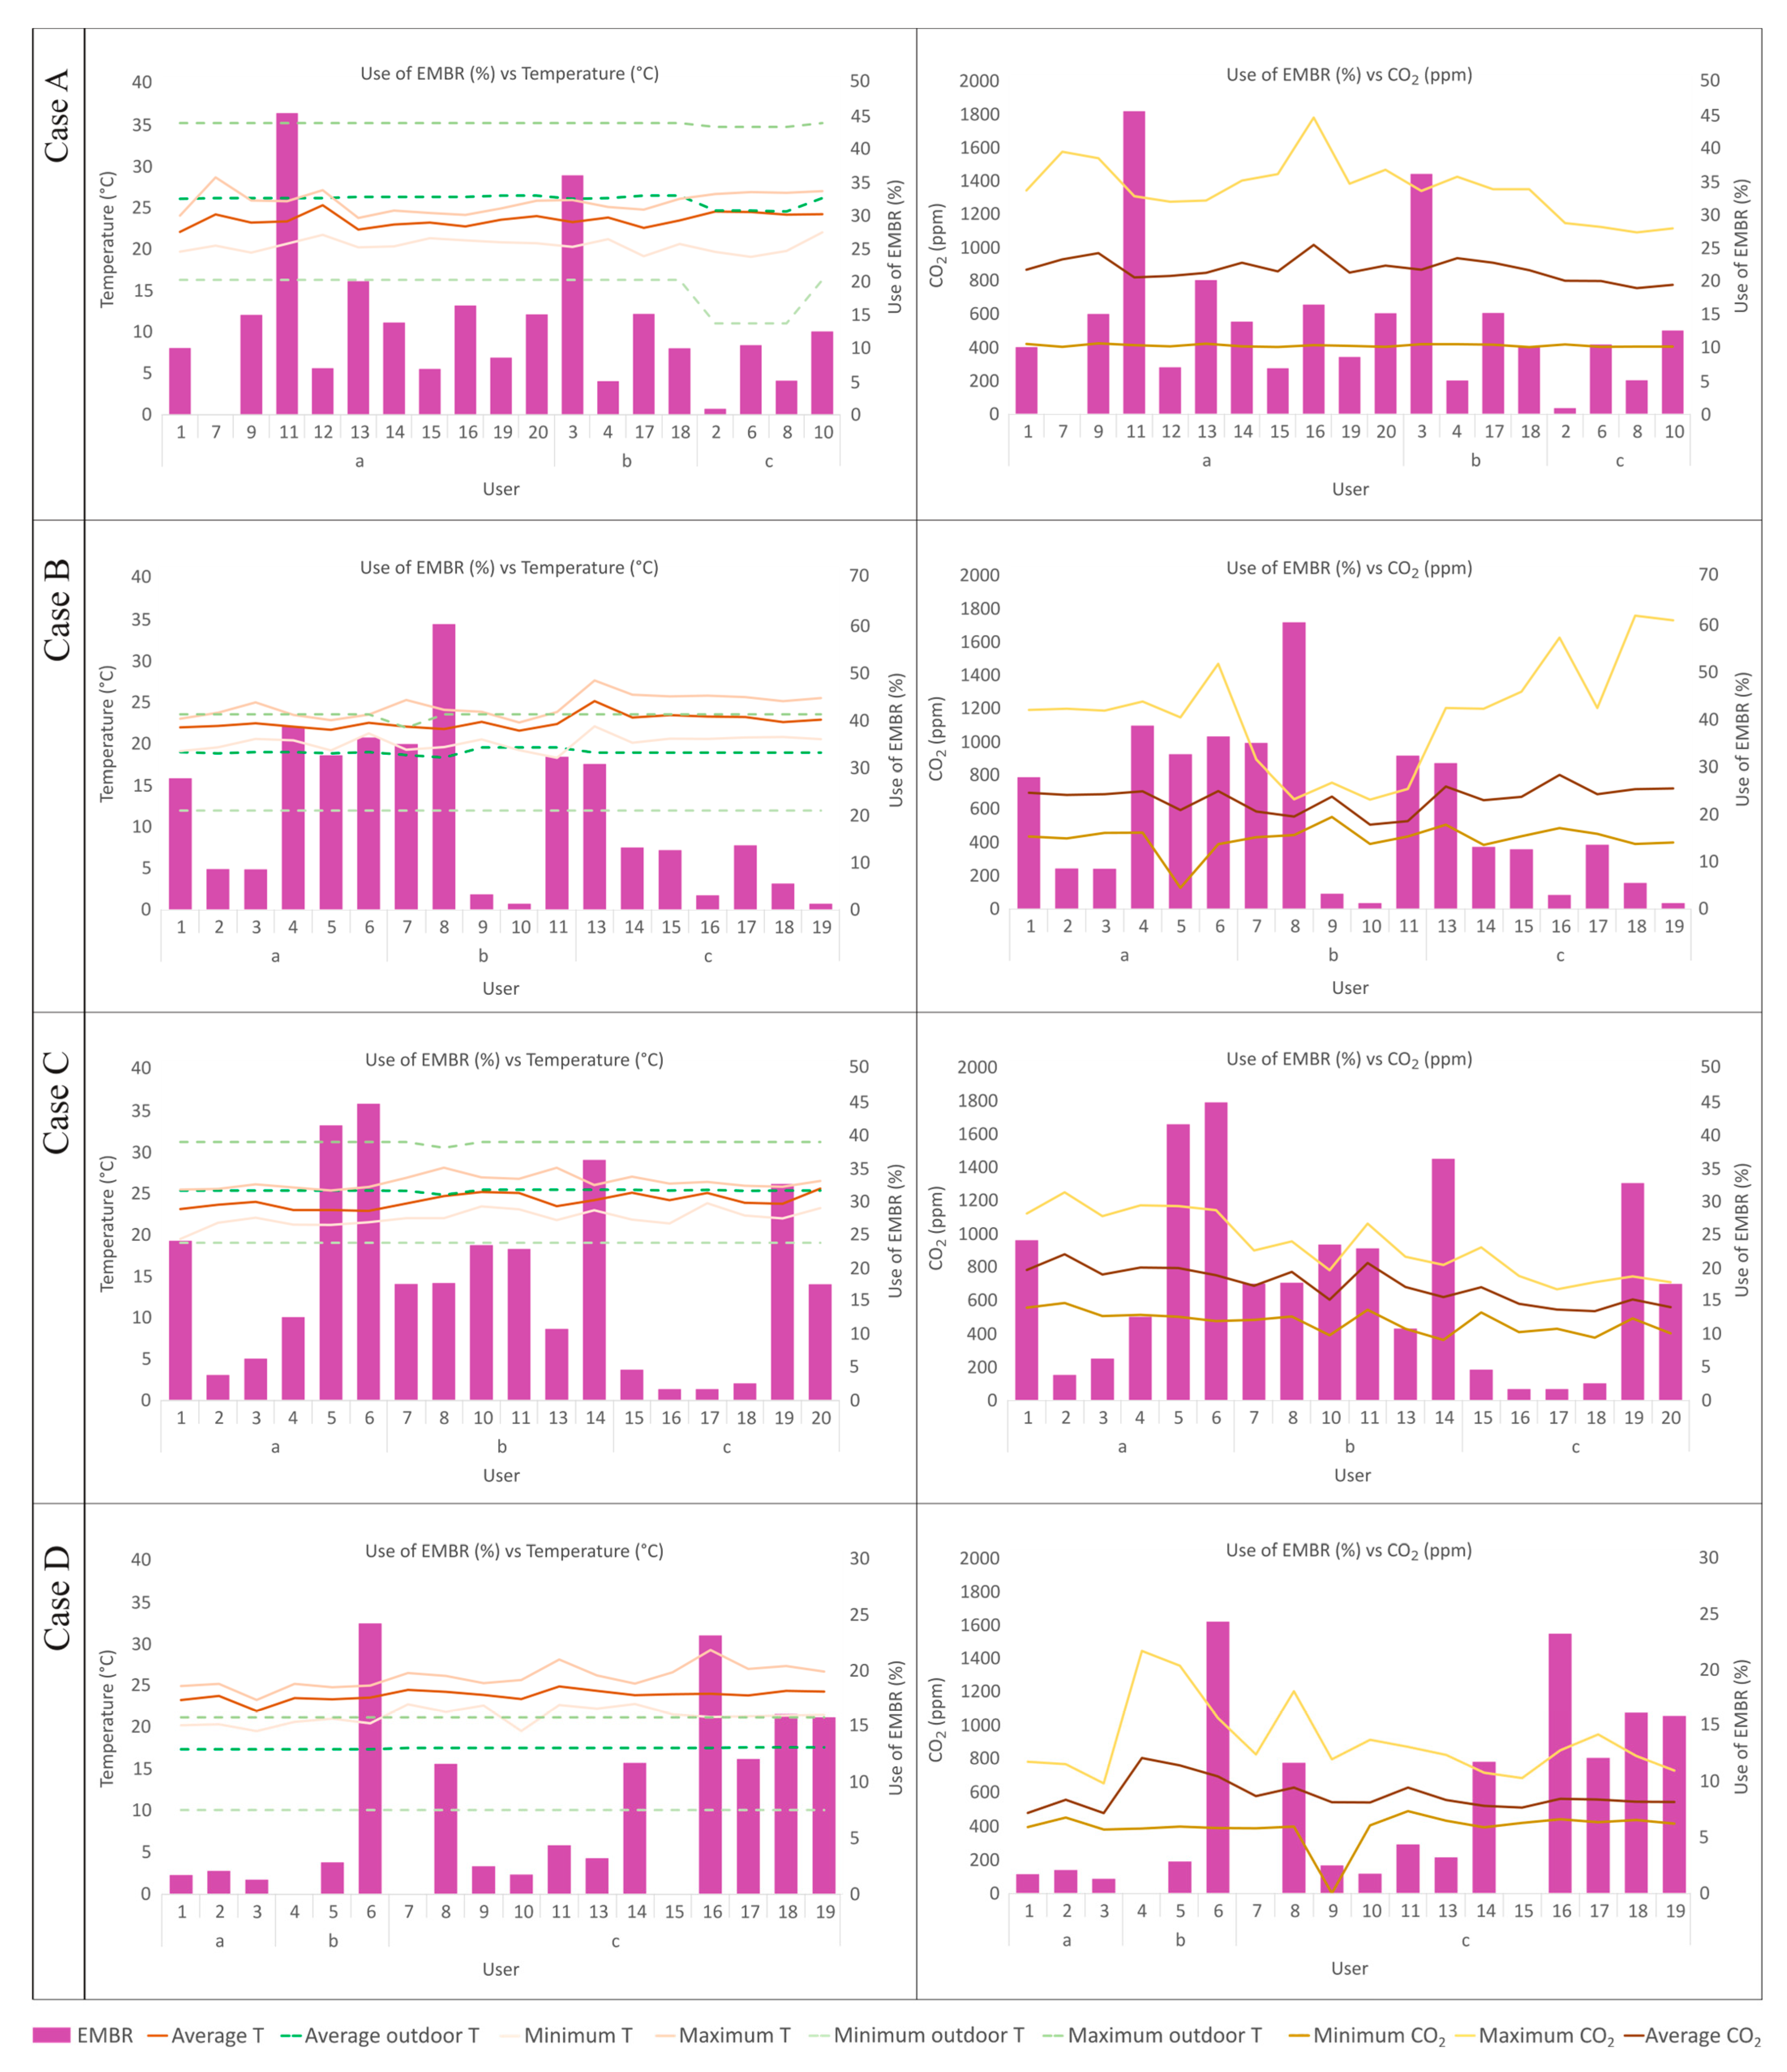
Figure 4.
Use of EMBR in summer by temperature (left column) and CO2 (right column).
In both seasons, EMBR use has a low percentage considering the time occupants are at their desks; only one occupant exceeds 50%. The use of the device by the same occupant in both seasons is never the same. There is always a preference in one season. However, in summer, this device is the most used among the occupants who use it. Case D is where the EMBR is used the least, and in cases B and C, it is used the most. The latter are located in very different climates from each other and use AC differently. While in B, the HVAC system is intermittent, and more passive strategies are used that the building provides, in C, due to the high outdoor temperatures, the use of the HVAC system is constant and sometimes intolerable, causing people to intervene with the air outlet manually.
The field study revealed that occupants who perceive low control of the ambient temperature and natural ventilation turn on the EMBR more often than those who manifest control of these environmental conditions. Likewise, most occupants satisfied with the indoor temperature and IAQ use the device little or not at all, even though the temperatures recorded in some of these desks are much higher (29 °C) than the accepted comfort range for adaptive comfort. Both in summer and winter, it is observed that the recorded temperature does not influence bracelet use. The occupants with lower satisfaction levels tend to use the EMBR.
Thus, as device use is higher in summer, greater use is recorded in the first few days of the study, pointing to the novelty of this PCS, but it has low effectiveness in thermal terms.
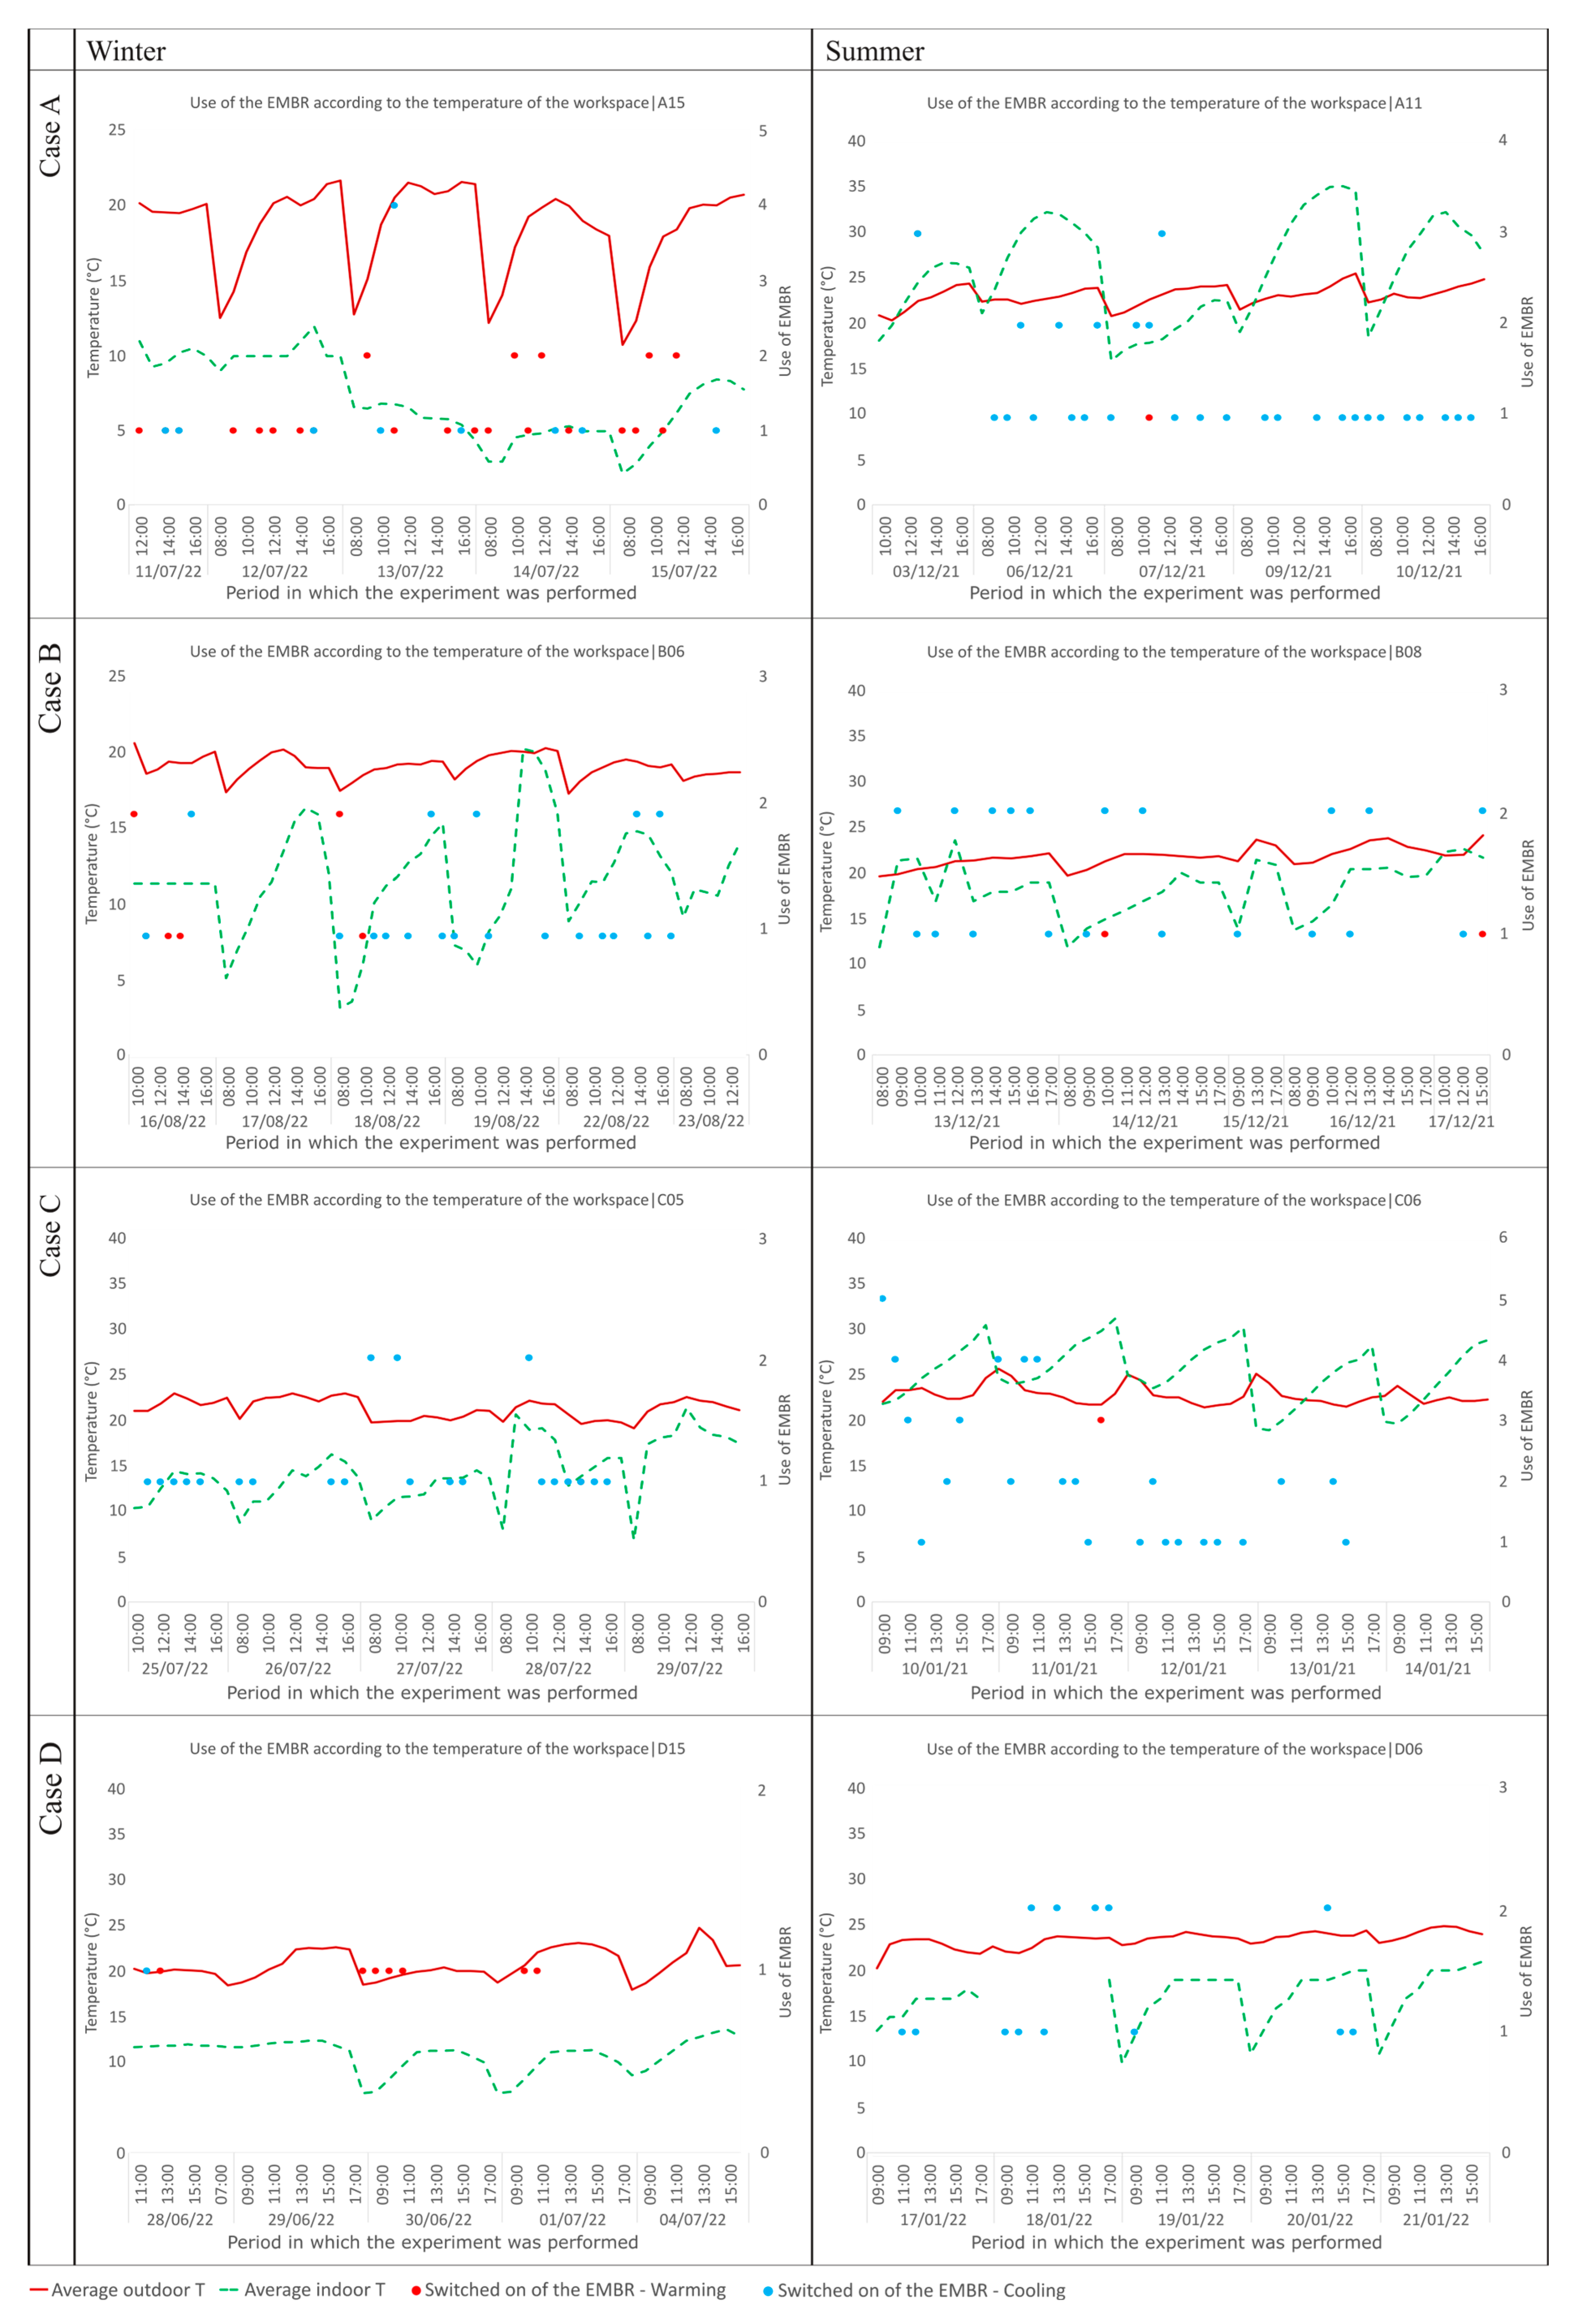
Of the users who used the EMBR the longest in each case (Figure 5), it is seen, in hourly terms, that the use varies with no apparent relation to the recorded temperatures. A trend in use is not distinguished from the point of view of the occupant’s gender (M = 50%, F = 38%, N = 12%) or their BMI, which in men varies between 22 and 35.1, while in women, it is between 23.2 and 30.4, showing no transcendence of this health aspect in the use of the EMBR. There is an evident influence on the type of office these users are from, where 88% are from shared offices, and most (75%) do not have direct access to a nearby window. Whether or not there is a colleague at an adjoining desk has no influence. Women perceive lower temperature control. However, men sometimes do not perceive this and use it despite perceiving high control. The same happens with satisfaction and comfort, which have a greater influence on device use in the case of women.
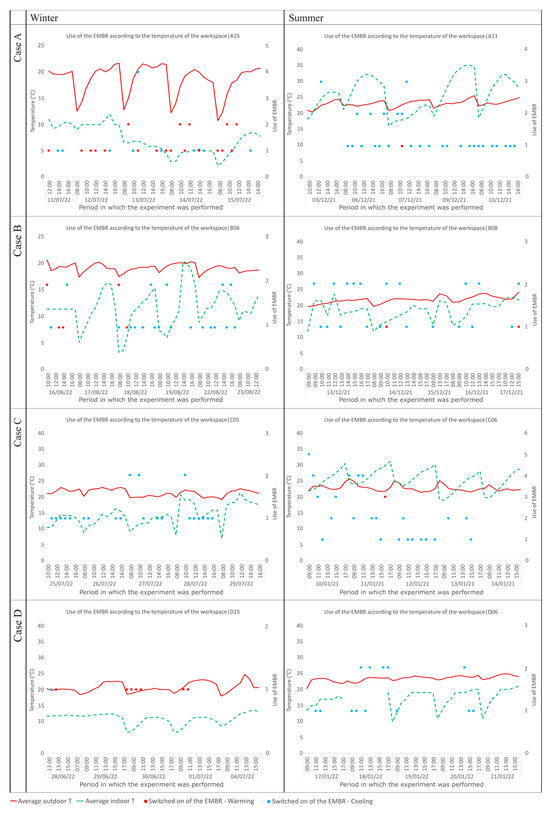
Figure 5.
Occupants who use the EMBR the most in both seasons.
The answers provided by the occupants who use the EMBR the most (Table 3) show that not all of the answers are consistent with the record of their use. Although all participants report feeling more comfortable, this improvement is not necessarily attributed to using the EMBR, as not everyone would continue to use this PCS. Instead, they prefer other devices, such as the lamp.
Table 3.
Interview answers from those who use the EMBR the most.
Some occupants claim not to have used the bracelet because it caused discomfort when using the mouse or typing on the keyboard, and for others, it caused a rash.
3.2.2. Evaluation of the Use of the Fan
From the characteristics of the occupants, their responses in the survey, and the relationship between fan use and dissatisfaction with IAQ, it is observed that of the people who report being dissatisfied with the IAQ (≤3 on a scale of 1–7) in all four cases, 70% use the fan in summer and 50% use it in winter. This does not happen with dissatisfaction with thermal conditions since the use of the fan is not significant according to this variable. Of the occupants reporting limited ventilation control (≤3 from 1–7), 53.6% use the fan in summer and 45.8% in winter. On the other hand, for those who have a low control over temperature, fan use decreases to 33.3% in summer and 22.2% in winter.
This device is the most used by the occupants, with some participants turning it on 100% of the time. Figure 6 and Figure 7 show the details of occupant use associated with the average temperatures (left column) and the CO2 registered by desk (right column).
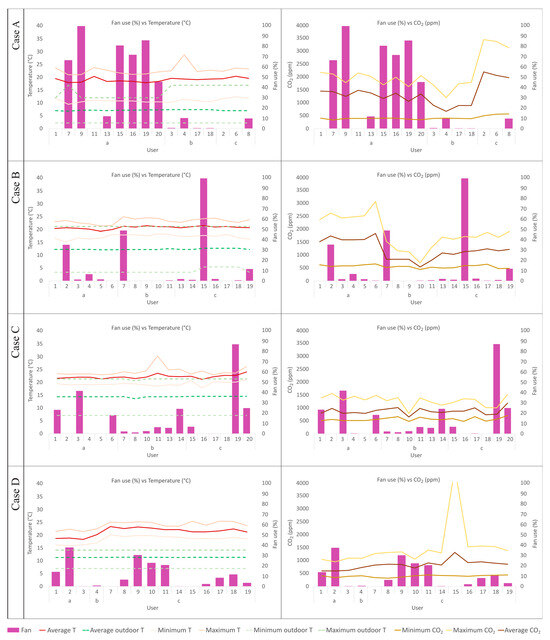
Figure 6.
Fan use in winter by temperature (left column) and CO2 (right column).
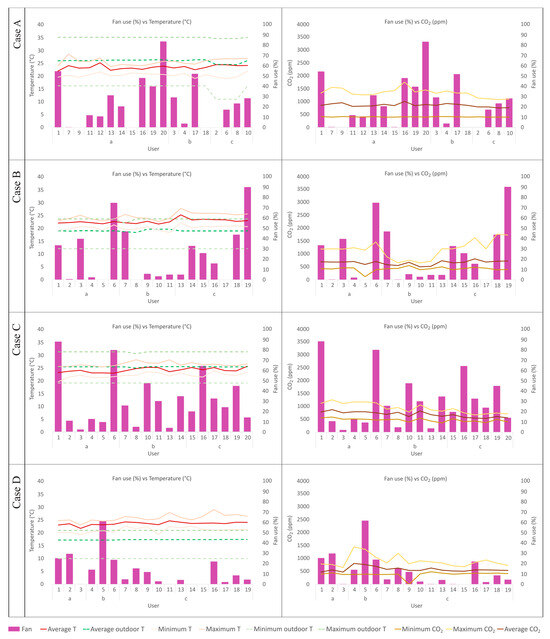
Figure 7.
Fan use in summer by temperature (left column) and CO2 (right column).
It is found that the season affects whether the device is turned on more or less, as no occupant registers the same use in both winter and summer. The fan is used mostly in summer and in climates where temperatures are extreme (cases A and C). Although, as in the analysis of the EMBR’s use, the high temperatures recorded at the desks do not necessarily influence the decision to turn on the fan, as only some people with low satisfaction with the thermal sensation use this PCS to a greater extent. On the contrary, occupants who express dissatisfaction with the IAQ tend to turn on the fan more, similar to those who perceive having ventilation under control and, to a lesser extent, to those with little temperature control.
When comparing perceived control over temperature and natural ventilation, the latter has the most significant influence on fan use. A total of 75% of the occupants perceive having very low control over ventilation, while for temperature, it is 38%—all of these occupants are in shared offices. Dissatisfaction with IAQ is not influential. People who have private offices use it little or not at all.
Half of the people who use the fan the most have access to a window to the outside, so it is assumed that this variable is irrelevant for using the PCS. However, having a desk next to another colleague does seem to have an impact, as most occupants are in this situation.
On the other hand, some occupants use it more when they return to their office from another room or outside, with a higher metabolism and thermal sensation.
As for the people who use the fan the most (Table 4), it is seen that only one of them would not continue using it; all of the others felt more comfortable doing so. Of these occupants, four are women, three are men, and one prefers not to say, so there is no distinction in the use regarding gender. For BMI, this ranges between 22.8 and 31.1 for women, and it is not more limited but higher in men, being between 29.7 and 36, which is more significant. The age of the occupants who use the fan the most has no impact, covering a range between 18 and 64 years.
Table 4.
Interview answers from those who most use the fan.
3.2.3. Evaluation of the Use of the Lamp
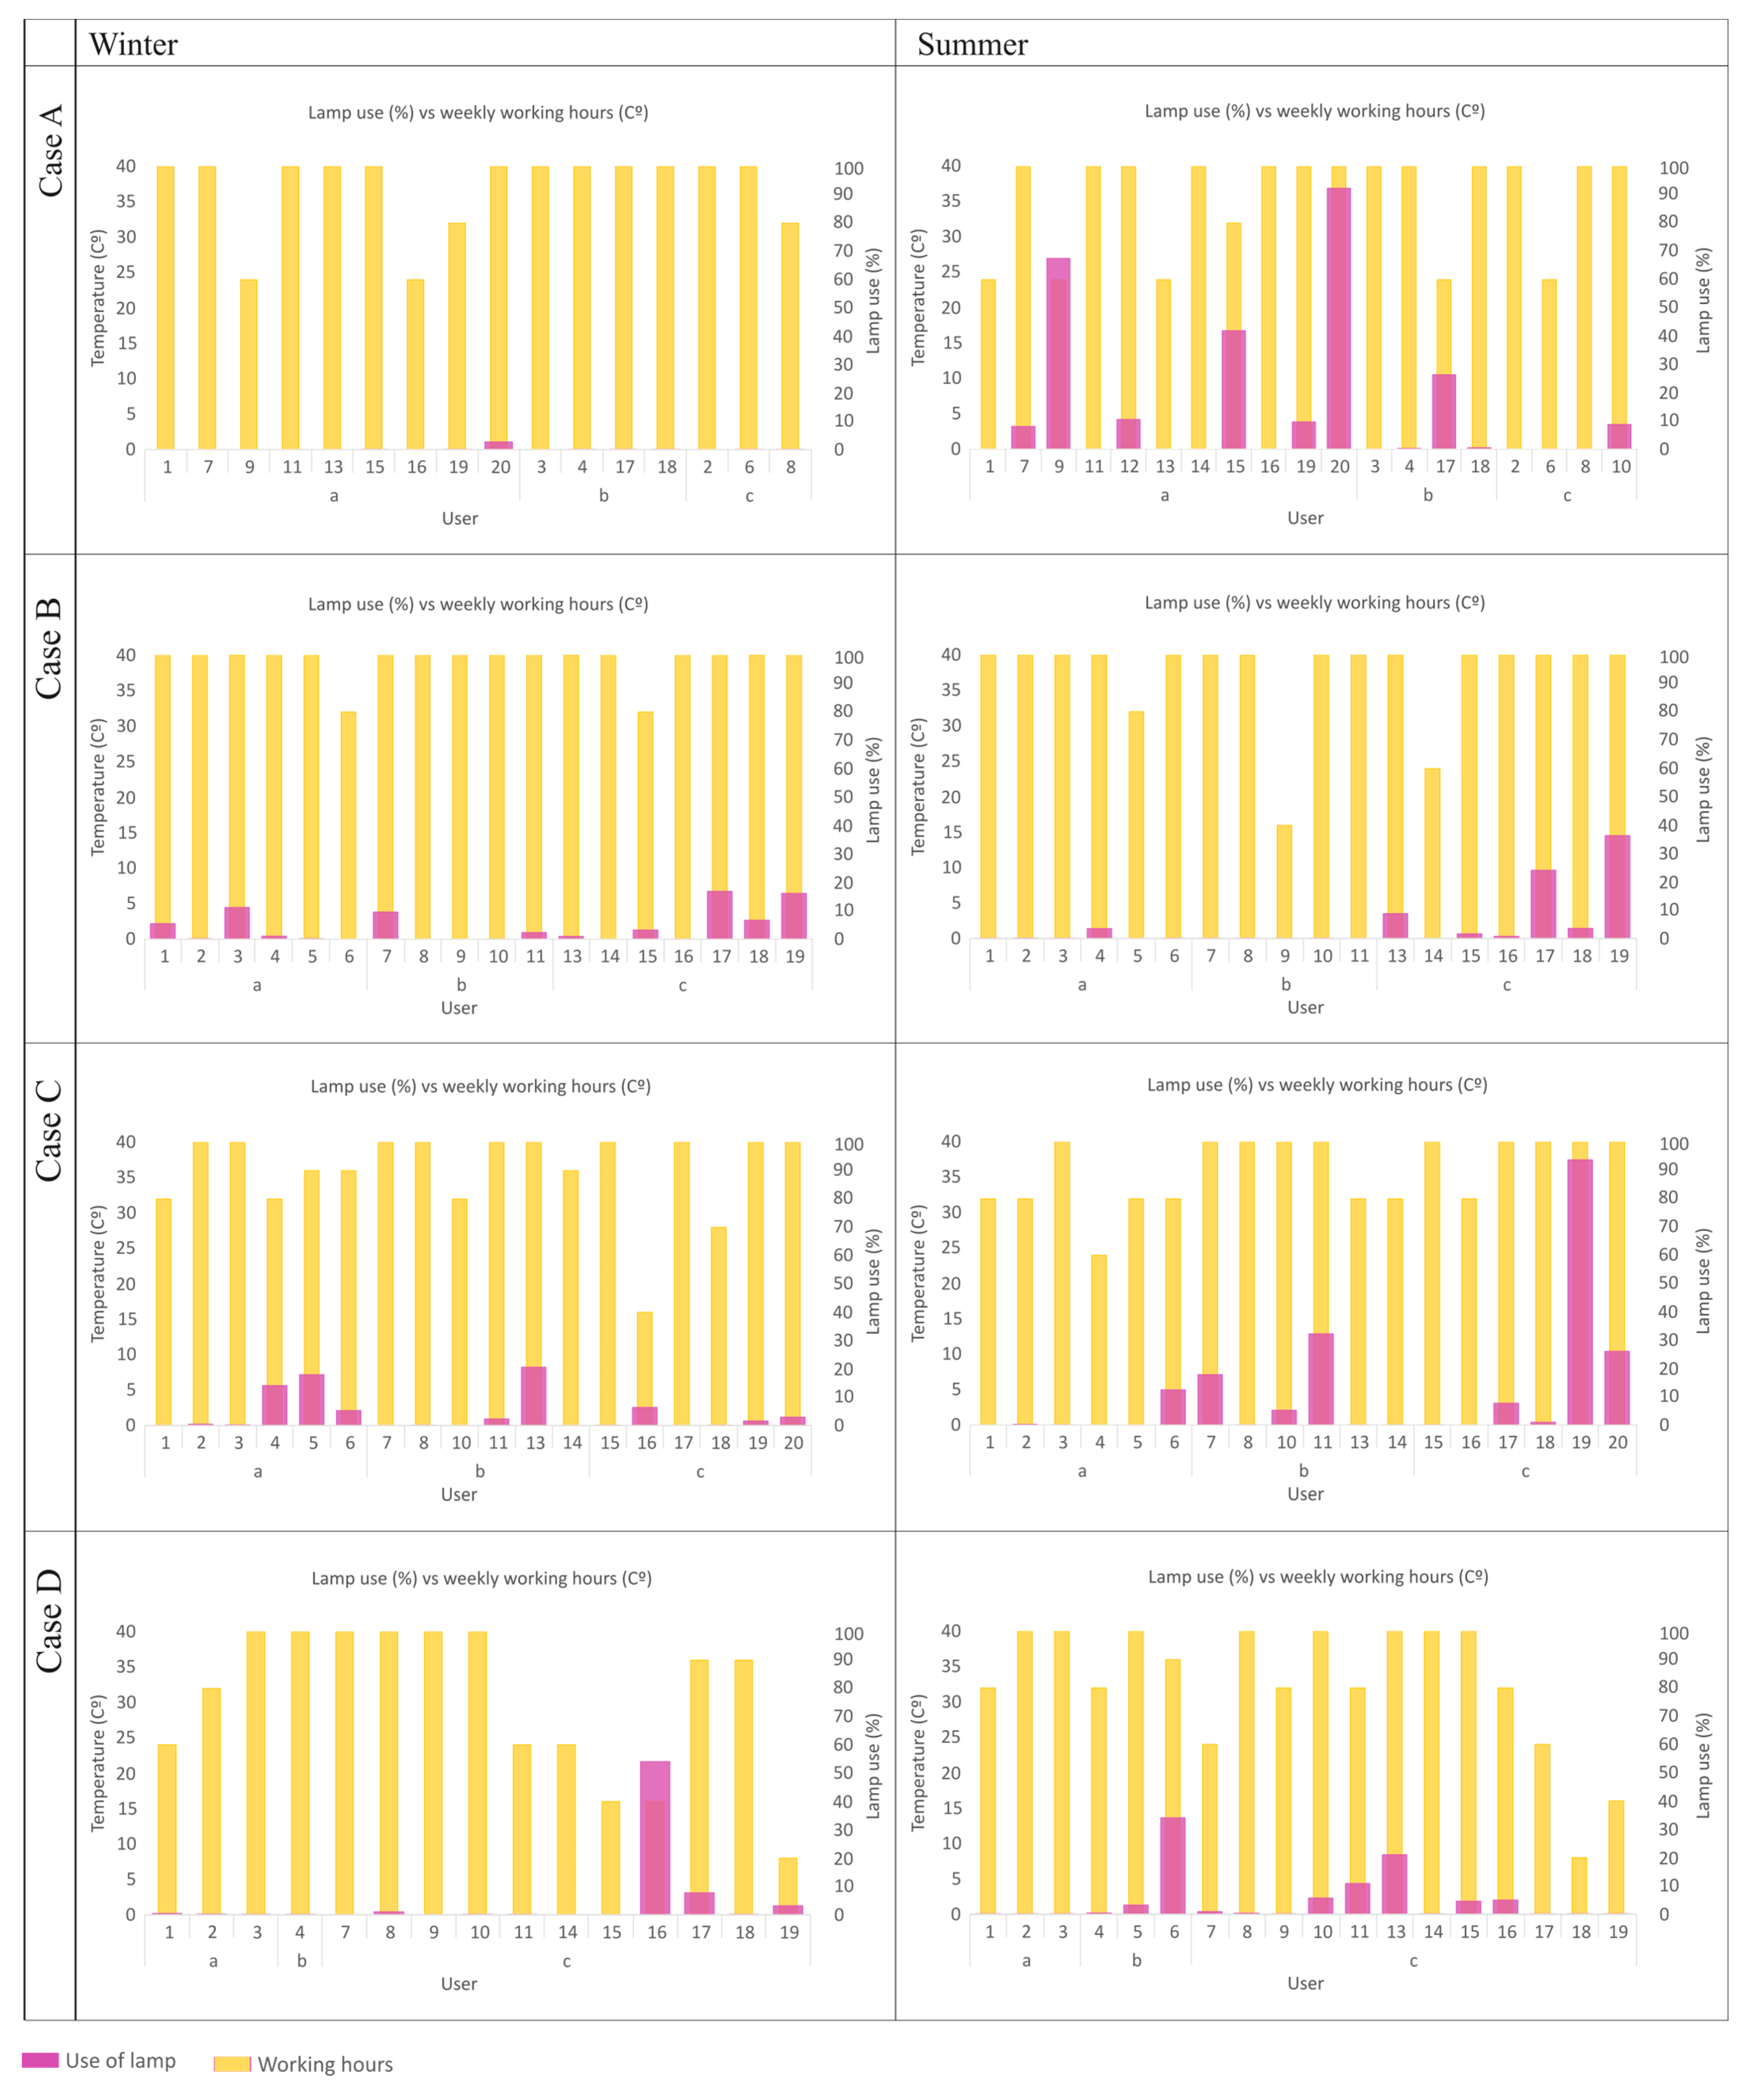
Even though the occupants state that the lamp is the PCS they would continue to use the most, it is used little. From the analysis carried out case by case and by season (Figure 8), it is seen that in all offices, the lamp is used more in summer, with the difference being more marked in cases A and C. This is because, as mentioned above, these offices tend to close the blinds to prevent the entry of solar radiation, with high temperatures, from the outside, thus reducing the lux on the work plane.
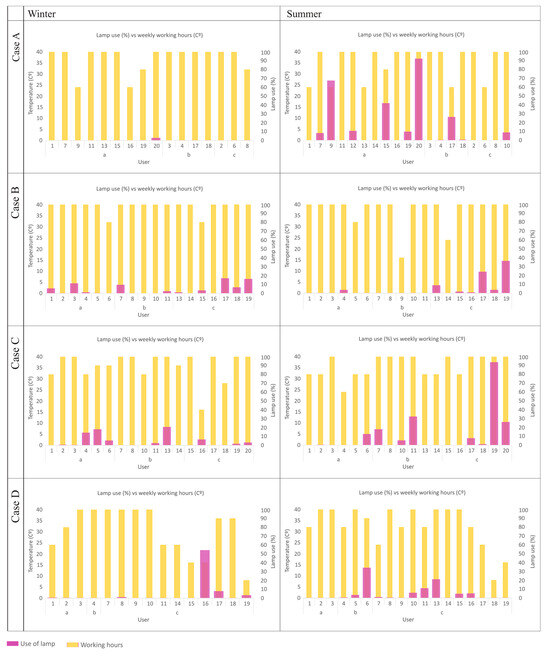
Figure 8.
Lamp use in winter (left column) and summer (right column) according to hours of use in workstation (working hours).
As for the subjects’ location in the space, it is found that the proximity of the workspace to a window does not mean reducing the use of the lamp, not only for the reason indicated above but also due to possible external obstructions (buildings, trees, etc.), received reflections, or light contrasts. For example, occupant 20 is located next to a north-facing window, but with the obstruction of a building that prevents the incidence of solar radiation, reducing the available lighting. On the desk, an illumination of 500 lux is achieved throughout the day with the blinds open, but when they are closed by other users, the brightness decreases and, with it, the feeling of warmth.
Unlike the other two PCSs, in this case, the same users use the lamp the most in both seasons, specifically in cases A and B.
From the analysis related to the survey and the use of this PCS, it is perceived that being dissatisfied with the place’s lighting conditions does not necessarily influence the use of the lamp, nor does the fact of perceiving little daylight. Some occupants do not even turn it on. On the other hand, some indicate that they receive enough daylight and still use this device (they do it to a greater extent in case A). In other cases, the illuminance levels are below 300 lux, the minimum required in office spaces [40]. Other people in similar spatial configurations practically do not use the lamp, but they have a more active type of work; they move to other places during the working day.
It should be noted that before the study, some occupants were already using a desk lamp because they were not satisfied with the light received from artificial lighting at a ceiling level or with the daylight entering the office.
Analyzing the occupants who use the lamp the longest (Table 5), it is observed that having general lighting under control influences the use of this PCS. On the contrary, not having control of solar protection does not influence its use at all, nor are gender, BMI, or age determining factors.
Table 5.
Interview answers from the users who use the lamp the most.
Only one of the occupants works in a private office (C13), and despite declaring total control of the minimum lighting conditions and maximum satisfaction with them, he is the one who turns on the lamp the most. However, he claims to perceive little daylight, as do all of the occupants who use the instrument the most.
When analyzing in more detail at what times of the day the lamp is used in cases A and C, where the highest use of this PCS is registered in summer (Figure 9), it is seen that in both cases, the first day (the upper part of the graphs) is when more users turn it on, while in subsequent days, the number of users who use it decreases. In case A, although the working day starts at 8 a.m., the lamp is barely turned on first thing, and the continued use by A20 is evident. In case C, the greatest use of the lamp is between 10 a.m. and 1 p.m.
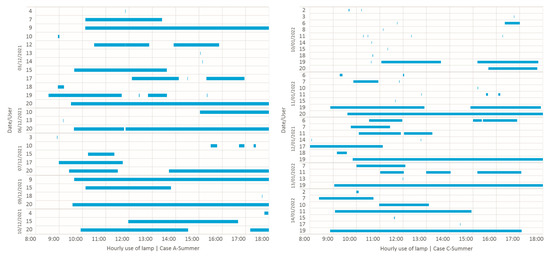
Figure 9.
Hourly use of lamp by occupants in case A (left) and case C (right) in summer.
3.2.4. Correlation of Environment, Control, and Satisfaction with the Use of PCSs
Appendix C shows the level of significance between different variables and the use measured in hours of the PCSs used in all cases. It is observed that for the use of the EMBR, the minimum CO2 present at the workplace has a positive correlation in winter. In other words, if the CO2 level increases, so does wristband use, while in summer, when the average temperature decreases, the use of the EMBR increases.
In the case of the lamp, the significance appears only in winter despite being used more in summer. It is detected that at a higher significance (0.05), if people are not comfortable with the perceived temperature in that season, the use of this PCS increases; and to a lesser extent, it is observed that if satisfaction with the thermal conditions is low, the use of the lamp increases.
More variables influence the use of the fan in winter. At a higher level of significance (0.1), both ventilation and lighting control have a negative correlation, so when the occupants perceive these as low, they use the fan more. Then, with a lower significance (0.05), the minimum temperature, the perceived daylight, and the satisfaction with IAQ conditions are negatively correlated with using the PCS. With a weaker significance, solar protection control appears with a negative correlation. In summer, it is still only ventilation control that influences PCS use, but with a lower level of significance (0.05), as well as the average CO2. With a higher level of significance, the maximum CO2 is positively correlated; namely, if this increases, so does the use of the fan.
4. Discussion
This study takes on the challenge of developing a PCS usage detection framework with real-time occupancy tracking compared to user perceptions in a real context. The extensive research concerning presence detection and occupancy monitoring has laid the foundations for developing models that optimize different tool use, from centralized to personal ones [41]. The use assessment of the three tested PCSs provides valuable results for the generation of a new personal comfort model, with a subjective and dynamic nature, that generates effective links between the user and the building, in addition to implications on how we design the built environment, from economic, social, and technological aspects and mainly from a health and well-being standpoint.
Individual differences in environmental comfort are wide-ranging and should be carefully considered in the design and operation of built environments. Using PCSs allows users to improve their thermal, lighting, and IAQ conditions without interfering with the conditions of others with whom they cohabit [15]. It also provides valuable information when adjusting the use of an HVAC system or anticipating the occupants’ actions [2,20,23].
The case studies of this study are buildings with constant and intermittent use of AC, and positive responses of satisfaction and comfort were obtained when using the PCSs in both options. The results indicate that 85.5% of people using the PCSs reported an improvement in their perception of comfort compared to their perception before the experiment, although the average use did not exceed 20% (fan = 19.6%; EMBR = 12.7%; lamp = 5.9%). In the case of the bracelet and the fan, the sensations are local and improve thermal comfort in general, correcting the discomfort in moderate conditions in the context of offices [31]. Using a PCS a little does not necessarily mean that it has not helped or occupants would not continue using it since PCSs are turned on at a specific time and with expectations of a quick and immediate response, considering that comfort is of a “right here, right now” nature. The reasons always correspond to dissatisfaction with the environmental conditions at a transient time, such as the time of day, returning from another place with a high metabolism, not being satisfied with the HVAC, etc. Due to this variability, a regular use pattern is not observed between the seasons studied.
The people who use the devices have different thermal preferences, which is why the alliesthesia hypothesis is believed to occur. Users can operate the devices freely, meeting their express needs without using PCSs. This coincides with previous conclusions [42], as small, personally driven changes can lead to significant improvements in comfort.
Regarding the continuity of using the PCSs provided, the occupants would continue to use the fan the most, then the EMBR, and finally the lamp. That is, a portable PCS does not mean greater comfort or preference. The “wearable” technology caused some users to feel annoyed or prejudiced toward their health. In addition, the EMBR has a technological development that complicates some people’s use of it. It is essential to know the PCS’s usability and the profile of those using it to make the interaction effective and improve environmental conditions [43].
Concerning technological development, it is also necessary to evaluate the cost–benefit ratio. In this case, the cost of the fan is equivalent to about 8% of the cost of the EMBR, which, together with its usability and small size, significantly improves comfort and thermal acceptability [23,25], in addition to having a low energy consumption.
Opportunities to control environmental conditions vary according to a subject’s proximity to the instrument or device and their age. A study conducted by Marín-Restrepo et al. [44] showed that the closer the person is to the instrument, the higher the probability that they will interact with it, and the younger the subject, the lower the perception of opportunity for interaction. Having control has a positive influence on thermal and light satisfaction but not on IAQ satisfaction. This may be because the AC systems installed in offices did not improve the air quality, but only cooled or heated it. Therefore, only the occupants near a window opened or closed it, affecting the feeling of every person inhabiting the office. In fact, only occupants positioned away from the windows reported experiencing lightheadedness or dizziness at their workplace.
The three PCSs were primarily used in shared offices, where the satisfaction, comfort, and control of thermal conditions were also lower. Climatic characteristics are not an inherent cause of greater use of a PCS. However, certain attitudes of the occupants that relate to the climate influence the use of an instrument. For example, in a warm climate (case C), solar radiation is annoying, so users close the blinds and are encouraged to use the lamp in summer.
Although there are no significant differences in the comfort and thermal sensation responses between genders, differences are observed in other aspects. Women tend to have less control over environmental conditions and tend to use thermal PCSs to a greater extent, while the lamp is used by men and women equally. So, gender is the cause of individual differences in thermal comfort [45].
The external factors influencing using one PCS over another differ depending on the device. In the case of the EMBR, the increase in CO2 in winter, low temperatures in summer, and a high dissatisfaction with indoor temperatures affect this. The latter also influences the use of the fan, as does the increase in CO2 in both seasons, the high dissatisfaction with IAQ, the low control of ventilation and solar protection, being located next to another desk with no intermediate spaces, and having a window in front of the desk. The most relevant factors for the lamp are that the window is behind the occupant, having low lighting control, and low thermal satisfaction and comfort. The latter confirms how unpredictable the use of the lamp is. Unlike what was thought, which is that by having less daylight, it would be used more, switching on this device does not depend on this, nor on satisfaction with the lighting. These offices used artificial light at ceiling level indiscriminately and not sectorized, constantly covering for the absence of daylight. On the contrary, people next to a window may use the lamp because of user interventions (closing blinds) or external factors (neighboring buildings, vegetation).
These results reinforce the hypothesis that comfort models should change the simplistic assumption paradigm in which humans react non-convexly and monotonously to the stimuli to which they are exposed. The new models must integrate other relevant stimuli, valuing the complexity of the built environments, which present combinations of continuous and transient exposures and produce multi-layered psychophysiological effects that drive the perception and behavior of the occupants [42,46].
4.1. Subjectivity, Objectivity, and Awareness
The weather station allowed each user to know the state of the air quality through the color indicated by the device, causing many of them to change their attitude and be willing to ventilate the air. Without this information, they claim that they would not have done so. This simple change shows how educating the user generates effective changes for their well-being and health.
Surveys and interviews are valuable tools for capturing occupant satisfaction, comfort, requirements, and other aspects. However, by themselves, they can distort the interpretation of a diagnosis [7,38]. Once the use of the PCS has been measured, certain inconsistencies are revealed between the consciously given responses (subjective) and the quantified actions (objective) of use [47]. Likewise, the interpretation scale (Likert in this case) can vary between occupants and alter the comparison or the averages to some extent.
4.2. Limitations of This Study
The EMBR is the instrument with the most limitations. Some occupants decided not to use it because of skin discomfort. It is also observed that as the wristband has a contemporary design and attractive technology, people tend to be captivated by its novelty and use it more in the first few days of the experiment, which does not mean that they have not worn it later, but rather that at first, the interpretation of its use may be distorted.
The warm light of the lamp was an influential factor for certain people who decided not to turn it on in summer, as the temperature caused a feeling of heat.
Some variables, such as air currents and the user’s clothing, are not considered in the analysis, but may be relevant. The latter significantly affects comfort, but it is not considered due to the difficulty of obtaining such information on a case-by-case basis.
This study required constant observation on-site to understand the occupant’s actions and follow up on their interaction with the research instruments, so it was impossible to increase the sample size. However, the results of this study help generate a comfort model based on clusters of occupants according to their preferences and use of PCSs. This method provides better results when limited data are available, which is essential for real-world applications [48]. In this way, progress will be made toward the development of a Cohort Comfort Model, which fills a gap between generalized and personalized models and improves the prediction of the thermal preference of a new occupant by using occupant data grouped according to the similarity of preference, with less input data required [8].
4.3. Future Research Directions
Future research is required to analyze the interaction and simultaneous integration of different environmental factors and their effects on people, addressing technical, social, mental, and physiological aspects [49,50]. Although the evaluation becomes more complex, it is essential to remember that stimuli exert a continuous influence and are interconnected in personal evaluations.
Likewise, progress should be made regarding how different PCSs influence people’s well-being. Comfort is associated with immediate actions that respond to the “right here, right now”, but the implications these actions have for people’s health and well-being in the short, medium, and/or long term are unknown.
Another important line of research is the possible energy savings of integrating PCSs in buildings with HVAC systems, even more so as low-cost technologies, such as the fan, are efficient.
5. Conclusions
This study shows that implementing PCSs in shared office spaces substantially improves workers’ perceptions and feelings of thermal, lighting, and IEQ comfort, achieving greater satisfaction in 85.5% of users.
The flexibility and adaptability of PCSs allow the user to tailor the environmental conditions to their momentary needs. Among the three PCSs applied, the desk fan was the most used, while the lamp was the least used.
It was found that gender and age affect the perception of control over environmental factors and the use of PCSs. Women use the systems associated with thermal improvements more.
It was shown that the use of PCSs is influenced not only by personal characteristics, such as a decline in satisfaction, comfort, and individual preferences, but also by various spatial and environmental external factors. The use of the EMBR is influenced by the level of indoor CO2 and the interior temperature, while for the fan, the CO2 level, having little control of the environmental conditions, being located next to another desk with no intermediate spaces, and having a window in front of the desk are relevant. Meanwhile, the use of the lamp presents more unexpected factors associated with temperature and other more predictable ones, such as the location of the windows and little control of the lighting.
Author Contributions
Conceptualization, P.W.-M., I.B.-A. and B.P.-M.; methodology, P.W.-M., I.B.-A. and B.P.-M.; validation, P.W.-M., I.B.-A. and B.P.-M.; formal analysis, P.W.-M., I.B.-A. and B.P.-M.; investigation, P.W.-M.; resources, P.W.-M., I.B.-A. and B.P.-M.; data curation, P.W.-M.; writing—original draft preparation, P.W.-M.; writing—review and editing, P.W.-M., I.B.-A. and B.P.-M.; visualization, P.W.-M. and I.B.-A.; supervision, P.W.-M.; project administration, P.W.-M.; funding acquisition, P.W.-M. All authors have read and agreed to the published version of the manuscript.
Funding
This study was funded by the National Research and Development Agency of Chile Anid-Fondecyt Initiation, grant number 11200667.
Data Availability Statement
The original contributions presented in the study are included in the article, further inquiries can be directed to the corresponding author.
Acknowledgments
The authors acknowledge the support provided by the Department of Design and Theory of Architecture of the Universidad del Bío-Bío, Chile; Department of Architecture Construction II, Higher Technical School of Building Engineering, University of Seville, Spain; and Faculty of Engineering, Architecture and Design, Universidad San Sebastian, Chile.
Conflicts of Interest
The authors declare no conflicts of interest.
Appendix A
Appendix B
| Some Results of the Survey Initially Given to Occupants: Characteristics, Comfort, and Satisfaction. Case | Zone | Occupant | Age Range | Gender [M: Male; F: Female] | BMI | Permanence at Desk [%] | Perceived Level of Control [1–7] | Temperature [1–7] | Lighting [1–7] | IAQ [1–7] | ||||||||
| Temperature | Ventilation | Solar protection | Lighting | Comfort with Temp. Perceived in Summer | Comfort with Temp. Perceived in Winter | Satisfaction with Thermal Conditions in Summer | Satisfaction with Thermal Conditions in Winter | Satisfaction with Lighting Conditions | Daylight Perceived | Satisfaction—IAQ Conditions | ||||||||
| A | Aa | A01 | 35–44 | N | 20.7 | - | 1 | 1 | 1 | 1 | - | 1 | 1 | 1 | A | 1 | 1 | 1 |
| Ac | A02 | 35–44 | N | 25.7 | 26–50 | 5 | 5 | 2 | 3 | 7 | 2 | 6 | 2 | MM | 6 | 2 | 4 | |
| Ab | A03 | 25–34 | F | 26.2 | 76–100 | 5 | 5 | 5 | 5 | 5 | - | 4 | 7 | A | 7 | 3 | 5 | |
| Ab | A04 | 25–34 | N | 25.3 | 76–100 | 2 | 3 | 1 | 5 | 7 | 7 | 7 | 7 | M | 6 | 2 | 6 | |
| Ac | A06 | 35–44 | F | 18.6 | 51–75 | 1 | 6 | 4 | 1 | 6 | 6 | 3 | 6 | MM | 4 | 2 | 2 | |
| Aa | A07 | 55–64 | F | 23.5 | 76–100 | 7 | 1 | 1 | 1 | 7 | 7 | 7 | 7 | MM | 5 | 1 | 3 | |
| Ac | A08 | 25–34 | F | 20.5 | 76–100 | 4 | 4 | 4 | 4 | 4 | 4 | 4 | 4 | MD | 6 | 3 | 4 | |
| Aa | A09 | >65 | N | 27.1 | 76–100 | - | - | - | - | - | 0 | 7 | 0 | A | 7 | 3 | - | |
| Ac | A10 | 25–34 | F | - | 51–75 | 4 | 4 | 4 | 3 | 4 | 1 | 3 | 1 | A | 1 | 1 | 1 | |
| Aa | A11 | 45–54 | M | 32.1 | 51–75 | 1 | 3 | 5 | 5 | 4 | 4 | 3 | 4 | MD | 7 | 3 | 4 | |
| Aa | A12 | 45–54 | N | - | 51–75 | 1 | 2 | 1 | 2 | - | 7 | 6 | 5 | M | 3 | 1 | 4 | |
| Aa | A13 | 35–44 | F | 34.3 | 51–75 | 1 | 1 | 1 | 1 | 6 | 6 | 6 | 6 | T/MM | 6 | 1 | 6 | |
| Aa | A14 | 25–34 | F | - | 76–100 | 4 | 1 | 7 | 1 | 4 | 4 | 6 | 6 | A | 6 | 2 | 4 | |
| Aa | A15 | 25–34 | F | 23.2 | 76–100 | 2 | 1 | 6 | 2 | - | 5 | 2 | 4 | A | 5 | 1 | 4 | |
| Aa | A16 | 55–64 | F | 27.1 | 26–50 | 1 | 1 | 1 | 1 | 4 | 3 | 6 | 3 | A | 5 | 1 | 5 | |
| Ab | A17 | 55–64 | F | 25 | 76–100 | 4 | 3 | - | 2 | - | - | 6 | 6 | N | 5 | - | 1 | |
| Ab | A18 | 45–54 | F | 27.7 | 51–75 | 5 | 3 | 7 | 7 | 7 | - | 7 | 7 | N | 7 | 3 | 7 | |
| Aa | A19 | 55–64 | F | 25.3 | 76–100 | 7 | 1 | 1 | 1 | 7 | 7 | 7 | 7 | MM | 5 | 1 | 3 | |
| Aa | A20 | 55–64 | F | 26.1 | 76–100 | 7 | 1 | 1 | 1 | 7 | 7 | 7 | 7 | MM | 5 | 1 | 3 | |
| B | Ba | B01 | 18–24 | F | 32 | 76–100 | 4 | 4 | 2 | 4 | 5 | 6 | 3 | 3 | M | 7 | 2 | 4 |
| Ba | B02 | 55–64 | F | 36 | 76–100 | - | - | 5 | - | - | 5 | - | 5 | A | 7 | 3 | 5 | |
| Ba | B03 | 25–34 | F | 29.7 | 76–100 | 4 | 4 | 4 | 1 | 5 | 5 | 5 | 5 | A | 6 | 2 | 5 | |
| Ba | B04 | >65 | M | 29.4 | 76–100 | 5 | 5 | 5 | 6 | - | 6 | 6 | 6 | MD | 6 | 2 | 6 | |
| Ba | B05 | 45–54 | M | 25.1 | 76–100 | 7 | 7 | 7 | 7 | 7 | 7 | 7 | 7 | N | 7 | 3 | 7 | |
| Ba | B06 | 25–34 | M | 35.1 | 76–100 | 7 | 2 | 2 | 4 | 5 | 7 | 5 | 7 | M | 6 | 1 | 4 | |
| Bb | B07 | 25–34 | F | 20.8 | 76–100 | 6 | 2 | 2 | 3 | 6 | 6 | 3 | 3 | A | 5 | 1 | 4 | |
| Bb | B08 | 35–44 | M | 22 | 76–100 | 5 | 4 | 7 | 5 | 5 | 6 | 6 | 6 | A | 6 | 2 | 6 | |
| Bb | B09 | 35–44 | F | 27.5 | 76–100 | 1 | 7 | 7 | 7 | 7 | 7 | - | 1 | M | 7 | 3 | 7 | |
| Bb | B10 | 45–54 | F | 23.4 | 76–100 | 5 | 5 | 7 | 7 | 7 | - | 7 | 7 | N | 7 | 3 | 6 | |
| Bb | B11 | 35–44 | M | 29.7 | 76–100 | 7 | 7 | 7 | 7 | 7 | 7 | 7 | 7 | N | 7 | 4 | 7 | |
| Bc | B13 | 35–44 | F | 28.3 | 76–100 | 3 | 3 | 1 | 3 | 1 | 1 | 3 | 2 | A | 4 | 2 | 4 | |
| Bc | B14 | 45–54 | N | 26.5 | 26–50 | 4 | 5 | 6 | 7 | - | 4 | 4 | 4 | A | 5 | 3 | 2 | |
| Bc | B15 | 25–34 | M | 29.7 | 51–75 | 7 | 7 | 7 | 7 | 7 | 7 | 7 | 7 | MD | 7 | 4 | 6 | |
| Bc | B16 | 45–54 | F | 28.3 | 76–100 | - | - | - | - | - | 7 | - | 7 | MD | 7 | 3 | 7 | |
| Bc | B17 | 55–64 | N | 25.2 | 51–75 | 1 | 3 | 7 | 7 | 7 | 6 | 1 | 2 | M | 7 | 3 | 7 | |
| Bc | B18 | 35–44 | F | 24.4 | 51–75 | 6 | 6 | 6 | 6 | 5 | 6 | 7 | 7 | M | 7 | 3 | 6 | |
| Bc | B19 | 25–34 | M | 36 | 51–75 | 5 | 5 | 5 | 5 | 4 | 4 | 4 | 5 | A | 6 | 3 | 5 | |
| C | Ca | C01 | 25–34 | M | 30.7 | 51–75 | 4 | 1 | 7 | 7 | 5 | 5 | 6 | - | N | 7 | 4 | 5 |
| Ca | C03 | 18–24 | F | 25 | 76–100 | 3 | 3 | 5 | 3 | 4 | 4 | 3 | 4 | M | 7 | 4 | 3 | |
| Ca | C04 | 35–44 | M | 30.3 | 76–100 | 4 | 4 | 7 | 6 | 5 | 6 | 6 | 5 | A | 6 | 4 | 6 | |
| Ca | C05 | 25–34 | M | 26 | 51–75 | 6 | 4 | 2 | 7 | 7 | 6 | 7 | 6 | MM | 7 | 4 | 5 | |
| Ca | C06 | 45–54 | F | 30.4 | 76–100 | 1 | 1 | 7 | 7 | 7 | - | 7 | 6 | MM | 5 | 1 | 5 | |
| Cb | C07 | 35–44 | F | 33.6 | 51–75 | 6 | 6 | 6 | 6 | 7 | 7 | 7 | 6 | M | 5 | 4 | 6 | |
| Cb | C08 | 25–34 | F | 35.2 | 76–100 | - | - | - | - | 6 | 6 | 6 | 6 | N | 7 | 4 | 7 | |
| Cb | C10 | 55–64 | N | 34.4 | - | 5 | 5 | 7 | 5 | 6 | - | 7 | 6 | A | 6 | 4 | 5 | |
| Cb | C11 | 45–54 | M | 25.6 | 76–100 | 7 | 7 | - | 5 | 7 | 7 | 6 | 6 | M | 7 | 3 | 6 | |
| Cb | C13 | 35–44 | M | 29.7 | 51–75 | 7 | 7 | 7 | 7 | - | 7 | 7 | 7 | N | 7 | 3 | 7 | |
| Cb | C14 | 35–44 | F | 33 | 76–100 | 7 | 7 | 5 | 7 | 6 | 6 | 5 | 6 | MM | 2 | 2 | - | |
| Cc | C15 | 35–44 | F | 20.5 | 76–100 | 7 | 7 | 7 | 7 | 7 | 7 | 7 | 7 | M | 7 | 2 | 7 | |
| Cc | C16 | 35–44 | F | 30 | 76–100 | 6 | 7 | 6 | 7 | 7 | 7 | 7 | 7 | A | 7 | 4 | 7 | |
| Cc | C17 | 35–44 | M | 29.3 | 51–75 | 5 | 4 | 1 | 5 | 5 | 5 | 6 | 5 | M | 6 | 3 | 5 | |
| Cc | C18 | 35–44 | M | 29.3 | 26–50 | 5 | 7 | 7 | 5 | 7 | 6 | 7 | 5 | M | 6 | 3 | 7 | |
| Cc | C19 | 55–64 | F | 31.1 | 76–100 | 7 | 2 | 2 | 3 | - | 6 | 7 | 6 | MM | 5 | 2 | 6 | |
| Cc | C20 | 35–44 | F | 22.3 | - | 7 | 7 | 2 | 7 | 7 | 7 | 7 | 7 | N | 5 | 1 | 7 | |
| D | Da | D01 | - | N | 26 | 76–100 | 7 | 7 | 7 | 7 | 7 | 7 | 7 | 7 | N | 7 | 2 | 5 |
| Da | D02 | 18–24 | F | 24.5 | - | 1 | 1 | 1 | 1 | 5 | 7 | 6 | 7 | M | 7 | 1 | 3 | |
| Da | D03 | 35–44 | M | 27.6 | 76–100 | 7 | 2 | 1 | 7 | 7 | 7 | 7 | 7 | N | 7 | 1 | 5 | |
| Db | D04 | 45–54 | F | 34.1 | 76–100 | 6 | 5 | 7 | 4 | - | 5 | 6 | 6 | N | 6 | 1 | 6 | |
| Db | D05 | 18–24 | F | 22.8 | 26–50 | 1 | 1 | 7 | 4 | 4 | 5 | 7 | 7 | N | 6 | 1 | 5 | |
| Db | D06 | - | N | 31.2 | 51–75 | 4 | 2 | 5 | 2 | 4 | 4 | 1 | 3 | M | 3 | 1 | 4 | |
| Dc | D07 | 45–54 | F | 24.8 | 51–75 | 3 | 3 | 6 | 5 | 6 | 6 | 6 | 6 | A | 7 | 4 | 5 | |
| Dc | D08 | 35–44 | F | 25.3 | 51–75 | 3 | 5 | 1 | 1 | 5 | 4 | 4 | 4 | A | 7 | 3 | 4 | |
| Dc | D09 | 25–34 | F | 29.2 | 76–100 | 5 | 6 | 6 | 6 | 6 | 5 | 6 | 6 | A | 5 | 3 | 6 | |
| Dc | D10 | 35–44 | F | 26.6 | 26–50 | 4 | 1 | 5 | 5 | 7 | 6 | 5 | 5 | M | 4 | 3 | 4 | |
| Dc | D11 | 45–54 | F | 31.3 | 51–75 | 5 | 5 | 7 | 5 | 6 | 6 | 6 | 5 | N | 5 | 2 | 5 | |
| Dc | D13 | 35–44 | M | 24.9 | 51–75 | 2 | 5 | 6 | 6 | 4 | 5 | 4 | 4 | A | 2 | 2 | 4 | |
| Dc | D14 | 25–34 | F | 23.8 | 26–50 | 4 | 4 | 1 | 2 | 7 | 5 | 6 | 5 | M | 5 | 1 | 7 | |
| Dc | D15 | 35–44 | F | 26.5 | 51–75 | 4 | 6 | 4 | 5 | 6 | 6 | 3 | 3 | A | 6 | 3 | 6 | |
| Dc | D16 | 35–44 | F | 30 | 76–100 | 6 | 6 | 5 | 6 | 6 | 6 | 5 | 5 | A | 7 | 3 | 6 | |
| Dc | D17 | 35–44 | M | 27.6 | 76–100 | 4 | 5 | 6 | 4 | 3 | 3 | 4 | 4 | A | 6 | 3 | 4 | |
| Dc | D18 | 35–44 | M | 24.7 | 51–75 | 5 | 4 | 4 | 6 | 5 | 5 | 5 | 4 | M | 5 | 4 | 5 | |
| Dc | D19 | 35–44 | F | 25.3 | 0–25 | 4 | 2 | 2 | 2 | 4 | 4 | 5 | 5 | A | 2 | 4 | 4 | |
| N: Non-response; M: morning; MD: midday; A: afternoon; MM: Monday AM; A: anytime; N: never. | ||||||||||||||||||
Appendix C
The correlation between environmental variables, perceived control, and satisfaction with the use of the PCSs.
| Winter | Summer | |||||
| EMBR | Lamp | Fan | EMBR | Lamp | Fan | |
| Minimum temperature | 0.003 | 0.235 | −0.304 ** | −0.071 | 0.078 | −0.025 |
| Average temperature | 0.083 | 0.196 | −0.194 | −0.239 ** | 0.157 | −0.095 |
| Maximum temperature | 0.051 | 0.088 | −0.146 | −0.165 | 0.076 | −0.118 |
| Minimum CO2 | 0.242 ** | 0.17 | −0.178 | 0.102 | 0.083 | −0.002 |
| Average CO2 | 0.021 | 0.029 | 0.119 | 0.04 | 0.211 | 0.217 * |
| Max CO2 | 0.034 | 0.041 | 0.052 | −0.008 | 0.147 | 0.355 *** |
| Temperature control | 0.011 | 0.029 | 0.085 | 0.132 | 0.173 | 0.098 |
| Ventilation control | −0.091 | 0.124 | −0.376 *** | −0.048 | −0.209 | −0.222 * |
| Solar protection control | 0.095 | 0.114 | −0.239 * | −0.008 | −0.191 | −0.076 |
| Lighting control | 0.069 | 0.226 | −0.37 *** | 0.099 | −0.201 | −0.102 |
| Comfort with temperature perceived in summer | −0.047 | −0.087 | 0.151 | −0.133 | 0.086 | −0.051 |
| Comfort with temperature perceived in winter | −0.036 | −0.355 ** | 0.046 | −0.075 | −0.006 | −0.098 |
| Satisfaction with thermal conditions—summer | −0.13 | 0.051 | 0.06 | 0.011 | 0.066 | 0.168 |
| Satisfaction with thermal conditions—winter | 0.054 | −0.261 * | −0.023 | 0.034 | 0.001 | 0.117 |
| Satisfaction with lighting conditions | −0.01 | 0.208 | −0.168 | 0.029 | −0.186 | 0.01 |
| Daylight perceived | −0.087 | 0.164 | −0.288 ** | −0.049 | −0.178 | −0.178 |
| Satisfaction—IAQ conditions | −0.067 | 0.187 | −0.275 ** | 0.07 | −0.124 | −0.146 |
| (*) (**) (***): Level of significance. *: 0.1, **: 0.05, *** 0.01. | ||||||
References
- Kim, J.; Zhou, Y.; Schiavon, S.; Raftery, P.; Brager, G. Personal Comfort Models: Predicting Individuals’ Thermal Preference Using Occupant Heating and Cooling Behavior and Machine Learning. Build. Environ. 2018, 129, 96–106. [Google Scholar] [CrossRef]
- Aghniaey, S.; Lawrence, T. The Impact of Increased Cooling Setpoint Temperature during Demand Response Events on Occupant Thermal Comfort in Commercial Buildings: A Review. Energy Build. 2018, 173, 19–27. [Google Scholar] [CrossRef]
- De Dear, R. Thermal Counterpoint in the Phenomenology of Architecture—A Phsychophysiological e Xplanation of Heschong’s ‘Thermal Delight’. In Proceedings of the International Conference Plea2014, Ahmedabad, Indina, 16–18 December 2014; p. 13. [Google Scholar]
- Kim, J.; Schiavon, S.; Brager, G. Personal Comfort Models—A New Paradigm in Thermal Comfort for Occupant-Centric Environmental Control. Build. Environ. 2018, 132, 114–124. [Google Scholar] [CrossRef]
- Parkinson, T.; De Dear, R. Thermal Pleasure in Built Environments: Physiology of Alliesthesia. Build. Res. Inf. 2015, 43, 288–301. [Google Scholar] [CrossRef]
- Zhang, H.; Arens, E.; Zhai, Y. A Review of the Corrective Power of Personal Comfort Systems in Non-Neutral Ambient Environments. Build. Environ. 2015, 91, 15–41. [Google Scholar] [CrossRef]
- Cheung, T.; Schiavon, S.; Parkinson, T.; Li, P.; Brager, G. Analysis of the Accuracy on PMV—PPD Model Using the ASHRAE Global Thermal Comfort Database II. Build. Environ. 2019, 153, 205–217. [Google Scholar] [CrossRef]
- Quintana, M.; Schiavon, S.; Tartarini, F.; Kim, J.; Miller, C. Cohort Comfort Models—Using Occupant’s Similarity to Predict Personal Thermal Preference with Less Data. Build. Environ. 2022, 227, 109685. [Google Scholar] [CrossRef]
- Kim, J.; Bauman, F.; Raftery, P.; Arens, E.; Zhang, H.; Fierro, G.; Andersen, M.; Culler, D. Occupant Comfort and Behavior: High-Resolution Data from a 6-Month Field Study of Personal Comfort Systems with 37 Real Office Workers. Build. Environ. 2019, 148, 348–360. [Google Scholar] [CrossRef]
- Liu, W.; Lian, Z.; Zhao, B. A Neural Network Evaluation Model for Individual Thermal Comfort. Energy Build. 2007, 39, 1115–1122. [Google Scholar] [CrossRef]
- Zhang, F.; de Dear, R.; Candido, C. Thermal Comfort during Temperature Cycles Induced by Direct Load Control Strategies of Peak Electricity Demand Management. Build. Environ. 2016, 103, 9–20. [Google Scholar] [CrossRef]
- Veselý, M.; Zeiler, W. Personalized Conditioning and Its Impact on Thermal Comfort and Energy Performance—A Review. Renew. Sustain. Energy Rev. 2014, 34, 401–408. [Google Scholar] [CrossRef]
- Wegertseder-Martínez, P. The Need for a Paradigm Shift toward an Occupant-Centered Environmental Control Model. Sustainability 2023, 15, 5980. [Google Scholar] [CrossRef]
- Rawal, R.; Schweiker, M.; Kazanci, O.B.; Vardhan, V.; Jin, Q.; Duanmu, L. Personal Comfort Systems: A Review on Comfort, Energy, and Economics. Energy Build. 2020, 214, 109858. [Google Scholar] [CrossRef]
- Parkinson, T.; De Dear, R. Thermal Pleasure in Built Environments: Spatial Alliesthesia from Air Movement. Build. Res. Inf. 2017, 45, 320–335. [Google Scholar] [CrossRef]
- Zhang, H.; Arens, E.; Kim, D.E.; Buchberger, E.; Bauman, F.; Huizenga, C. Comfort, Perceived Air Quality, and Work Performance in a Low-Power Task-Ambient Conditioning System. Build. Environ. 2010, 45, 29–39. [Google Scholar] [CrossRef]
- De Dear, R. Revisiting an Old Hypothesis of Human Thermal Perception: Alliesthesia. Build. Res. Inf. 2011, 39, 108–117. [Google Scholar] [CrossRef]
- Kalaimani, R.; Jain, M.; Keshav, S.; Rosenberg, C. On the Interaction between Personal Comfort Systems and Centralized HVAC Systems in Office Buildings. Adv. Build. Energy Res. 2020, 14, 129–157. [Google Scholar] [CrossRef]
- Anderson, M.; Fierro, G.; Kumar, S.; Kim, J.; Arens, E.; Zhang, H.; Raftery, P.; Culler, D. Well-Connected Microzones for Increased Building Efficiency and Occupant Comfort. In Proceedings of the 2nd ACM International Conference on Embedded Systems for Energy-Efficient Built Environments, Seoul, Republic of Korea, 4 November 2015. [Google Scholar]
- Bauman, F.; Raftery, P.; Kim, J. Changing the Rules: Innovative Low-Energy Occupant-Responsive HVAC Controls and Systems; Final Project Report; Center for the Built Environment: Berkeley, CA, USA, 2017. [Google Scholar]
- Hoyt, T.; Arens, E.; Zhang, H. Extending Air Temperature Setpoints: Simulated Energy Savings and Design Considerations for New and Retrofit Buildings. Build. Environ. 2015, 88, 89–96. [Google Scholar] [CrossRef]
- Pasut, W.; Zhang, H.; Arens, E.; Zhai, Y. Energy-Efficient Comfort with a Heated/Cooled Chair: Results from Human Subject Tests. Build. Environ. 2015, 84, 10–21. [Google Scholar] [CrossRef]
- Warthmann, A.; Wölki, D.; Metzmacher, H.; van Treeck, C. Personal Climatization Systems—A Review on Existing and Upcoming Concepts. Appl. Sci. 2018, 9, 35. [Google Scholar] [CrossRef]
- Yang, B.; Lei, T.H.; Yang, P.; Liu, K.; Wang, F. On the Use of Wearable Face and Neck Cooling Fans to Improve Occupant Thermal Comfort in Warm Indoor Environments. Energies 2021, 14, 8077. [Google Scholar] [CrossRef]
- Song, W.; Zhang, Z.; Chen, Z.; Wang, F.; Yang, B. Thermal Comfort and Energy Performance of Personal Comfort Systems (PCS): A Systematic Review and Meta-Analysis. Energy Build. 2022, 256, 111747. [Google Scholar] [CrossRef]
- Kogawa, Y.; Nobe, T.; Onga, A. Practical Investigation of Cool Chair in Warm Offices. In Proceedings of the Clima 2007 WellBeing Indoors, Helsinki, Finland, 10–14 June 2007; FINVAC: Helsinki, Finland, 2007; pp. 2–7. [Google Scholar]
- Watanabe, S.; Shimomura, T.; Miyazaki, H. Thermal Evaluation of a Chair with Fans as an Individually Controlled System. Build. Environ. 2009, 44, 1392–1398. [Google Scholar] [CrossRef]
- Sun, W.; Cheong, K.W.D.; Melikov, A.K. Subjective Study of Thermal Acceptability of Novel Enhanced Displacement Ventilation System and Implication of Occupants’ Personal Control. Build. Environ. 2012, 57, 49–57. [Google Scholar] [CrossRef]
- Shahzad, S.; Calautit, J.K.; Calautit, K.; Hughes, B.; Aquino, A.I. Advanced Personal Comfort System (APCS) for the Workplace: A Review and Case Study. Energy Build. 2018, 173, 689–709. [Google Scholar] [CrossRef]
- Zhang, H.; Arens, E.; Taub, M.; Dickerhoff, D.; Bauman, F.; Fountain, M.; Pasut, W.; Fannon, D.; Zhai, Y.; Pigman, M. Using Footwarmers in Offices for Thermal Comfort and Energy Savings. Energy Build. 2015, 104, 233–243. [Google Scholar] [CrossRef]
- Wang, Z.; Warren, K.; Luo, M.; He, X.; Zhang, H.; Arens, E.; Chen, W.; He, Y.; Hu, Y.; Jin, L.; et al. Evaluating the Comfort of Thermally Dynamic Wearable Devices. Build. Environ. 2020, 167, 106443. [Google Scholar] [CrossRef]
- Wang, Z.; Luo, M.; Zhang, H.; He, Y.; Jin, L.; Arens, E.; Liu, S. The Effect of a Low-Energy Wearable Thermal Device on Human Comfort. In Proceedings of the 15th Conference of the International Society of Indoor Air Quality & Climate (ISIAQ), Philadelphia, PA, USA, 22–27 July 2018; pp. 1–9. [Google Scholar]
- Lopez, G.; Tokuda, T.; Oshima, M.; Nkurikiyeyezu, K.; Isoyama, N.; Itao, K. Development and Evaluation of a Low-Energy Consumption Wearable Wrist Warming Device. J. Autom. Technol. 2018, 12, 911–920. [Google Scholar] [CrossRef]
- Duarte Roa, C.; Schiavon, S.; Parkinson, T. Targeted Occupant Surveys: A Novel Method to Effectively Relate Occupant Feedback with Environmental Conditions. Build. Environ. 2020, 184, 107129. [Google Scholar] [CrossRef]
- Sood, T.; Janssen, P.; Miller, C. Spacematch Using Environmental Preferences to Match Occupants to Suitable Activity-Based Workspace. Front. Built Environ. 2020, 6, 113. [Google Scholar] [CrossRef]
- Embr Labs Embr Wave. Available online: https://www.embrlabs.com/ (accessed on 30 July 2020).
- Arens, E.; Hui, Z. The Skin’s Role in Human Thermoregulation and Comfort. In Thermal and Moisture Transport in Fibrous Materials; Woodhead Publishing: Cambridge, UK, 2006; pp. 560–602. [Google Scholar] [CrossRef]
- Moezzi, M.; Goins, J. Text Mining for Occupant Perspectives on the Physical Workplace. Build. Res. Inf. 2011, 39, 169–182. [Google Scholar] [CrossRef]
- MacNaughton, P.; Spengler, J.; Vallarino, J.; Santanam, S.; Satish, U.; Allen, J. Environmental Perceptions and Health before and after Relocation to a Green Building. Build. Environ. 2016, 104, 138–144. [Google Scholar] [CrossRef]
- ASHRAE Standard 62.1; Ventilation for Acceptable Indoor Air Quality. ASHRAE: Peachtree Corners, GA, USA, 2010.
- Labeodan, T.; Zeiler, W.; Boxem, G.; Zhao, Y. Occupancy Measurement in Commercial Office Buildings for Demand-Driven Control Applications—A Survey and Detection System Evaluation. Energy Build. 2015, 93, 303–314. [Google Scholar] [CrossRef]
- Bond, L.; Kearns, A.; Mason, P.; Tannahill, C.; Egan, M.; Whitely, E. Exploring the Relationships between Housing, Neighbourhoods and Mental Wellbeing for Residents of Deprived Areas. BMC Public Health 2012, 12, 1–14. [Google Scholar] [CrossRef] [PubMed]
- Exss, K.; Wegertseder-Martínez, P.; Trebilcock, M. A Systematic Review of Personal Comfort Systems from a Post-Phenomenological View. Ergonomics 2024, 6. [Google Scholar] [CrossRef] [PubMed]
- Marín-Restrepo, L.; Trebilcock, M.; Gillott, M. Occupant Action Patterns Regarding Spatial and Human Factors in Office Environments. Energy Build. 2020, 214, 109889. [Google Scholar] [CrossRef]
- Wang, Z.; de Dear, R.; Luo, M.; Lin, B.; He, Y.; Ghahramani, A.; Zhu, Y. Building and Environment; Elsevier Ltd.: Amsterdam, The Netherlands, 2018; pp. 181–193. [Google Scholar]
- Hanc, M.; McAndrew, C.; Ucci, M. Conceptual Approaches to Wellbeing in Buildings: A Scoping Review. Build. Res. Inf. 2019, 47, 767–783. [Google Scholar] [CrossRef]
- Bluyssen, P.M.; Aries, M.; Van Dommelen, P. Comfort of Workers in Office Buildings: The European HOPE Project. Build. Environ. 2011, 46, 280–288. [Google Scholar] [CrossRef]
- Lee, S.; Karava, P.; Tzempelikos, A.; Bilionis, I. Inference of Thermal Preference Profiles for Personalized Thermal Environments with Actual Building Occupants. Build. Environ. 2019, 148, 714–729. [Google Scholar] [CrossRef]
- Schweiker, M.; Ampatzi, E.; Andargie, M.S.; Andersen, R.K.; Azar, E.; Barthelmes, V.M.; Berger, C.; Bourikas, L.; Carlucci, S.; Chinazzo, G.; et al. Review of Multi-domain Approaches to Indoor Environmental Perception and Behaviour. Build. Environ. 2020, 176, 106804. [Google Scholar] [CrossRef]
- Wei, W.; Wargocki, P.; Zirngibl, J.; Bendžalová, J.; Mandin, C. Review of Parameters Used to Assess the Quality of the Indoor Environment in Green Building Certification Schemes for Offices and Hotels. Energy Build. 2020, 209, 109683. [Google Scholar] [CrossRef]

Disclaimer/Publisher’s Note: The statements, opinions and data contained in all publications are solely those of the individual author(s) and contributor(s) and not of MDPI and/or the editor(s). MDPI and/or the editor(s) disclaim responsibility for any injury to people or property resulting from any ideas, methods, instructions or products referred to in the content. |
© 2024 by the authors. Licensee MDPI, Basel, Switzerland. This article is an open access article distributed under the terms and conditions of the Creative Commons Attribution (CC BY) license (https://creativecommons.org/licenses/by/4.0/).