Article

A Comparative Analysis of Low-Carbon Design Strategies for China’s Higher Education Parks Based on Building and Urban Scale in Sustainability Rating Systems

1
China Academy of Building Research, No. 30 North Third Ring East Road, Beijing 100013, China
2
Nation Engineering Research Center of Building Technology, Beijing 100013, China
*
Author to whom correspondence should be addressed.
Buildings 2024, 14(6), 1846; https://doi.org/10.3390/buildings14061846
Submission received: 18 April 2024 / Revised: 29 May 2024 / Accepted: 2 June 2024 / Published: 18 June 2024

Abstract

:
In the global context of carbon neutrality, higher education parks are an important strategic position for achieving China’s goal of carbon peaking and carbon neutralization. Strategies from the perspective of life cycle to guide early low-carbon planning and design are an effective way to achieve carbon emission reduction goals. As the scale of university construction gradually expands, the “urban” attributes of them are becoming prominent. However, there is no quantitative study on analyzing the life cycle carbon emission strategies at both the building and urban scale based on sustainability rating systems. This study first extracts the design strategies according to BREEAM, LEED, DGNB and relative assessment standards for campuses and cities in China at the building and urban scale based on the 7-dimensional low-carbon strategy framework, then sorts out and compares the proportions of carbon-emission-related strategies across various dimensions and life cycle stages. It then summarizes the applications and concerns of low-carbon design strategies at different design scales. Finally, the weighting and calculation methods of life cycle carbon emissions in different sustainability rating systems are compared, the scope and methods of carbon emission benchmarks under different standards are compiled, and the evaluation method for locally applicable carbon emission benchmarks in China is proposed in light of China’s national conditions, which provides guidance for the design process and standard formulation.

1. Introduction

1.1. Background

As the world’s largest carbon emitter, China accounts for a significant portion of carbon emissions, with its education sector contributing 246 million tons, or 2.5% of the national total [1]. Data show that the per capita energy consumption of students in the operational phase alone is more than twice that of the average Chinese resident [2], highlighting the need for carbon reduction efforts within colleges and universities. This highlights the urgent need for comprehensive carbon reduction initiatives on higher education campuses. Numerous studies [3,4,5,6] indicate that the early design stage significantly influences the final performance of buildings. Consequently, early planning and design are essential for achieving low-carbon campuses.
The concept of green campuses was initially proposed by Tsinghua University in 1998 [7], leading Chinese universities to actively engage in green campus initiatives over the following two decades. Guiding Opinions of the State Council on Accelerating the Establishment of a Sound Green, Low-Carbon and Circular Development Economic System [8] released in 2021 proposed the promotion of campus low-carbon transformation. Subsequently, the issuance of the Assessment Standard of Green Campus (GB/T51356-2019) [9] and Guideline for Carbon Emissions Accounting of University Campuses (T/CABEE 053-2023) [10] has provided a top-down approach to promoting low-carbon design in China’s higher education institutions. These standards will continue to evolve alongside the growth of higher education in China.
With the development of urbanization and the improvement of the education level in China [11], a large number of new colleges and universities are constructed every year, with their scale surpassing that of traditional campuses [12]. Many new colleges and universities are situated on the peripheries of urban areas, constituting higher education parks [13] with distinct zones and often catalyzing the development of residential and commercial areas, thereby fostering the emergence of “college towns.” Relevant research institutions are currently striving to refine and categorize low-carbon park standards, specifically recognizing higher education parks as a distinct type. Due to their prominent functions and construction characteristics, special studies are warranted for them. The planning and design of large-scale higher education parks need to pay attention to the top-level design, the transport and overall regulation at the urban scale, as well as focus on reducing carbon emissions of each building within the colleges and the universities as a whole.
Life cycle assessment (LCA) is defined as the fundamental methodology for building sustainability assessment in international standards [14], with life cycle carbon emissions (LCCEs) being a crucial element. From the perspective of life cycle, besides the operational carbon emissions from energy and resource consumption from daily activities, the embodied carbon emissions from construction, repair and refurbishment in the operation stage cannot be ignored, particularly in the expansive development of new higher education parks. Although current relevant Chinese standards [10,15] focus primarily on the operational phase of campus carbon emissions, the significance of other life cycle stages is increasingly apparent as operational energy emissions decrease due to enhanced energy-saving designs [3] and reduced energy usage during academic breaks. Consequently, it is vital to consider a comprehensive low-carbon design strategy for higher education parks throughout their entire life cycle, at both urban and building scales.

1.2. State of the Art

As a “miniature city” within a region [16], the research on sustainable design of higher education campuses has been attracting much attention. Research mainly focuses on campus development paths [17,18], planning and design methods [19,20], management and implementation mechanisms [21,22], evaluation systems [18,23], etc. Among these, the planning and design methods and evaluation system are most closely related to the early design of new higher education parks.
In terms of planning and design methods, some articles focus on energy management and optimization strategies for higher education parks [24,25]. Through various tools and models to optimize the operational energy consumption of higher education campuses [26], studies focus on the green space planning of the campus, emphasizing the enhancement of the ecological environment quality of the campus by increasing the greening area and improving the ecological landscape design. In addition, some studies have explored low-carbon design strategies for educational buildings within universities, such as reducing carbon emissions in the operation phase of buildings through passive technologies [27]. Regarding campus carbon emissions, much attention is directed towards the operation stage, including methods for calculating carbon footprints [28] and analyzing energy consumption behaviors [29]. Ref. [30] developed tools for calculating carbon emissions throughout the life cycle of university campuses. However, these studies often focus on individual aspects, leaving a gap in research concerning comprehensive low-carbon design strategies for entire higher education parks.
Researchers have endeavored to construct diverse dimensions of sustainable evaluation methods for assessing the sustainability of campuses. For instance, Dawodu, A. et al. [31] developed a new framework for Chinese campus sustainable assessment planning and discovered that environmental, educational and governance are the most predominant dimensions in campus sustainability assessment [32], while another study [33] proposes a Performance Indicators for Core Sustainability Objectives of Universities (PICSOU) evaluation framework for colleges and universities based on the United Nations’ (UN’s) Triple Bottom Line of sustainable development. Additionally, various evaluation systems have been established for local colleges and universities [16,18]. Numerous mature evaluation standards exist for green campuses globally, including the Sustainability Tracking, Assessment & Rating System (STARS) [34], green metrics [35], the United Nations Toolkit [36], and so on. However, due to the distinctive geographical characteristics of college and university campuses, few evaluation standards are specifically tailored to them and applicable on a global scale. For instance, green metrics and the United Nations Toolkit primarily focus on the environmental dimension, while STARS emphasizes the operational and maintenance aspects of education management. The evaluation system for sustainable campuses encompasses various dimensions, including the environment, management mechanisms, economic factors, social culture and co-education of teachers and students, which do not entirely prioritize the target of life cycle carbon emissions. And it is challenging to provide target-oriented evaluation criteria and strategy references for designers during the design stages.
The Building Research Establishment Environmental Assessment Method (BREEAM) [37], Leadership in Energy and Environmental Design (LEED) [38] and Deutsche Gü tesiegel für Nachhaltiges Bauen (DGNB) [39] systems have been widely used to assess the sustainability of campuses worldwide. However, most of the established evaluation cases are for single school buildings, neglecting assessments at the park level. The use of community-level evaluation tools, such as BREEAM Communities and LEED Community Development, is often applied to evaluate cities or parks of larger scale, disregarding the specific sustainability needs of a campus’s microenvironment. Furthermore, the wide array of evaluation metrics in the sustainability rating systems (SRSs) makes it challenging for designers to extract usable strategies efficiently. Therefore, refining low-carbon design strategies for higher education parks requires a comparative analysis of existing evaluation indicators specifically for designers and standard-setting processes.

1.3. Main Objectives of the Study

Systematic research into low-carbon strategies for higher education parks, particularly aiming at the initial planning and design stages, remains scarce. This paper initiates the extraction and analysis of low-carbon design strategies from a life cycle perspective, employing the existing SRSs. The primary objectives of this study include:
(1)
Comprehensive Analysis of Low Carbon Strategies: this process entails analyzing and categorizing the provisions of the evaluation system to identify low-carbon strategies at both the building and urban scales within higher education parks. The study conducts score share and ranking analyses of these strategies, proposing highly visible strategies across various dimensions for application in design and standards development.
(2)
Life Cycle Perspective Integration: this study examines the correlation between the criteria weights and different life cycle stages to assess the impacts of various strategies on the LCCE of higher education parks. Suggestions for improving the evaluation system for Chinese universities from a life cycle perspective will be presented.
(3)
Carbon Neutrality Considerations: through comparative analysis, this research addresses the significance of carbon emissions calculations, alongside relevant tools, databases and benchmarking systems for higher education parks in the context of carbon neutrality. It will propose strategies aimed at reducing carbon emissions.
The significance of this study lies in presenting a framework of analytical methods that, through a comprehensive analysis of SBS score shares, helps designers explore the low-carbon design strategies embedded within SBSs from various perspectives. It proposes a strategic selection list for low-carbon design, offers policy recommendations for early-stage low-carbon calculation and evaluation methods and provides a reference for low-carbon and carbon-neutral initiatives in China’s higher education campuses.

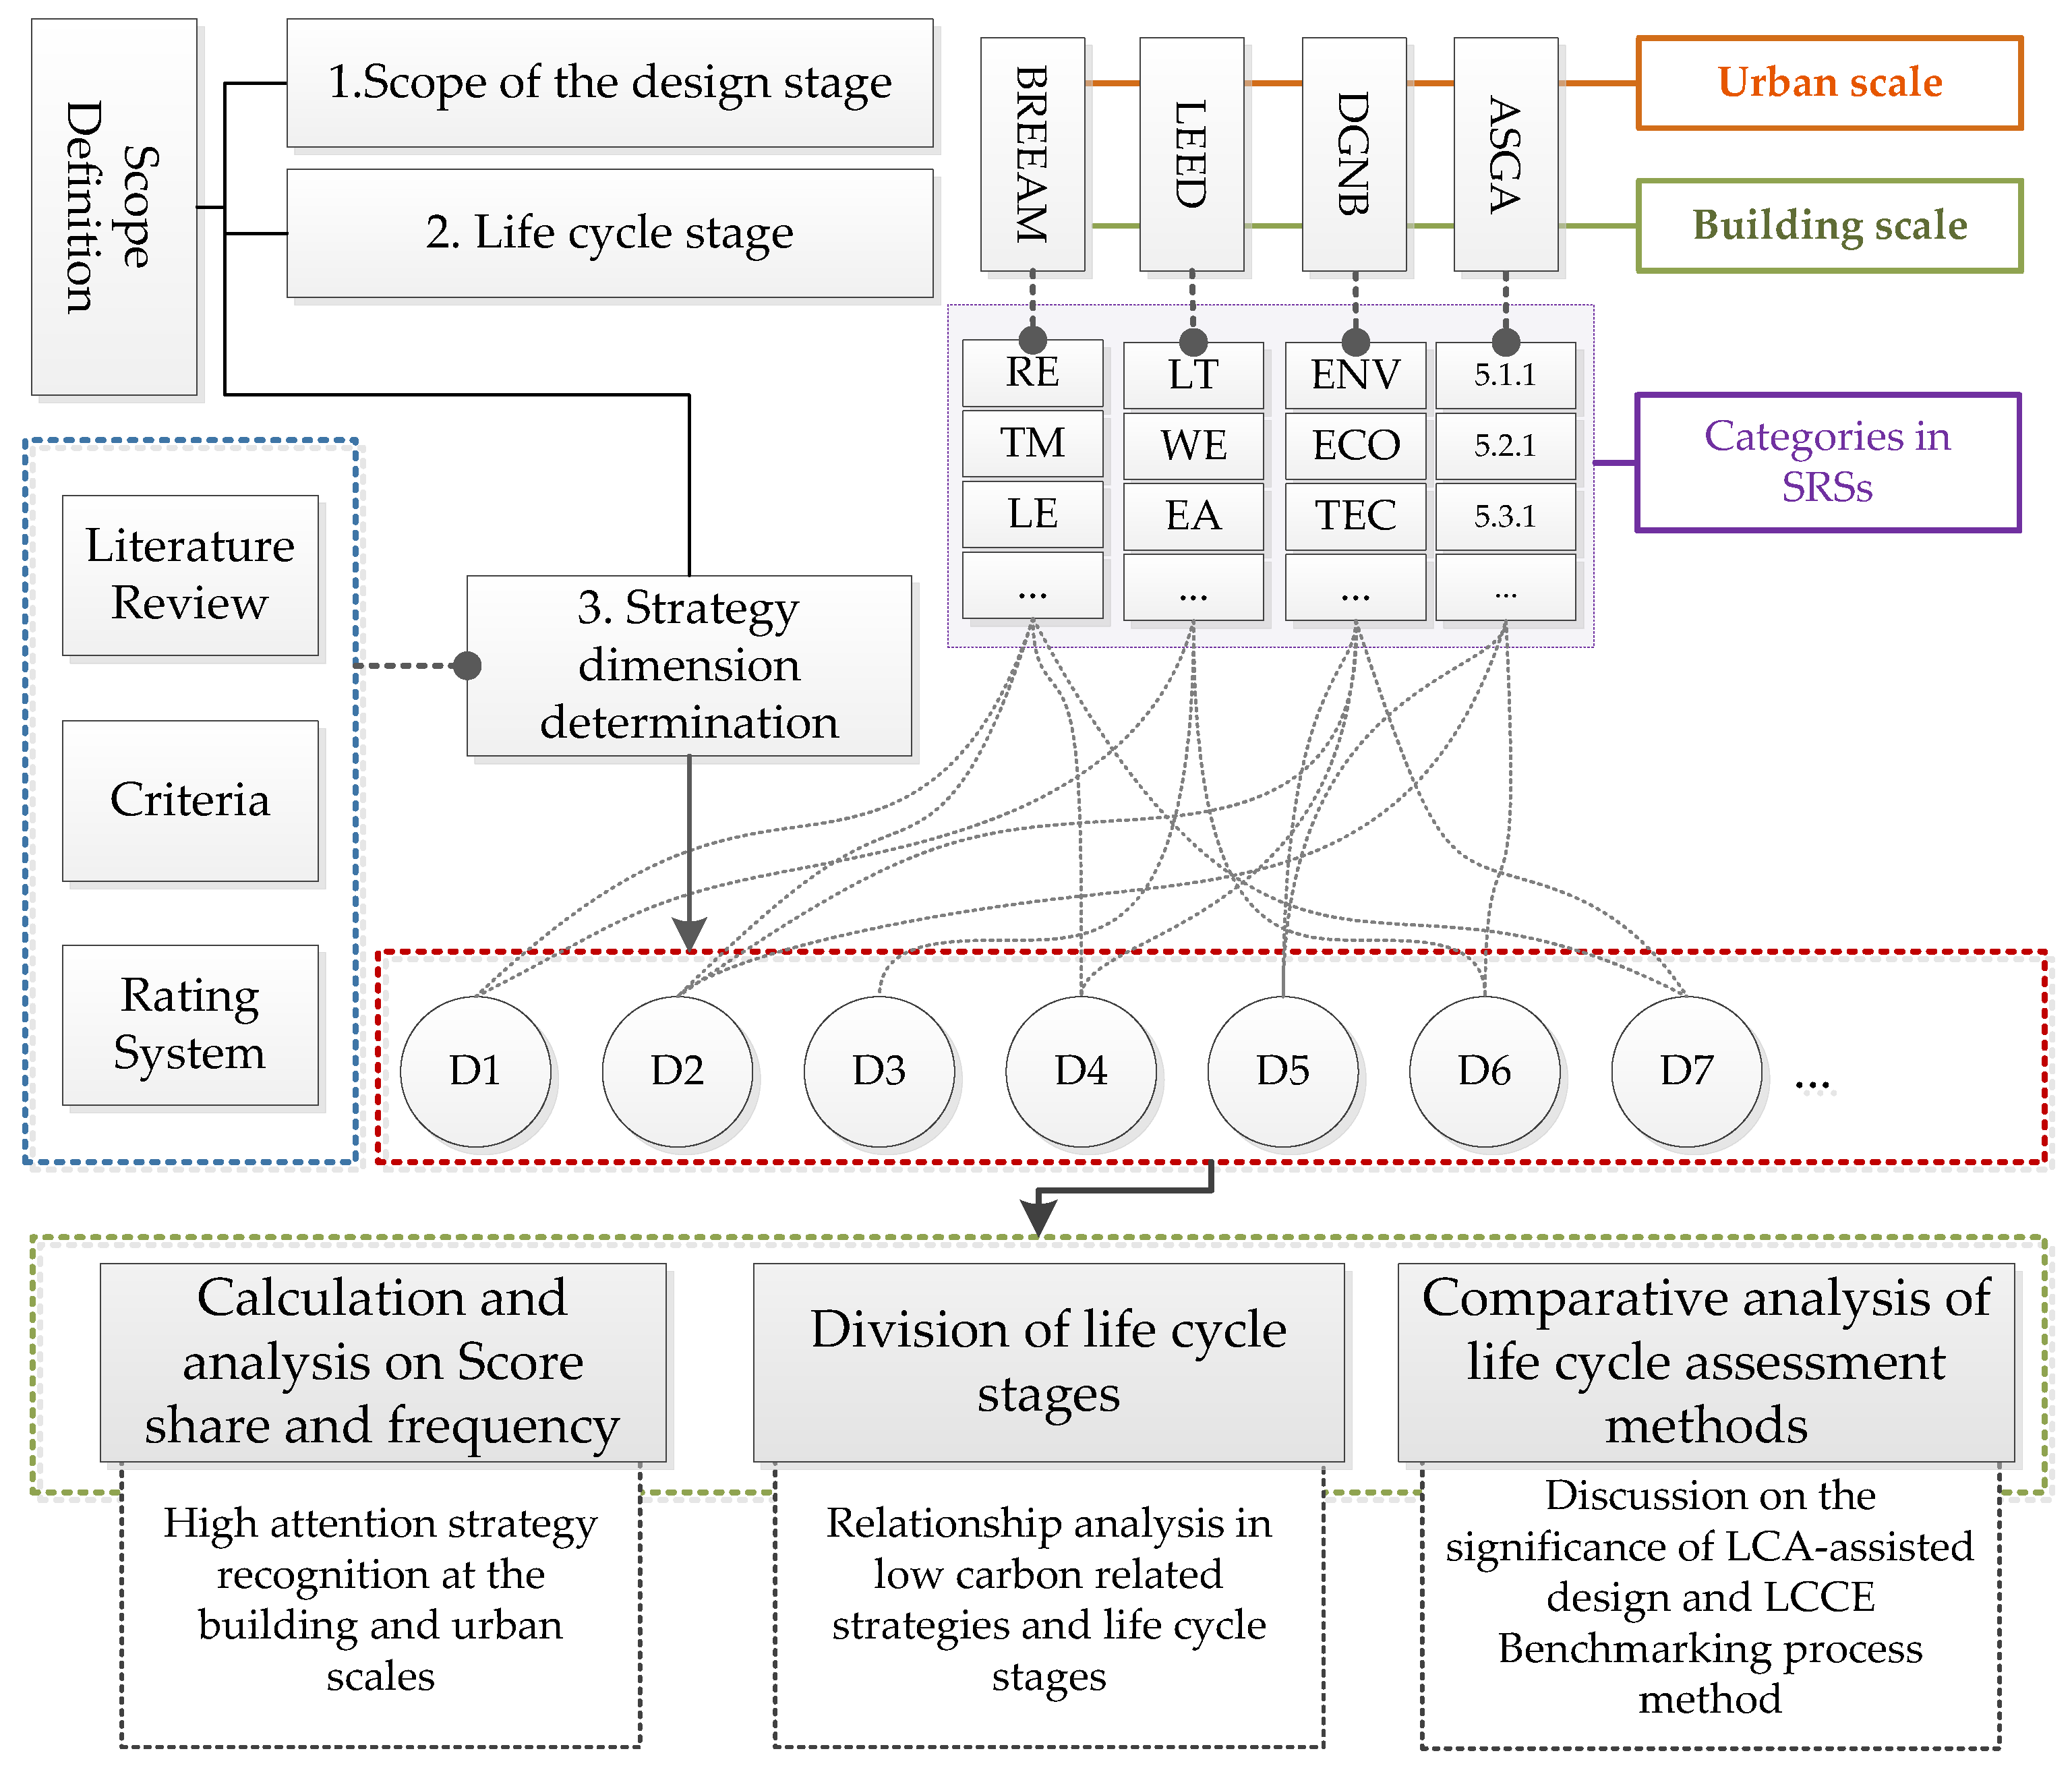
2. Materials and Methods

The methodology employed in this article comprises four primary steps, as illustrated in Figure 1 and outlined below. Initially, we identify the scope and dimensions of higher education parks examined in this research, alongside delineating the scope of the design stage and the life cycle stage. Subsequently, we ascertain the strategic dimension pertinent to low-carbon design through a comprehensive review of literature. In the third step, we identify several representative SRSs and extract criteria contents from both building and urban scales, translating them into specific low-carbon strategies. These specific strategies are aligned with the dimensions to establish a comprehensive strategy library. We synthesize and analyze the outcomes of the SRSs across three dimensions, including: (1) the percentage distribution of strategy scores, (2) the effects of strategies on life cycle carbon emissions at each stage and (3) a comparison of methods for calculating life cycle carbon emissions (LCCEs).

2.1. Scope and Dimension Determination

This paper focuses on newly constructed colleges and universities, categorizing them as “parks,” and examines carbon emission strategies from both macro and micro perspectives. Given China’s current goals of carbon peaking and carbon neutrality, the study specifically investigates strategies for carbon reduction in the early design stage, emphasizing environmental aspects of campus life cycle carbon reduction, while excluding discussions on low-carbon issues in economics, management, education and society.
In terms of the life cycle, based on a comprehensive reference to European Standard EN 15978 [40] and China’s Standard for Building Carbon Emission Calculation (GB/T 51366-2019) [15], this paper includes the stages of material production, material transportation, construction, replacement and repair, operational energy use, operational water use, demolition and disposal and recycling.
The assessment system of green and sustainable campuses has developed and evolved over the years, forming a relatively mature assessment framework. By reviewing existing studies, standards and assessment tools about sustainable colleges and universities or low-carbon parks with strong relevance to this paper, by the method provided in Figure 2, the analytical dimensions of higher educational parks for low-carbon design are identified.

2.2. Extraction and Organization of Low-Carbon Strategies in SRSs

2.2.1. SRS Options

This study examines three prominent international SRSs for building evaluation—BREEAM, LEED and DGNB—alongside the Assessment Standard of Green Campus (GB/T51356-2019) [9] in China. BREEAM, LEED and DGNB are the most widely used sustainable building standards (SBSs) internationally. Although each has unique characteristics, they lack strong regional specificity in their provisions and have been applied to numerous certification cases in China. Due to their maturity, these SBSs have developed evaluation methods for various scales and types of buildings, ensuring consistency in the basic framework across both building and city scales. Within the new construction systems of these international SRSs, specific categories dedicated to schools and education are included (Appendix A). At the urban level, BREEAM Communities (B-C) [41], LEED Cities and Communities (L-C) [42] and DGNB Districts Criteria Set (D-U) [43] are selected. Although no explicitly applicable terms for higher education parks exist in urban-scale assessment systems, official institutions acknowledge that evaluations can be conducted on higher educational campuses based on criteria requirements regarding scale, function and size. Additionally, considering China’s context, an analysis and comparison with the national standard Assessment Standard for Green Eco-District (GB/T 51255-2017) [44] have been undertaken.

2.2.2. Indicator Translation

Extraction of low-carbon design strategies from the indicators is divided into two steps. Firstly, it entails identifying the relationships between indicators and carbon emissions, along with their associated life cycle stages. Secondly, it involves summarizing strategies based on established dimensions, aligning them with corresponding dimensions and compiling a coded list of low-carbon strategies to create a strategy analysis database for ease of analysis and utilization. The first step entails qualitative assessment. We selected 10 engineers who have extensive practical and research experience in green buildings, low-carbon buildings and zero-carbon buildings and parks (the detailed information of the experts is listed in Appendix B). The assessment results were then compiled based on their judgments. Despite some divergence in expert opinions, a substantial consensus emerged regarding the relevance of certain indicators to carbon emissions. Specifically, at least eight experts agreed on whether an indicator was related to carbon emissions. Therefore, a judgment was deemed accepted if it received agreement from at least eight engineers. The life cycle stage to which the criterion or indicator belongs is determined based on its content. It may impact one, several or all of the eight stages mentioned above.

2.3. Comparison and Analysis Methods of Low-Carbon Strategies

2.3.1. Calculation Method for Strategy Weight

The score share calculation quantitatively analyzes low-carbon-related indicators to elucidate their proportion in the SRSs. This study calculates the score share of each indicator as the strategy weight in two main parts:
(1)
The indicator’s score shares in the total score (Equations (1)–(4)).
(2)
The proportion of related carbon emission indicators to all carbon-emission-related indicators in the entire rating system (Equation (5)).
The first part aims to identify the degrees of attention on carbon-related strategies of various SRSs with the distinct emphases. Given the varying evaluation scopes and focuses of different SRSs, the distribution of scores for carbon-emission-related criteria significantly varies. To facilitate further comparison, the second part identifies the share of carbon-related strategies to enhance comparability between indicators, assuming each indicator receives the highest score.
Both LEED and ASGC have prerequisites that are indispensable factors in the evaluation but do not contribute to the score. The strategies within these prerequisites are also discussed in this article to identify key strategies. Among the chosen SRSs in this study, LEED employs implied weights, while ASGC and ASGED utilize a comprehensive weighting system. BREEAM and DGNB use independent weights, with DGNB serving as a secondary weight [45]. Depending on the weight method, each SRS allocates indicator credits using Equations (1)–(4) in total.
S S B R E i   = j J W B j × ( S I n d j / S T j )
  • S S B R E i = Score share of strategy i related to low-carbon design in BREEAM;
  • J = All indicators related to strategy i;
  • W B j = Weighting of category j in BREEAM;
  • S I n d j = Score of indicator j related to strategy i in BREEAM;
  • S T j = Total score of category j including indicator j in BREEAM.
S S L E E D i   = j J S I n d j / S T j
  • S S L E E D i = Score share of strategy i related to low-carbon design in LEED;
  • J = All indicators related to strategy i;
  • S I n d j = Score of indicator j related to strategy i in LEED;
  • S T j = Total score of category j in LEED.
S S D G N B i = j J W D i × ( S I n d j / S I j ) × W D j  
  • S S D G N B i = Score share of strategy i related to low-carbon design in DGNB;
  • J = All indicators related to strategy i;
  • W D j = Weighting of item j in DGNB;
  • S I n d j = Score of indicator j related to strategy i in DGNB;
  • S I j = Total score of item a including indicator j in DGNB;
  • W D j = weighting of category j including indicator j in DGNB.
S S C H N i   = j J S I n d j / S T j × W C j
  • S S C H N i = Score share of strategy i related to low-carbon design in ASGC or ASGED;
  • J = All indicators related to strategy i;
  • S I n d j = Score of indicator j related to strategy j in ASGC or ASGED;
  • S T j = Total score of category j including indicator j in ASGC or ASGED;
  • W C j = Weighting of category j including indicator j in ASGC or ASGED.
S R i   = S S S R S i / j I S I n d j
  • S R i = Share for score of low-carbon-design-related strategy i in total score share of all the low-carbon-design-related strategies in a specific SRS in this article;
  • S S S R S i = Score share of strategy i related to low-carbon design in a specific SRS in this article;
  • I = All indicators related to low-carbon design strategies in a specific SRS in this article;
  • S I n d j = Score of indicator j related to low-carbon design strategies in a specific SRS in this article.

2.3.2. Integration Analysis Method of Carbon Emission Strategies

Carbon emission calculation holds significant importance in the design of higher education parks. This paper primarily examines the life cycle carbon emission calculation indicators within SRSs, encompassing: (1) classification of influencing indicators related to low-carbon design stages. For instance, optimizing carbon emissions during the life cycle stage impacts all stages, while the use of recyclable materials affects material production, maintenance replacement and recycling stages. Additionally, enhanced equipment commissioning affects the operational stage; (2) identification of SRS criteria pertaining to carbon emission calculation modules, followed by comparison and analysis of the indicator contents, including: score distribution for carbon emission indicators, scope of carbon emission calculation, tools and databases for calculation, benchmarking systems.

3. Results

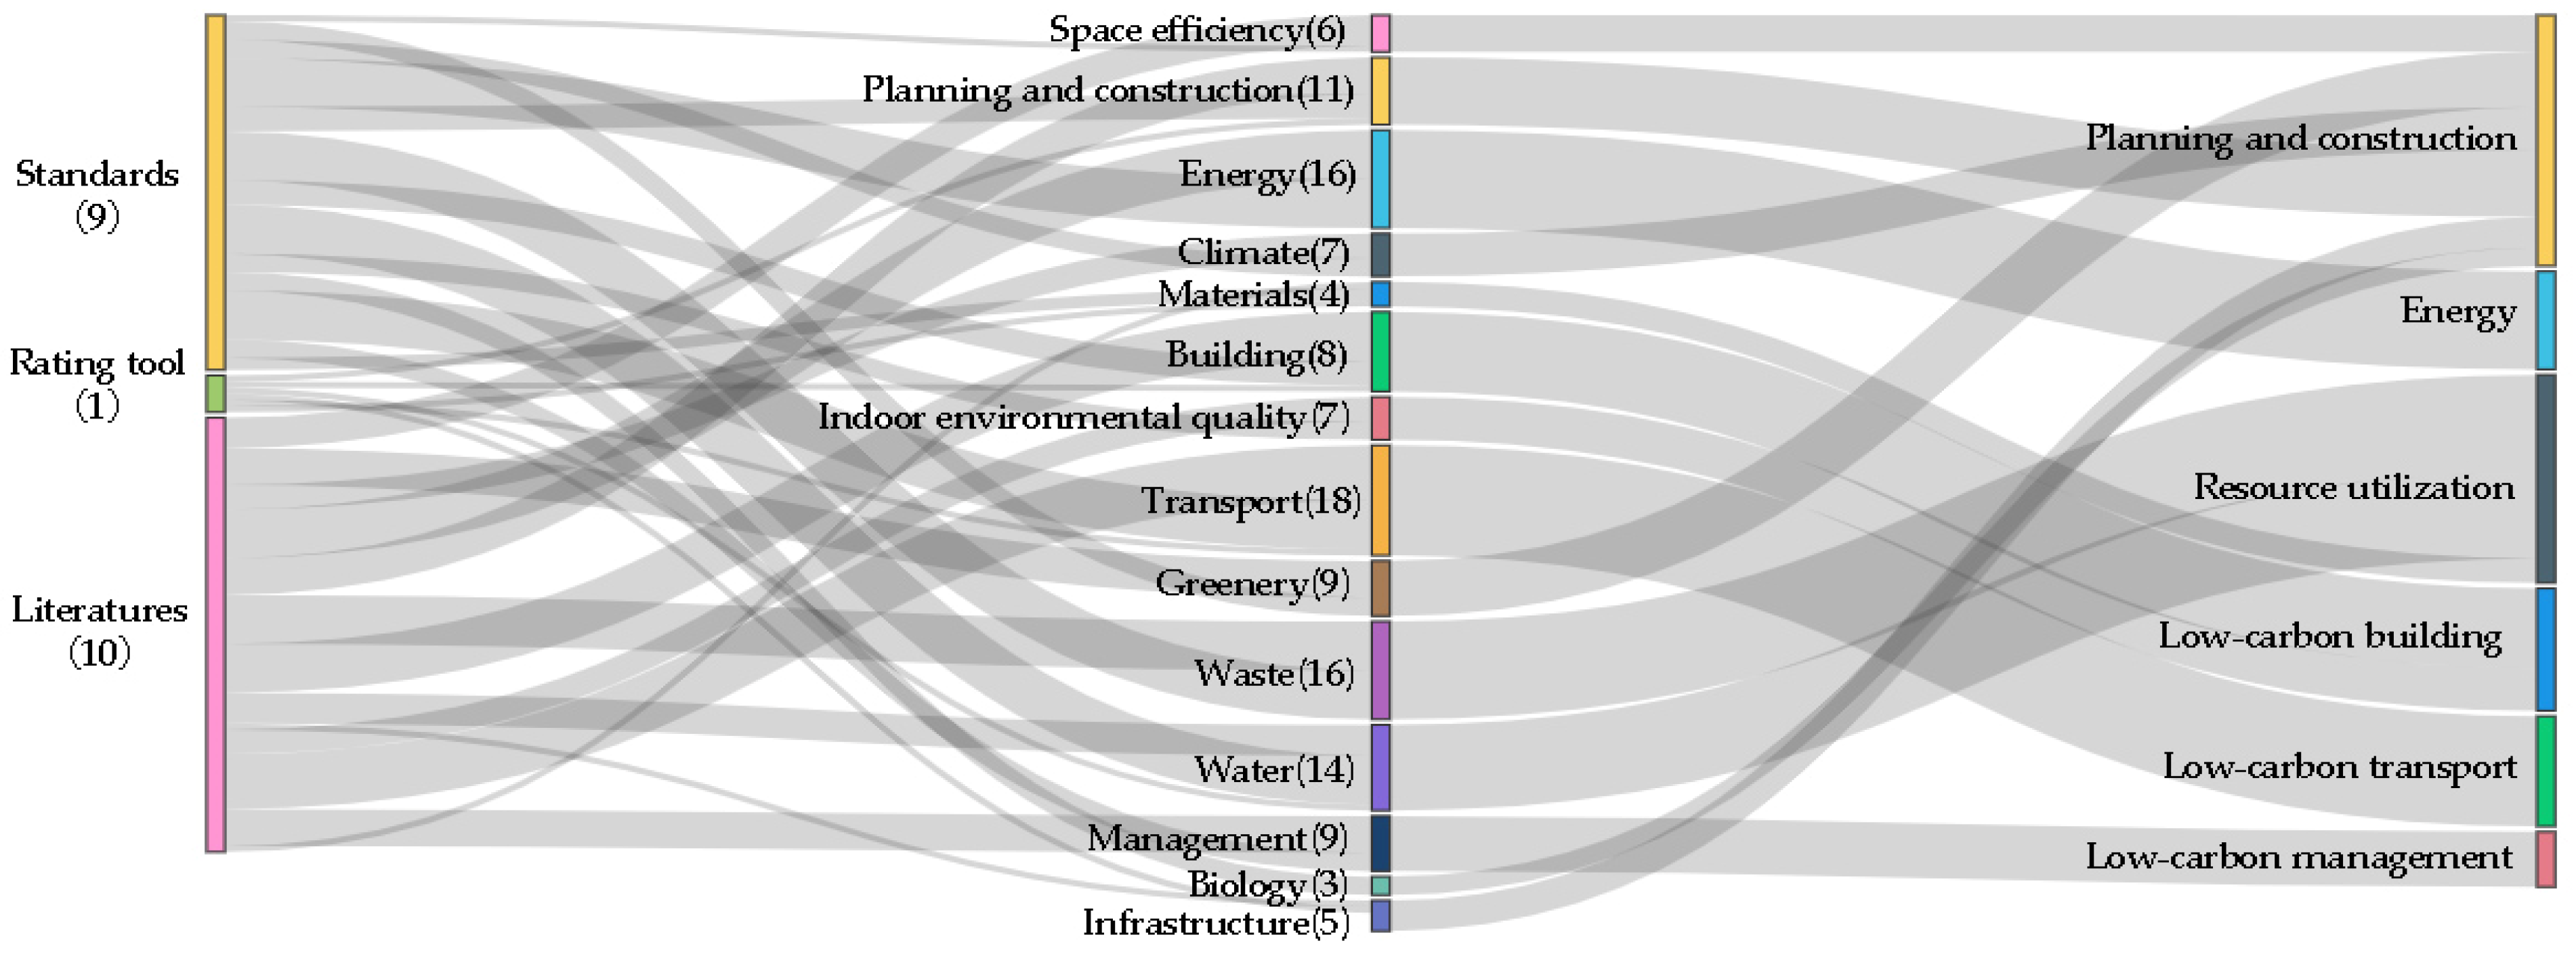
3.1. Dimension Determination of Low-Carbon Strategies

According to the method described in Figure 2, this paper selects a total of 20 papers, standards and evaluation tools that are closely related to the environmental performance of a campus, and through browsing, counting and filtering, there are 14 broad categories that are enumerated (Appendix C). Comprehensive assessments of green campuses extend to various domains, including development models, low-carbon education, health and safety, governance and participation. However, as these aspects are typically not within the purview of designers during the early stages of low-carbon design, they are not discussed in this paper.
By referring to the evaluation categories in the related low-carbon building and eco-city evaluation standards and categorizing and integrating the evaluation dimensions in the existing studies and standards, the results are presented in Figure 3. It can be seen that energy, building, waste and transportation are commonly addressed in most standards and can serve as specialized dimensions. However, infrastructure, biology, greening rate, etc. are not consistently mentioned in all studies. Therefore, these categories are consolidated and integrated into the planning and construction. Low-carbon transportation primarily focuses on travel methods within colleges and universities. Considering the vast expanse of higher education parks and the need to access various functional modules across different areas, transportation-related carbon emissions are a critical aspect deserving attention. Water, waste and materials represent valuable resources and are amalgamated into the dimension of resource utilization. At the micro design scale, indoor environmental quality is also merged into the low-carbon building dimension. While low-carbon management may not entail physical facility construction, it significantly influences energy regulation and efficiency during the operation stage, rendering it an essential technical approach for energy conservation and carbon reduction. In addition, carbon emission calculation serves as a quantitative representation of low-carbon design principles; hence, a dedicated dimension is allocated to it.
Through the screening and integration process described above, the main evaluation contents of low-carbon strategies in campuses are synthesized into the following seven dimensions: planning and construction, low-carbon transport, energy, low-carbon building, resource utilization, low-carbon management and carbon emission calculation.

3.2. Selection and Analysis of SRSs’ Indicators

3.2.1. Determination of Indicators Related to Carbon Emission Strategies

Based on the aforementioned seven dimensions, all indicators extracted from SRSs are reviewed. Design strategies mentioned in these indicators are summarized, refined and categorized into their respective dimensions (Figure 4). To facilitate future comparisons and supplementary research, these strategies have been coded (Appendix D), establishing a database of low-carbon design strategies for higher education parks derived from SRSs. Despite variations in organizational structures across different evaluation systems, the seven dimensions encompass nearly all design strategies mentioned in SRSs. This unified framework enables comparative research in subsequent steps.

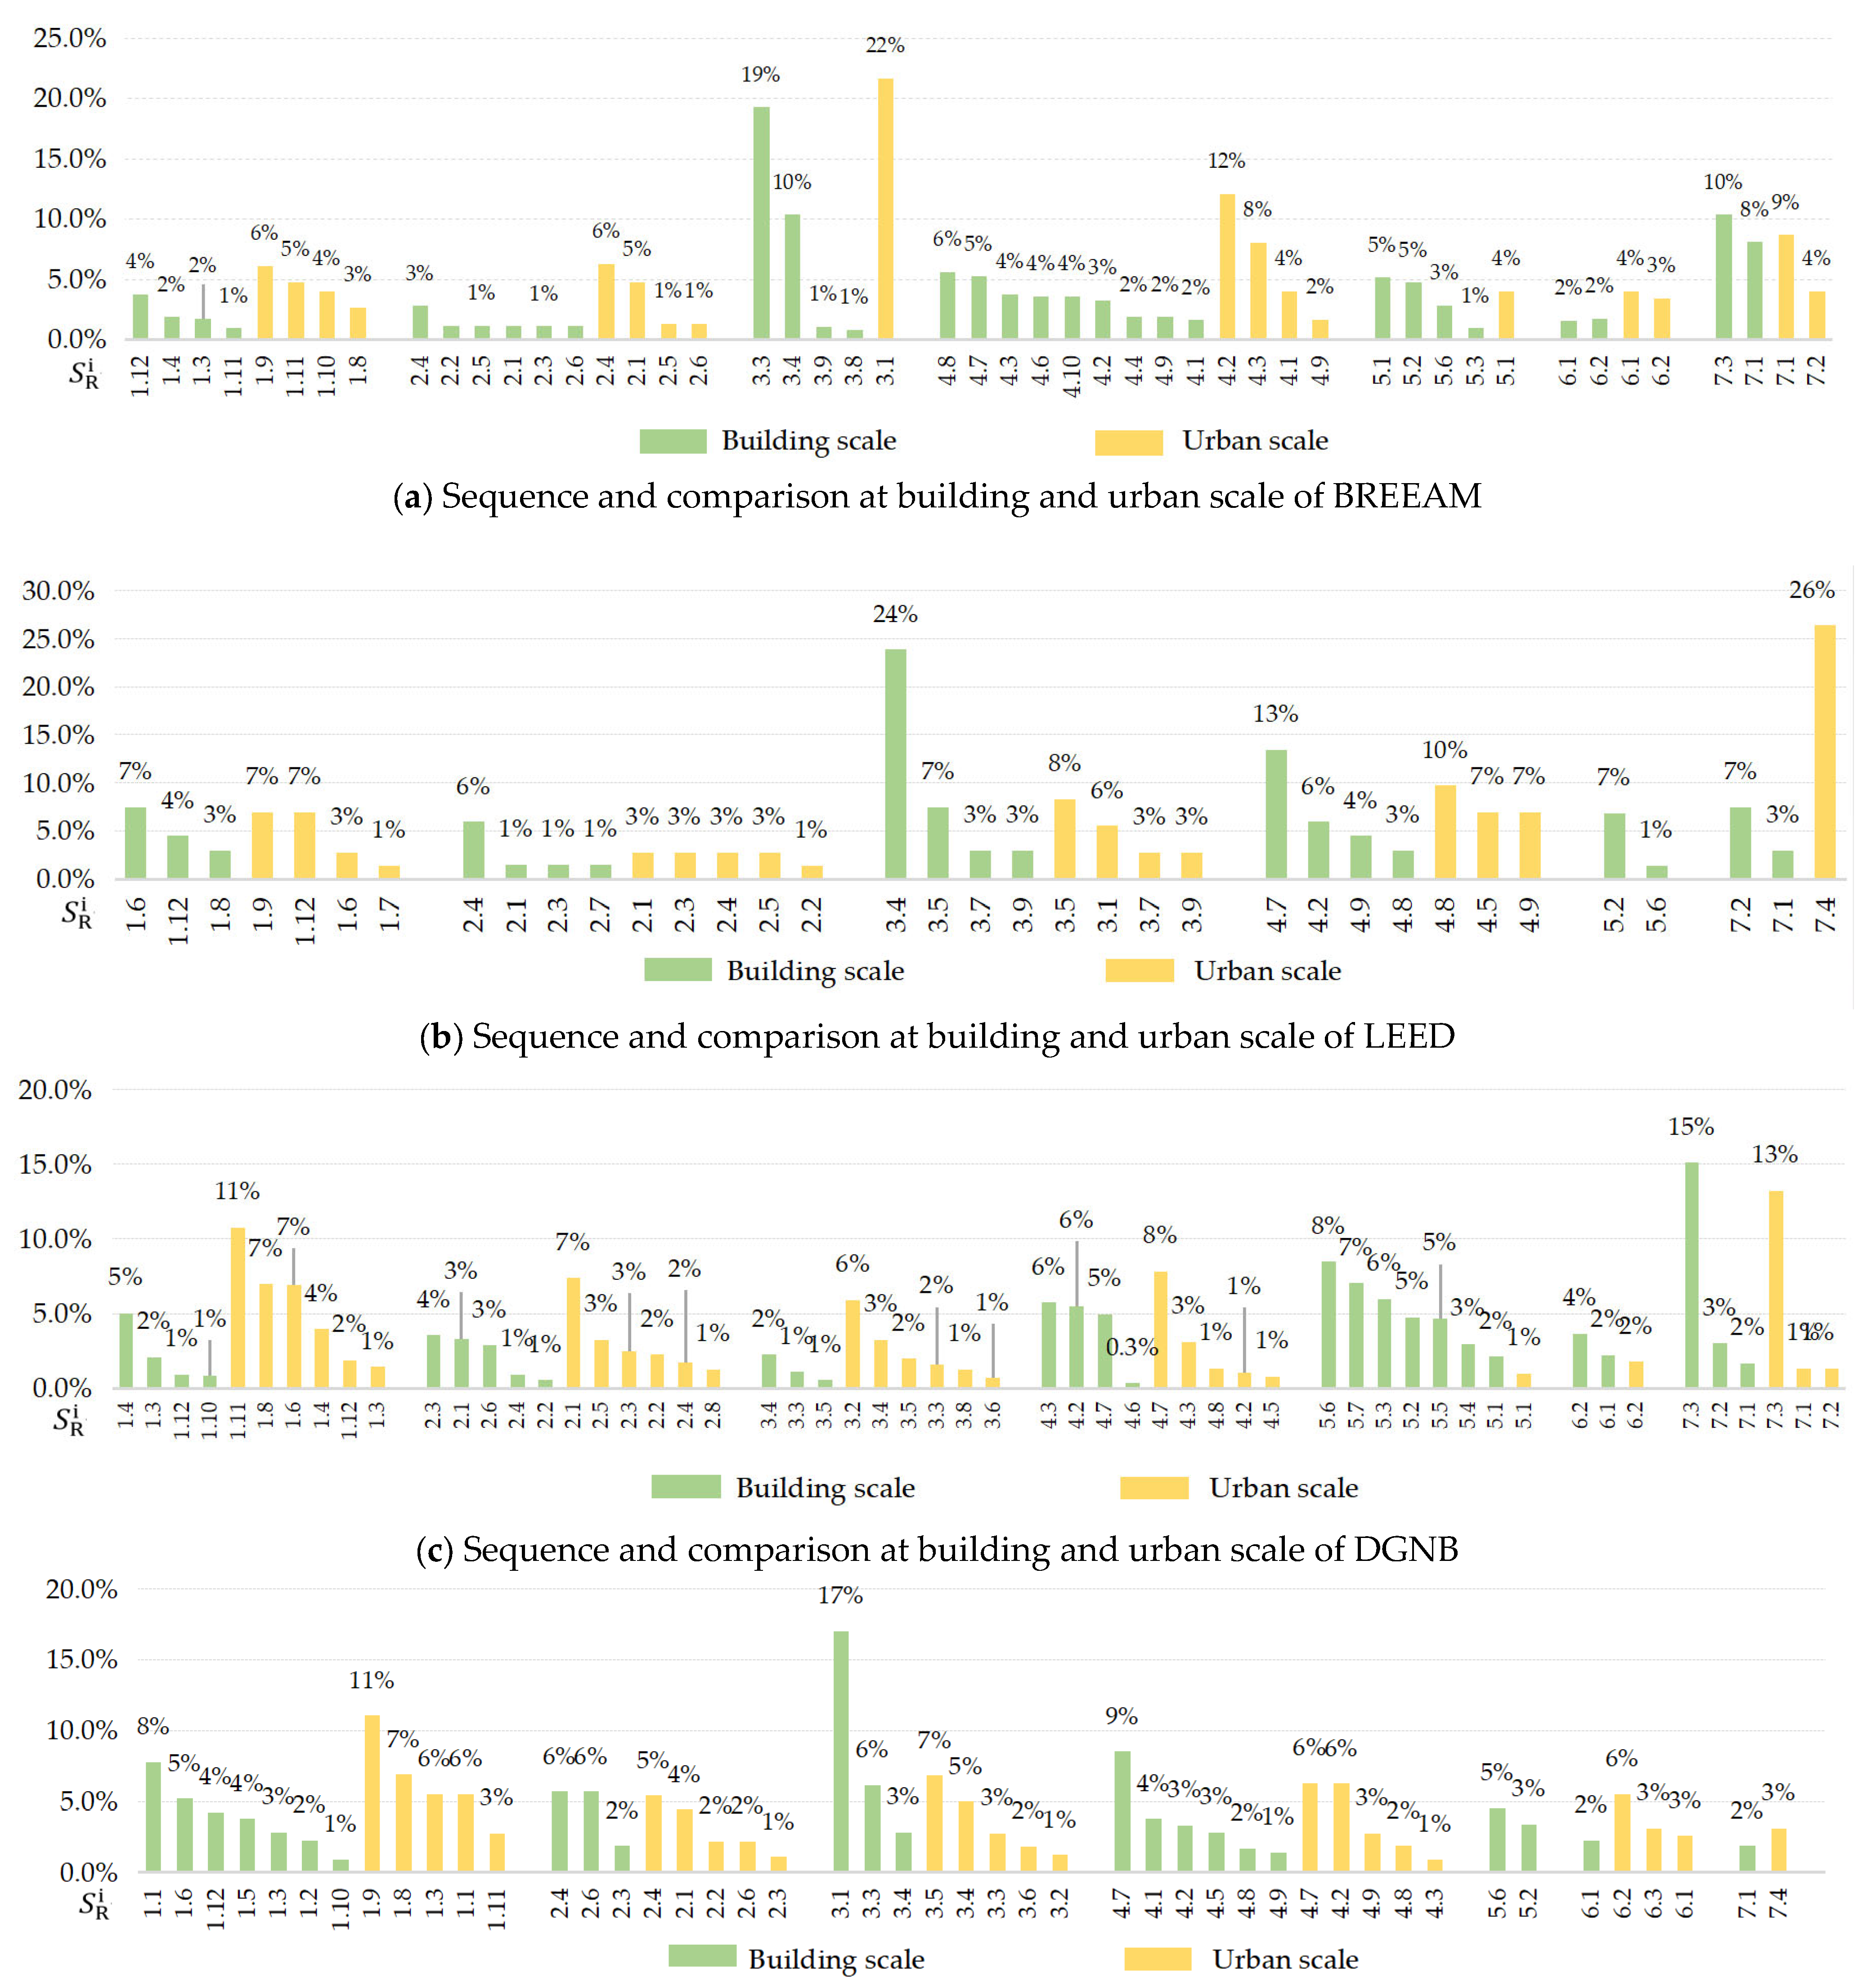
3.2.2. Comparative Analysis of Building and Urban Scale in SRSs

Through Equations (1)–(4), all strategies related to low carbon within the seven-dimension framework are extracted, and their respective score shares are displayed in Figure 5. This section also delineates the prerequisites and consistency between building-scale and city-scale strategies. Further analysis of the score shares ( S R i ) is conducted through Equation (5).

BREEAM

In the BREEAM system, all indicators are directly calculated by assigning weights to them. Thirteen indicators in B-E align with those in B-C, covering aspects across all seven dimensions (Table 1). Carbon-emission-related strategies have the highest total score share among all SBSs (Table 2).
The ranking of each dimension is shown in Figure 6a. B-C places greater emphasis on resources and energy, with scores notably concentrated in the Energy (Ene) 01 and Ene 06–Ene 10 categories. This is mainly due to the fulfillment of high requirements for energy-efficient design (3.1) and the improvement of equipment energy efficiency (3.3). In B-C, energy strategy in Resources and energy (RE) 01 is part of the interpolation system, which involves a variety of strategies within the energy dimension. Additionally, the calculation of carbon emissions (7) holds significant weight in both B-E and B-C. Overall, BREEAM-Edu accounts for 18.5% (comparable with carbon emission baseline values and life cycle performance assessment in the design stage) and 12.7% in B-C. In the resource utilization, low-carbon recyclable materials utilization (4.2) and material recycling (4.3) are significantly represented.
Figure 5. Low-carbon Strategy score share ( S S S R S i ) in SRSs. B-E: BREEAM Education; B-C: BREEAM Community; L-S: LEED for School; L-C: LEED Cities and Communities; D-E: DGNB Education; E-U: DGNB Urban District Set; ASGC: Assessment Standard of Green Campus; ASGED: Assessment Standard of Green Eco-District; Buildings 14 01846 i001 Prerequisites; Buildings 14 01846 i002 consistent strategies in building and urban scale.
Buildings 14 01846 g005

LEED

In L-S and L-C, indicators in Planning and construction (1), Transport (2), Energy (3) and Resource utilization (4) are closely linked, with 35.5% (Table 1) in L-S total credit. L-C also focuses on per capita greenhouse gas emissions (7.4), which complements L-S’s carbon-emission-related indicators. In addition, the prerequisites in both of them mention strategies for low-carbon construction (1.3).
As depicted in Figure 6b, enhancement of energy efficiency (3.4) in L-S commands the highest S R i at 23.9%. The Energy and Atmosphere (EA) category focuses on enhancement of energy efficiency (3.4), which serves as a rating indicator synthesizing the level of energy savings during the operation stage. This indicator employs an interpolated point method for baseline value comparison, requiring minimum energy savings of 42% in school buildings to achieve the highest score. S R i is lower at the building scale because more metrics focus on indoor air quality in L-S. In contrast, in L-C, the Quality of Life (QL) category addresses community safety and economic performance, which do not contribute to the low-carbon design strategy score share. Among the individual units, Sustainable Sites (SS)—Joint Use of Facilities and SS—Site Master Plan are specific to schools, with the score of 2% in total excluded in low-carbon-related strategies.
The highest S R i in L-C is the per capita GHG emissions rating (7.4) provided by the issue energy and greenhouse gas emissions management in the Energy and greenhouse gas emissions (EN) category. Additionally, L-C emphasizes waste management (4.8), renewable energy use (3.5) and rainwater recycling. It is important to note that in L-S S R i shows none at the building scale, without strategies directly related to carbon emissions, because more issues focus on indoor air quality.
Table 1. Score share ( S S S R S i ) of consistent strategies in SRSs of building and urban scale.
BREEAMLEEDDGNBASGC/ESGED
Total score share ( S S S R S i ) of consistent strategiesBuilding scale23.8%35.5%26.8%23.0%
Urban scale33.2%35.5%21.1%22.1%
Strategies involved at building scale1.11
2.1, 2.4, 2.5, 2.6
3.2, 3.3
4.1, 4.2, 4.3, 4.9
5.1
6.1, 6.2, 7.1
1.3, 1.6, 1.8,1.11, 1.12
2.1, 2.3, 2.4
3.5, 3.7, 3.9
4.7, 4.8, 4.9
1.3, 1.4, 1.12
2.1, 2.2, 2.3, 2.4
3.3, 3.4
4.2, 4.3, 4.7
5.1
6.2
7.1, 7.2, 7.3
1.1, 1.3
2.3, 2.4, 2.6
3.3, 3.4
4.2, 4.7, 4.8, 4.9
6.1

DGNB

In the D-E manual, DGNB indicates whether the same criteria appear in D-U, highlighting the relation of these indicators between buildings and urban design. In D-E, the significant weight assigned to achieving the building carbon target (1.4) more closely links the different dimensions of cities and buildings.
As shown in Figure 6c, unlike other evaluation systems, DGNB’s emphasis on energy strategies is not prominent. This is because the life cycle carbon emissions calculation (7.3) in the Environmental quality (ENV) category reflects the building’s overall energy efficiency. Among identical provisions, in the ENV category, life cycle carbon emission calculation (7.3) holds a significant advantage (15.1% in D-E, 13.2% in D-U), with each addressing life cycle performance calculation of buildings from different perspectives. In D-E, in addition to calculating the life cycle performance of the building, more attention is paid to the optimization of the indoor thermal environment (5.6) and the spatial efficiency of the building (5.7), which can effectively reduce carbon emissions in terms of energy consumption and materials. The emphasis on material recycling (4.3) and the use of low-carbon, recyclable materials (4.2) can more directly reduce carbon emissions.
At the urban level, DGNB also prioritizes bike-ability (2.1) and efficient utilization of water resources (4.3). Similarly to BREEAM, although there are few low-carbon strategies for buildings at the city level, they all focus on the impact of passive design (5.1) within them. Besides life cycle performance calculation of buildings, greater attention is paid to indoor environmental optimization (5.3) and material utilization (4.2, 4.3). Conversely, D-U places more emphasis on bike-ability (2.1) and water resource utilization (4.3). The evaluation characteristics of D-U focus on infrastructure and public spaces, in addition to prioritizing social equity and harmony, as well as the development of industrialization and informatization. These criteria are not categorized within the scope of low-carbon strategies discussed in this paper but still occupy a portion of the overall assessment. Consequently, the total S S R i is relatively lower (Table 2).
Table 2. Total Score share ( S S R i ) for low-carbon-design-related strategies in SRSs.
Building ScaleUrban Scale
Share of scores related to low-carbon strategies in overall evaluation
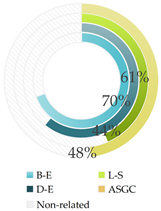
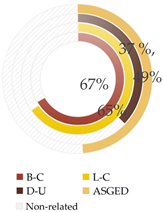
Buildings 14 01846 i003Buildings 14 01846 i004

ASGC and ASGED

The consistency share in ASGC is essentially the same as in BREEAM and DGNB (Table 1). The share (Table 2) of low-carbon strategies is significantly lower than in BREEAM and LEED, because ASGC primarily targets green campuses in China, encompassing evaluation dimensions beyond sustainable building practices. These include aspects such as education and promotion, campus safety and operation mechanism, which collectively contribute to 28% of the total score.
Notably, the indicators with the largest share of the score include the fulfillment of high requirements for energy-efficient design (3.1). Similar to B-E and L-S, energy has the highest weight (Figure 6d). Additionally, the efficient use of water resources (4.7), greenery (1.1), public transportation accessibility (2.4) and indoor comfort (5.6) receive significant attention. In ASGED, a dedicated category (Chapter 6: Green Building) is established to regulate the proportion of certification for green building design, operation and renovation (1.9). This closely links the city to the Green Building Evaluation Standard (GB/T 50378-2019) [46], ensuring that the overall carbon reduction rate of the urban area meets the required standard. In the carbon emissions calculation section, ASGED specifically emphasizes carbon emission indicators: 7.2.14 includes the carbon emissions per unit of GDP, per capita carbon emissions and carbon emissions per unit area. These three indicators are required to meet the carbon reduction targets for the locality and the urban area.
Figure 6. Sequence and comparison of S R i at building and urban scale of four SBSs.
Buildings 14 01846 g006
A rose diagram of the strategy ratio aggregated data across the seven dimensions shows (Figure 7) that Energy (3) and Low-carbon building (5) strategies are more prominently represented at the building level. B-E emphasizes Resource utilization (4) and D-E emphasizes Planning and construction (1) of their carbon reduction efforts as well. In DGNB, as most of the operation energy evaluations are put into the ENV1.1 Environmental quality category, the corresponding scores are lower than others. At the urban scale, Planning and construction (1) and Resource utilization (4) obtained more attention. D-N and L-C exhibit particularly outstanding performance in these regards.

3.3. Strategy Analysis in SRSs Regarding Life Cycle Assessment

According to the SRSs, different indicators impact various stages in the life cycle, necessitating comprehensive consideration for low-carbon design. Illustrated in Figure 8 and Table 3, operational energy receive the highest attention across all SRSs, particularly emphasized by BREEAM, constituting 43.6% of the total. This is closely followed by the material production stage. Both DGNB and BREEAM outline clear and detailed requirements for material life cycle performance based on comprehensive LCA databases for buildings. Meanwhile, LEED and ASGC mandate low-carbon construction (1.3), material recycling (4.3) and low-carbon material selection (4.2) in their prerequisites, which do not contribute to scoring, resulting in a relatively lower proportion. The impact of construction stage strategies is notable in BREEAM and DGNB, accounting for 14.3% and 19.5%, respectively. Additionally, the ratio in water use, demolition and disposal and recycling stages aligns closely with the material production stage across all SRSs, emphasizing the reuse of building materials.
DGNB’s emphasis on comprehensive assessment of the building life cycle results in a higher ratio of life cycle performance calculation and optimization, encompassing all stages within the ENV category. In D-U, although implicit carbon emissions are not explicitly detailed, they are included in the life cycle calculation and still require optimization. ASGC exhibits a smaller impact on each stage in terms of environmental impact compared to other SRSs, with 28% of indicators unrelated to carbon emissions. Nevertheless, the relationship between each stage can still be observed from the proportion of indicators associated with each stage. In China, while the share of relevant strategies is not significantly lower than in other regions, there is no mandatory requirement for LCCE. ASGC’s 6.2.11 and ASGED’s 7.2.14 mandate calculations for operational carbon emissions.

3.4. Carbon Emission Calculation Methods

Life cycle carbon emission calculations are required in certain SRSs discussed in this article. Despite the limited number of criteria related to benchmarks in these calculations, they hold a significant score ratio (Table 4) in total score, emphasizing their importance in addressing carbon emissions within the SRS framework.
Among SRSs at the urban scale, only D-U explicitly mentions LCA calculations. B-C addresses zero-carbon and carbon-negative measures during the operational stage, as well as carbon emissions from transport and the selection of recyclable and low-carbon materials. However, it does not mandate the calculation of specific embodied carbon emissions. LEED separates embodied carbon emissions from operational energy into distinct indicators. In contrast, DGNB integrates embodied and operational carbon emissions into a single indicator, with detailed procedures outlined in its first category, underscoring the overall significance of building life cycle assessment. Additionally, DGNB offers four levels of baseline values at the district level for user reference. ASGED focuses on carbon emissions during the operational stage, with indicators such as carbon emission intensity of urban GDP, per capita carbon emissions, and carbon emissions per unit of territorial area in urban regions. Nevertheless, it does not provide quantitative evaluation indices for embodied carbon emissions.
In the implementation design stages of life cycle assessment, BREEAM and DGNB stress the importance of integrating life cycle assessment into design at an early phase. LEED recommends initiating the benchmark building creation during the initial design stage. ASGC suggests conducting pre-evaluations for campuses during the planning and design phase. It is evident that early integration of life cycle carbon emissions calculation into the design process is crucial. Researchers are actively advocating for the early adoption of LCA methods in design [47,48,49]. The early design stage offers greater flexibility to implement design changes, thereby more easily optimizing the life cycle performance of design. To improve the local adaptability of life cycle results, the development and utilization of corresponding local evaluation tools and databases are essential. These resources provide fundamental support for the calculation and optimization of life cycle carbon emissions (Table 5).
In SRSs, internal benchmarks and external benchmarks are the two commonly used approaches for the LCA benchmarking process [50]. SRSs utilizing external benchmarks leverage predefined threshold values from existing buildings to enhance their own performance. Examples include BREEAM, which assesses material embodied carbon emissions, and DGNB. In BREEAM, environmental performance assessment of building materials relies on average Ecopoint values from certified building statistics. DGNB’s baseline data span various life cycle stages and encompass six environmental impact indicators, with global warming potential (GWP) accounting for the largest share (40%) of the total indicator weight. It provides baseline, reference and target values, as well as exceeding target values for major environmental impact categories.
Internal benchmarking processes are employed in LEED, ASGA and BREEAM’s assessment of carbon emissions from operational energy consumption. These systems conduct benchmarking within their own frameworks, establishing benchmarks by analyzing data obtained from reference buildings with similar geometrical and contextual features, as well as conventional construction characteristics. This internal benchmarking method focuses on optimizing design, comparing and refining schemes against established standards. However, the baseline building is not universal and pertains to a virtual structure.

4. Discussion

4.1. Summary and Analysis of Strategies

4.1.1. Prerequisites and Frequency of Strategies

The section conducts a more in-depth discussion of the results outlined in Section 3, encompassing an analysis of prerequisites, an examination of consistency across the two scales and an assessment of the frequency of strategy occurrence.
In SRSs, prerequisite conditions serve as mandatory requirements for building certification attainment. While these conditions do not directly contribute to credit accumulation, they represent essential factors to be addressed in the design stage. LEED, ASGA and ASGED delineate clear prerequisite indicators, emphasizing criteria essential for certification. At the urban level, prerequisite conditions often align with overarching carbon emission targets for entire city districts and tailored guidelines (Table 6). Within BREEAM and DGNB, prerequisite conditions also factor into scoring assessments, with specific score thresholds required for each rating level. Common prerequisites typically encompass ecological analysis (1.11), energy-efficient equipment enhancements (3.3), efficient water resource utilization (4.6), improved heat transfer performance of building envelopes (5.5) and life cycle performance assessment during the design stage (7.1).
Based on the results (Figure 9), the comparison of indicators between building and urban scales reveals higher consistency in strategies related to Energy (3) and Resource utilization (4). Conversely, Low-carbon building (5), Management (6) and Planning (1), along with dimension Low-carbon transport (2), show potential for mutual complementarity. This underscores the potential effectiveness of integrating strategies across multiple dimensions to enhance sustainability goals.

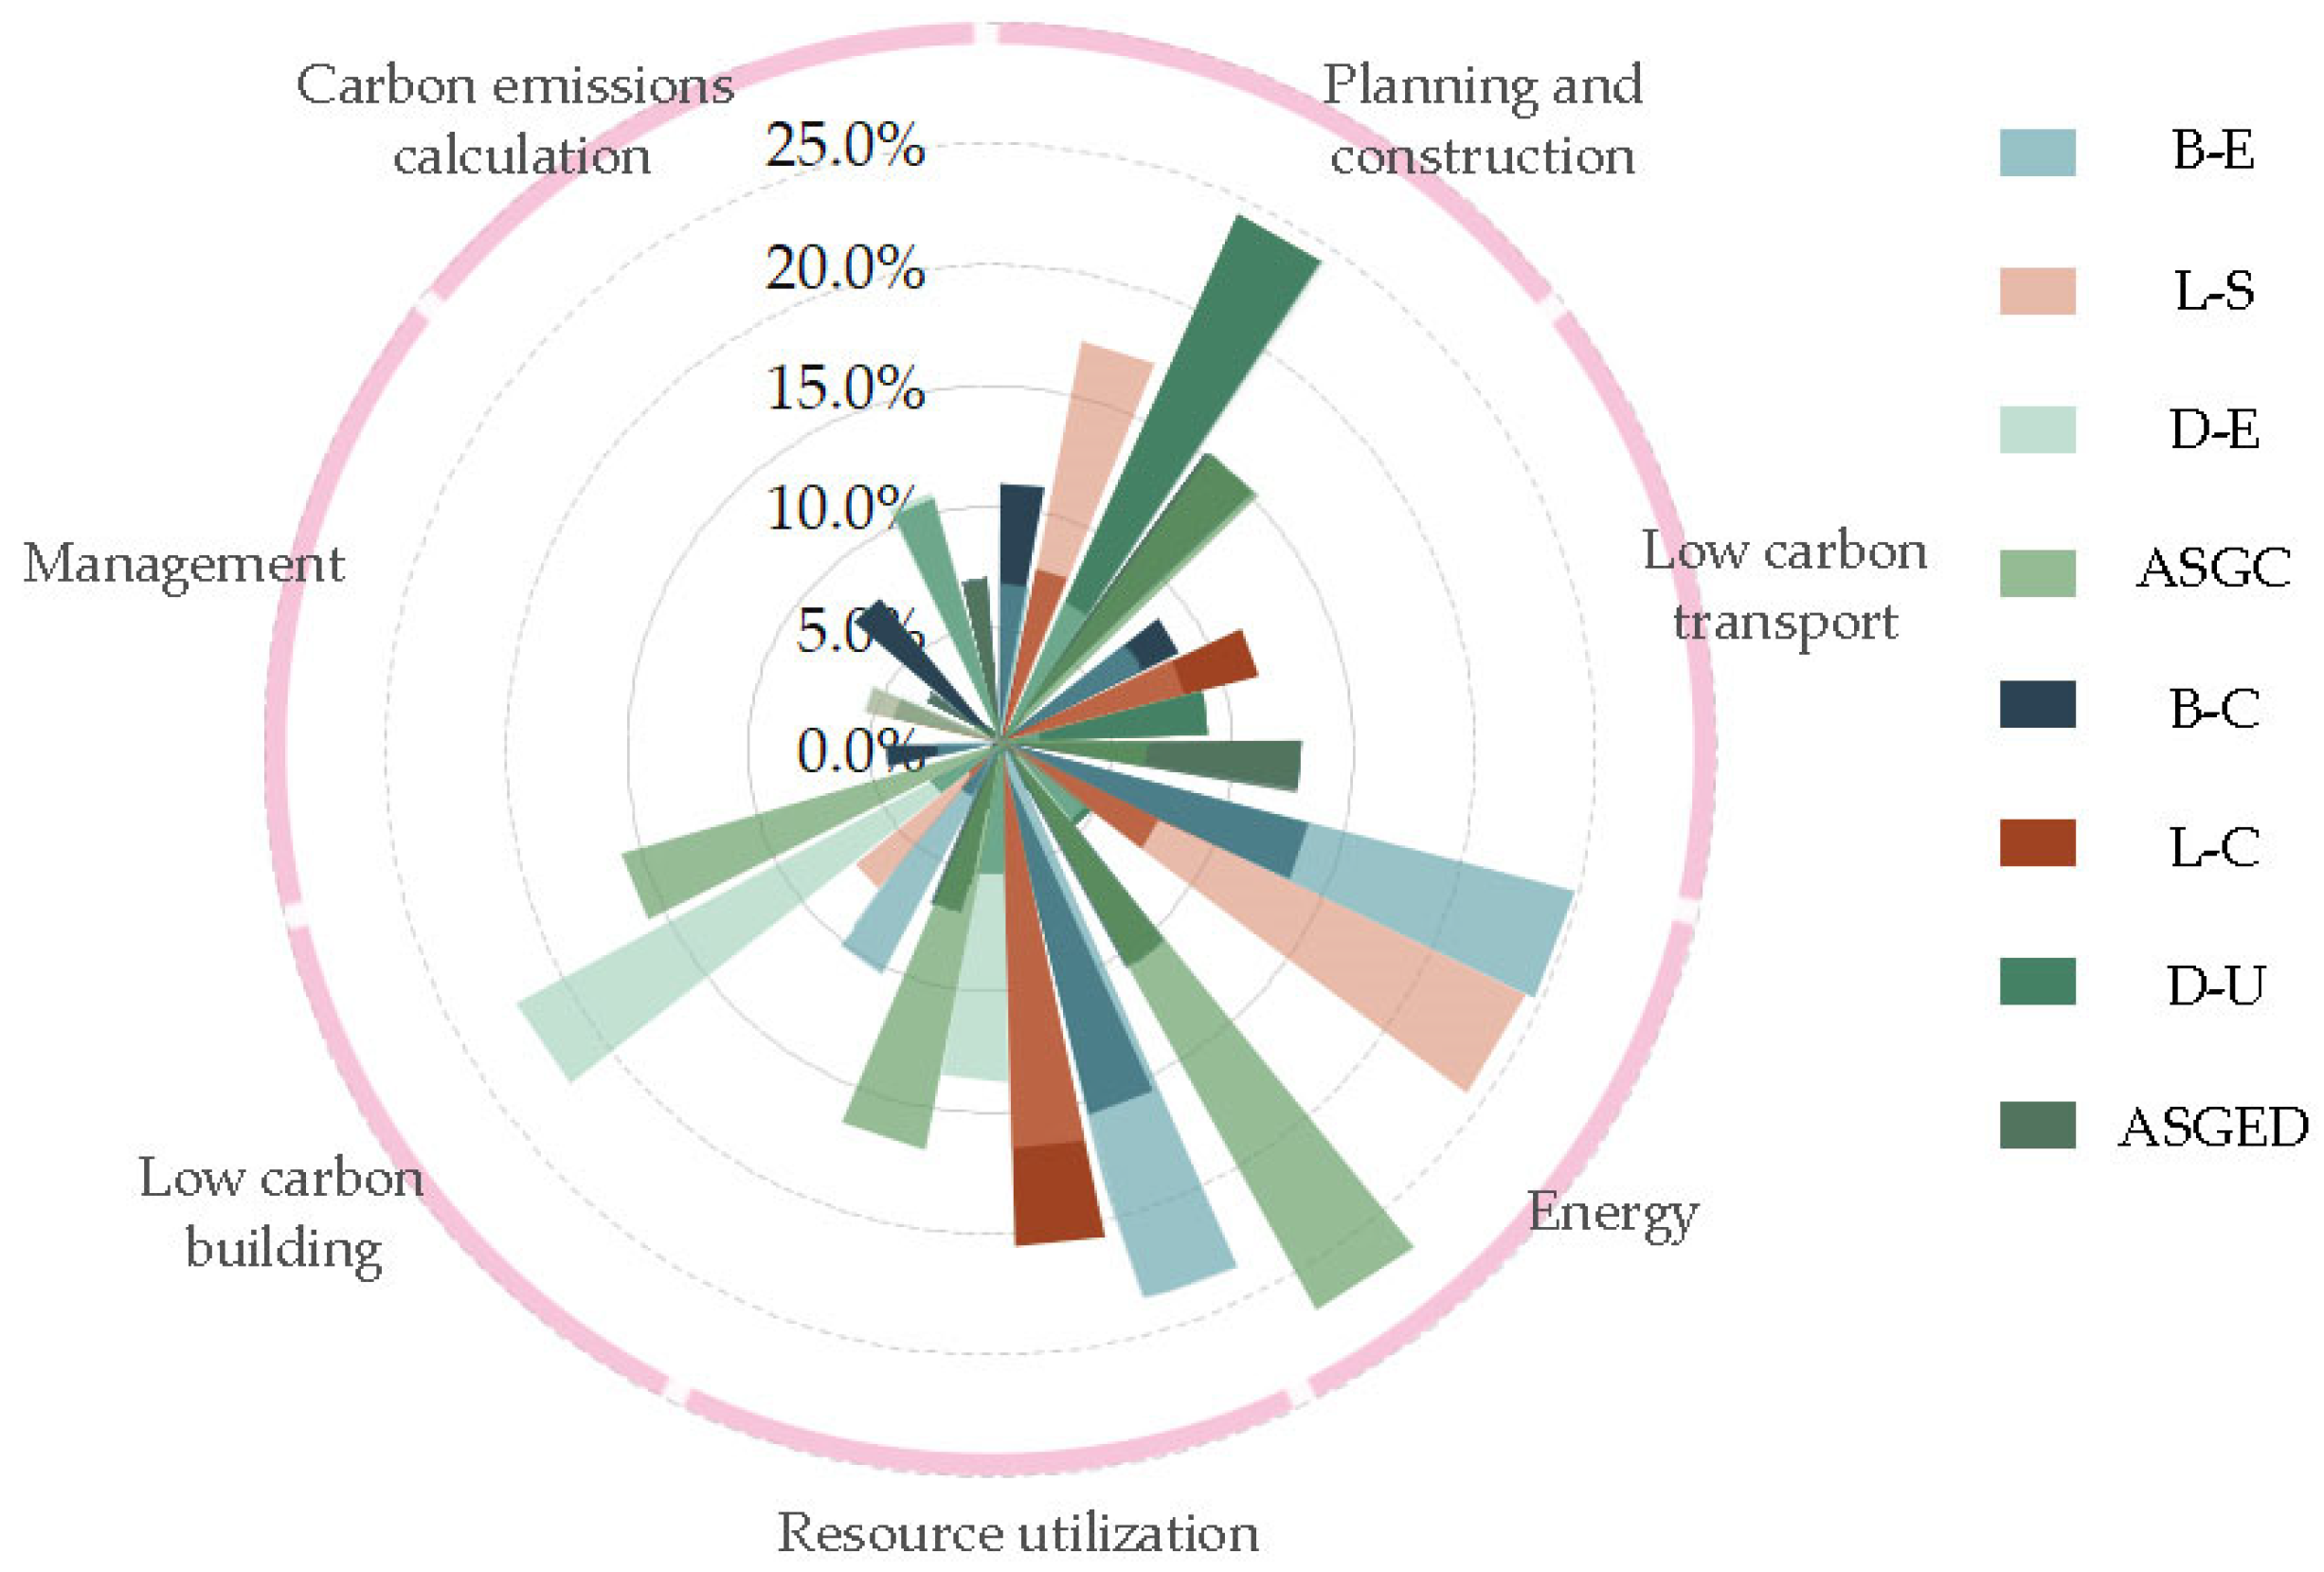
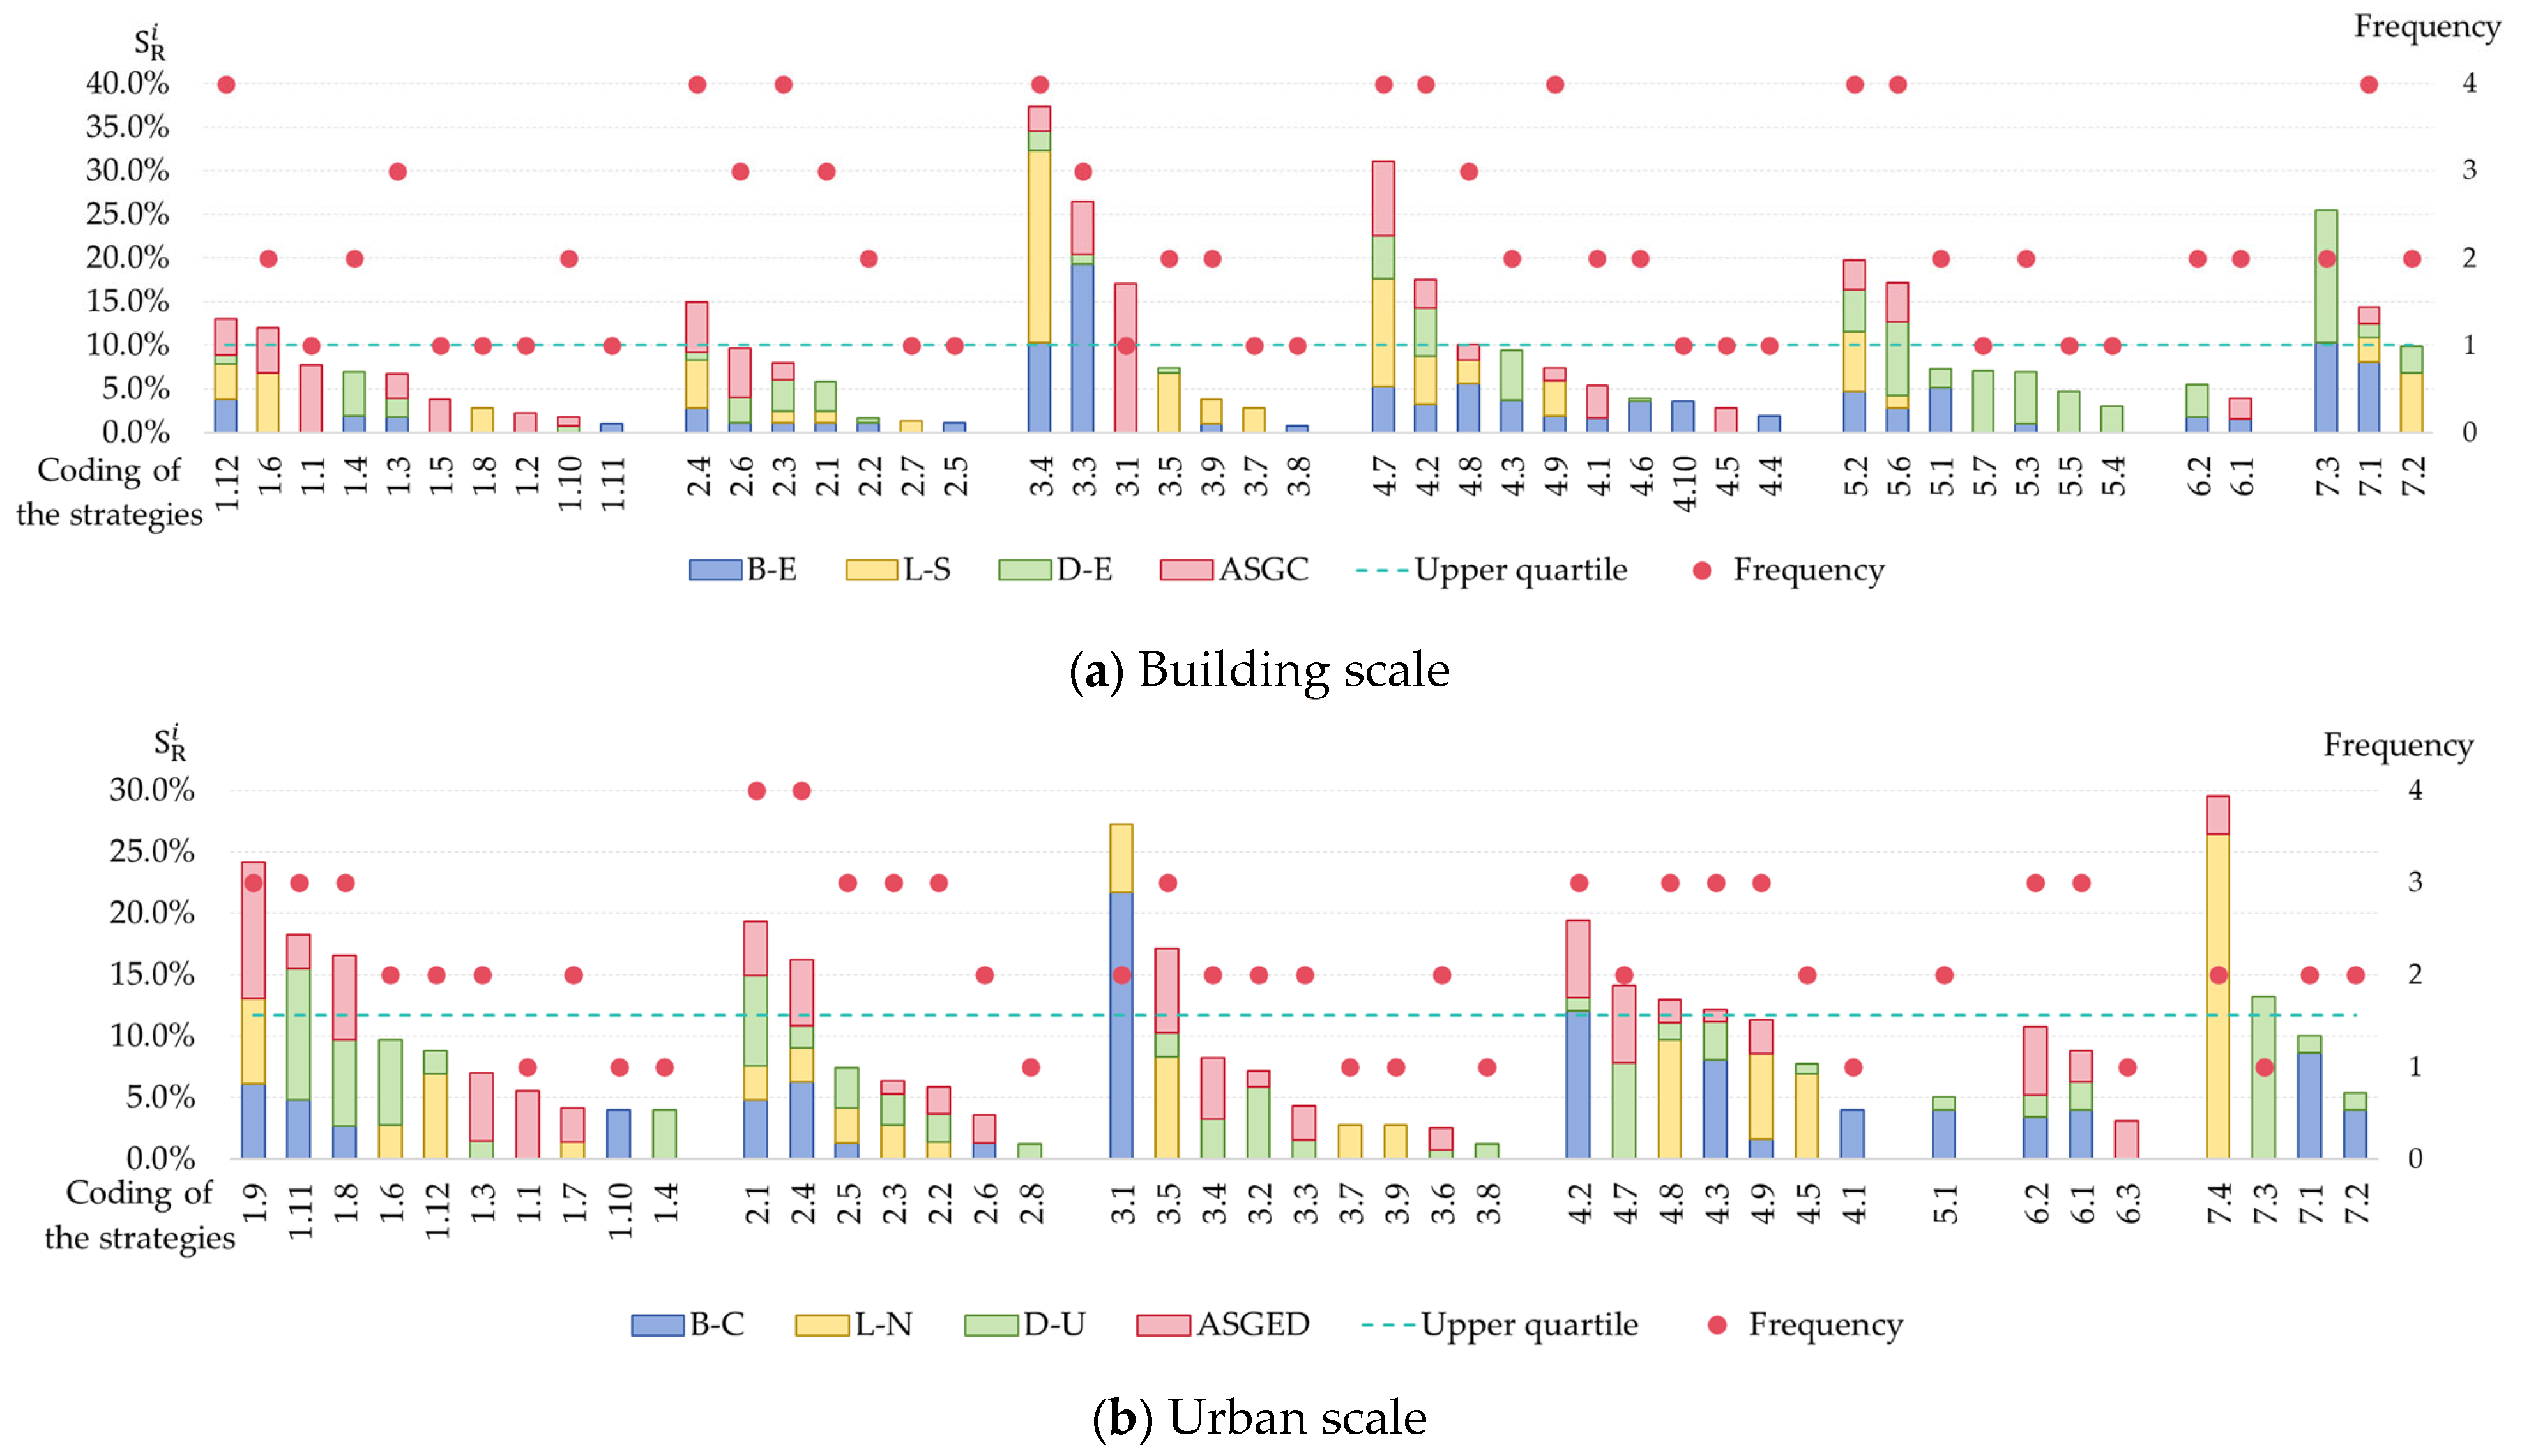
4.1.2. Comprehensive Analysis of Strategies in 7 Dimensions

To further identify the optionality of strategies in design, the score shares ( S R i ) of the same strategies involved in the four SRSs are summed up to comprehensively determine their level of attention. Figure 10 illustrates the summed S R i results for all low-carbon strategies.
In the dimension of Planning and construction (1) at the building level, ecological protection measures (1.12) account for the highest cumulative proportion, mentioned in all four systems, followed by building density and layout (1.6). These two strategies are equally deserving of preference when considering the combined benefits of the building. Among the top strategies, achieving the carbon emission targets (1.4), greening rate (1.1) and low-carbon construction (1.3) have a more direct impact on carbon emissions. Although ecological analysis (1.11) is not given much consideration at the building scale, it ranks first at the urban scale, providing a basis for the “top-level design” of carbon emission targets for the whole campus. The green building compliance rate (1.9) is mentioned in all three systems and receives high attention, suggesting that buildings, as the main source of carbon emissions in the park, need fundamental control. It is worth mentioning that a reasonable greening rate (1.1) design is an important source of carbon sinks, balancing carbon emissions from automobiles during the operational phase and creating a humanistic environment in the higher education park. Additionally, for buildings with special functions such as experimental buildings, attention should be paid to their layout (1.6) and automobile carbon emission reduction design in the park.
In Low-carbon transportation (2), the number of high-frequency strategies is relatively high. Integrating building and urban scales, strategies mentioned more than five times account for 62.5% of the eight low-carbon strategies listed. Bike-ability (2.1) and accessibility of public transport (2.4) are mentioned in all SRSs, with the latter being the building-level strategy that receives the most attention. As technology matures, the charging of electric vehicle devices (2.3) could receive more attention in the operation stage as part of the photovoltaic, energy storage, direct current and flexibility (PEDF) strategy.
As the core of emission reduction efforts, the total score share in the Energy (3) dimension significantly higher than for other dimensions at both the building and city levels, particularly in meeting energy-efficient design (3.1) and improving energy utilization (3.4), highlighting the importance of energy efficiency in low-carbon design. Additionally, the total value of renewable energy utilization (3.5) should not be overlooked, although most of it is contributed by LEED. The score is not prominent due to some technical difficulties in grid harmonization (3.7), but the overall energy regulation’s ability to reduce carbon in large-scale parks should be emphasized, and some real projects have shown that a corresponding overall regulation strategy can achieve significant carbon reduction [51].
In the Resource utilization (4) dimension, the main focus is on water and building material utilization. Low-carbon, recyclable materials (4.2, 4.3) and water utilization methods (4.7, 4.9) are of great interest in both urban and building dimensions due to their impact on carbon emissions reduction and their significance in resources, economic cost savings, campus ecosystems, spatial environments and environmentally friendly behavior education. Waste management strategies (4.8) also received attention, as did enhanced refrigerant management (4.6) and control of NOx emissions (4.10), which, although not scoring well, directly impact carbon emissions and should be considered for compliance.
The focus of design at the micro level is on Low-carbon buildings (5). Indoor light environment optimization (5.2) and indoor thermal comfort optimization (5.6) are scored on the fact that the quality of the indoor environment is the most basic need for the use of the building. Building on this, the use of passive measures (5.1) is mentioned at both city and building levels and is given a high score by DGNB and BREEAM, with a clear effect on reducing building energy consumption and carbon emissions [3,52]. The thermal insulation of the building envelope (5.5), which is linked to it, is not prominent in the scores but includes the significance of the building envelope in connecting operational carbon emissions and embodied carbon emissions.
At the urban level, low-carbon management (6) plays a crucial role. Utilizing an intelligent platform to control the entire park is an inevitable result of the big data era. ASGED emphasizes setting carbon emission targets (6.2) and establishing a carbon reduction management mechanism (6.3) to guide top-level design. Considering the direct reflection of operational results in the energy aspect and the maturity of technology and cost factors, its score share is not emphasized too much.
Figure 10 displays both the total score and the frequency for each strategy. Strategies with occurrences equal to or greater than three times are considered high frequency, while those above the 3/4 quartile line are deemed to have a high score share. Among all the S R i strategies, enhancement of energy efficiency (3.4), wastewater recycling and reuse (4.7) and low-carbon, recyclable materials utilization (4.2) exhibit both high scores and frequencies. Others, such as those comparison with carbon emission baseline values (7.3) and energy efficiency of equipment improvement (3.3) in BREEAM and control of greenhouse gas emissions per capita (7.4) in LEED, demonstrate an absolute advantage in certain SRSs but are not universally emphasized across all systems. Despite variations in how different systems measure carbon emissions, they share a common goal. Learning from each other’s evaluation methods can provide insights into design strategies and indicators crucial for international sustainable certification in Chinese higher education park design. Additionally, certain strategies, notably those related to transportation, such as bike-ability (2.1), walk-ability (2.2), charging electric vehicle devices (2.3) and accessibility of public transport (2.4), appear frequently but do not score prominently, underscoring their importance in low-carbon design.
As SRSs are developed by different countries with specific geographical characteristics, low frequencies and low share score strategies complement each other and offer solutions for more detailed low-carbon design. Strategies such as renewable energy utilization (3.5), clean energy utilization (3.6), rainwater harvesting and utilization (4.9) and enhancement of the heat transfer performance of the building (5.5) have become increasingly essential in designing low-carbon parks due to advancements in energy-saving technology. Moreover, strategies like heat island effect reduction (1.2), resilience planning (1.5), rational road network design (1.7), material durability improvement (4.1), indoor wind environment optimization (5.3) and building space efficiency (5.7) not only impact carbon emissions but also address comfort, aesthetics and the economic benefits of space utilization.

4.2. Recommendations for Enhancing the Application of LCCE Method in the Chinese Context

The life cycle assessment method is an effective method for improving building environmental performance. The significance of life cycle carbon emissions calculation is underscored by the high scores attained in dimension 7. However, its significance extends beyond obtaining scores in assessment systems to establishing digital connections between buildings and their surrounding environment. This facilitates optimizing overall building performance and enhancing comprehensive building efficiency. Both BREEAM and DGNB underscore the early involvement of life cycle assessment in building design, emphasizing its impact on design outcomes and designers’ understanding of building life cycles. Moreover, the effectiveness of LCCE calculations in design relies on comprehensive databases, user-friendly tools and benchmarking processes. LCCE calculation tools and databases in China are gradually improving, while benchmarks in LCCE require refinement and systematization to assist in effective design.
In light of China’s carbon peaking and carbon neutrality goals, researchers have been exploring emission reduction pathways and benchmark setting methods for school buildings [53]. The introduction of guidelines such as the Guidelines for Accounting for Carbon Emissions on Higher Education Campuses (T/CABEE 053-2023) [10] provides a foundation for further LCCE calculations and methodology refinement.
Quantifying the implementation of emission reduction strategies requires both national top-down policy guidance and bottom-up data support from colleges and universities. At the national and regional levels, external benchmark values defined in regulations such as the General Code for Energy Efficiency and Renewable Energy Application in Buildings (GB 55015-2021) [54] and forthcoming standards like the Technical Standard for Zero-Carbon Buildings (GB/T xxxxx–202x) [55] can be refined for different functional buildings in higher education parks. To establish a comprehensive benchmarking system, relevant sectors are advised to:
(1)
accelerate the development of local LCCE databases tailored for universities and develop unified life cycle tools to facilitate LCCE calculations;
(2)
establish optimization guidelines for LCCE and increase the weight of building life cycle performance assessment in rating systems to encourage comprehensive assessments;
(3)
establish an information collection platform for life cycle assessments of colleges and universities to accumulate reliable sample data, develop specific data entry and processing processes and regularly update statistical data.
Additionally, colleges and universities should provide fundamental data to establish national or regional building sample databases, which can provide benchmarks for LCCE benchmarking processes in rating systems. As these sample databases grow, benchmarks can be adjusted in real time, providing valuable references for policy formulation, market orientation and new building decisions.

5. Conclusions

This study conducted a comparative analysis of SRSs at both building and urban scales to extract relevant low-carbon strategies applicable to higher education parks.
(1)
Within the framework of seven dimensions encompassing planning and design, low-carbon transport, energy, resource utilization, building construction, energy management and carbon emission calculation, a total of 52 corresponding low-carbon design strategies were identified from BREEAM, LEED, DGNB and ASGA/ASGED across building and urban scales. These strategies serve as design references for higher education parks and provide a basis for standardization.
(2)
Analysis of strategy consistency across building and urban scales revealed the need for mutual supplementation and comprehensive consideration within the Planning and construction (1), Transport (2), Resource utilization (4) and Low-carbon building (5) dimensions. Through sorting the ratio of specific strategies to all carbon emission-related strategies, as well as analyzing the frequency of strategy occurrence and the strategies corresponding to prerequisites, we have identified strategies with higher attention across seven dimensions. Moreover, by amalgamating the frequency of strategy occurrences, a comprehensive analysis of strategies within each dimension is conducted. During the overall planning of the campus, the prioritization of low-carbon strategies is primarily contemplated at the city level, while separate buildings necessitate more attention at the building level. While the score share can indicate the degree of attention to a strategy, the scoring mechanism is influenced by various factors. Therefore, in actual circumstances, the consideration of key strategies must weigh factors such as economic viability, technological feasibility and other pertinent elements in a comprehensive manner.
(3)
All SRSs exhibit the highest level of concern for carbon reduction in operational energy, followed by materials production and recycling stages. Conversely, the construction and transport stages have the lowest percentage of scores. Strengthening the mandatory requirement for LCCE calculation in China is essential for designing carbon reduction strategies across all life cycle stages.
(4)
Early intervention in LCCE during the predesign stage encourages designers to adopt an LCA perspective in their design thinking. Establishing a benchmarking system at both national macro and unit levels can offer a more objective and comprehensive evaluation of building life cycle carbon emissions.
This study primarily focuses on discussing design strategies for life cycle carbon emissions in the environmental context of higher education parks, excluding evaluations of economic and social dimensions. Future research will broaden the scope to explore the relationship between design strategies and the life cycle performance of higher education parks. Additionally, the strategy library will be expanded and refined with additional case studies to further validate the reliability and practicality of this study. While the identified high-focus criteria for low-carbon strategies can enhance project performance in SRSs, it is crucial to recognize that high-scoring strategies may not necessarily be superior in reducing carbon emissions. Tailoring strategies to local conditions remains paramount in sustainable design.

Author Contributions

Q.L.: Conceptualization, Methodology, Data curation, Writing—original draft preparation; Y.Z.: Supervision, Conceptualization, Methodology; Y.M.: Conceptualization, Methodology, Data curation, Validation. Z.P.: Supervision, Conceptualization, Methodology; W.K.: Data curation, Validation. All authors have read and agreed to the published version of the manuscript.

Funding

The authors acknowledge the Research Fund of China Academy of Building Research Co., Ltd. for the financial support given to this research under the process number of 20220118330730003 (the 2022 company’s research fund project).

Data Availability Statement

The original contributions presented in the study are included in the article, further inquiries can be directed to the corresponding author.

Acknowledgments

Chao Zhu, Xin Huang, Zhang Jiang and Shu Yuan have given valuable advice and information for the study.

Conflicts of Interest

The authors declare no conflicts of interest.

Appendix A

Table A1. Comparison in SBSs.
BREEAMLEEDDGNBASGC
Building levelEducationFor schoolEducationSecondary vocational schools and colleges and universities
ScopeEducation includes: Universities and specialized colleges, including:
a. Teaching facilities;
b. Learning resource centers;
c. Laboratories, seminar rooms or studios;
d. Student activity buildings;
e. A mixture of the above types of buildings
Schools may optionally be used for higher education and non-academic buildings on school campusesAll educational buildings, including:
The primary use of these buildings is rooms for education, training, seminars, lectures, workshops and classrooms. Secondary uses in the building being assessed, such as offices, kitchen, refectory, laboratory, library, gym, etc., are assessed within the same scope
Green campuses should be evaluated as individual campuses or schools as a whole
SourceBREEAM International New Construction Technical Manual 2016LEED v4
Building design and construction
DGNB system criteria set: new construction building 2020Assessment Standard of Green Campus 2019 (GB/T51356-2019):
3.1 basic requirements
Categories covered in this paperManagement (Man)
Health and wellbeing (Hea)
Energy (Ene)
Transport (Tra)
Water (Wat)
Materials (Mat)
Waste (Was)
Land use and ecology (LE)
Pollution (Pol)
Location and Transportation (LT)
Sustainable Sites (SS)
Water Efficiency
Energy and Atmosphere (EA)
Materials and Resources (MR)
Indoor Environmental Quality (IE)
Environmental quality (ENV)
Economic quality (ECO)
Sociocultural and functional quality (SOC)
Technical quality (TEC)
Process quality (PRO)
Site quality (SITE)
5.1 Planning and Ecology
5.2 Energy and Resources
5.3 Environment and Health
5.4 Operation and Management
Urban scaleCommunitiesCities and
Communities
Districts Criteria SetAssessment Standard of Green Eco-District
ScopeIt can be applied to moderate or large mixed-use developments. And the assessment methodology may also deliver significant benefits for smaller-scale developmentsIt can be applied to non-city areas, such as counties, regions, districts, economic zones, neighborhoods, campuses and military installations. Large educational, institutional or industrial campuses and communitiesThe system is based on the schemes for urban districts (City), business districts (Business), event areas (Event), industrial sites (Industry) and commercial areas (Commercial)The evaluation of green eco-cities should be pushed by the urban area, and the planning land area should be clarified
sourceBREEAM Communities Technical Manual SD202 1.2-2012:
Scope of BREEAM Communities
LEED v4.1 Cities and communities:
plan and design communities
DGNB System
criteria set:
criteria set districts version 2020
Assessment Standard for Green Eco-District (GB/T 51255-2017): 3.1 basic requirements
Category covered in this paperGovernance (GO)
Social and economic wellbeing (SE)
Resources and energy (RE)
Land use and ecology (LE)
Transport and movement (TM)
Integrative Process (IP)
Natural System and Ecology (NS)
Transportation and Land Use (WE)
Energy and Greenhouse Gas Emissions (EN)
Materials and Resource (MR)
Quality of Life (QL)
Environmental quality (ENV)
Economic quality (ECO)
Sociocultural and functional quality (SOC)
Technical quality (TEC)
Process quality (PRO)
4 Land Utilization
5 Ecological Environment
6 Green Building
7 Resource and Carbon Emission
8 Green Transportation
9 Informatization Management
12 Technical Innovation

Appendix B

Table A2. Experts’ Information.
Engineer NumberTitleQualificationFieldLow Carbon Building Research and Practice Time/YearsExperience
AProfessor-level
Senior
Architect
LEED AP
/BREEAM AP/Class I Certified Architects
Architecture21Over 100 green building scheme designs, over 100 design consultations and 20 green building standards
BProfessor-level
Senior
Engineer
LEED AP/ Certified Structural EngineersCivil Engineering20Over 100 green building scheme designs, over 100 design consultations and 20 green building standards
CProfessor-level
Senior
Engineer
LEED AP/WELL AP/Certified Utility EngineersHVAC18Over 100 green building scheme designs, over 100 design consultations and 20 green building standards
DProfessor-level Senior EngineerLEED AP/
Class I Certified Architects
Architecture1685 green building scheme designs, 35 design consultations and 8 green building standards
ESenior EngineerBREEAM AP/Certified Electrical EngineersElectrical Engineering1582 green building scheme designs, 31 design consultations and 6 green building standards
FSenior EngineerLEED AP/BREEAM AP/Certified Structural EngineersCivil Engineering1675 green building scheme designs, 12 design consultations and 6 green building standards
GSenior EngineerLEED AP/
Class I Certified Architects
Architecture1580 green building scheme designs, 17 design consultations and 7 green building standards
HSenior EngineerLEED AP/
Class I Certified Architects
Architecture1583 green building scheme designs, 25 design consultations and 6 green building standards
IProfessor-level Senior ArchitectLEED AP/BREEAM APD&G Engineering1976 green building scheme designs, 27 design consultations and 5 green building standards
JSenior EngineerLEED AP/
Certified Utility Engineers
HVAC1465 green building scheme designs, 33 design consultations and 5 green building standards

Appendix C

Table A3. Evaluation dimensions mentioned in the literature and evaluation system.
Research1234567891011121314
[9]
[16]
[29]
[30]
[31]
[32]
[33]
[34]
[35]
[56]
[57]
[58]
[59]
[60]
[61]
[62]
[63]
[64]
[65]
[66]
[67]
√: the literature, standard or tool considers the corresponding dimension. 1: Infrastructure, 2: Space efficiency, 3: Planning and construction, 4: Energy, 5: Climate; 6: Materials, 7: Building, 8: Indoor environmental quality, 9: Transport, 10: Greenery, 11: Waste, 12: Water, 13: Management, 14: Biology.

Appendix D

Table A4. Coding of low-carbon-related strategies.
CodingDimensionCodingStrategy
1Planning and
construction
1.1Reasonable greening rate
1.2The heat island effect reduction
1.3Low-carbon construction
1.4Achieving the carbon emission targets
1.5Resilience planning
1.6Reasonable building density and layout
1.7Rational road network design
1.8Microclimate regulation
1.9Enhancement of green building compliance rate
1.10Establishment of shared spaces and facilities
1.11Ecological analysis
1.12Measures for ecological protection of the site
2Low-carbon
transport
2.1Bike-ability
2.2Walk-ability
2.3Charging electric vehicle devices
2.4Accessibility of public transport
2.5Vehicle sharing
2.6Rationalization of parking spaces
2.7Parking spaces rationalized
2.8Frequency of public transport
3Energy3.1Fulfillment of high requirements for energy-efficient design
3.2Overall energy connectivity enhancement
3.3Energy efficiency of equipment improvement
3.4Enhancement of energy efficiency
3.5Renewable energy utilization
3.6Clean energy utilization
3.7Grid harmonization
3.8Flexibility and expansion reserves of the building
3.9Real-time energy monitoring
4Resource utilization4.1Material durability improvement
4.2Low-carbon, recyclable materials utilization
4.3Material recycling
4.4Full utilization of existing buildings and facilities
4.5Wastewater recycling and reuse
4.6Enhanced refrigerant management
4.7Efficient utilization of water resources
4.8Waste management
4.9Rainwater harvesting and utilization
4.10Control of NOx emissions
5Low-carbon
building
5.1Passive strategies of buildings
5.2Indoor light environment optimization
5.3Indoor wind environment optimization
5.4Accessibility of building components for cleaning
5.5Enhancement of the heat transfer performance of the building envelope
5.6Indoor thermal comfort optimization
5.7Building space efficiency
6Management6.1Establishment of low-carbon energy management platform
6.2Low-carbon target setting
6.3Establishment of a management mechanism for carbon emission reduction
7Carbon emissions calculation7.1Life cycle performance assessment in the design stage
7.2Optimization for reducing life cycle carbon emissions
7.3Comparison with carbon emission baseline values
7.4Control of greenhouse gas emissions per capita

References

  1. Caifei, W. Member Wang Yanxin: Promoting the Construction of Carbon-Neutral Campuses in Colleges and Universities. Available online: https://www.cas.cn/zt/hyzt/2022lh/jjkj/202203/t20220304_4827055.shtml (accessed on 12 October 2023).
  2. Yuan, X.; Zuo, J.; Huisingh, D. Green Universities in China–what matters? J. Clean. Prod. 2013, 61, 36–45. [Google Scholar] [CrossRef]
  3. Hollberg, A.; Ruth, J. LCA in architectural design—A parametric approach. Int. J. Life Cycle Assess. 2016, 21, 943–960. [Google Scholar] [CrossRef]
  4. Meex, E.; Hollberg, A.; Knapen, E.; Hildebrand, L.; Verbeeck, G. Requirements for applying LCA-based environmental impact assessment tools in the early stages of building design. Build. Environ. 2018, 133, 228–236. [Google Scholar] [CrossRef]
  5. Li, Q.; Yang, W.; Kohler, N.; Yang, L.; Li, J.; Sun, Z.; Yu, H.; Liu, L.; Ren, J. A BIM–LCA Approach for the Whole Design Process of Green Buildings in the Chinese Context. Sustainability 2023, 15, 3629. [Google Scholar] [CrossRef]
  6. Yu, H.; Yang, W.; Li, Q.; Li, J. Optimizing Buildings’ Life Cycle Performance While Allowing Diversity in the Early Design Stage. Sustainability 2022, 14, 8316. [Google Scholar] [CrossRef]
  7. Office, T.A.S. Major Event in Tingshua. Available online: https://2021.tsinghua.edu.cn/dsj.htm (accessed on 21 April 2023).
  8. Findler, F.; Schönherr, N.; Lozano, R.; Stacherl, B. Assessing the Impacts of Higher Education Institutions on Sustainable Development—An Analysis of Tools and Indicators. Sustainability 2018, 11, 59. [Google Scholar] [CrossRef]
  9. GB/T51356-2019; Assessment Standard for Green Campus. National Standard of the People’s Republic of China: Beijing, China, 2019.
  10. T/CABEE 053-2023; Guideline for Carbon Emissions Accounting of University Campuses. China Association of Building Energy Efficiency (CABEE): Beijing, China, 2023.
  11. He, B.J.; Zhao, D.X.; Gou, Z. Integration of Low-Carbon Eco-City, Green Campus and Green Building in China. In Greening Energy and Technology; Springer: Berlin/Heidelberg, Germany, 2020; pp. 49–78. [Google Scholar] [CrossRef]
  12. Ministry of Education. National Statistical Bulletin on the Development of Education, 2022; Ministry of Education: Beijing, China, 2023. [Google Scholar]
  13. Ning, L. A Study of Influence of Collegiate Parks to Urban Development in China; East China Normal University: Shanghai, China, 2013. [Google Scholar]
  14. Technical Committee ISO/TC 207; Environmental Management—Life Cycle Assessment: Principles and Framework. International Organization for Standardization: Geneva, Switzerland, 2006.
  15. GB/T 51366-2019; Standard for Building Carbon Emission Calculation. National Standard of the People’s Republic of China: Beijing, China, 2019.
  16. Li, Y.; Gu, Y.; Liu, C. Prioritising performance indicators for sustainable construction and development of university campuses using an integrated assessment approach. J. Clean. Prod. 2018, 202, 959–968. [Google Scholar] [CrossRef]
  17. Karatzoglou, B. An in-depth literature review of the evolving roles and contributions of universities to Education for Sustainable Development. J. Clean. Prod. 2013, 49, 44–53. [Google Scholar] [CrossRef]
  18. Albareda-Tiana, S.; Vidal-Raméntol, S.; Fernández-Morilla, M. Implementing the sustainable development goals at University level. Int. J. Sustain. High. Educ. 2018, 19, 473–497. [Google Scholar] [CrossRef]
  19. Pacheco-Blanco, B.; Bastante-Ceca, M.J. Green public procurement as an initiative for sustainable consumption. An exploratory study of Spanish public universities. J. Clean. Prod. 2016, 133, 648–656. [Google Scholar] [CrossRef]
  20. Marinho, M.; Gonçalves, M.d.S.; Kiperstok, A. Water conservation as a tool to support sustainable practices in a Brazilian public university. J. Clean. Prod. 2014, 62, 98–106. [Google Scholar] [CrossRef]
  21. Yoshida, Y.; Shimoda, Y.; Ohashi, T. Strategies for a sustainable campus in Osaka University. Energy Build. 2017, 147, 1–8. [Google Scholar] [CrossRef]
  22. Mendoza, J.M.F.; Gallego-Schmid, A.; Azapagic, A. A methodological framework for the implementation of circular economy thinking in higher education institutions: Towards sustainable campus management. J. Clean. Prod. 2019, 226, 831–844. [Google Scholar] [CrossRef]
  23. Berzosa, A.; Bernaldo, M.O.; Fernández-Sanchez, G. Sustainability assessment tools for higher education: An empirical comparative analysis. J. Clean. Prod. 2017, 161, 812–820. [Google Scholar] [CrossRef]
  24. Cho, H.M.; Yun, B.Y.; Yang, S.; Wi, S.; Chang, S.J.; Kim, S. Optimal energy retrofit plan for conservation and sustainable use of historic campus building: Case of cultural property building. Appl. Energy 2020, 275, 115313. [Google Scholar] [CrossRef]
  25. Karuchit, S.; Puttipiriyangkul, W.; Karuchit, T. Carbon Footprint Reduction from Energy-Saving Measure and Green Area of Suranaree University of Technology, Thailand. Int. J. Environ. Sci. Dev. 2020, 11, 170–174. [Google Scholar] [CrossRef]
  26. Cai, P. Study on the Design of Campus Landscape Sketches under the Characteristics of Lingnan Regional Culture. Environ. Resour. Ecol. J. 2022, 6, 110–118. [Google Scholar] [CrossRef]
  27. Dai, J.; Jiang, S.; Li, J.; Xu, X.; Wu, M. The influence of layout on energy performance of university building. In IOP Conference Series: Earth and Environmental Science; IOP Publishing: Bristol, UK, 2019; p. 022069. [Google Scholar] [CrossRef]
  28. da Silva, L.A.; Dutra, A.R.d.A.; Soares, T.C.; Birch, R.S.; Guerra, J.B.S.O.d.A. Trends in research: Carbon footprint reduction in universities as a way to achieve a green campus. Int. J. Sustain. High. Educ. 2022, 24, 584–601. [Google Scholar] [CrossRef]
  29. Amaral, A.R.; Rodrigues, E.; Gaspar, A.R.; Gomes, Á. Lessons from unsuccessful energy and buildings sustainability actions in university campus operations. J. Clean. Prod. 2021, 297, 126665. [Google Scholar] [CrossRef]
  30. Leon, I.; Oregi, X.; Marieta, C. Environmental assessment of four Basque University campuses using the NEST tool. Sustain. Cities Soc. 2018, 42, 396–406. [Google Scholar] [CrossRef]
  31. Dawodu, A.; Guo, C.; Zou, T.; Osebor, F.; Tang, J.; Liu, C.; Wu, C.; Oladejo, J. Developing an integrated participatory methodology framework for campus sustainability assessment tools (CSAT): A case study of asino-foreign university in China. Prog. Plan. 2023, 183, 100827. [Google Scholar] [CrossRef]
  32. Dawodu, A.; Dai, H.; Zou, T.; Zhou, H.; Lian, W.; Oladejo, J.; Osebor, F. Campus sustainability research: Indicators and dimensions to consider for the design and assessment of a sustainable campus. Heliyon 2022, 8, e11864. [Google Scholar] [CrossRef] [PubMed]
  33. Jiang, Q.; Kurnitski, J. Performance based core sustainability metrics for university campuses developing towards climate neutrality: A robust PICSOU framework. Sustain. Cities Soc. 2023, 97, 104723. [Google Scholar] [CrossRef]
  34. Stars Technical Manual. Version 2.1. Available online: https://stars.aashe.org/pages/about/technical-manual.html (accessed on 28 May 2024).
  35. UI Green City Metric Methodology. Available online: https://greenmetric.ui.ac.id/about/methodology (accessed on 28 May 2024).
  36. Greening Universities Toolkit V2.0. Available online: https://www.unenvironment.org/resources/toolkits-manuals-andguides/greening-universities-toolkit-v20 (accessed on 28 May 2024).
  37. BREEAM. BREEAM Certification from BRE. Available online: https://bregroup.com/products/breeam/ (accessed on 20 March 2024).
  38. LEED Rating System: The Most Widely Used Green Building Rating System. Available online: https://www.usgbc.org/leed (accessed on 20 March 2024).
  39. Council, G.S.B. DGNB Certification. Available online: https://www.dgnb-system.de/en/ (accessed on 20 March 2024).
  40. C.E.N. Sustainability of Construction Works. Assessment of Environmental Performance of Buildings. Calculation Method; CEN: Brussels, Belgium, 2011. [Google Scholar]
  41. BRE. BREEAM Communities. Available online: https://breeam.com/standards/communities (accessed on 20 March 2024).
  42. U.S. German Sustainable Building Council. LEED for Cities and Communities. Available online: https://www.usgbc.org/leed/rating-systems/leed-for-cities-communities (accessed on 20 March 2024).
  43. U.S. German Sustainable Building Council. DGNB System for Ditrict. Available online: https://www.dgnb.de/en/certification/districts#:~:text=For%20certification%20according%20to%20the%20DGNB%20System%20for,publicly%20accessible%20spaces%20and%20corresponding%20infrastructure.%20...%20%E6%9B%B4%E5%A4%9A%E9%A1%B9%E7%9B%AE (accessed on 25 March 2024).
  44. GB/T 51255-2017; Assessment Standard for Green Eco-District. National Standard of the People’s Republic of China: Beijing, China, 2017.
  45. Yuan, G. Studies on the China’s Green Building Assessment System Integrated Assessment of Carbon Emissions; Tianjin University: Tianjin, China, 2015. [Google Scholar]
  46. GB/TGB/T51356-2019; Green Building Evaluation Standard. National Standard of the People’s Republic of China: Beijing, China, 2019.
  47. Santos, R.; Costa, A.A.; Silvestre, J.D.; Pyl, L. Integration of LCA and LCC analysis within a BIM-based environment. Autom. Constr. 2019, 103, 127–149. [Google Scholar] [CrossRef]
  48. Hollberg, A.; Genova, G.; Habert, G. Evaluation of BIM-based LCA results for building design. Autom. Constr. 2020, 109, 102972. [Google Scholar] [CrossRef]
  49. Cavalliere, C.; Habert, G.; Dell’Osso, G.R.; Hollberg, A. Continuous BIM-based assessment of embodied environmental impacts throughout the design process. J. Clean. Prod. 2019, 211, 941–952. [Google Scholar] [CrossRef]
  50. Ganassali, S.; Lavagn, M.; Campioli, A. LCA benchmarks in building’s environmental certiication system. In Proceedings of the Sustainability and Innovation for the Future, Albufeira, Algarve, Portugal, 13–16 September 2016. [Google Scholar]
  51. Melton, P. DOE to Test Grid-Harmonization Tech in the Real World. Available online: https://www.buildinggreen.com/newsbrief/doe-test-grid-harmonization-tech-real-world (accessed on 10 June 2024).
  52. Feist, W. Life-cycle energy analysis: Low-energy house, passive house, self-sufficient house. Int. Symp. CIB 1997, 1, 183–190. [Google Scholar]
  53. Li, Q.; Yang, W. Methodology of Life Cycle GWP Benchmarking for Buildings—Taking a Primary School in the Cold Climate Zone for Example. Urban Eviron. Des. 2023, 144, 54–58. [Google Scholar]
  54. GB 55015-2021; Standard Forlighting Design of Buildings. National Standard of the People’s Republic of China: Beijing, China, 2021.
  55. GB/T xxxxx–202x; Technical Standard for Zero Carbon Buildings (Draft for Soliciting Opinions). Beijing, China, 2023.
  56. G.R.I. GRI Initiative. Available online: https://www.globalreporting.org/ (accessed on 3 June 2024).
  57. Alshuwaikhat, H.M.a.A. An integrated approach to achieving campus sustainability: Assessment of the current campus environmental management practices. J. Clean. Prod. 2008, 16, 1777–1785. [Google Scholar] [CrossRef]
  58. T/QDSF 012-2022; Evaluation Guide for Low-Carbon Parks. Qingdao Modern Service Industry Federation: Qingdao, China, 2022.
  59. DB11/T 1552—2018; Beijing Municipal Commission of Planning and Natural Resources. Assessment Standard for Green Ecological Demonstration Region Planning: Beijing, China, 2019.
  60. The Green Plan Is Not Just Green. Available online: https://www.developpement-durable.gouv (accessed on 1 June 2024).
  61. Parvez, N.; Agrawal, A. Assessment of sustainable development in technical higher education institutes of India. J. Clean. Prod. 2019, 214, 975–994. [Google Scholar] [CrossRef]
  62. Wang, Y.L.; Zhang, T.; Yuan, B.; Li, S. Comprehensive Evaluation Indicators and Methods of Near-zero Carbon Emission Parks. Electr. Power Sci. Eng. 2023, 39, 51–60. [Google Scholar] [CrossRef]
  63. Zhenyu, H. Optimization for Planning and Design of Nanjing Zidong Low Carbon Park Guided by Evaluation System. Morden City Res. 2011, 5, 44–48, 66. [Google Scholar]
  64. Suzhou Zhongzi Engineering Consulting Co., Ltd. Research on the Construction Path of Near Zero Carbon Industrial Park in Suzhou Industrial Park; Energy Foundation: Beijing, China, 2023. [Google Scholar]
  65. Ding, Q.; Qian, J. Study on Green Campus Evaluation System under the Framework of Overall Sustainable Development of Campus—Taking University of California at Berkeley as an Example. Urban Build. 2014, 1, 50–58. [Google Scholar]
  66. Wu, E. Research on the Strategy of Green Campus Planning and Construction in Universities under the Background of “Dual Carbon”. Art Time 2023, 10, 68–70. [Google Scholar]
  67. Du, Y. The Green Campus Assessment System of Higher Education Institutions Based on Problem Aligning with Goal Orientation—Take the Beijing-Tianjin-Hebei as an Example; Tianjin University: Tianjin, China, 2021. [Google Scholar]
Figure 1. Methodology framework. The abbreviations of category names in BREEAM: RE: Resources and energy, TM: Transport and movement and LE: Land use and ecology. The abbreviations of category names in LEED: LT: Location and transportation, WE: Water efficiency and EN: Energy and atmosphere. The abbreviations of category names in DGNB: ENV: Environmental quality, ECO: Economic quality and TEC: Technical quality. 5.1.1: Chapter Code in ASGA and ASGED. D1: Analysis dimension of low-carbon strategies, the same for D2–D7.
Buildings 14 01846 g001
Figure 2. Method for determining the analytical dimensions of low-carbon strategies.
Buildings 14 01846 g002
Figure 3. Dimension determination process. Numbers in brackets represent the number of selected standards, tool and literature and the amount of them dealing with a specific low-carbon evaluation element.
Buildings 14 01846 g003
Figure 4. Building-level SRS sections corresponding to the 7 dimensions.
Buildings 14 01846 g004
Figure 7. Comparison of S R i in 7 dimensions at building and urban scales within SRSs.
Buildings 14 01846 g007
Figure 8. Impact of indicators in SRSs on the life cycle stage Score ratio. MP: Material Production; MT: Material Transportation; C: Construction; RR: Replacement and Repair; O: Operational energy use; WU: Water Use; DD: Demolition and Disposal; RE: Recycling.
Buildings 14 01846 g008
Figure 9. Analysis of the percentage of consistent parts of the 7 dimensions.
Buildings 14 01846 g009
Figure 10. Sequence of sums of S R i .
Buildings 14 01846 g010
Table 3. Low-carbon strategy score share ( S R i ) of different life cycle stages in SRSs.
MPMTCRROWUDDRE
B-E15.7%9.5%14.3%9.5%43.6%8.4%9.0%13.2%
L-C10.9%8.2%1.8%11.8%36.4%13.6%11.8%10.0%
DGNB20.7%16.0%19.5%20.7%33.3%13.0%13.7%15.7%
ASGC7.7%1.8%4.8%5.9%31.8%10.9%2.6%4.8%
B-C20.7%15.3%15.3%18.0%46.7%7.9%18.0%18.0%
L-C6.4%4.5%4.5%6.4%44.5%15.5%12.7%10.9%
D-U7.8%7.4%8.6%7.8%33.1%10.6%9.1%7.4%
ASGED13.6%10.9%15.2%13.7%38.9%10.0%14.5%14.0%
Table 4. Comparison of SRS Life Cycle Carbon Emission Evaluation Provisions.
B-EL-SD-EASGC
Share of LCA-related component scoresEnergy–carbon emissions measurement7.2%--1.67%
LCA5.6%6.4%8.6%-
Evaluation approaches and toolsAssessment methodsNormalized indicators (Ecopoint)Optimization ComparisonGradingOptimization comparison
Tools for LCA calculationsByggLCA, Conpact, One Click LCA, eTool, Green Guide, COCON, ELODIE, MRPI Freetool MPG, nova EQUER, SBS Building Sustainability, Anavitor/ ECO2Athema Impact Estimator (North America), Envest2 (UK), LCA Design (Australia) SimaPro, GaBieLCA, LayLCA, LEGEPT20-CE V7.0, PKPM-CES, Swell CEEB, East Harvest, Carbon Central Harvest AIA
Database supportIMPACTGaBi, SimaProOekobau.dat, BRUSACO, CHISUCO,
EUSUCO, UKRASUCO, EPD programs
China Carbon Emission Factor Database
Benchmarking process approachBenchmark approachExternal benchmarks (building materials)
Internal benchmarks (energy consumption)
Internal benchmarksExternal benchmarksInternal benchmarks (energy consumption)
Reference value settingEcopoint
average value
Baseline buildingExcess of target value
General target value
reference point
threshold value
Baseline building
(energy consumption)
Source of baseline dataStatistics on certified buildings (building materials)
Targeted programs (energy
consumption)
Targeted
programs
Statistics on
certified
buildings
Targeted
programs
(energy consumption)
Table 5. Criteria involved in the quantification of carbon emissions.
BREEAMLEEDDGNBASGC/ASGED
Building ScaleOperation CarbonRE 01EN Prerequisite
EN Credit: Grid Harmonization
ENV1.16.2.11
RE 07
TM01
Embodied CarbonRE 02EN Prerequisite-
Urban ScaleOperation CarbonRE01EN PrerequisiteENV1.17.1.3
TM077.2.14
Embodied CarbonRE05--
Table 6. Strategies from prerequisites in SRSs.
1234567
BREEAM1.112.73.54.3, 4.6, 4.75.2-7.1
LEED1.1, 1.5, 1.11-3.34.3, 4.75.5-
DGNB1.2- 4.15.5-7.1
ASGC/ESGED1.6, 1.112.23.34.75.56.1, 6.27.3
Disclaimer/Publisher’s Note: The statements, opinions and data contained in all publications are solely those of the individual author(s) and contributor(s) and not of MDPI and/or the editor(s). MDPI and/or the editor(s) disclaim responsibility for any injury to people or property resulting from any ideas, methods, instructions or products referred to in the content.

