Article

Evaluating and Comparing Human Perceptions of Streets in Two Megacities by Integrating Street-View Images, Deep Learning, and Space Syntax

by
Yalun Lei
1,
Hongtao Zhou
1,*,
Liang Xue
2,
Libin Yuan
3,
Yigang Liu
4,
Meng Wang
5 and
Chuan Wang
6
1
College of Design and Innovation, Tongji University, Shanghai 200092, China
2
Academic Affairs Office, Guangdong University of Education, Guangzhou 510303, China
3
Department of Architecture, University of Florence, 50041 Florence, Italy
4
College of Art and Design, Nanjing Forestry University, Nanjing 210037, China
5
Shanghai Academy of Fine Arts, Shanghai University, Shanghai 200444, China
6
School of Design and Fashion, Zhejiang University of Science and Technology, Hangzhou 310023, China
*
Author to whom correspondence should be addressed.
Buildings 2024, 14(6), 1847; https://doi.org/10.3390/buildings14061847
Submission received: 31 March 2024 / Revised: 16 May 2024 / Accepted: 12 June 2024 / Published: 18 June 2024
(This article belongs to the Special Issue Future Cities and Their Downtowns: Urban Studies and Planning)

Abstract

:
Street quality plays a crucial role in promoting urban development. There is still no consensus on how to quantify human street quality perception on a large scale or explore the relationship between street quality and street composition elements. This study investigates a new approach for evaluating and comparing street quality perception and accessibility in Shanghai and Chengdu, two megacities with distinct geographic characteristics, using street-view images, deep learning, and space syntax. The result indicates significant differences in street quality perception between Shanghai and Chengdu. In Chengdu, there is a curvilinear distribution of the highest positive perceptions along the riverfront space and a radioactive spatial distribution of the highest negative perceptions along the ring road and main roads. Shanghai displays a fragmented cross-aggregation and polycentric distribution of the streets with the highest positive and negative perceptions. Thus, it is reasonable to hypothesize that street quality perception closely correlates with the urban planning and construction process of streets. Moreover, we used multiple linear regression to explain the relationship between street quality perception and street elements. The results show that buildings in Shanghai and trees, pavement, and grass in Chengdu were positively associated with positive perceptions. Walls in both Shanghai and Chengdu show a consistent positive correlation with negative perceptions and a consistent negative correlation with other positive perceptions, and are most likely to contribute to the perception of low street quality. Ceilings were positively associated with negative perceptions in Shanghai but are not the major street elements in Chengdu, while the grass is the opposite of the above results. Our research can provide a cost-effective and rapid solution for large-scale, highly detailed urban street quality perception assessments to inform human-scale urban planning.

1. Introduction

As an essential public space in the city, the street carries the critical functions of daily commuting, living, leisure, and socializing. High-quality urban streets can have a strong positive impact on human psychological and physiological health [1,2]. Therefore, analyzing the relationship between human perception and street quality is of great practical significance for constructing people-centered exemplary urban management. In recent decades, China’s urbanization has led to rapid economic development and “urban diseases” [3]. Government policies on street construction primarily focus on financial benefits, overlooking the need to improve street quality. The original social functions of the street are gradually being eroded by traffic functions, leading to the marginalization of pedestrians or their relocation to indoor environments [4]. As a result, street space faces a growing crisis of disorder. However, existing research indicates that high-quality streets foster friendly neighbourhoods and vibrant public life and promote social integration, and that a comfortable street environment enhances walking frequency, thus affecting user behaviour [5,6]. Due to the positive impacts of high-quality streets on humans, scholars from different fields have begun prioritizing research on street quality perception at the human scale [7,8,9]. Therefore, evaluating street quality perception is a prerequisite for urban street regeneration and management projects. Designers and city managers need a clear understanding of how to measure these perceptions on a large scale. The previous research on urban street quality perception is usually qualitative and descriptive, including questionnaire surveys, field research, and social networks or macro-scale studies based on geography and sociology, which can capture humans’ views on street quality perception but are limited by the observation time and number of observers, making it difficult to achieve a rapid evaluation on large scale and scope [10,11]. In addition, most macro studies only consider the impact of a single street-view element on human perception, and it is difficult to determine which of the multiple street-view elements influences street quality perception [12].
The rapid development of artificial intelligence (AI) technologies and big data has brought about a paradigm shift in spatial physical perception metrics for urban streets. The increasing popularity of urban geographic information, point of interest (POI), map service, and volunteered geographic information (VGI) provides better conditions for obtaining basic information and large-scale measurements of street quality. With the emergence of deep learning algorithms in image processing, researchers can now extract the physical environment of urban streets through the rapid quantification of remote sensing images and street-view images. Yao et al. [7] verified the feasibility of using semantic segmentation and Google Street View images to measure streets’ sky, trees, buildings, cars, and other landscape elements. Zhang et al. [8] proposed a data-driven machine-learning approach to measure how people perceive a place in a large urban area. In addition, the development of deep convolutional neural networks (CNNs) has further stimulated interest in image content analysis. Image sensing data can process and visualize people’s behaviours, actions, and preferences in a low-cost but highly accurate manner. Many researchers, urban planners, and policymakers seek to integrate computer technology with urban street research, preferring deep learning techniques to measure urban street quality perception and guide urban planning [13,14,15]. However, for many economically underdeveloped cities, a shortage of urban renewal funds does not support large-scale urban street renovations or governance. Therefore, it has become crucial to identify which areas urgently need renewal or governance to allocate urban construction funds reasonably, avoid resource wastage, and enhance urban planning efficiency. Utilizing space syntax to identify highly accessible streets is a high priority in the urban planning process.
This study combines street-view images, deep learning, and space syntax to evaluate and compare the link between street quality perception and street accessibility in two megacities, enabling the large-scale and fast identification of urban streets that urgently need maintenance and renewal based on a human perception perspective. The results of this approach are a detailed measure of the dynamic regulation of urban development. Furthermore, we applied a multiple linear regression model to analyze the relationship between various perceptual indicators and the street elements of highly accessible streets. We tried to identify “which street elements may lead to a place being perceived as a specific perception”. Through statistical analysis, different street elements were determined to be positively or negatively correlated with perceptual indicators. These findings contribute to the objective assessment of previously subjective and experience-based issues, aiding in the development of urban planning and design at a human scale.

2. Literature Review

2.1. Human Perception Assessment

Human perception evaluation is a method of measuring respondents’ perceived emotions towards a selected built environment through different types of interviews or on-site questionnaires. The results of this research method help to identify important factors in the built environment that affect people’s mental health and spatial behaviour. However, human perception evaluation is influenced by personal experience, culture, and perceptual interpretation. Regarding architecture, Lynch [16] identifies three components that make up an individual’s perception evaluation of an urban spatial environment: identity, structure, and meaning; where meaning indicates the location’s actual and perceived value to the individual. Ma et al. [17] used social descriptions to express the pursuit of neighbourhood life, pointing out that “great streets” are remarkable for character and qualities and that there is a strong relationship between human activity and spatial physical characteristics. From an environmental psychology perspective, Bornioli et al. [18] suggested that restorative urban environments can help people recover from depleted physical and mental states. The higher the quality rating of urban streets, the higher the residents’ attachment to them [19]. Positive urban street quality perceptions may be relaxing and therapeutic, especially for mental illness patients.
Traditionally, due to the limitations of science and technology, research on human perception assessment primarily relied on methods such as interviews, questionnaires, and telephone surveys, in which respondents were asked to measure quality by answering open-ended questions or environmental assessments (e.g., satisfaction-dissatisfaction) through a ranking scale. For example, Tang et al. [20] conducted field interviews on three similar streets in San Francisco with different traffic levels to understand how traffic conditions affect the liveliness and quality of the street environment. Based on expert judgment, these on-site surveys are a powerful tool for making informed decisions but are costly and time-consuming. They can lead to inadequate samples, raising concerns about response bias and hindering their widespread use.
During the last 10 years, computer-assisted audits and assessments have become increasingly popular due to their efficiency in the rapid development of multi-source geospatial big data such as massive geo-tagged imagery datasets, GIS (geographic information system), remote sensing, and POI. In particular, the emergence of street-view images opens up more possibilities for rapidly acquiring high-precision street-view datasets. Street-view images are geo-tagged photographs captured, processed, and maintained by mapping service providers (e.g., Google Maps, Baidu Maps) according to standard processing. Chen et al. [21] were the first to propose using street-view images to collect urban environment perceptions, suggesting that high-quality urban environments promote social and economic development. In addition, the popularity of crowdsourcing techniques has enhanced the ability to collect large numbers of images to represent local physical environments and predict human responses to image perception. For example, Larkin et al. [22] used an online crowdsourcing strategy and machine learning to extend measurements to regions in major cities worldwide, thereby constructing a large-scale global dataset of urban perceptions. These studies extend the investigation of human perception of street-view images and help researchers better understand these streets. However, extracting higher-order information about natural images is challenging because these methods do not allow for the pixel-level classification of image features. Therefore, completely new research methods are needed for more in-depth analysis.

2.2. Key Methods for Evaluating Street Quality

The academic discussion and application of the quantitative evaluation of street quality mainly revolves around three main areas: (1) extracting semantic information from street-view images using deep learning techniques; (2) exploring the human perception of urban space using machine learning techniques; (3) quantifying urban street accessibility using space syntax. The development of these research methods provides a theoretical foundation for assessing urban street quality and innovative practices in this study.

2.2.1. Extracting Semantic Information from Street-View Images via Deep Learning

The emerging online street-view images from providers such as Google, Baidu, and others have provided valuable training datasets for deep learning. Inspired by this large number, area, and panoramic coverage of image datasets, many crowdsourcing studies have attempted to extract pixel semantic information through the automatic segmentation processing of eye-level images to enable simultaneous microscale assessment and analysis of high-resolution streetscape features across cities [23]. However, these methods for extracting semantic features from image-recognized objects mainly rely on image pixel colors, which do not distinguish well between two different types of objects with the same colors. Several neural networks for semantic pixel segmentation, such as FCNs (fully convolutional networks), CNNs, and SegNet, have emerged recently. These algorithms can efficiently recognize visual features in an image, such as roads, buildings, sky, sidewalks, trees, and automobiles. These provide a solid foundation for a more scientific study of urban street quality and human perception.

2.2.2. Exploring the Human Perception of Urban Space Using Machine Learning Techniques

Humans have superior abilities in recognizing images’ global properties, laying the foundation for the large-scale and rapid measurement of human perception using deep learning techniques. Assessing user street perceptions can lead to a better understanding of how urban streets are being built [24]. In 2013, Zhang et al. [8] examined more than 4000 images of four cities in the U.S. and Austria to map human perceptions of the appearance of these cities at MIT media lab using the Google Street View dataset called “Place Pulse”. This data collection platform allows volunteers to compare two images based on criteria for six perceptual indicators (beautiful, lively, wealthy, safety, boring, and depressing) and produce a deep learning dataset. Han et al. [25] employed the SegNet deep learning model to extract detailed human activity information on a city scale from street-view images. This approach aimed to identify higher-level scene features and reveal the relationship between the urban built environment and residents’ perceived psychological stress. Yao et al. [7] proposed a human-computer adversarial model based on deep learning to explore the relationship between street elements and residents’ ratings using semantic segmentation and random forest algorithms, and the framework can be used to study the correlation between street visual features and residents’ perceptions in complex urban environments. These studies demonstrate the potential of using deep learning techniques with street-view images to study the relationship between objective physical environments and perceptions in large-scale spaces.

2.2.3. Quantifying Accessibility in the Urban Street Using Space Syntax

Accessibility is crucial for assessing urban street quality [26]. Accessibility analysis is mainly based on space syntax theory. Space syntax is a novel language for describing architectural and urban spatial patterns, centered on dividing and partitioning space to analyze complex relationships. The basic principle of space syntax is to delineate a given space into axial, convex, and grid dimensions and to explore the accessibility of street network configurations using parameters such as depth and integration to analyze the patterns of internal changes in urban topological configurations [27]. Human mobility in space can be represented by the network accessibility metric DepthmapX 1.0, developed by University College London, and uses space integration or selection to quantify accessibility.
In human-scale street research, people and streets are the main objects, and how people perceive street space and where activities occur are the two ways these objects primarily interact. Using space syntax theory can help urban planners and managers better identify the most active areas in the street and compare street quality. For example, Wu et al. [28] combined deep learning with space syntax theory to provide more accurate and practical information for urban streets’ restorative perception. In addition, the space syntax theory has been applied to commercial district planning to improve space utilization and economic efficiency. In summary, space syntax theory is an effective tool for quantifying urban street accessibility and improving overall urban street quality.

3. Methodology

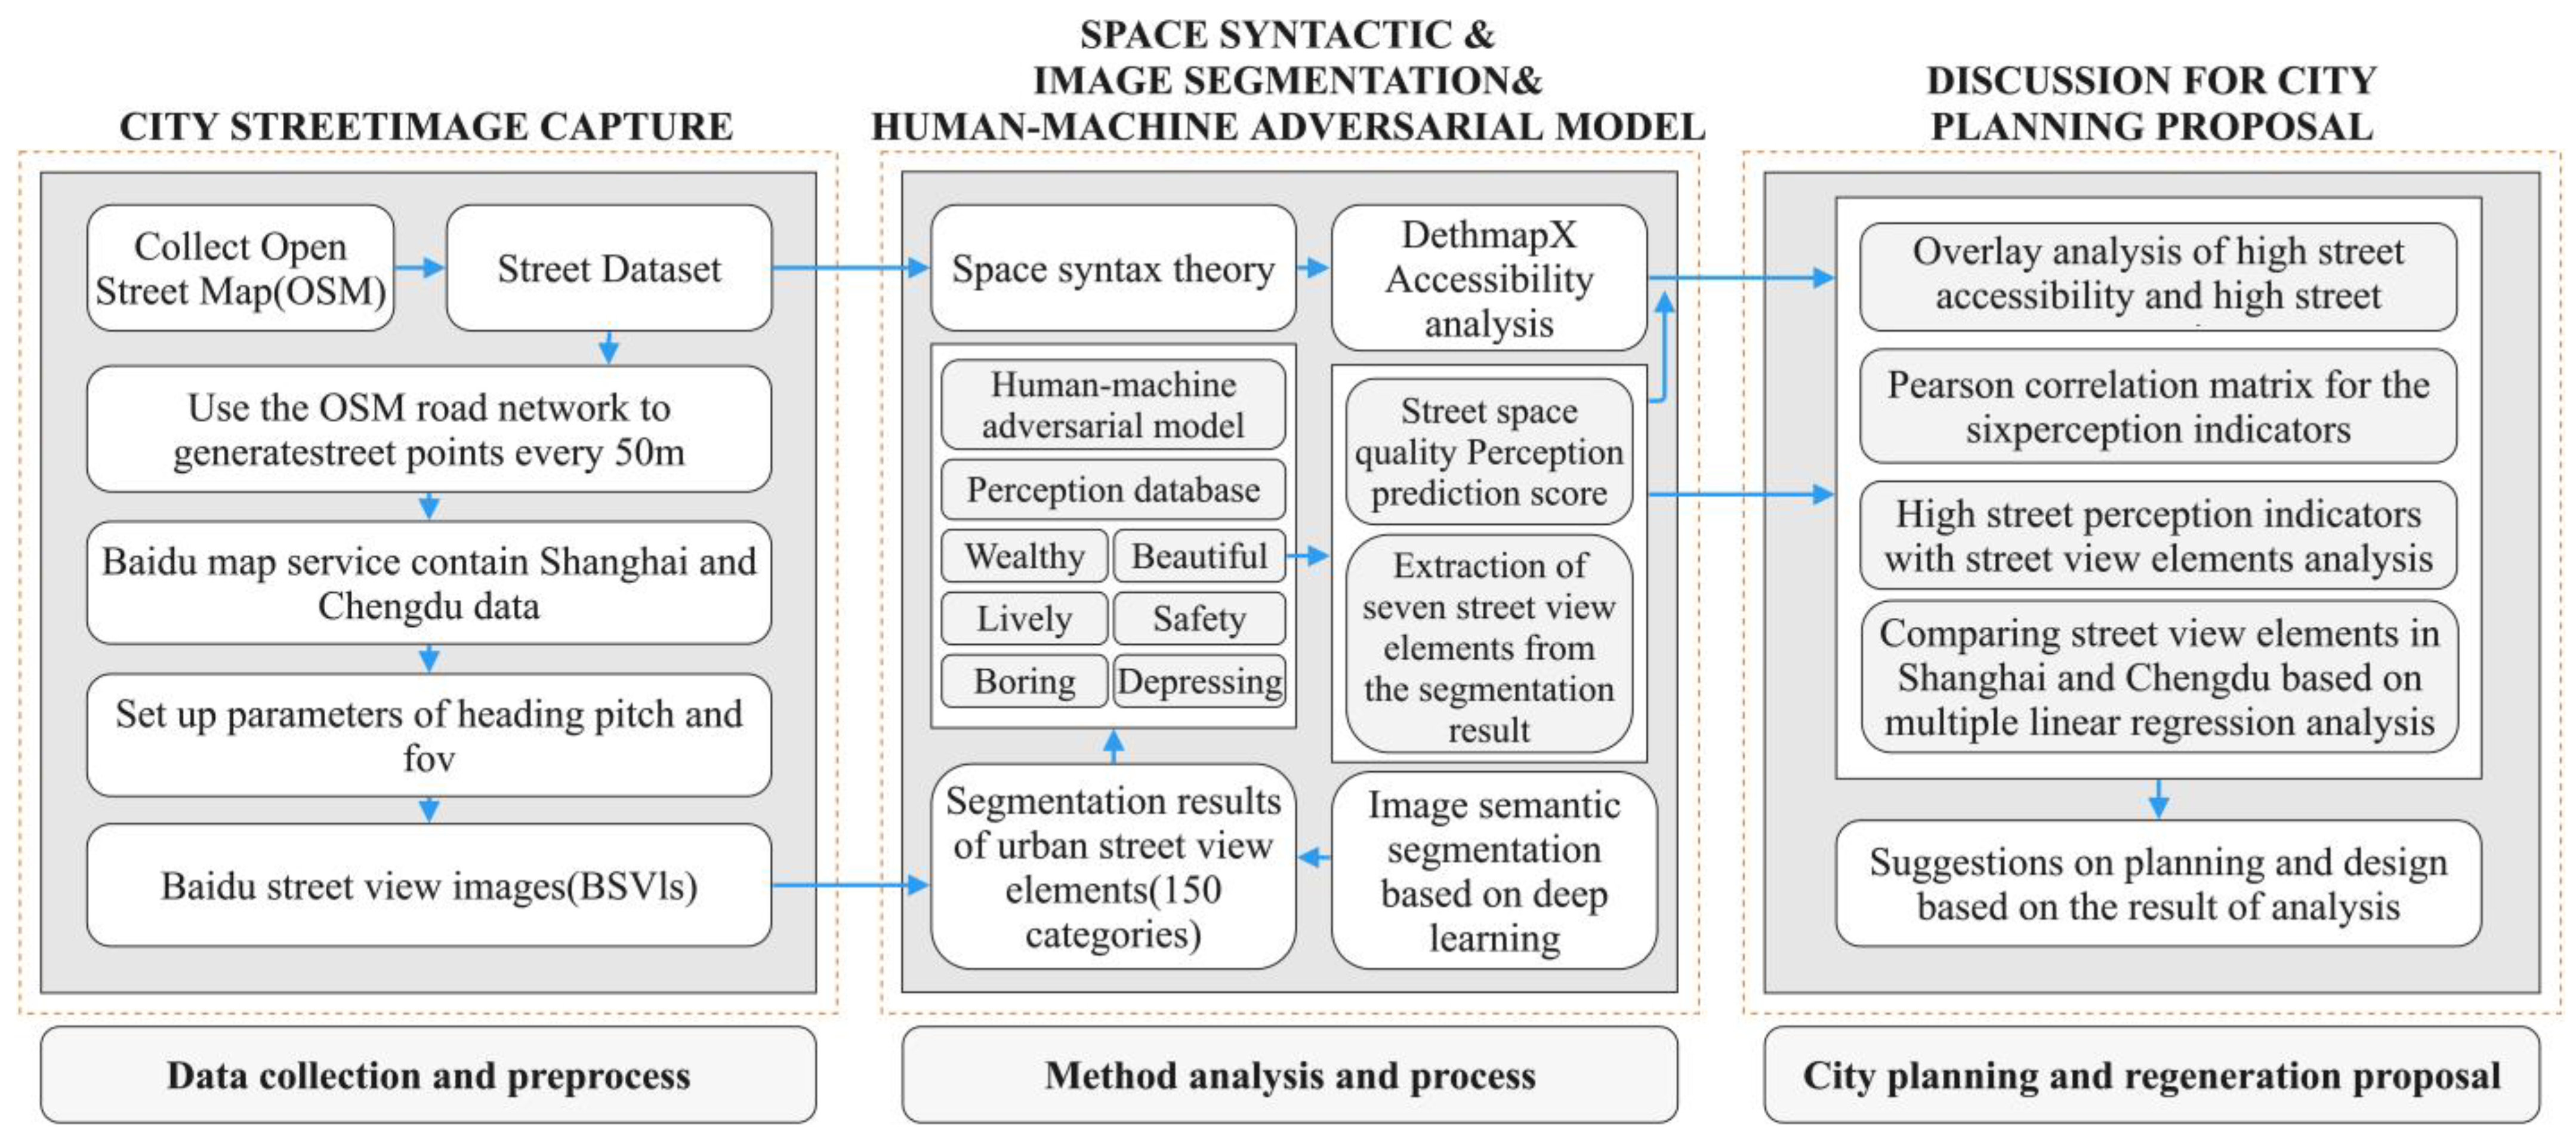
3.1. Research Framework
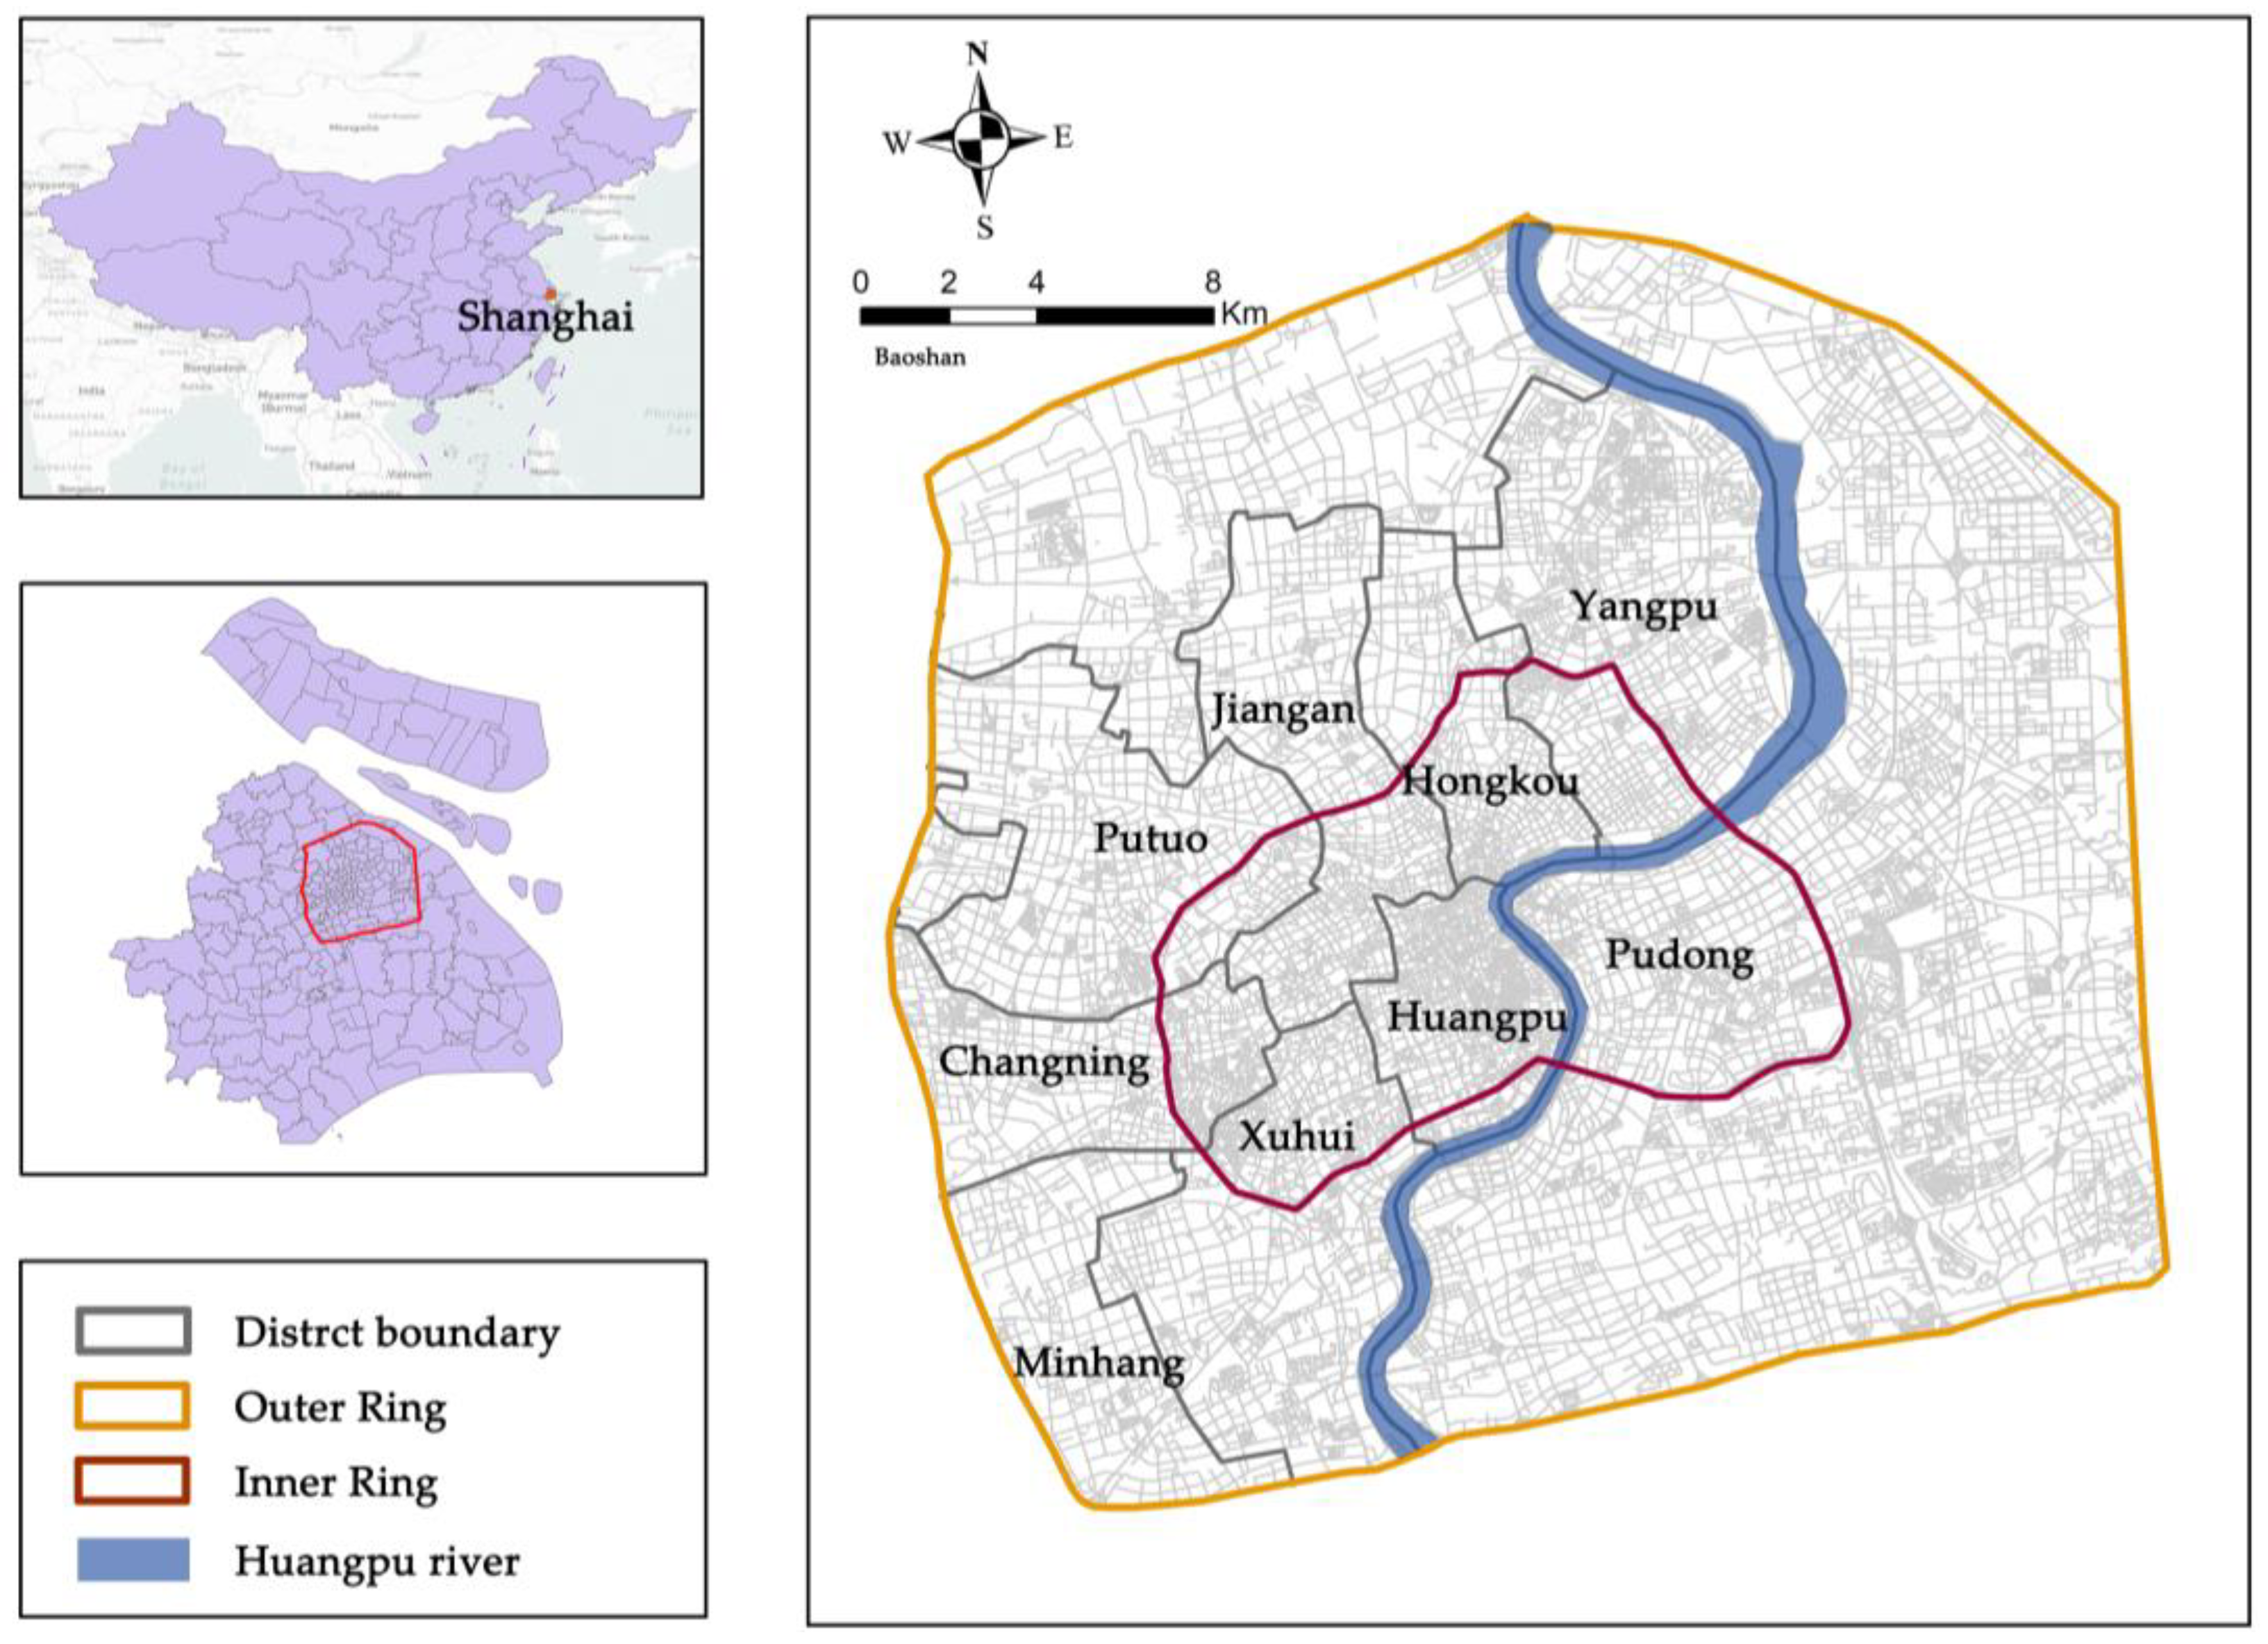
This research was divided into three main phases, as shown in Figure 1.
In the first phase, we collected street-view images of the study areas and used OpenStreetMap (OSM) to collect accurate data on the street network. In ArcGIS 10.4, street network data were used to generate street-view collection points at 50 m intervals. A Python program was then written to access the Baidu Maps API (BAPI 3.0) to collect Baidu Street View Images (BSVIs).
In the second stage, we evaluated the perception of street quality and accessibility in the study area. An image semantic segmentation neural network model was constructed using Python’s TensorFlow framework to fully segment BSVIs and extract street perception metrics. In addition, we used the space syntax method to process the urban street network to measure the pedestrian accessibility of each street with a 500 m accessibility radius (the average daily travel distance for urban residents in first-and second-tier cities in China was approximately 500 m) [28,29]. The top 20% of streets with the highest accessibility scores are designated as highest accessibility streets [12]. The BSVI data were then trained for perception scoring using a human-machine adversarial model. We invited volunteers with knowledge of the historical and cultural context of the study area to rate six perception indicators of urban street quality, and human-machine adversarial modelling predicted the remaining image perception scores. Since the volunteers’ perception scores differed from the model’s predictions, weighing the average of each volunteer’s scores as the final perception scores and visualizing the perception scores on a map was necessary. Pearson correlation analyses were performed on the six perception indicator scores to determine their relationships. Subsequently, we set safety, wealthy, lively, and beautiful as positive perceptions and boring and depressing as negative perceptions. The top 20% of streets with the highest positive perception scores were considered high-quality streets, and the top 20% with the most negative perception sores were considered low-quality streets [24]. Simultaneously, we performed a linear regression analysis on the street elements constituted by BSVIs to determine which street elements positively or negatively impacted the perception indicators.
In the third phase, we proposed to combine urban street quality perception and space syntax approaches. We used the streets with the highest accessibility overlaid with those with the highest scores on each of the six perception indicators to determine their space relationships. We identified the space distribution of highly accessible streets with quality perception to assist urban street planning.

3.2. Study Area

In this study, Shanghai and Chengdu were selected as study areas to evaluate and compare street quality perceptions based on the following criteria (Figure 2 and Figure 3). First, they are the most developed cities in China’s eastern and western regions, respectively, and their urban development processes have matured. In recent years, the municipal governments of Shanghai and Chengdu have implemented renewal policies to improve street infrastructure, environmental functions, the cityscape, and residents’ perceptions of well-being and safety. We need to evaluate urban street quality perception to investigate the relationship between changes in human perceptions and street renewal. In addition, the two cities have distinctive characteristics in terms of their geographical locations, spatial forms, functions, and urban development statuses. Shanghai is located in the southeastern coastal area, at the mouth of the Yangtze River, and the whole area is an impact plain facing the Pacific Ocean. Chengdu is located in the southwest inland, in the western part of the Sichuan Basin, surrounded by mountains.
Regarding space patterns, Shanghai belongs to the radial development type, while Chengdu belongs to single-center circle expansion development. Shanghai is China’s financial, trade, and shipping center regarding city functions and development status. At the same time, Chengdu is an essential center of the economy, science and technology, culture and innovation, and foreign communication, and is a transportation hub in the western region. It is known as the “Leisure Capital” [30]. The higher demands of urban development and the significant differences between the cities and their streets’ characteristics make them a suitable case for evaluating and comparing the perception of urban street quality. More importantly, Shanghai and Chengdu have abundant BSVIs, which can improve the accuracy of the study results. We selected the Outer Ring Road of Shanghai (665 Km2) and the Third Ring Road of Chengdu (270 Km2) as the study boundaries.

3.3. Data Collection and Processing

We selected 227,449 collection points in Shanghai and 85,299 in Chengdu and used Python and BAPI to obtain 909,796 street-view images in Shanghai and 341,140 street-view images in Chengdu.
To simulate the natural feeling of a human in the street space, we set the vertical angle (Pitch) at 20° and camera angles (FOV) at 0°, 90°, 180°, and 270° [28]. For each sampling point, we created a 360° panoramic street image by stitching together views from these four images (0–90°, 90–180°, 180–270°, and 270–360°). The maximum pixel dimensions for the images were set to 600 × 480 to ensure accessibility. An example of a downloaded street-view image is shown in Figure 4. To ensure the reliability of the overall evaluation of street quality, we conducted a final data cleaning to remove street-view images with invalid access.

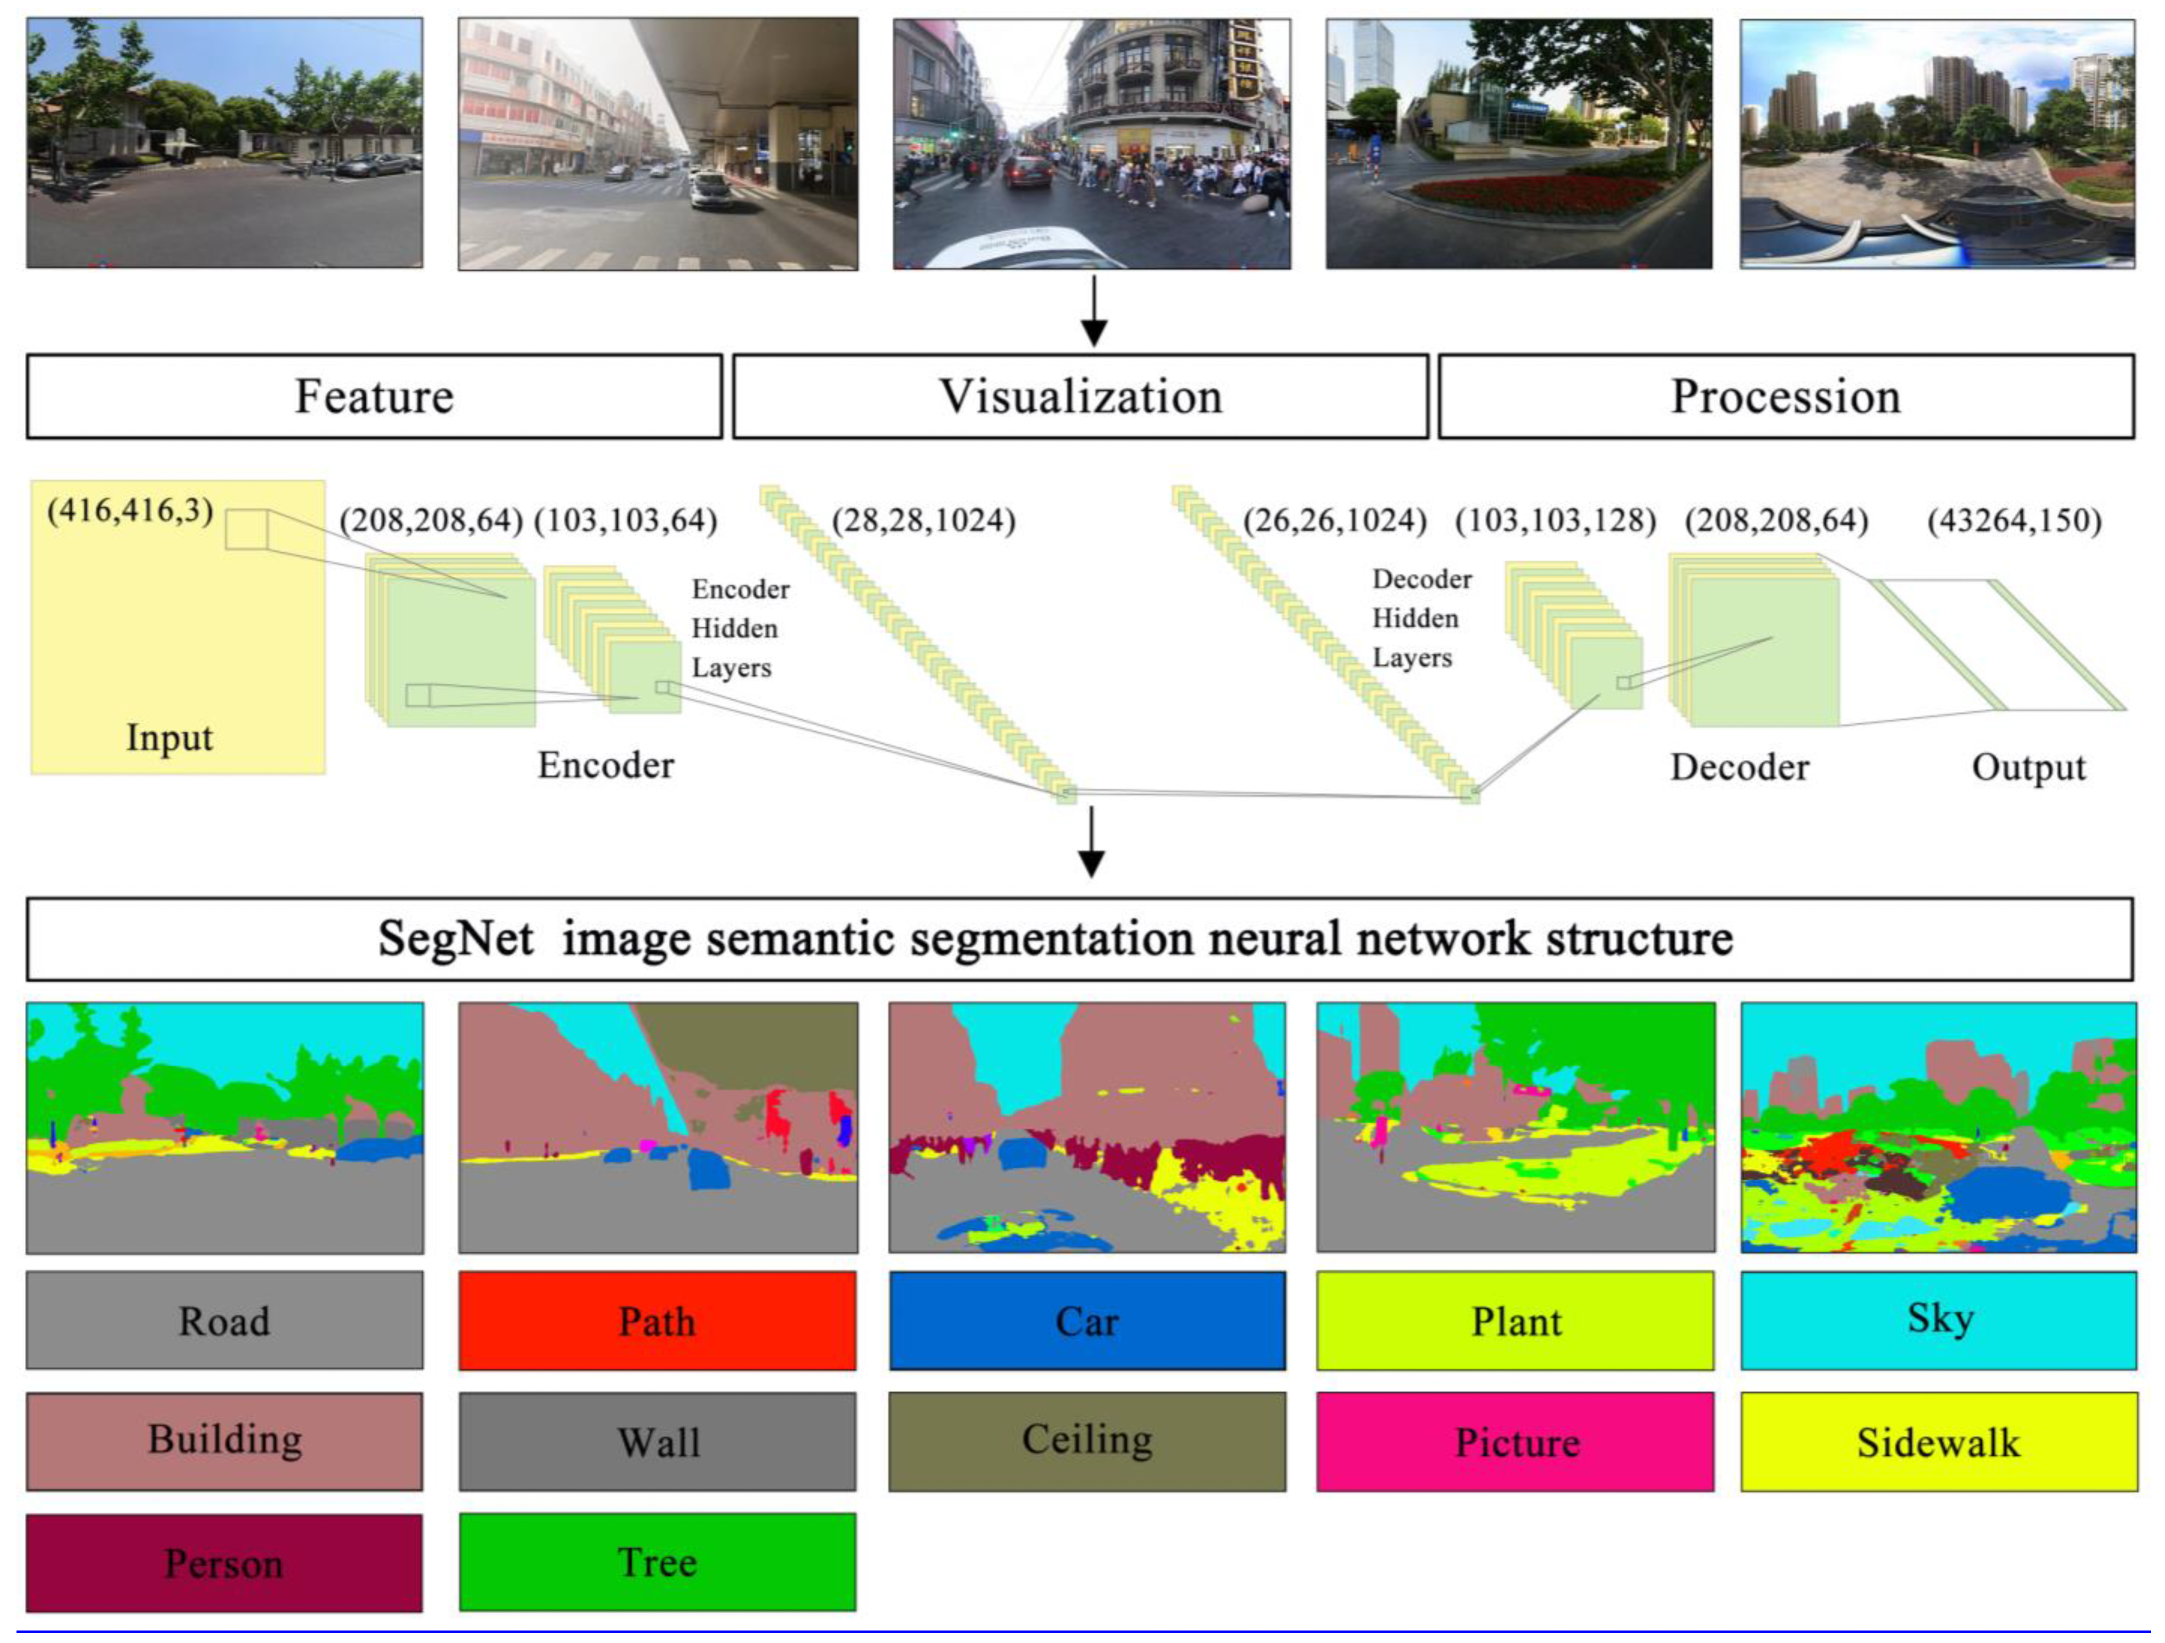
3.4. Deep Learning-Based Semantic Segmentation of Street-view Images

This study used an improved semantic image segmentation method based on the codec structure SegNet. This image segmentation method utilizes a convolutional neural network containing an encoder and a decoder. The neural network structure tested an image semantic segmentation task and achieved a pixel contrast accuracy of 79.73% for the training set and 67.68% for the test set. The ADE-20K dataset was used as the training dataset.
In the SegNet network structure, we used the Reshape function to resize images to a size of 416 × 416, and the image features have three dimensions of RGB. ZeroPadding2D is used to zero-pad the image two-dimensional (2D) matrix to indicate rows and columns, which allows better control of the feature image size and efficient extraction of the convolutional kernel. The convolutional kernel Conv2D is employed to extract features from input high-dimensional arrays. Normalization feature data using BatchNormalization accelerates gradient descent solutions, improves the network training speed, and increases the generalization ability. MaxPooling2D reduces image dimensions and neuronal parameters without sacrificing image features. UpSampling2D is used to restore the original image size. The encoder reshapes the image to a size of 208 × 208. Softmax calculates a specific semantic classification probability for each pixel across 150 categories. The code used in this article can be downloaded from GitHub (https://github.com/CSAILVision/semantic-segmentation-pytorch accessed on 22 January 2024).
Figure 5 shows the original BSVIs and the results of the segmented street elements. The bottom color matrix represents the segmentation semantics corresponding to the extracted street elements. The process of image semantic segmentation using SegNet is also illustrated through a multilevel representation of the neural network structure, including the codec neural network feature size (“Feature Shape”), a visual representation of the neural network structure (“Visualization”), and image processing (“Procession”) [24].

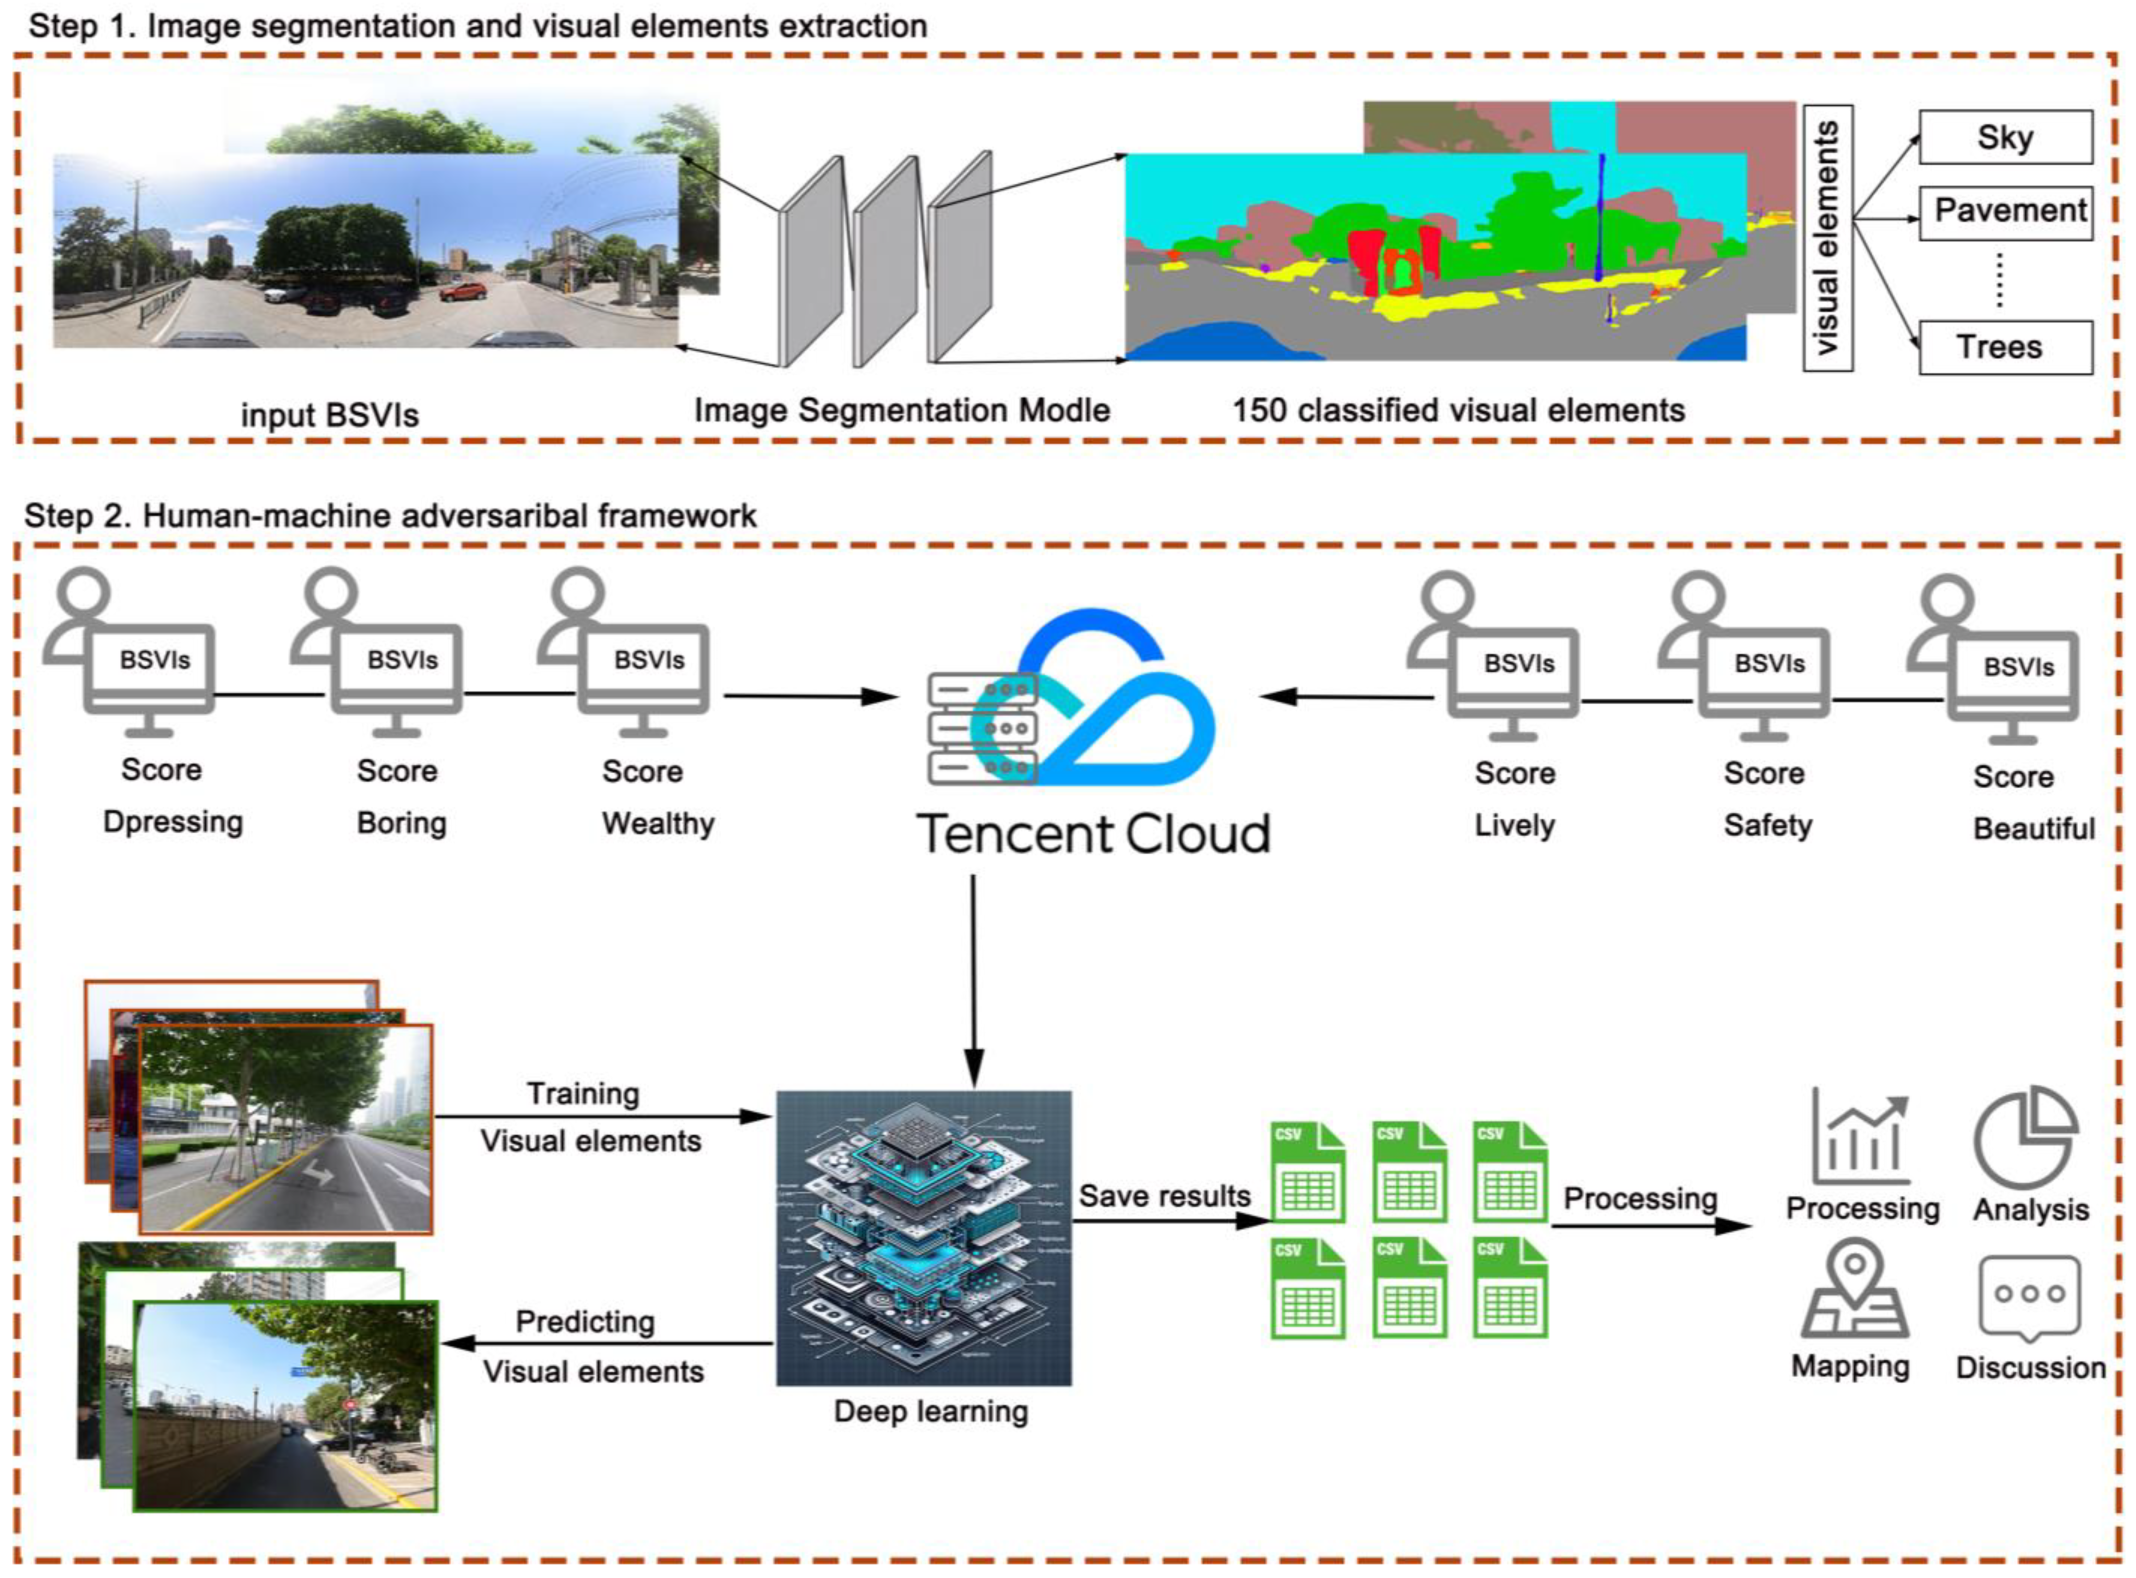
3.5. Simulating Urban Streets Quality Perception Using Human-Machine Adversarial Model

To accommodate the scoring process (volunteers scoring a small number of street-view images), the human-machine adversarial model creates a dataset that will be applied with an ensemble learning algorithm named random forest (RF). In the RF algorithm, the bootstrapping process randomly selects two-thirds of the samples for data fitting or categorization, and the remaining one-third is defined as out-of-bag (OOB) data, which are used to assess the overall model error and the significance of identifying variables. To calculate the importance of the input variable X j in the nth random tree, a regression tree model t n is constructed using the autonomously extracted sample data to compute the range of prediction errors for the OOB data, and the observations are randomly returned to the variable X j . The model t n was then reconstructed, and the OOB data prediction errors were calculated after the displacement variable was observed. After processing the prediction errors for the OOB data, the average of the results was used to represent the importance of the variable X j in the nth randomized tree, as shown in Equation (1) [25].
V l n ( X j ) = i = 1 N O O B l [ f ( X i ) = f n ( X i ) ] i = 1 N O O B I f ( X i ) = f n ( X i ) / N O O B b ± b 2 4 a c 2 a
This study uses the six perception indicators adopted by MIT in the “Place Pulse” program: beautiful, safety, lively, wealthy, boring, and depressing [8]. These six indicators refine human perception and provide a detailed picture of urban street quality perception. A high or low score on each perception indicator reflects the user’s perceived recognition, with higher ratings indicating stronger perceptions. We categorized these six perception indicators into positive and negative spatial perceptions and adopted a human-scale perceptual perspective to assess street quality.
Volunteers accessed the human-computer adversarial model through the Tencent Cloud server, and they first used the human-computer adversarial model to score each of the six perception indicators, with scores ranging from 0 to 5, with higher scores indicating greater consistency with the perception indicators. Following previous scholars’ criteria for scoring time in image experiments, we required that each image be displayed on the screen for 15 s, a period during which the volunteer could perceive the image in depth [25]. We used randomized order for image extraction scoring, which can somewhat reduce the dataset error. Each volunteer rated 100 street-view images, and the model recorded the results. The RF dataset was then created, and starting with the 101st street-view image, the model predicted the volunteer’s perceived score based on the relationship between the volunteer’s previous score and the corresponding street elements (Figure 6).
We performed a Pearson correlation coefficient on the perception results of these six indicators, using covariance and standard deviation to define the correlation coefficient between the two variables, as shown in Equation (2).
ρ X , Y = c o ν ( X , Y ) σ X σ Y = E [ ( X μ X ) ( Y μ Y ) ] σ X σ Y
Estimating the covariance and standard deviation of the sample, we can calculate the Pearson correlation coefficient ( ρ ) and ( r ).
r = i = 1 n X i X Y i Y i = 1 n X i X 2 i = 1 n Y i Y 2
A linear regression model was used to study the relationship between street elements and six perception indicators. The proportion of street-view elements in the top 20% of high-score streets for each of the six perception indicators was weighted and averaged. The percentage of street element area for each perceptual indicator can provide recommendations for the study area during urban street renewal. Figure 6 presents a schematic diagram of the evaluation process of urban street quality using the human-machine adversarial model.

3.6. Overlay Analysis of Street Accessibility Measure and Perception Indicators

This study evaluates urban street accessibility based on the advantages of the segmented model. OMS road network data were used as the raw data for space syntax, but since they are very complex, there is a possibility of inaccurate accessibility calculation. For this reason, it is necessary to add buffer zones for roads in ArcGIS, extract centerlines from the buffer zones to establish a new road network, and, finally, process them into interconnected and topologically structured road centerlines after road merging, simplification, and topology checking to ensure that Equation (4) can make an accurate calculation of accessibility.
C i = p n 1 q n d p q ( i ) d p q
C i is the accessibility value of space i . d p q refers to the shortest path from space p to space q . d p q ( i ) denotes the shortest path between spaces p and q containing space i ( p < q , p = 1, 2, 3..., n − 1, q = 2, 3, 4..., n). We used DepthmapX to visualize street accessibility, which was applied to compute various street scales in the city. Then, the top 20% of streets with the highest accessibility in the study areas and the top 20% of street views for each perception indicator were overlaid in ArcGIS to obtain data for streets that were both highly accessible and had high street quality perception scores for particular perception indicators [12].

4. Results and Discussion

4.1. Human–Machine Training Accuracy

To split the dataset, 66.7% of the data scored by the volunteers were used for training, while the remaining 33.3% were used for testing. The precision for the street quality perception of Shanghai was 74%, the recall was 69%, the F1-score was 70%, the accuracy was 73%, and the OOB error was 33%. The precision for the street quality perception of Chengdu was 86%, the recall was 85%, the F1-score was 86%, the accuracy was 86%, and the OOB error was 22%. Table 1 and Table 2 present a higher perception of boring, beautiful, and lively among our volunteers, which may represent a stronger subjectivity towards boring, beautiful, and lively.

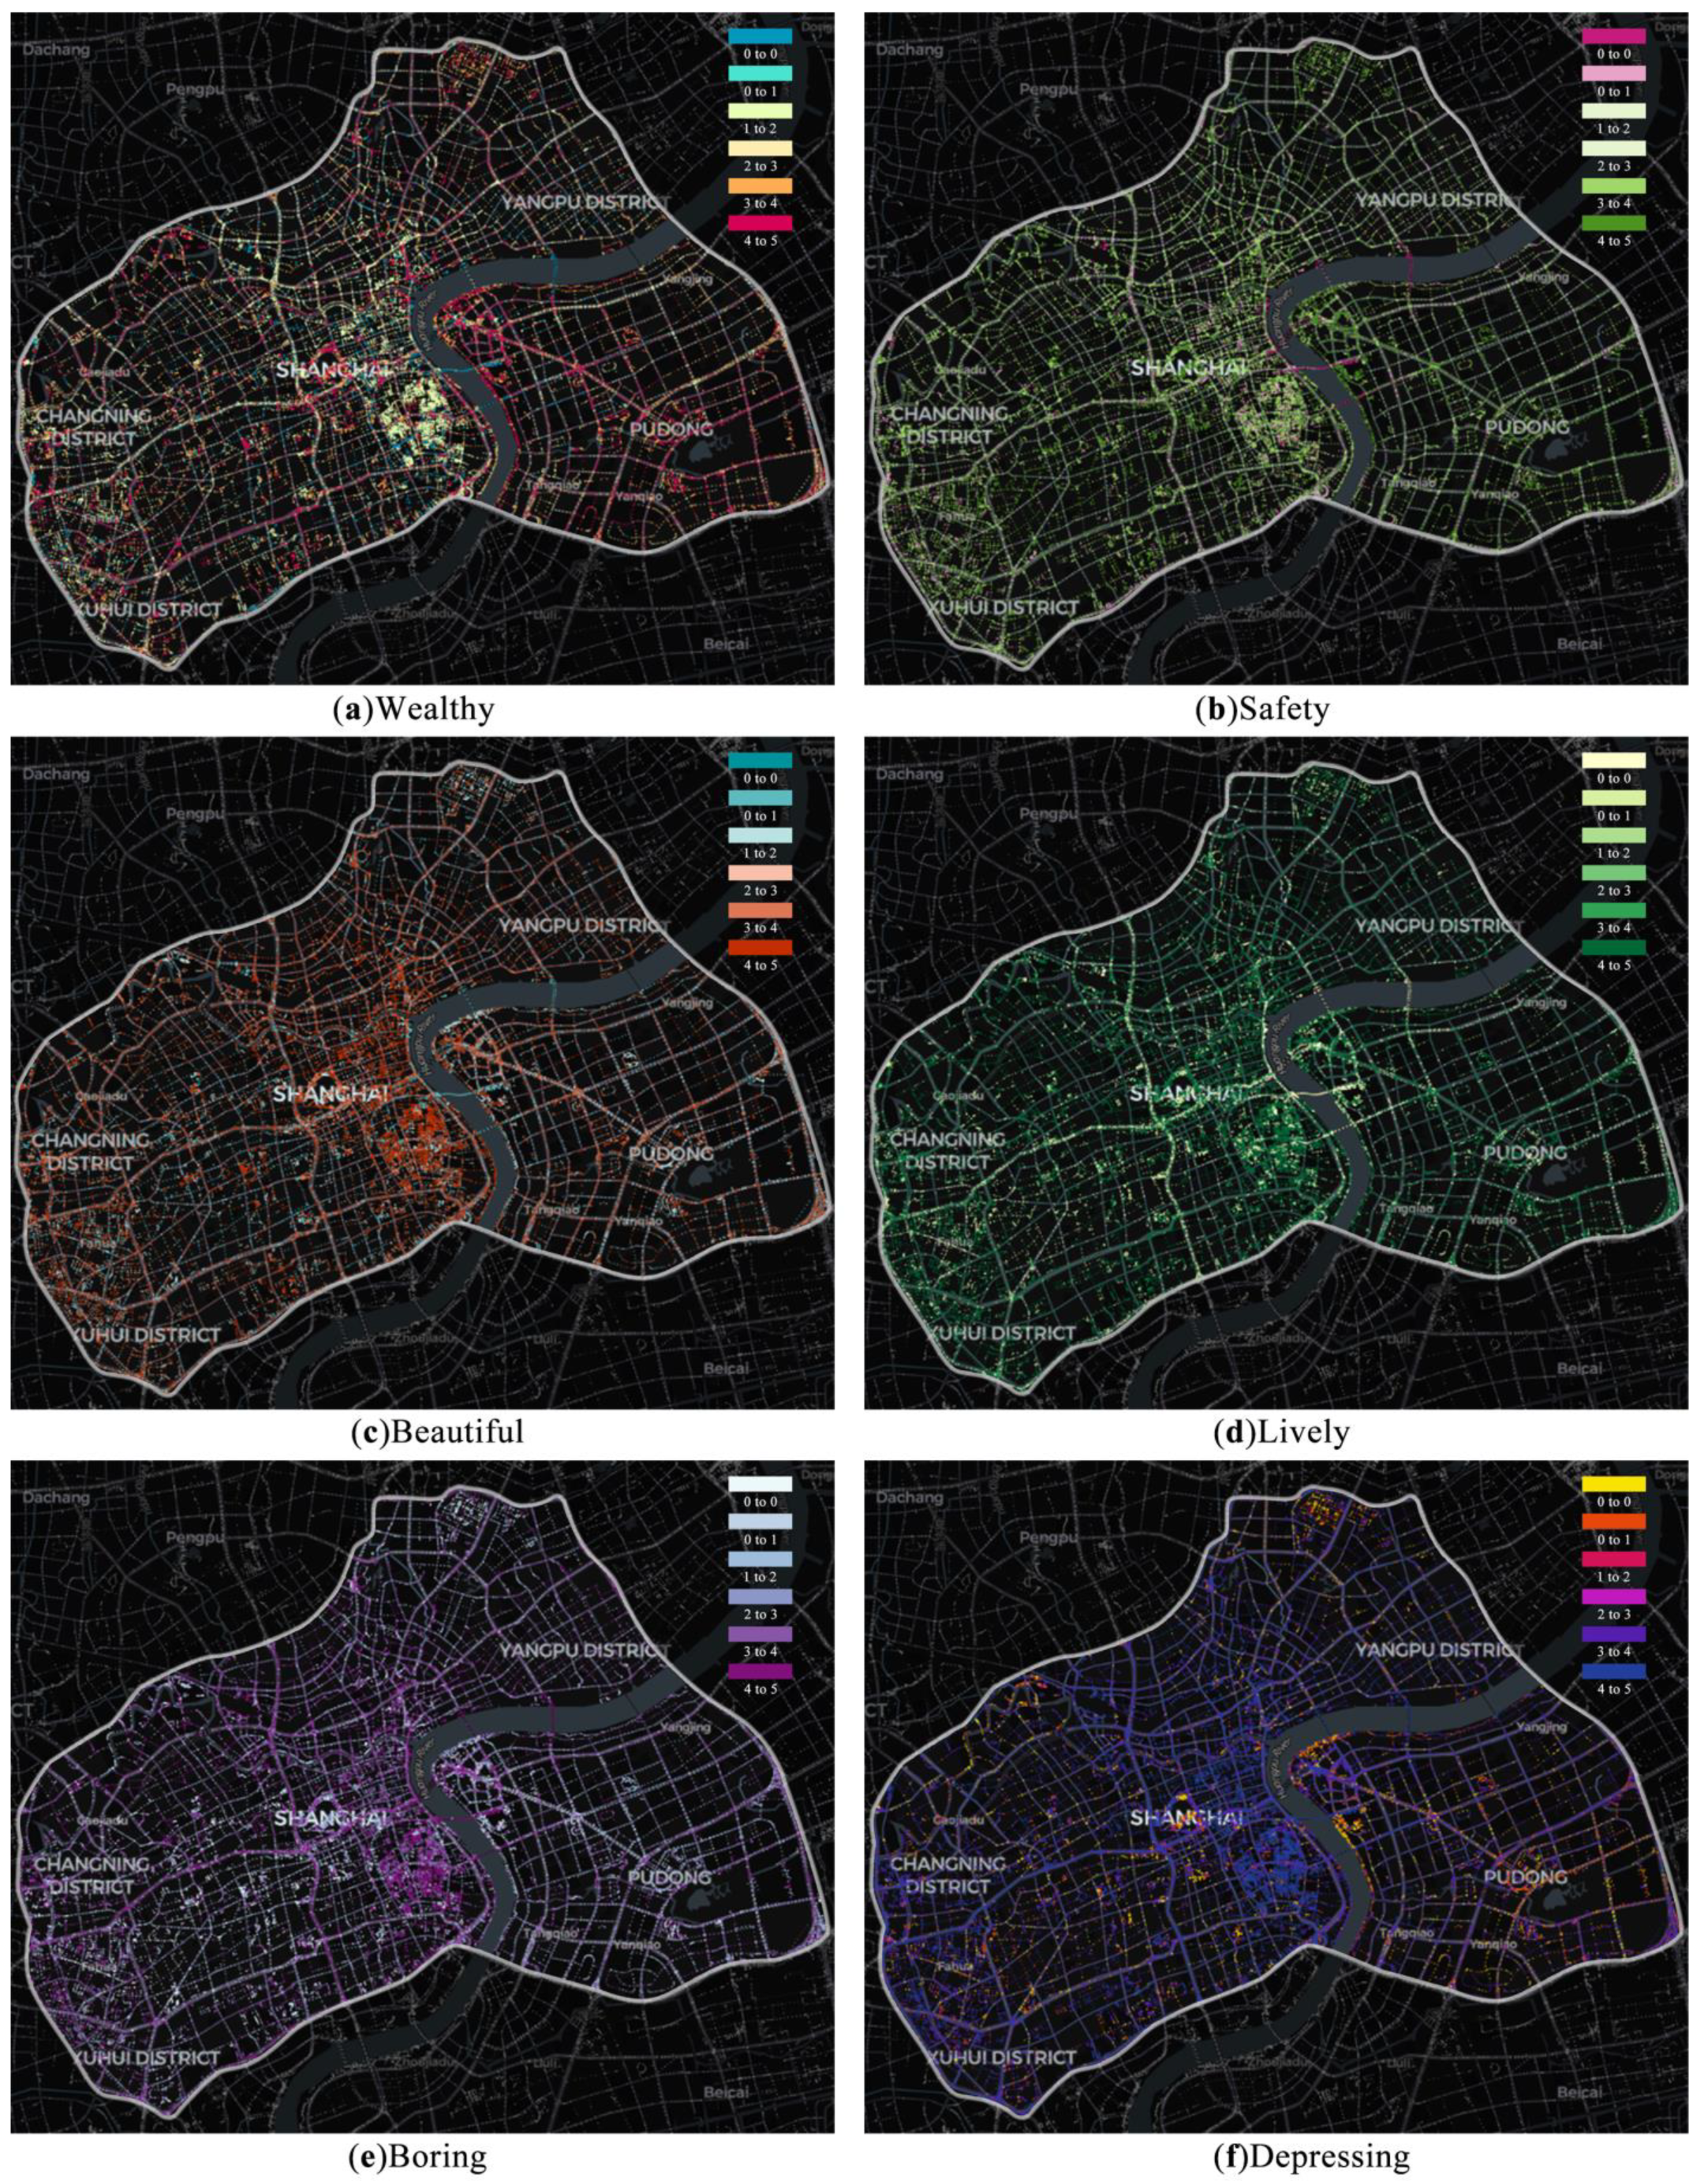
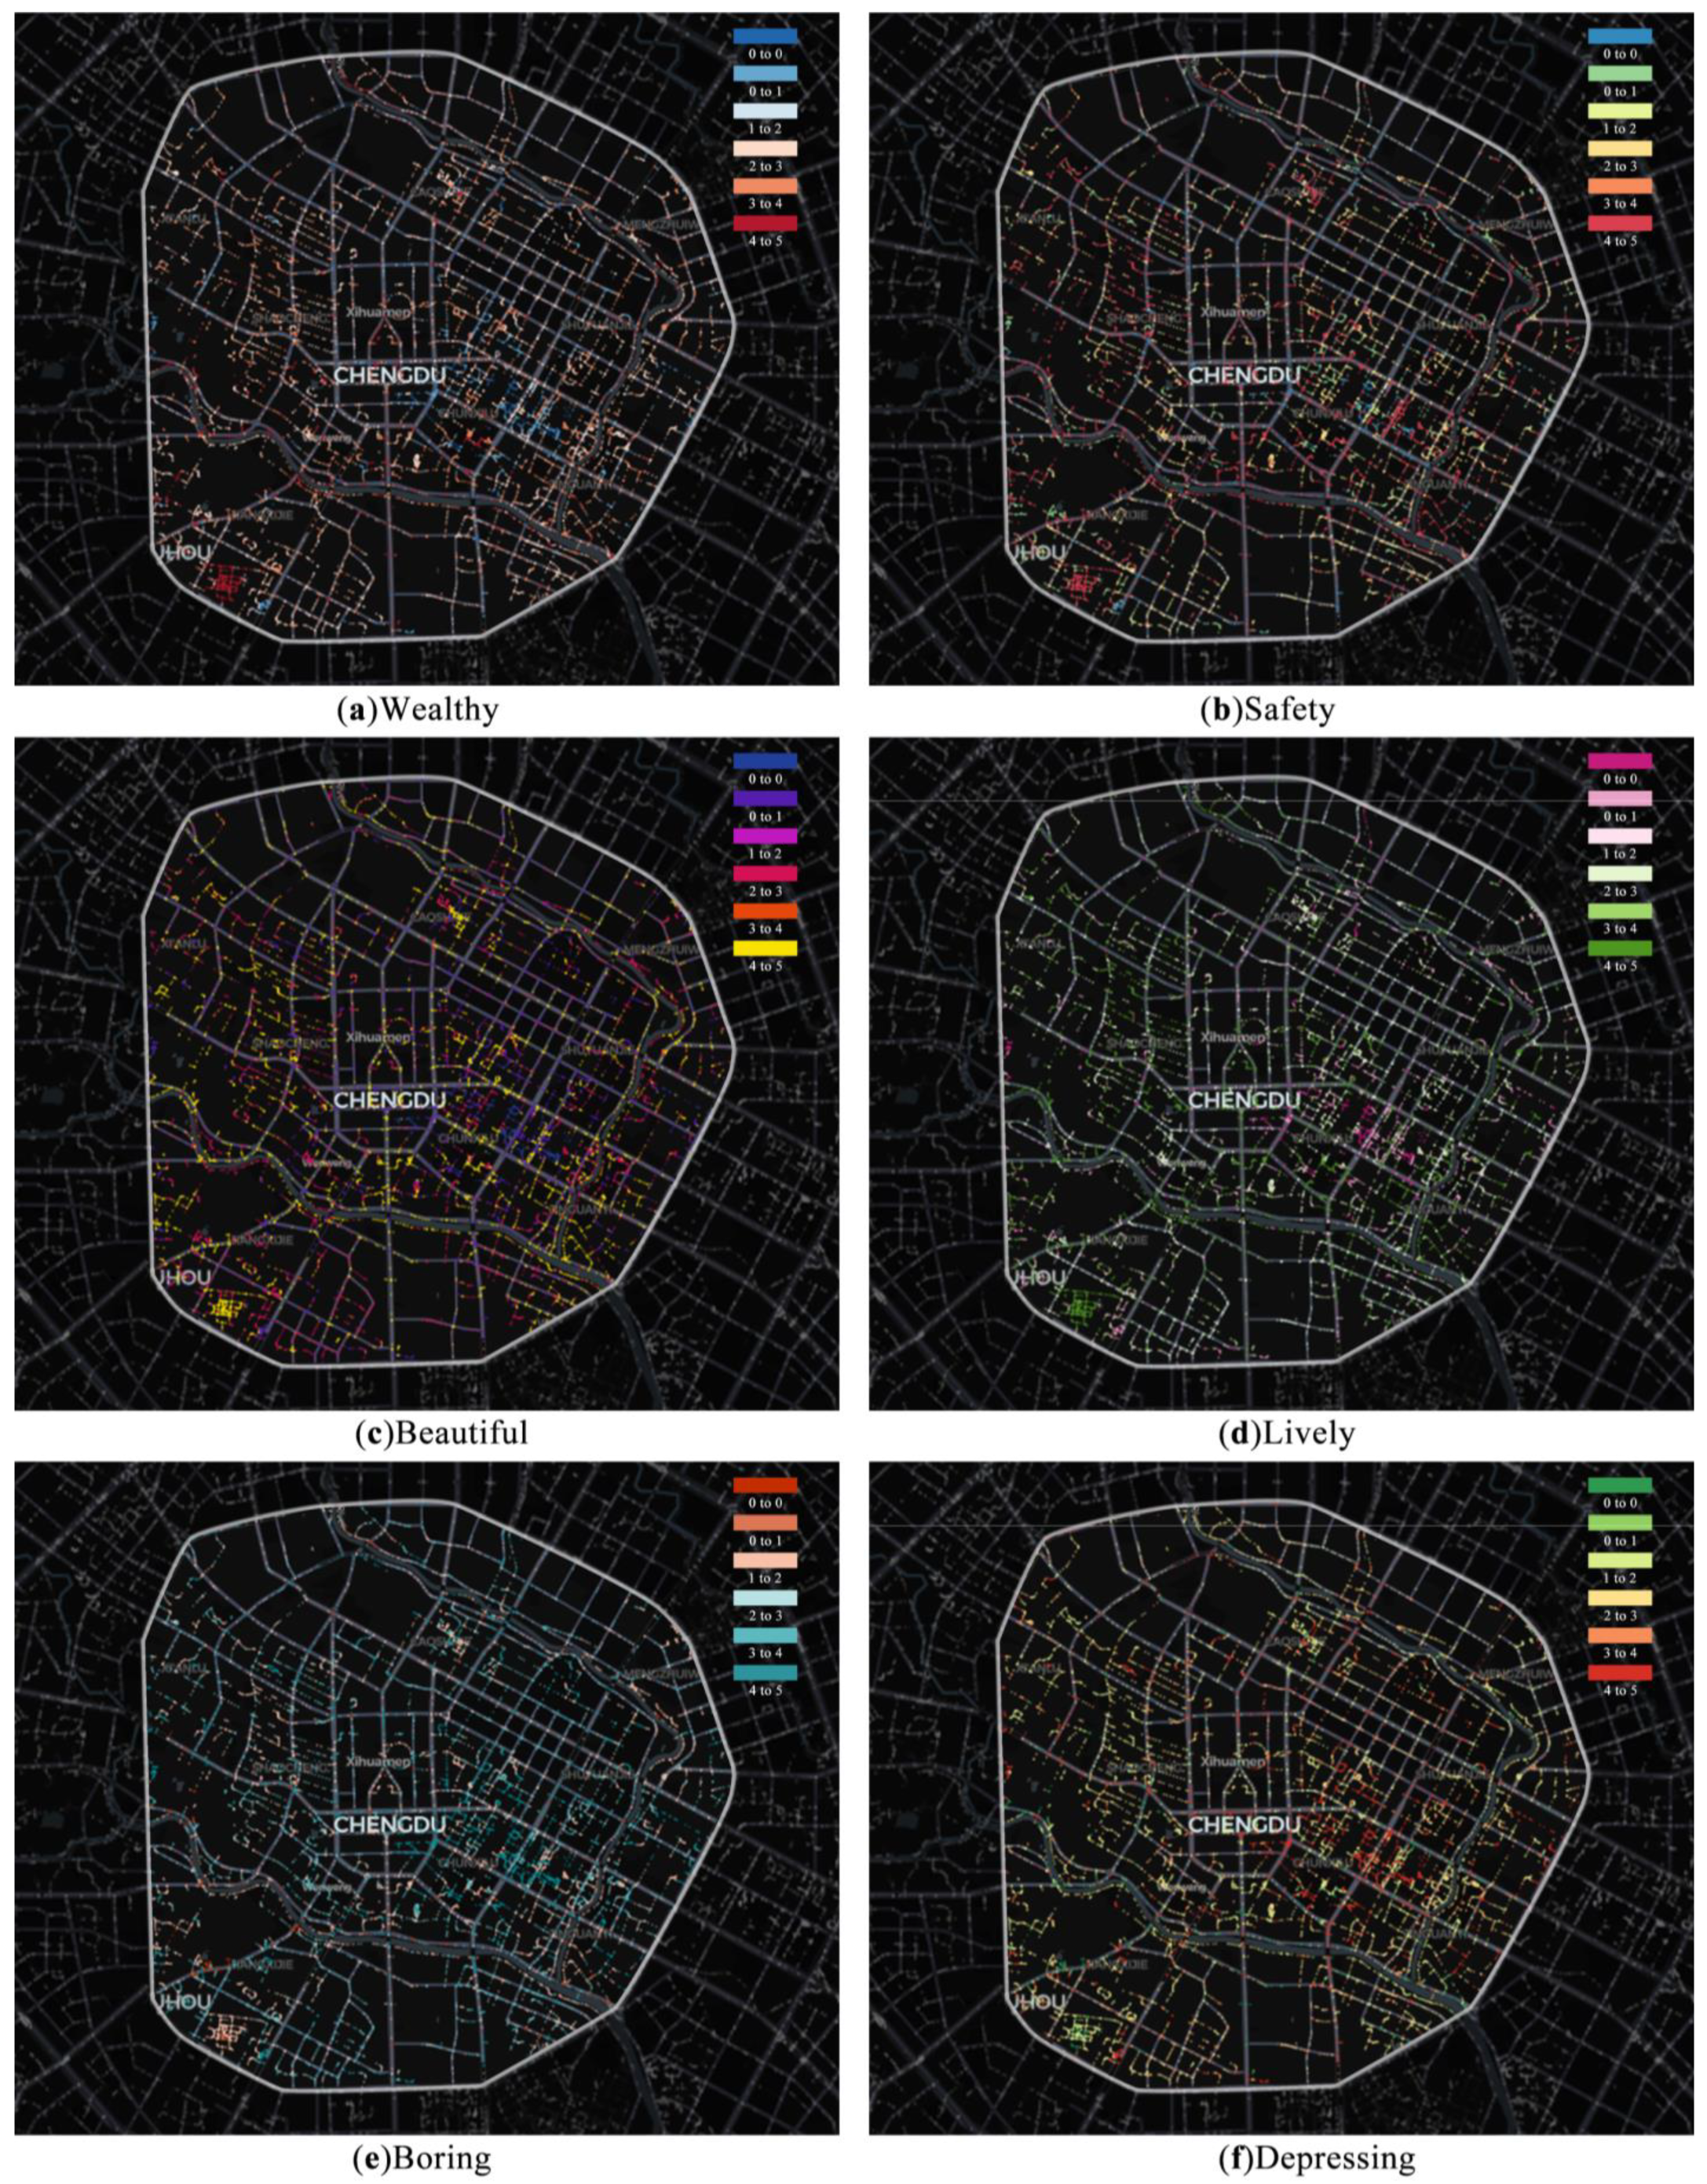
4.2. Analyzing and Comparing Street Quality and Distribution Based on BSVIs

The 20 volunteers’ perception scores of street quality based on the RF for each of the six perception indicators were averaged (Figure 7 and Figure 8). Overall, Chengdu streets have a higher average positive perception score (2.84) than Shanghai (2.58). High positive perception score (4–5) street locations accounted for 35.77% of the total in Chengdu and 26.48% in Shanghai.
Shanghai received relatively high scores in perceptions of wealthy (2.92), safety (2.98), and lively (2.68), which indicates that, as the financial center of China, Shanghai boasts significant economic advantages, dense population flow, and more modern facilities (as well as a more substantial police presence). Thus, it is reasonable that perceptions of wealthy, safety, and lively are evoked simultaneously. However, compared to the perception scores for wealthy, safety, and lively, the beautiful perception scores are relatively low, which may be related to Shanghai’s overall planning and urban functional layout. Shanghai’s highly wealthy streets by perception are distributed polycentrally, mainly clustered in Huaihai Middle Road, East Nanjing Road, the Lujiazui Financial Center, and along the Huangpu River within the Inner Ring Road, the Zhangjiang Hi-Tech Park in the southeast, and the Jiangwan New City in the north. Lively perception and safety perception are distributed along the skeleton of the urban road network, showing the spatial distribution characteristics of being denser within the Inner Ring Road and gradually decreasing from the Inner Ring Road to the Outer Ring Road. Huangpu District, within the Inner Ring Road, is rich in cultural and natural landscapes, making the street beautiful. The perception score is high, and spatial distribution is concentrated. On the boring (3.78) and depressing (3.07) scores, the street quality in Shanghai is low. The highly depressing and boring perceptions are mainly distributed on the old town branch roads within the Inner Ring Road and the city’s main roads, which may be due to the many old houses, old building facades, and narrow roads. In addition, to solve traffic congestion, Shanghai has built nearly 200 km of highways in the city over the past 20 years, most of which are viaduct roads that undoubtedly provide unprecedented convenience for urban transportation. Still, at the same time, these urban main roads are built in a more homogenous way and inevitably become massive cuts across urban fabric [31]. The above may be the main reason for highly depressing and boring perceptions.
Chengdu has received high perception scores in beautiful (2.97), safety (2.91), and lively (2.90), indicating that Chengdu, with its unique geographical location, abundant natural resources, rich cultural heritage, perfect infrastructure, and relatively relaxed development environment, creates a pleasant and relaxing atmosphere for people. The lower wealthy perception score (2.56) compared to the beautiful, safety, and lively perception scores may be due to the lower overall economic level of the Western Region compared to the developed Eastern Region, and this regional difference may lead to the perception that Chengdu as relatively less wealthy. High perceptions of beautiful, safety, and lively are mainly distributed along the rivers and the Third Ring Road, with several clusters centered on the Sandong Ancient Bridge Park, the Wangjiang Campus of Sichuan University, and Chengdu University of Technology. High depressing and boring perceptions were widely distributed, but no areas of large-scale clustering were apparent. Specifically, the highly depressing perception is evenly distributed along the road network skeleton, especially on the First Ring Road, the Second Ring Road, and the city’s main roads, with an overall radioactive spatial distribution characteristic. High boring perceptions are evenly distributed along the city’s branch roads. It is worth noting that compared to Shanghai, where high depressing perceptions and boring perceptions are common in the vicinity of viaduct roads, Chengdu received low depressing perceptions and low boring perceptions in the northern and western parts of the Third Ring Road because designers and city administrators renewed and remodeled these spaces accordingly.

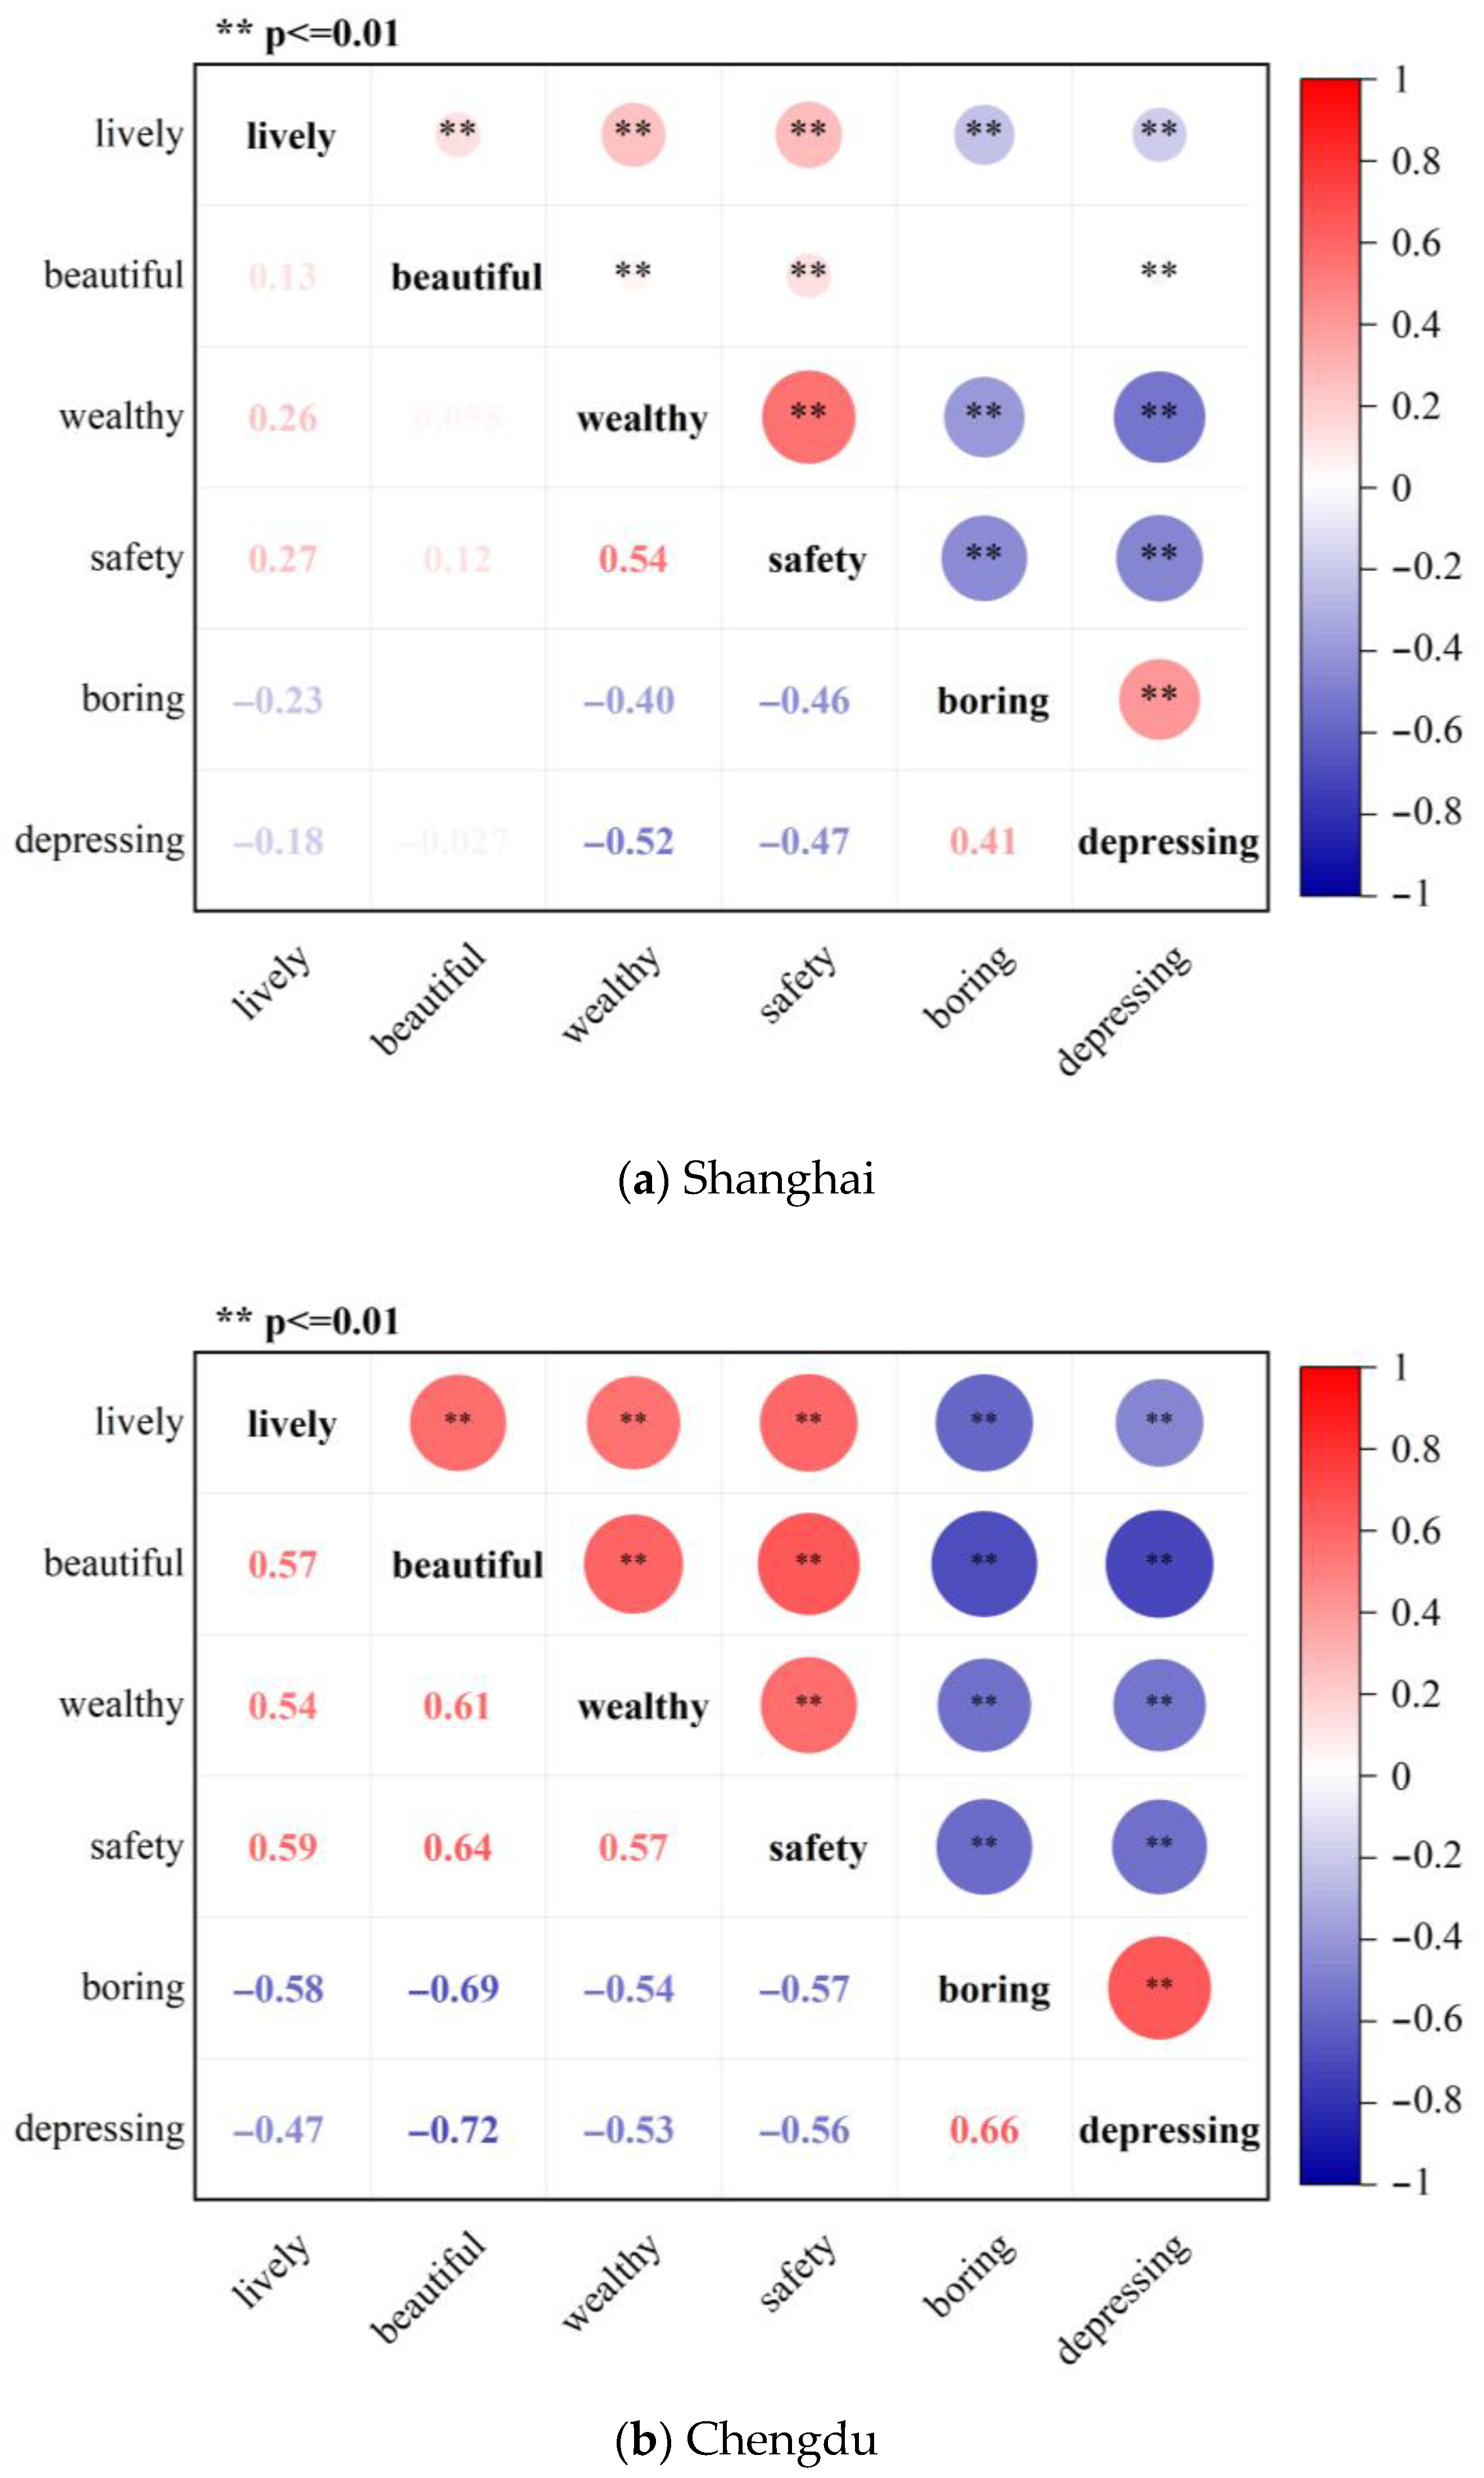
4.3. Correlation Analysis for the Perception Indicators

Figure 9 presents the Pearson correlation coefficient of the six perception indicators for Shanghai and Chengdu. The analysis shows a strong positive correlation between being beautiful and wealthy and being safe and lively, which suggests that the development model of Shanghai and Chengdu has shifted from pursuing high economic growth to high-quality development. This development strategy is reflected in the construction of high-quality streets. For example, the correlation coefficient between beautiful and lively in Shanghai is 0.13 (p < 0.01), and the correlation coefficient between beautiful and lively in Chengdu is 0.54 (p < 0.01), which suggests that Shanghai and Chengdu have each generated a lively and beautiful atmosphere in their street spaces. The strongest positive correlation between wealthy and safety was 0.541 (p < 0.01) in Shanghai. The strongest positive correlation between beautiful and safety in Chengdu was 0.64 (p < 0.01). A consistent and robust negative correlation exists between depressing, boring, lively, wealthy, and safety in Shanghai and Chengdu. The strongest negative correlation was found between depressing and wealthy in Shanghai (−0.52, p < 0.01), and the strongest negative correlation existed between depressing and beautiful in Chengdu (−0.72, p < 0.01). There was no correlation between beautiful and boring in Shanghai (0.001, p > 0.05).

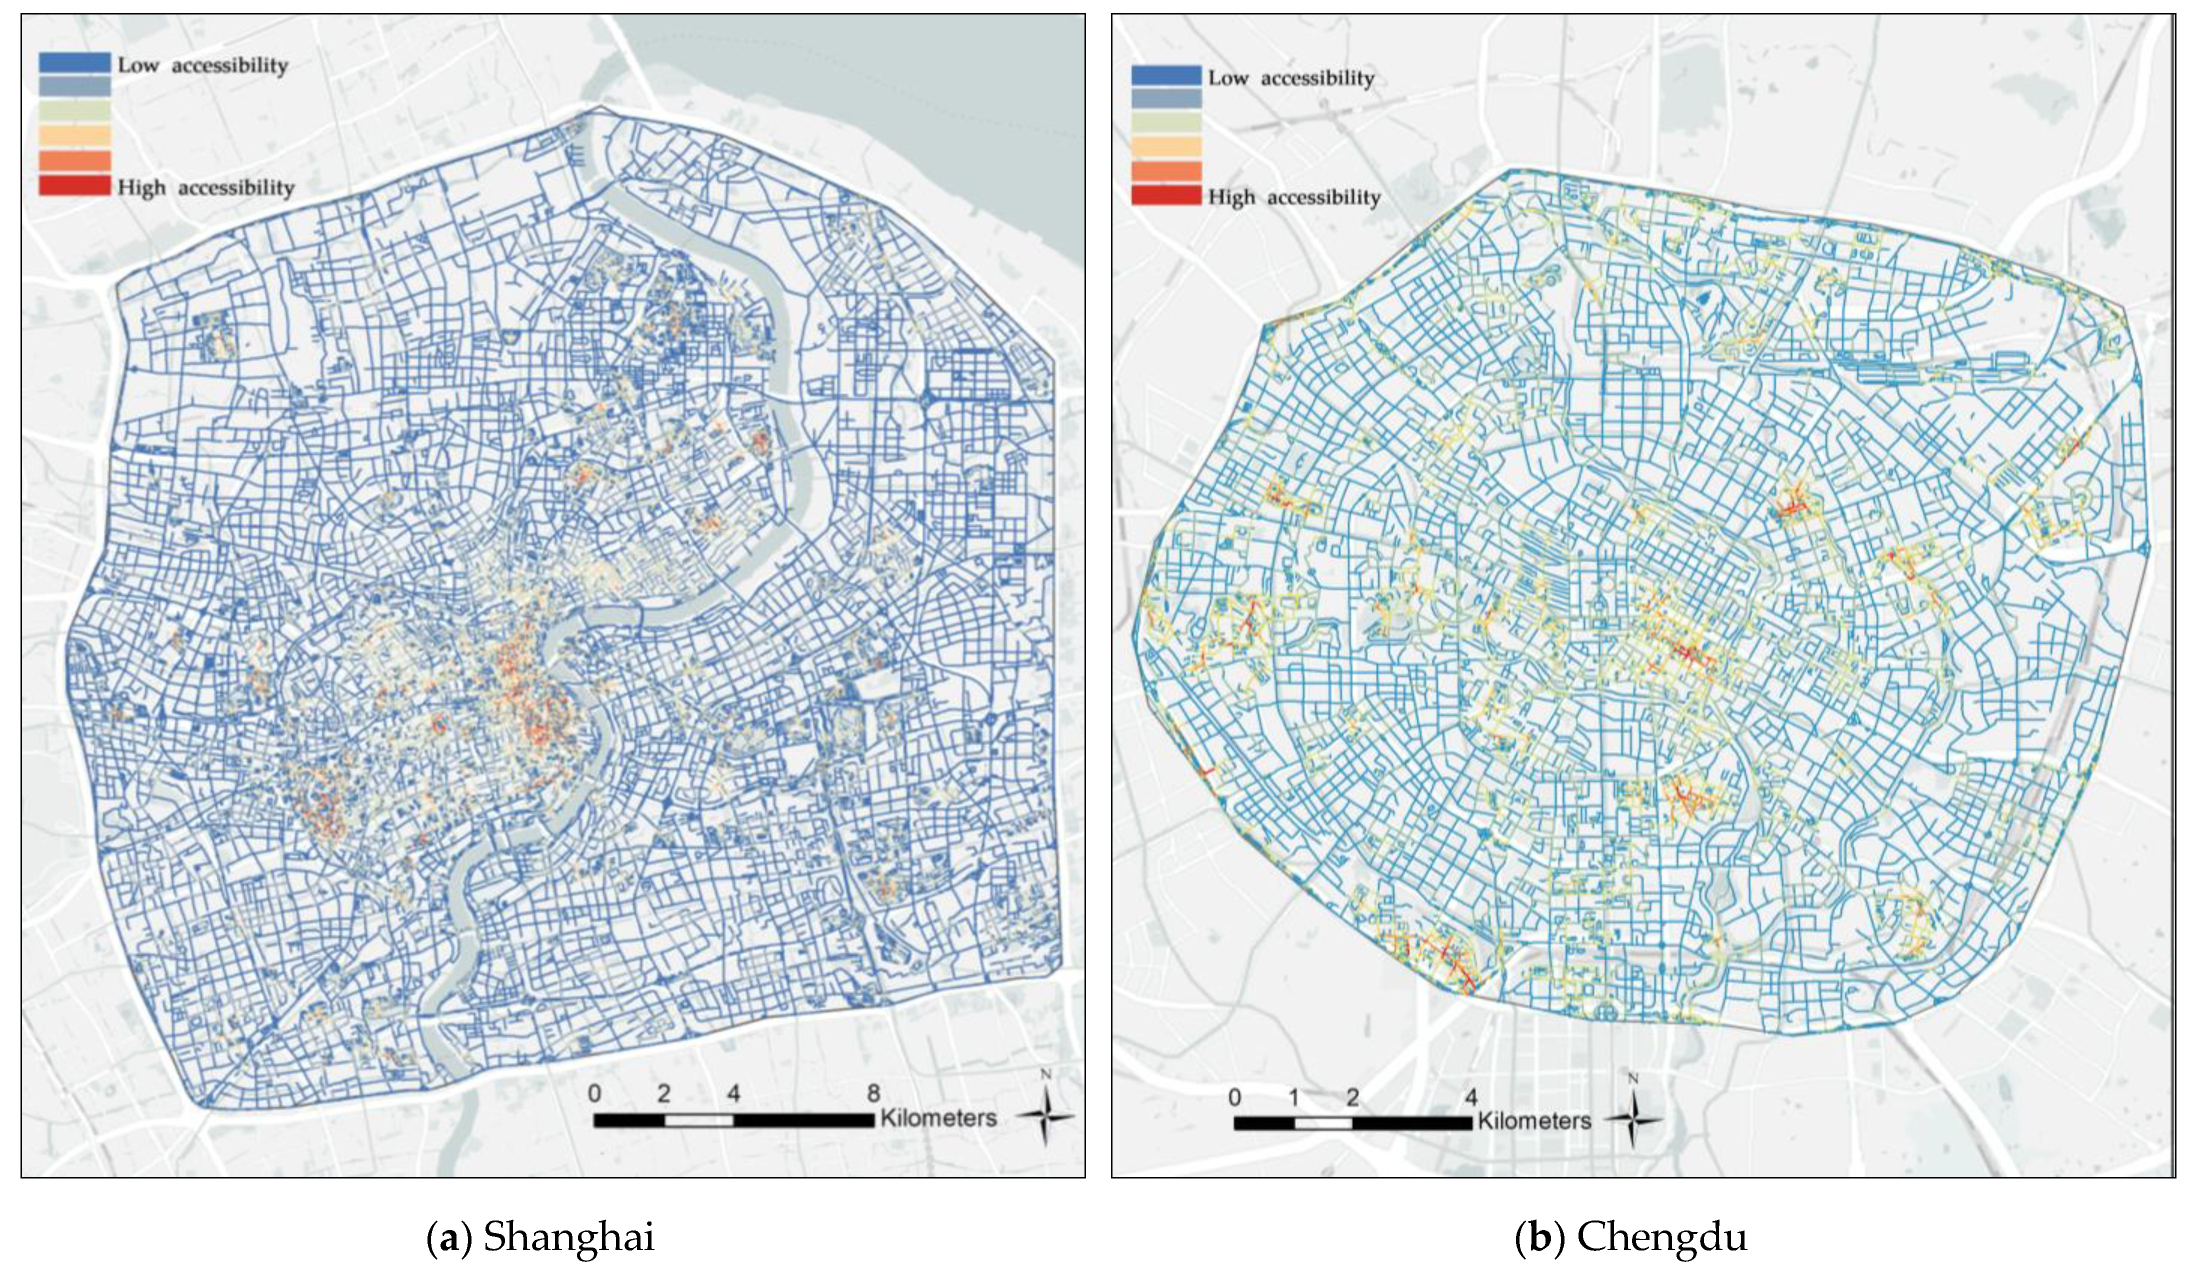
4.4. The Accessibility Analysis Based on the Space Syntax

Figure 10 demonstrates street accessibility based on a distance radius of 500 m, with higher accessibility in blue and lower accessibility in red. Shanghai’s highly accessible streets are mainly located in Huangpu District within the Inner Ring Road (near Huaihai Road and Nanjing East Road), the northeast (Jiangwan New Town), and parts of the southwest (Xujiahui business circle). Lower accessibility near the Outer Ring Road connects the central city to the highway network of neighboring cities over a considerable distance. Chengdu’s highly accessible streets are mainly located within the First Ring Road and along the Third Ring Road, and clustered around Chunxi Road, Wangjiang Campus of Sichuan University, University of Electronic Science and Technology, Shahe City Park, and Hesketh Sports Park, near Xinle Road. Most of Chengdu’s low-accessibility streets are between the First Ring Road and Second Ring Road, an area with outdated environments, a relatively complex street and road network, and a low degree of integration.

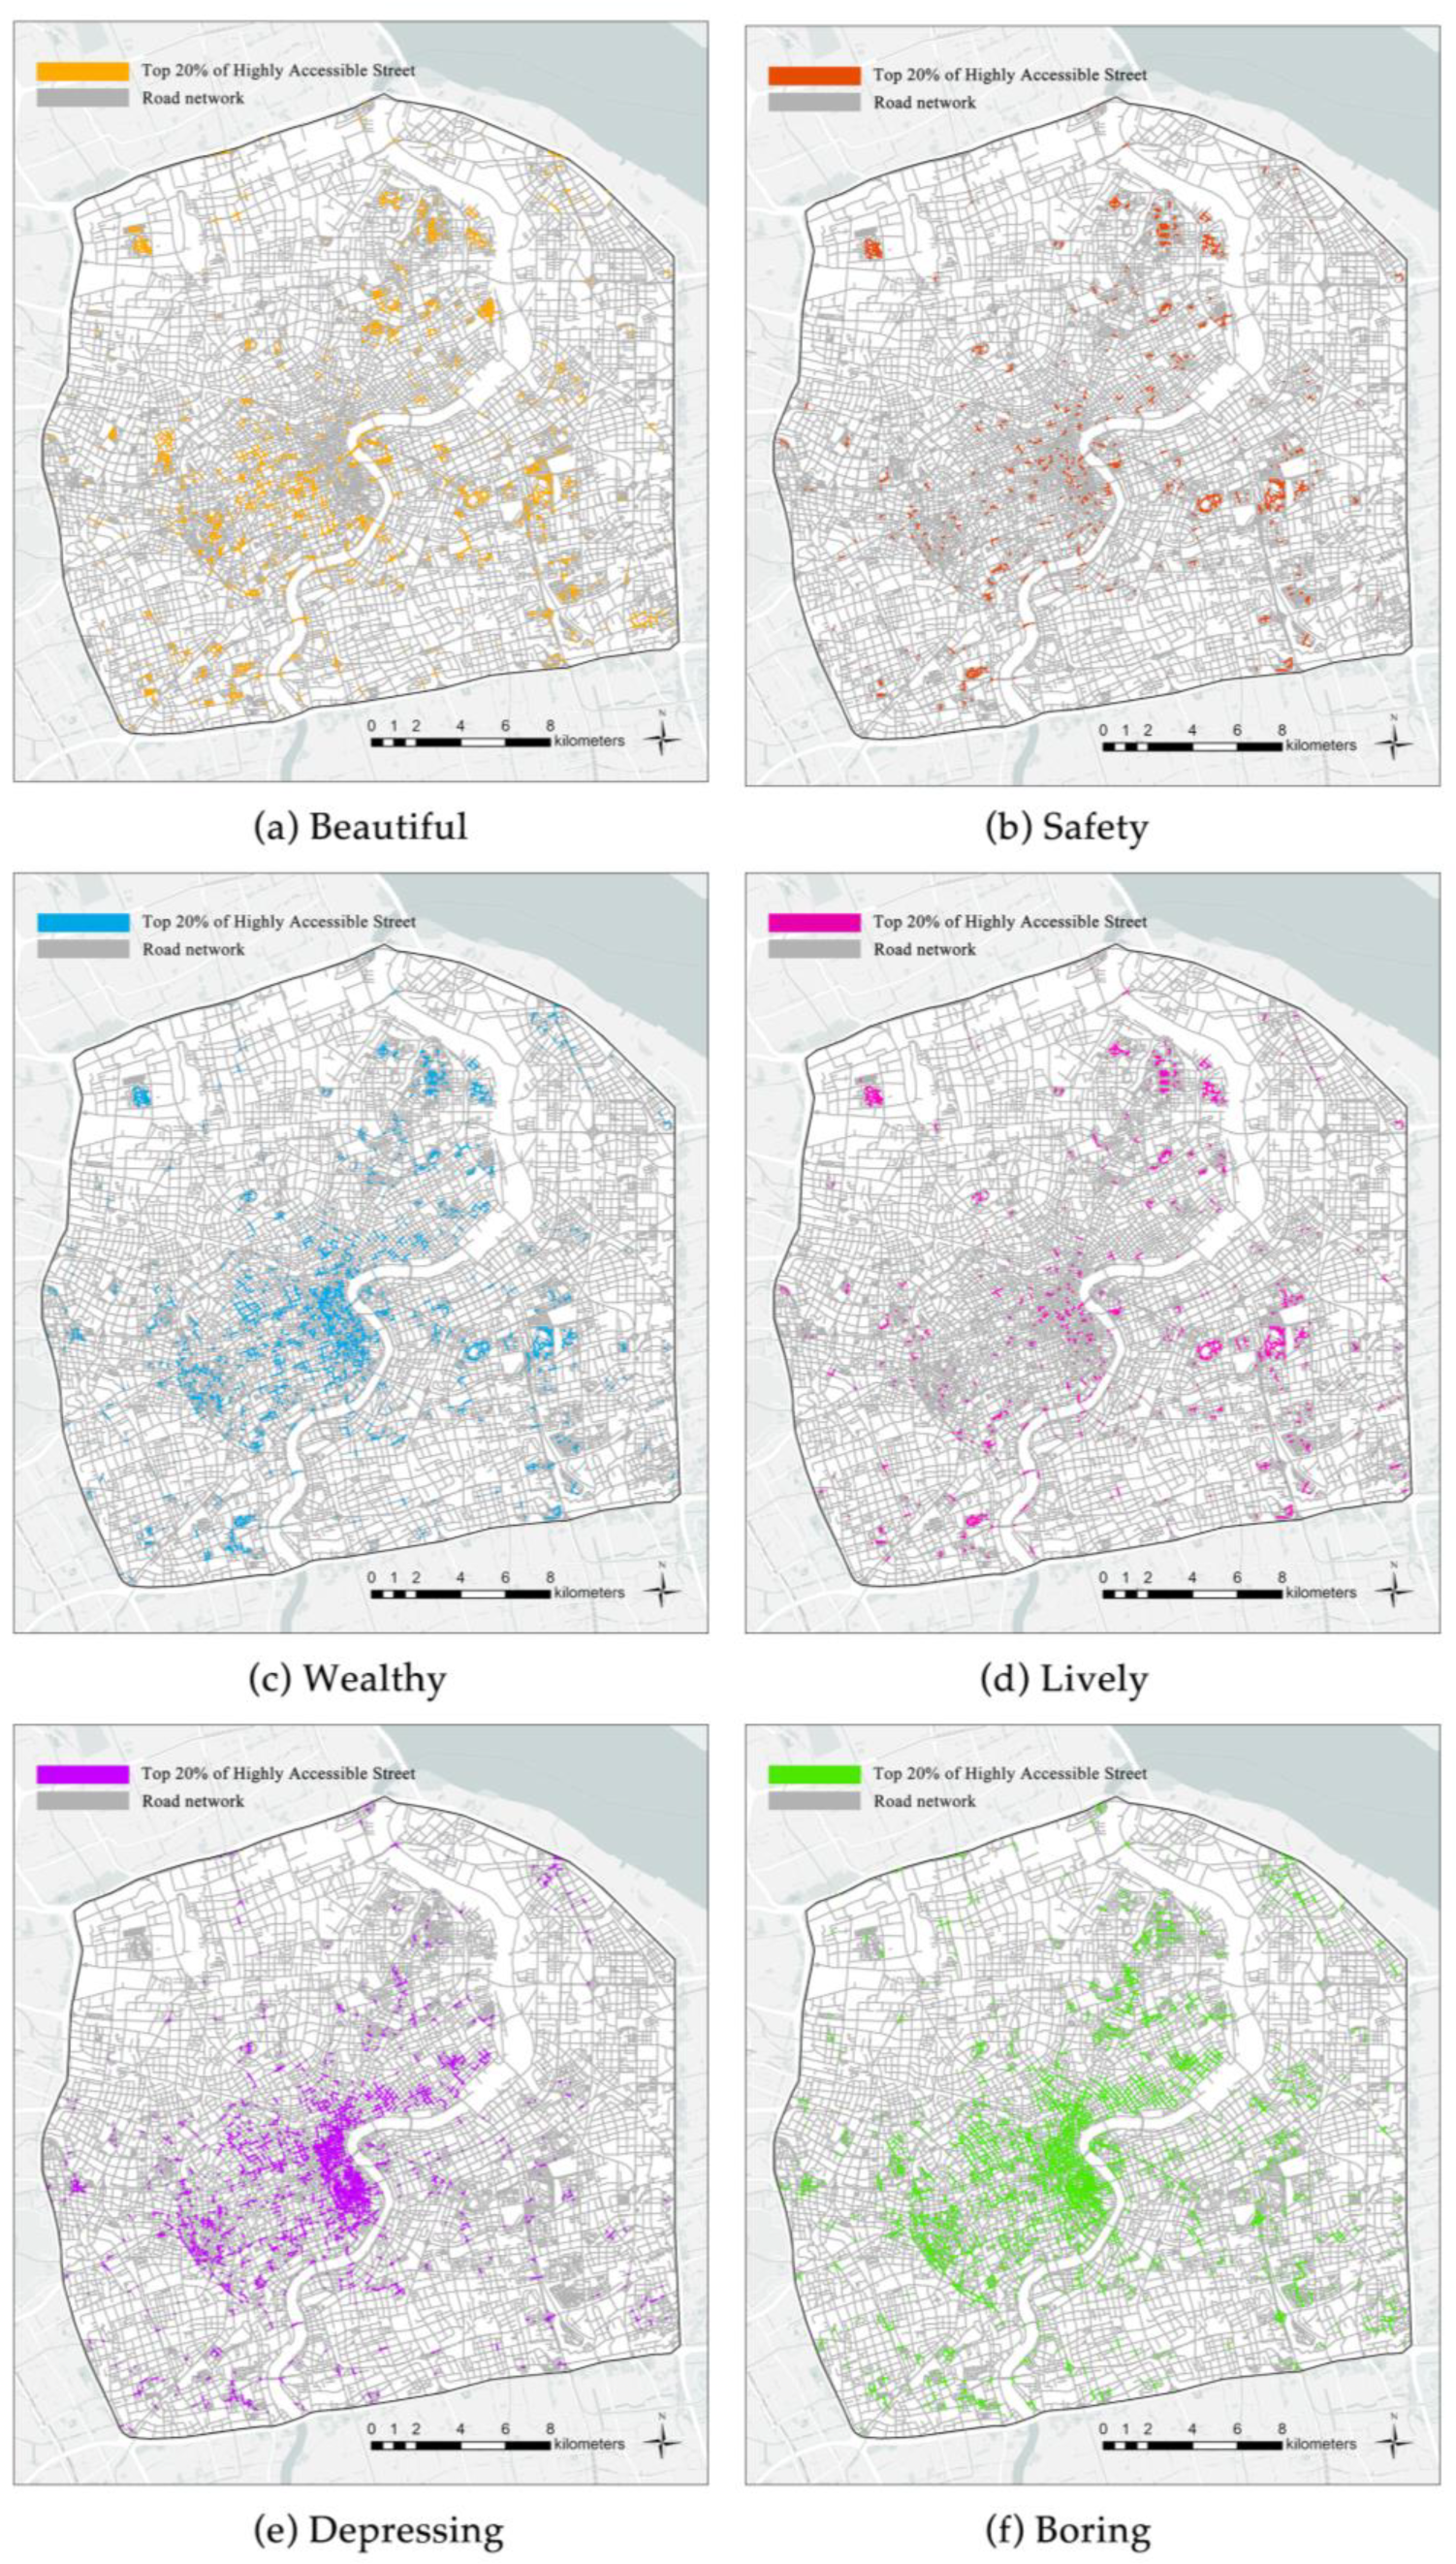
4.5. Overlay Analysis Based on Street Accessibility and Street Quality Perception

The top 20% of streets with the highest accessibility were categorized as high-accessibility streets, and the top 20% with the highest score for each perception indicator were taken as representative of that high perception indicator. After that, high-accessibility streets were overlaid with high perception scoring streets for all indicators. For example, streets with high accessibility and high safety perception scores are areas where people can feel very safe. High lively perception streets have landscape elements that enhance spatial liveliness. A concentration of upscale buildings and rich streetscape design elements characterizes highly wealthy perception streets. High beautiful perception streets have gorgeous views and landscapes. High boring perception streets are mainly laid out with uniformly planned, featureless landscape elements and a single street spatial visual composition. The highly depressing perception refers to street spaces that may evoke a strong sense of enclosure, blocking natural landscapes and causing psychological stress. The perception identification of different indicators can provide a variety of information for targeted improvements in urban planning.
Figure 11 and Figure 12 use six colors to mark the high perception score and accessibility overlap areas of the shown street. The spatial distribution of wealthy perceptions in Shanghai is almost identical to high-accessibility streets. Shanghai’s perception of beautiful, lively, and safety is primarily located in the Northeast, Southeast, and within the Inner Ring Road, where stylish and environmentally pleasing street spaces make residents feel prosperous, safe, and lively. Chengdu’s perception of beautiful, lively, and safety is consistent with the distribution of highly accessible streets. Still, its distribution of wealthy perceptions significantly differs from that of highly accessible streets, especially in high-accessibility areas within the First Ring Road, where there is space with lower wealthy perception scores. Depressing and boring are negative perceptions. Shanghai’s perceptions of depressing and boring are concentrated in the southeast and northeast, within the Inner Ring Road, and the overall spatial shape is fragmented. Chengdu’s perception of depressing and boring is concentrated in the southeast of Tianfu Square and at the intersection of the Second Ring Road and Third Ring Road with Gaoxin Avenue, Jinniu Avenue, and Chenghua Avenue, with the overall space radiating. These streets, with highly depressing perceptions and boring perceptions of high accessibility, need to be prioritized for renovation and upgrading because residents use them frequently but fail to get a positive perception of them. Early studies have found that high-accessibility streets play a crucial role in placemaking and life quality, and this series of case studies based on human perception can provide a good assessment of urban street quality. Since positive and negative perceptions are comparable in high-accessibility street areas, we felt it was necessary to focus on improving those areas where negative perceptions existed.
Figure 13a shows that streets with high positive perceptions in Shanghai exhibit a multi-center distribution, meaning that each administrative district has at least one street of this type. Furthermore, highly negative perception streets are scattered around highly positive perception streets and near the main roads. Area A (Huangpu District branch road) has many world-class business districts rich in historical and cultural heritage and green parks, where greenery and architectural style are crucial.
Still, there are also many old communities, narrow roads, road encroachment, cluttered billboards, overhead lines, and confusing interfaces. Area B (near the intersection of Wulian Road and Heze Road) has many high-class buildings, and the surrounding green environment and infrastructure are better than the rest of the city, which is conducive to people’s happiness. Area C has an open park (Jing’an Park) surrounded by modern buildings, high-class shopping centers, and historical and cultural sites.
In contrast, Area D (Zhangjiang overpass) and Area E (the intersection of Luoshan Elevated Road, Gaoke Middle Road, and Bibo Road) are both intersections of viaduct roads and the urban main road, and are surrounded by obsolete or dilapidated building facades, heavy traffic, temporary building construction, and high noise pollution. Area F (the intersection of Hengmianjiang Road and Mianbei Road) lacks reasonable spatial organization. The roads are complex and narrow, residential buildings, factories, and farmers’ houses are interspersed, and the overall spatial environment strongly contrasts with the surrounding urban environment. These factors may lead to an increase in negative perceptions among residents.
As can be seen from Figure 13b, Chengdu’s high positive perceptions are mainly distributed around the Ring Road network and waterfront space. Area A is the Wangjiang Campus of Sichuan University. The roads, buildings, and green spaces within the university town have been carefully planned and designed, with an abundance of green vegetation, campus sculptures, cultural and artistic facilities, and other landscape elements, creating a spacious, clean, and orderly campus environment. Area B is the Sand River waterfront. Area C is the Qingshui River waterfront. Area D is the Qingshui River, Nan River, and Modi River confluence. These waterfronts have blended with the surrounding high-rise buildings, bridges, and other structures to create a unique urban landscape. A comprehensive observation shows that these waterfront strips can make people happy by integrating various natural and cultural elements and public facilities. For example, parks, buildings with historical and cultural features, university campuses, walking trails, bicycle paths, and coffee shops allow people to relax in a natural environment while providing residents with opportunities for recreation and socialization, which helps to alleviate the pressure of urban life and improve resident’s life quality. In marked contrast, Areas G and F are the intersections of viaduct roads, railroads, and urban main roads (G is the intersection of the West Third Ring Road and Jinniu Avenue. F is the intersection of ChengYu Ring Road and the northern section of Yixin Road), which are characterized by heavy traffic, and a lack of landscape design and effective management. Many bridges, overpasses, roads, and tracks form a complex transportation network, and the visual clutter can be depressing and unsettling for residents. Area E becomes a fragmented mosaic of Shuwa Middle Street and Zhongxin Street near the Chunxi Road shopping area in the high perception area because vehicles parked on both sides of the road may result in narrow access spaces, increase the likelihood of traffic congestion, and obstruct buildings and greenery, making Area E appear cluttered and disorganized, which would harm the Chunxi Road shopping area, and make it visually uncomfortable and unsafe for traffic.

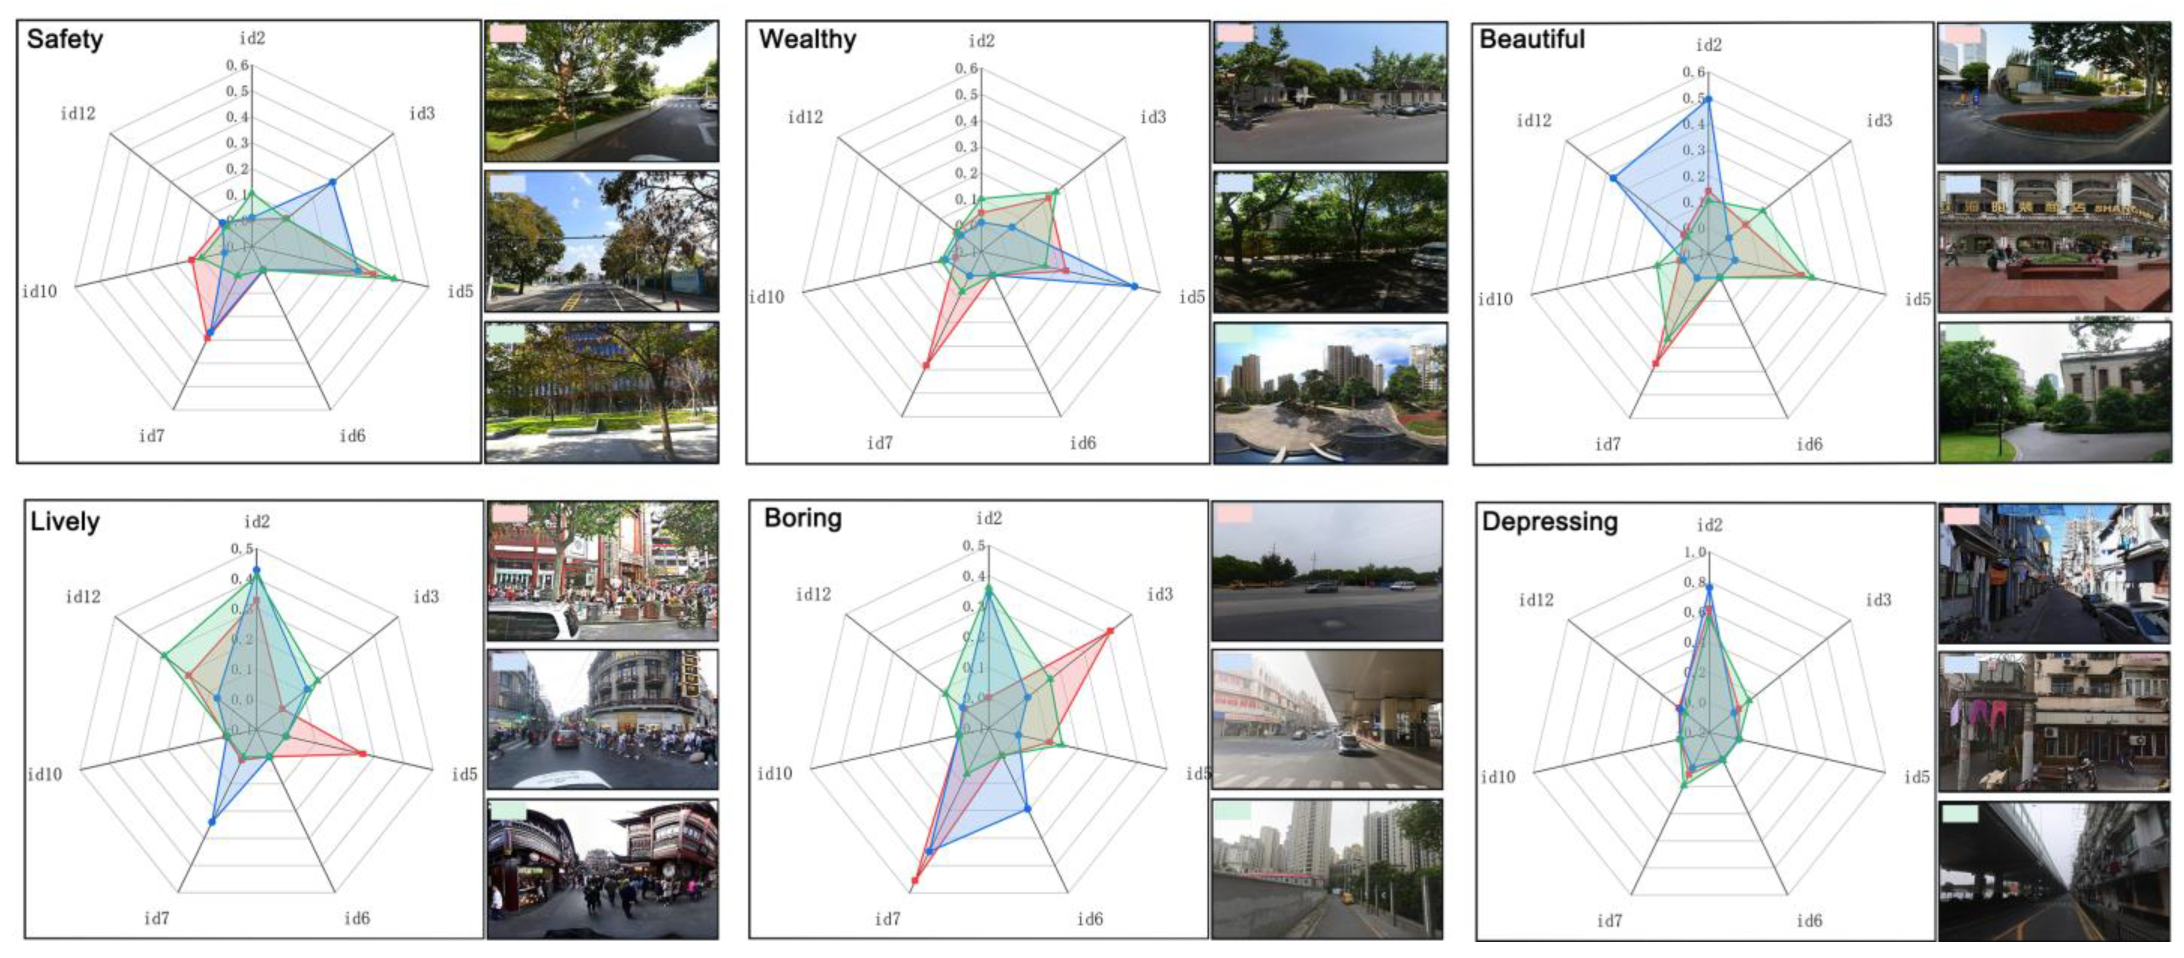
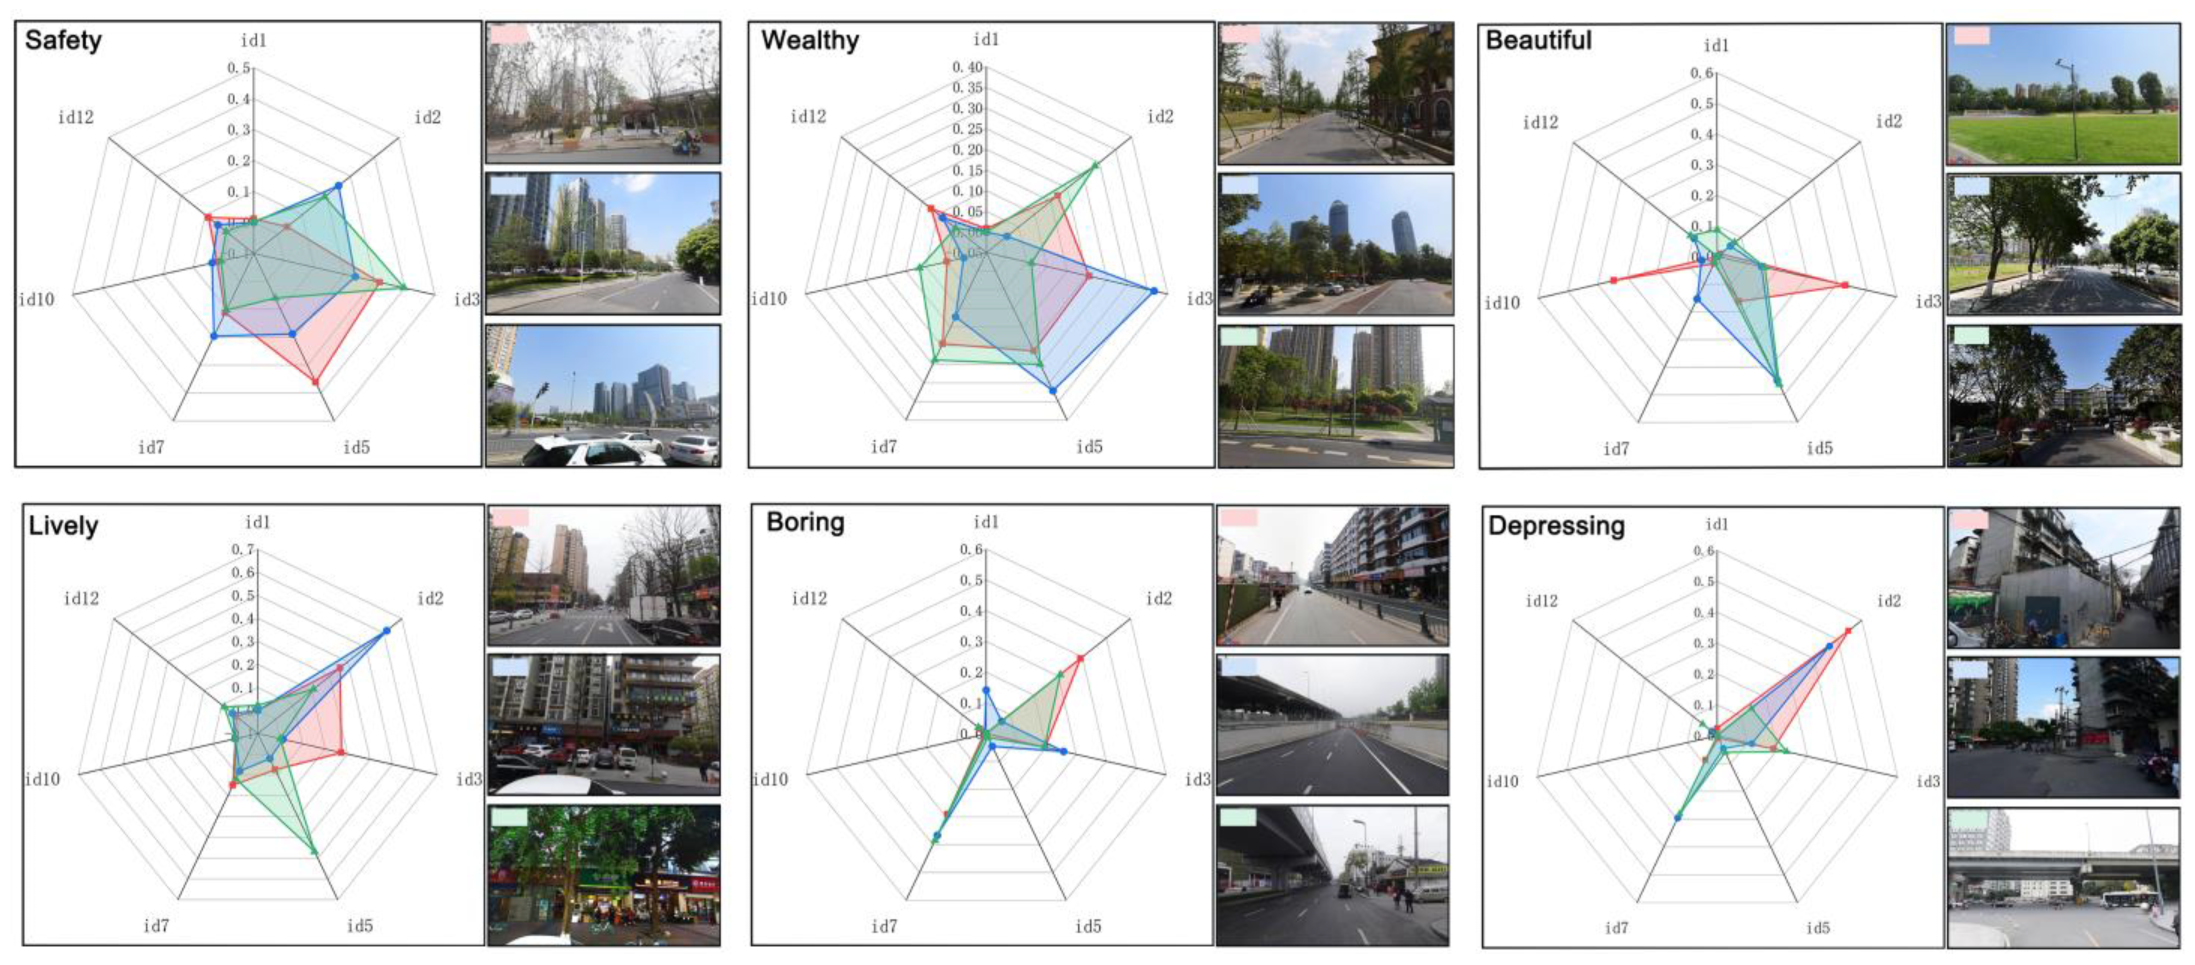
4.6. Analysis of Street-view Elements Closely Related to Each Perception Indicator

Table 3 and Table 4 list the seven street elements that significantly impact the street quality perception in Shanghai and Chengdu, respectively (by the percentage of area in the image). To understand the seven elements of highly accessible streets correlated with the six perception indicators, we weighted and averaged the street elements’ proportions in the top 20% of images with the highest perception indicator scores under high accessibility (Table 5 and Table 6). The results show that the sky has the highest percentage of boring and depressing in Shanghai and Chengdu, which may reflect that the street space visibility is too high, meaning there is a lack of green plant cover. The low proportion of trees on the street may add to the negative perceptions. Grass makes up the highest percentage of Chengdu’s beautiful perception. Modified open grass spaces may contribute to residents’ beautiful perception, which can be pleasurable and release physical stress. In the perception indicators of beautiful, lively, wealthy, and safety, roads with excellent visibility, lush trees, orderly and enjoyable traffic, and diverse architectural styles may make people happy and relaxed.

4.7. Multiple Linear Regression Analysis of Street Elements in the Street-view Images

This study used multiple linear regression analysis to explore the relationship between seven street elements and six perception indicators. Figure 14 and Figure 15 show a representative street-view image for six indicators in the high-accessibility streets. Figure 14 and Figure 14 and Table 7 and Table 8 show that buildings are positively related to Shanghai’s beautiful, lively, wealthy, and safety scores. The sky, ceiling, and walls are negatively associated with the beautiful, lively, and safety scores of Shanghai. Trees, pavement, and grass are positively related to Chengdu’s beautiful, lively, wealthy, and safety scores, while walls and buildings are negatively associated with Chengdu’s beautiful, wealthy, and safety scores. Among the negative perception indicators, depressing and boring in Shanghai are negatively related to roads, trees, and pavement and positively associated with ceilings and walls. Boring and depressing in Chengdu are negatively related to roads, pavement, and grass while positively correlating with sky and wall. It is worth noting that walls are consistently positively associated with depressing and boring in Shanghai and Chengdu and negatively correlated with all other positive perception indicators. When p > 0.05, there is no statistical significance, so there is no need to focus on these values as they will not have an effect.
These images show that each street element plays a different role according to different perception indicators. For example, trees are positively correlated with all positive perception indicators in Chengdu and negatively correlated with all negative perception indicators. This result is consistent with Zhao’s [32] claim that trees can enhance urban life and are an essential element of urban street space that can produce beautiful streetscapes. A study states that street trees can release oxygen and ions through respiration, which can regulate the function of the human brain cortex, achieving a balance between excitement and inhibition mechanisms, eliminating fatigue, uplifting spirits, and enhancing work efficiency [33]. In addition, a suitable combination of trees can improve the street’s liveliness and turn a monotonous street space into a lively scene, which aligns with the point made by Han [34]. Contrary to common knowledge, trees are negatively correlated with beautiful and lively in Shanghai, which is equally consistent with Tang, Serafin, Tsang, et al. [20,35,36]. Although increasing the number of trees in urban street spaces can benefit residents, improperly pruned, positioned, and cared for trees may result in trees obstructing sightlines, sunlight, and essential parts of buildings, which could lead to people being unable to retain much memory about buildings or even the visual and spatial aspects of a city.
Walls have a consistent positive correlation with the negative perception indicators for Shanghai and Chengdu and a negative effect on all other positive perception indicators, especially safety, which is counterintuitive. This phenomenon is known as the “wall effect”, where early urban planning led to the formation of enclosed wall spaces between buildings, which lacked aesthetics, blocked sunlight, made people feel surrounded, and tended to depress people. Our study confirms previous findings obtained in the literature. An earlier study using street video and expert assessments concluded that the walkability of urban streets is positively correlated with the sense of enclosure created by the building envelope [37].
Buildings are positively correlated with Shanghai’s beautiful, depressing, lively, wealthy, and safety scores, while having a negative correlation with boring. Buildings are negatively correlated with Chengdu’s beautiful, wealthy, safety, and boring scores, while they are positively correlated with lively and depressing, which indicates that richly decorated, varied architectural styles lead to good urban imageability and help to make urban life more manageable, more accessible, and more attractive and stimulate people’s emotions, which is similar to the study by Park et al. [38,39]. Conversely, overcrowded buildings with dilapidated facades may also trigger anxiety and aversion associated with work stress. The more buildings there are, the more walls are created to divide the street space, giving the impression of living in a “concrete urban forest,” which is also in line with the findings of Han et al. [25].
The sky is negatively correlated with beautiful, depressing, and safety scores in Shanghai, positively correlated with boring and wealthy, and unrelated to lively. The sky in Chengdu shows a negative correlation with beautiful and lively, while exhibiting positive correlations with wealthy, safety, boring, and depressing. Sky openness represents, to some extent, the degree of sky exposure. Streets with high sky openness imply lower building densities, which aligns with Dai et al.‘s [13] suggestion that streets with open views significantly eliminate depressing perceptions. However, some studies suggest that excessively high or low sky openness can reduce street quality. Too much sky openness implies low plant coverage, creating a sense of emptiness and poor aesthetics. Too-low sky openness means that dense buildings and dense tree canopies develop a sense of visual closure, resulting in psychological depression, i.e., the effect of urban street space on the depressing perception is moderated by the degree of closure. In addition, the low visibility of the sky caused by trees, while influencing the depressing perception, counteracts some of the trees’ positive effects in mitigating depressing perception [8,12,13].
Ceilings are negatively correlated with beautiful, lively, and safety scores in Shanghai and positively correlated with boring and depressing. As Shanghai’s viaduct roads are mainly in the city center, it has their spatiality, permanence, and persistence, which makes them and their structures become a vital part of the urban space that cannot be ignored, influencing and transforming the living environment of residents. Sunlight is blocked by the overpass structure, meaning there is insufficient sunlight to sustain plant growth or schedule other activities. Dust also affects the space under the overpass. At the same time, the noise and vibration of automobiles significantly impact the street space environment under the viaduct roads. These factors increase the perception of boring and depressing and significantly negatively impact the street quality. The results of this study support the view of Li et al. [27] that ceilings create a strong and distinctive visual sense of shelter and habitation, which is not easy to ignore and may cause physiological and psychological barriers and make an unpleasant landscape. In Chengdu, however, the ceilings are not the main street component because the designers transformed the “leftover space” underneath the viaduct roads into a green pocket park, effectively reducing residents’ negative perceptions. This finding also confirms Cindik et al.’s [40] view that integrating the space under viaduct roads with the surrounding environment is essential to achieving a homogeneous urban environment. This kind of space can become a popular recreational space for residents.
Grass consistently correlates with all positive perceptions of Chengdu, yet it is not the primary street element for Shanghai. Grass is a significant public open space in urban streets, serving as a vital venue for residents to engage in social activities such as recreation, sports, and gatherings. The high-frequency utilization of these grasses can provide vitality for the city’s socio-economic development and is an essential goal of urban green space planning and management [41]. In Shanghai, due to early urban planning, the city center (within the Inner Ring Road) is crowded with buildings, narrow streets, and heavy traffic, and there is a lack of public space to lay out grass, so grass accounts for a relatively low percentage of the street-view images.

5. Discussion

5.1. The Research Findings

The study found that the average positive perception score of street quality in Chengdu (2.84) was higher than that of Shanghai (2.58). Shanghai’s highly wealthy perception is multicentered, mainly clustered along Huaihai Zhong Road, Nanjing East Road, the Lujiazui Financial Center and along the Huangpu River and Suzhou River within the Inner Ring Road, the Zhangjiang Hi-Tech Park in the southeast, and Jiangwan New City in the north. Shanghai’s perceptions of liveliness and safety form a radioactive distribution along the city’s road network skeleton, gradually decreasing from the Inner Ring Road to the Outer Ring Road. The beautiful perception of Shanghai is concentrated in the Huangpu District. In contrast, the highly depressing and boring perception is mainly distributed in the older city districts’ branch roads within the Inner Ring Road and along the main roads of the study area. The lack of street space in older city districts often requires balancing transportation and aesthetic functions. Consideration should be given to micro-planning small spaces from the perspective of urban repair, including improving ground conditions, refurbishing building facades, adding vegetation, and tidying up signboards. These measures can effectively mitigate residents’ negative perceptions. In addition, the urban main roads are heavily trafficked, and consideration should be given to adding planted streetscape elements to alleviate the residents’ boring perception. Chengdu’s perceptions of high beautiful, safety, and lively scores are distributed along the river and the Third Ring Road, forming three large-scale agglomerations (Sandong Ancient Bridge Park, Sichuan University Wangjiang Campus, and Chengdu University of Technology). High perceptions of depressing and boring are widely distributed, with no apparent large-scale aggregation areas. Specifically, high depressing perception is evenly distributed along the urban road network skeleton, and high boring perception is evenly distributed along the urban branch roads.
Under high accessibility, there is a significant difference in the distribution of street quality perception in Shanghai and Chengdu, which is related to their urban planning and construction processes. Shanghai exhibits a fragmented cross-aggregation and polycentric distribution of highly positive and negative perception streets. For example, the highly commercialized Huangpu District also has significantly high negative perceptions, which may be consistent with the specific functional layout of Shanghai’s commercial districts and the planning intention to develop a polycentric city model. High negative perceptions are clustered around the Zhangjiang overpass, Luoshan Viaduct Road, Gaoke Middle Road, Bibo Road, and the intersection of Hengmianjiang Road and Mianbei Road. Chengdu has a highly positive perception of the curvilinear distribution of waterfront space along the Qingshui River, Nanhe River, and Modi River, which aligns with Chengdu’s plan for the city’s ecological base. High negative perceptions are distributed in a radioactive space along the main roads at the intersection of the ChengYu Ring Road and the northern section of Yixin Road and at the junction of the West Third Ring Road and Jinniu Avenue, with fractional cross-clustering at the intersection of Summer Stocking Middle Street and Zhongxin Street, which is consistent with the planning and design intent of Chengdu’s single-center circle expansion.
Based on the multiple linear regression model, we found that walls were consistently positively related to negative perceptions in Shanghai and Chengdu. To some extent, this finding aligns with contemporary urban planning concepts that suggest that walls may lead to visual obstruction, reduced sunlight, and increased pollution [8]. Our results provide evidence of the “wall effect” from the human perspective and verify that walls are the most likely factor contributing to the perception of low urban street quality. Ceilings positively correlate with negative perceptions of Shanghai but are not Chengdu’s main street element. This indicates that the architectural structure under the viaduct roads is relatively monotonous, lacks landscaping and greening, and suffers from traffic noise, air pollution, and safety hazards.
Considering the high cost of reconstruction, we strongly recommend that Shanghai incorporate the improvement of the older city districts’ branch road view elements within the Inner Ring Road into the urban renewal program to promote the urban repair strategy. Rather than large-scale remodeling, minor adjustments to street elements align with the practical adjustments to urban street planning in Shanghai. For example, Shanghai can learn from Chengdu’s design methodology, strictly controlling building density along the Huangpu River, Suzhou River, and other waterfront river spaces, demolishing dangerous houses, widening alleys, and improving the proportion of green space to improve the streets’ openness, which can effectively alleviate the psychological pressure on residents and enhance the positive street space perception of old urban areas within the Inner Ring Road.
In conclusion, in contrast to the results of traditional research methods that only consider the street perception distribution, our process, based on the space syntax method, considers the frequency with which streets are used. We convert the frequency of street crossing into quantifiable data that serve as constraints limiting the perception distribution. This approach is consistent with a user-centric perspective in everyday life scenarios and can identify which streets need the highest priority for rehabilitation based on accessibility. In a way, it solves the problem of the time and cost of large-scale, highly detailed data collection in urban streets. In addition, the methodological framework of this study also benefits from the dissemination of AI technology and easy access to big data, and Shanghai and Chengdu are used as case studies to validate the scientific and generalizability of our methodological framework, which can, therefore, be transferred to the renewal and planning of streets in other cities.

5.2. Planning Countermeasures for Multiple Street Elements on Human Perceptions

Our findings suggest that streets labelled “positively” perceived in cities tend to be located in areas rich in natural resources. These areas have a higher proportion of natural elements such as trees, grass, and sky, which are positively correlated with positive perception scores and are characterized by high green coverage, low building density, and green landscapes that can alleviate depression and promote the secretion of beneficial hormones through the visual pathway. In addition, adequately trimmed trees release negative ions that contribute to urban residents’ overall health and well-being. Grass also helps to reduce psychological stress. Therefore, it is crucial to prioritize incorporating such street elements in urban street planning.
Conversely, negative streets are mainly clustered at the intersections of viaduct roads and urban main roads, and substandard ground conditions, monotonous building structures, dilapidated building facades, limited landscaping and greenery, and problems such as traffic noise and safety hazards characterize the older city districts’ branch roads. In these areas, artificial street elements such as buildings, walls, ceilings, roads, and pavement were prominent and positively correlated with negative perception. These street elements have the potential to destroy positive street perceptions as they often trigger anxiety and aversion associated with work stress.
In terms of optimizing street space characteristics, specific improvement measures include, according to the flow of people, adjusting the form of road sections and rationally allocating road surface space, which should be taken mainly to ensure the appropriateness of the spatial scale and traffic accessibility. For example, in the older city districts’ branch roads, focus should be placed on parking restrictions on both sides of the road to release road space, combined with the design of buildings along the street and pavement improvements. Coordinating the form and color of the building interface along the street, cultivating plants with sound landscape effects according to the season, and enriching the street color can enhance the greening effect of the street landscape. For some streets with insufficient greening, a specific greening rate can be ensured by adding street trees, greening along the street level, and vertical greening of buildings. For streets with heavy trees, branches should be trimmed appropriately to ensure safe vehicle travel and open street views.
In terms of upgrading the spatial quality of streets, building interfaces and facilities should be kept tidy and uniform through architectural micro-remodeling. Removing temporary buildings, reorganizing street space within a time frame, and transforming “leftover space” under elevated roads into green pocket parks that blend in with the surrounding landscape can reduce residents’ negative perceptions. The uniform management of overhead lines can result in a cleaner and more aesthetically pleasing street space.
In addition, we can minimize the negative perceptions that walls bring to residents in the following ways. First, greenery should be added to wall space: this is achieved through vertical gardens, climbing plants, and the installation of flower boxes. Second, add art deco: use murals, sculptures, or other art deco to beautify wall space, add color and vibrancy, and delight and excite residents. Third, diverse architectural appearance: avoiding large monotonous walls in the city. Designers who design diverse architectural appearances using different materials, colors, and textures can add visual richness. Fourth, creative lighting design: using lighting design to illuminate walls at night creates a warm, romantic atmosphere and reduces the feeling of depression. Fifth, open design: adopt open building design to increase the connection between buildings and the surrounding environment. For example, some dangerous buildings can be demolished, and streets widened to increase an area’s openness and make the space more accessible. Consideration can also be given to adding windows or other light-transmitting facilities to walls to increase light and ventilation and reduce the sense of closure. Sixth, enrichment of activities: arrange public activity areas and leisure seats around wall space to increase people’s desire to stay there and make the wall space more comfortable.
This study emphasizes that most residents prefer natural landscape elements in assessing perceived street quality. However, it must be acknowledged that, even in highly commercialized downtown areas, certain streets have significant positive qualities, which may be due to the specific functions of these commercial areas. Despite the small spatial area occupied by street elements, their potential to contribute to residents’ well-being and psychological health cannot be ignored. We strongly recommend incorporating street element improvements into older city districts’ renewal projects to promote micro-renewal strategies. Minor adjustments to street elements should be made rather than large-scale remodeling, which is more in line with the actual adjustment of urban street planning and easier to manage.

5.3. Potential Applications

The methodological framework constructed in this study has been tested to provide a faster and more accurate understanding of the primary urban situation, which can be applied to the preliminary investigation of urban design. It can be used as an augmentation tool for designers and urban managers to eliminate subjective judgment bias and criticism and to achieve a more rational design. This study evaluates and compares the street quality in two megacities with prominent geographic characteristics through accessibility and spatial perception, which can identify key points and precise locations in the street for refinement to optimize their design and achieve the best combination of science, practicality, and aesthetics. For example, when a street is both high-quality and highly accessible, the stores, restaurants, and other commercial facilities in that street environment are more likely to attract customers, thus contributing to the commercial prosperity of the entire street. In addition, retrofitting “high accessibility-high negative perception” streets can reduce the incidence of mental illness and create more recreational space, greenbelts, and places to socialize and enhance interactions between neighbours.

5.4. Scientific Contribution of the Practical Approach

In the last decade, measuring street quality using street-view images and machine learning methods has become a hot topic in research in the urban field. However, existing studies have only focused on the perception distribution of urban street quality and have not considered the usage conditions of the streets. In contrast to existing studies, this work is a comprehensive measure that considers street quality under the constraints of urban street use conditions. By proposing space syntax accessibility to identify critical areas of urban street perception, a more rigorous and efficient assessment method is provided to quantify high-quality streets with a high frequency of use. This work has important implications for developing interdisciplinary urban design and computing science integration.

5.5. Potential Limitations and Future Work

Despite the many advantages of this study, there are still areas that should be improved in future work. First, the feasibility of this work relies heavily on the public availability of street-view images and machine-learning technology. While this reliance is not new, ethical and privacy issues emerge as images’ resolution and the number of research cases on street space quality increase, with implications for governance, policy, and people’s lives [42]. BSVIs provide high-resolution 360° panoramic images of streets, cities, mountains, and forests. Some images were taken from a higher position to enable viewers to look over hedges and walls designed to prevent public access to certain areas. The widespread availability of BSVIs and machine learning technology amplifies the potential harm of such information. To balance privacy and anonymity issues, BSVIs now blur parts of images that contain license plates and faces.
However, the current level of blurring does not always prevent a person from being identified. In addition, other non-ambiguous information can be recognized indirectly. Therefore, researchers should be cautious about the data they make publicly available. Second, the BSVIs did not cover all streets in this work, which may have excluded essential data. However, this issue is expected to be gradually resolved as data collection technology advances. In addition, relying only on street elements to predict urban perception is inherently limited, making it difficult to gain insight into the characteristics of the urban built environment and the evolution of urban street quality. Third, it is unclear why multifactorial explanations for the results of urban street quality perceptions have developed. It may be that the multiple linear regression model itself may oversimplify the complexity of real-world relationships, and the regression analysis results may be biased if the model does not include essential variables affecting the dependent variable or if there are insufficient sample sizes, among other issues. As implied by the previous research, urban perception is unique and subjective. It is related to the streetscapes seen by individuals and other developmental factors in the city, such as consumer safety, water resources, and economic conditions [43,44]. Therefore, future work needs to incorporate more variables in constructing more complex urban perception models to assess the different impacts of streets on urban development. Our future work will be directed towards combining richer multi-source urban data, overcoming sensory limitations, and utilizing AI techniques based on ethical principles to further integrate visual and non-visual factors to analyze the causes of urban perception phenomena.

6. Conclusions

Streets are an integral part of the human living environment. However, current urban street planning often neglects human perception. This study adopted BSVIs from a human-centered perspective, space syntax theory, and AI techniques to construct a measurement method for urban street quality perception. Our survey does not rely on a single perceptual indicator for assessment. Instead, it aims to capture the distribution of positive and negative perceptions to evaluate street quality, which is highly accessible. Our investigation verifies the hypothesis that quality perceptions of highly accessible streets in the central urban areas of Shanghai and Chengdu are regularly distributed and clustered. In addition, we analyzed and compared the effects of different street elements on human perception. These combined results allow us to identify streets needing effective optimization and how to retrofit them in large-scale complex urban environments. Therefore, our study can provide innovative perspectives and strategies for urban street planning and renewal.

Author Contributions

Conceptualisation, Y.L. (Yalun Lei); methodology, H.Z.; software, Y.L. (Yigang Liu); formal analysis, Y.L. (Yalun Lei); data curation, Y.L. (Yigang Liu); writing—original draft preparation, Y.L. (Yalun Lei); supervision, L.X.; writing—review and editing, L.Y.; visualization, L.Y.; resource, C.W. (Chuan Wang); funding acquisition, Y.L. (Yalun Lei) and M.W. All authors have read and agreed to the published version of the manuscript.

Funding

This research was funded by China Postdoctoral Science Foundation (Grant number: 2023M742669), and Shanghai Municipal Foundation for Philosophy and Social Science (Grant number 2020EWY017).

Data Availability Statement

The data used to support the findings of this study are included in the article.

Conflicts of Interest

The authors declare that they have no conflicts of interest or personal relationships that could have appeared to influence the work reported in this paper.

References

  1. Lei, Y.; Zhou, H.; Li, Q.; Liu, Y.; Li, J.; Wang, C. Investigation and Evaluation of Insolation and Ventilation Conditions of Streetscapes of Traditional Settlements in Subtropical China. Buildings 2023, 13, 1611. [Google Scholar] [CrossRef]
  2. Mouratidis, K. Urban Planning and Quality of Life: A Review of Pathways Linking the Built Environment to Subjective Well-Being. Cities 2021, 115, 103229. [Google Scholar] [CrossRef]
  3. Guan, X.; Wei, H.; Lu, S.; Dai, Q.; Su, H. Assessment on the Urbanization Strategy in China: Achievements, Challenges and Reflections. Habitat Int. 2018, 71, 97–109. [Google Scholar] [CrossRef]
  4. Abdi, M.H.; Soltani, A. Which Fabric/Scale Is Better for Transit-Oriented Urban Design: Case Studies in a Developing Country. Sustainability 2022, 14, 7338. [Google Scholar] [CrossRef]
  5. Istrate, A.-L.; Chen, F. Liveable Streets in Shanghai: Definition, Characteristics and Design. Prog. Plan. 2022, 158, 100544. [Google Scholar] [CrossRef]
  6. Ma, X.; Chau, C.K.; Lai, J.H.K. Critical Factors Influencing the Comfort Evaluation for Recreational Walking in Urban Street Environments. Cities 2021, 116, 103286. [Google Scholar] [CrossRef]
  7. Yao, Y.; Liang, Z.; Yuan, Z.; Liu, P.; Bie, Y.; Zhang, J.; Wang, R.; Wang, J.; Guan, Q. A Human-Machine Adversarial Scoring Framework for Urban Perception Assessment Using Street-View Images. Int. J. Geogr. Inf. Sci. 2019, 33, 2363–2384. [Google Scholar] [CrossRef]
  8. Zhang, F.; Zhou, B.; Liu, L.; Liu, Y.; Fung, H.H.; Lin, H.; Ratti, C. Measuring Human Perceptions of a Large-Scale Urban Region Using Machine Learning. Landsc. Urban Plan. 2018, 180, 148–160. [Google Scholar] [CrossRef]
  9. Kruse, J.; Kang, Y.; Liu, Y.-N.; Zhang, F.; Gao, S. Places for Play: Understanding Human Perception of Playability in Cities Using Street View Images and Deep Learning. Comput. Environ. Urban Syst. 2021, 90, 101693. [Google Scholar] [CrossRef]
  10. Vallejo-Borda, J.A.; Cantillo, V.; Rodriguez-Valencia, A. A Perception-Based Cognitive Map of the Pedestrian Perceived Quality of Service on Urban Sidewalks. Transp. Res. Part F Traffic Psychol. Behav. 2020, 73, 107–118. [Google Scholar] [CrossRef]
  11. Ren, X.; Wei, P.; Wang, Q.; Sun, W.; Yuan, M.; Shao, S.; Zhu, D.; Xue, Y. The Effects of Audio-Visual Perceptual Characteristics on Environmental Health of Pedestrian Streets with Traffic Noise: A Case Study in Dalian, China. Front. Psychol. 2023, 14, 1122639. [Google Scholar] [CrossRef]
  12. Duan, J.; Liao, J.; Liu, J.; Gao, X.; Shang, A.; Huang, Z. Evaluating the Spatial Quality of Urban Living Streets: A Case Study of Hengyang City in Central South China. Sustainability 2023, 15, 10623. [Google Scholar] [CrossRef]
  13. Dai, L.; Zheng, C.; Dong, Z.; Yao, Y.; Wang, R.; Zhang, X.; Ren, S.; Zhang, J.; Song, X.; Guan, Q. Analyzing the Correlation between Visual Space and Residents’ Psychology in Wuhan, China Using Street-View Images and Deep-Learning Technique. City Environ. Interact. 2021, 11, 100069. [Google Scholar] [CrossRef]
  14. Ye, Y.; Zeng, W.; Shen, Q.; Zhang, X.; Lu, Y. The Visual Quality of Streets: A Human-Centred Continuous Measurement Based on Machine Learning Algorithms and Street View Images. Environ. Plan. B Urban Anal. City Sci. 2019, 46, 1439–1457. [Google Scholar] [CrossRef]
  15. Li, Y.; Yabuki, N.; Fukuda, T. Exploring the Association between Street Built Environment and Street Vitality Using Deep Learning Methods. Sustain. Cities Soc. 2022, 79, 103656. [Google Scholar] [CrossRef]
  16. Lynch, K. “The City Image and Its Elements”: From The Image of the City (1960). In The City Reader; Routledge: Oxfordshire, UK, 2020; ISBN 978-0-429-26173-2. [Google Scholar]
  17. Ma, S.; Wang, B.; Liu, W.; Zhou, H.; Wang, Y.; Li, S. Assessment of Street Space Quality and Subjective Well-Being Mismatch and Its Impact, Using Multi-Source Big Data. Cities 2024, 147, 104797. [Google Scholar] [CrossRef]
  18. Bornioli, A.; Subiza-Pérez, M. Restorative Urban Environments for Healthy Cities: A Theoretical Model for the Study of Restorative Experiences in Urban Built Settings. Landsc. Res. 2023, 48, 152–163. [Google Scholar] [CrossRef]
  19. Han, X.; Wang, L.; He, J.; Jung, T. Restorative Perception of Urban Streets: Interpretation Using Deep Learning and MGWR Models. Front. Public Health 2023, 11, 1141630. [Google Scholar] [CrossRef]
  20. Tang, J.; Long, Y. Measuring Visual Quality of Street Space and Its Temporal Variation: Methodology and Its Application in the Hutong Area in Beijing. Landsc. Urban Plan. 2019, 191, 103436. [Google Scholar] [CrossRef]
  21. Chen, C.; Li, H.; Luo, W.; Xie, J.; Yao, J.; Wu, L.; Xia, Y. Predicting the Effect of Street Environment on Residents’ Mood States in Large Urban Areas Using Machine Learning and Street View Images. Sci. Total Environ. 2022, 816, 151605. [Google Scholar] [CrossRef] [PubMed]
  22. Larkin, A.; Krishna, A.; Chen, L.; Amram, O.; Avery, A.R.; Duncan, G.E.; Hystad, P. Measuring and Modelling Perceptions of the Built Environment for Epidemiological Research Using Crowd-Sourcing and Image-Based Deep Learning Models. J. Expo. Sci. Env. Epidemiol. 2022, 32, 892–899. [Google Scholar] [CrossRef] [PubMed]
  23. Ma, X.; Ma, C.; Wu, C.; Xi, Y.; Yang, R.; Peng, N.; Zhang, C.; Ren, F. Measuring Human Perceptions of Streetscapes to Better Inform Urban Renewal: A Perspective of Scene Semantic Parsing. Cities 2021, 110, 103086. [Google Scholar] [CrossRef]
  24. Wang, L.; Han, X.; He, J.; Jung, T. Measuring Residents’ Perceptions of City Streets to Inform Better Street Planning through Deep Learning and Space Syntax. ISPRS J. Photogramm. Remote Sens. 2022, 190, 215–230. [Google Scholar] [CrossRef]
  25. Han, X.; Wang, L.; Seo, S.H.; He, J.; Jung, T. Measuring Perceived Psychological Stress in Urban Built Environments Using Google Street View and Deep Learning. Front. Public Health 2022, 10, 891736. [Google Scholar] [CrossRef]
  26. Yunitsyna, A.; Shtepani, E. Investigating the Socio-Spatial Relations of the Built Environment Using the Space Syntax Analysis—A Case Study of Tirana City. Cities 2023, 133, 104147. [Google Scholar] [CrossRef]
  27. Li, X.; Lv, Z.; Zheng, Z.; Zhong, C.; Hijazi, I.H.; Cheng, S. Assessment of Lively Street Network Based on Geographic Information System and Space Syntax. Multimed. Tools Appl. 2017, 76, 17801–17819. [Google Scholar] [CrossRef]
  28. Wu, Y.; Liu, Q.; Hang, T.; Yang, Y.; Wang, Y.; Cao, L. Integrating Restorative Perception into Urban Street Planning: A Framework Using Street View Images, Deep Learning, and Space Syntax. Cities 2024, 147, 104791. [Google Scholar] [CrossRef]
  29. Xuan, W.; Zhao, L. Research on Correlation between Spatial Quality of Urban Streets and Pedestrian Walking Characteristics in China Based on Street View Big Data. J. Urban Plan. Dev. 2022, 148, 05022035. [Google Scholar] [CrossRef]
  30. Yang, W.; Hu, J.; Liu, Y.; Guo, W. Examining the Influence of Neighborhood and Street-Level Built Environment on Fitness Jogging in Chengdu, China: A Massive GPS Trajectory Data Analysis. J. Transp. Geogr. 2023, 108, 103575. [Google Scholar] [CrossRef]
  31. Shi, J. Study of the Leftover Space in the City Based on Reutilization: Take the Space under Elevated Road in Shanghai as an Example. Master’s Thesis, Universitat Politècnica de Catalunya, Barcelona, Spain, 2016. [Google Scholar]
  32. Zhao, J.; Wu, J.; Wang, H. Characteristics of Urban Streets in Relation to Perceived Restorativeness. J. Expo. Sci. Env. Epidemiol. 2020, 30, 309–319. [Google Scholar] [CrossRef]
  33. Shi, G.-Y.; Zhou, Y.; Sang, Y.-Q.; Huang, H.; Zhang, J.-S.; Meng, P.; Cai, L.-L. Modeling the Response of Negative Air Ions to Environmental Factors Using Multiple Linear Regression and Random Forest. Ecol. Inform. 2021, 66, 101464. [Google Scholar] [CrossRef]
  34. Han, Y.; Qin, C.; Xiao, L.; Ye, Y. The Nonlinear Relationships between Built Environment Features and Urban Street Vitality: A Data-Driven Exploration. Environ. Plan. B Urban Anal. City Sci. 2023, 51, 195–215. [Google Scholar] [CrossRef]
  35. Serafin, A.; Wynalda, B. Trees Take the Streets: Urban Tree Growth and Hazard Potential. SUURJ Seattle Univ. Undergrad. Res. J. 2021, 5, 50–60. [Google Scholar]
  36. Tsang, Y.T. Do You See What I See? Assessing the Relationships between Demographics, Street Trees and Visual Recognition of Urban Buildings. SCIENTIA MORALITAS-Int. J. Multidiscip. Res. 2020, 5, 89–119. [Google Scholar]
  37. Ewing, R.; Handy, S.; Brownson, R.C.; Clemente, O.; Winston, E. Identifying and Measuring Urban Design Qualities Related to Walkability. J. Phys. Act. Health 2006, 3, S223–S240. [Google Scholar] [CrossRef]
  38. Park, K.; Ewing, R.; Sabouri, S.; Larsen, J. Street Life and the Built Environment in an Auto-Oriented US Region. Cities 2019, 88, 243–251. [Google Scholar] [CrossRef]
  39. Sim, D. Soft City: Building Density for Everyday Life; Island Press: Washington, DC, USA, 2019; ISBN 978-1-64283-018-7. [Google Scholar]
  40. Cindik Akinci, Y.; Demir, S.; Demirel, Ö. Landscape Architecture and Creating Innovative Spaces under Highway Overpasses; St. Kliment Ohridski University Press: Sofia, Bulgaria, 2016; pp. 1–10. ISBN 978-954-07-4140-6. [Google Scholar]
  41. Dong, Q.; Cai, J.; Chen, S.; He, P.; Chen, X. Spatiotemporal Analysis of Urban Green Spatial Vitality and the Corresponding Influencing Factors: A Case Study of Chengdu, China. Land 2022, 11, 1820. [Google Scholar] [CrossRef]
  42. Kochupillai, M.; Kahl, M.; Schmitt, M.; Taubenböck, H.; Zhu, X.X. Earth Observation and Artificial Intelligence: Understanding Emerging Ethical Issues and Opportunities. IEEE Geosci. Remote Sens. Mag. 2022, 10, 90–124. [Google Scholar] [CrossRef]
  43. Pietrucha-Urbanik, K.; Rak, J.R. Consumers’ Perceptions of the Supply of Tap Water in Crisis Situations. Energies 2020, 13, 3617. [Google Scholar] [CrossRef]
  44. Pietrucha-Urbanik, K.; Rak, J. Water, Resources, and Resilience: Insights from Diverse Environmental Studies. Water 2023, 15, 3965. [Google Scholar] [CrossRef]
Figure 1. An analytical framework for the present study.
Buildings 14 01847 g001
Figure 2. Study area: Shanghai center area.
Buildings 14 01847 g002
Figure 3. Study area: Chengdu center area.
Buildings 14 01847 g003
Figure 4. Example of a panoramic street-view image using BSVIs.
Buildings 14 01847 g004
Figure 5. Street elements extraction from street images using the SegNet image semantic model.
Buildings 14 01847 g005
Figure 6. Human street quality perception based on a human-machine adversarial model.
Buildings 14 01847 g006
Figure 7. Mapping the human perception in typical areas of Shanghai using six perceptual indicators.
Buildings 14 01847 g007
Figure 8. Mapping the human perception in typical areas of Chengdu using six perceptual indicators.
Buildings 14 01847 g008
Figure 9. Pearson correlation coefficients for the six perceptual indicators using data from Shanghai (a) and Chengdu (b).
Buildings 14 01847 g009
Figure 10. Accessibility of the streets in the study area.
Buildings 14 01847 g010
Figure 11. Overlay of the top 20% of streets with high accessibility and the top 20% of streets with high spatial perception for (a) beautiful, (b) safety, (c) wealthy, (d) lively, (e) depressing, and (f) boring in Shanghai.
Buildings 14 01847 g011
Figure 12. Overlay of the top 20% of streets with high accessibility and the top 20% of streets with high spatial perception for (a) beautiful, (b) safety, (c) wealthy, (d) lively, (e) depressing, and (f) boring in Chengdu.
Buildings 14 01847 g012
Figure 13. Distribution map of positive and negative perceptions of street view in the study area.
Buildings 14 01847 g013
Figure 14. Representative street-view images from different perception indicators in Shanghai. The radar graph represents the percentage of different street elements in image segmentation.
Buildings 14 01847 g014
Figure 15. Representative street-view images from different perception indicators in Chengdu. The radar graph represents the percentage of different street elements in image segmentation.
Buildings 14 01847 g015
Table 1. Training on the accuracy of Shanghai’s street quality perception estimation.
PerceptionPrecisionRecallF1-ScoreAccuracyOOB Error
Boring0.880.830.870.900.18
Depressing0.620.600.560.610.40
Lively0.730.640.620.660.40
Wealthy0.640.600.710.630.42
Safety0.630.600.600.660.46
Beautiful0.930.890.880.890.17
Table 2. Training on the accuracy of Chengdu’s street quality perception estimation.
PerceptionPrecisionRecallF1-ScoreAccuracyOOB Error
Wealthy0.850.850.860.850.24
Beautiful0.830.830.850.850.24
Depressing0.870.870.860.870.23
Lively0.890.860.870.870.22
Safety0.850.850.850.850.24
Boring0.860.850.850.880.19
Table 3. Top seven street elements identified following segmentation of BSVIs in Shanghai.
NumberVisual ElementsMinMaxMeanS.D.
id3Sky0.0010.9110.2930.119
id7Road0.0010.4730.2300.088
id5Tree0.0010.7690.1140.099
id2Building0.0010.7820.0930.090
id12Pavement0.0010.4540.0280.038
id6Ceiling0.0010.6960.0210.073
id10Wall0.0010.6280.0120.034
Table 4. Top seven street elements identified following segmentation of BSVIs in Chengdu.
NumberVisual ElementsMinMaxMeanS.D.
id3Sky0.001 0.665 0.227 0.138
id2Building0.001 0.877 0.221 0.160
id5Tree0.001 0.793 0.203 0.147
id7Road0.001 0.423 0.145 0.077
id12Pavement0.001 0.342 0.047 0.043
id1Wall0.001 0.759 0.026 0.052
id10grass0.001 0.350 0.022 0.040
Table 5. Analysis of the street elements associated with the high perception scores for six perception indicators in Shanghai.
SkyRoadTreeBuildingPavementCeilingWall
Beautiful0.2540.2460.1060.1650.0300.049
Boring0.2870.2290.0690.1410.03300.015
Depressing0.2330.2160.0340.2180.040.0420.021
Lively0.1650.2270.1740.1790.03900.006
Wealthy0.2570.2320.2470.1140.03500.006
Safety0.2210.2460.1590.1360.04400.009
Table 6. Analysis of the street elements associated with the high perception scores for six perception indicators in Chengdu.
SkyBuildingTreeRoad PavementWallGrass
Boring 0.3190.2450.0640.1660.0220.0430.015
Depressing0.2880.2480.1010.1730.0330.0360.013
Lively 0.2010.2260.2320.1420.0530.0110.038
Wealthy 0.2560.1110.2720.1510.0420.0090.074
Safety 0.2320.2060.2170.140.0520.0150.036
Beautiful0.2190.1890.140.0670.0340.0261.459
Table 7. Results of the multivariate linear regression analysis for street view elements and perception scores in Shanghai.
Standardization
Factor
Beautiful
(Beta)
Lively
(Beta)
Wealthy
(Beta)
Safety
(Beta)
Boring
(Beta)
Depressing
(Beta)
Sky−0.046 ***−0.0030.458 ***−0.061 ***0.086 ***−0.175 ***
road0.032 ***0.026 ***−0.013 ***−0.052 ***−0.001−0.004 *
Tree−0.095 ***−0.071 ***0.689 ***0.397 ***−0.380 ***−0.521 ***
building0.120 ***0.102 ***0.178 ***0.048 ***−0.007 ***0.177 ***
pavement−0.041 ***−0.025 ***−0.109 ***0.002−0.014 ***−0.090 ***
ceiling−0.167 ***−0.270 ***0.013−0.272 ***0.257 ***0.236 ***
wall−0.129 ***−0.281 ***−0.057 ***−0.182 ***0.030 ***0.006 **
Beta coefficient * p < 0.05, ** p < 0.01, *** p < 0.001.
Table 8. Results of the multivariate linear regression analysis for street-view elements and perception scores in Chengdu.
Standardization
Factor
Beautiful
(Beta)
Lively
(Beta)
Wealthy
(Beta)
Safety
(Beta)
Boring
(Beta)
Depressing
(Beta)
Sky−0.032 ***−0.025 ***0.069 ***0.051 ***0.047 ***0.037 ***
Building−0.092 ***0.106 ***−0.053 ***−0.014−0.039 ***0.099 ***
Tree0.321 ***0.305 ***0.260 ***0.134 ***−0.354 ***−0.302 ***
Road−0.011 **0.242 ***0.119 ***0.117 ***−0.076 ***0.067 ***
Pavement0.158 ***0.253 ***0.204 ***0.273 ***−0.150 ***−0.133 ***
Wall−0.143 ***−0.080 ***−0.064 ***−0.148 ***0.095 ***0.136 ***
grass0.158 ***0.235 ***0.377 ***0.271 ***−0.217 ***−0.168 ***
Beta coefficient ** p < 0.01, *** p < 0.001.
Disclaimer/Publisher’s Note: The statements, opinions and data contained in all publications are solely those of the individual author(s) and contributor(s) and not of MDPI and/or the editor(s). MDPI and/or the editor(s) disclaim responsibility for any injury to people or property resulting from any ideas, methods, instructions or products referred to in the content.

