Article

Characterizing Splitting Failure of Concrete Influenced by Material Heterogeneity Based on Digital Image Processing Techniques

1
School of Civil Engineering, Sun Yat-sen University, Zhuhai 519082, China
2
Zhuhai Institute of Urban Planning & Design, Zhuhai 519000, China
3
School of Resources and Safety Engineering, Central South University, Changsha 410083, China
4
Huai’an Water Conservancy Survey and Design Institute Co., Ltd., Huaian 223001, China
*
Author to whom correspondence should be addressed.
These authors contributed equally to this work.
Buildings 2024, 14(6), 1856; https://doi.org/10.3390/buildings14061856
Submission received: 18 April 2024 / Revised: 3 June 2024 / Accepted: 16 June 2024 / Published: 19 June 2024
(This article belongs to the Special Issue The Damage and Fracture Analysis in Rocks and Concretes)

Abstract

:
Concrete, as a composite material, is subject to heterogeneity in its mechanical properties and damage characteristics responding to load. In this paper, a numerical approach for analyzing the heterogeneous characteristics and the mechanical behavior of concrete specimens in tensile splitting tests using DIP techniques is introduced. The experiment involves the preparation of three types of concrete specimens with different strengths and performances of the tensile splitting test. The contour and position information of the different components in the split surface of a concrete specimen are reflected in the numerical model using the DIP techniques and the fracture of the split surface is realized by three types of cohesive elements in the finite element software ABAQUS. The results of the proposed numerical model are highly consistent with the experimental results with a maximum error of 4.77%, whereby the evolution of the splitting process is discussed. The simulation shows that the concrete fracture develops from the periphery towards the center of the concrete and the ITZ region splits first at similar strain levels, followed by the mortar region and finally the aggregate region. In addition, a simplified modeling scheme with faster computational efficiency and higher accuracy is proposed, which indicates that the shape of the heterogeneous components in concrete has a low effect on mechanical strength. The proposed model can accurately reflect the splitting fracture process of concrete which is instantaneous in the actual process, contributing to the understanding of the mechanism of the splitting fracture process and proposing a new methodology for simulating the fracture process of heterogeneous materials (e.g., concrete, rock). This work contributes to the understanding of the effect of material heterogeneity on concrete’s mechanical behavior and fracturing process and provides valuable hints for the research on the non-destructive prediction of concrete strength.

1. Introduction

Concrete’s mechanical properties are crucial for the safety design and stability analysis in various geotechnical works such as tunnels, dams and railways. As a brittle material, the tensile strength of concrete is much lower than its compressive strength, making it highly susceptible to tensile failure in practical applications [1]. Understanding the tensile damage mechanism and characteristics of concrete is an important prerequisite for improving its strength and safety performance. Various tensile tests such as the uniaxial tensile test, Brazilian splitting test and tensile splitting test were performed with numerical simulation to reproduce the test processes [2,3,4,5,6]. However, concrete was usually simplified as a homogeneous material in many traditional numerical models, which are only able to mimic the concrete’s mechanical behavior at the macroscopic level, rather than reflecting its specific damage mechanisms at the mesoscopic scale in such tensile splitting processes.
In fact, concrete is a heterogeneous material that contains components such as aggregates, mortar, ITZs, etc. [7]. The different volumes and distributions of the components play an important role in determining the mechanical response of concrete subjected to external load [8]. Various attempts have been made to incorporate the heterogeneous nature of concrete through indirect methods, most of which are based on statistical algorithms to randomly generate and distribute the components of the concrete [9,10,11,12]. These methods allow the rapid establishment of heterogeneous numerical models of concrete with reasonable precision. Given the essence of the statistical methods, they fail to reflect the exact configurations inside the concrete despite their high efficiency. This poses obstacles to analyzing the underlying damage and failure mechanisms featured by the inherent material heterogeneity distinct for each concrete specimen [13,14].
As another method, the DIP techniques have also been adopted by many scholars to obtain a more precise representation of the concrete’s components and structure. Early attempts to apply the DIP techniques to obtain morphological and distributional characteristics of aggregates in concrete were achieved by Bentz et al. [15,16]. Together with the explosion of numerical simulation research on heterogeneous concrete, DIP techniques became a popular method for extracting heterogeneous information from concrete. Khormani et al. [17] established a 2D heterogeneous concrete model by utilizing DIP techniques to acquire cross-sectional configurations of the concrete and found that the uniaxial compressive strength of concrete in the numerical simulation is weakly correlated with the position of the modeled cross-section in the actual specimen. Similar methods were adopted to investigate the effect of heterogeneity on the tensile and flexural damage behavior of concrete [18,19,20], and some key issues in the DIP technique such as threshold segmentation and contour identification have been optimized in the latest research [21,22]. Since the information obtained by DIP techniques is planar, most of the numerical models are 2D models, which fail to comprehensively reflect the stresses and deformations of concrete in 3D space. To solve this problem, Huang et al. [23] proposed a 3D heterogeneous concrete model constructed by stacking multiple 2D models along the normal direction of a façade of the concrete, where these 2D models were constructed by scanning CT images obtained at multiple positions of the concrete through the DIP techniques. This approach has also been adopted by other scholars to construct 3D numerical models to investigate the extension of internal cracks in concrete, pointing out that the initial cracks are generated around the aggregates and pores [24,25,26,27]. In recent studies, a new approach that uses voxels to construct aggregate morphology based on the position information of points in 3D CT images has also been applied to establish 3D heterogeneous models [28]. However, a successful application of this method relies on obtaining a series of CT images and corresponding meshing, which makes it time-consuming and computationally inefficient to set up several groups of models for comparative analyses [29].
In finite element software ABAQUS (2020), the cohesive element is suitable to simulate the process of material fracture. In this study, the influence of concrete’s heterogeneity on its mechanical behavior is discussed through the tensile splitting process of concrete specimens. A simple and convenient approach to establishing a 3D numerical model which differs from previous research is proposed to reproduce the tensile splitting tests, where DIP techniques are adopted to obtain the heterogeneous characteristics from the ordinary photos of actual concrete splitting surfaces and rebuild the splitting surface in the numerical model. Different types of concrete specimens are tested to verify the applicability of the numerical approach and the regularity of concrete fracture in the splitting process is discussed. Possible simplified modeling schemes are also discussed based on the numerical results. The methodology of this paper can provide a viable pathway for the investigation of the correlation between heterogeneity and mechanical strength of concrete, which may contribute to the improvement of the mechanical strength at the mesoscale. The results of this paper can be applied to the prediction of the concrete strength and cracking process in a non-destructive manner, which is valuable for checking the performance of the critical points (such as the beam-column joints, connections, and points of load applications) of construction members in actual engineering works [30,31].

2. Experiments

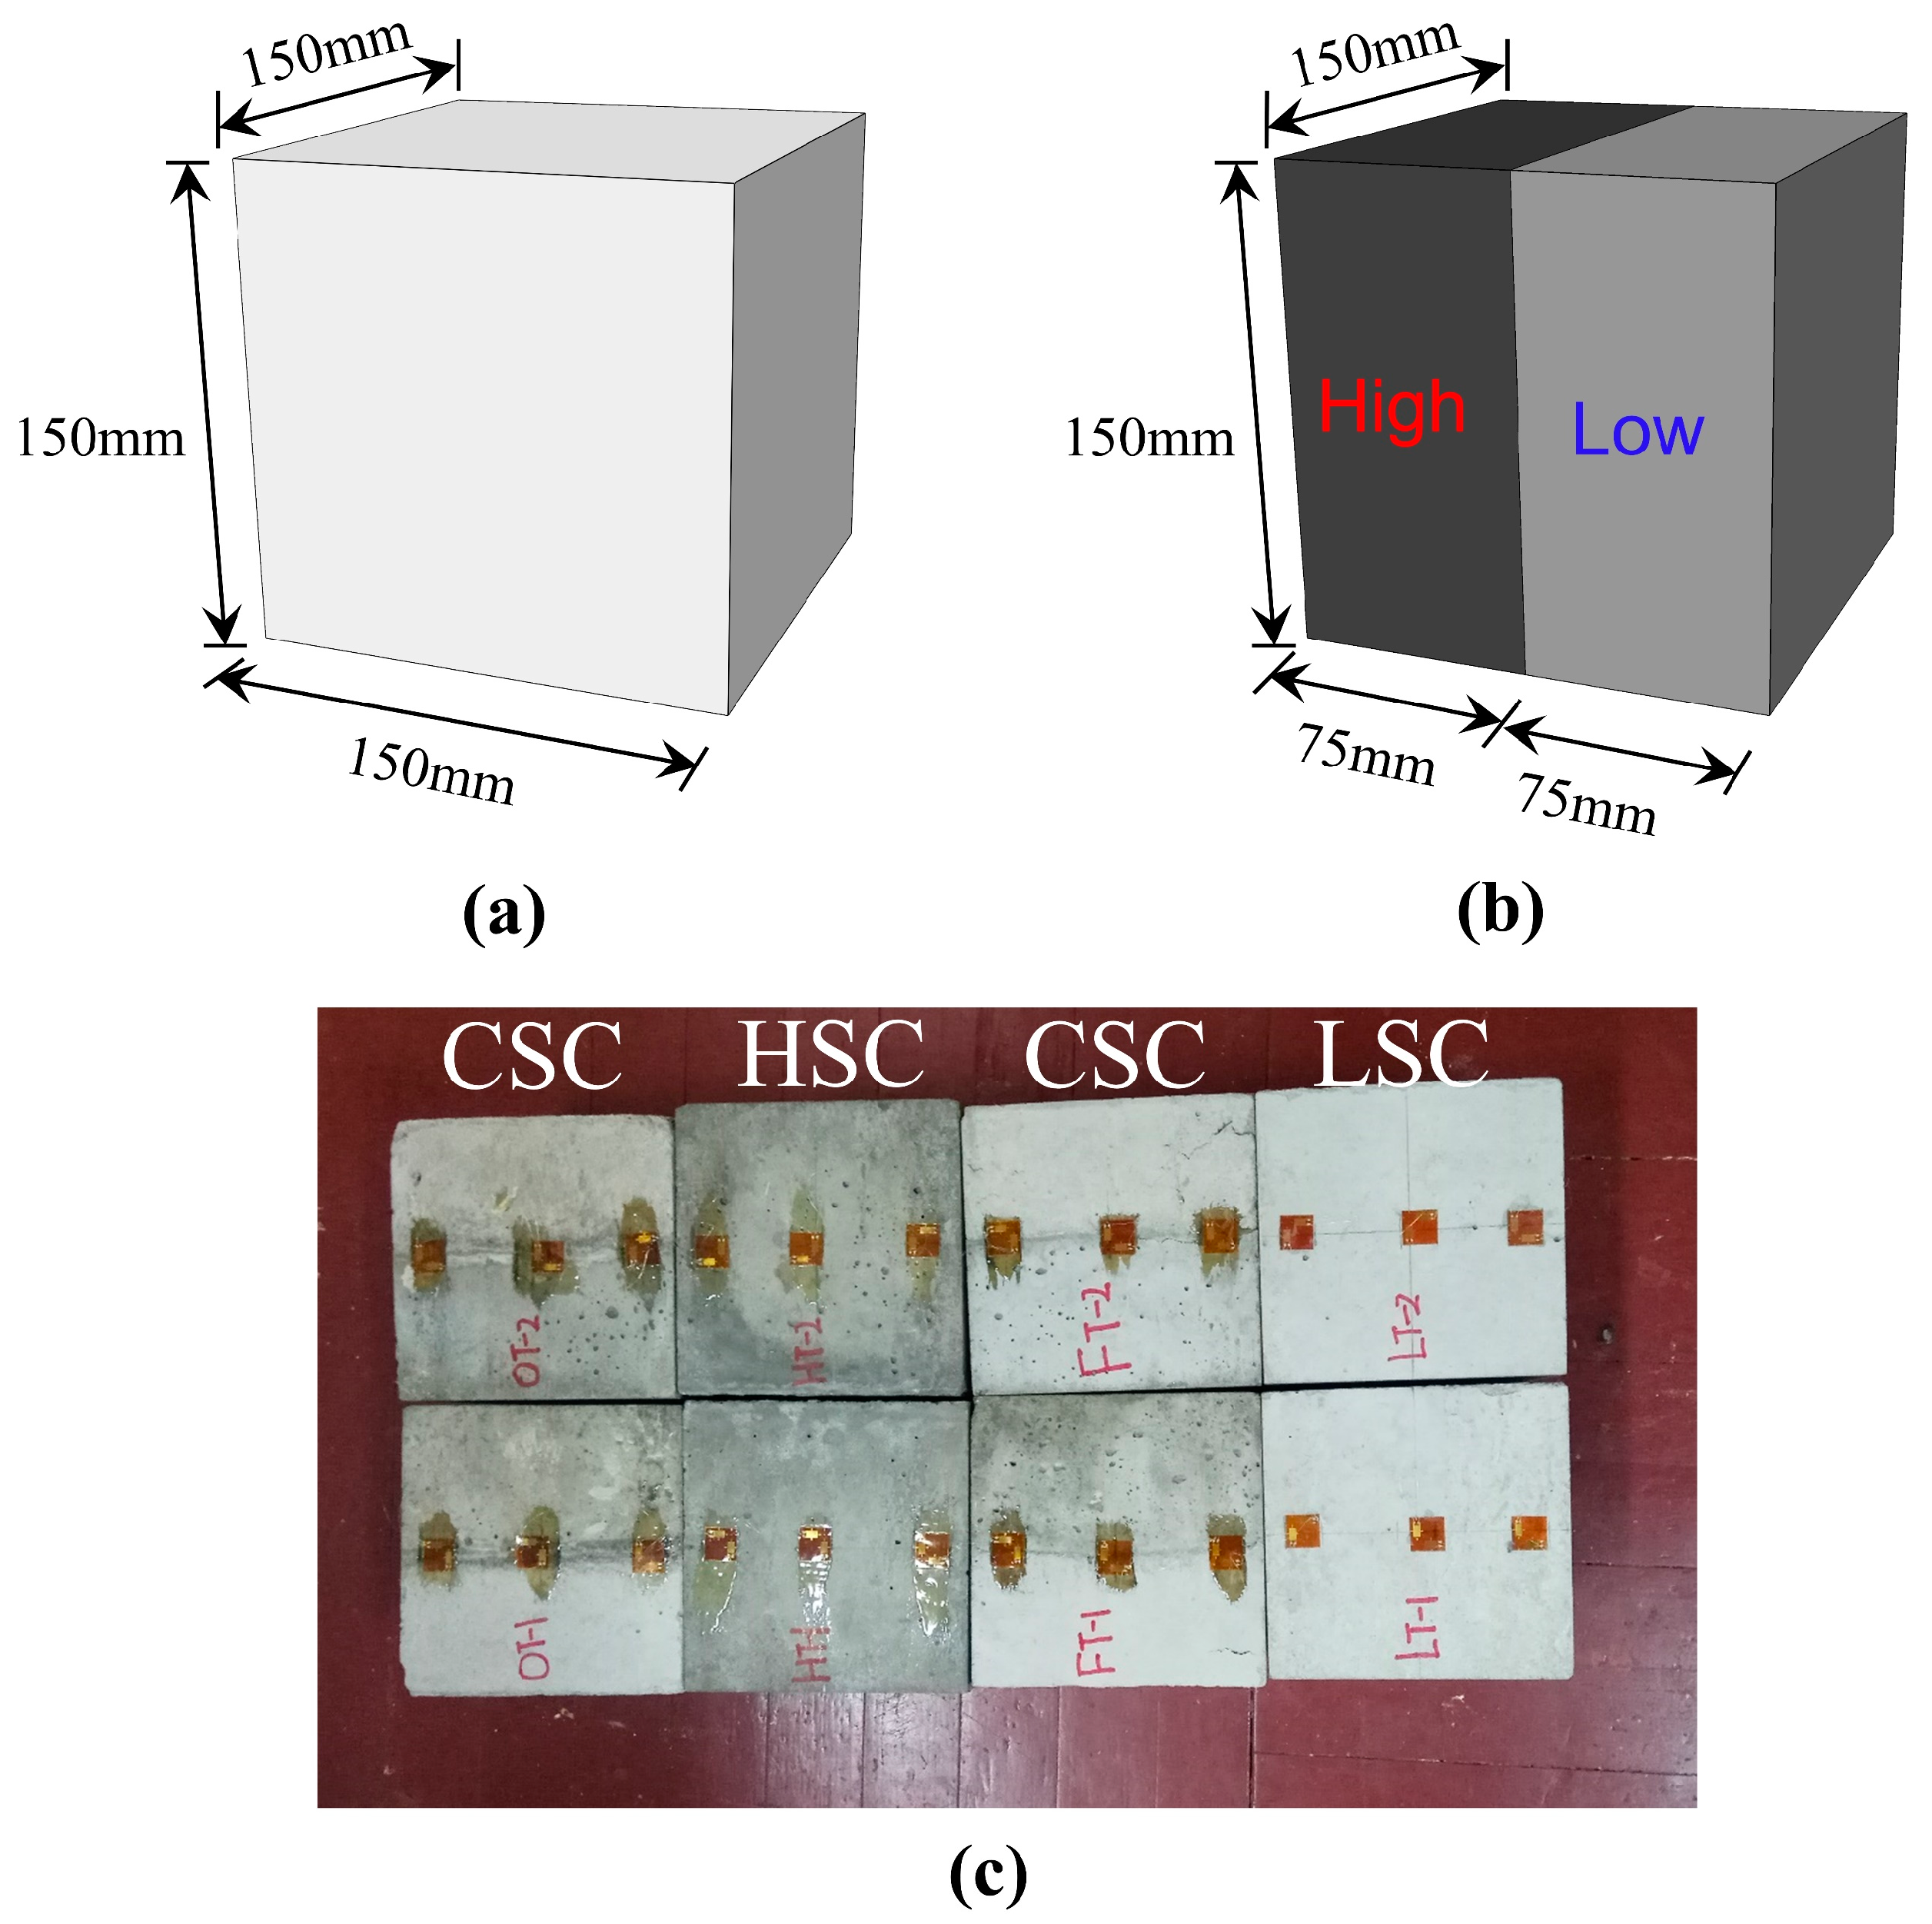
2.1. Concrete Specimens

Three types of cubic concrete specimens are prepared for the mechanical test, namely high-strength concrete (HSC), low-strength concrete (LSC) and combined-strength concrete (CSC). The dimension of high-strength concrete and low-strength concrete is shown in Figure 1a and that of combined-strength concrete is given in Figure 1b, where the combined-strength concrete is prepared by cementing the former two types of concrete (Figure 1b). The mix proportions and the basic mechanical properties obtained from uniaxial compression tests and unit weight tests [32,33,34] of the concrete are listed in Table 1 and Table 2.

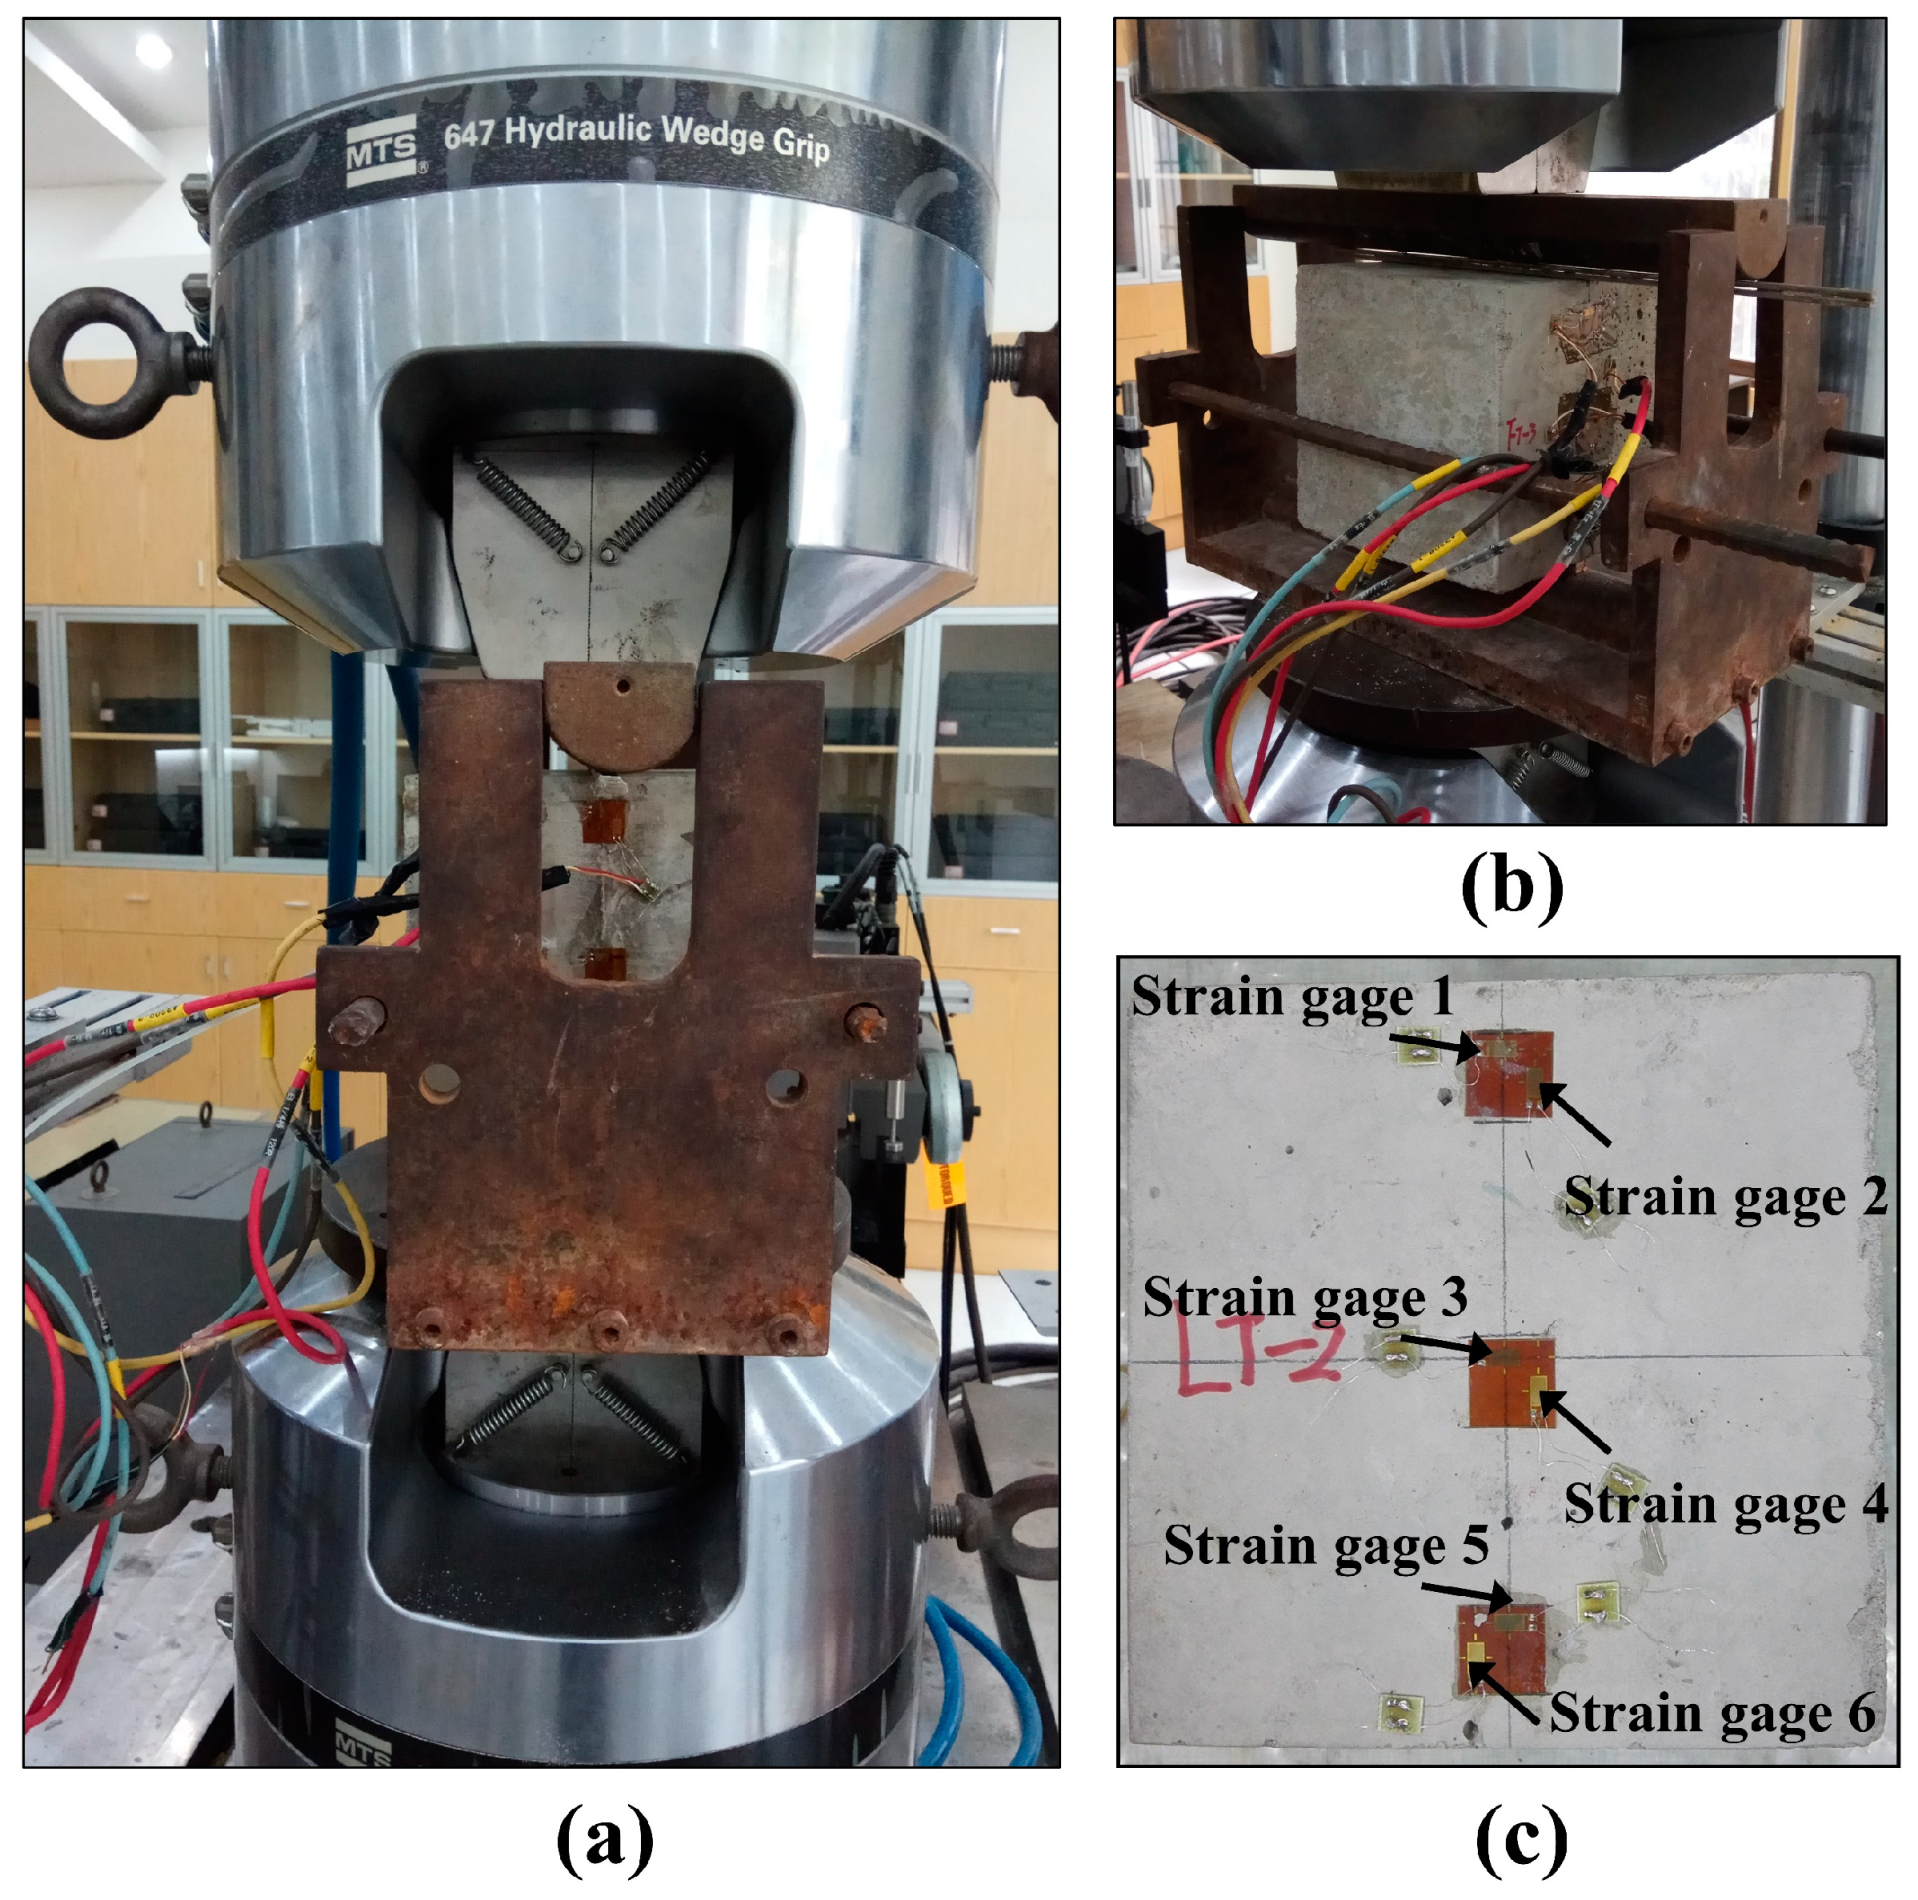
2.2. Testing Procedures

The tensile splitting tests are performed on the concrete specimens using MTS 322 testing system which is manufactured by MTS Industrial Systems Ltd. in New York, NY, USA, as shown in Figure 2a. A metal frame is utilized to fix the specimen while allowing free movement of the upper loading plate, so the strip load can be transmitted from the upper loading cylinder to the specimen through a pair of wooden strips (6 mm in width). The loading rate of the experiment is set as 1 kN/s [35], and the vertical load and displacement of the upper loading platen are recorded during the loading process. In addition, six strain gauges are attached to the side of the specimen, where both vertical and lateral strains at the top, bottom and middle height of the specimen can be recorded (Figure 2b). Based on the test data, the tensile splitting strength σ c t can be obtained as follows [35]:
σ c t = 2 P m a x π × D 1 × D 2
where P m a x denotes the peak axial load, D 1 is the length of the side of the sample parallel to the loading strip and D 2 is the height of the specimen.

3. Numerical Approach

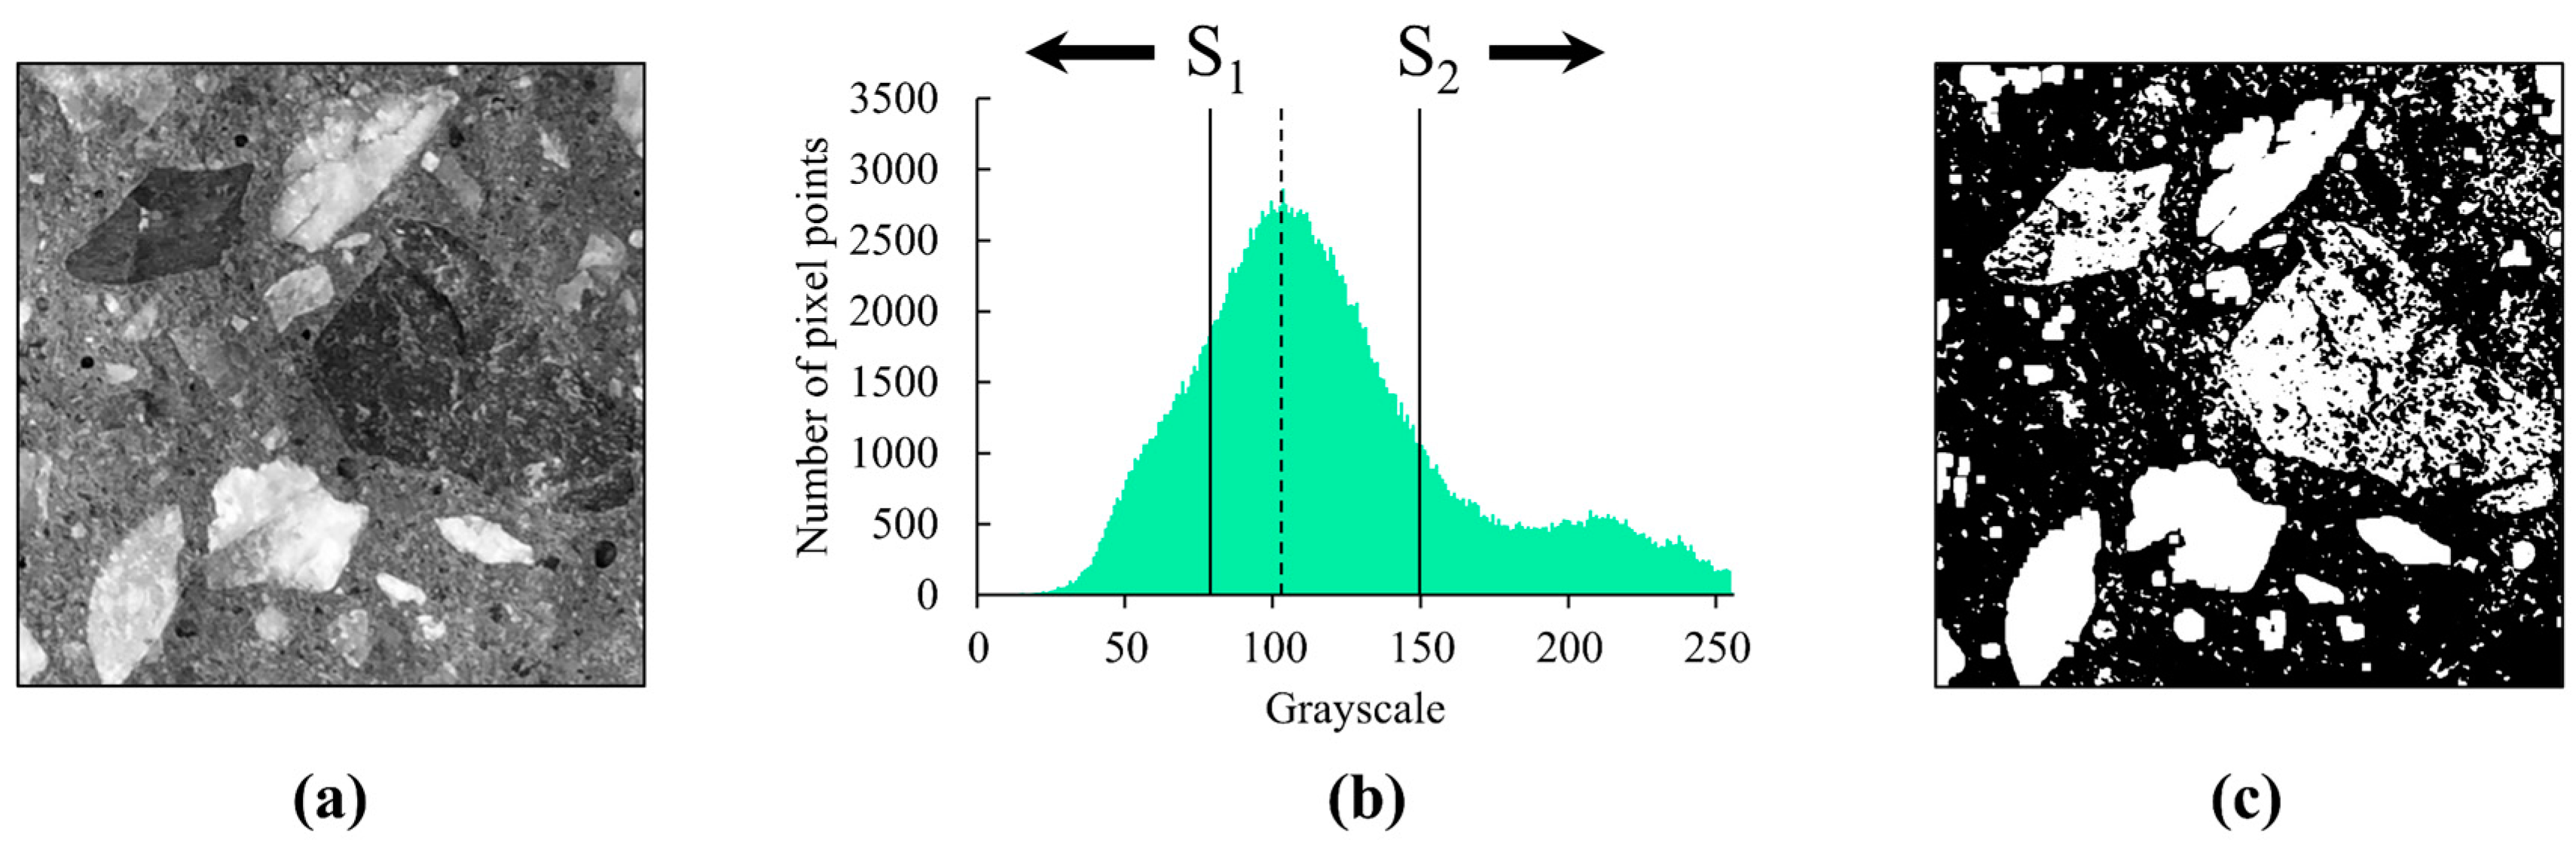
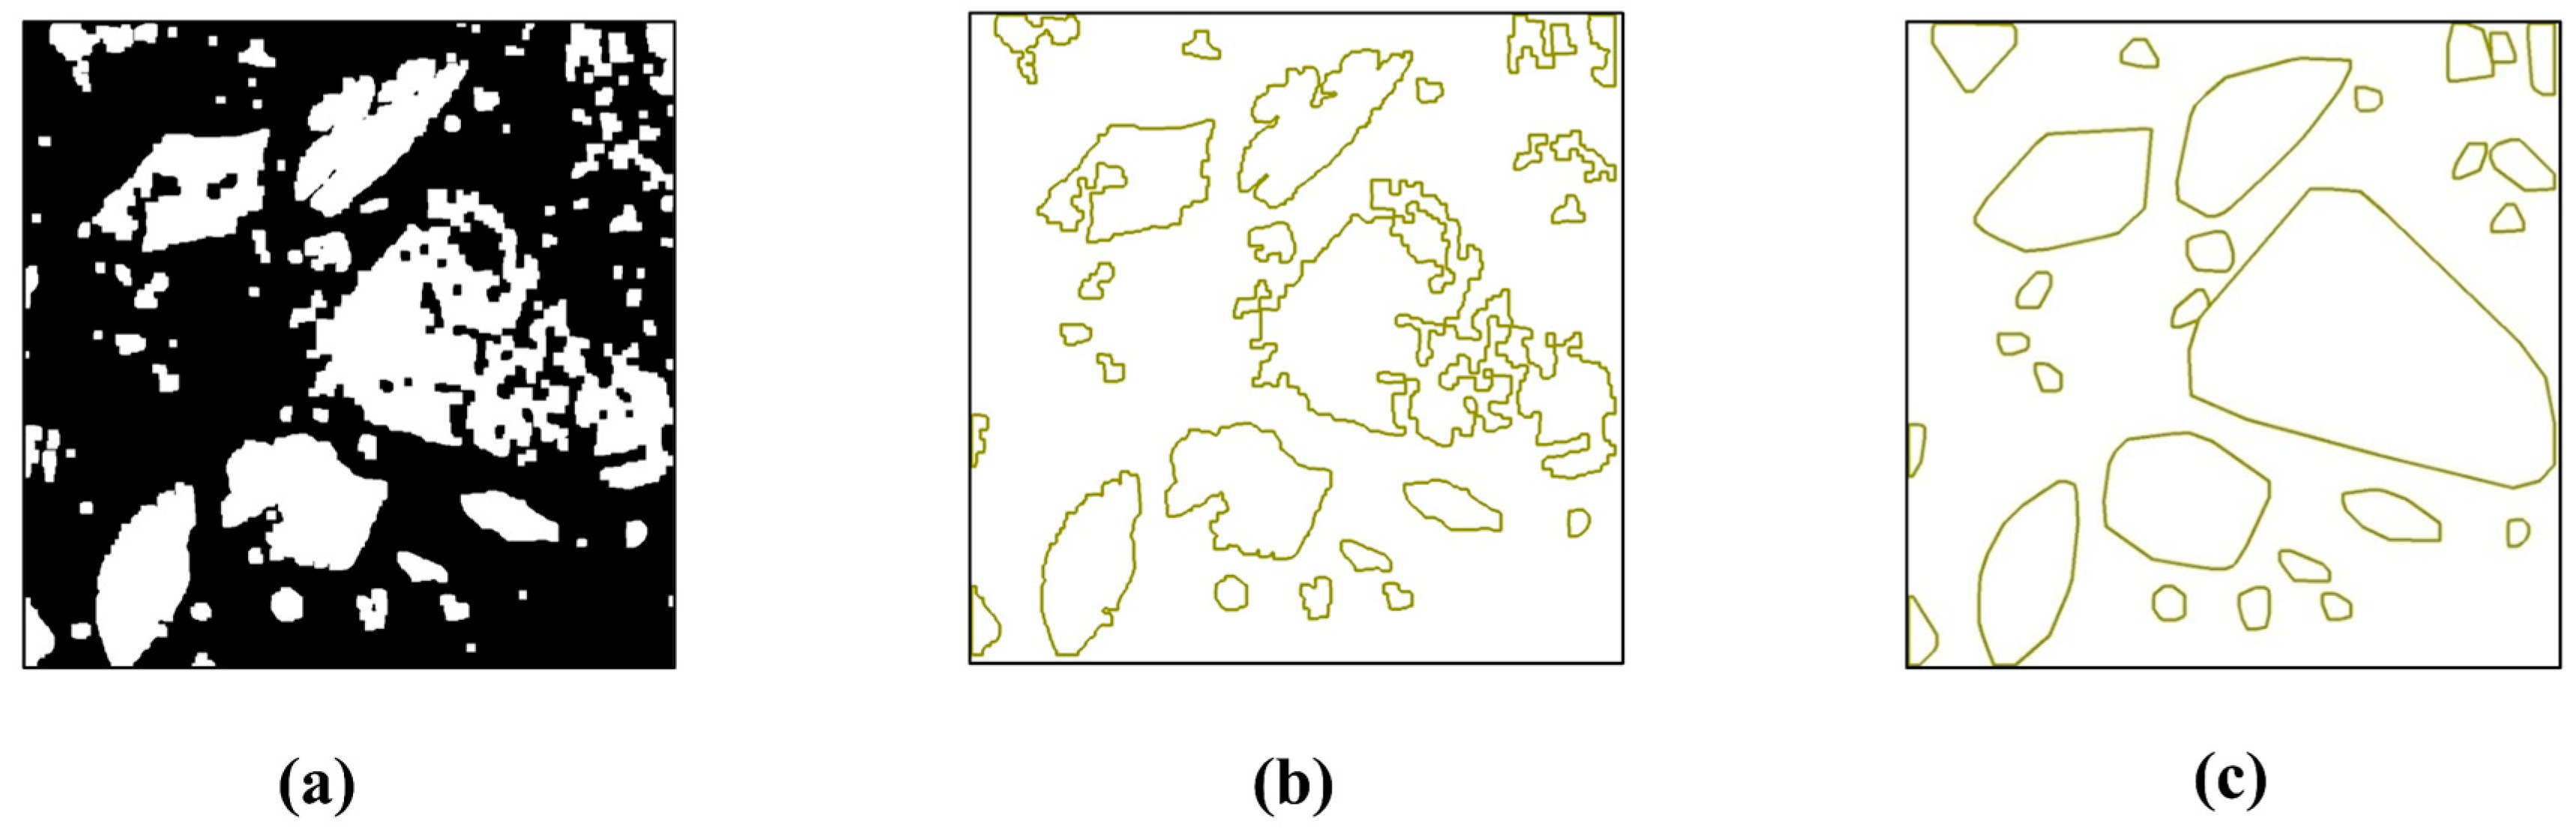
3.1. Splitting Surface Analysis through DIP Techniques

As the specimen is split, different components on the splitting surface can be identified according to their respective shapes and colors. As seen in Figure 3, generally three types of regions are identified by comparing the two sides of the splitting surface placed symmetrically (Figure 3), namely the interface splitting the aggregate (in red circles), the interface between aggregate and mortar paste, also known as “ITZ” (in blue circles), and the interface splitting mortar paste (rest of the splitting surface as in black circles). The interface splitting of the aggregate is determined by locating the region where the shape and color are identical on both sides of the splitting surface. The interface between aggregate and mortar paste (ITZ) is determined by locating aggregate on one side of the splitting surface, while only mortar paste is on the symmetrical position on the other side of the splitting surface.
The colored images of the splitting surfaces are subsequently recorded in grayscale format with the pixels’ color depth (grayscale) values ranging between 0 and 255, where 0 denotes “black” and 255 denotes “white” (Figure 4a). It is noticed from the figure that the regions representing aggregates can be either darker or lighter than those representing mortar paste. Therefore, two segmentation thresholds should be determined among the grayscale values to differentiate the aggregates from the mortar paste [19]: as shown in the corresponding color depth distribution (Figure 4b), the mortar paste is represented by the middle section of the grayscale range, and the aggregates are represented by the grayscale values above the upper threshold “S2” (lighter regions) and also below the lower threshold “S1” (darker regions). For each concrete specimen under study, multiple attempts have been made to determine the optimal threshold values to ensure an exhaustive inclusion of all the aggregates. Then, the grayscale image is further converted into binary format as shown in Figure 4c, where the regions representing the aggregates are prescribed with the grayscale value of 1 (white) and those representing the mortar paste are prescribed with the value of 0 (black).
The binary image contains scattered white spots which are assumed to be the result of light reflection due to the unevenness of the splitting surface. Such a feature is assumed to have an insignificant influence on the mechanical behavior in the splitting process and thus is not considered in the subsequent numerical model. Therefore, these spots are removed through an opening operation based on mathematical morphology [36] (Figure 5a). The boundaries of the aggregates are then determined through the detection of an abrupt change in the grayscale value from 0 to 1 (Figure 5b). To facilitate meshing in the numerical model, the boundary of the aggregate contour is further simplified using the convex hull algorithm [37], where the curvy segments of the contour are substituted by straight lines at an acceptable precision (Figure 5c). The positions of the points on contours are recorded, and corresponding points are placed and connected in the mid-section of the numerical model according to the positional information to form multiple enclosed areas with different components.

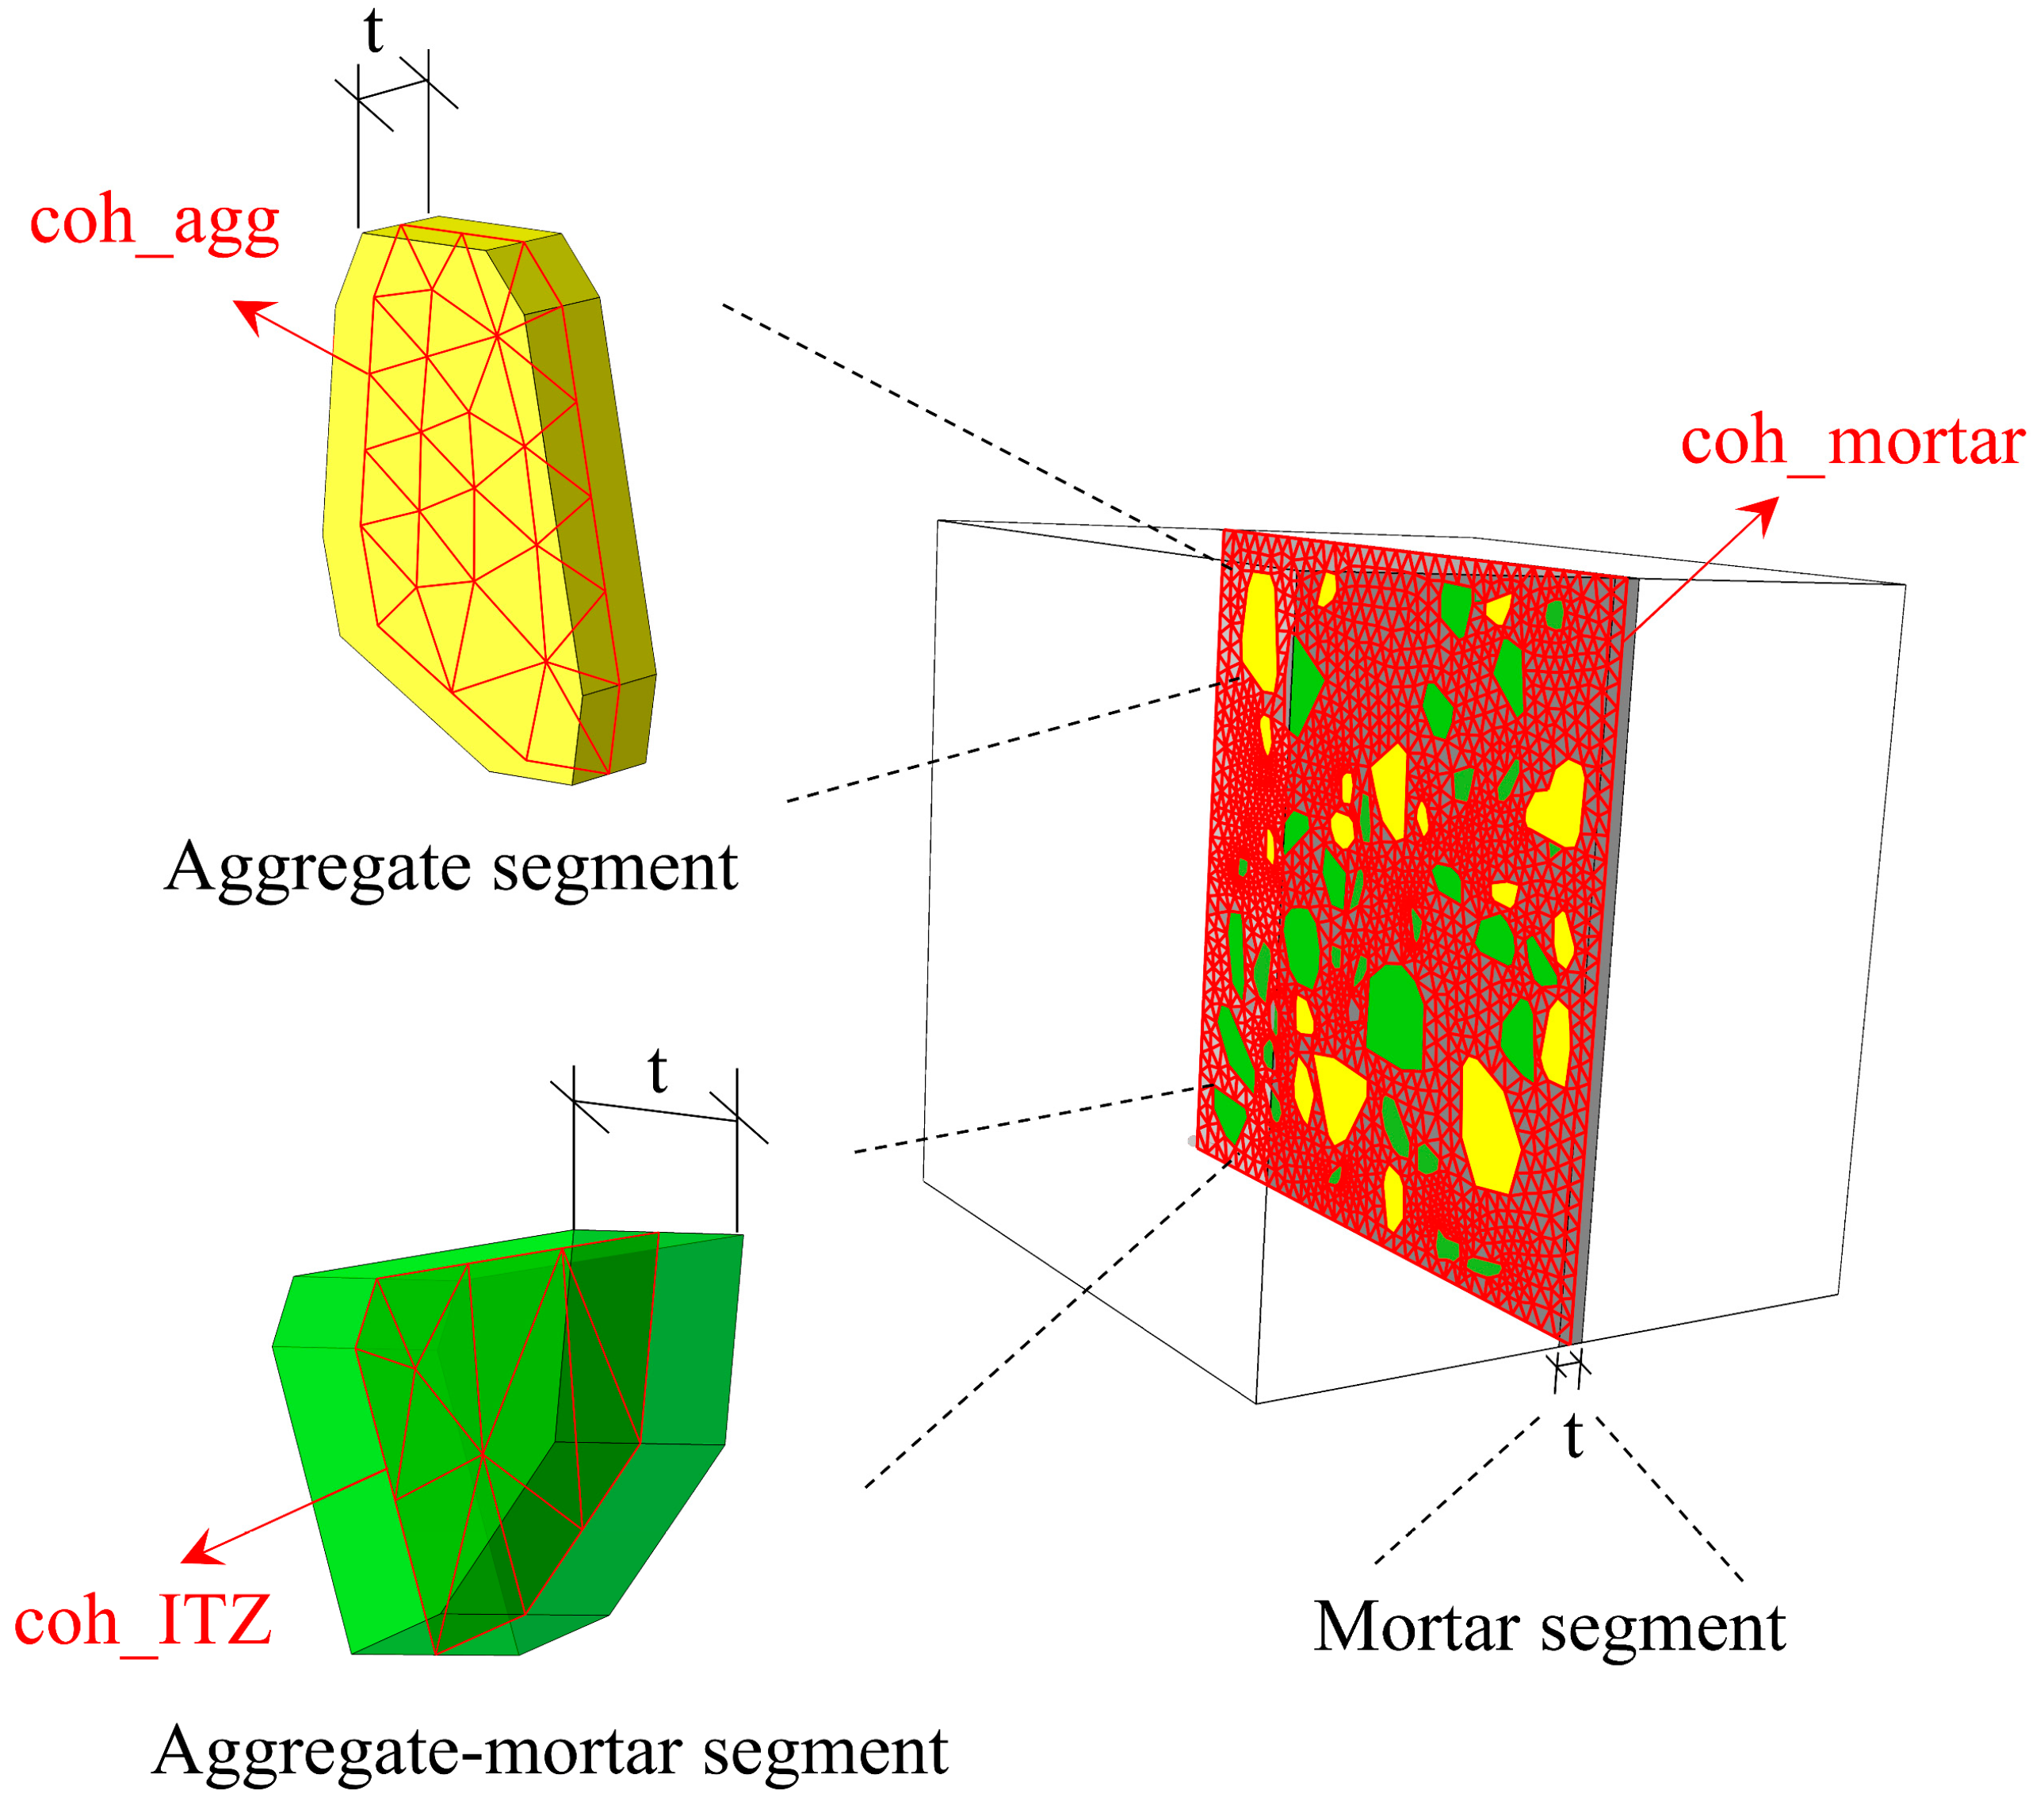
3.2. Establishment of the Numerical Model

The numerical model is established using the FEM software ABAQUS according to the exact geometry of the concrete specimen as shown in Figure 6a. The strip load is applied by defining a pair of loading strips that move toward each other while clamping the middle section of the model (Figure 6a). For comparison purposes, numerical models have been built for high-strength concrete specimens, low-strength concrete specimens and combined-strength concrete specimens, respectively (Figure 6b). The material property of the timber is defined as the bilinear model, which is linear in the elastic stage and maintains invariable stress in the plastic stage [38], and other solid components are modeled by the concrete damaged plasticity (CDP) model [39] with material properties prescribed in Table 3 consulting the results of tests and references [40,41,42]. The other parameters of the CDP model are listed in Table 4 [43].
The lamellar segment with a width identical to the strip load is established sandwiching the model’s middle section which is introduced in the subsequent paragraph. Regions are enclosed on the lamellar segment with their boundaries in accordance with the contour obtained through DIP techniques as described in the preceding section (Figure 6a). Different material properties are assigned to the enclosed regions corresponding to the respective components on the splitting surface according to Table 3. The wedge mesh is adopted and the swept approach is chosen to avoid the occurrence of deformed mesh due to the complex aggregate morphology, which affects the computational efficiency. For the rest of the model less affected by the strip load, the material property of concrete is assumed to be homogeneous for the purpose of simplicity as their effect on the splitting process is insignificant.
As the potential splitting face, the middle section of the model is defined by cohesive elements [44] which allow separation according to the traction–separation law [45]. Specifically, three types of cohesive elements are defined, namely, “coh_agg” sandwiched by aggregate-aggregate segment, “coh_ITZ” sandwiched by aggregate-mortar segment and “coh_mortar” sandwiched by mortar segment (Figure 7). The material properties of three types of cohesive elements are prescribed accordingly (Table 5) [46,47,48]. It should be noted that theoretically, the initial stiffness of the cohesive element becomes infinity due to its thickness of 0, which cannot be used for numerical calculations. Therefore, a large value (e.g., 106) is usually chosen as the initial stiffness of a cohesive element to satisfy the calculation requirements [49].

4. Results

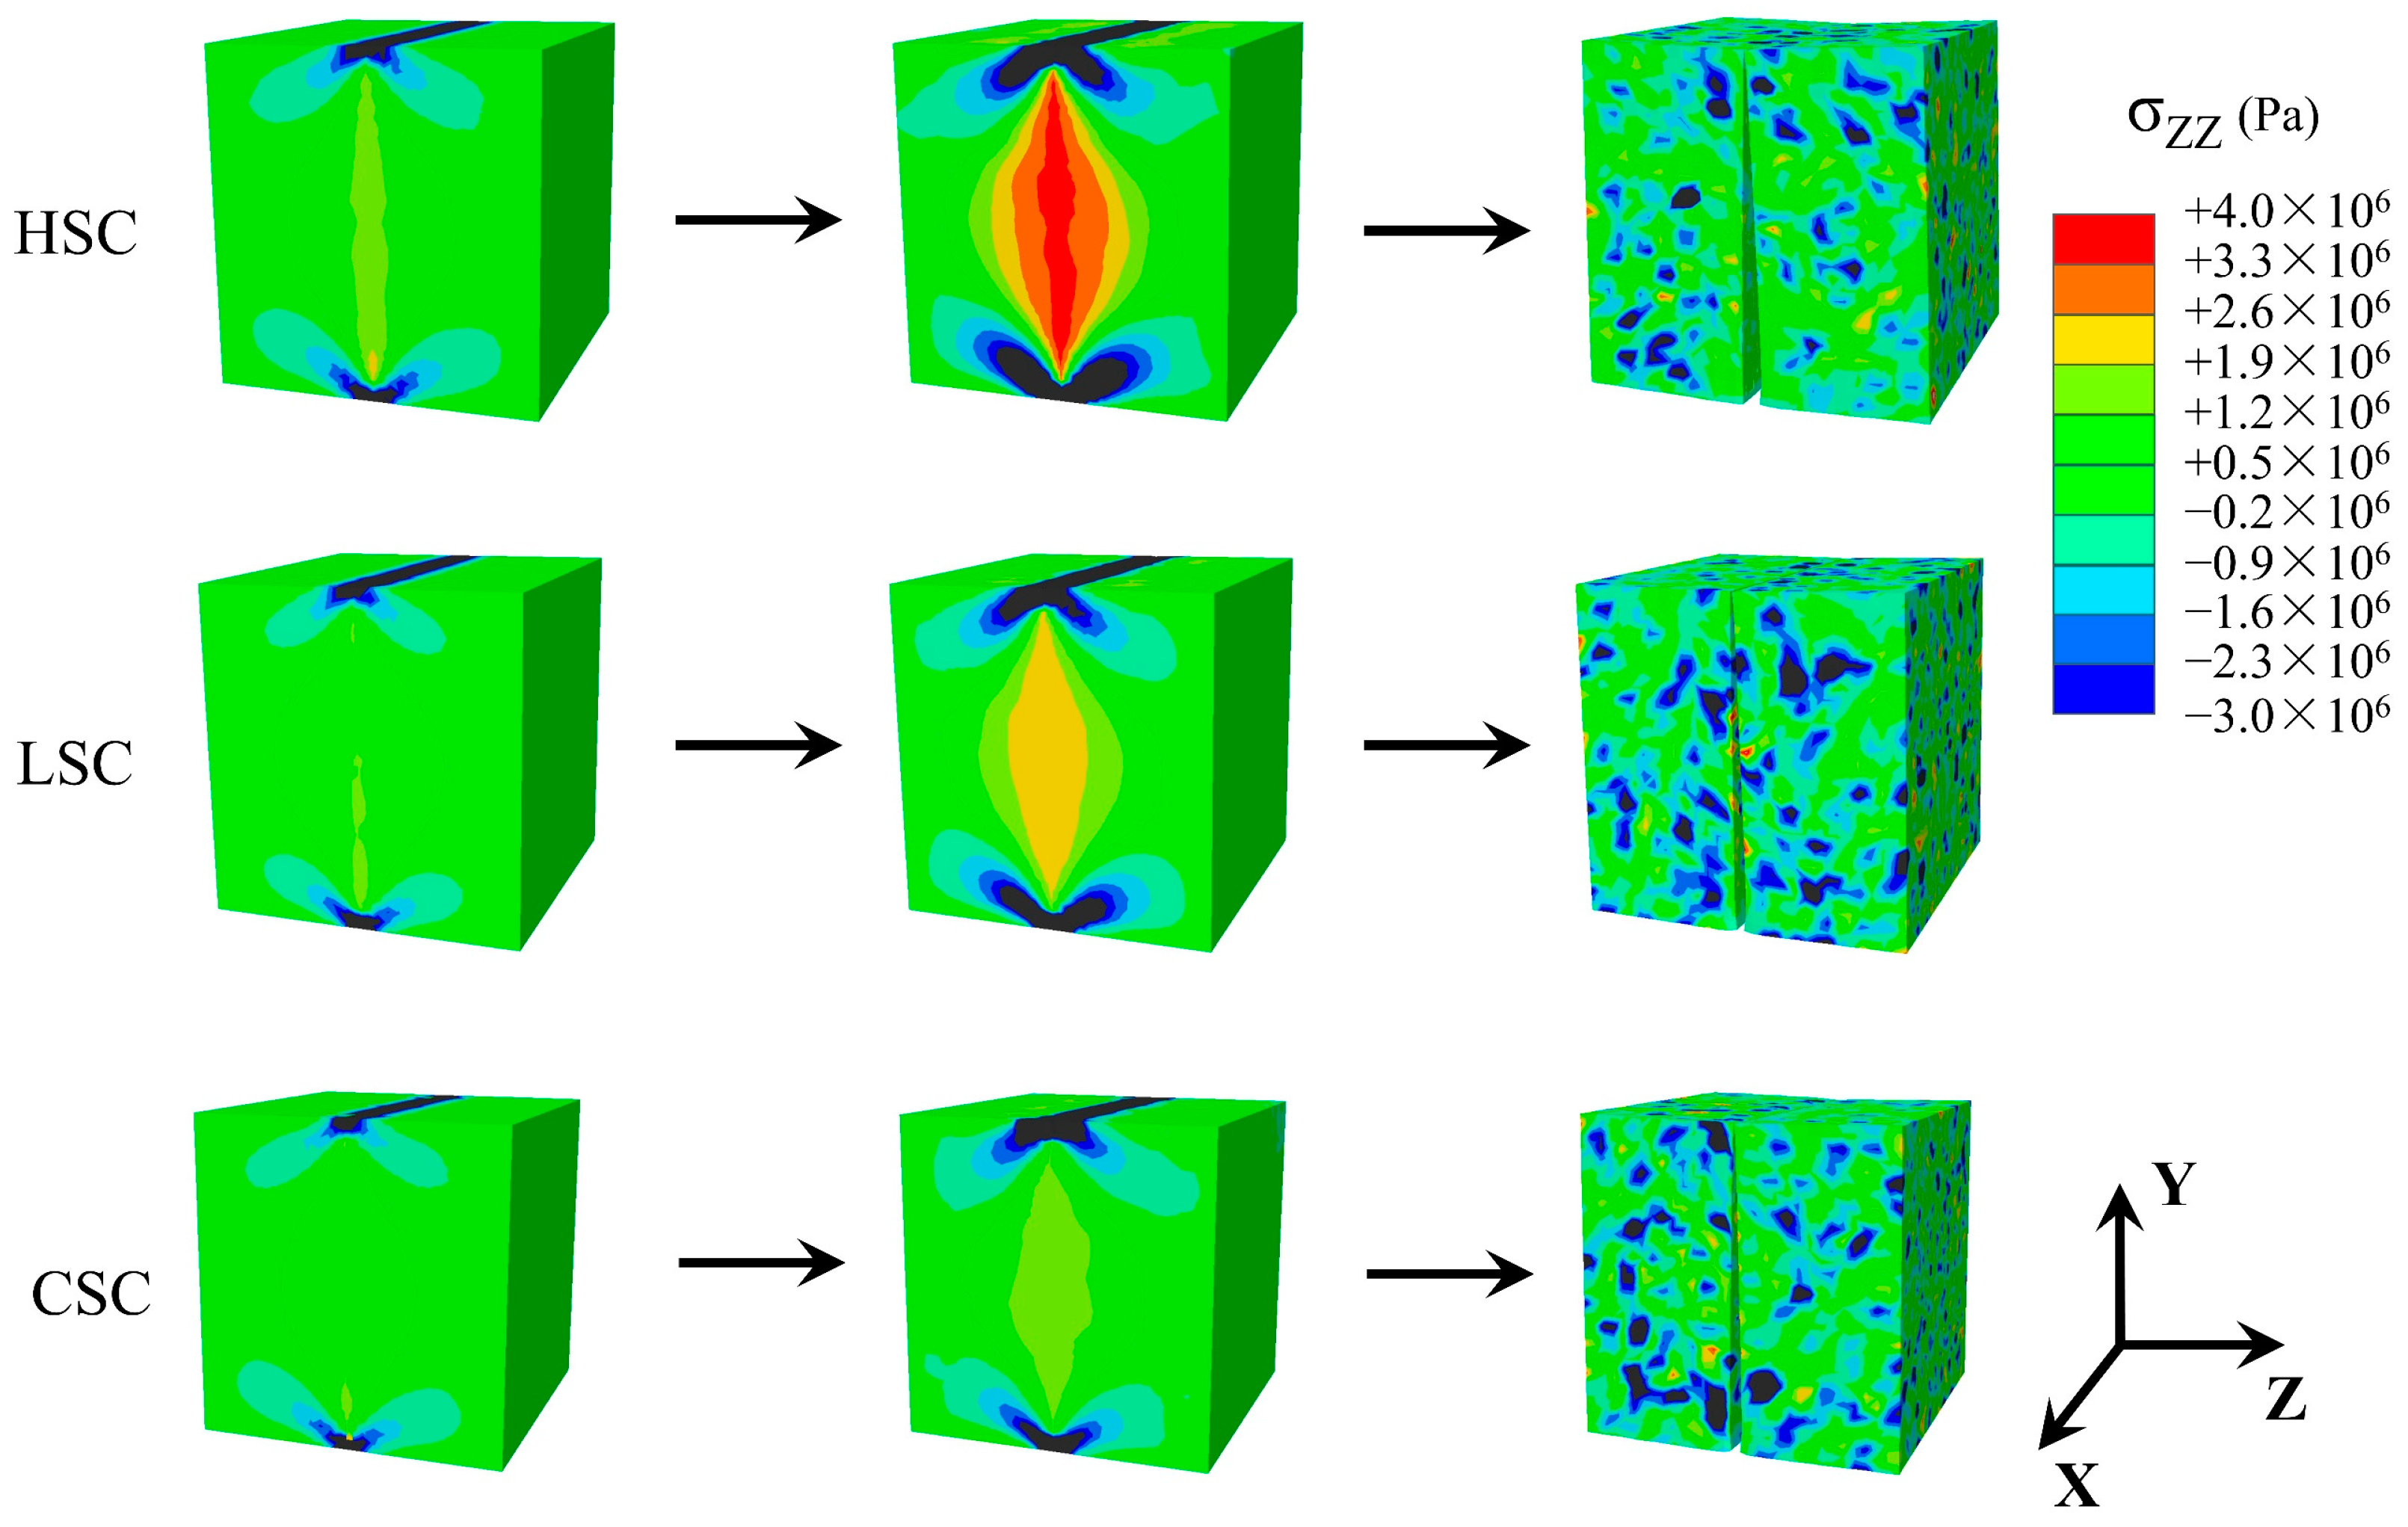
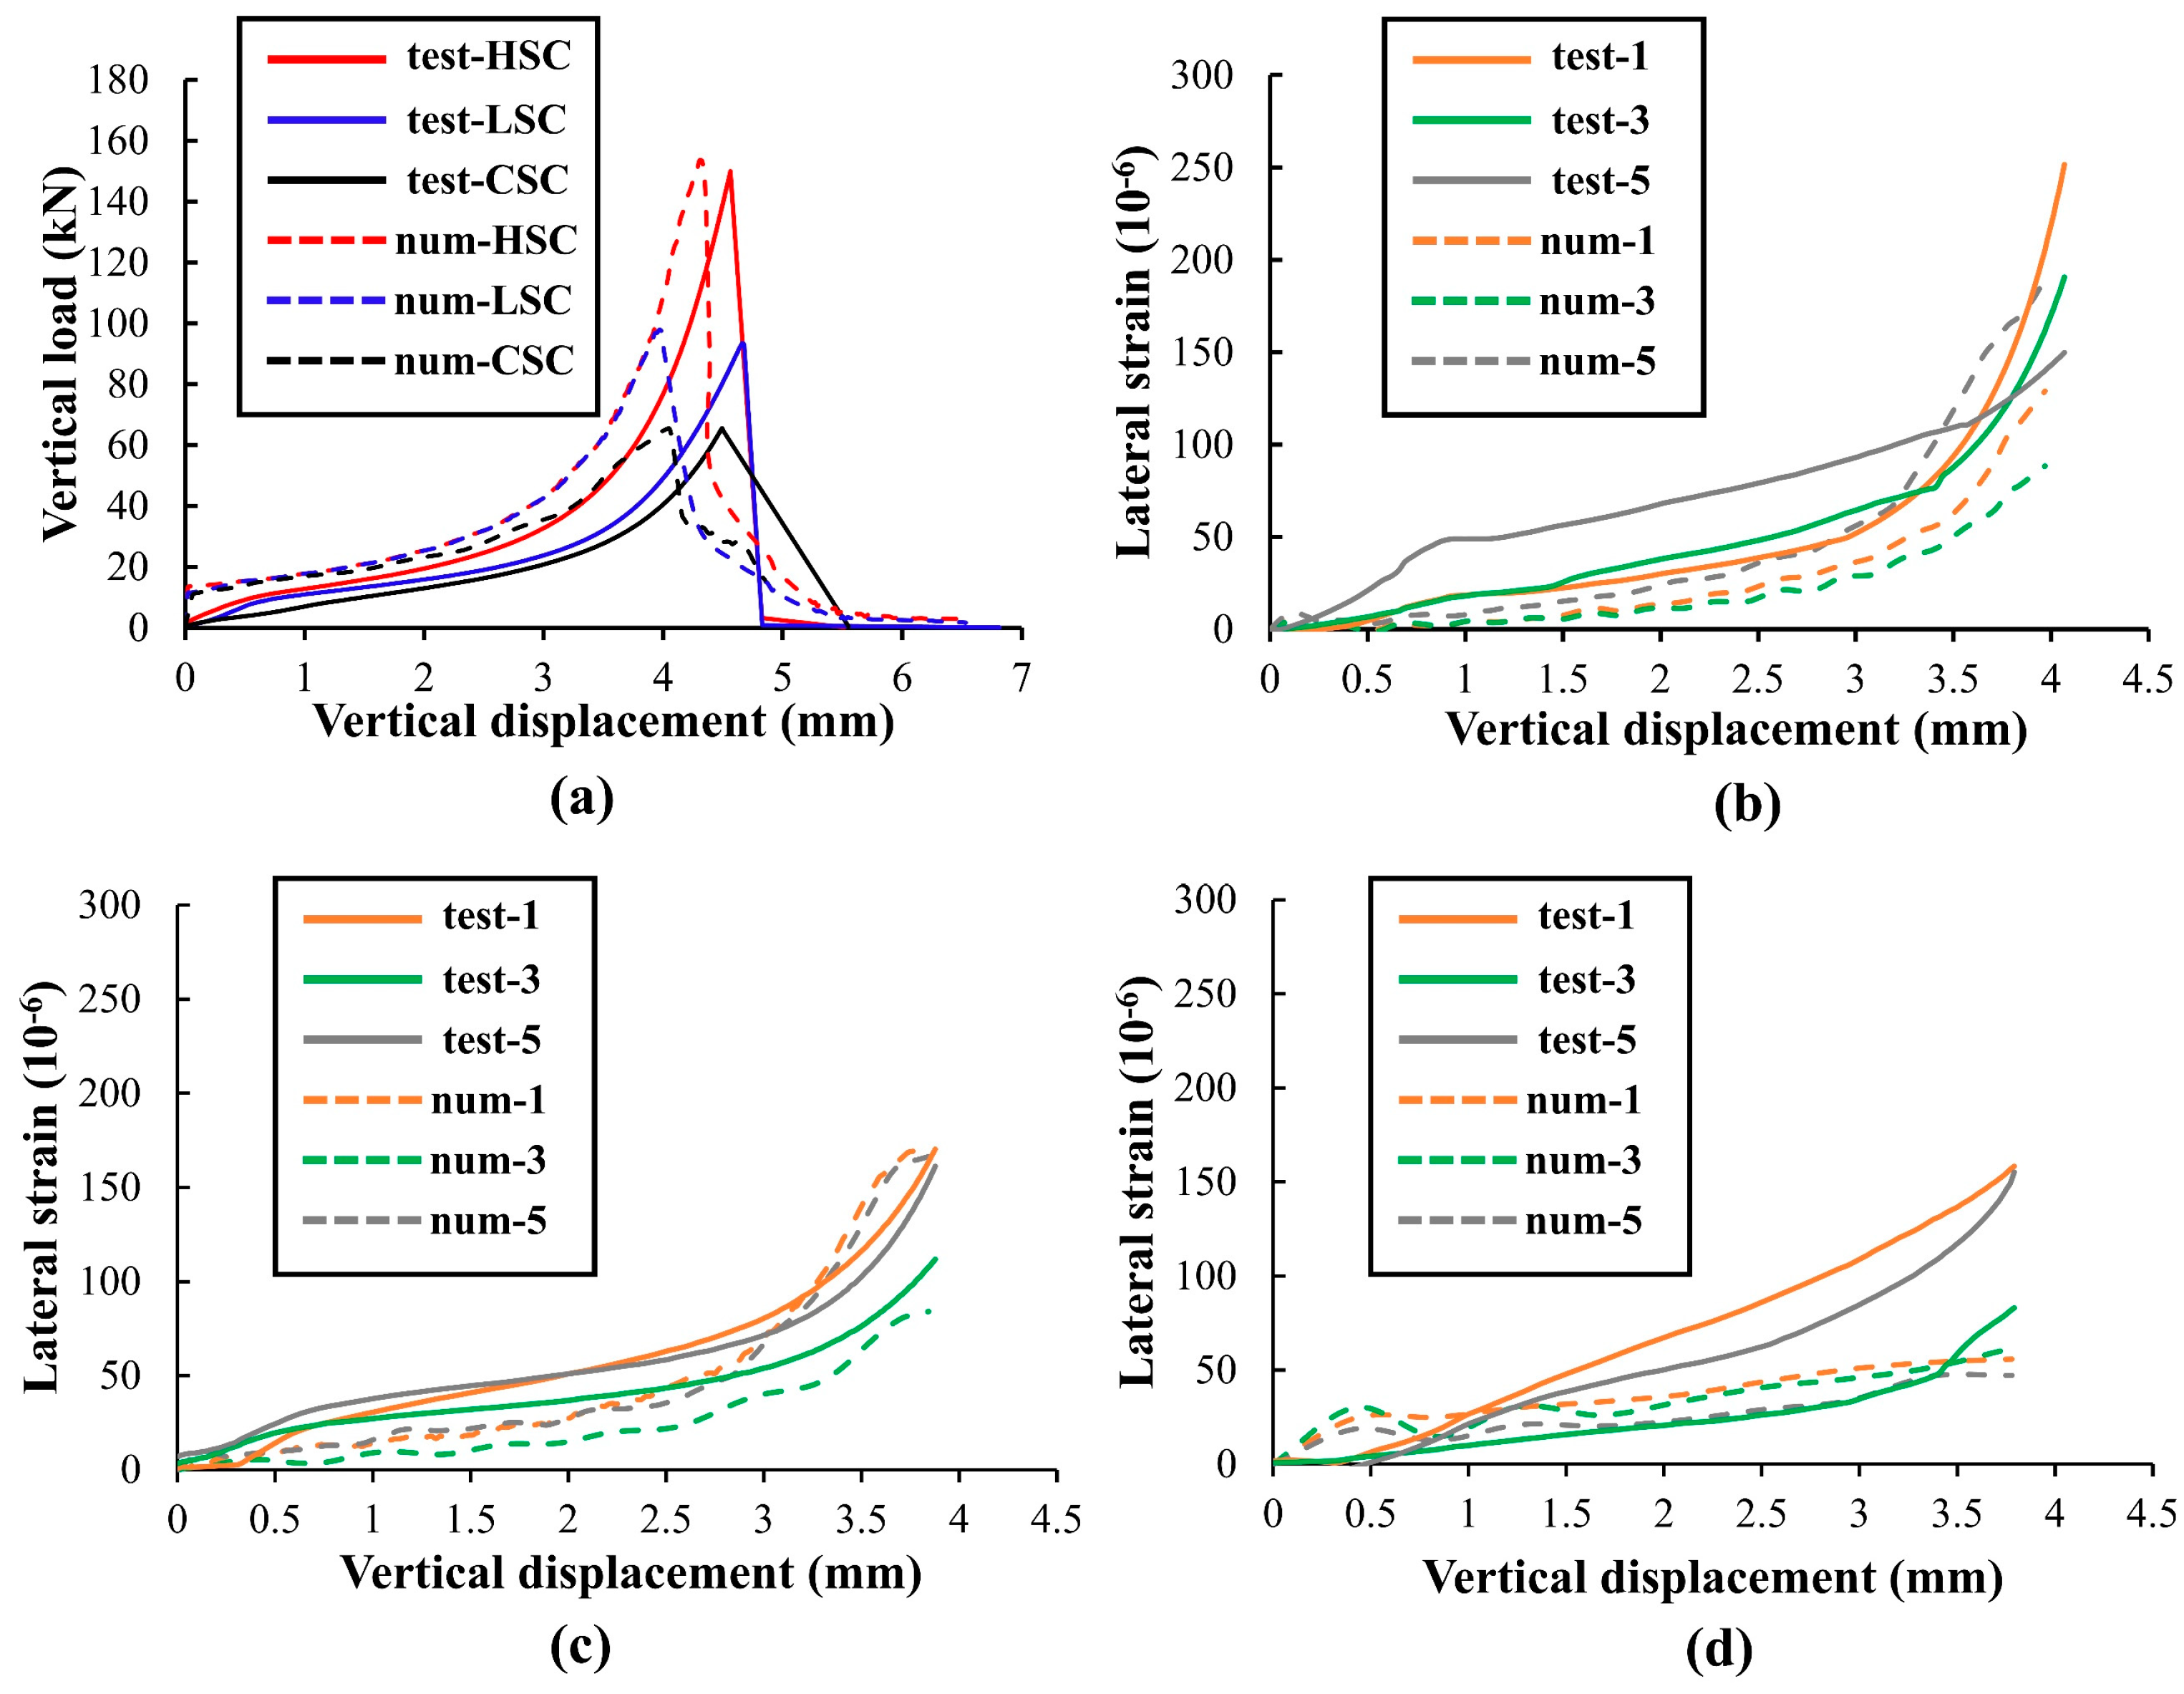
4.1. Analysis of Mechanics and Deformation

In the splitting tensile test, the stress in the horizontal direction is the principal factor leading to the tensile failure of concrete. The evolution of horizontal stress distribution ( σ z z ) in the numerical model during the loading process is presented in Figure 8. It can be observed that concentrated compressive regions appear at the top and bottom of the specimen near the loading strips at the initial stage of loading, accompanied by tensile stress concentration along the vertical mid-section (Figure 8 left). The tensile region is most widely distributed at the middle height of the specimen, with a gradual decrease towards the top and bottom ends and eventually transformed into the compressive region (Figure 8 middle). At the latter stage of the loading, the tensile stress at the mid-section of the specimen reaches the maximum value, which causes the cohesive elements to fracture; meanwhile, the stress is dissipated (Figure 8 right). Figure 8 also reveals that the maximum tensile stress achieved in the HSC model before breach is larger than the LSC model and that the CSC model is the smallest, which reflects the actual order of the tensile strength among the three models. Based on the contents above, the basic stress characteristics and patterns of concrete’s failure under splitting loads can be identified, and the feasibility of the external condition settings in the numerical model is also verified.
The vertical load–vertical displacement curves and lateral strain–vertical displacement curves of the three types of concrete from the experiments are plotted in Figure 9a. The curves indicate that at the initial stage of loading, the specimen and the strips are compacted under pressure to a certain extent, which results in a large loading displacement in the vertical direction. As the specimen becomes more compacted, the vertical displacement increment gradually decreases until the specimen is damaged. The values of peak load and splitting tensile strength obtained in the tests are shown in Table 6. It can be seen from Table 6 that the splitting tensile strength follows the trend of “HSC > LSC > CSC”, and the average strength of CSC is reduced by 54.29% and 32.62% compared with that of HSC and LSC, respectively, which indicates that a comparatively weak adhesion is formed at the interface of the CSC specimen.
To further justify the numerical models, comparisons of the results between the experiments and numerical simulations are made in Figure 9, with the exact data presented in Table 7. It is seen that the load–displacement curves of the numerical models for the three types of concrete are in good agreement with those of the experiments (Figure 9a). The curves of the experiments and numerical modeling both reveal large vertical displacements (about 4 mm) at peak loads for all specimens, which are mainly due to the excessive compressive deformation of the wooden loading strips responding to the external load. However, since the material of the numerical model is continuous and the deformation of the pores inside the actual concrete is ignored, the damage displacements of simulations will be slightly smaller than those of the tests. The relative errors between the splitting tensile strength obtained by numerical simulations and lab tests are 2.36% (HSC), 4.77% (LSC) and −0.32% (CSC), respectively (Table 7).
The lateral strains of the specimens are obtained by strain gages attached at different heights along the mid-section of the specimens (strain gauges 1, 3 and 5 in Figure 2b). In the numerical model, lateral strain is also recorded at the corresponding locations for comparison (Figure 9b–d). It can be seen that the strain in the numerical simulation and the tests are in accordance and have a gradually accelerating growth tendency. The maximum value of the lateral strain before specimen failure exceeded 150 × 10−6 for all three specimens, but only the strain of the HSC specimen in the test exceeded 200 × 10−6. Therefore, it is possible to assume that the lateral strain of 150 × 10−6 is a signal for the occurrence of macroscopic cracking of concrete [50]. According to the above analysis, the numerical models provide accurate macroscopic mechanical responses for different concrete specimens, which verifies the applicability of the proposed numerical model.

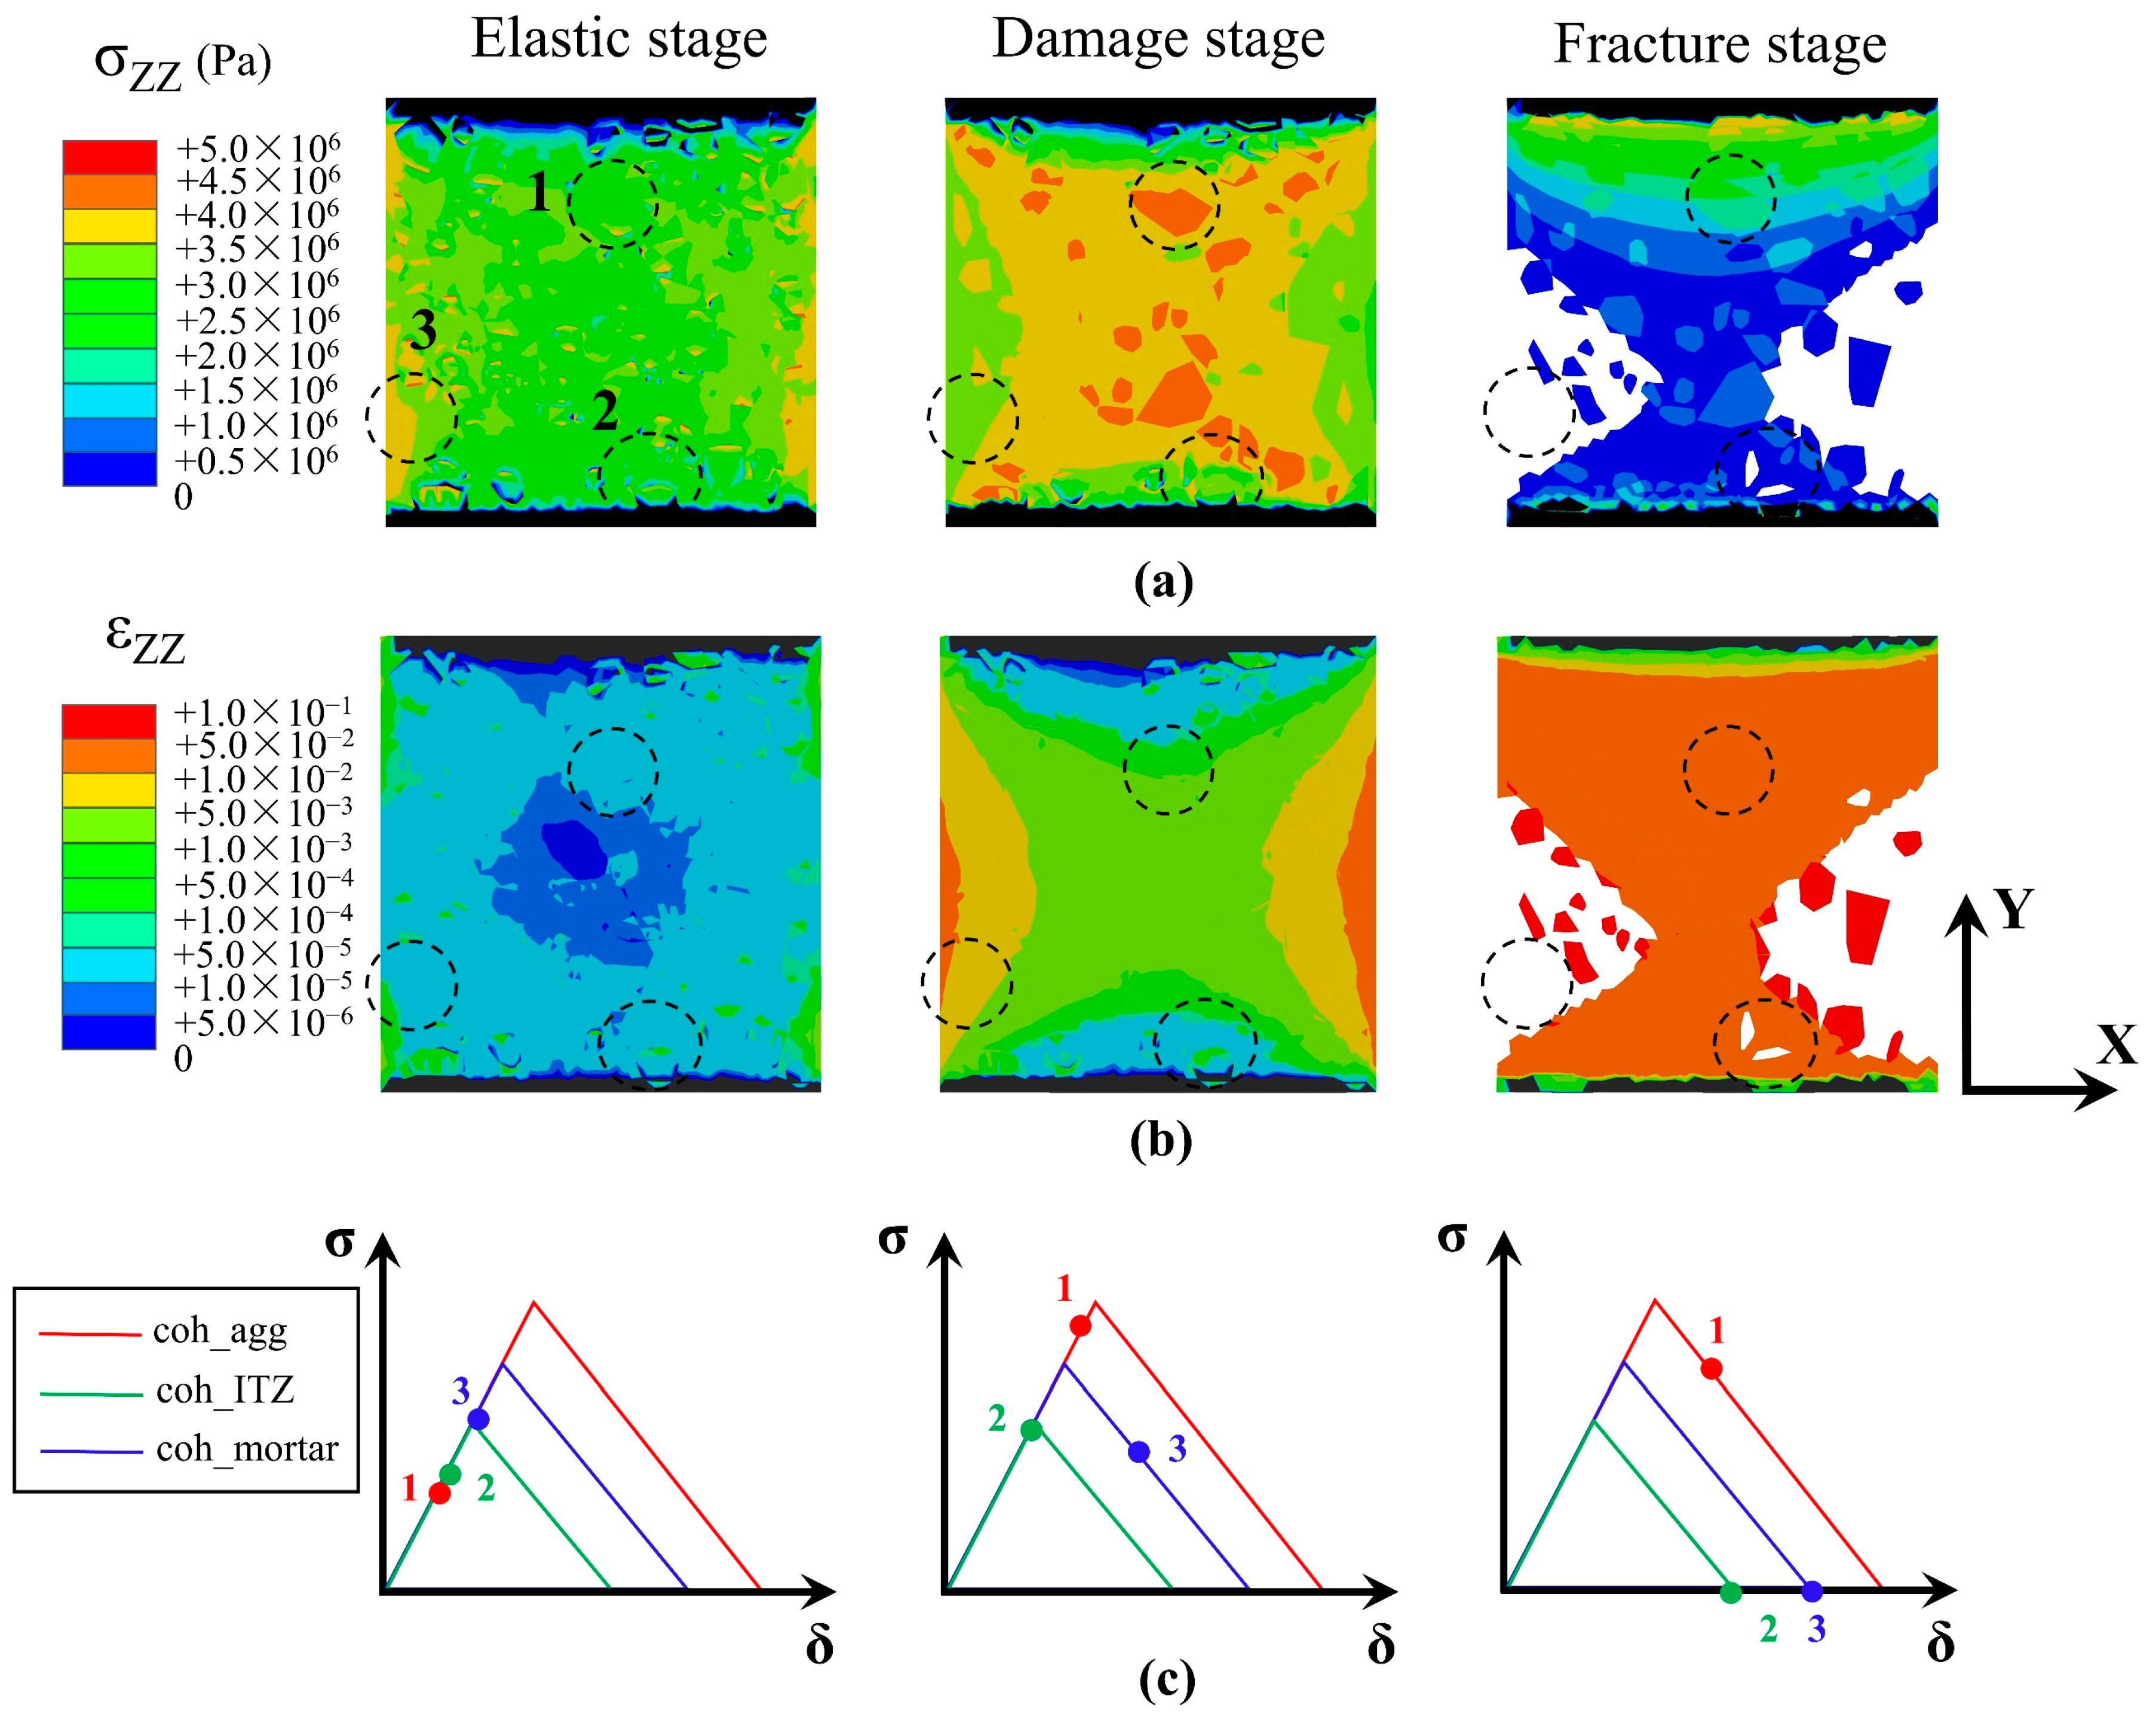
4.2. Splitting Process

As the splitting of concrete under strip load is transient, direct visual observation of the damage and fracture process is difficult to achieve during the test. Therefore, it is beneficial to look into the splitting process with the help of a realistic heterogeneous numerical model. In this section, analysis of the separating evolution at the mid-section of the concrete specimen is performed using the HSC model as an example. The normal stress and strain distributions on the mid-section of the numerical model are illustrated in Figure 10. Three critical regions are selected for comparison as enclosed by black circles 1, 2 and 3 in Figure 10, where the elements in region 1 are the cohesive elements of aggregates (i.e., coh_agg), those in region 2 are the cohesive elements of ITZs (i.e., coh_ITZ) and those in region 3 are the cohesive elements of mortar (i.e., coh_mortar). The magnitude of stress and strain of the three circled regions is illustrated correspondingly in Figure 10c. Accordingly, the cracking process is mainly divided into three stages: elastic stage, damage stage, and fracture stage. At the beginning of the elastic stage, both the stress and strain decrease as the location approaches the center of the mid-section because the constraint is stronger in the interior of the concrete than at the periphery (Figure 10a left and Figure 10b left). Since the stress–strain maintains a linear elastic relationship, the stress and strain of three regions follow the order of region 1 > region 2 > region 3 as shown in Figure 10c. As the external load increases, the stress concentration is more pronounced at the center while decreases approaching the periphery of the mid-section (Figure 10a middle), which is contrary to the previous initial elastic stage. The strain at the center of the mid-section remains smaller than that in the peripheral regions at the same height, while it is greater than the strain near the top and bottom of the mid-section (Figure 10b middle). This phenomenon can be explained according to Figure 10c: the materials have transitioned to the damage stage in weaker areas such as ITZ and mortar (regions 2 and 3) even with less concentrated stress and lower strain because of the low strength in these areas, and the aggregate (region 1) still behaves elastically with higher strength (in fact, due to its greater elastic modulus, the stress in aggregate of region 1 is even apparently higher than that in the material of its surround area). At the fracture stage, the decline in the load-bearing capacity in ITZ and mortar (regions 2 and 3) has caused the cohesive elements in these regions to separate first and thus form the initial cracks on the mid-section (Figure 10a right and Figure 10b right). According to the right image of Figure 10c, the ITZ (region 2) is the first region to crack, followed by the mortar (region 3), and finally the aggregate (region 1) at similar strain levels. This cracking order actually reflects the adhesive strength of different components and indicates that increasing the area of aggregate can enhance the splitting and tensile strength for a cross-section.

5. Discussion

The above results show that the numerical model established by DIP techniques accurately reflects the mechanical behavior of the failed specimen. However, reconstruction of the splitting surface featuring its actual heterogeneous characteristics is complex and time consuming. This section discusses the applicability of a simplified modeling approach which can improve the computational efficiency while still maintaining a satisfactory accuracy. More simplification procedures are adopted here: (1) calculating the area proportion of each component by DIP techniques; (2) simplifying the shapes of aggregates and ITZs to regular shapes (e.g., circular areas in this study) with their areas in accordance with the respective proportions calculated in the first step, and distributed these regular shapes uniformly on the middle section of the numerical model (Figure 11). Therefore, the total area of each component on the mid-section of the model is identical to that of the actual specimen. Based on the results of the DIP technique, the area proportion of each component in the three types of concrete is shown in Table 8.
As a result of the simplification, no distorted meshes will be caused by complex shapes of component contour boundary, which is effective in improving the smallest stable time increment (Figure 12a). It can be observed that the smallest stable time increment of the HSC model has an increase of 192.86% after simplification, while the increases in the smallest stable time increment of the LSC and CSC models are 122.70% and 74.41%, respectively. As the smallest stable time increment increases, the total increment required for completing the computation decreases significantly, resulting in a reduction in the time spent on the computation. As shown in Figure 12b, the total increments are reduced to less than 2 × 10⁵ for all three models after simplification, with detail reductions of 58.13% (HSC), 48.91% (LSC) and 43.82% (CSC), respectively.
The calculation results of simplified models are presented in Table 9. Compared with the original model, the splitting tensile strength of the HSC specimen and LSC specimen are slightly reduced after simplification, while the tensile strength of the CSC specimen is slightly increased. This indicates that the shape of different components has a weak correlation with splitting tensile strength and the variation is probably caused by the difference between the original model and the simplified model: in the original model, some of the aggregates are concentrated, resulting in a higher load-bearing capacity in local areas. In contrast, the simplified model has a uniform distribution of all components, reducing the effect of aggregate concentration. Moreover, the smallest error between the numerical model and lab test reduced to only 0.11% after simplification. This shows that a simplified model improves the computational efficiency while increasing the accuracy of the calculations, which is mainly due to the significant reduction in distorted meshes that affect the calculation accuracy in the original model.
This simplified modeling approach may provide a faster way to predict the splitting strength of concrete as long as the areas of each component on the potential splitting surface are obtained. For example, a few CT photographs of a mid-section of the concrete specimen would be enough for the establishment of the model to predict the splitting tensile strength of concrete.

6. Conclusions

The proposed numerical models established with the help of DIP techniques precisely reflect the heterogeneous characteristics on the splitting surface and successfully simulate the splitting process of concrete specimens. The results of the numerical simulations are highly consistent with the test results and the errors in tensile strength are 2.36% (HSC), 4.77% (LSC) and −0.32% (CSC). The fracture characteristics and the effect of heterogeneity on the splitting process are specifically investigated. It is clarified by the model that the tensile stresses are widely distributed and concentrated in the center of the middle section when concrete is subjected to splitting loads. A significant regularity is found from the simulation that the concrete fracture initiates from the periphery towards the center, with the ITZ region splitting first at similar levels of strain, followed by the mortar region and finally the aggregate region.
A feasible simplified modeling scheme with enhanced computational efficiency and accuracy is proposed. The smallest stable time increment increased by 192.86% (HSC), 122.70% (LSC) and 74.41% (CSC) after simplification, while the total increment reduced by 58.13% (HSC), 48.91% (LSC) and 43.82% (CSC), respectively. The errors in the tensile splitting strength of the simplified model to the test data are −0.26% (HSC), −4.43% (LSC), and 0.11% (CSC), respectively, which are slightly lower than the original models, indicating that the shape of the different heterogeneous components in concrete has a low effect on splitting tensile strength. The proposed simplified modeling approach provides a possible non-destructive way to perform the prediction of concrete’s splitting strength. However, it is worth noting that the original model is capable of providing a more realistic presentation of the splitting process than the simplified model.
It is important to note that the areas and positions of the different components on the splitting surface can also affect the fracture process and the strength of the concrete, as they may lead to the corresponding degree of stress concentration. Therefore, the effect of the areas and positions of different components should be further investigated in detail to improve the current simplified modeling schemes, for instance by changing the distribution density of the components in the model, so both the mechanical response and splitting process can be reflected more realistically. These issues are to be discussed in a possible future work.

Author Contributions

Conceptualization, X.L.; Methodology, H.L. (Houquan Lin); Formal analysis, H.L. (Houquan Lin), D.L., Z.H., X.L. and Z.Y.; Investigation, H.L. (Houquan Lin) and Z.H.; Resources, Z.Y.; Data curation, D.L. and H.L. (Hui Li); Writing—original draft, H.L. (Houquan Lin); Writing—review & editing, D.L., Z.H., X.L. and H.L. (Hui Li); Supervision, J.L.; Project administration, J.L.; Funding acquisition, D.L. All authors have read and agreed to the published version of the manuscript.

Funding

This work was supported by the National Natural Science Foundation of China (NSFC, Grant number 52274106), National Key Research and Development Program of China (Grant number 2022YFC3002903), Technology Innovation Project of the Department of Housing and Urban Rural Development of Guangdong Province, China (Grant number 2022-K4-231814 and 2022-K4-065552).

Data Availability Statement

The original contributions presented in the study are included in the article, further inquiries can be directed to the corresponding author.

Conflicts of Interest

Author Hui Li was employed by the company Huai’an Water Conservancy Survey and Design Institute Co., Ltd. The remaining authors declare that the research was conducted in the absence of any commercial or financial relationships that could be construed as a potential conflict of interest.

Nomenclature

Abbreviation
DIPDigital image processing
ITZInterfacial transition zone
CTComputed tomography
HSCHigh-strength concrete
LSCLow-strength concrete
CSCCombined-strength concrete
FEMFinite element method
CDPConcrete damaged plasticity
coh_aggCohesive elements sandwiched by aggregate-aggregate segment
coh_ITZCohesive elements sandwiched by aggregate-mortar segment
coh_motarCohesive elements sandwiched by mortar segment
Notation
σ c t Tensile splitting strength
P m a x Peak axial load
D 1 Length of the side of the sample parallel to the loading strip
D 2 Height of the specimen
S 1 Lower threshold
S 2 Upper threshold
ρ Density
E c Young’s modulus
v Poisson’s ratio
f c * Compressive strength
f t * Tensile strength
φ Dilation angle
ε Flow potential eccentricity
f b 0 Initial equibiaxial compressive yield stress
f c 0 Initial uniaxial compressive yield stress
KRatio of the second stress invariant on the tensile meridian to that on the compressive meridian
μ Viscosity parameter
k 0 Initial stiffness
f t Cohesive strength
G c Fracture energy
σ z z Horizontal stress along the Z-direction
ε z z Horizontal strain along the Z-direction
σ Stress
δ Separation distance of cohesive elements

References

  1. Iskhakov, I.; Ribakov, Y. Structural phenomenon based theoretical model of concrete tensile behavior at different stress-strain conditions. J. Build. Eng. 2021, 33, 101594. [Google Scholar] [CrossRef]
  2. Cotsovos, D.M.; Pavlović, M.N. Numerical investigation of concrete subjected to high rates of uniaxial tensile loading. Int. J. Impact Eng. 2008, 35, 319–335. [Google Scholar] [CrossRef]
  3. Vořechovský, M.; Sadílek, V. Computational modeling of size effects in concrete specimens under uniaxial tension. Int. J. Fract. 2008, 154, 27–49. [Google Scholar] [CrossRef]
  4. Khosravani, M.R.; Silani, M.; Weinberg, K. Fracture studies of Ultra-High Performance Concrete using dynamic Brazilian tests. Theor. Appl. Fract. Mech. 2018, 93, 302–310. [Google Scholar] [CrossRef]
  5. Abrishambaf, A.; Barros, J.A.O.; Cunha, V.M.C.F. Tensile stress–crack width law for steel fibre reinforced self-compacting concrete obtained from indirect (splitting) tensile tests. Cem. Concr. Compos. 2015, 57, 153–165. [Google Scholar] [CrossRef]
  6. Wu, Z.; Zhang, J.; Yu, H.; Wu, Q.; Da, B. Computer-aided investigation of the tensile behavior of concrete: Relationship between direct and splitting tensile strength. Structures 2023, 55, 453–467. [Google Scholar] [CrossRef]
  7. Diamond, S. Considerations in image analysis as applied to investigations of the ITZ in concrete. Cem. Concr. Compos. 2001, 23, 171–178. [Google Scholar] [CrossRef]
  8. Zhang, J.; Ma, R.; Pan, Z.; Zhou, H. Review of Mesoscale geometric models of concrete materials. Buildings 2023, 13, 2428. [Google Scholar] [CrossRef]
  9. Jin, L.; Liu, M.; Zhang, R.; Du, X. Cracking of cover concrete due to non-uniform corrosion of corner rebar: A 3D meso-scale study. Constr. Build. Mater. 2020, 245, 118449. [Google Scholar] [CrossRef]
  10. Meng, Z.; Liu, Q.F.; She, W.; Cai, Y.; Yang, J.; Farjad Iqbal, M. Electrochemical deposition method for load-induced crack repair of reinforced concrete structures: A numerical study. Eng. Struct. 2021, 246, 112903. [Google Scholar] [CrossRef]
  11. Tong, L.Y.; Qin, X.X.; Zhang, M.Z.; Meng, Z.Z.; Meftah, F.; Liu, Q.F. Multi-scale modelling and statistical analysis of heterogeneous characteristics effect on chloride transport properties in concrete. Constr. Build. Mater. 2023, 367, 130096. [Google Scholar] [CrossRef]
  12. Fang, Q.; Zhang, J.H.; Zhang, Y.D.; Liu, J.C. Mesoscopic investigation of the sand particulate system subjected to intense dynamic loadings. Int. J. Impact Eng. 2016, 89, 62–71. [Google Scholar] [CrossRef]
  13. Ren, W.Y.; Yang, Z.J.; Sharma, R.; Zhang, C.; Withers, P.J. Two-dimensional X-ray CT image based meso-scale fracture modelling of concrete. Eng. Fract. Mech. 2015, 133, 24–39. [Google Scholar] [CrossRef]
  14. Deng, Z.Y.; Chen, P.; Liu, X.R.; Du, L.B.; Tan, J.K.; Liang, N.H. Study on the tensile and compressive mechanical properties of multi-scale fiber-reinforced concrete: Laboratory test and mesoscopic numerical simulation. J. Build. Eng. 2024, 86, 108852. [Google Scholar] [CrossRef]
  15. Bentz, D.P.; Barboczi, E.J. Digital-image-based computer modelling of cement-based materials. In Digital Image Processing: Techniques and Application in Civil Engineering; Frost, J.D., Wright, J.R., Eds.; ASCE: New York, NY, USA, 1993; pp. 44–51. [Google Scholar]
  16. Bentz, D.P.; Garboczi, E.J.; Jennings, H.M.; Quenard, D.A. Multi-Scale Digital-Image-Based Modelling of Cement-Based Materials. MRS Online Proc. Libr. 1994, 370, 33–41. [Google Scholar] [CrossRef]
  17. Khormani, M.; Kalat Jaari, V.R. Statistical analysis of the compressive strength of concrete using 2D DIP technology and Finite Element Method. Case Stud. Constr. Mater. 2023, 19, e02461. [Google Scholar] [CrossRef]
  18. Yu, Q.L.; Liu, H.Y.; Yang, T.H.; Liu, H.L. 3D numerical study on fracture process of concrete with different ITZ properties using X-ray computerized tomography. Int. J. Solids Struct. 2018, 147, 204–222. [Google Scholar] [CrossRef]
  19. Peng, Y.J.; Ying, L.P.; Kamel, M.M.A.; Wang, Y. Mesoscale fracture analysis of recycled aggregate concrete based on digital image processing technique. Struct. Concr. 2021, 22, E33–E47. [Google Scholar] [CrossRef]
  20. Yu, J.J.; Li, G.D.; Ren, Z.Y.; Zhang, W.; Tang, J.Q.; Zhang, L.; Si, X.L.; Zhao, Z.M. Mixed-mode I-II mesoscale fracture behavior of concrete determined by the realistic aggregate numerical model. Constr. Build. Mater. 2019, 226, 802–817. [Google Scholar]
  21. Zhang, S.; Hamed, E.; Song, C.M. Computational modelling of the basic creep of concrete: An image-based meso-scale approach. Eng. Anal. Bound. Elem. 2022, 136, 64–76. [Google Scholar] [CrossRef]
  22. Cai, K.P.; Wang, G.Q.; Li, W.; Long, W. Numerical simulation of concrete strength based on microstructure and mineral composition analysis using micro-CT and XRD technology. Constr. Build. Mater. 2024, 432, 136505. [Google Scholar] [CrossRef]
  23. Huang, M.; Li, Y.M. X-ray tomography image-based reconstruction of microstructural finite element mesh models for heterogeneous materials. Comput. Mater. Sci. 2013, 67, 63–72. [Google Scholar] [CrossRef]
  24. Xue, G.L.; Yilmaz, E.; Song, W.D.; Cao, S. Analysis of internal structure behavior of fiber reinforced cement-tailings matrix composites through X-ray computed tomography. Compos. Part B Eng. 2019, 175, 107091. [Google Scholar] [CrossRef]
  25. Wen, F.S.; Li, W.C.; Zhou, G.F.; Li, H.J.; Chen, T.; Zhang, K.Q. A simplified numerical simulation of uniaxial compression for polyacrylonitrile fiber reinforced permeable concrete based on CT images. Constr. Build. Mater. 2024, 411, 134319. [Google Scholar] [CrossRef]
  26. Feng, X.H.; Gong, B.; Tang, C.A.; Zhao, T. Study on the non-linear deformation and failure characteristics of EPS concrete based on CT-scanned structure modelling and cloud computing. Eng. Fract. Mech. 2022, 261, 108214. [Google Scholar] [CrossRef]
  27. Khormani, M.; Kalat Jaari, V.R.; Aghayan, I.; Ghaderi, S.H.; Ahmadyfard, A. Compressive strength determination of concrete specimens using X-ray computed tomography and finite element method. Constr. Build. Mater. 2020, 256, 119427. [Google Scholar] [CrossRef]
  28. Meng, Q.X.; Xu, W.Y.; Wang, H.L.; Zhuang, X.Y.; Xie, W.C.; Rabczuk, T. DigiSim—An open source software package for heterogeneous material modeling based on digital image processing. Adv. Eng. Softw. 2020, 148, 102836. [Google Scholar] [CrossRef]
  29. Mishnaevsky, L.L.; Schmauder, S. Continuum mesomechanical finite element modeling in materials development: A state-Of-The-Art review. Appl. Mech. Rev. 2001, 54, 49–67. [Google Scholar] [CrossRef]
  30. Shakir, Q.M.; Hanoon, H.K. New models for reinforced concrete precast hybrid deep beams under static loads with curved hybridization. Structures 2023, 54, 1007–1025. [Google Scholar] [CrossRef]
  31. Shakir, Q.M.; Alliwe, R. Upgrading of deficient disturbed regions in precast RC beams with near surface mounted (NSM) steel bars. J. Mater. Eng. Struct. 2020, 7, 167–184. [Google Scholar]
  32. GB/T50081-2002; Ministry of Construction of the People’s Republic of China. Standard for Test Method of Mechanical Properties on Ordinary Concrete. China Architecture & Building Press: Beijing, China, 2003. (In Chinese)
  33. ASTM C 469-2002; Standard Test Method for Static Modulus of Elasticity and Poisson’s Ratio of Concrete in Compression. ASTM. International: West Conshohocken, PA, USA, 2002.
  34. ASTM C 138-2001; Standard Test Method for Unit Weight, Yield, and Air Content (Gravimetric) of Concrete. ASTM. International: West Conshohocken, PA, USA, 2001.
  35. BS 1881-117; Testing Concrete—Part 117: Method for Determination of Tensile Splitting Strength. British Standards Institution: London, UK, 1983.
  36. Hammoumi, A.; Moreaud, M.; Jeulin, D.; Jolimaitre, E.; Chevalier, T.; Sorbier, L.; Klotz, M.; Novikov, A. A novel physisorption model based on mathematical morphology operators preserving exact pore morphology and connectivity. Microporous Mesoporous Mater. 2022, 337, 111847. [Google Scholar] [CrossRef]
  37. Graham, R.L. An Efficient Algorithm for Determining the Convex Hull of a Finite Planar Set. Inf. Process. Lett. 1972, 1, 132–133. [Google Scholar] [CrossRef]
  38. Wang, T.X.; Wang, Y.; Crocetti, R.; Wålinder, M. Influence of face grain angle, size, and moisture content on the edgewise bending strength and stiffness of birch plywood. Mater. Des. 2022, 223, 111227. [Google Scholar] [CrossRef]
  39. GB 50010-2010; Ministry of Housing and Urban-Rural Development of the People’s Republic of China. Code for Design of Concrete Structures. China Architecture & Building Press: Beijing, China, 2015. (In Chinese)
  40. Zhao, H.Y.; Wu, Z.H.; Liu, A.; Zhang, L.C. Numerical insights into the effect of ITZ and aggregate strength on concrete properties. Theor. Appl. Fract. Mech. 2022, 120, 103415. [Google Scholar] [CrossRef]
  41. Kılıç, A.; Atiş, C.D.; Teymen, A.; Karahan, O.; Özcan, F.; Bilim, C.; Özdemir, M. The influence of aggregate type on the strength and abrasion resistance of high strength concrete. Cem. Concr. Compos. 2008, 30, 290–296. [Google Scholar] [CrossRef]
  42. Zhou, F.P.; Lydon, F.D.; Barr, B.I.G. Effect of coarse aggregate on elastic modulus and compressive strength of high performance concrete. Cem. Concr. Res. 1995, 25, 177–186. [Google Scholar] [CrossRef]
  43. ABAQUS/CAE User’s Manual; ABAQUS, Inc.: Palo Alto, CA, USA, 2004.
  44. Zhu, S.S.; Zhou, Z.F.; Xiong, Y. Mesoscale fracture analysis of three-point bending concrete beams based on cohesive zone model. Eng. Fract. Mech. 2024, 296, 109828. [Google Scholar] [CrossRef]
  45. Viñuela, J.Z.; Torres, M.; Silva, R.G. Cohesive zone modeling in load–unload situations. Int. J. Mech. Sci. 2022, 222, 107205. [Google Scholar] [CrossRef]
  46. Tang, L.W.; Zhou, W.; Liu, X.H.; Ma, G.; Chen, M.X. Three-dimensional mesoscopic simulation of the dynamic tensile fracture of concrete. Eng. Fract. Mech. 2019, 211, 269–281. [Google Scholar] [CrossRef]
  47. Huang, Y.J.; Yang, Z.J.; Zhang, H.; Natarajan, S. A phase-field cohesive zone model integrated with cell-based smoothed finite element method for quasi-brittle fracture simulations of concrete at mesoscale. Comput. Methods Appl. Mech. Eng. 2022, 396, 115074. [Google Scholar] [CrossRef]
  48. Li, Y.; Hao, Z.; Shen, Z.; Fu, P.; Zhang, J. Mesoscopic modeling and simulation of tensile properties of cracked concrete using cohesive model. Case Stud. Constr. Mater. 2023, 18, e02186. [Google Scholar] [CrossRef]
  49. Naderi, S.; Zhang, M.Z. Meso-scale modelling of static and dynamic tensile fracture of concrete accounting for real-shape aggregates. Cem. Concr. Compos. 2021, 116, 103889. [Google Scholar] [CrossRef]
  50. Carmona, S.; Aguado, A. New model for the indirect determination of the tensile stress–strain curve of concrete by means of the Brazilian test. Mater. Struct. 2012, 45, 1473–1485. [Google Scholar] [CrossRef]
Figure 1. Geometry of concrete specimens: (a) Geometry of high-strength or low-strength concrete, (b) geometry of combined-strength concrete, (c) actual specimens in tests.
Buildings 14 01856 g001
Figure 2. (a) The MTS 322 testing system, (b) loading frame of tensile splitting test, (c) locations of strain gages on the concrete specimen.
Buildings 14 01856 g002
Figure 3. Two sides of the splitting surface of the tested concrete specimens placed symmetrically.
Buildings 14 01856 g003
Figure 4. Image processing of the splitting surface of a low-strength concrete sample: (a) optimized grayscale image, (b) grayscale histogram, (c) binary image.
Buildings 14 01856 g004
Figure 5. Simplification treatments on the binary image: (a) removing the white spots on the binary image, (b) material contours on the splitting surface, (c) simplification of the contour image by convex hull algorithm.
Buildings 14 01856 g005
Figure 6. Numerical model of the concrete specimen: (a) geometry of the numerical model, (b) established model for high-strength concrete, low-strength concrete and combined-strength concrete specimens.
Buildings 14 01856 g006
Figure 7. Three types of cohesive elements on the mid-section of the numerical model.
Buildings 14 01856 g007
Figure 8. Contour of horizontal stress σzz (MPa) of numerical models during the loading process.
Buildings 14 01856 g008
Figure 9. (a) Vertical load–displacement curves of the concrete samples, (b) lateral strain–vertical displacement curves of the HSC sample, (c) lateral strain–vertical displacement curves of the LSC sample, (d) lateral strain–vertical displacement curves of the CSC sample.
Buildings 14 01856 g009
Figure 10. Splitting process of HSC model: (a) normal stress distribution and (b) normal strain distribution on mid-section of model, (c) conceptual illustration of tensile normal stress versus separation distance of cohesive elements.
Buildings 14 01856 g010
Figure 11. Middle section of the numerical model before and after simplification (taking the HSC model as an example).
Buildings 14 01856 g011
Figure 12. Comparison of computational efficiency before and after model simplification: (a) the smallest stable time increment; (b) total increment of analysis step.
Buildings 14 01856 g012
Table 1. Mix proportions of concretes (Unit: kg/m3).
MixturesCementWaterFine SandCoarse AggregateLimestone PowderSlagAdmixture
HSC38814562310811085013.65
LSC227149795109868446.4
Table 2. Basic mechanical properties of concrete.
SampleCompressive Strength (MPa)Elastic Modulus (GPa)Poisson’s RatioUnit Weight (kg/m3)
HSC169.145.20.142406
265.444.70.152397
370.447.50.152411
Average68.345.80.152405
LSC136.239.50.142390
235.338.40.152381
331.637.90.162370
Average34.438.60.152380
Table 3. Material parameters used in the numerical model [40,41,42].
Segment RegionDensity ρ (kg/m3)Young’s Modulus EC (MPa)Poisson’s Ratio νCompressive Strength  f c * (MPa)Tensile Strength  f t * (MPa)
Aggregate300050,0000.15804.2
ITZ250035,0000.15533.5
HSC240045,0000.15704.1
LSC240038,0000.15362.6
Strip100050000.315-
Table 4. Parameters used in the CDP model [43].
φεfb0/fc0Kμ
300.11.160.6670.0005
Table 5. Material properties for the cohesive elements.
ModelElementsDensity ρ (kg/m3)Initial Stiffness k0 (MPa/mm)Cohesive Strength ft (MPa)Fracture Energy GC (N/mm)
HSCcoh_mortar240010640.1
coh_agg30001064.20.12
coh_ITZ25001063.50.075
LSCcoh_mortar24001062.50.05
coh_agg30001064.20.12
coh_ITZ25001061.80.025
CSCcoh_mortar24001061.50.025
coh_agg30001064.20.12
coh_ITZ25001060.80.01
Table 6. Experimental data of tensile splitting tests.
SamplePeak Load  P m a x (kN)Splitting Tensile Strength  σ c t (MPa)Average  σ c t (MPa)
HSC137.3133.8853.949
150.0144.245
131.3443.716
LSC93.6222.6492.679
93.4612.644
96.9402.743
CSC64.3761.8211.805
65.5721.855
61.4231.738
Table 7. Results of tensile splitting tests and numerical simulations.
SamplePeak Load  P m a x (kN)Splitting Tensile Strength  σ c t (MPa)Error (%)
TestSimulationTestSimulation
HSC150.015153.5654.2454.3452.36
LSC93.46197.9092.6442.7704.77
CSC65.57265.3421.8551.849−0.32
Table 8. Real proportion of each component.
SampleMortarAggregatesITZs
HSC72.5%24.8%2.7%
LSC73.7%7.3%19.0%
CSC92.6%1.9%5.5%
Table 9. Splitting tensile strength of tests and numerical simulations.
SampleTestOriginal ModelSimplified Model
σ c t (MPa) σ c t (MPa)Error (%) σ c t (MPa)Error (%)
HSC4.2454.3452.364.234−0.26
LSC2.6442.7704.772.527−4.43
CSC1.8551.849−0.321.8570.11
Disclaimer/Publisher’s Note: The statements, opinions and data contained in all publications are solely those of the individual author(s) and contributor(s) and not of MDPI and/or the editor(s). MDPI and/or the editor(s) disclaim responsibility for any injury to people or property resulting from any ideas, methods, instructions or products referred to in the content.

