

The Flexural Behavior and Mechanical Properties of Super High-Performance Concrete (SHPC) Reinforced Using the Hybridization of Micro Polypropylene and Macro Steel Fibers


Abstract
1. Introduction
2. Research Significance
- (a)
- the workability of fresh concrete,
- (b)
- concrete compressive strength,
- (c)
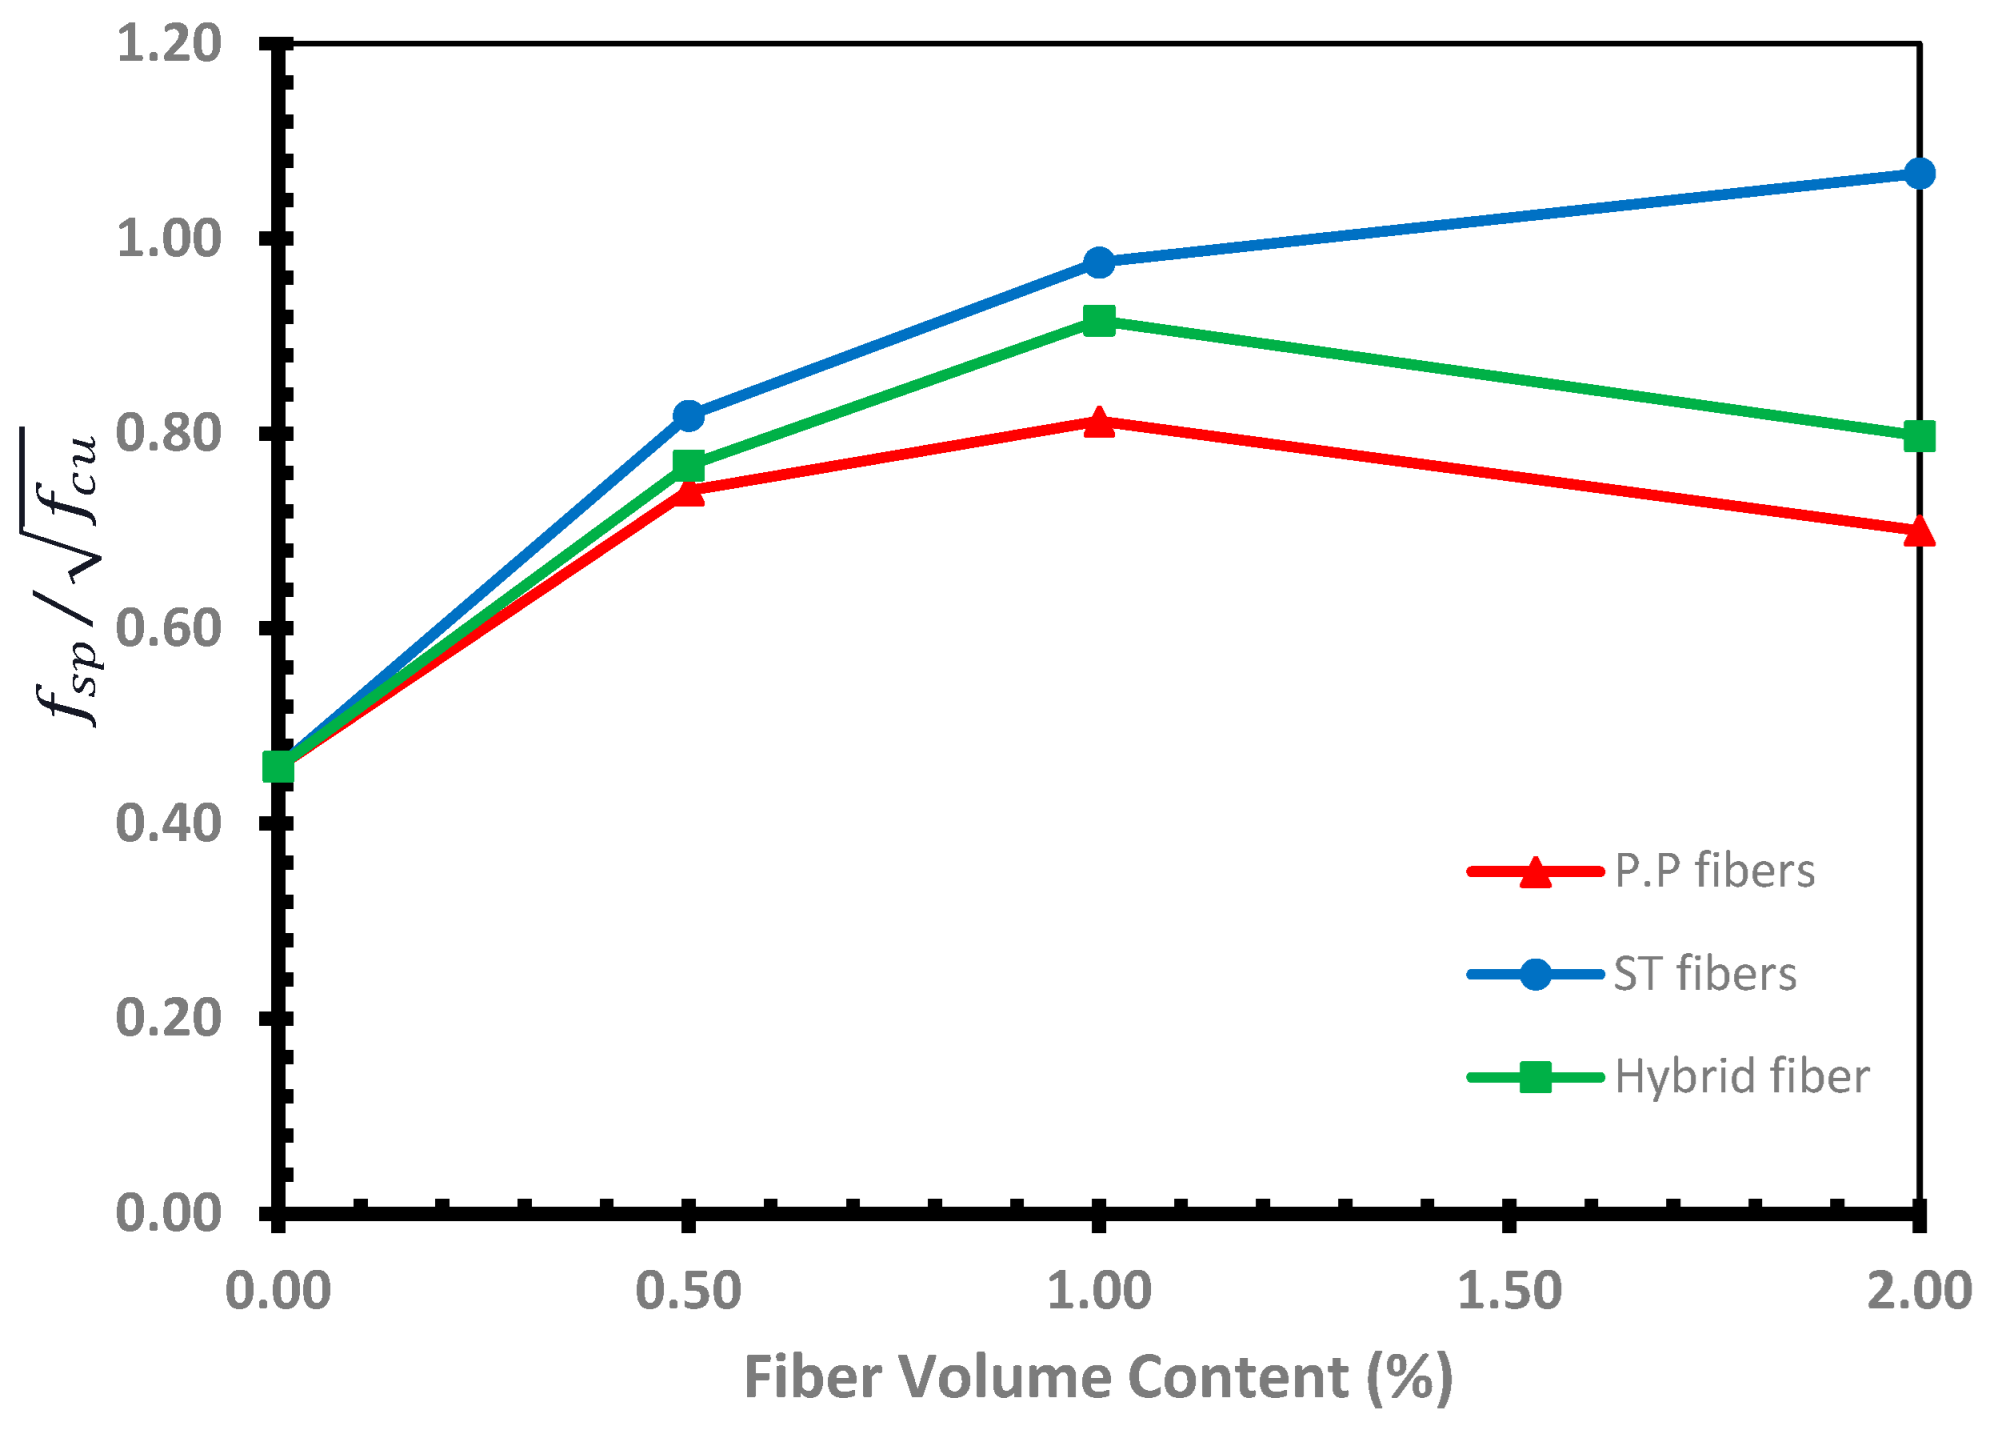
- splitting tensile strength,
- (d)
- flexural behavior, including flexural tensile strength and toughness.
- (e)
- the optimum percentage of each of the two fibers, PP and ST, in the hybrid to get the maximum structural and economic benefits of hybridization.
3. Experimental Program
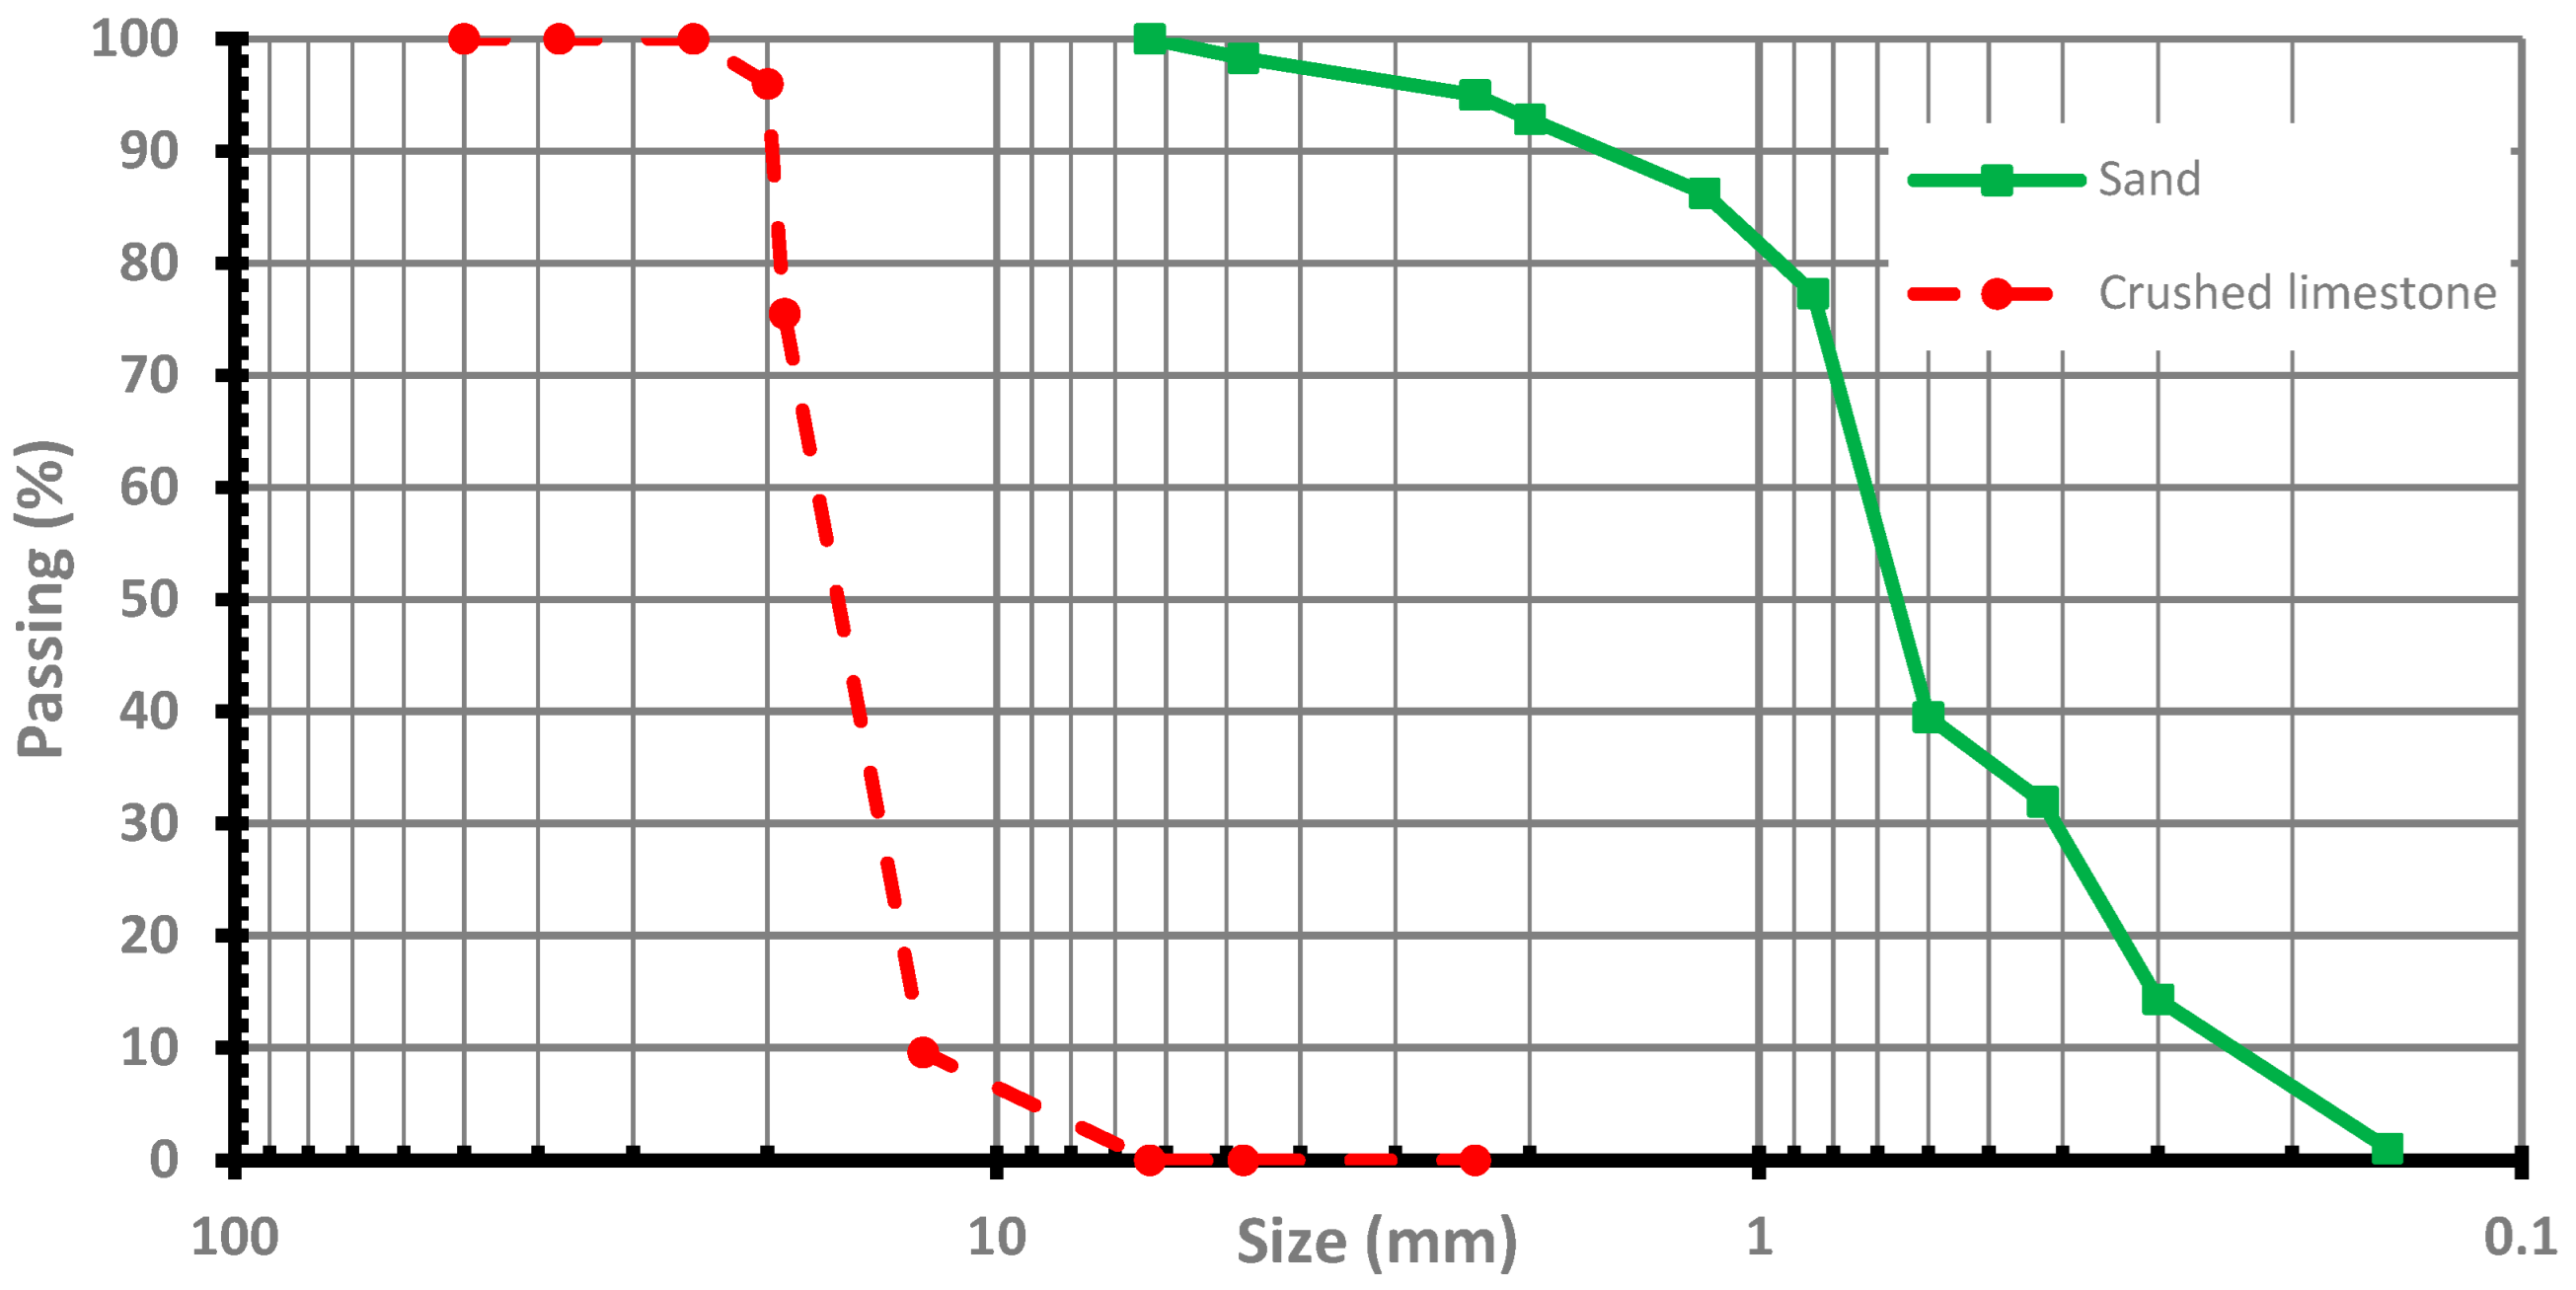
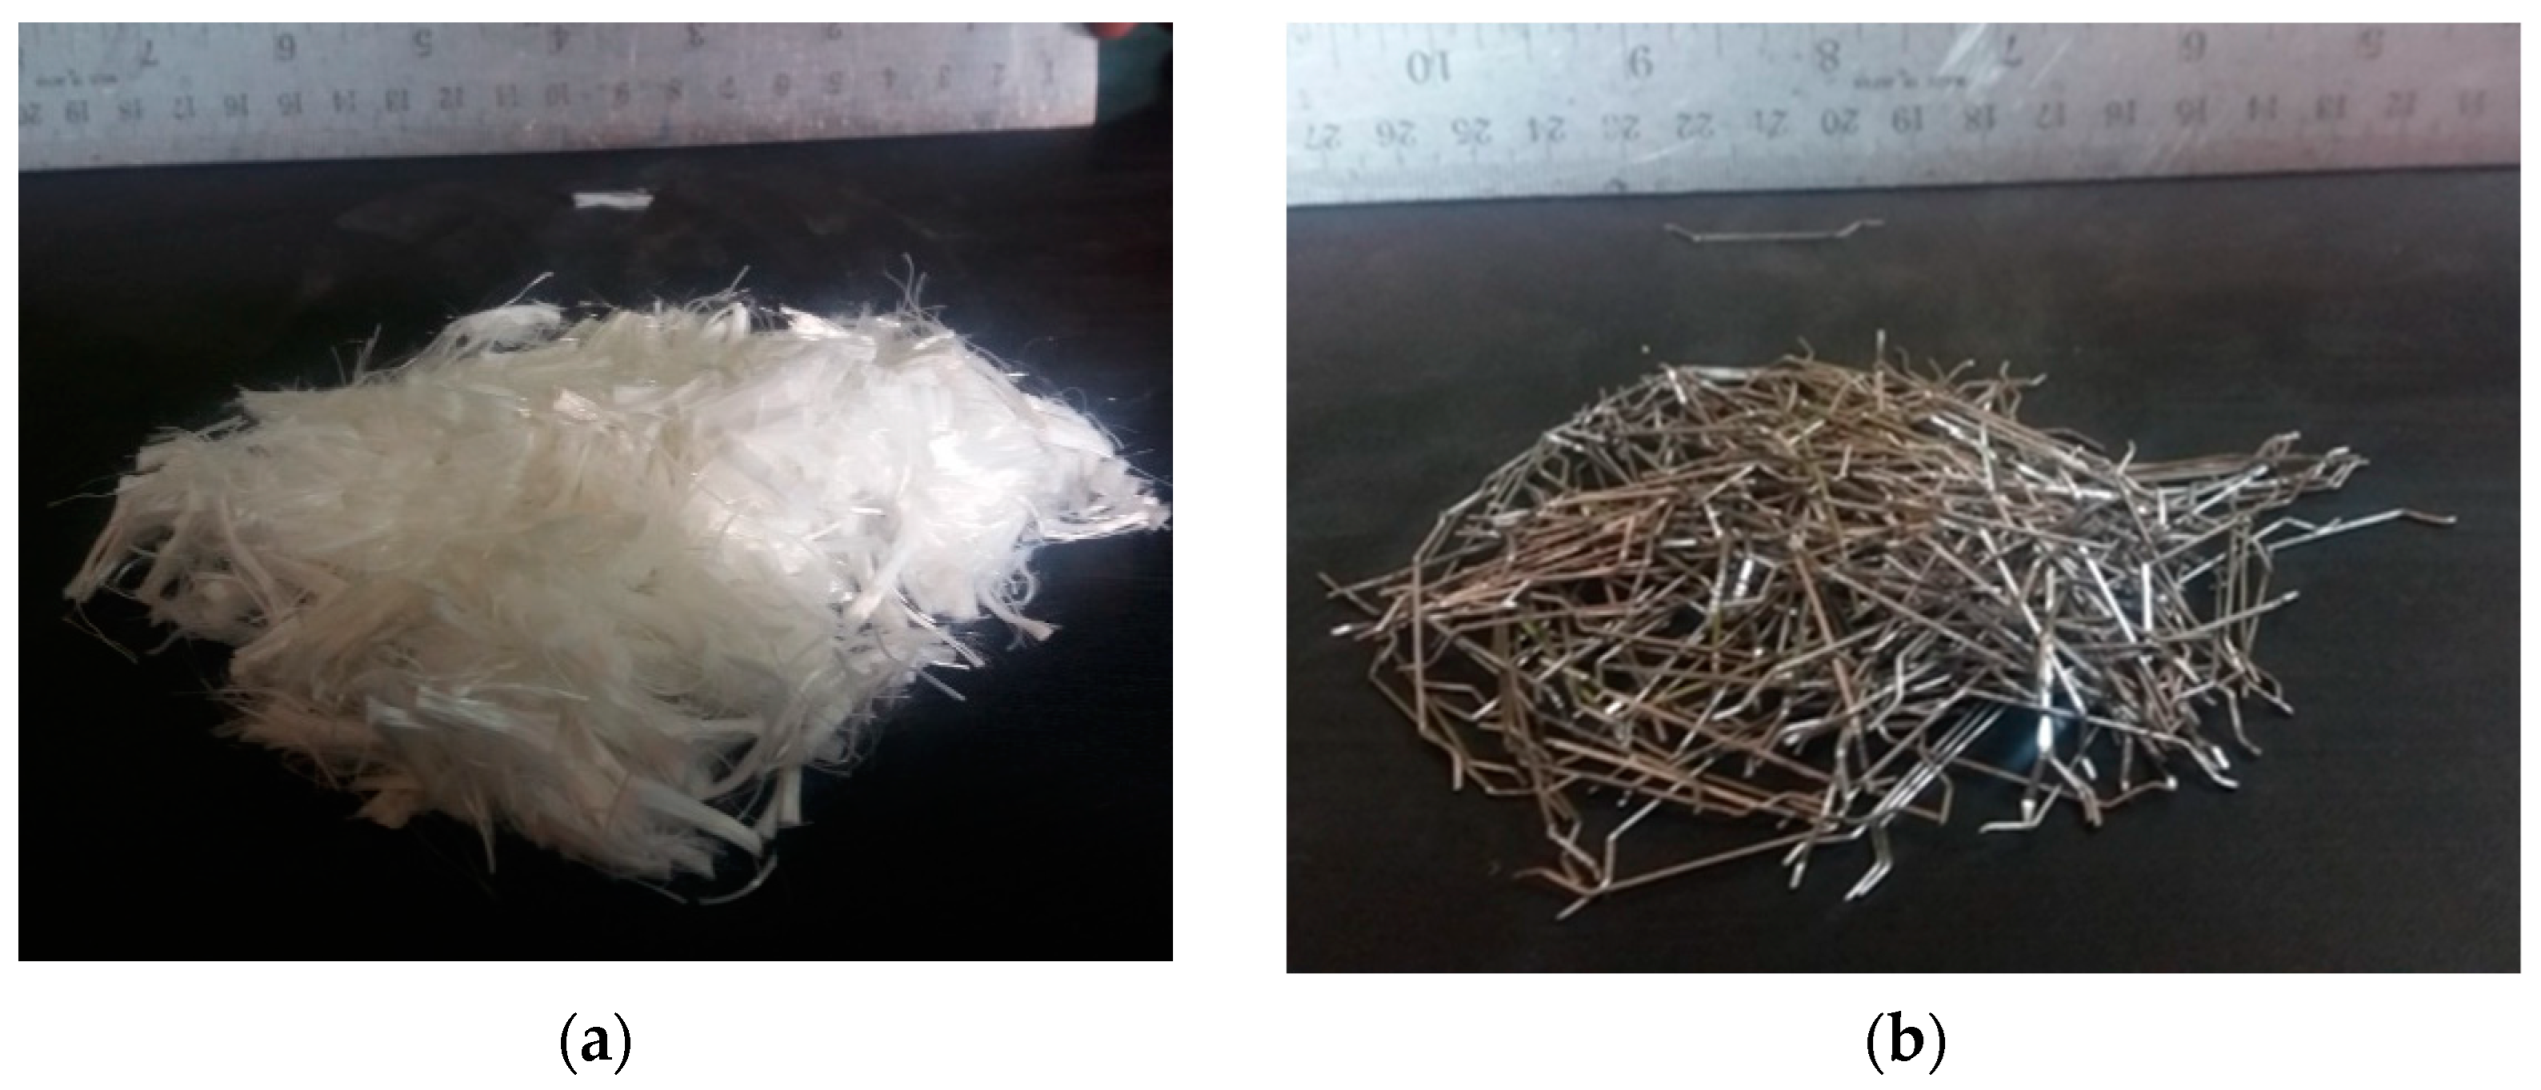
3.1. Materials of SHPC
3.2. Mixtures Proportions and Studied Variables
- Group 1: Effect of micro-Polypropylene fibers (PP)
- Group 2: Effect of Macro End Hooked Steel Fibers (ST)
- Group 3: Effect of Hybrid Polypropylene and steel fibers (PP + ST)
3.3. Mixture Casting and Test Specimens
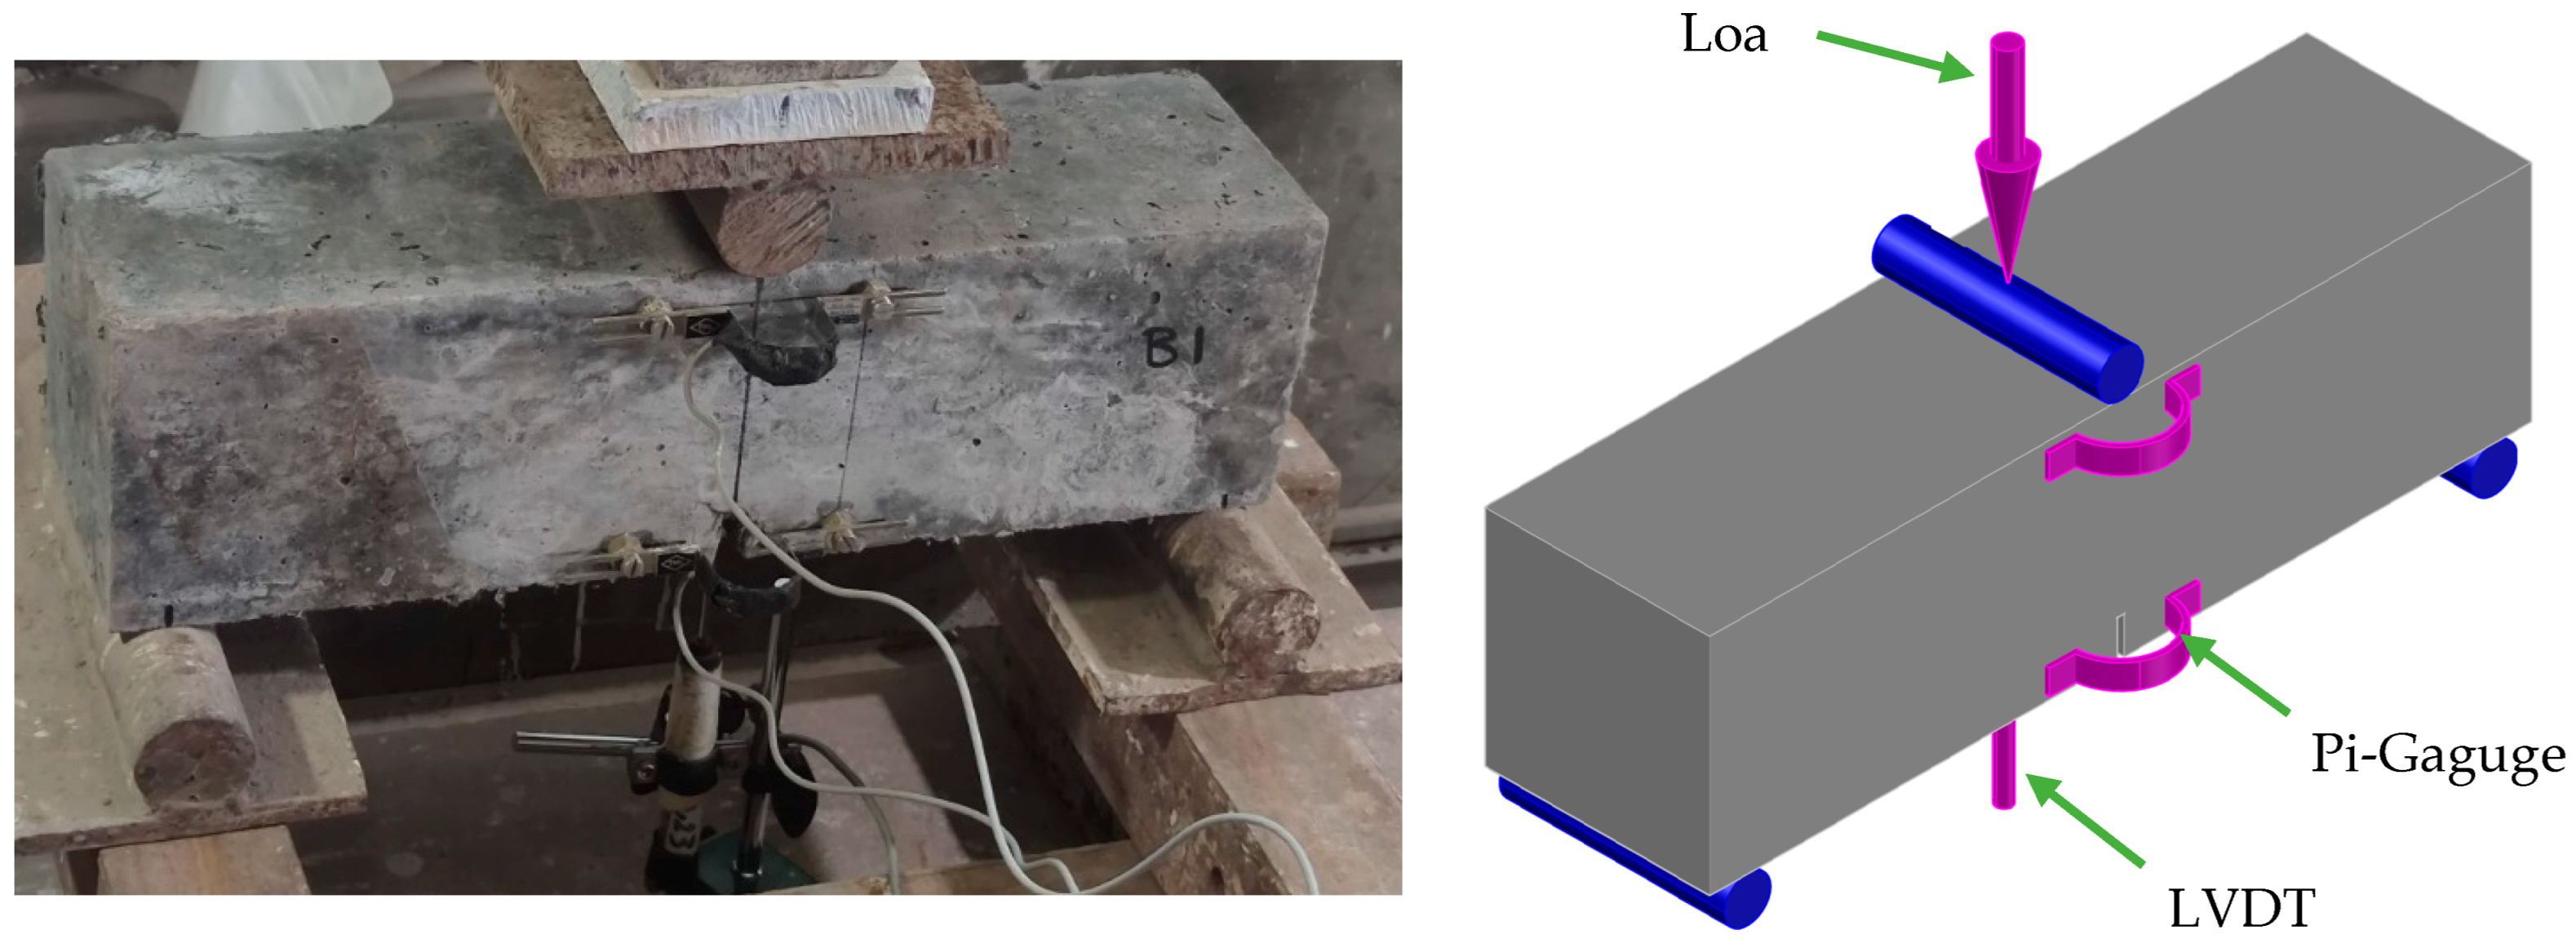
3.4. Testing Methods
4. Results and Discussions
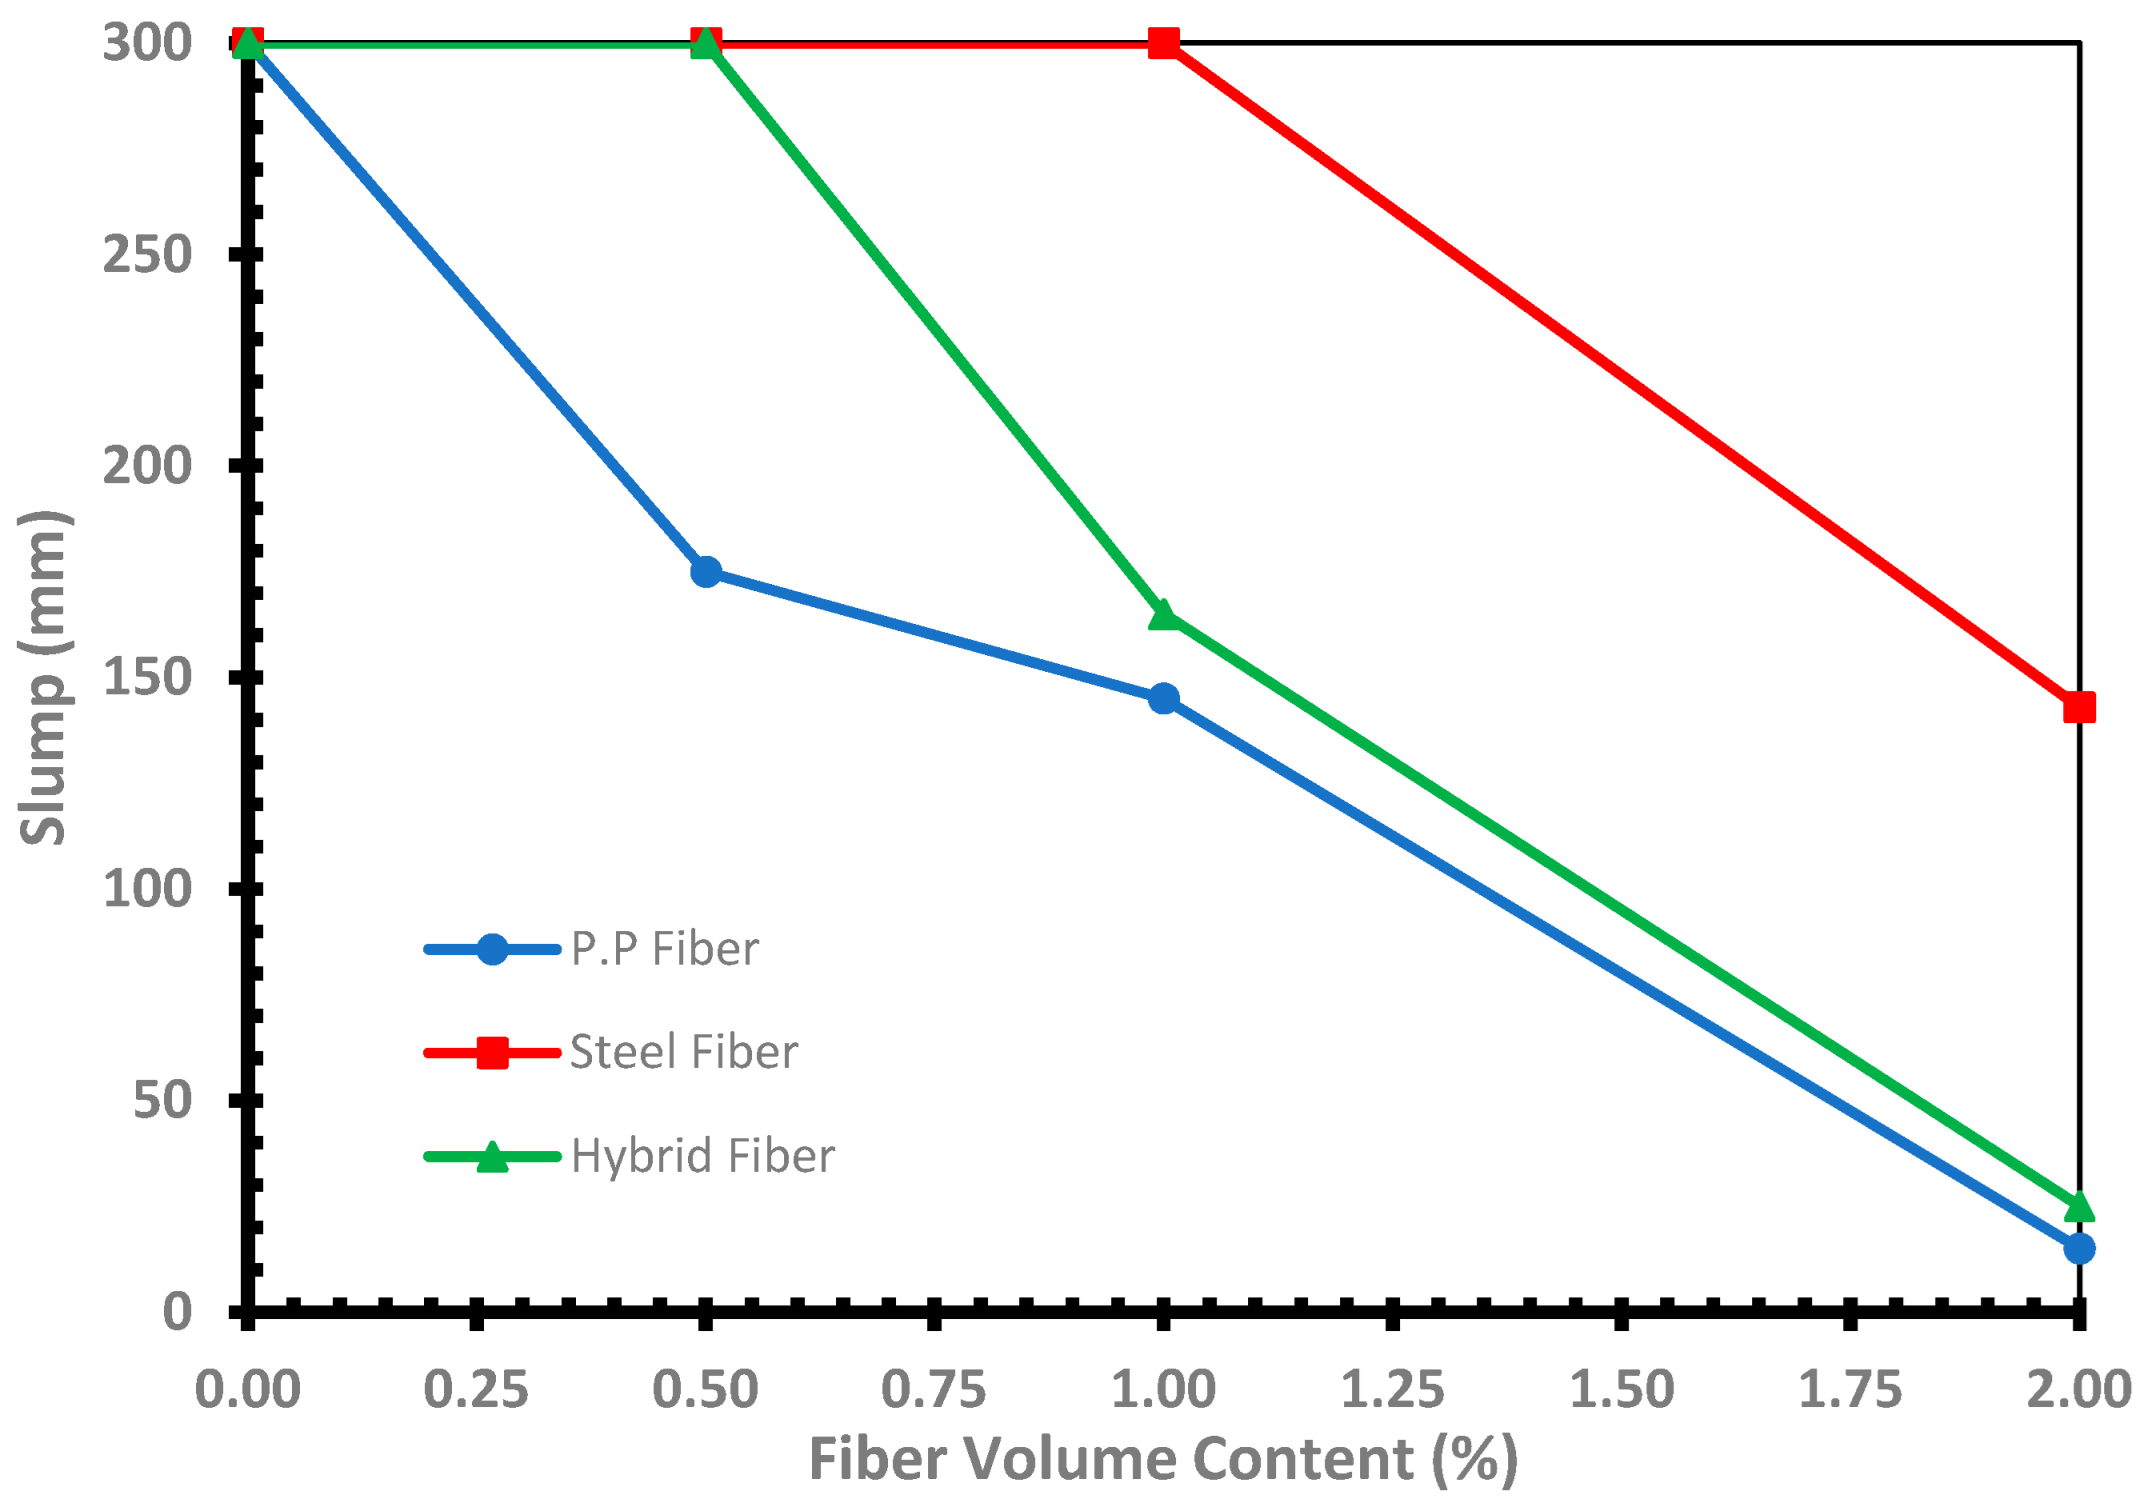
4.1. Workability
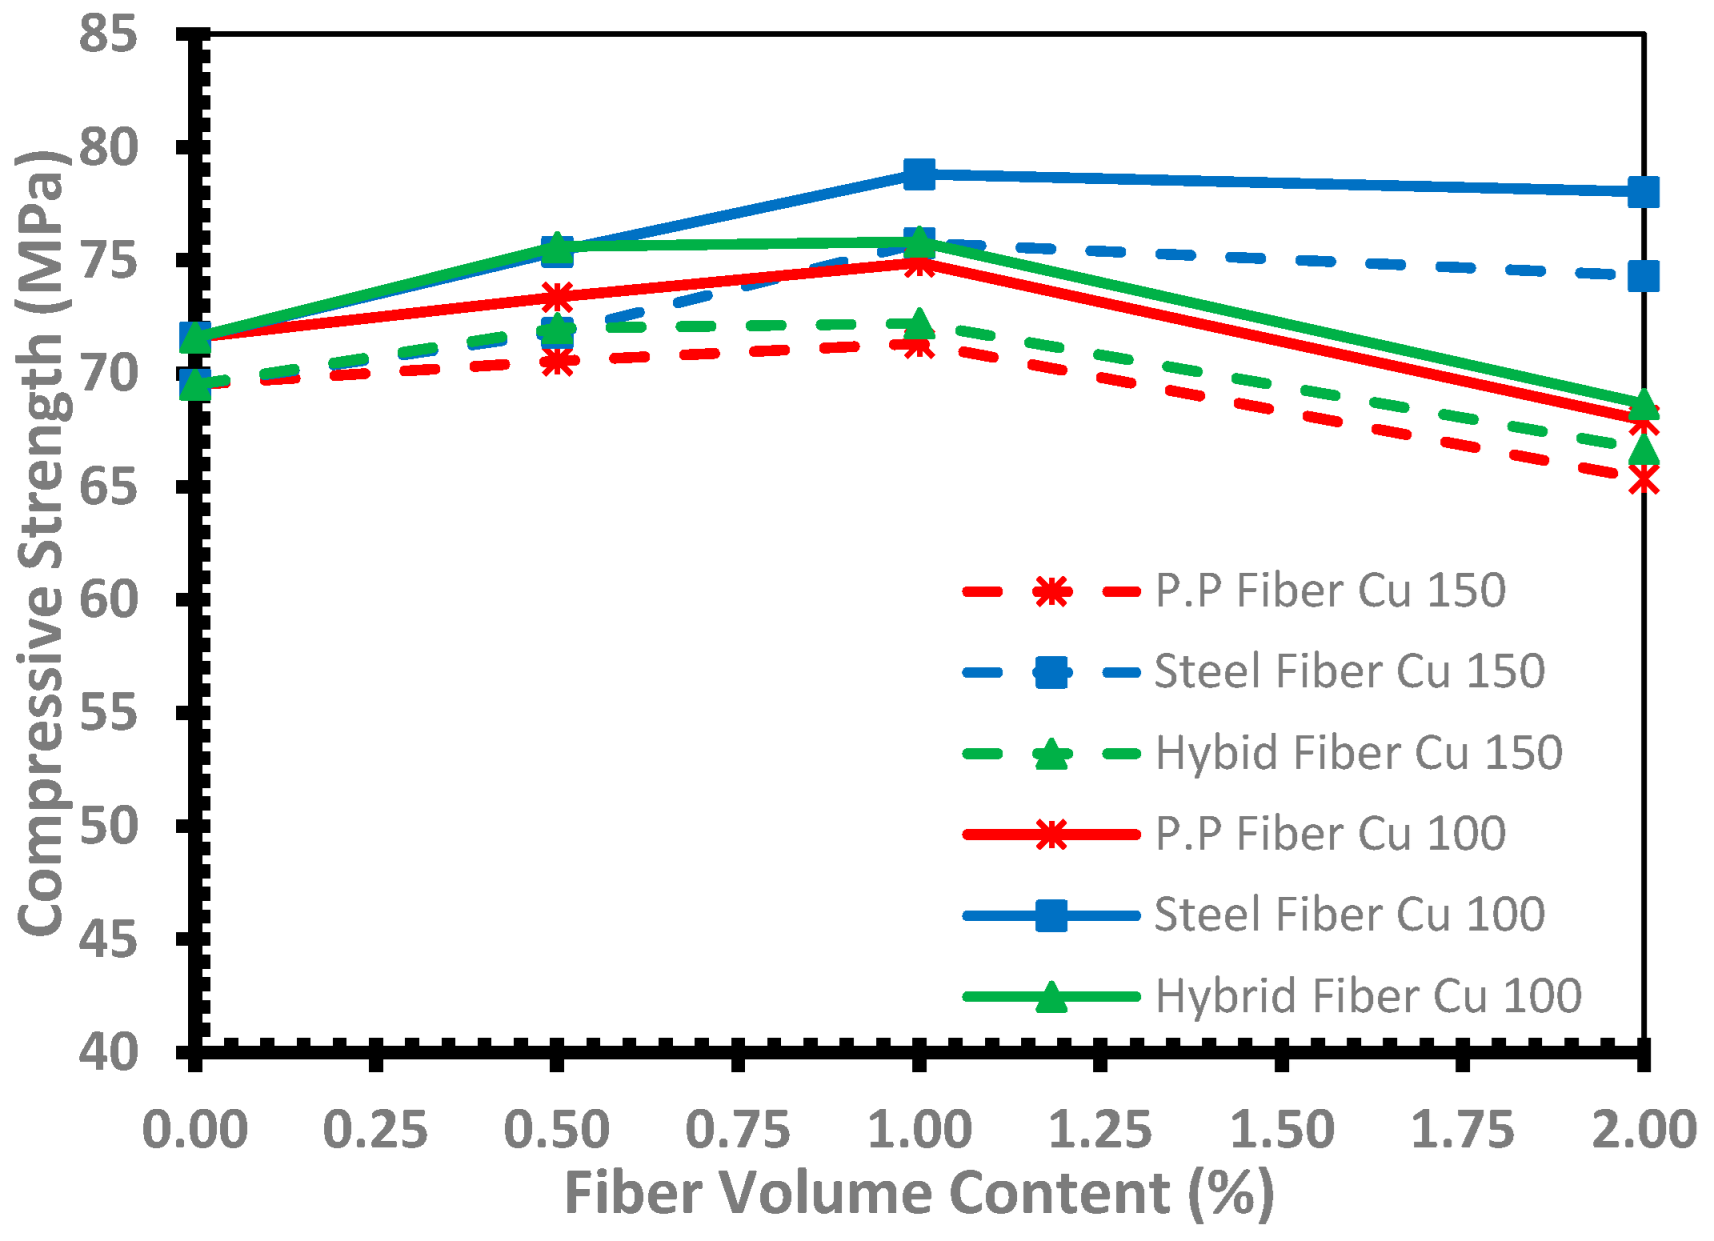
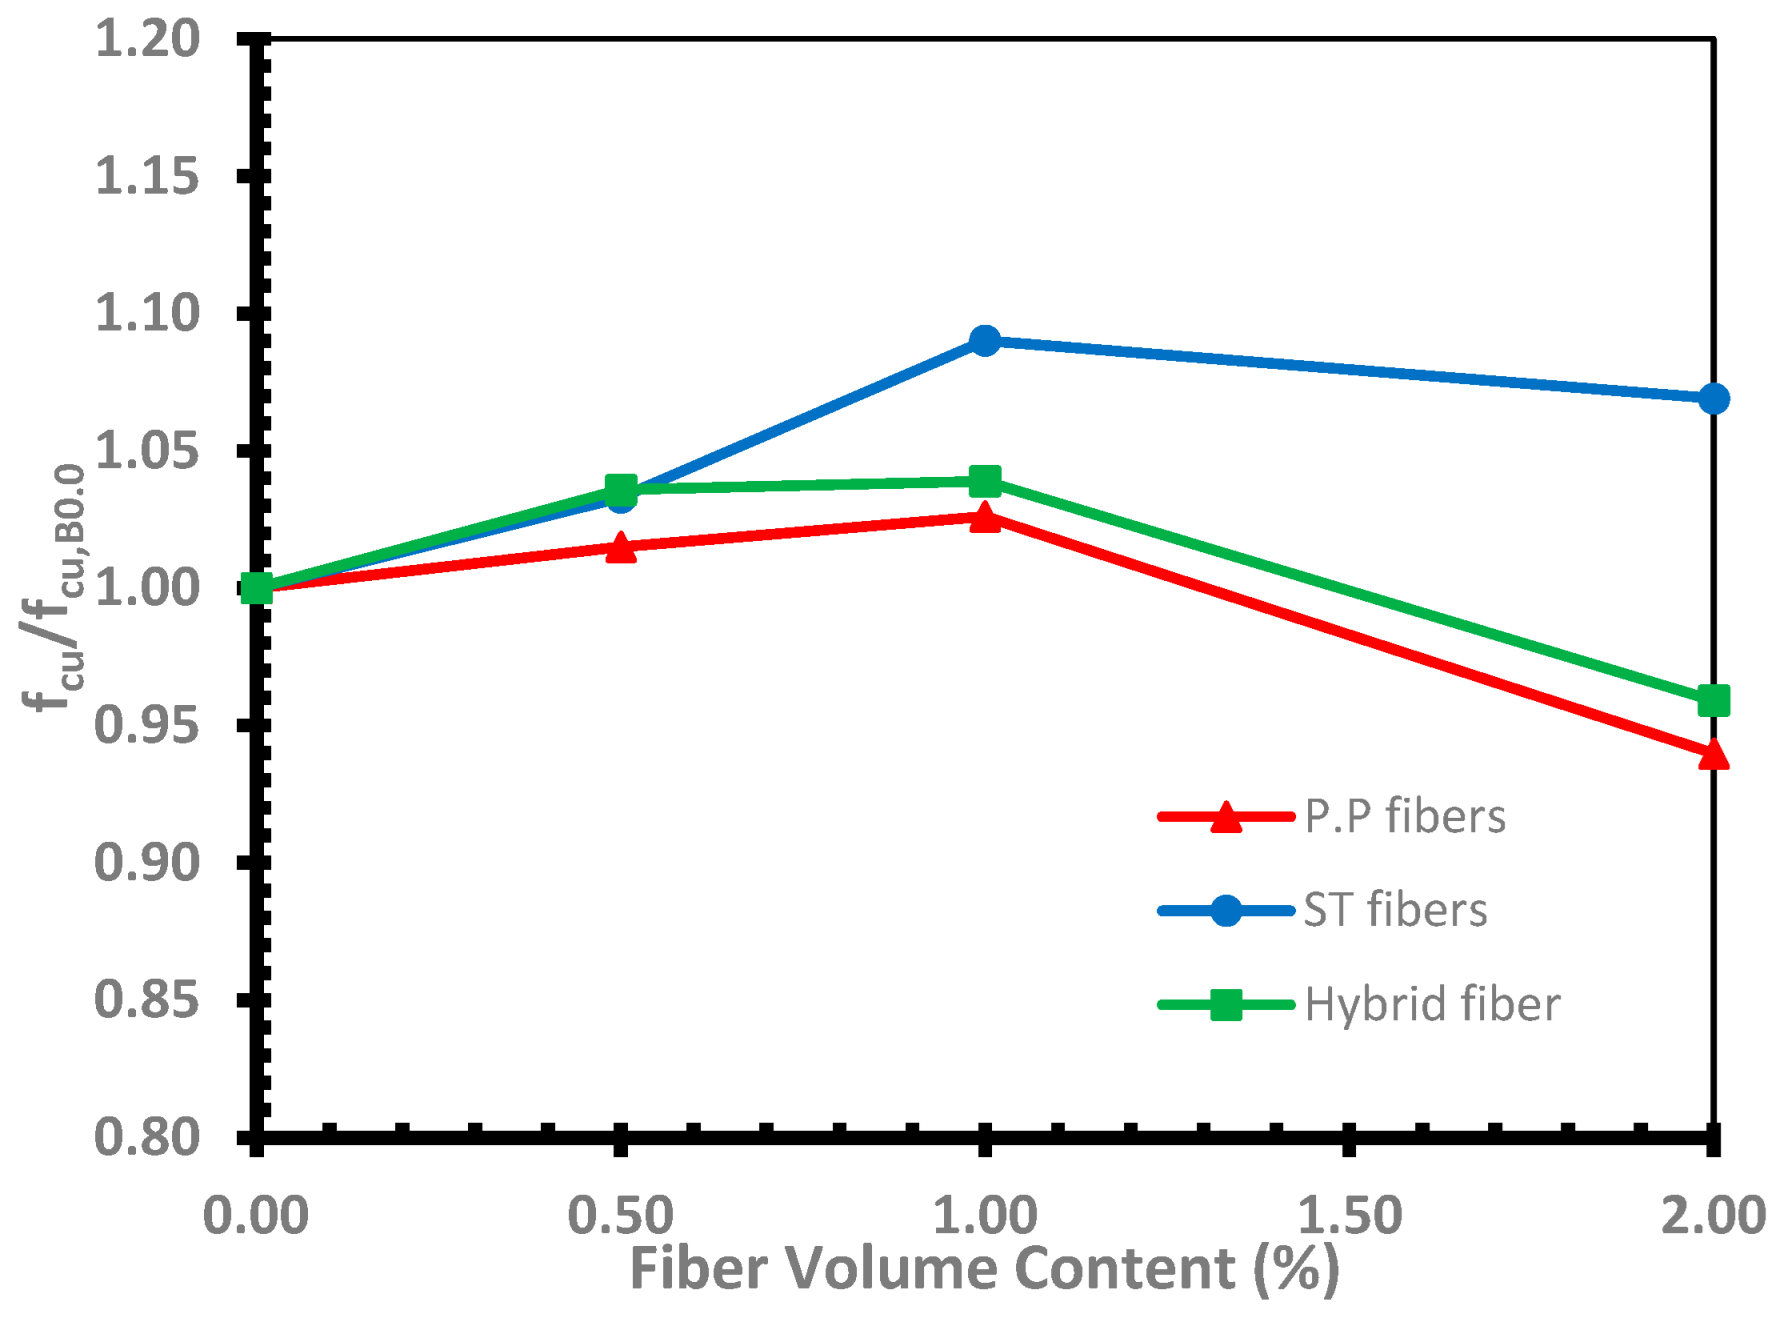
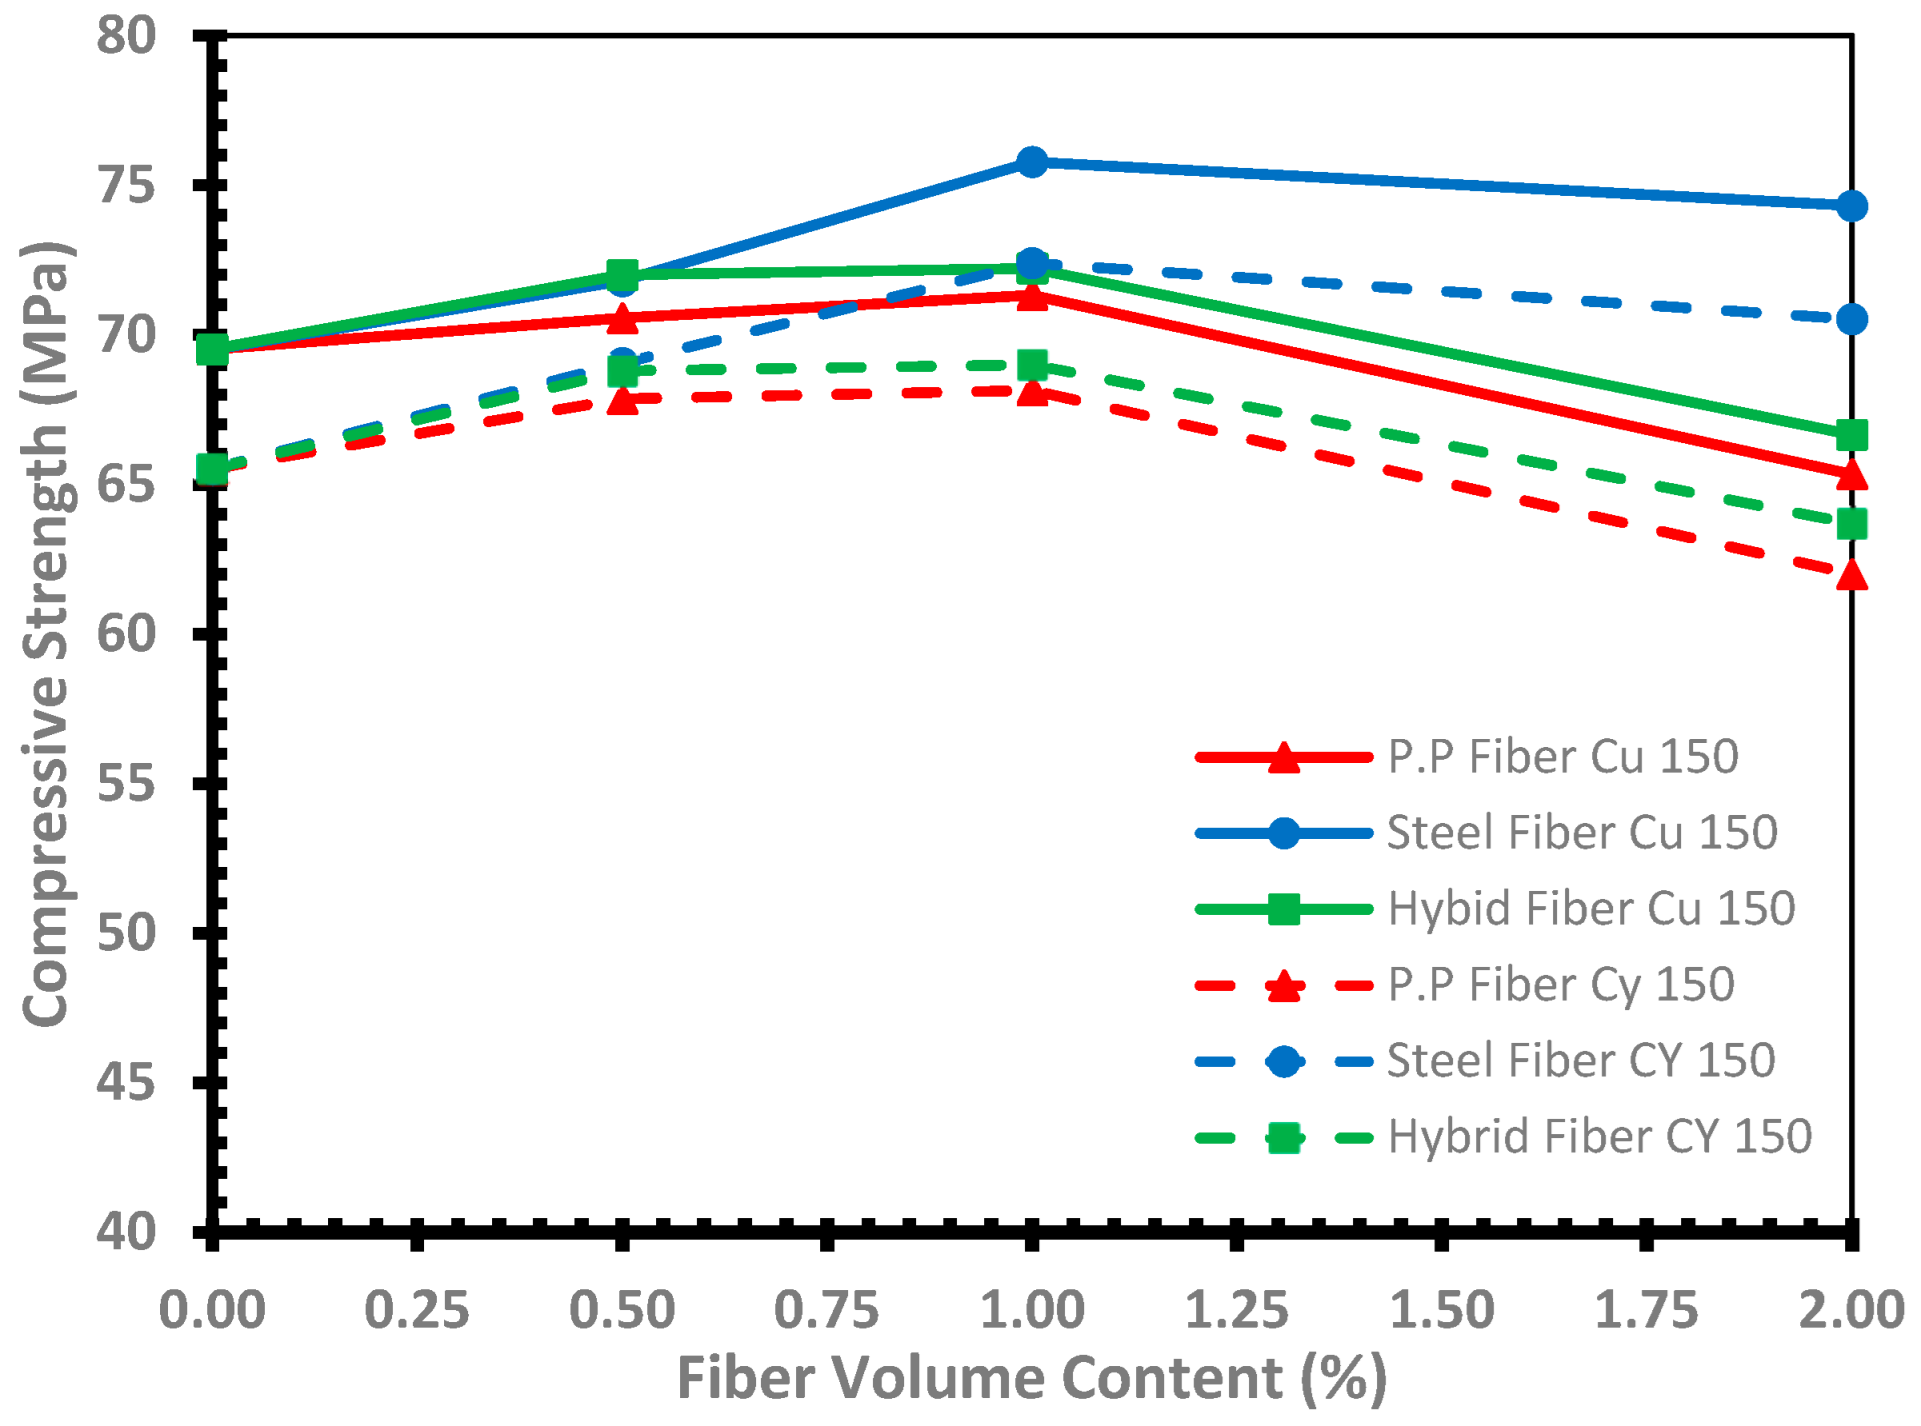
4.2. Compressive Strength
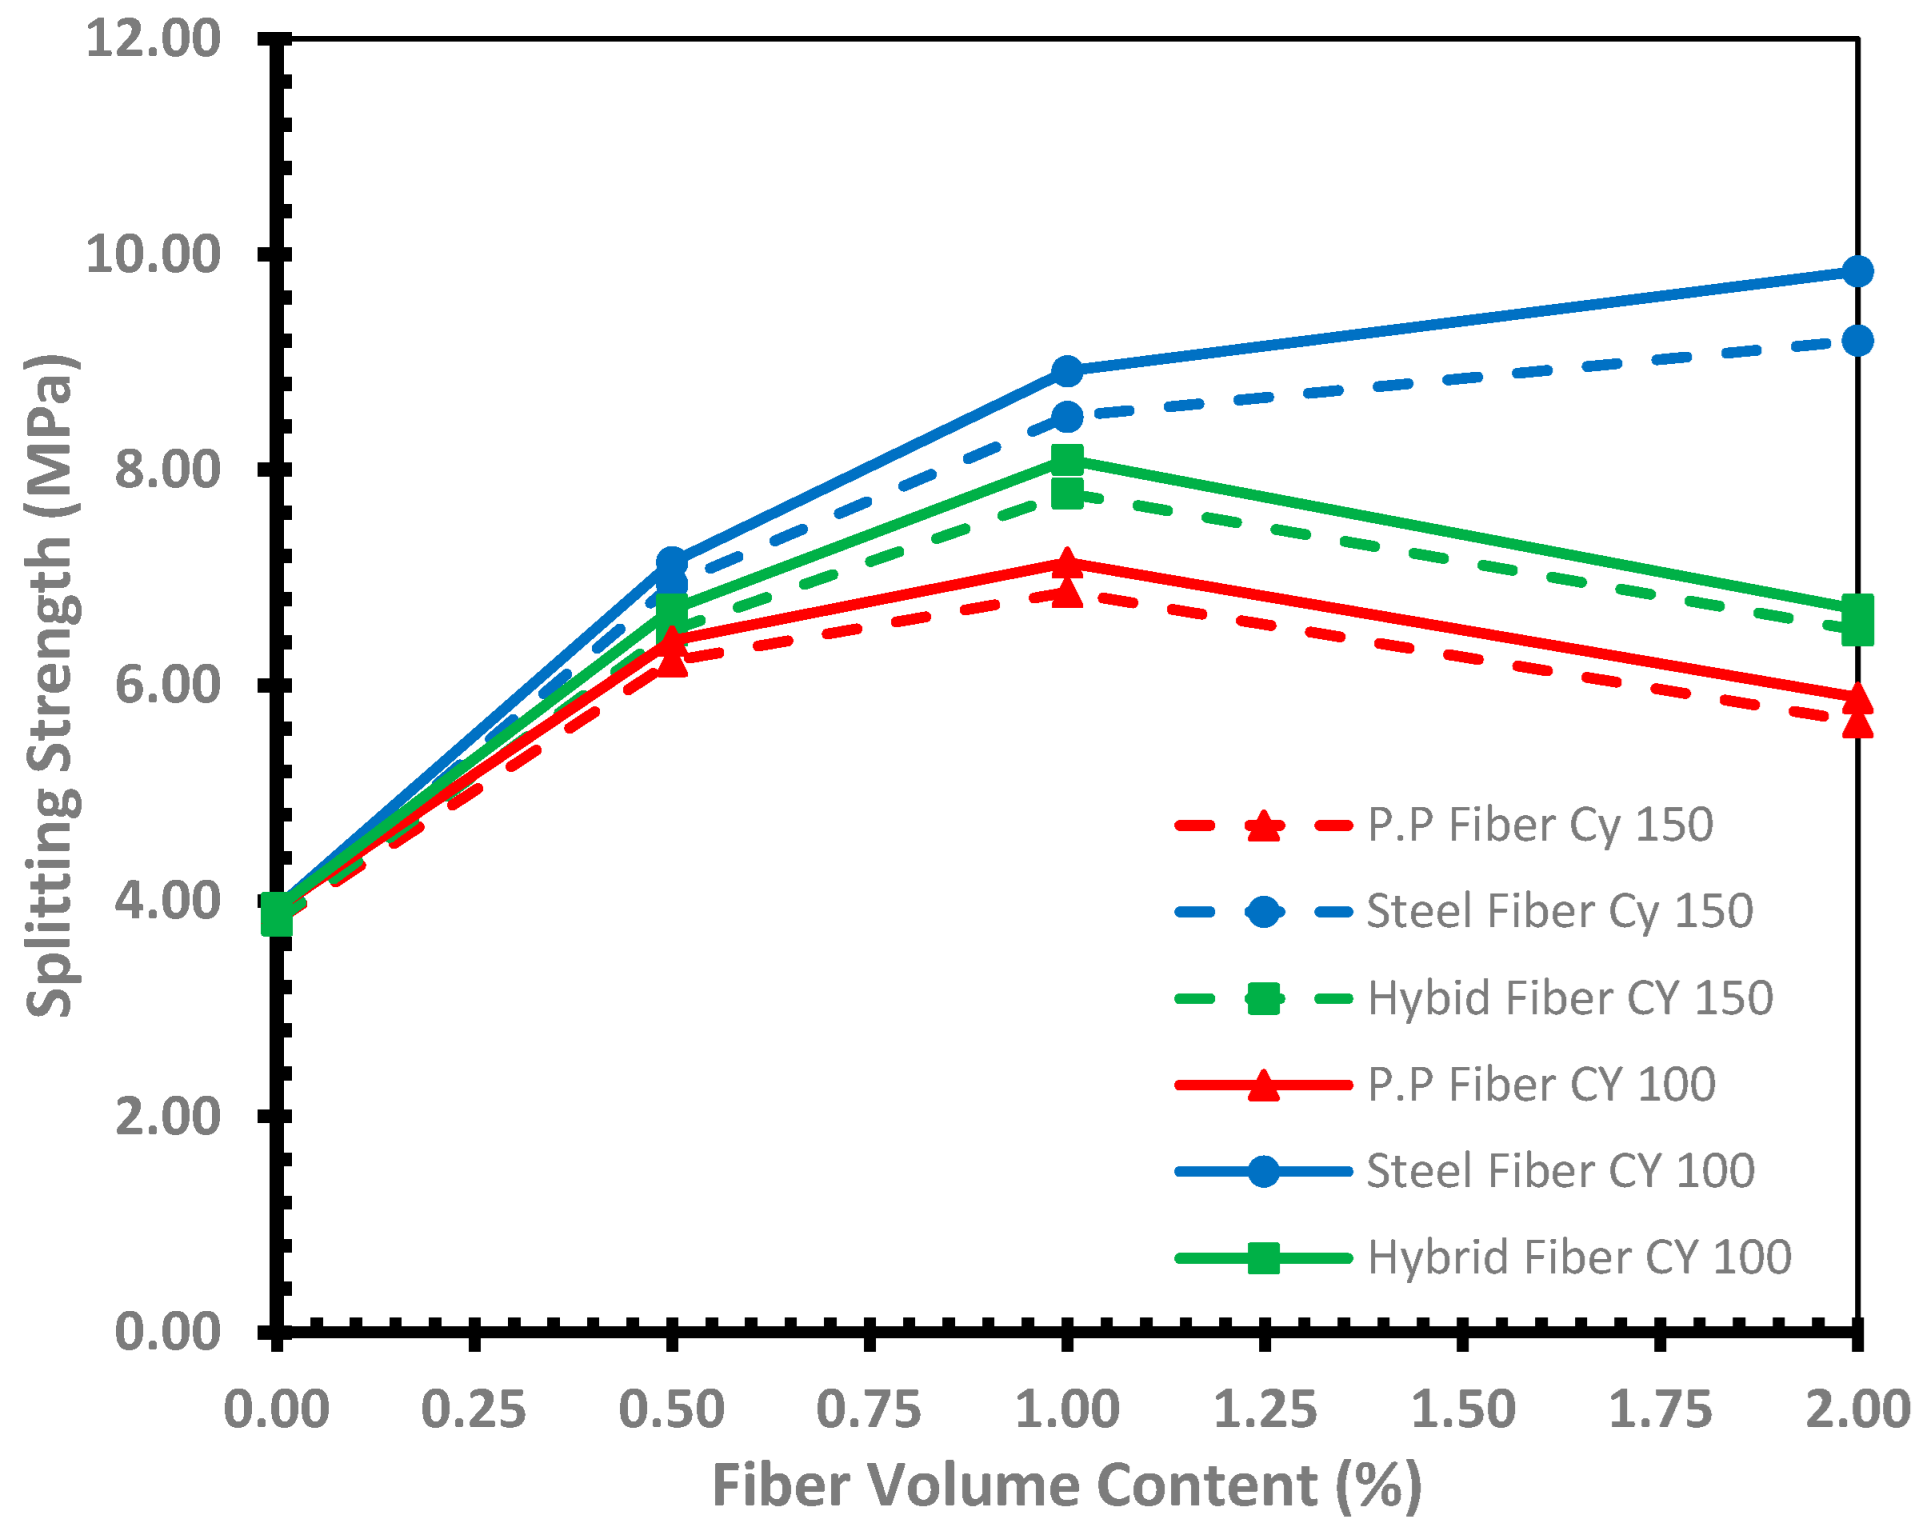
4.3. Tensile Splitting Strength
4.4. The Flexural Behavior
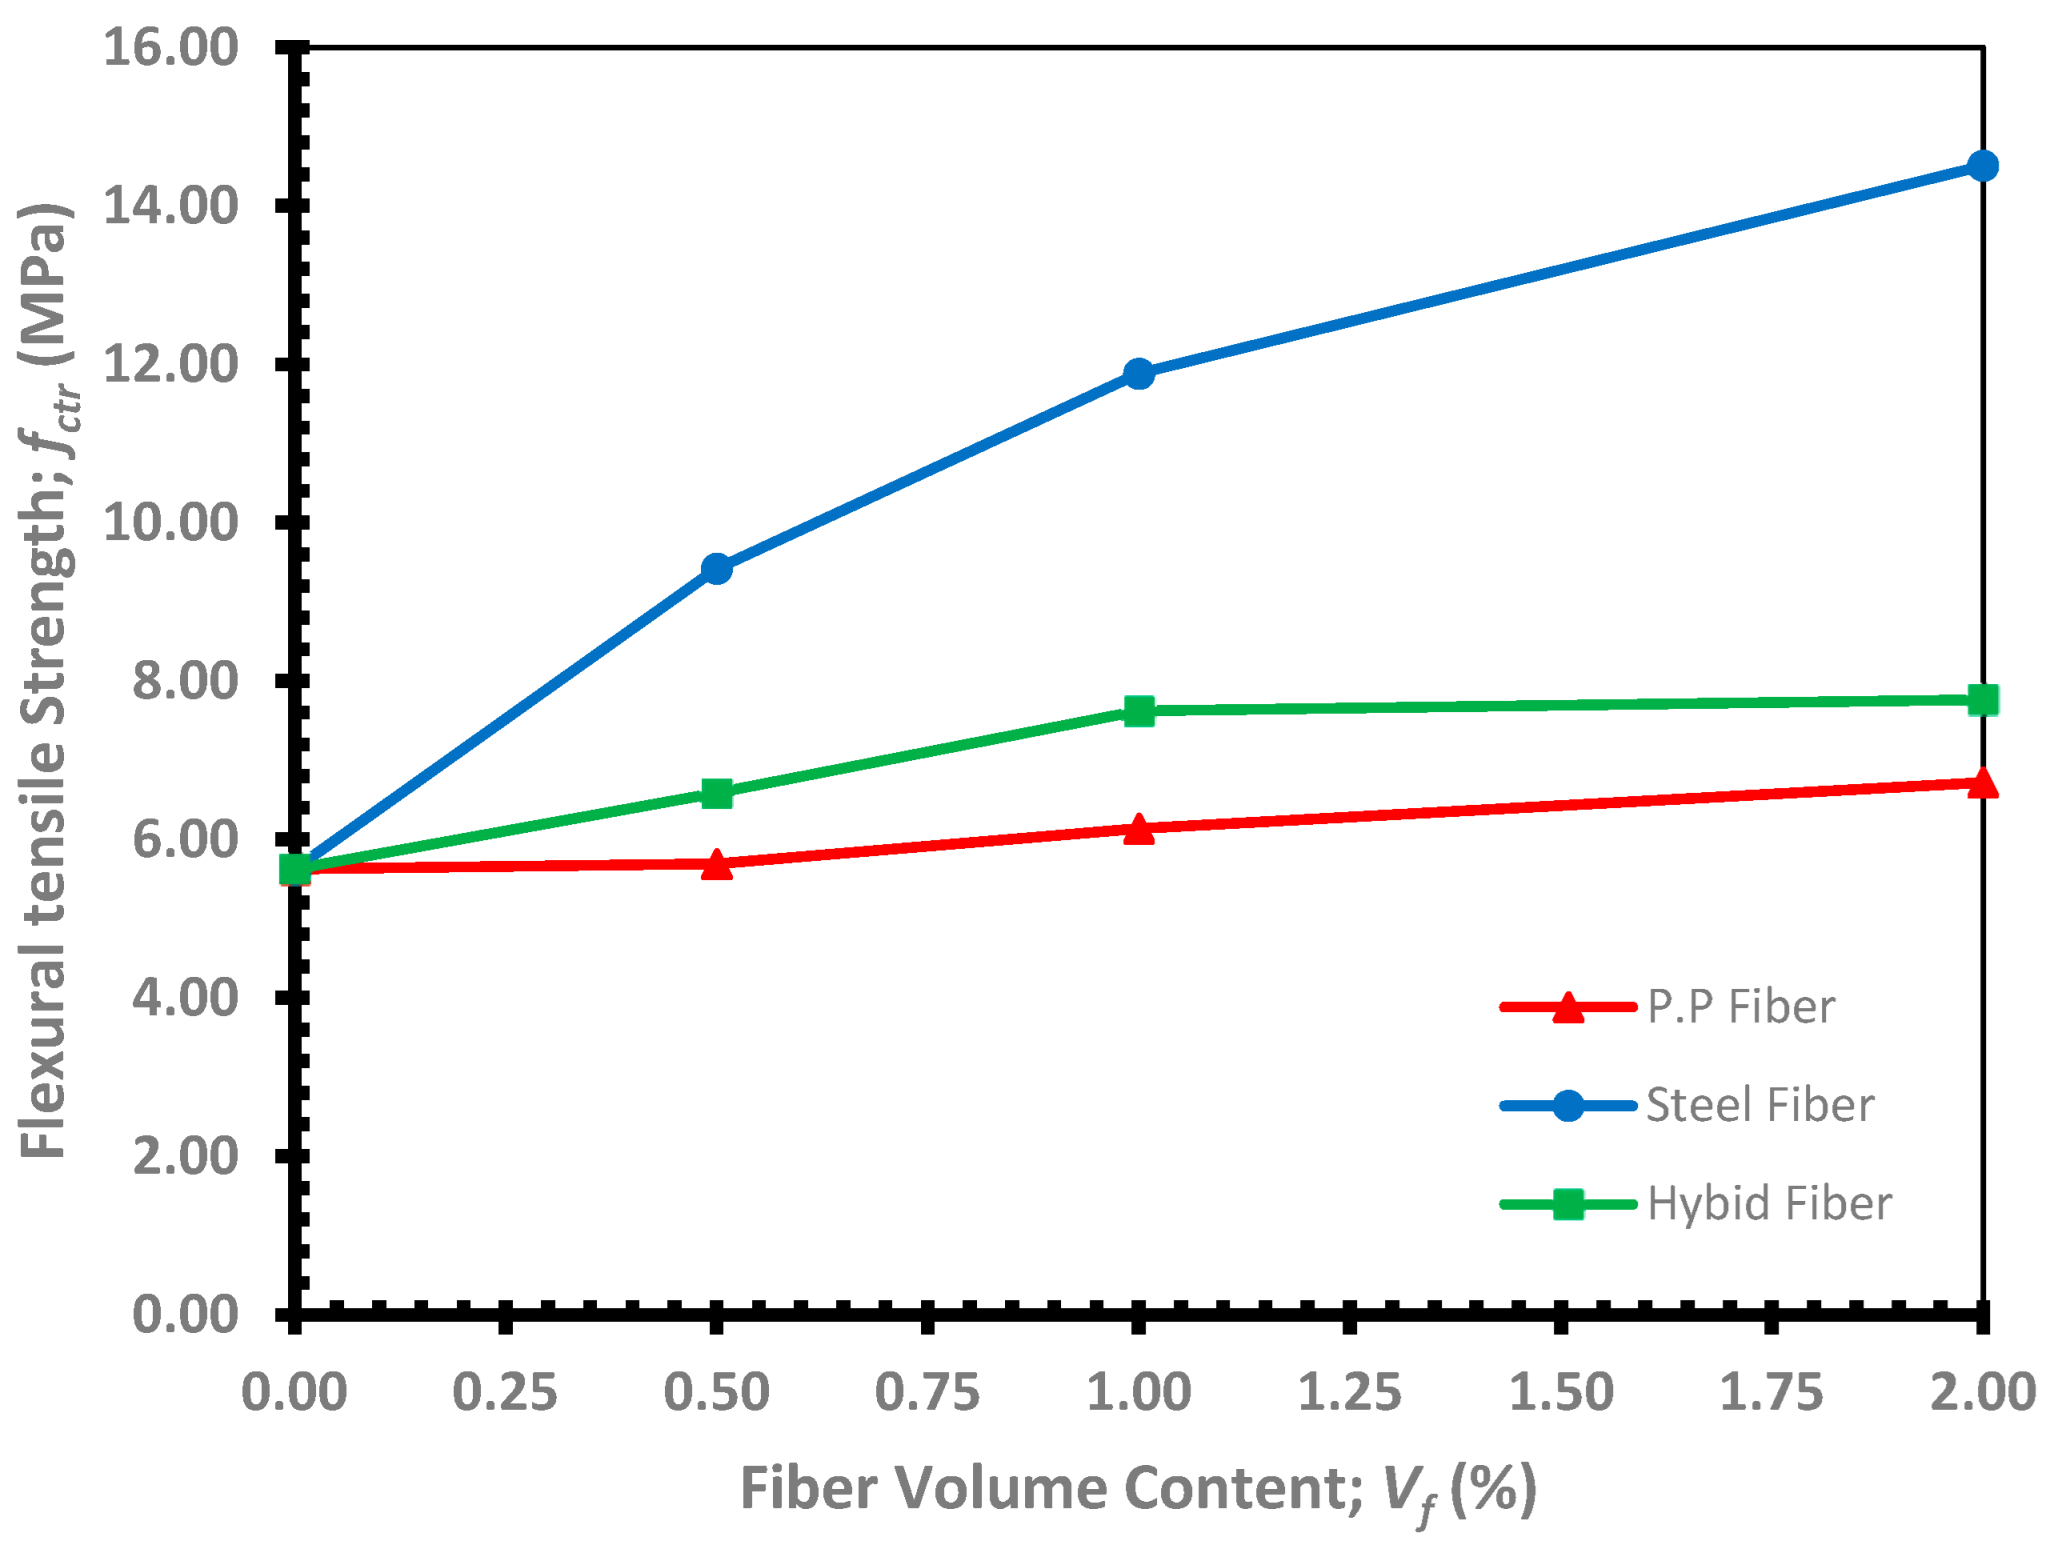
4.4.1. The Modulus of Rupture (fctr)
4.4.2. Load-CMOD Curve and the Residual Flexural Strength
- fR1 intervals are: 1.0, 1.5, 2.0, 2.5, 3.0, 4.0, 5.0, 6.0, 7.0, 8.0, …MPa.
- “a” for 0.5 < fR3/fR1 < 0.7, “b” for 0.7 ≤ fR3/fR1 < 0.9, “c” for 0.9 ≤ fR3/fR1 < 1.1, “d” for 1.1 ≤ fR3/fR1 < 1.3, and “e” for 1.3 ≤ fR3/fR1.
4.4.3. Toughness and Ductility
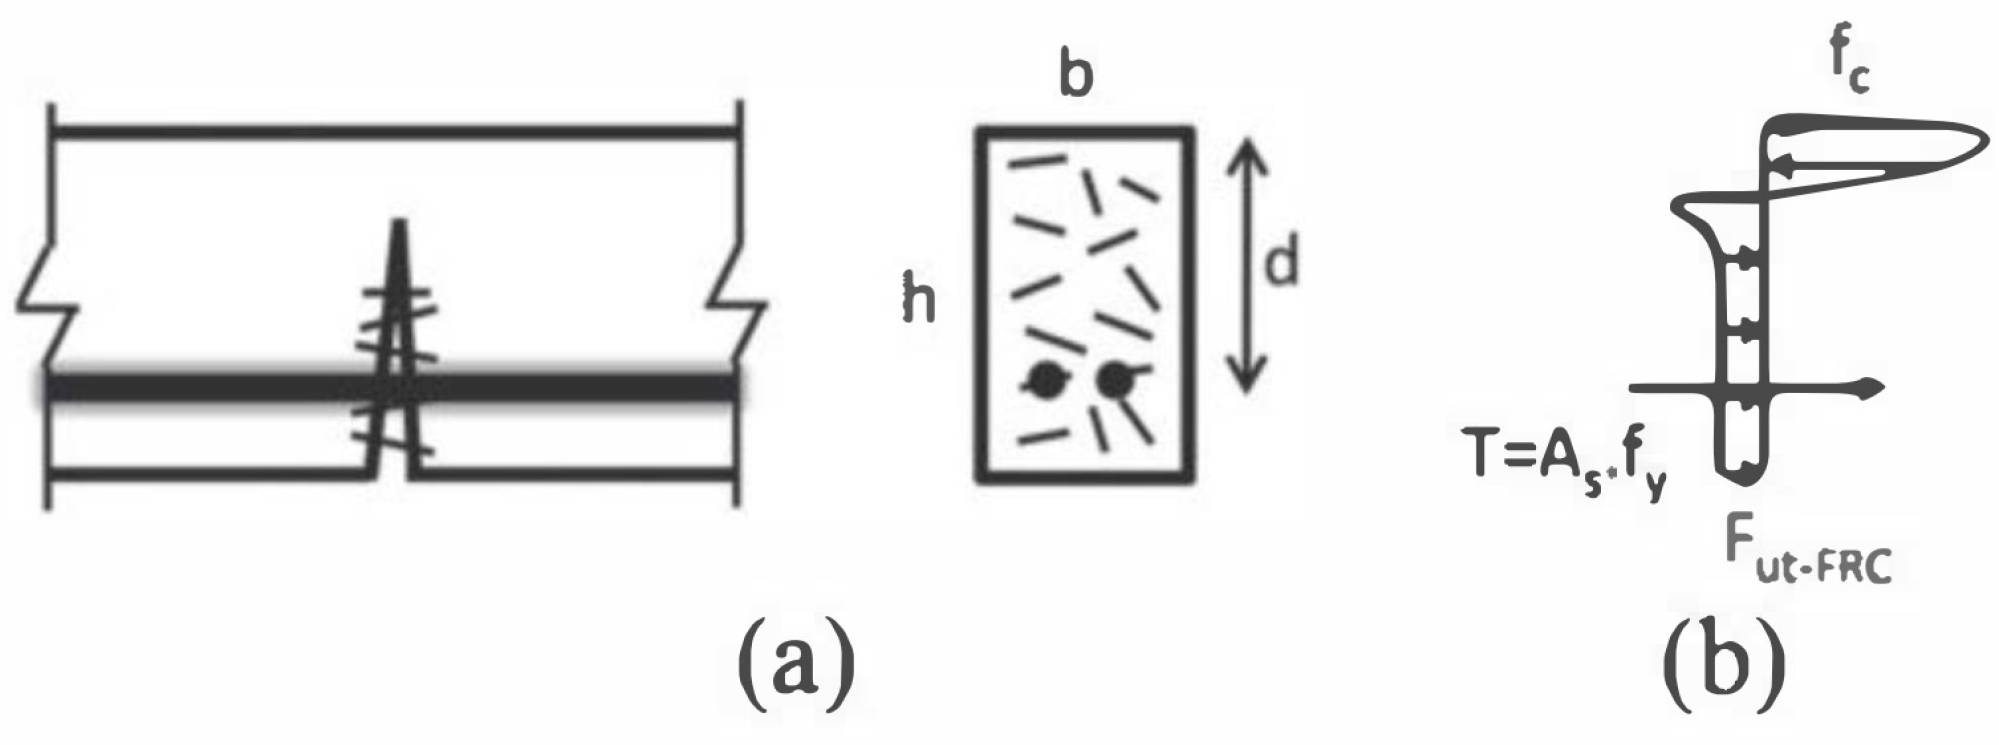
5. Prediction of the Effect of Fibers on the Ultimate Flexure Moment
6. The Economic Impact of Using Fiber Reinforcement for Beams
6.1. Cost Analysis
6.2. Cost to Benefit Analysis
7. Conclusions
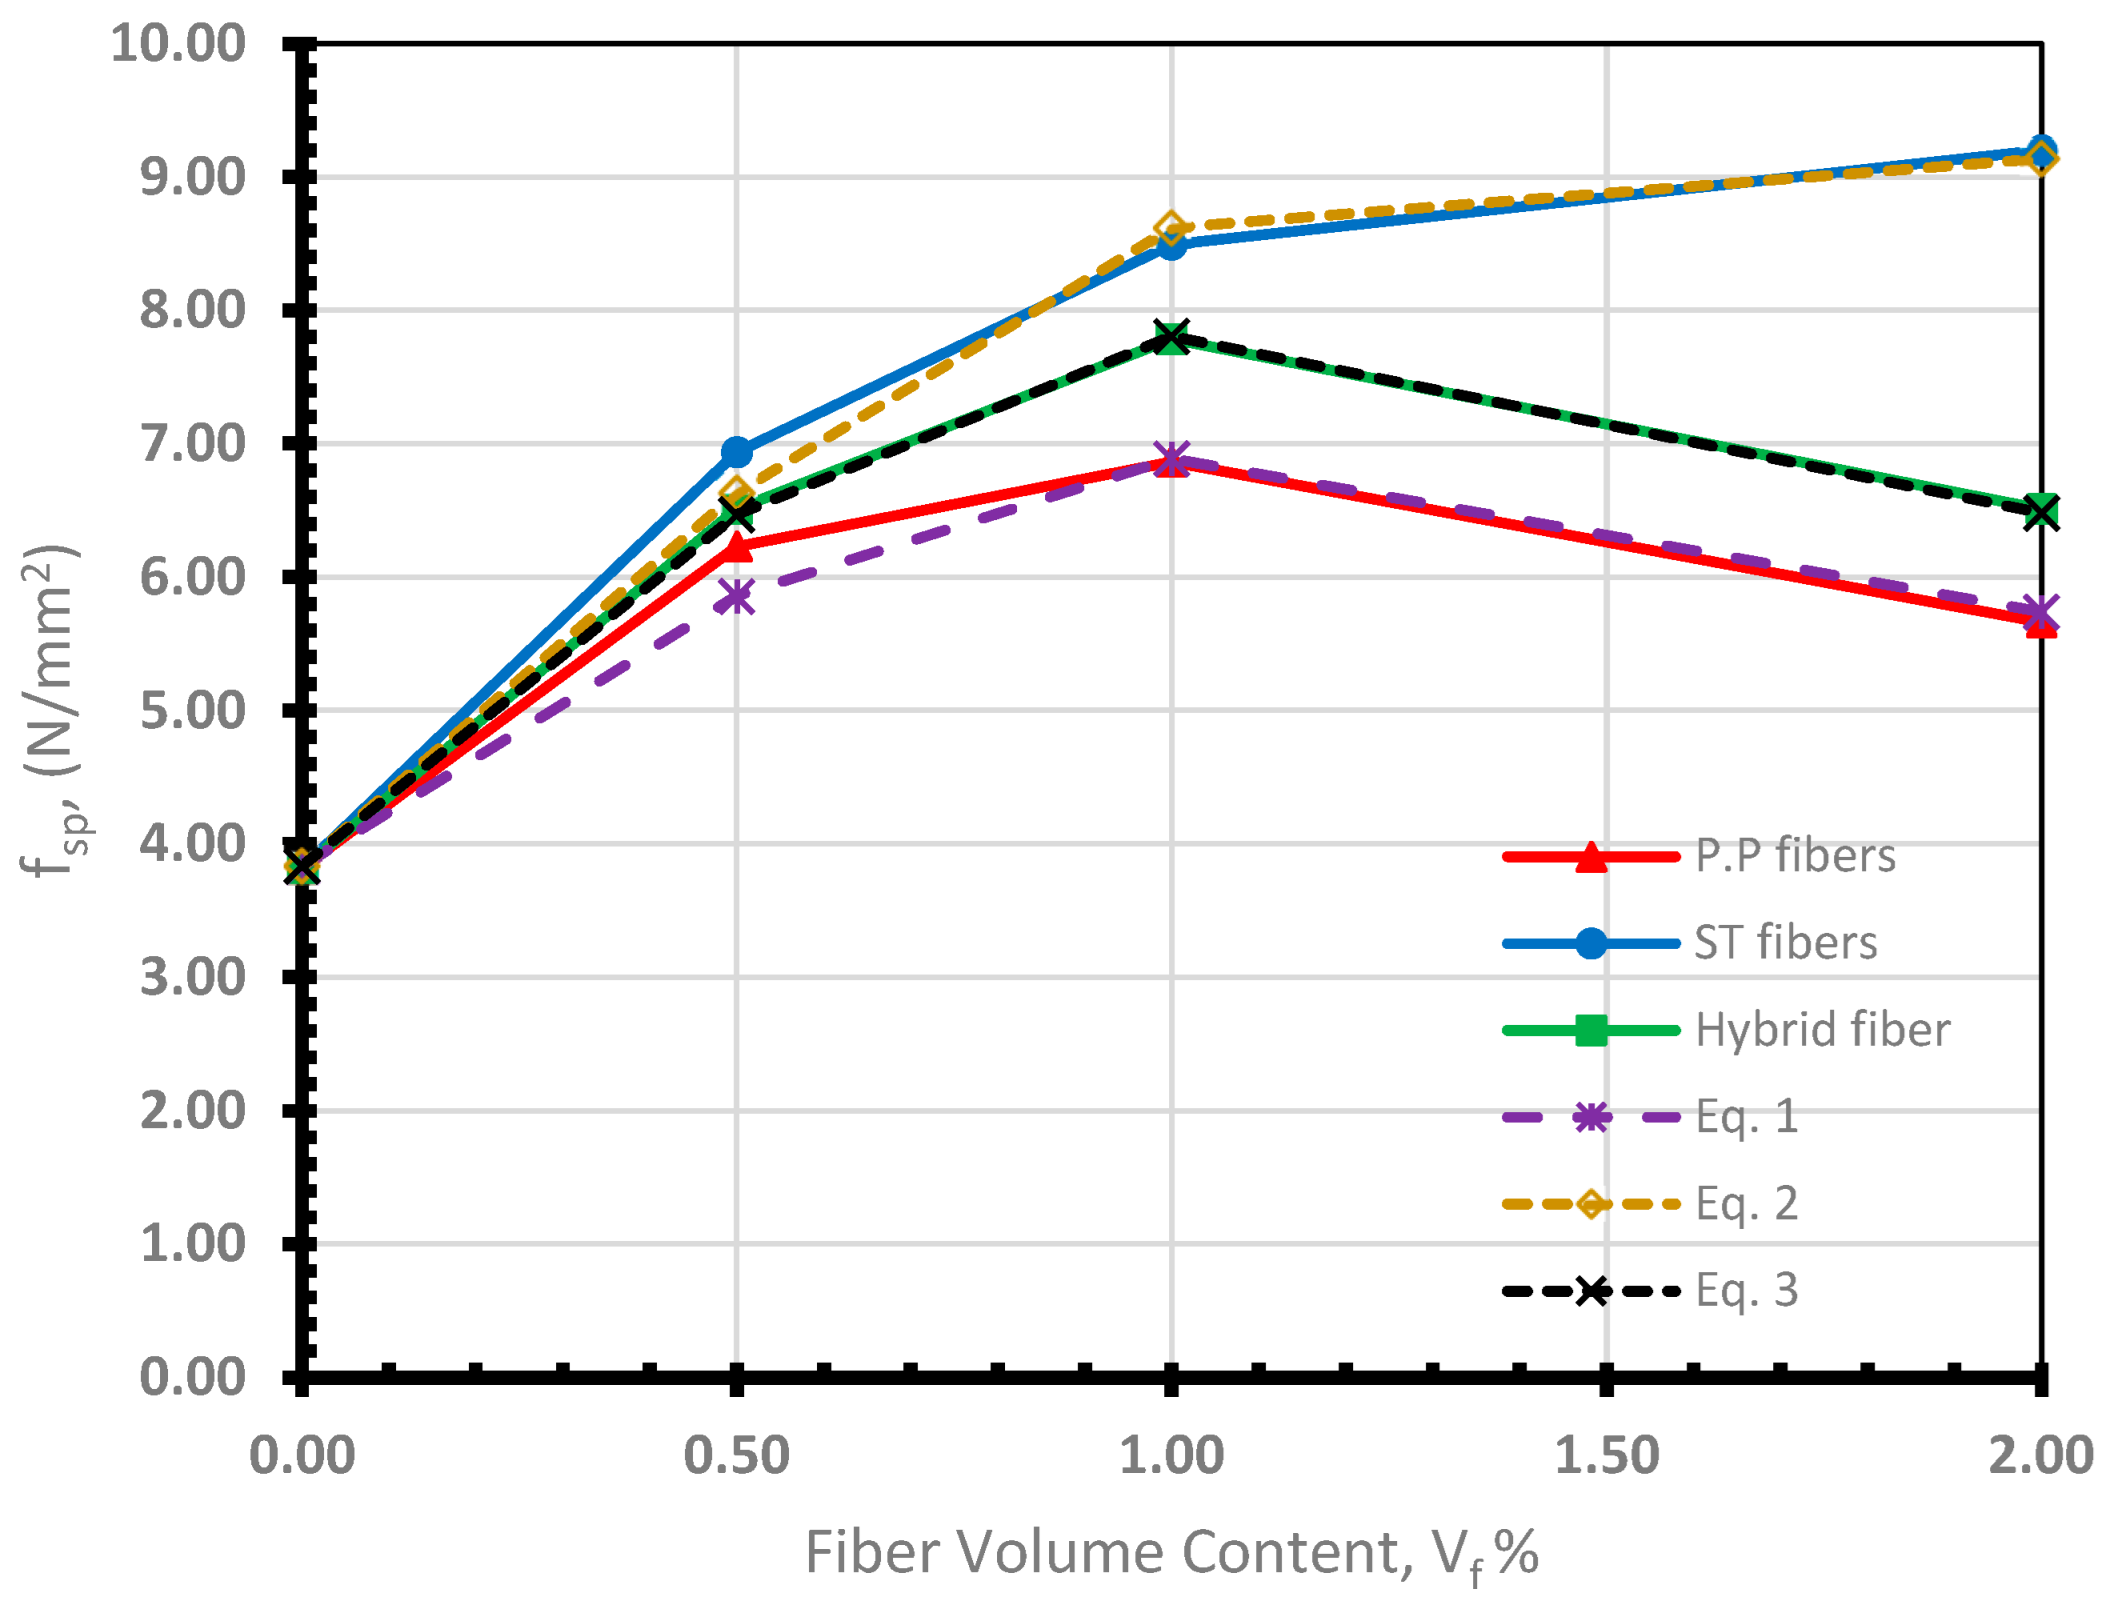
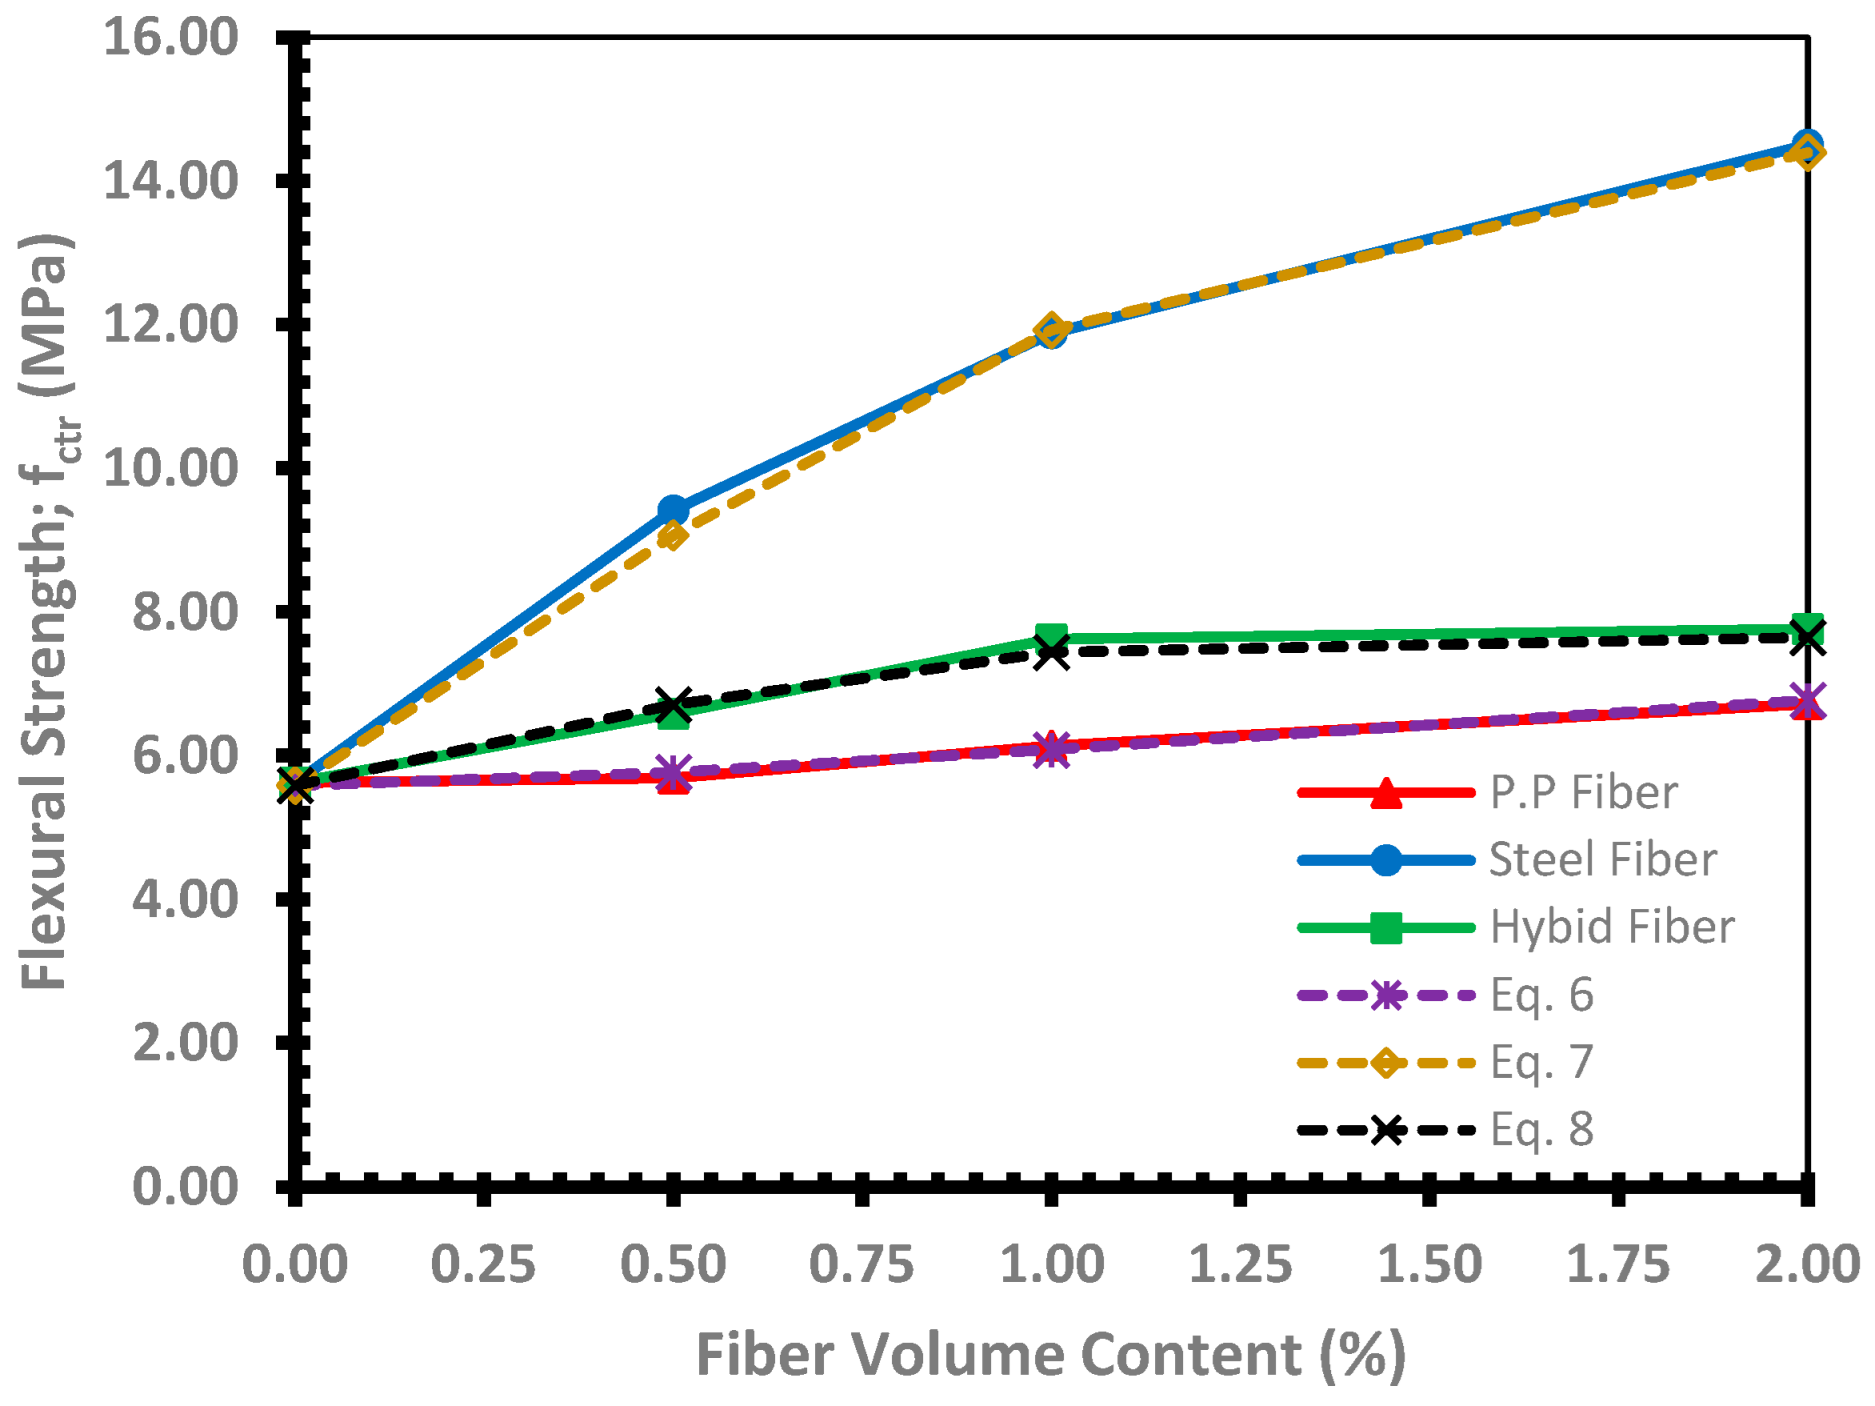
- Both the tensile splitting strength () and the flexural tensile strength in the form of the modulus of rupture () can be predicted as a function of the volume fraction of PP, ST, and hybrid fibers and the square root of the concrete compressive strength by a polynomial with a 2nd order relationship using a statistical analysis program.
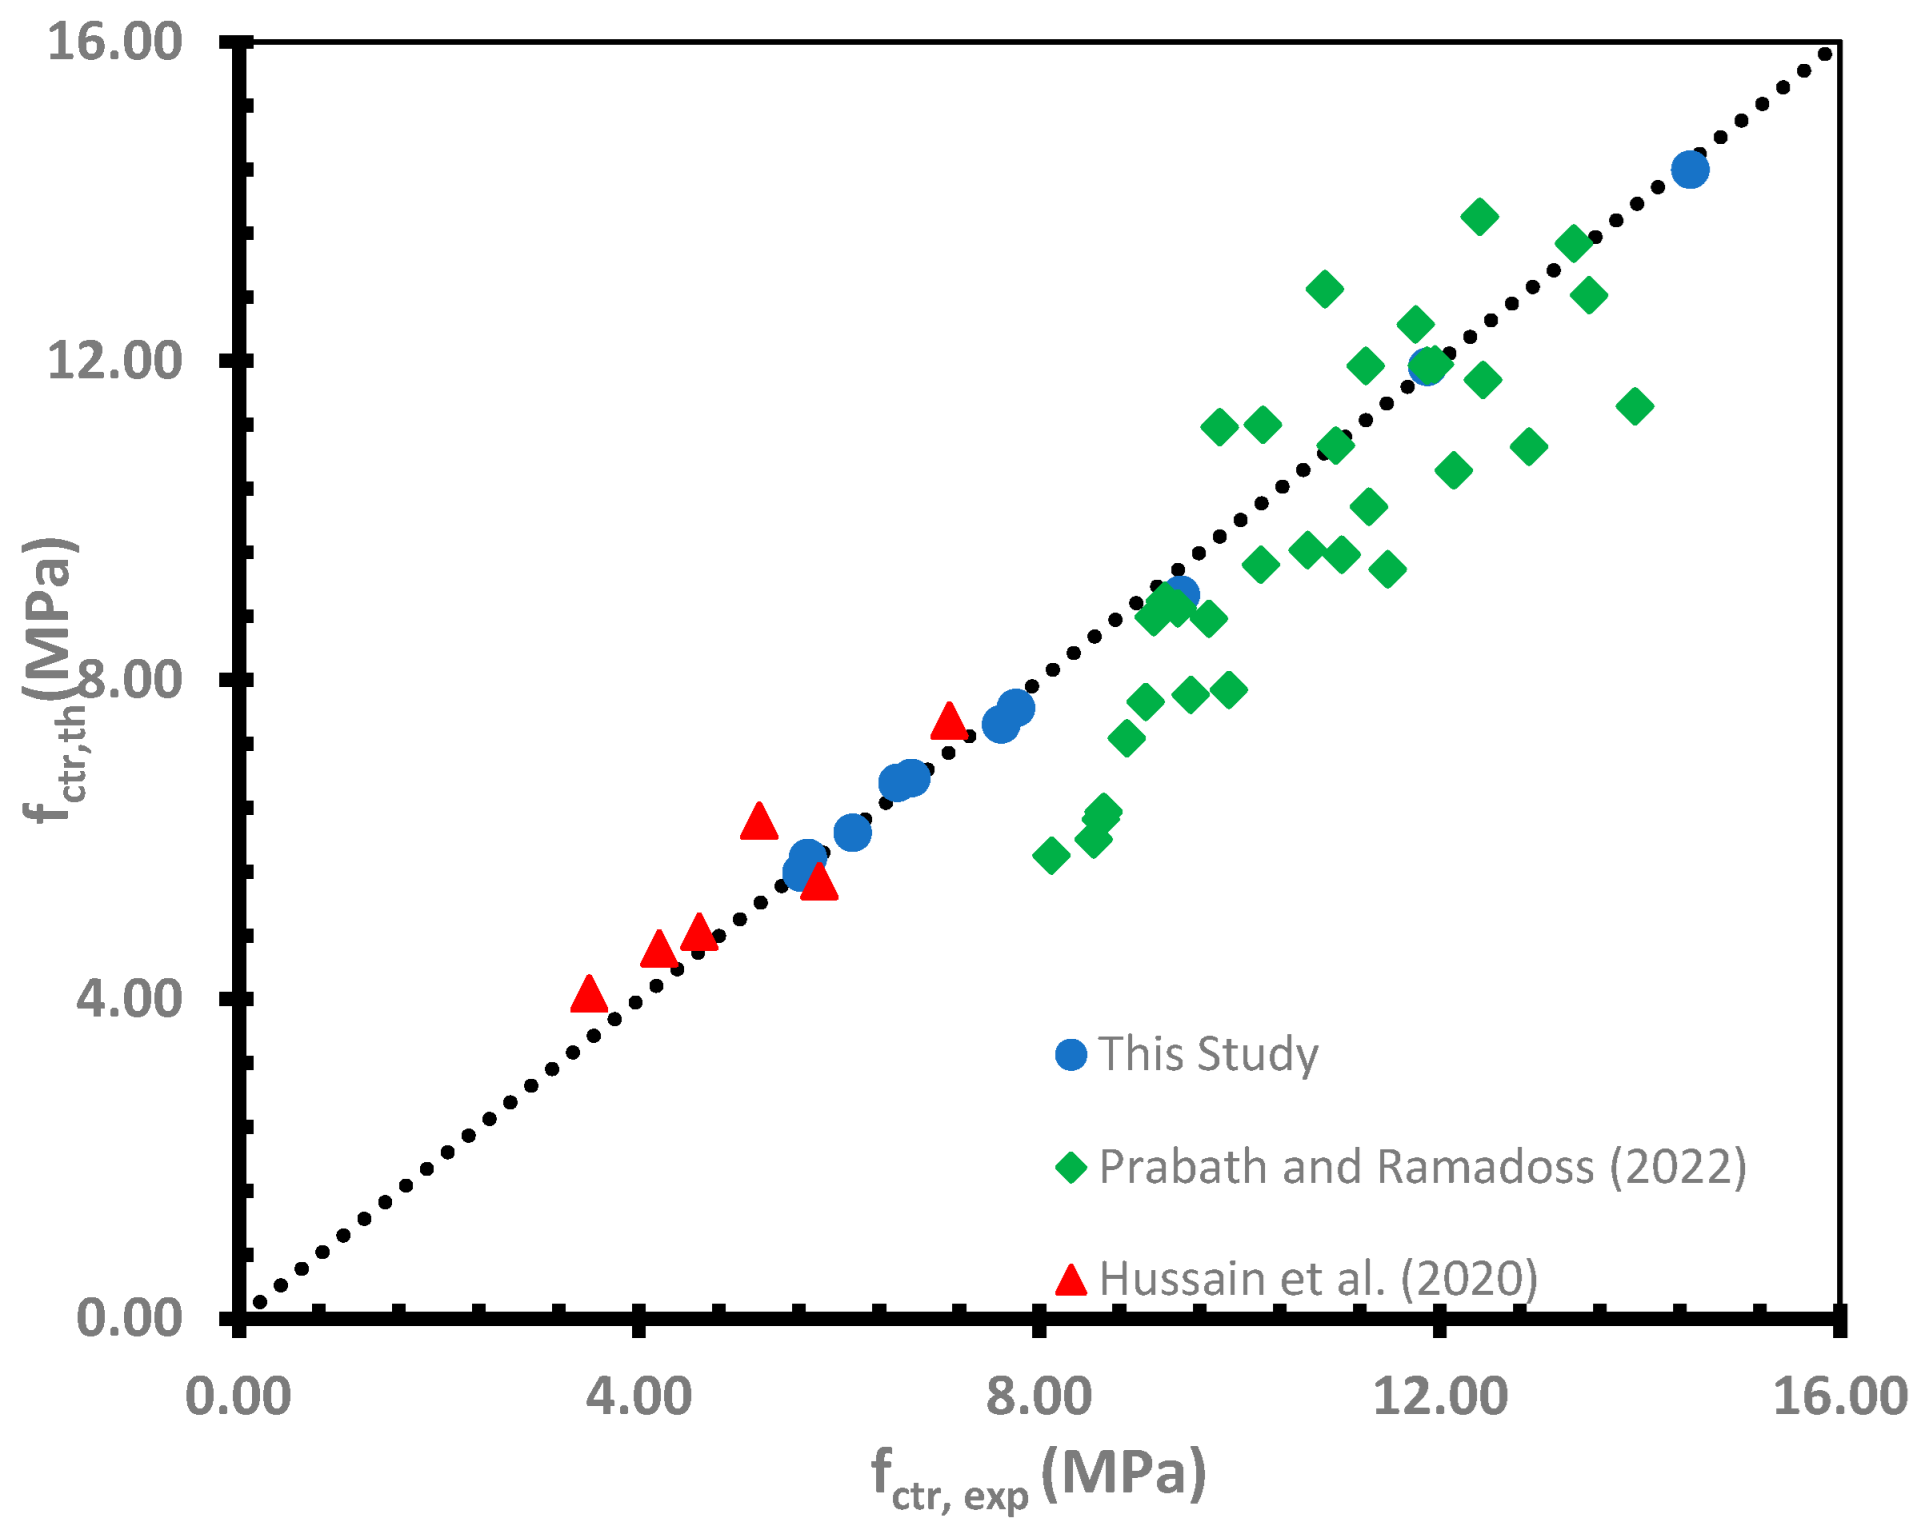
- The obtained formulae were able to predict accurately both the splitting tensile strength and modulus of rupture for SHPC with each of the three types of fibers used in this research. Also, they were in very good agreement with the values corresponding to different experimental results of other research, which means the ability to use these equations more generally.
- Nominal additional ultimate bending moment (Mnu-FRC), due to the presence of fibers, increases with increasing the percentage of fiber volume content, either ST or hybrid (ST + PP) fibers. It is not the case for PP fibers with 2% volume content. ST fibers led to the highest Mnu-FRC values. Mnu-FRC values for Group 3 (hybrid fiber) beams ranged from 2.2 to 2.8 kN·m. These values were greater than those for Group 1 (micro-PP fiber) beams and lower than those for Group 2 (macro-ST fiber) beams.
- For all mixtures, reference and fibered ones, the cylinder compressive strength () showed the same behavior as the cube compressive strength (), and the ratio (/) ranged from 0.9 to 0.93.
- Hybrid fiber content up to 0.5% demonstrated a conservative change in consistency, but when the hybrid fiber content increased from 1.0 to 2.0 percent, the mix consistency changed from SHPC to HPC with slump classes S4 and S2, respectively.
- For mixtures of hybrid fiber, the compressive strengths typically fluctuate in a range close to those of plain concrete. It may be related to the voids and microscopic cracks that fibers produce, which, on the one hand, cause localized stress concentrations and, on the other hand, slow down the spread of cracks (the bridging effect).
- Increasing the amount of hybrid fibers up to 1% increased the tensile splitting strength in this group. However, increasing the amount of hybrid fibers to 2% decreased tensile splitting strength. This was due to the balling effect of the high-volume content of PP fibers, which led to more voids in mix H2.0, and may be due to their short length.
- Due to the higher modulus of elasticity, bond stresses, and fiber crack bridging of hooked-end ST fibers, the flexural tensile strength increased much more with macro ST fibers than with micro-PP fibers. However, when using hybrid fibers of micro-PP fibers and macro-ST fibers with equal volume content, the flexural tensile strength increased but was still close to that of Group 1 (PP fibers).
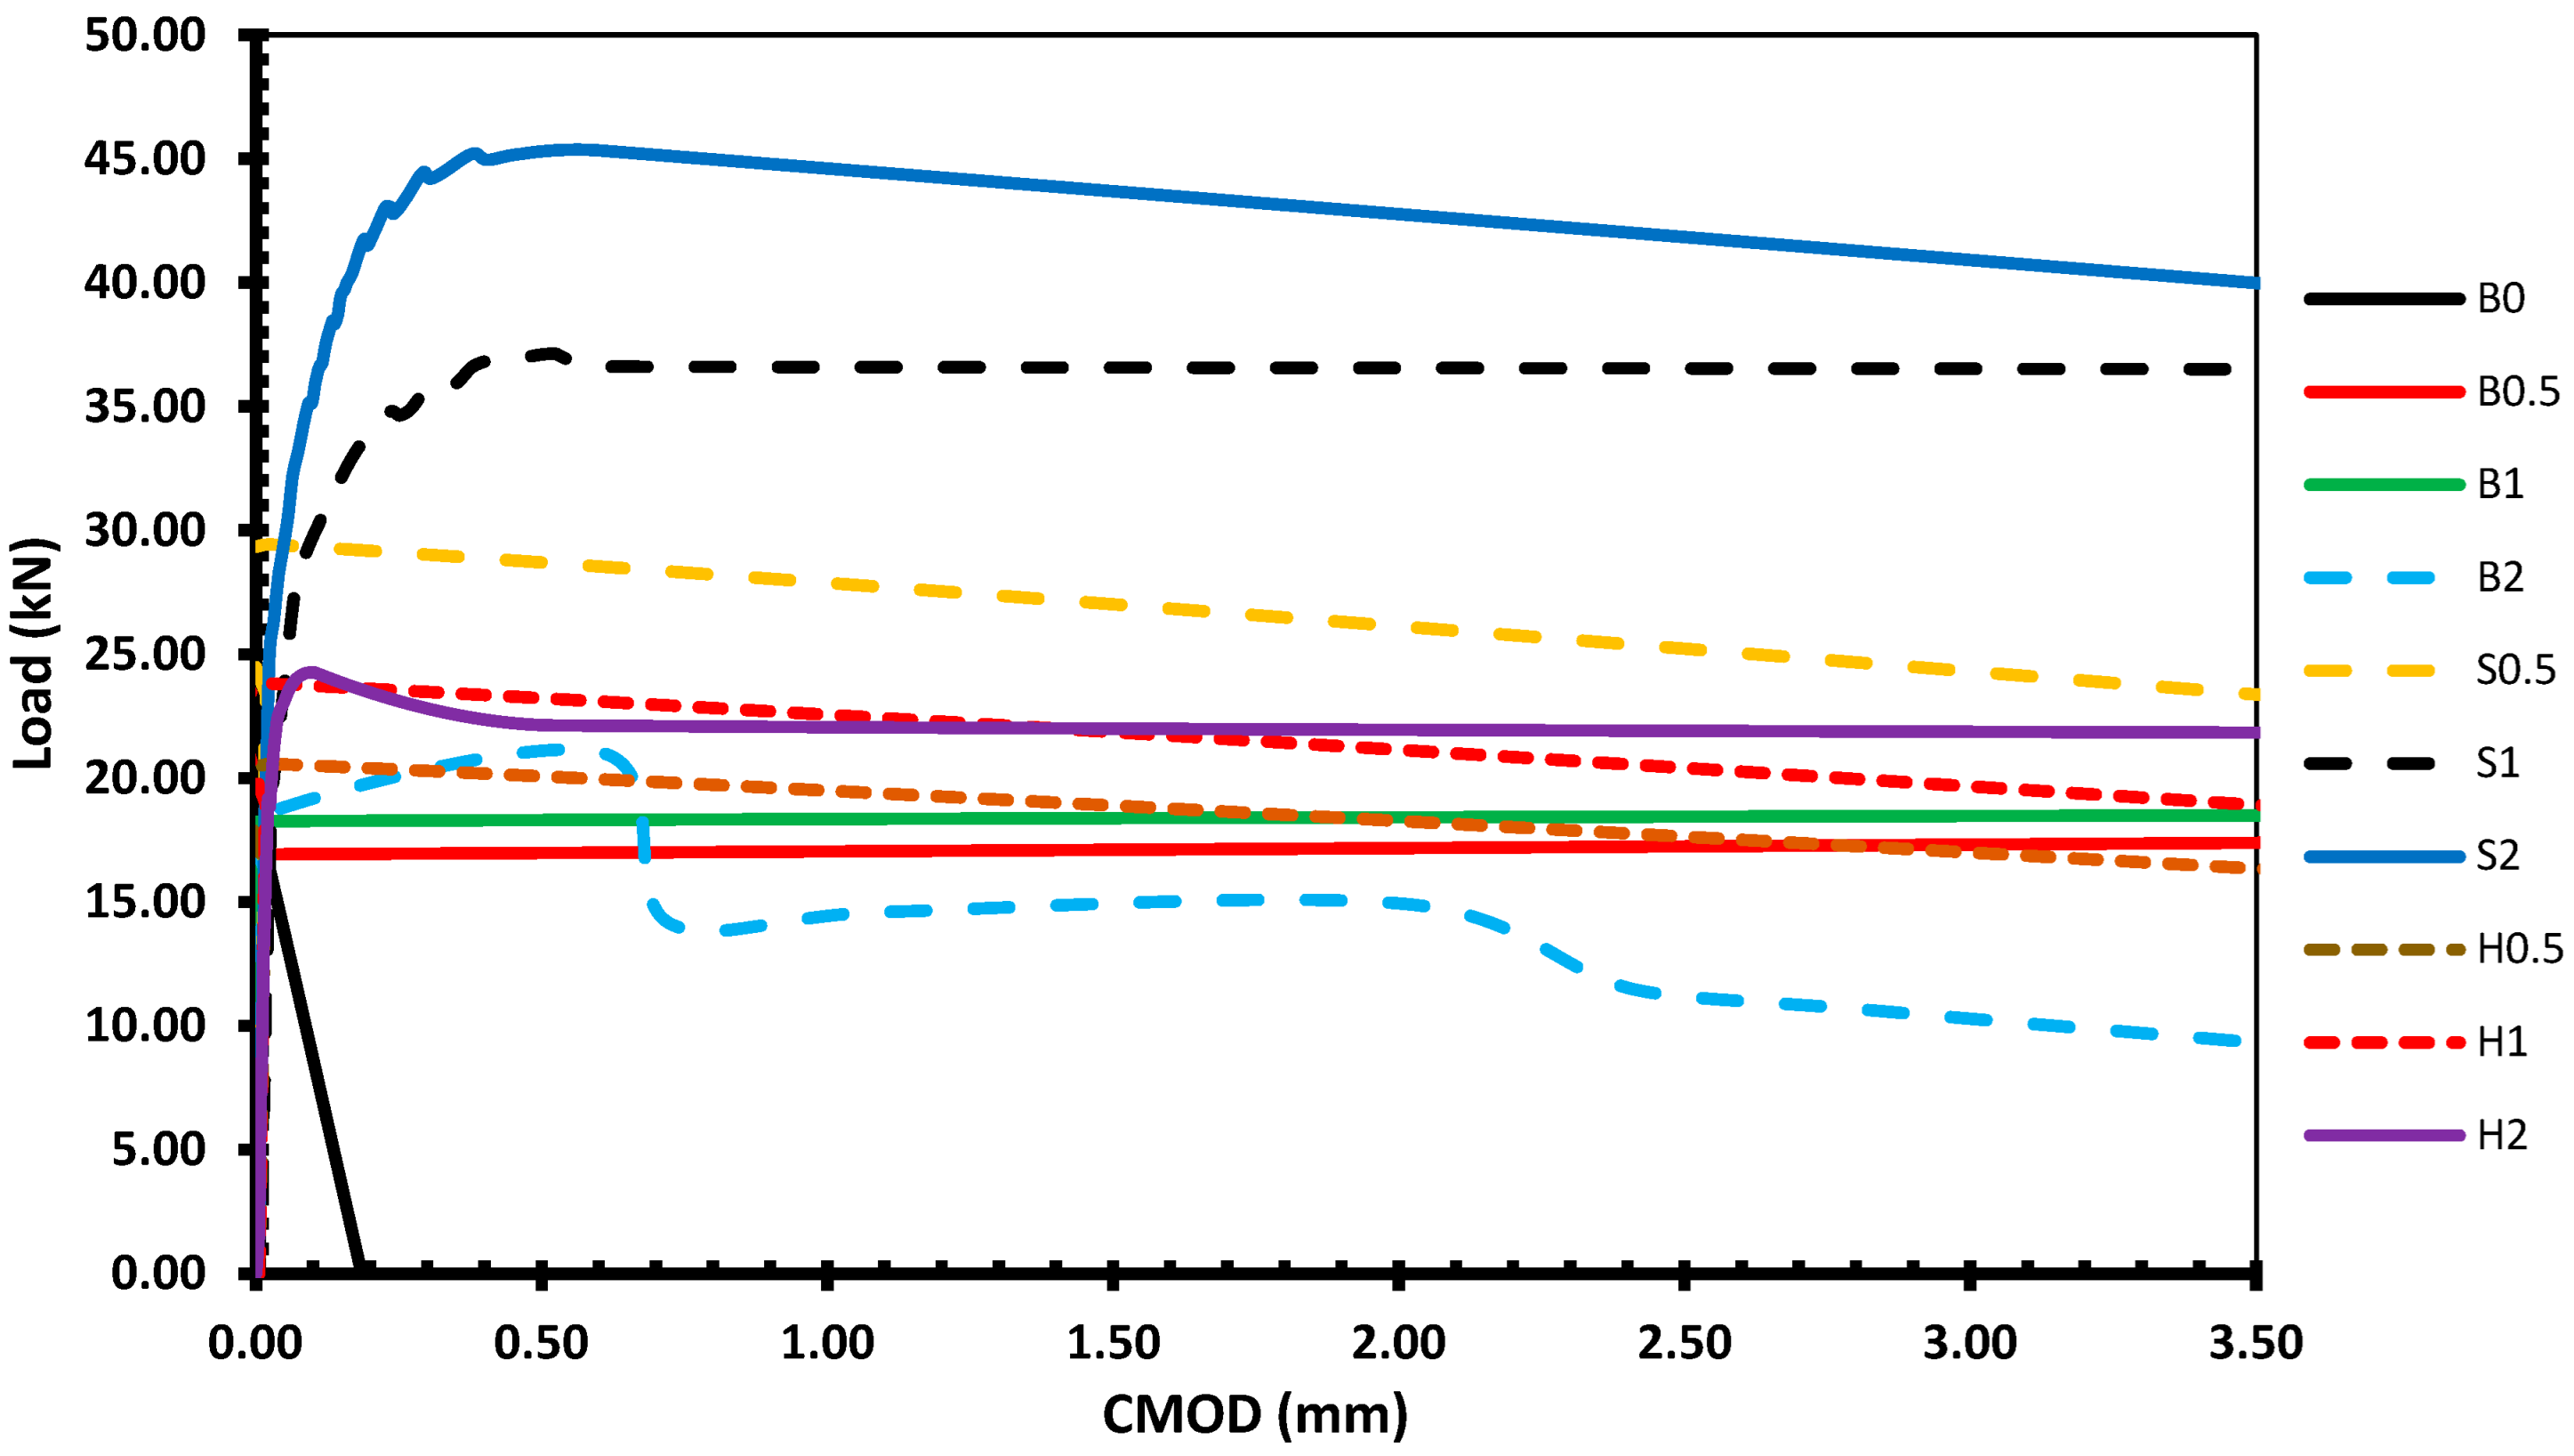
- According to the Load-CMOD curves, micro-PP fibers (Group 1) showed the least flexural behavior, whereas ST fibers (Group 2) demonstrated the most flexural behavior compared to other fibers. The hybrid fibers (Group 3) exhibited behavior resembling ST fibers (Group 2) but had values near PP fibers (Group 1).
- For hybrid fibers (Group 3), the ratio of fR3/fR1 was nearly steady at 0.88 for beams H0.5 and H1.0 but increased to 1.0 for beam H2.0. The categorization of beams according to fib model code 2010 in Group 3 was 6b for beams H0.5, 7b for beams H1.0, and 7c for beams H2.0, indicating that all hybrid fiber beams in Group 3 may be used effectively in structural design, with the best performance reached in this group with a hybrid fiber content of 2.0%.
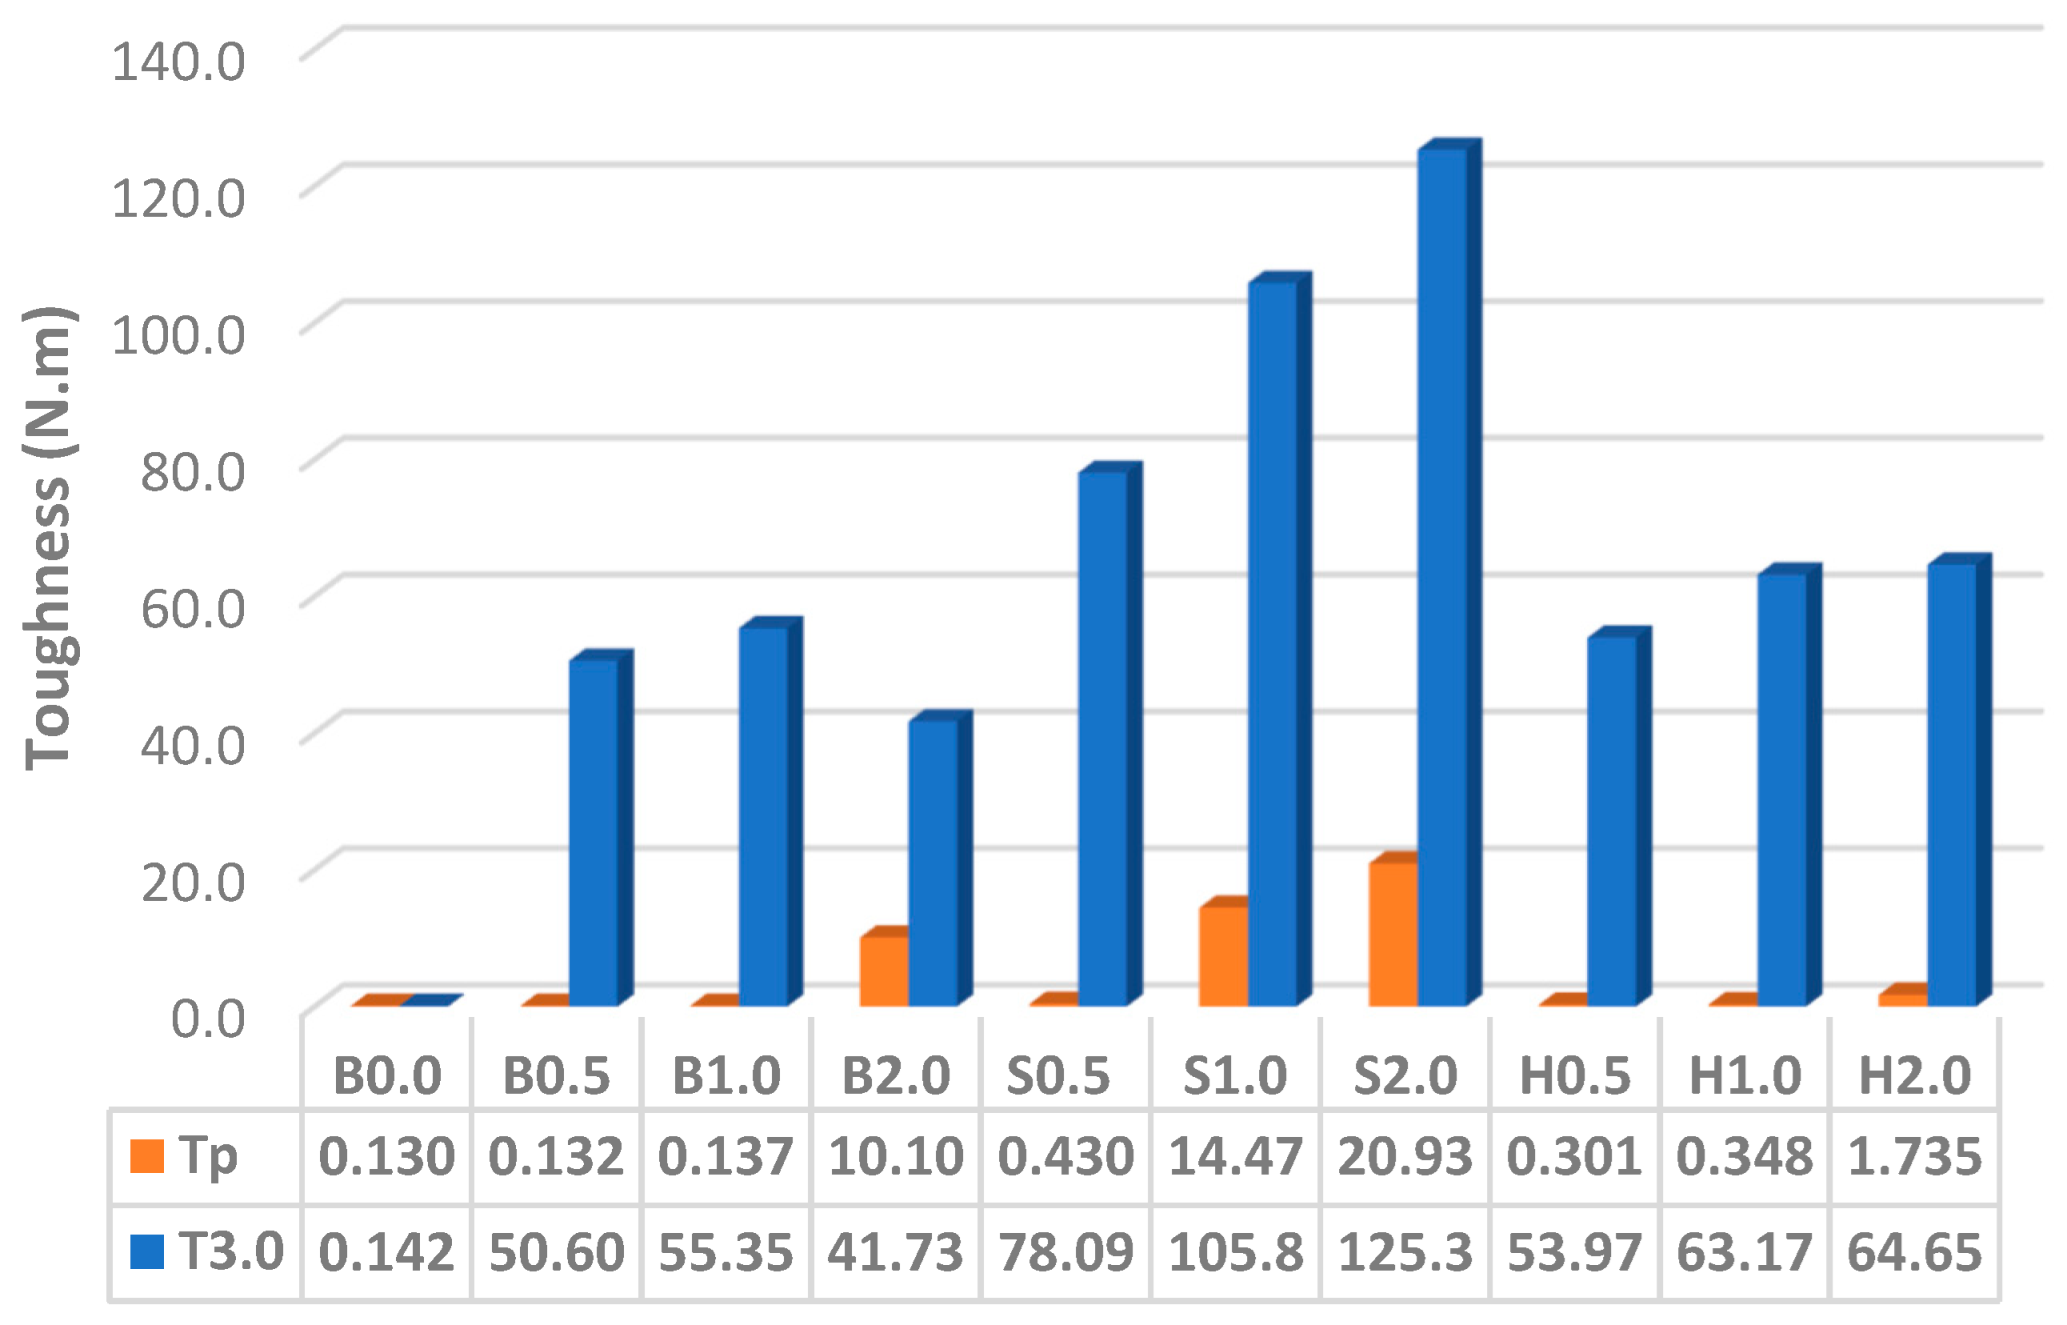
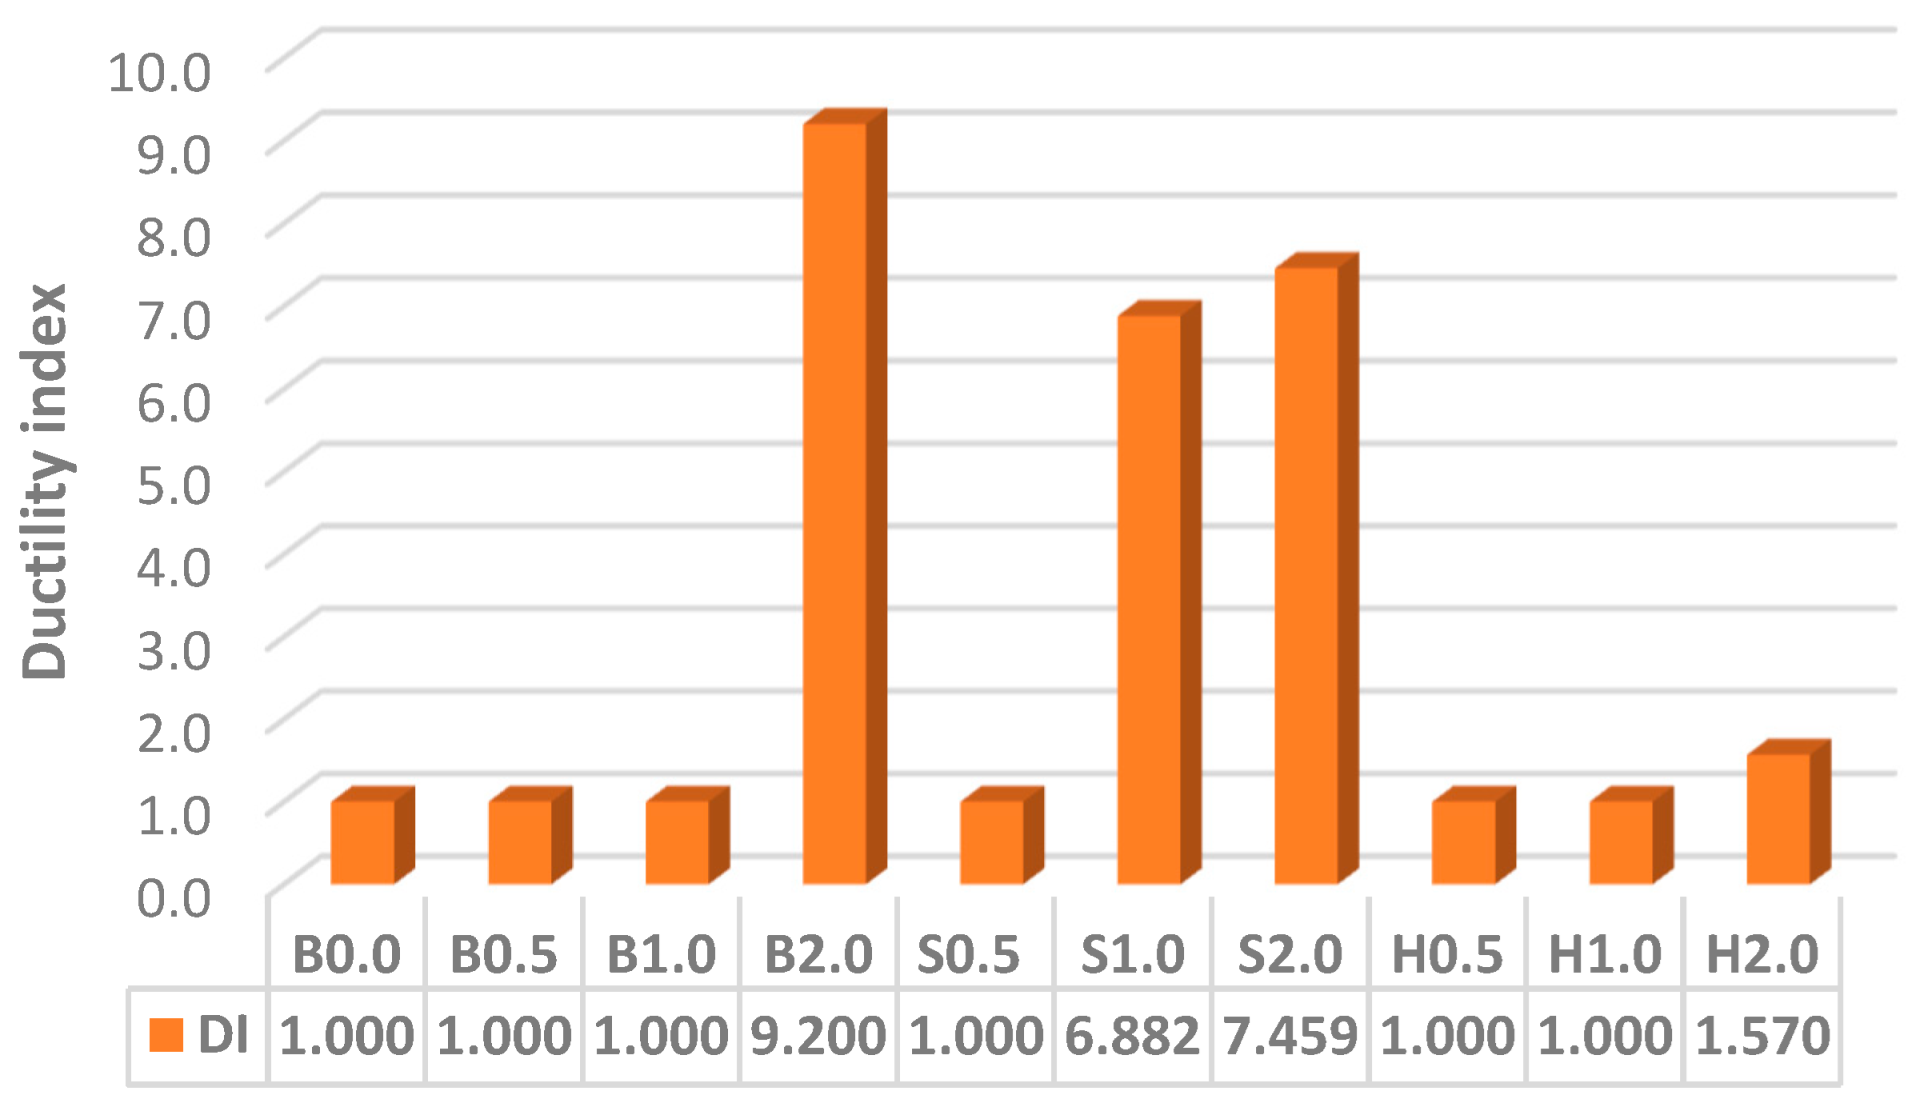
- Increasing the fiber volume content demonstrated an increase in fracture toughness for ST and hybrid fibers. On the other hand, increasing the volume content of PP fibers up to 1.0% increased the fracture toughness T3.0, while increasing from 1.0 to 2.0% revealed a decrease in the fracture toughness T3.0.
- For all specimens, Tp was less than T3.0. However, according to the experimental results, Tp, which is calculated at a very early stage of behavior, cannot be considered an index for comparison between different types of fibers. Only T3.0 is the right index for this comparison.
- Both hybrid and polypropylene fibers can help reduce the cost as well as the dimensions and reinforcement of RC sections. For SHPC, both polypropylene and hybrid fiber-reinforced mixtures are much more economical than ST fiber-reinforced mixtures.
- Finally, the optimum percentage for the fiber volume content for the hybrid of ST and PP is 1%; 0.5% for each of the two kinds.
Author Contributions
Funding
Data Availability Statement
Acknowledgments
Conflicts of Interest
References
- Malloy, J.; Sim, C.; Tian, Y.; Hu, J. Development of Specifications for High-Performance Fiber Concrete for Nevada; Nevada Department of Transportation: Carson City, NV, USA, 2020. [Google Scholar]
- ECP 203-2020; Egyptian Code for Design and Construction of Reinforced Concrete Structures. Egyptian Code Committee for Design and Construction of Reinforced Concrete Structures: Cairo, Egypt, 2020.
- European Committee for Standardization. Eurocode 2: Design of Concrete Structures: Part 1-1: General Rules and Rules for Buildings; European Committee for Standardization: Brussels, Belgium, 2004. [Google Scholar]
- JSCE No. 15; Standard Specifications for Concrete Structures 2007 “Design”. Japan Society of Civil Engineers (JSCE): Tokyo, Japan, 2007.
- ACI Committee. Building Code Requirements for Structural Concrete (ACI 318-19); ACI Committee 318; American Concrete Institute: Farmington Hills, MI, USA, 2019. [Google Scholar]
- Fédération Internationale du Béton (fib). fib Model Code for Concrete Structures 2010; Fédération Internationale du Béton (fib): Ecublens, Switzerland, 2013. [Google Scholar]
- Vandewalle, L.; Nemegeer, D.; Balázs, L.; Barr, B.; Barros, J.; Bartos, P.; Banthia, N.; Brandt, A.; Criswell, M.; Denarie, F.J.M.; et al. RILEM TC162-TDF: Test and Design Methdos for Steel Fibre Reinforced Concrete: Design of steel fibre reinforced concrete using the sigma-w-method: Principles and applications. Mater. Struct. 2002, 35, 262–278. [Google Scholar]
- CNR-DT 204/2006; Guide for the Design and Construction of Fiber-Reinforced Concrete Structures. CNR—Advisory Committee on Technical Recommendations for Construction: Rome, Italy, 2007.
- JSCE No. 82; Recommendations for Design and Construction of High Performance Fiber Reinforced Cement Composites with multiple fine cracks (HPFRCC). Japan Society of Civil Engineers, Concrete Committee:: Tokyo, Japan, 2008.
- AFGC. Ultra High Performance Fibre-Reinforced, Recommendations; AFGC, Association Française de Génie Civil: Paris, France, 2013. [Google Scholar]
- ACI Committee. Guide to Design with Fiber-Reinforced Concrete; ACI Committee 544; American Concrete Institute: Farmington Hills, MI, USA, 2018; p. 44. [Google Scholar]
- ACI Committee. Report on Fiber Reinforced Concrete; ACI Committee 544; American Concrete Institute: Farmington Hills, MI, USA, 1996; p. 64. [Google Scholar]
- Elnaggar, M.A.; Omar, M.S.; Yassin, A.M. Rehabilitation of defective connections between two precast concrete segments (experimental and analytical study). Constr. Build. Mater. 2023, 368, 130498. [Google Scholar] [CrossRef]
- Wang, W.; Shen, A.; Lyu, Z.; He, Z.; Nguyen, K.T. Fresh and rheological characteristics of fiber reinforced concrete—A review. Constr. Build. Mater. 2021, 296, 123734. [Google Scholar] [CrossRef]
- Anas, M.; Khan, M.; Bilal, H.; Jadoon, S.; Khan, M.N. Fiber Reinforced Concrete: A Review. Eng. Proc. 2022, 22, 3. [Google Scholar]
- Wafa, F.F. Properties and applications of fiber reinforced concrete. Eng. Sci. 1990, 2, 14. [Google Scholar] [CrossRef]
- Ragavendra, S.; Reddy, I.P.; Dongre, A. Fibre reinforced concrete—A case study. In Proceedings of the 33rd national Convention of Architectural Engineers and National Seminar on Architectural Engineering Aspect for Sustainable Building Envelopes, Hyderabad, India, 10 November 2017. [Google Scholar]
- Tawfeeq, W.M.; Ali, T.K.M.; Al-Kumzari, Y.; Al-Hosni, M.; Al-Fazari, K.; Al-Bedwawi, M.; Al-Bashkardi, A. Flexural performance of reinforced concrete beams made by using recycled block aggregates and fibers. Innov. Infrastruct. Solut. 2021, 6, 38. [Google Scholar] [CrossRef]
- Alrekabi, T.K.; Cunha, V.M.; Barros, J.A. Reactive powder concrete reinforced with steel fibres exposed to high temperatures. In Proceedings of the IOP Conference Series: Materials Science and Engineering, Prague, Czech Republic, 13–16 September 2017; p. 012020. [Google Scholar]
- Shoukry, M.E.; Tarabia, A.M.; Yassin, A.M. Punching shear strength of ultra-high-performance fibre concrete slab–column connections. Proc. Inst. Civ. Eng. Struct. Build. 2022, 175, 644–656. [Google Scholar] [CrossRef]
- Ferrara, L.; Park, Y.-D.; Shah, S.P. A method for mix-design of fiber-reinforced self-compacting concrete. Cem. Concr. Res. 2007, 37, 957–971. [Google Scholar] [CrossRef]
- Ozyurt, N.; Mason, T.O.; Shah, S.P. Correlation of fiber dispersion, rheology and mechanical performance of FRCs. Cem. Concr. Compos. 2007, 29, 70–79. [Google Scholar] [CrossRef]
- Akcay, B.; Tasdemir, M.A. Mechanical behaviour and fibre dispersion of hybrid steel fibre reinforced self-compacting concrete. Constr. Build. Mater. 2012, 28, 287–293. [Google Scholar] [CrossRef]
- He, F.; Biolzi, L.; Carvelli, V. Effect of fiber hybridization on mechanical properties of concrete. Mater. Struct. 2022, 55, 195. [Google Scholar] [CrossRef]
- ACI Committee. Report on the Physical Properties and Durability of Fiber-Reinforced Concrete; ACI Committee 544; American Concrete Institute: Farmington Hills, MI, USA, 2010; p. 35. [Google Scholar]
- Hahne, H.; Karl, S.; Worner, J. Properties of polyacrylonitrile fiber reinforced concrete. Spec. Publ. 1987, 105–112, 211–224. [Google Scholar]
- Wang, Y.; Backer, S.; Li, V.C. An experimental study of synthetic fibre reinforced cementitious composites. J. Mater. Sci. 1987, 22, 4281–4291. [Google Scholar] [CrossRef]
- Amat, T.; Blanco, M.; Palomo, A. Acrylic fibres as reinforcement for cement pastes. Cem. Concr. Compos. 1994, 16, 31–37. [Google Scholar] [CrossRef]
- Conforti, A.; Trabucchi, I.; Tiberti, G.; Plizzari, G.A.; Caratelli, A.; Meda, A. Precast tunnel segments for metro tunnel lining: A hybrid reinforcement solution using macro-synthetic fibers. Eng. Struct. 2019, 199, 109628. [Google Scholar] [CrossRef]
- Xu, H.; Shao, Z.; Wang, Z.; Cai, L.; Li, Z.; Jin, H.; Chen, T. Experimental study on mechanical properties of fiber reinforced concrete: Effect of cellulose fiber, polyvinyl alcohol fiber and polyolefin fiber. Constr. Build. Mater. 2020, 261, 120610. [Google Scholar] [CrossRef]
- Blazy, J.; Drobiec, L.; Wolka, P. Flexural Tensile Strength of Concrete with Synthetic Fibers. Materials 2021, 14, 4428. [Google Scholar] [CrossRef]
- Slebi-Acevedo, C.J.; Lastra-González, P.; Castro-Fresno, D.; Vega-Zamanillo, Á. Experimental evaluation and recyclability potential of asphalt concrete mixtures with polyacrylonitrile fibers. Constr. Build. Mater. 2022, 317, 125829. [Google Scholar] [CrossRef]
- Sor, N.H.; Ali, T.K.M.; Vali, K.S.; Ahmed, H.U.; Faraj, R.H.; Bheel, N.; Mosavi, A. The behavior of sustainable self-compacting concrete reinforced with low-density waste Polyethylene fiber. Mater. Res. Express 2022, 9, 035501. [Google Scholar]
- Zeng, Y.; Tang, A. Comparison of effects of basalt and polyacrylonitrile fibers on toughness behaviors of lightweight aggregate concrete. Constr. Build. Mater. 2021, 282, 122572. [Google Scholar] [CrossRef]
- Walton, P.; Majumdar, A.J. Cement-based composites with mixtures of different types of fibres. Composites 1975, 6, 209–216. [Google Scholar] [CrossRef]
- Vondran, G.; Webster, T. Relationship of polypropylene fiber reinforced concrete to permeability. Spec. Publ. 1988, 108, 85–98. [Google Scholar]
- Morgan, D.; McAskill, N.; Richardson, B.; Zellers, R. A comparative evaluation of plain, polypropylene fiber, steel fiber, and wire mesh reinforced shotcretes. Transp. Res. Rec. 1989. Available online: https://onlinepubs.trb.org/Onlinepubs/trr/1989/1226/1226-011.pdf (accessed on 27 November 2023).
- Padron, I.; Zollo, R.F. Effect of synthetic fibers on volume stability and cracking of portland cement concrete and mortar. ACI Mater. J. 1990, 87, 327–332. [Google Scholar]
- Sadiqul Islam, G.M.; Gupta, S.D. Evaluating plastic shrinkage and permeability of polypropylene fiber reinforced concrete. Int. J. Sustain. Built Environ. 2016, 5, 345–354. [Google Scholar] [CrossRef]
- Allouzi, R.; Al Qatawna, A.; Al-Kasasbeh, T. Lightweight Foamed Concrete Mixture for Structural Use. ACI Mater. J. 2020, 117, 99. [Google Scholar]
- Altalabani, D.; Bzeni, D.K.H.; Linsel, S. Mechanical properties and load deflection relationship of polypropylene fiber reinforced self-compacting lightweight concrete. Constr. Build. Mater. 2020, 252, 119084. [Google Scholar] [CrossRef]
- Hussain, I.; Ali, B.; Akhtar, T.; Jameel, M.S.; Raza, S.S. Comparison of mechanical properties of concrete and design thickness of pavement with different types of fiber-reinforcements (steel, glass, and polypropylene). Case Stud. Constr. Mater. 2020, 13, e00429. [Google Scholar] [CrossRef]
- Zheng, D.; Song, W.; Fu, J.; Xue, G.; Li, J.; Cao, S. Research on mechanical characteristics, fractal dimension and internal structure of fiber reinforced concrete under uniaxial compression. Constr. Build. Mater. 2020, 258, 120351. [Google Scholar] [CrossRef]
- Dey, V.; Bauchmoyer, J.; Pleesudjai, C.; Schaef, S.; Mobasher, B. Correlation of Tensile and Flexural Response of Continuous Polypropylene Fiber Reinforced Cement Composites. In Materials, Analysis, Structural Design and Applications of Textile Reinforced Concrete/Fabric Reinforced Cementitious Matrix at the Concrete Convention and Exposition-Fall; American Concrete Institute: Farmington Hills, MI, USA, 2019; pp. 230–242. [Google Scholar]
- Yang, X.; Liang, N.; Hu, Y.; Feng, R. An Experimental Study of Shear Resistance for Multisize Polypropylene Fiber Concrete Beams. Int. J. Concr. Struct. Mater. 2021, 15, 52. [Google Scholar] [CrossRef]
- Fu, Q.; Zhang, Z.; Xu, W.; Zhao, X.; Zhang, L.; Wang, Y.; Niu, D. Flexural Behavior and Prediction Model of Basalt Fiber/Polypropylene Fiber-Reinforced Concrete. Int. J. Concr. Struct. Mater. 2022, 16, 52. [Google Scholar] [CrossRef]
- Shafigh, P.; Hafez, M.A.; Che Muda, Z.; Beddu, S.; Zakaria, A.a.; Almkahal, Z. Influence of Different Ambient Temperatures on the Thermal Properties of Fiber-Reinforced Structural Lightweight Aggregate Concrete. Buildings 2022, 12, 771. [Google Scholar] [CrossRef]
- Ganasini, D.; Effting, C.; Schackow, A.; Gomes, I.R. High-Performance Concrete with Polypropylene Microfibers for Fire Safety. ACI Struct. J. 2022, 119, 197–209. [Google Scholar]
- Rezaeian, A.; Daghari, A.; Kodur, V. Behavior of Polypropylene Fiber-Reinforced Concrete Beams in Fire. ACI Mater. J. 2022, 119, 25–36. [Google Scholar]
- Qian, C.X.; Stroeven, P. Development of hybrid polypropylene-steel fibre-reinforced concrete. Cem. Concr. Res. 2000, 30, 63–69. [Google Scholar] [CrossRef]
- Di Nunzio, G.; Consiglio, A.; Muciaccia, G.; Rosati, G. Aging Behavior of High-Performance Fiber-Reinforced Concrete. Spec. Publ. 2018, 326, 61.1–61.10. [Google Scholar]
- Özsoy Özbay, A.E.; Erkek, O.; Çeribaşı, S. The effect of polypropylene, steel, and macro synthetic fibers on mechanical behavior of cementitious composites. Rev. Construcción 2021, 20, 591–601. [Google Scholar] [CrossRef]
- Prabath, N.V.N.; Ramadoss, P. Effect of Hybrid Fiber Reinforcements on the Mechanical and Ductility Performance of HPC Incorporating Micro Silica and Alccofine-1203. Preprint (Preliminary Report). Res. Sq. 2022. [Google Scholar] [CrossRef]
- Ali, S.H.; Abid, S.R.; Al-Lami, K.; Calabrese, A.S.; Yosri, A.M.; Al-Ghasham, T.S. Experimental and Statistical Analysis of Repeated Impact Records of Hybrid Fiber-Reinforced High-Performance Concrete. Buildings 2023, 13, 678. [Google Scholar] [CrossRef]
- Di Prisco, M.; Colombo, M.; Dozio, D. Fibre-reinforced concrete in fib Model Code 2010: Principles, models and test validation. Struct. Concr. 2013, 14, 342–361. [Google Scholar] [CrossRef]
- Neto, B.N.M.; Barros, J.A.O.; Melo, G.S. Model to simulate the contribution of fiber reinforcement for the punching resistance of RC slabs. J. Mater. Civ. Eng. 2014, 26, 04014020. [Google Scholar] [CrossRef]
- 237R-07; Self-Consolidating Concrete. American Concrete Institute: Farmington Hills, MI, USA, 2007; p. 30.
- ACI Committee. Guide for Specifying, Proportioning, and Production of Fiber-Reinforced Concrete; ACI Committee 544; American Concrete Institute: Farmington Hills, MI, USA, 2008; p. 16. [Google Scholar]
- ACI Committee. Report on High-Strength Concrete; ACI Committee 363; American Concrete Institute: Farmington Hills, MI, USA, 2010. [Google Scholar]
- ACI Committee. Report on Indirect Method to Obtain Stress-Strain Response of Fiber-Reinforced Concrete (FRC); ACI Committee 544; American Concrete Institute: Farmington Hills, MI, USA, 2016; p. 28. [Google Scholar]
- ACI Committee. Report on the Measurement of Fresh State Properties and Fiber Dispersion of Fiber-Reinforced Concrete; ACI Committee 544; American Concrete Institute: Farmington Hills, MI, USA, 2017; p. 24. [Google Scholar]
- ACI Committee. Report on Measuring Mechanical Properties of Hardened Fiber-Reinforced Concrete; ACI Committee 544; American Concrete Institute: Farmington Hills, MI, USA, 2017; p. 52. [Google Scholar]
- BS EN 206: 2013+A1: 2016: Concrete; Specification, Performance, Production and Conformity. BSI: London, UK, 2013.
- Standardization ECF. EN14651; Test Method for Metallic Fibered Concrete—Measuring the Flexural Tensile Strength (Limit or Proportionality (LOP), Residual). CEN: London, UK, 2007.


| Fiber | PP | ST |
|---|---|---|
| Material | polypropylene | Steel |
| shape | Straight | End-Hook |
| Length, lf (mm) | 12 | 30 |
| Thickness (mm) | 0.03–0.032 | 0.5 |
| Cross section | rounded | rectangular |
| Equivalent diameter, df (mm) | 0.03 | 0.6 |
| Density (kg/m3) | 910 | 7800 |
| Modulus of Elasticity (N/mm2) | 5500–5700 | 200,000 |
| Tensile strength (N/mm2) | 350 | >1000 |
| Group | Mix | Mix Proportion (kg/m3) | Workability | |||||||||
|---|---|---|---|---|---|---|---|---|---|---|---|---|
| Cement | Crushed Limestone | Sand | Water | Admixture | Fiber | W/B ** | ||||||
| Weight | Vf % * | Type | Slump (mm) | T50 (s) | ||||||||
| Reference | B0.0 | 800 | 1100 | 700 | 200 | 16.0 | - | - | - | 0.25 | 300 | 7 |
| Group 1 | B0.5 | 4.6 | 0.5 | PP | 175 | - | ||||||
| B1.0 | 9.1 | 1.0 | PP | 145 | - | |||||||
| B2.0 | 18.2 | 2.0 | PP | 15 | - | |||||||
| Group 2 | S0.5 | 39.0 | 0.5 | ST | 300 | 9 | ||||||
| S1.0 | 78.0 | 1.0 | ST | 300 | 12 | |||||||
| S2.0 | 156.0 | 2.0 | ST | 143 | - | |||||||
| Group 3 | H0.5 | 2.3 + 19.5 | 0.5 | PP + ST | 300 | 10 | ||||||
| H1.0 | 4.6 + 39.0 | 1.0 | PP + ST | 165 | - | |||||||
| H2.0 | 9.1 + 78.0 | 2.0 | PP + ST | 25 | - | |||||||
| Group | Mix | Compressive Strength (N/mm2) | Tensile Splitting Strength (N/mm2) | Modulus of Rupture (N/mm2) | fsp/fctr | |||||||||||
|---|---|---|---|---|---|---|---|---|---|---|---|---|---|---|---|---|
| fcu,100 | fcu | fcu,100/fcu | fcu/fcu,B0.0 | /fcu | fsp,100 | fsp | fsp,100/fsp | fsp/fsp,B0.0 | fctr | fctr/fctr,B0.0 | ||||||
| Ref. | B0.0 | 71.60 | 69.51 | 65.53 | 1.03 | 1.00 | 0.92 | 3.94 | 3.82 | 1.03 | 1.00 | 0.46 | 5.63 | 1.00 | 0.67 | 0.68 |
| Group 1 | B0.5 | 73.38 | 70.56 | 67.86 | 1.04 | 1.02 | 0.92 | 6.41 | 6.23 | 1.03 | 1.63 | 0.74 | 5.69 | 1.01 | 0.68 | 1.09 |
| B1.0 | 74.90 | 71.33 | 68.15 | 1.05 | 1.03 | 0.91 | 7.14 | 6.86 | 1.04 | 1.80 | 0.81 | 6.14 | 1.09 | 0.73 | 1.12 | |
| B2.0 | 67.95 | 65.33 | 62.00 | 1.04 | 0.94 | 0.91 | 5.89 | 5.66 | 1.04 | 1.48 | 0.70 | 6.72 | 1.19 | 0.83 | 0.84 | |
| Group 2 | S0.5 | 75.39 | 71.80 | 69.06 | 1.05 | 1.03 | 0.92 | 7.14 | 6.94 | 1.03 | 1.81 | 0.82 | 9.42 | 1.67 | 1.11 | 0.74 |
| S1.0 | 78.81 | 75.78 | 72.40 | 1.04 | 1.09 | 0.92 | 8.92 | 8.49 | 1.05 | 2.22 | 0.98 | 11.88 | 2.11 | 1.36 | 0.71 | |
| S2.0 | 78.03 | 74.31 | 70.52 | 1.05 | 1.07 | 0.90 | 9.84 | 9.20 | 1.07 | 2.41 | 1.07 | 14.51 | 2.58 | 1.68 | 0.63 | |
| Group 3 | H0.5 | 75.60 | 72.00 | 68.79 | 1.05 | 1.04 | 0.91 | 6.71 | 6.51 | 1.03 | 1.70 | 0.77 | 6.58 | 1.17 | 0.78 | 0.99 |
| H1.0 | 75.83 | 72.22 | 69.00 | 1.05 | 1.04 | 0.91 | 8.10 | 7.78 | 1.04 | 2.04 | 0.92 | 7.62 | 1.35 | 0.90 | 1.02 | |
| H2.0 | 68.67 | 66.67 | 63.69 | 1.03 | 0.96 | 0.93 | 6.71 | 6.51 | 1.03 | 1.70 | 0.80 | 7.77 | 1.38 | 0.95 | 0.84 | |
| Group | Mix | fsp,exp | fsp,th | fsp,th/fsp,exp | fctr,exp | fctr,th | fctr,th/fctr,exp | Fiber | Equations |
|---|---|---|---|---|---|---|---|---|---|
| Group 1 | B0.0 | 3.82 | 3.84 | 1.004 | 5.63 | 5.59 | 0.993 | PP | Equation (1) + Equation (6) |
| B0.5 | 6.23 | 5.86 | 0.941 | 5.69 | 5.77 | 1.014 | |||
| B1.0 | 6.86 | 6.89 | 1.003 | 6.14 | 6.08 | 0.991 | |||
| B2.0 | 5.66 | 5.74 | 1.014 | 6.72 | 6.77 | 1.008 | |||
| Mean | 0.990 | Mean | 1.001 | ||||||
| Standard deviation (STD) | 0.033 | STD | 0.011 | ||||||
| Coefficient of variation (COV); % | 3.381 | COV % | 1.107 | ||||||
| Coefficient of determination (R2) | 0.976 | R2 | 0.985 | ||||||
| Group 2 | B0.0 | 3.82 | 3.84 | 1.004 | 5.63 | 5.59 | 0.993 | ST | Equation (2) + Equation (7) |
| S0.5 | 6.94 | 6.63 | 0.956 | 9.42 | 9.07 | 0.963 | |||
| S1.0 | 8.49 | 8.62 | 1.015 | 11.88 | 11.93 | 1.004 | |||
| S2.0 | 9.20 | 9.14 | 0.993 | 14.51 | 14.40 | 0.992 | |||
| Mean | 0.992 | Mean | 0.988 | ||||||
| Standard deviation (STD) | 0.025 | STD | 0.018 | ||||||
| Coefficient of variation (COV); % | 2.569 | COV % | 1.778 | ||||||
| Coefficient of determination (R2) | 0.994 | R2 | 0.998 | ||||||
| Group 3 | B0.0 | 3.82 | 3.84 | 1.004 | 5.63 | 5.59 | 0.993 | PP + ST | Equation (3) + Equation (8) |
| H0.5 | 6.51 | 6.47 | 0.993 | 6.58 | 6.71 | 1.019 | |||
| H1.0 | 7.78 | 7.81 | 1.003 | 7.62 | 7.44 | 0.977 | |||
| H2.0 | 6.51 | 6.48 | 0.995 | 7.77 | 7.65 | 0.985 | |||
| Mean | 0.999 | Mean | 0.993 | ||||||
| Standard deviation (STD) | 0.005 | STD | 0.018 | ||||||
| Coefficient of variation (COV); % | 0.519 | COV % | 1.861 | ||||||
| Coefficient of determination (R2) | 1.000 | R2 | 0.986 | ||||||
| Group | Mix | fL (N/mm2) | fR1 (N/mm2) | fR2 (N/mm2) | fR3 (N/mm2) | fR4 (N/mm2) | fR3/fR1 | fR1/fL | Classification According to fib Model Code 2010 | ||
|---|---|---|---|---|---|---|---|---|---|---|---|
| fR1 | fR3/fR1 | Notes | |||||||||
| Reference | B0.0 | 5.63 | 0.00 | 0.00 | 0.00 | 0.00 | ---- | ---- | ---- | ---- | ---- |
| Group 1 | B0.5 | 5.57 | 5.44 | 5.44 | 5.44 | 5.44 | 1.00 | 0.98 | 5 | c | Accepted |
| B1.0 | 5.86 | 5.82 | 5.82 | 5.82 | 5.82 | 1.00 | 0.99 | 5 | c | Accepted | |
| B2.0 | 6.08 | 6.78 | 4.80 | 3.58 | 2.94 | 0.53 | 1.12 | 6 | a | Accepted | |
| Group 2 | S0.5 | 9.34 | 9.22 | 8.64 | 8.06 | 7.42 | 0.88 | 0.99 | 9 | b | Accepted |
| S1.0 | 9.41 | 11.84 | 11.68 | 11.68 | 11.68 | 0.99 | 1.26 | 11 | c | Accepted | |
| S2.0 | 9.54 | 14.46 | 13.98 | 13.44 | 12.80 | 0.93 | 1.52 | 14 | c | Accepted | |
| Group 3 | H0.5 | 6.58 | 6.40 | 6.02 | 5.70 | 5.18 | 0.89 | 0.97 | 6 | b | Accepted |
| H1.0 | 7.36 | 7.42 | 7.04 | 6.50 | 6.08 | 0.88 | 1.01 | 7 | b | Accepted | |
| H2.0 | 7.62 | 7.07 | 7.07 | 7.04 | 7.04 | 1.00 | 0.93 | 7 | c | Accepted | |
| Group | Mix | Tp (N·m) | T3.0 (N·m) | ΔL (mm) | Δp (mm) | DI = Δp/ΔL | Fiber |
|---|---|---|---|---|---|---|---|
| Reference | B0.0 | 0.130 | 0.142 | 0.048 | 0.048 | 1.000 | ---- |
| Group 1 | B0.5 | 0.132 | 50.607 | 0.033 | 0.033 | 1.000 | PP |
| B1.0 | 0.137 | 55.357 | 0.036 | 0.036 | 1.000 | ||
| B2.0 | 10.109 | 41.737 | 0.060 | 0.557 | 9.200 | ||
| Group 2 | S0.5 | 0.430 | 78.094 | 0.065 | 0.065 | 1.000 | ST |
| S1.0 | 14.472 | 105.841 | 0.071 | 0.487 | 6.882 | ||
| S2.0 | 20.939 | 125.341 | 0.074 | 0.553 | 7.459 | ||
| Group 3 | H0.5 | 0.301 | 53.973 | 0.065 | 0.065 | 1.000 | PP + ST |
| H1.0 | 0.348 | 63.174 | 0.065 | 0.065 | 1.000 | ||
| H2.0 | 1.735 | 64.652 | 0.080 | 0.126 | 1.570 |
| Mix | Cost (EGP/m3) * | Relative Cost |
|---|---|---|
| B0.0 | 4500.00 | 1.00 |
| B0.5 | 5121.00 | 1.14 |
| B1.0 | 5729.00 | 1.27 |
| B2.0 | 7047.00 | 1.57 |
| S0.5 | 7172.00 | 1.59 |
| S1.0 | 9843.00 | 2.19 |
| S2.0 | 15,186.00 | 3.37 |
| H0.5 | 6146.00 | 1.37 |
| H1.0 | 7793.00 | 1.73 |
| H2.0 | 11,072.00 | 2.46 |
| Beam | Dimensions (mm) | Reinforcement * | Mu (kN·m) | Mn-HFRC/Mn-RCB0.0 | ||||
|---|---|---|---|---|---|---|---|---|
| Width (b) | Height (h) | Depth (d) | Mn-RC | Mnu-FRC | Mn-HFRC | |||
| B0.0 | 200 | 600 | 550 | 4 T 16 | 168.09 | 0.00 | 168.09 | 1.00 |
| B0.5 | 168.09 | 65.28 | 233.37 | 1.39 | ||||
| B1.0 | 168.09 | 69.89 | 237.98 | 1.42 | ||||
| B2.0 | 168.09 | 43.01 | 211.10 | 1.26 | ||||
| S0.5 | 168.09 | 96.77 | 264.86 | 1.58 | ||||
| S1.0 | 168.09 | 140.16 | 308.25 | 1.83 | ||||
| S2.0 | 168.09 | 161.28 | 329.37 | 1.96 | ||||
| H0.5 | 168.09 | 68.35 | 236.44 | 1.41 | ||||
| H1.0 | 168.09 | 77.95 | 246.04 | 1.46 | ||||
| H2.0 | 168.09 | 84.48 | 252.57 | 1.50 | ||||
| Beam | Dimensions (mm) | Reinforcement (Rft) to Obtain Mn-RCB0. | Cost (EGP/Unit Length of the Beam) | Relative Cost | ||||
|---|---|---|---|---|---|---|---|---|
| b | h | d | Cost of Mix | Cost of Rft | Total Cost | |||
| B0.0 | 200 | 600 | 550 | 4 T 16 | 540.00 | 31.60 | 571.60 | 1.00 |
| B0.5 | 2 T 16 + 1 T 12 | 614.52 | 20.25 | 634.77 | 1.11 | |||
| B1.0 | 2 T 16 + 1 T 10 | 687.48 | 18.89 | 706.37 | 1.24 | |||
| B2.0 | 3 T 16 | 845.64 | 23.70 | 869.34 | 1.52 | |||
| S0.5 | 2 T 16 | 860.64 | 15.80 | 876.44 | 1.53 | |||
| S1.0 | 2 T 12 | 1181.16 | 8.89 | 1190.05 | 2.08 | |||
| S2.0 | 2 T 10 | 1822.32 | 6.17 | 1828.49 | 3.20 | |||
| H0.5 | 2 T 16 + 1 T 10 | 737.52 | 18.89 | 756.41 | 1.32 | |||
| H1.0 | 2 T 16 + 1 T 10 | 935.16 | 18.89 | 954.05 | 1.67 | |||
| H2.0 | 2 T 16 | 1328.64 | 15.80 | 1344.44 | 2.35 | |||
Disclaimer/Publisher’s Note: The statements, opinions and data contained in all publications are solely those of the individual author(s) and contributor(s) and not of MDPI and/or the editor(s). MDPI and/or the editor(s) disclaim responsibility for any injury to people or property resulting from any ideas, methods, instructions or products referred to in the content. |
© 2024 by the authors. Licensee MDPI, Basel, Switzerland. This article is an open access article distributed under the terms and conditions of the Creative Commons Attribution (CC BY) license (https://creativecommons.org/licenses/by/4.0/).
Share and Cite
Yassin, A.M.; Mohie Eldin, M.; Hafez, M.A.; Elnaggar, M.A. The Flexural Behavior and Mechanical Properties of Super High-Performance Concrete (SHPC) Reinforced Using the Hybridization of Micro Polypropylene and Macro Steel Fibers. Buildings 2024, 14, 1887. https://doi.org/10.3390/buildings14071887
Yassin AM, Mohie Eldin M, Hafez MA, Elnaggar MA. The Flexural Behavior and Mechanical Properties of Super High-Performance Concrete (SHPC) Reinforced Using the Hybridization of Micro Polypropylene and Macro Steel Fibers. Buildings. 2024; 14(7):1887. https://doi.org/10.3390/buildings14071887
Chicago/Turabian StyleYassin, Ahmed M., Mohammad Mohie Eldin, Mohamed Ahmed Hafez, and Mohamed A. Elnaggar. 2024. "The Flexural Behavior and Mechanical Properties of Super High-Performance Concrete (SHPC) Reinforced Using the Hybridization of Micro Polypropylene and Macro Steel Fibers" Buildings 14, no. 7: 1887. https://doi.org/10.3390/buildings14071887
APA StyleYassin, A. M., Mohie Eldin, M., Hafez, M. A., & Elnaggar, M. A. (2024). The Flexural Behavior and Mechanical Properties of Super High-Performance Concrete (SHPC) Reinforced Using the Hybridization of Micro Polypropylene and Macro Steel Fibers. Buildings, 14(7), 1887. https://doi.org/10.3390/buildings14071887