
Experimental Study on the Mechanical Properties and Health Monitoring Methods of Joints in AAPF

Abstract
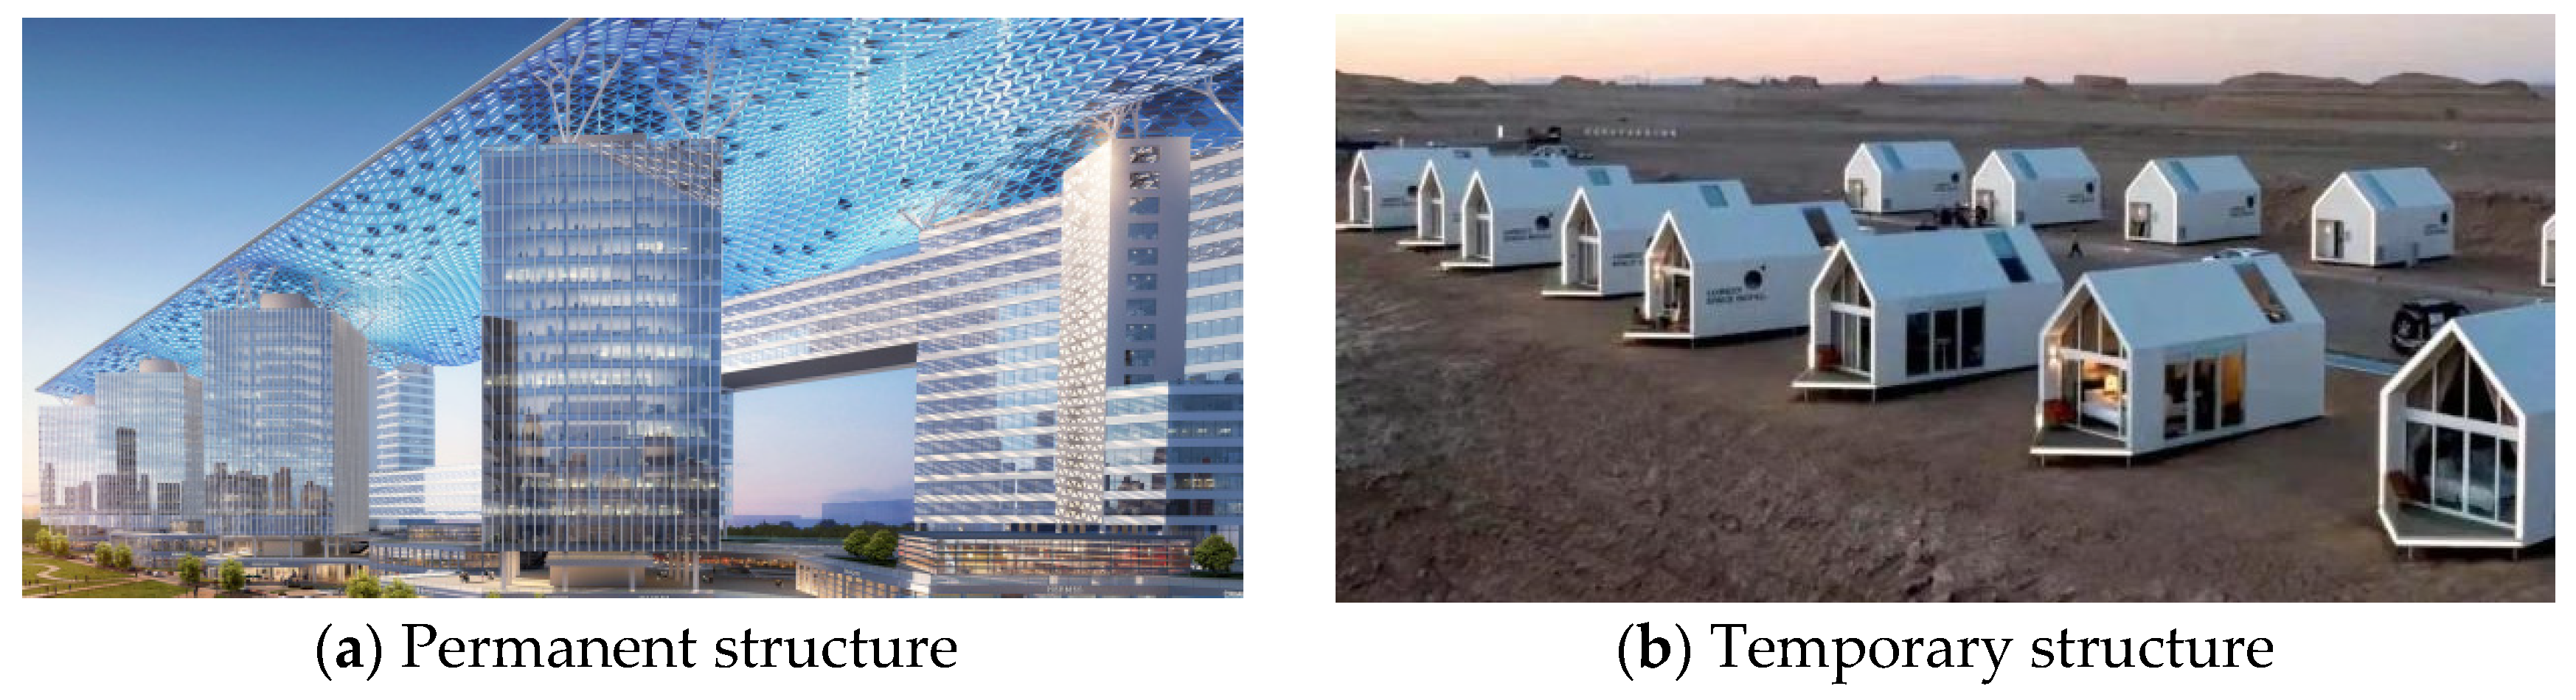
:1. Introduction
2. Test Scheme
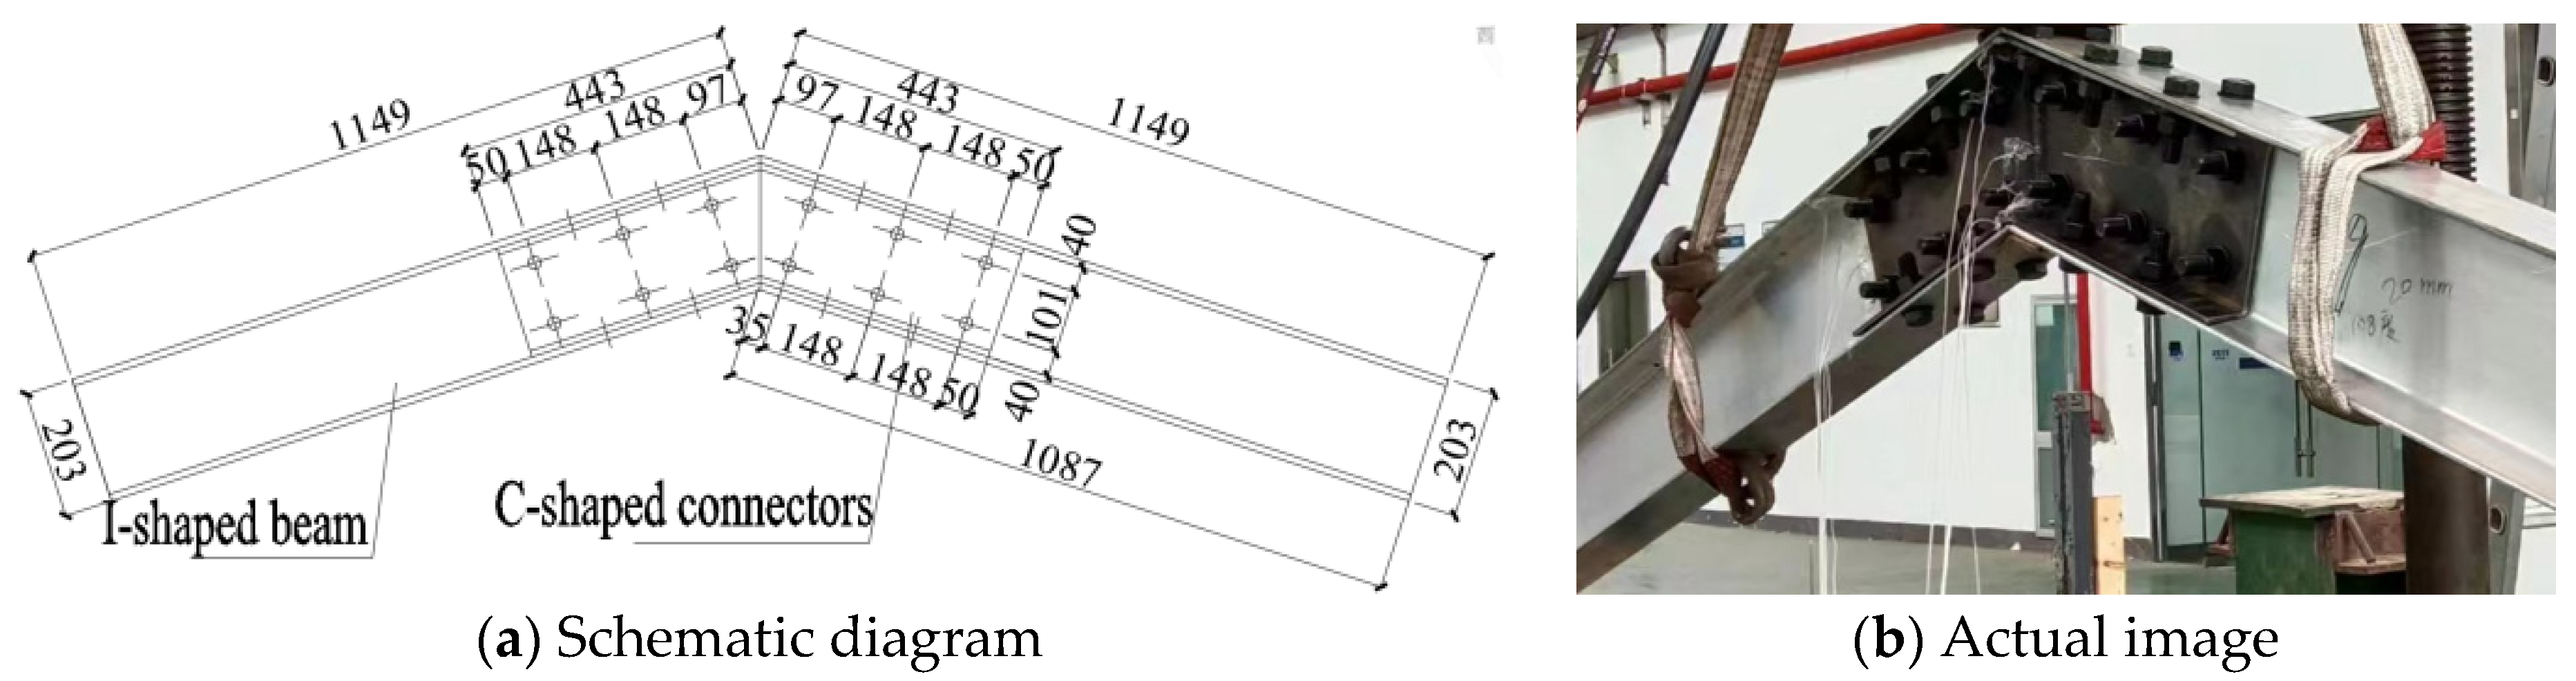
2.1. Specimen Design
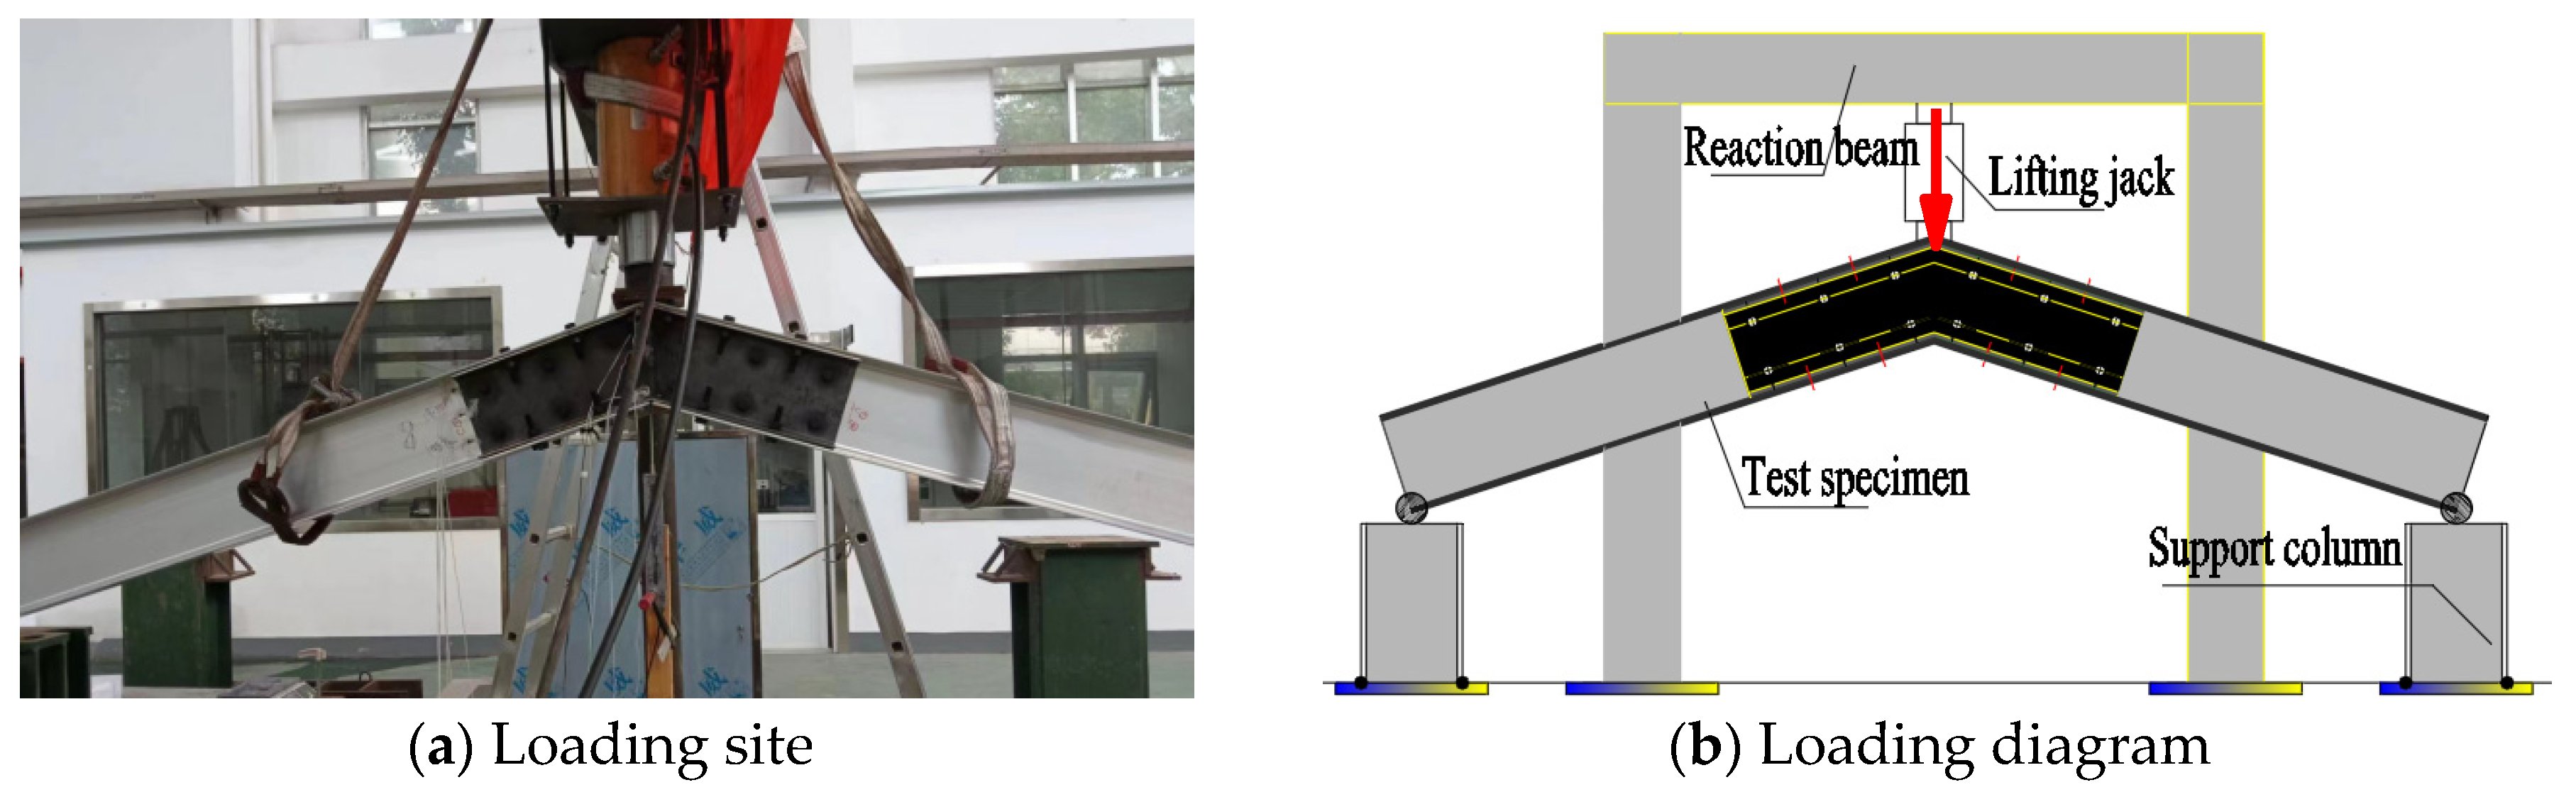
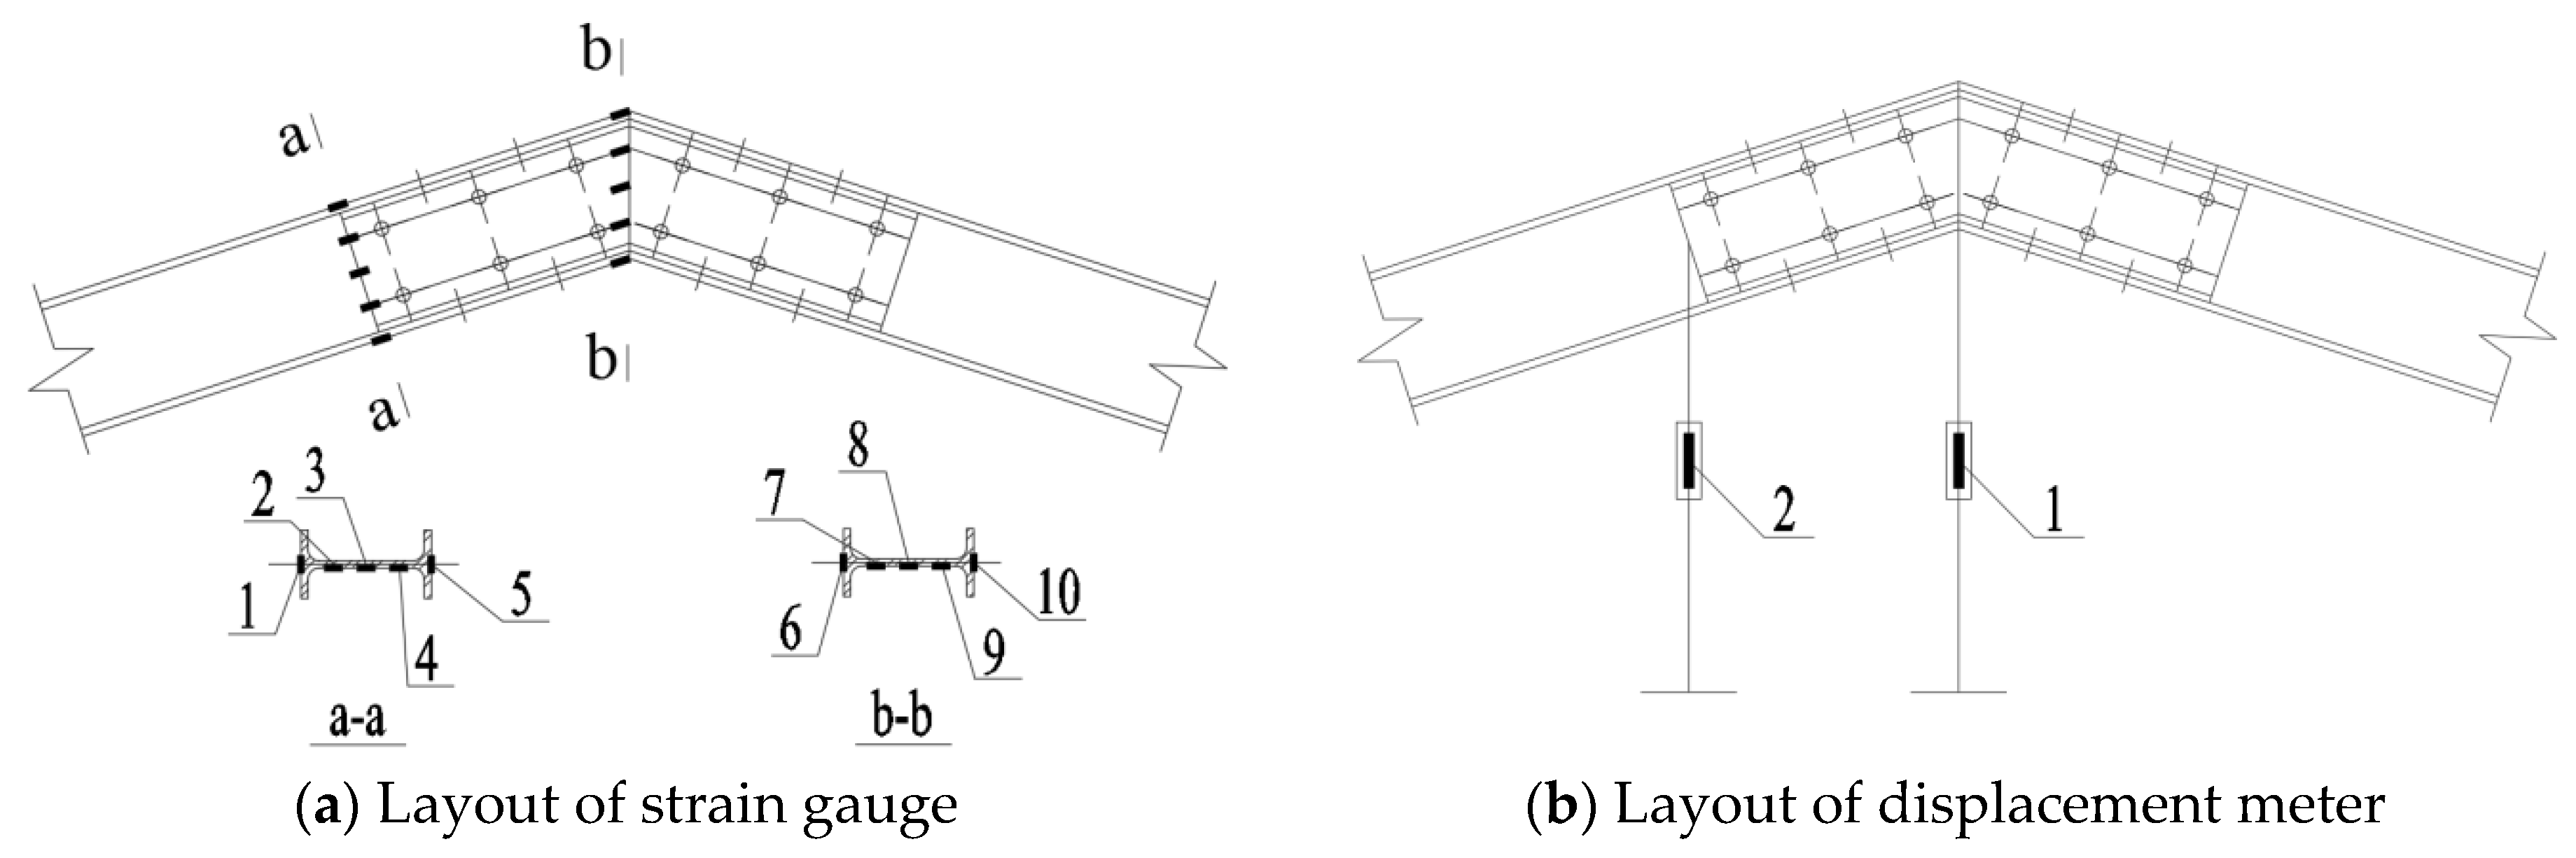
2.2. Testing Plan
2.3. Material Property Test
3. Test Results
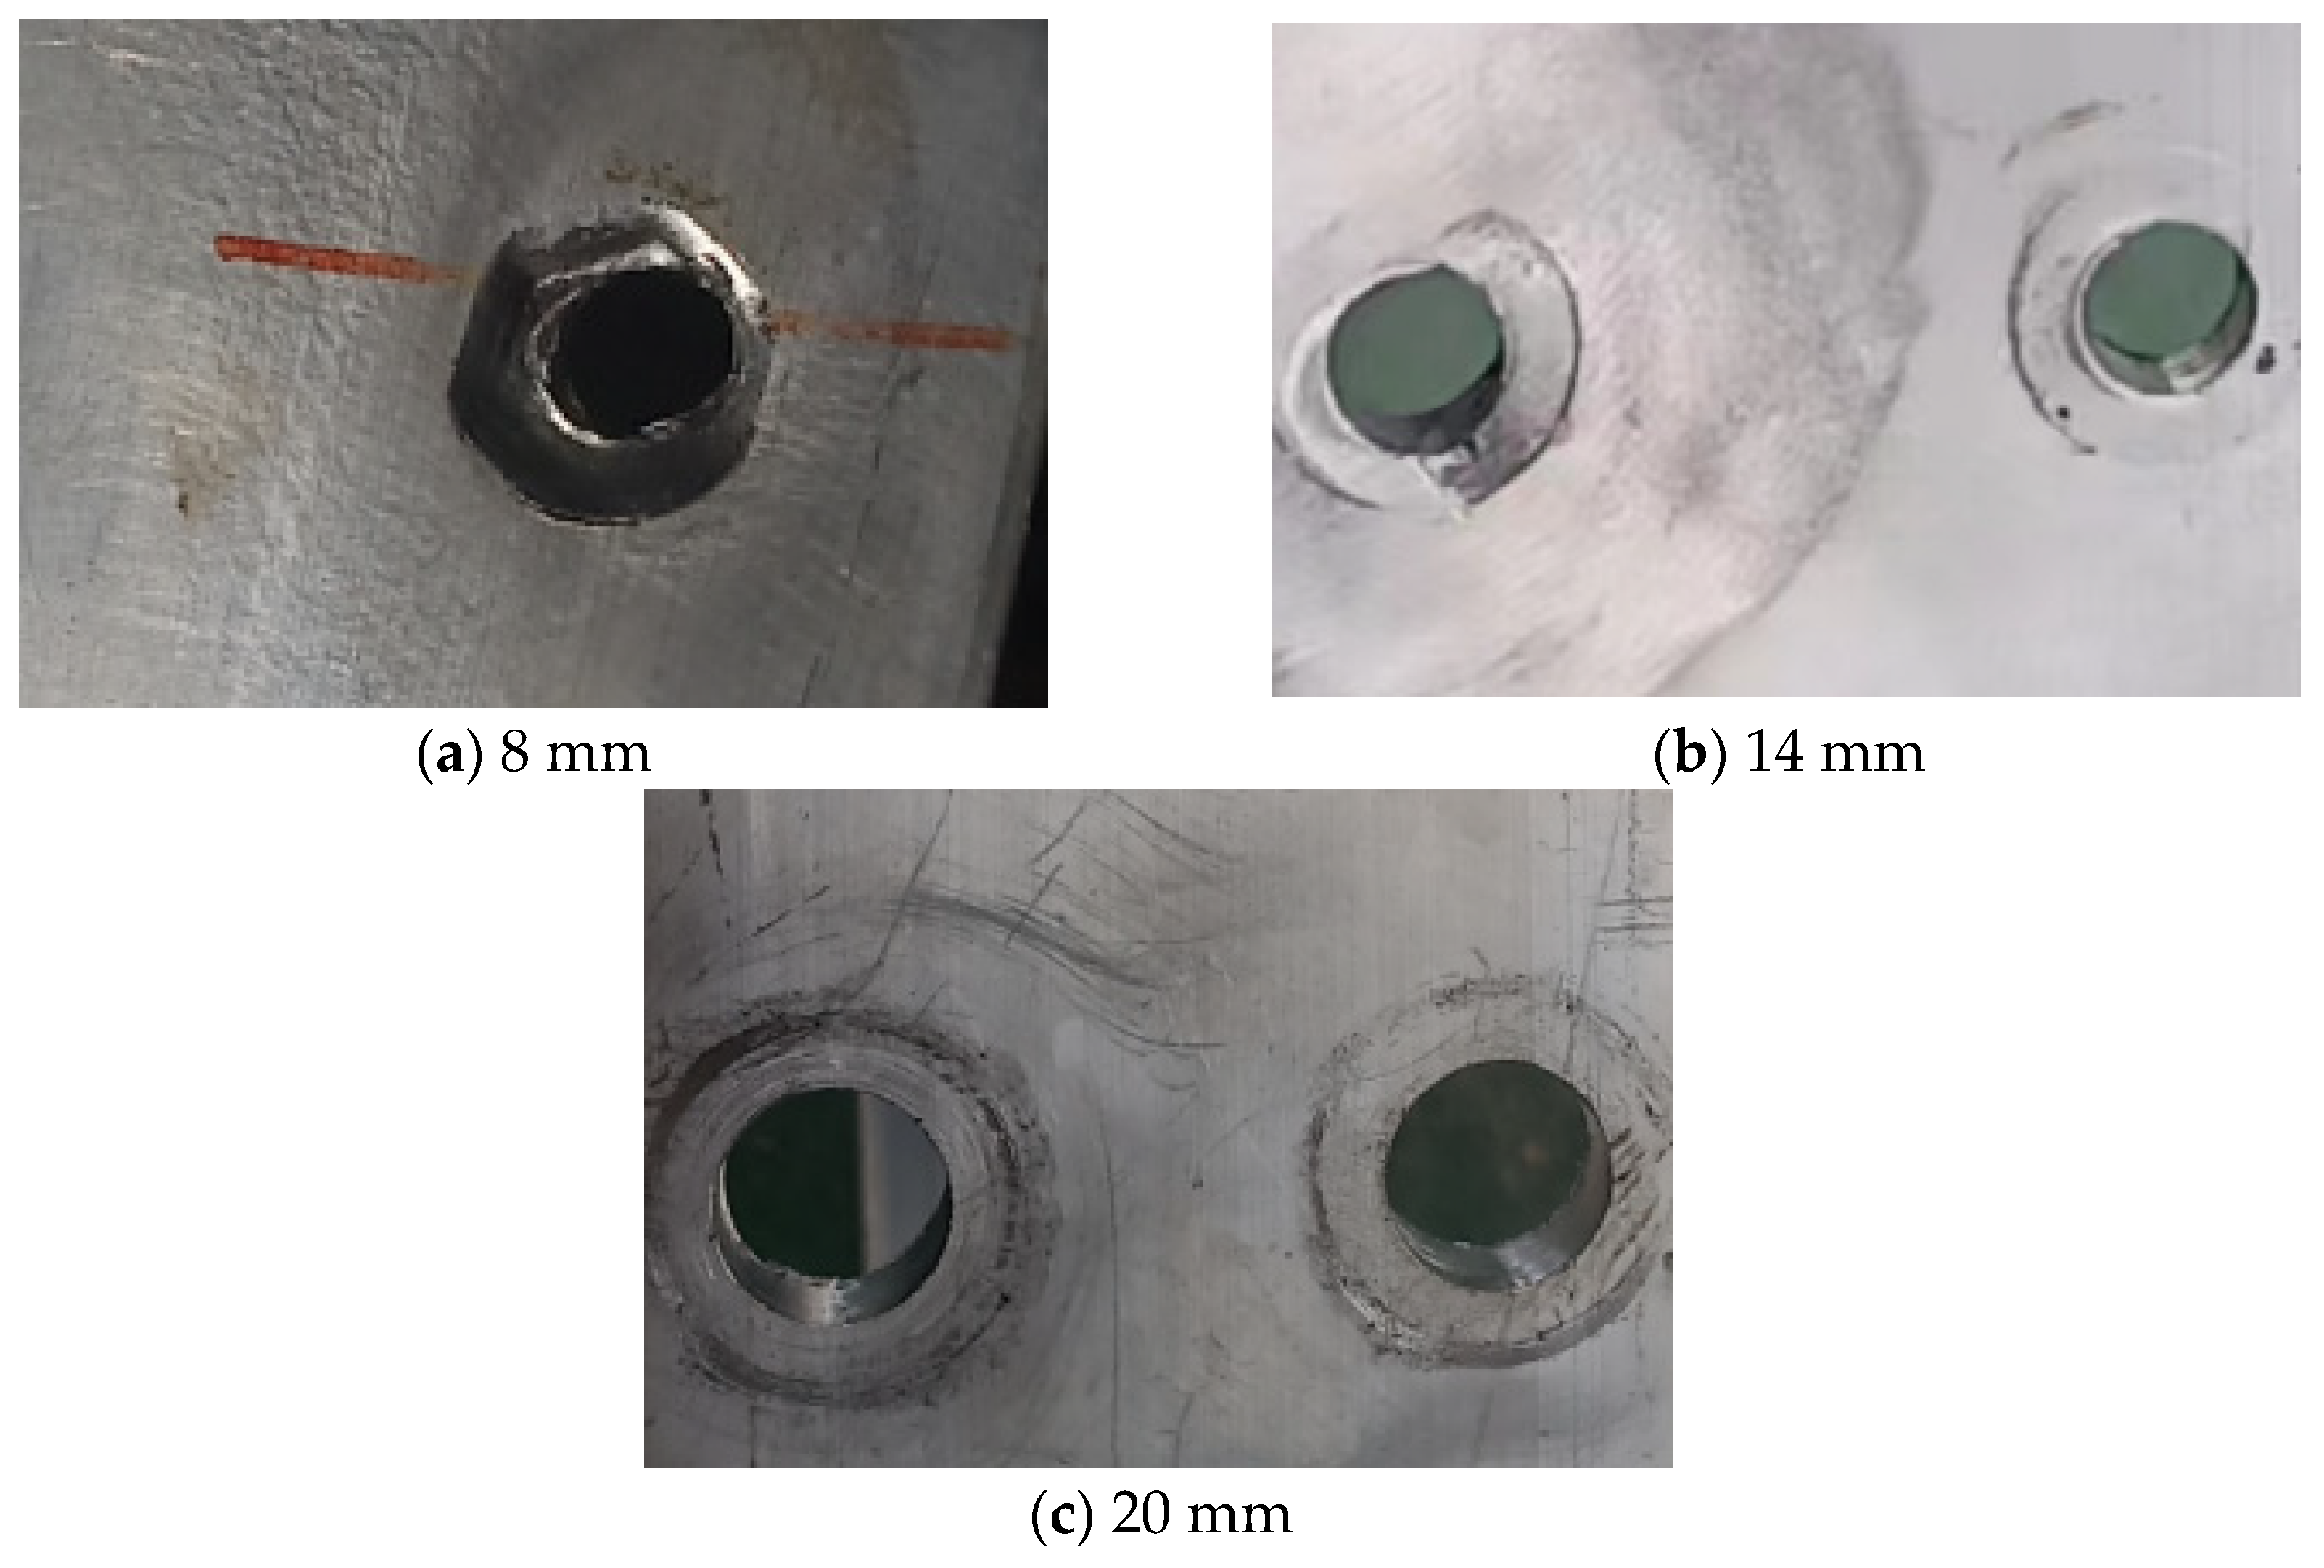
3.1. Analysis of Destructive Patterns
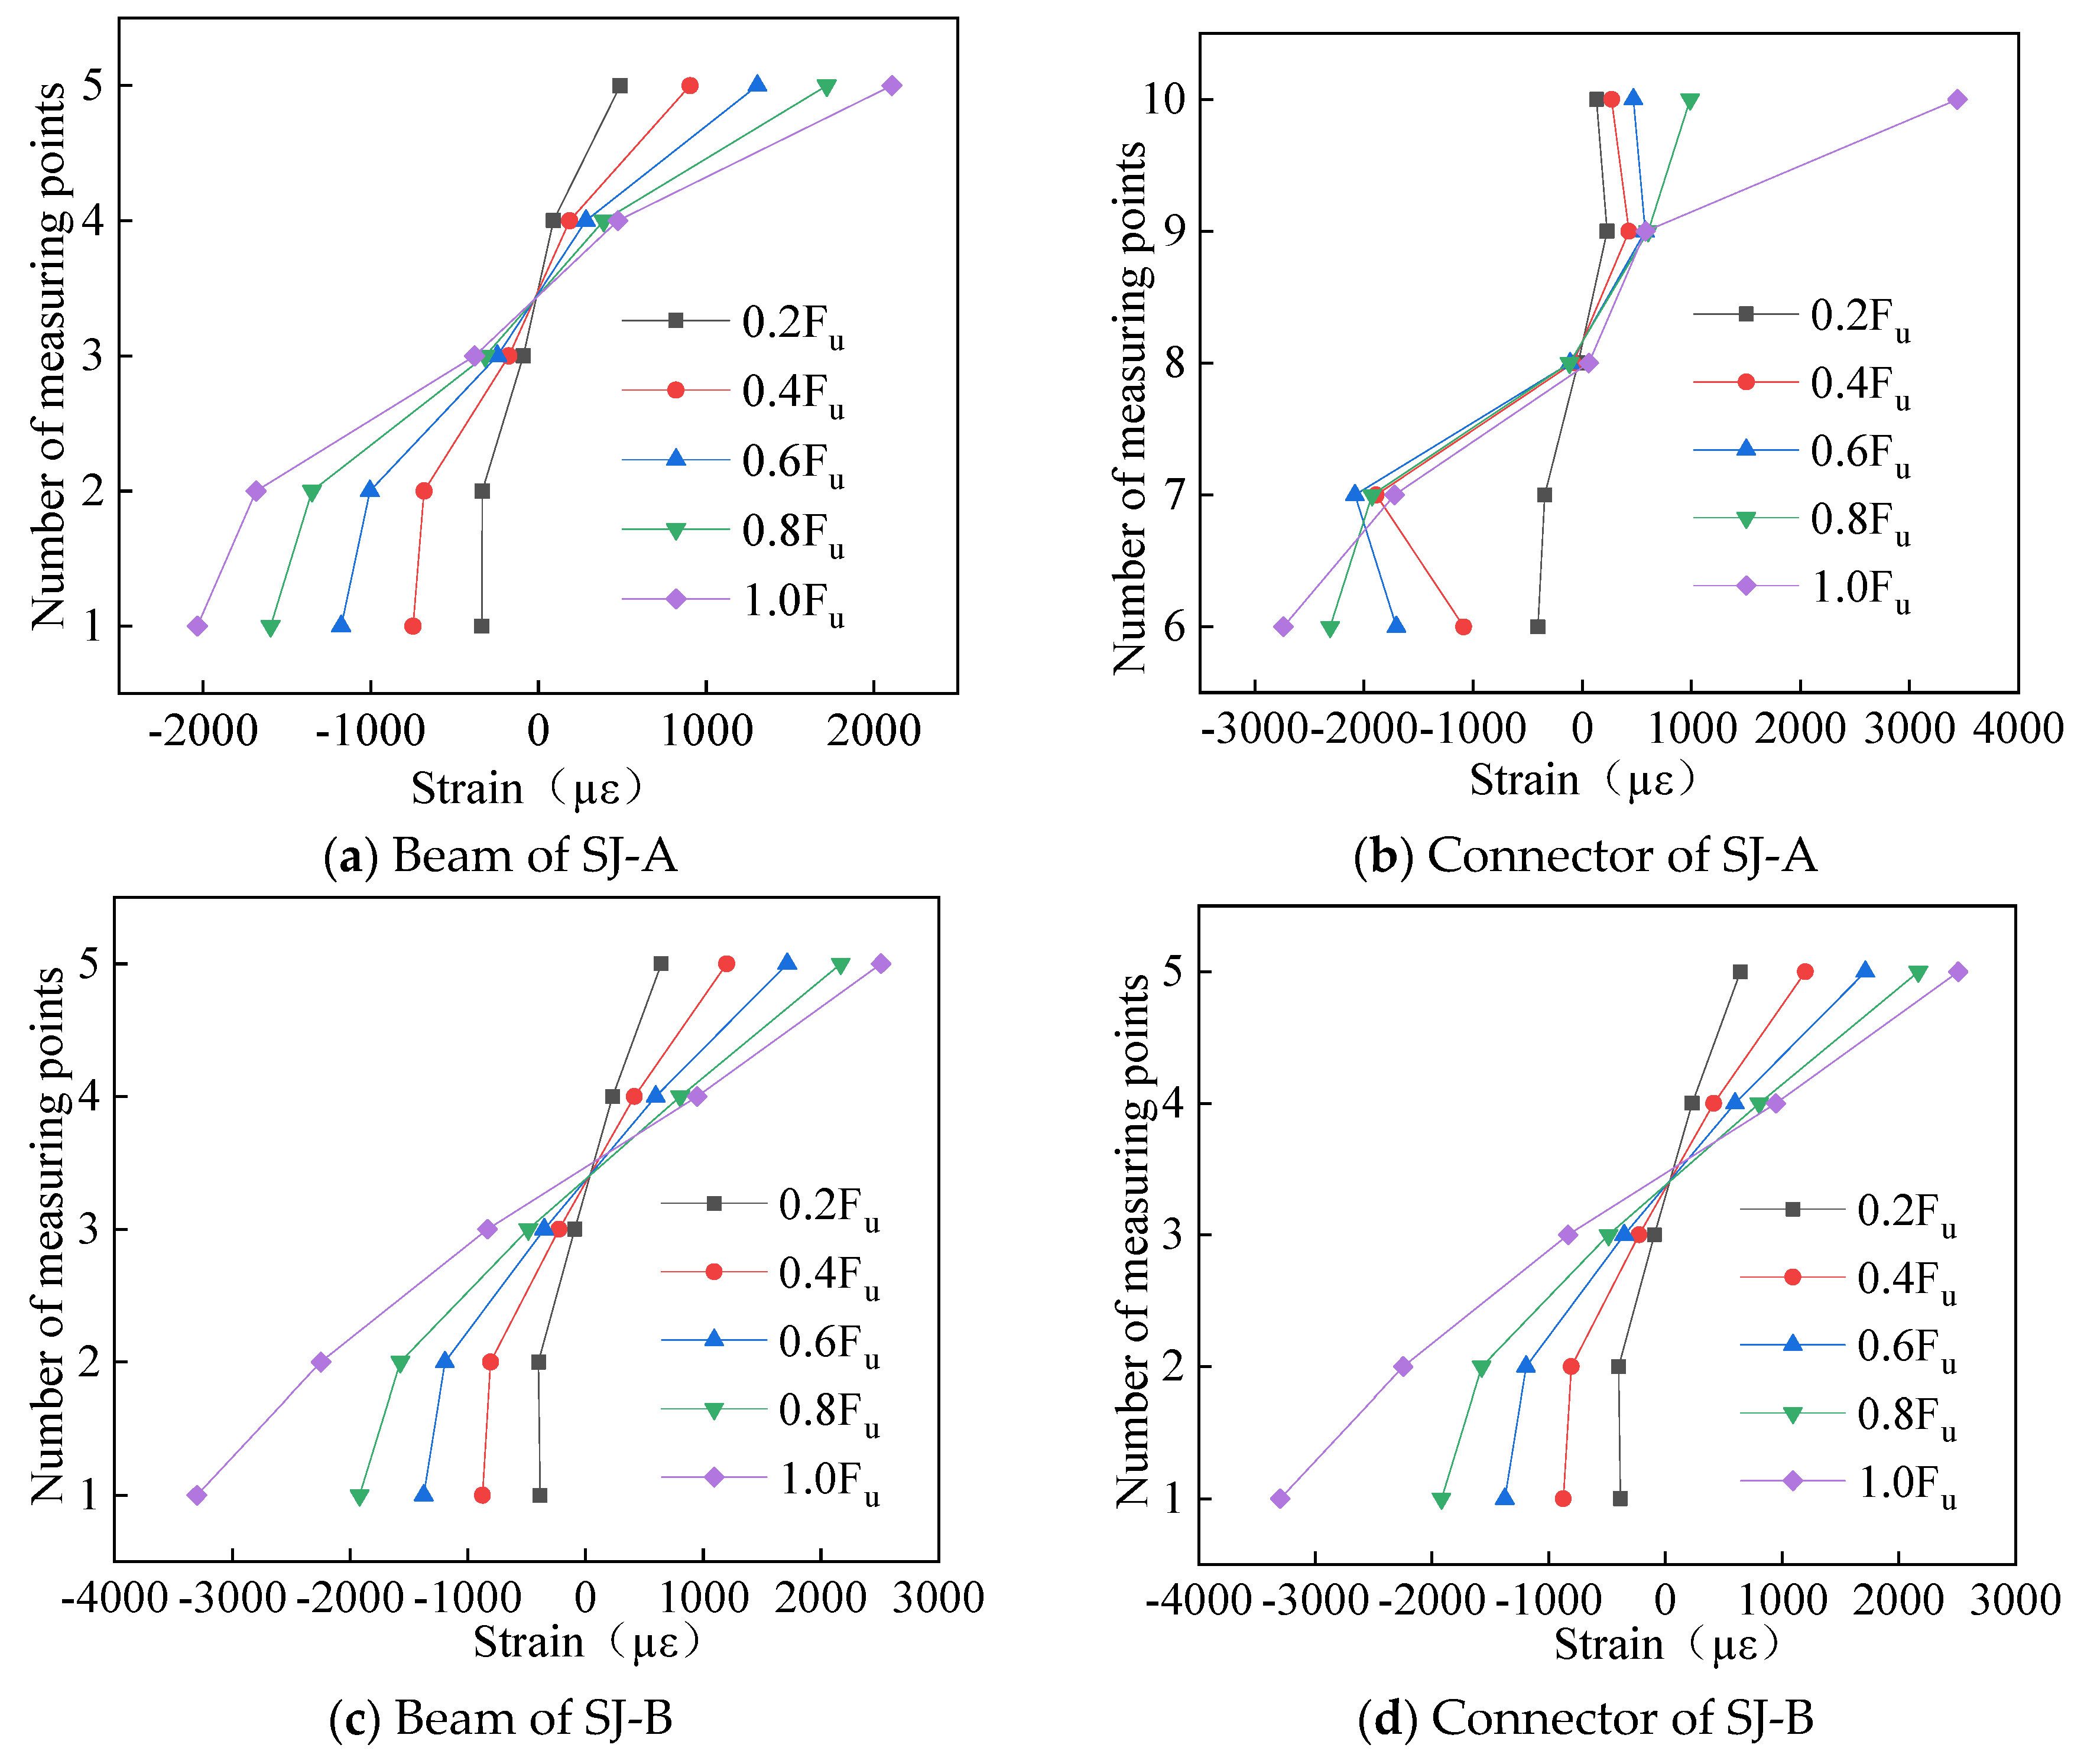
3.2. Distribution of Strain
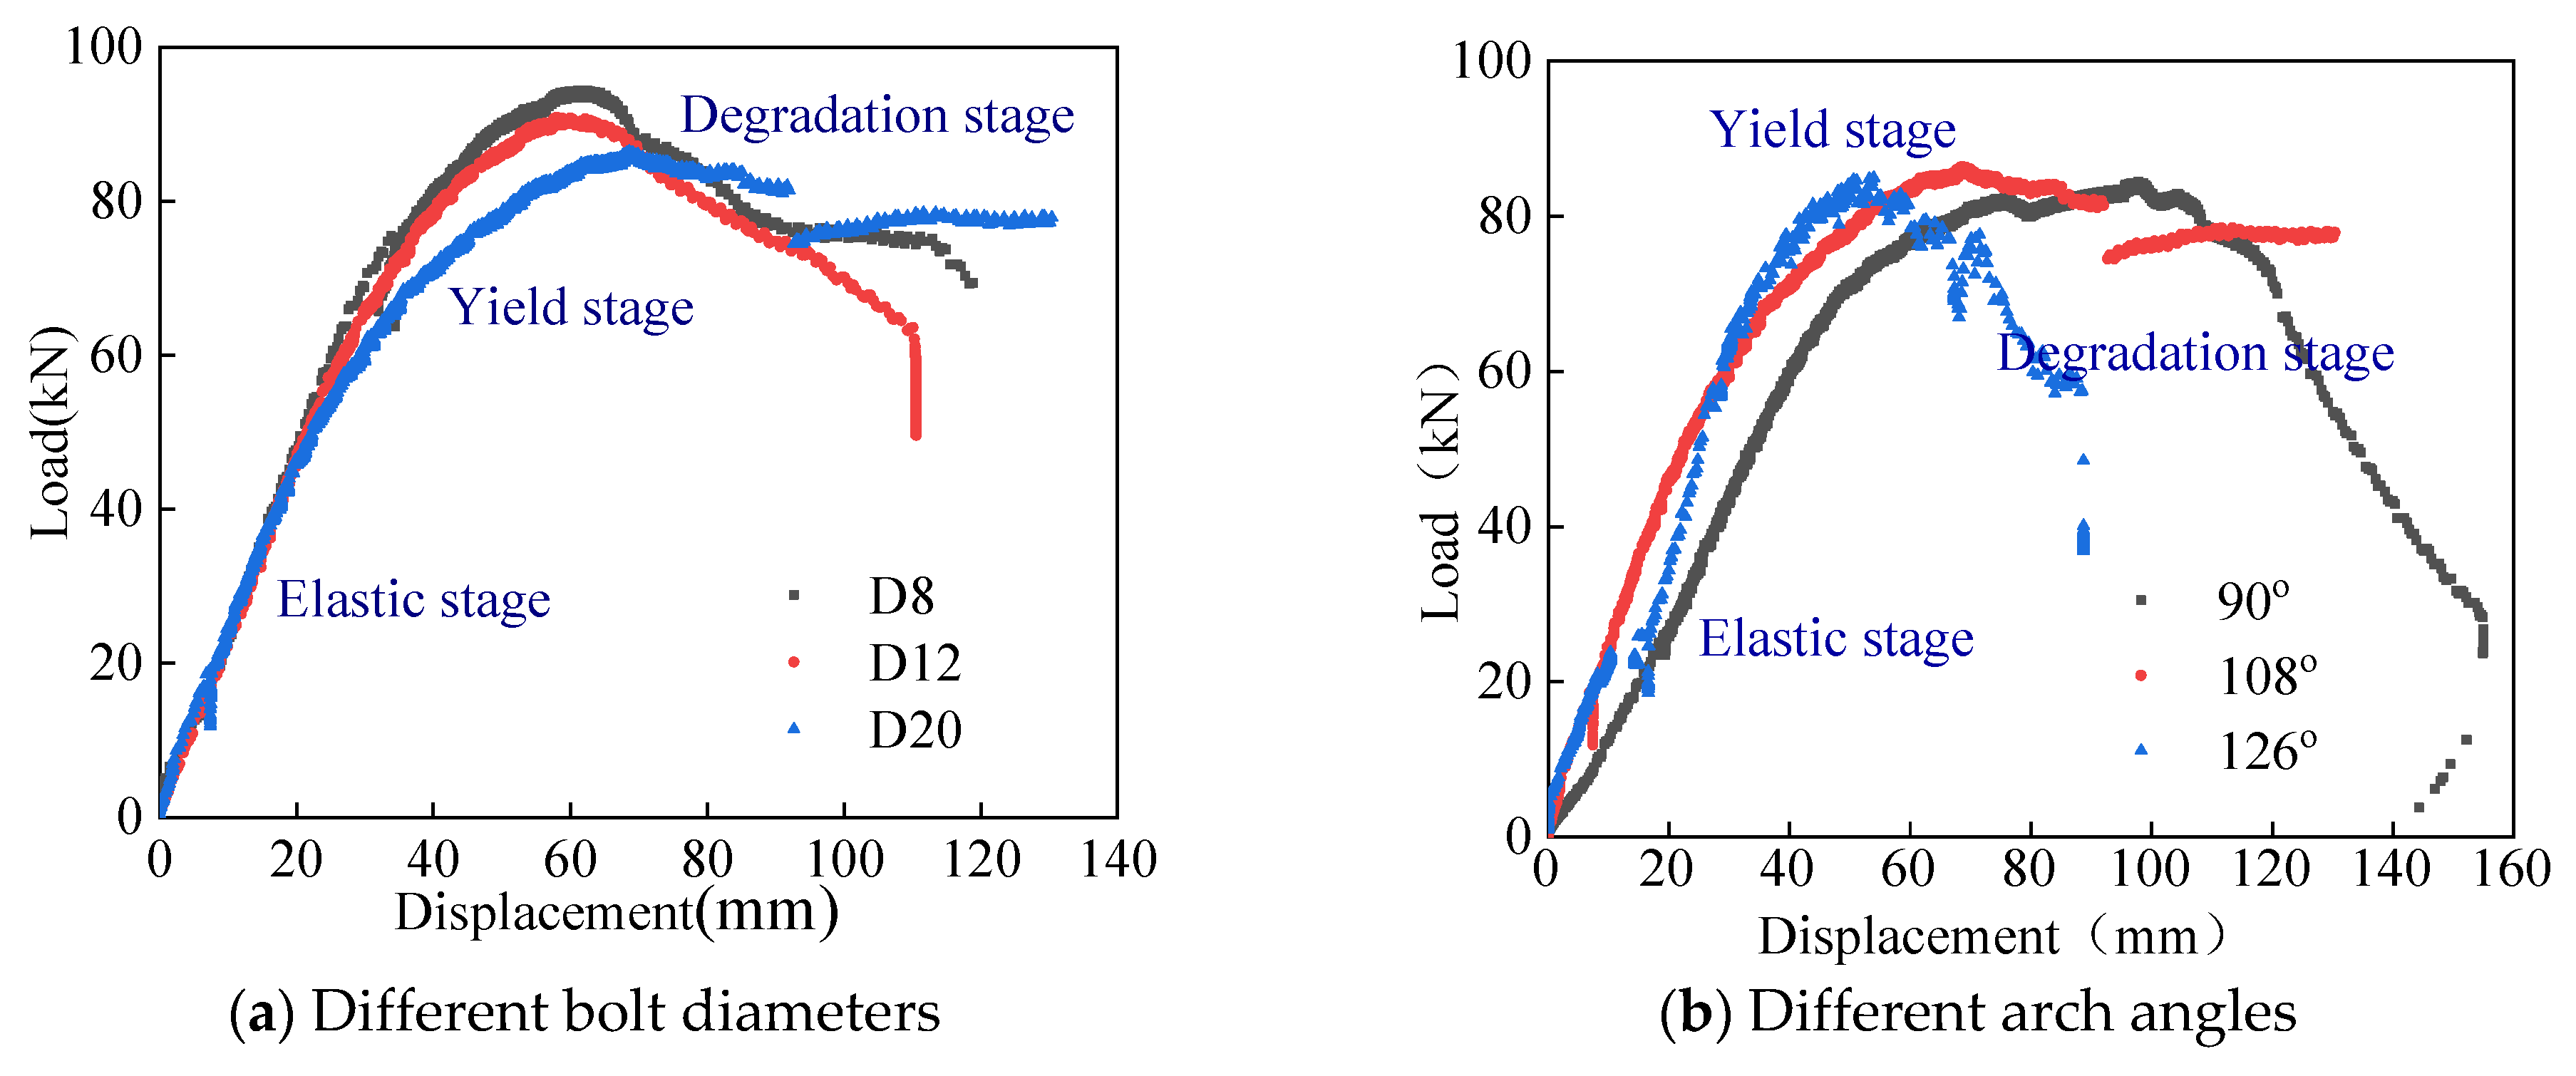
3.3. Load-Deformation Curve
4. Establishing Numerical Models
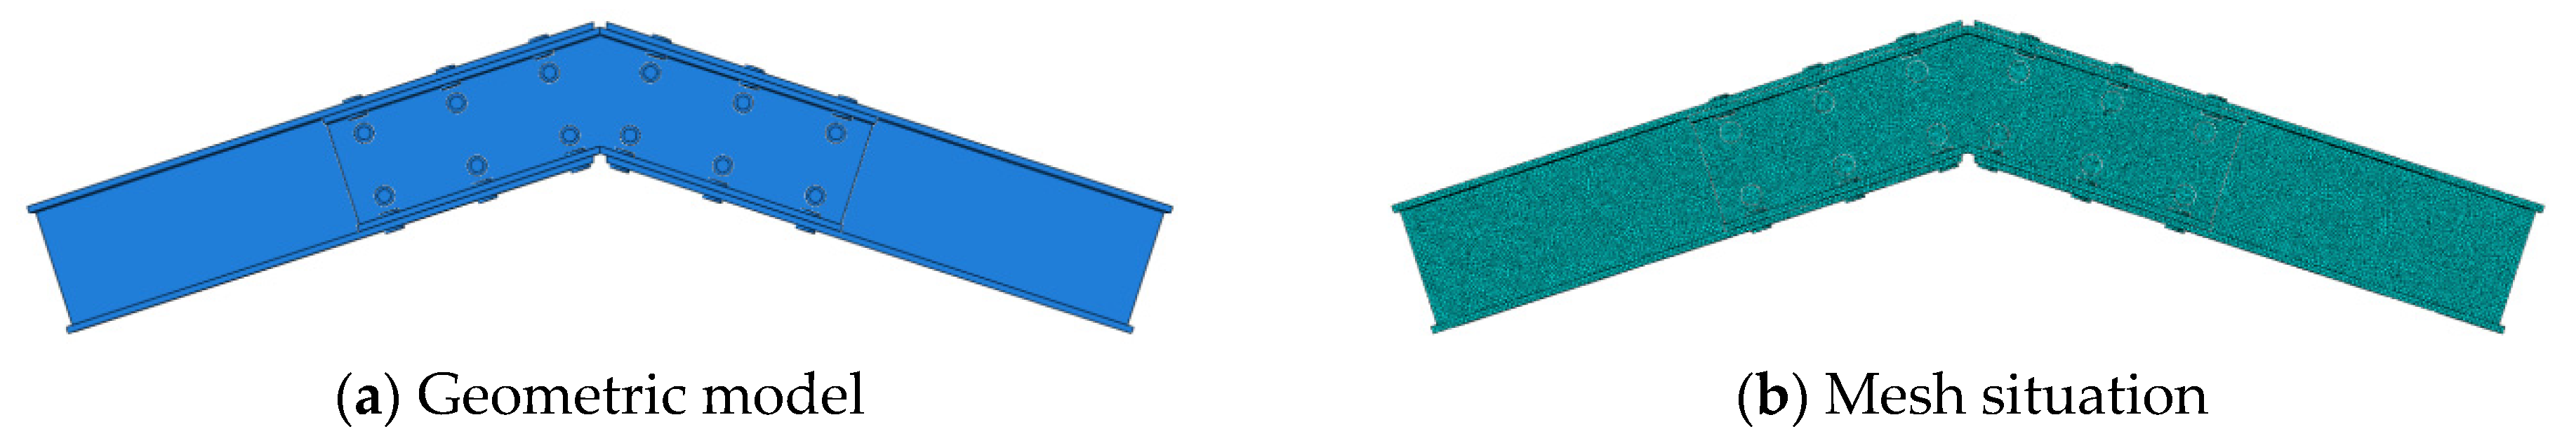
4.1. Information of the Model
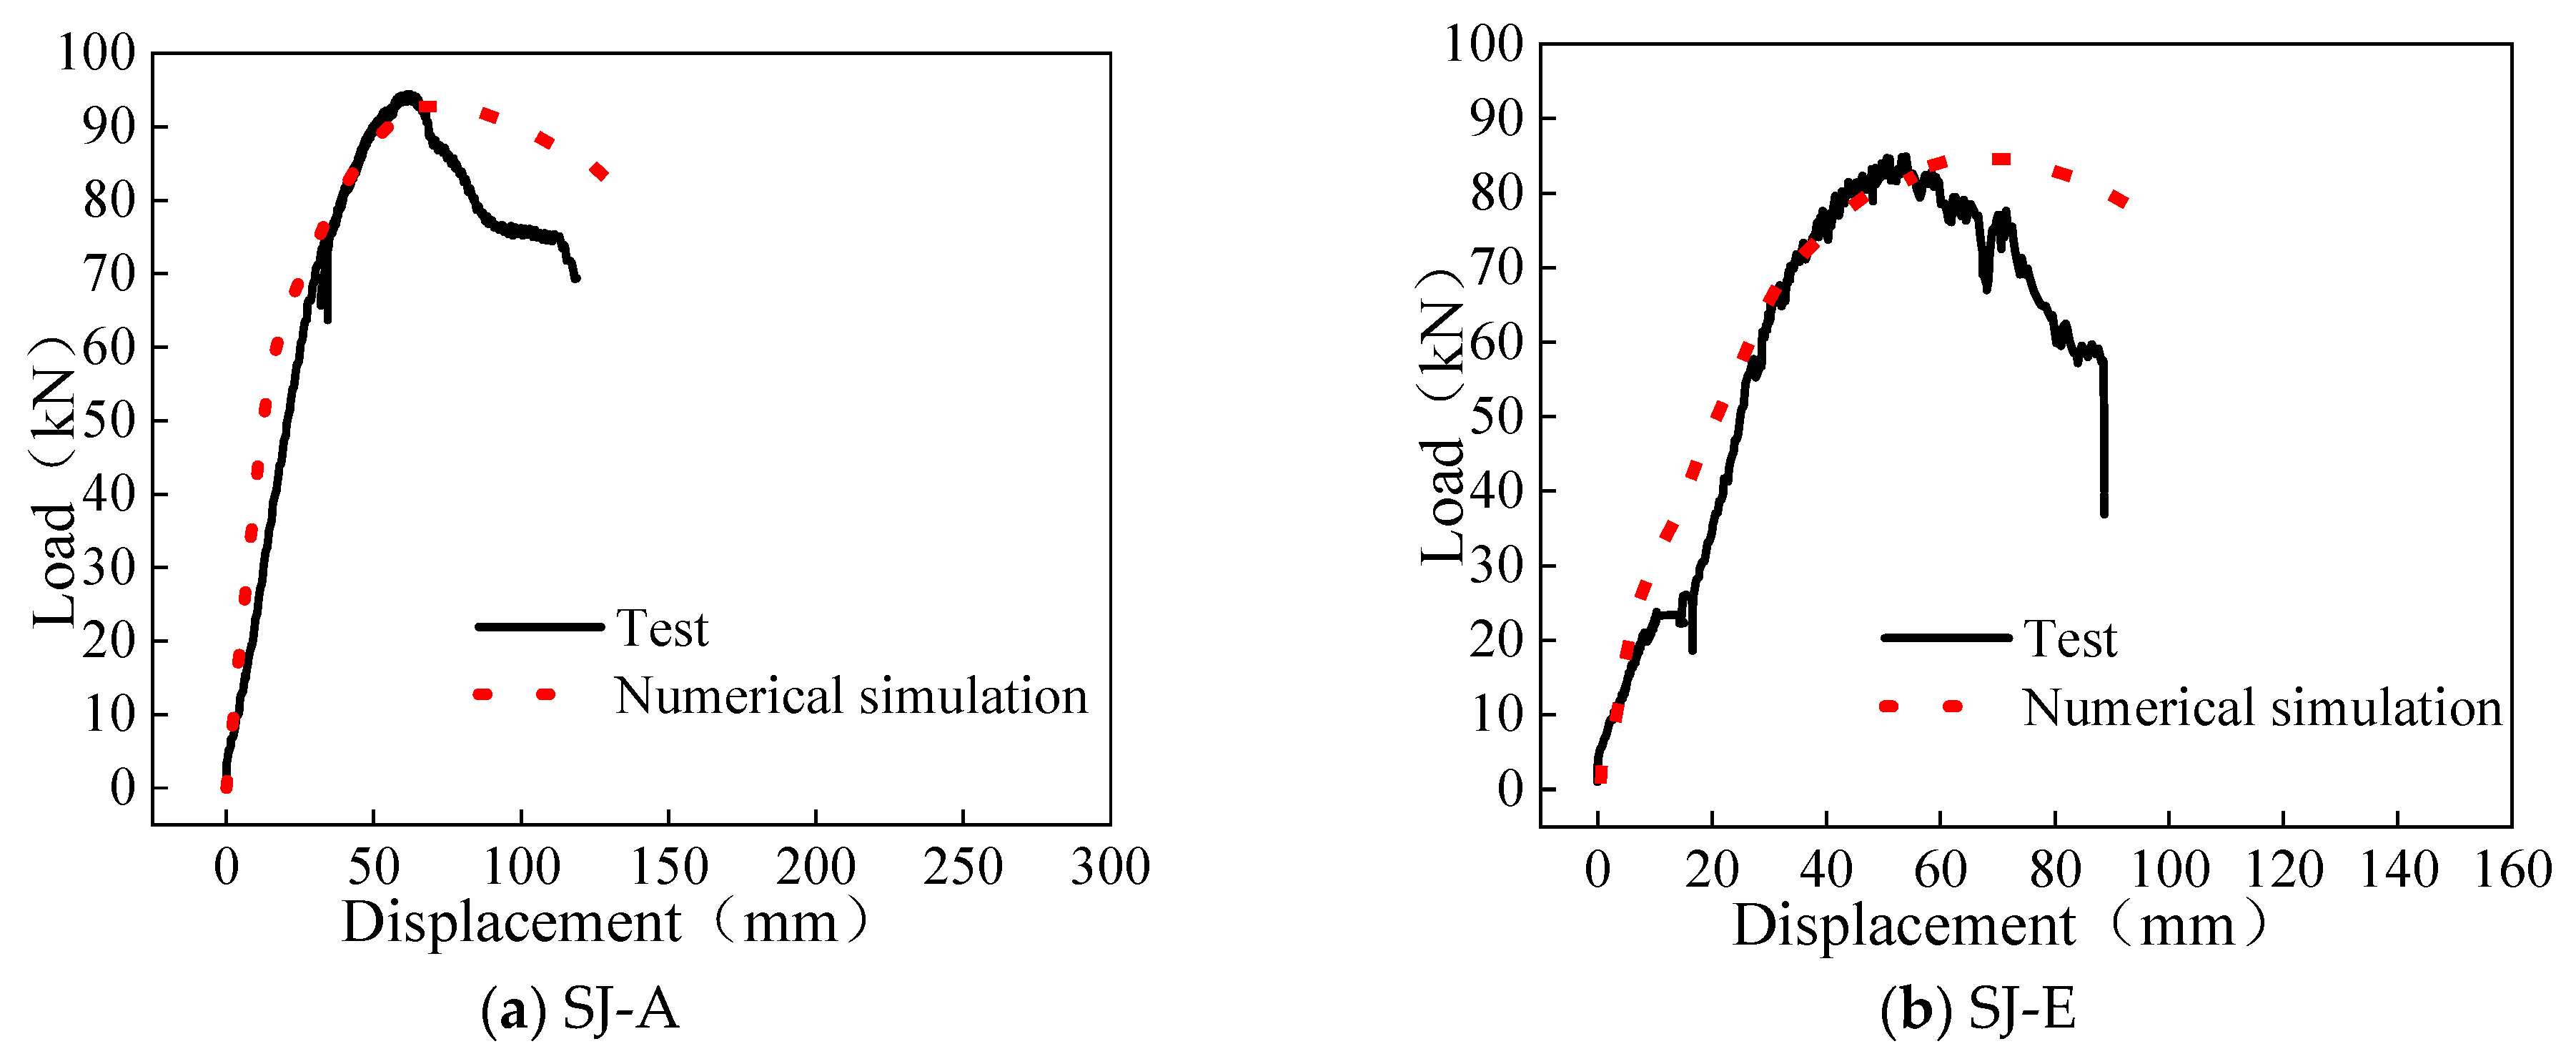
4.2. Model Validation
5. The Influence of the Arch Angle
5.1. Information of Basic Model
5.2. Vertical Load
5.3. Horizontal Load
6. Safety Monitoring of Beam-Beam Joints
6.1. Displacement Monitoring
6.2. Frequency Monitoring
7. Conclusions and Prospects
Author Contributions
Funding
Data Availability Statement
Conflicts of Interest
References
- Liu, Y.; Liu, H.; Chen, Z. Post-fire mechanical properties of aluminum alloy 6082-T6. Constr. Build. Mater. 2019, 196, 256–266. [Google Scholar] [CrossRef]
- Zhu, S.; Guo, X.; Tang, W.; Gao, S. Temperature development of aluminum alloy structural components under fire conditions. J. Build. Eng. 2021, 42, 102836. [Google Scholar] [CrossRef]
- Wang, G.; Zhao, C.Q.; Ma, J. Experimental and numerical study on the bending performance of an aluminium alloy flower-gusset composite joint. Structures 2021, 33, 2475–2486. [Google Scholar]
- Wang, G.; Zhao, C.Q. Experimental and theoretical study on the bearing capacity of FGC joints for single-layer aluminium alloy lattice shell structures. Structures 2021, 33, 2445–2458. [Google Scholar]
- Xiong, Z.; Guo, X.; Luo, Y.; Zhu, S.; Liu, Y. Experimental and numerical studies on single-layer reticulated shells with aluminium alloy gusset joints. Thin-Walled Struct. 2017, 118, 124–136. [Google Scholar] [CrossRef]
- Xiong, Z.; Guo, X.; Luo, Y.; Zhu, S. Elasto-plastic stability of single-layer reticulated shells with aluminium alloy gusset joints. Thin-Walled Struct. 2017, 115, 163–175. [Google Scholar] [CrossRef]
- Liu, H.; Ding, Y.; Chen, Z. Static stability behavior of aluminum alloy single-layer spherical latticed shell structure with Temcor joints. Thin-Walled Struct. 2017, 120, 355–365. [Google Scholar] [CrossRef]
- Feng, R.; Zhu, W.; Wan, H.; Chen, A.; Chen, Y. Tests of perforated aluminium alloy SHSs and RHSs under axial compression. Thin-Walled Struct. 2018, 130, 194–212. [Google Scholar] [CrossRef]
- Feng, R.; Shen, C.; Lin, J. Finite-element analysis and design of aluminium alloy CHSs with circular through-holes in bending. Thin-Walled Struct. 2019, 144, 106289. [Google Scholar] [CrossRef]
- Meulen, O.R.; Soetens, F.; Maljaars, J. Experimental analysis of stability of aluminium beams in case of fire. J. Struct. Fire Eng. 2014, 5, 161–174. [Google Scholar] [CrossRef]
- Suzuki, J.I.; Ohmiya, Y.; Wakamatsu, T.; Harada, K.; Yusa, S.; Kohno, M. Evaluation of fire resistance of aluminum alloy members. Fire Sci. Technol. 2005, 24, 237–255. [Google Scholar] [CrossRef]
- Maljaars, J.; Soetens, F.; Snijder, H.H. Local buckling of aluminium structures exposed to fire: Part 1: Tests. Steel Constr. 2009, 47, 1404–1417. [Google Scholar] [CrossRef]
- Maljaars, J.; Soetens, F.; Snijder, H.H. Local buckling of aluminium structures exposed to fire: Part 2: Finite element models. Thin-Walled Struct. 2009, 47, 1418–1428. [Google Scholar] [CrossRef]
- Liu, H.B.; Gu, A.; Chen, Z.H.; Tan, Z.L.; Zhou, G.G. Mechanical properties and design method of aluminum alloy bolt-sphere Joints. Struct. Eng. Int. 2021, 31, 30–39. [Google Scholar] [CrossRef]
- Liu, H.; Gu, A.; Chen, Z. Tensile properties of aluminum alloy bolt-sphere joints under elevated temperatures. KSCE J. Civ. Eng. 2020, 24, 525–536. [Google Scholar] [CrossRef]
- Shi, G.; Ban, H.; Bai, Y.; Wang, Y.; Luo, C.; Shi, Y. A novel cast aluminum joint for reticulated shell structures: Experimental study and modeling. Adv. Struct. Eng. 2013, 16, 1047–1059. [Google Scholar] [CrossRef]
- Mazzolani, F.M. 3D aluminium structures. Thin-Walled Struct. 2012, 61, 258–266. [Google Scholar] [CrossRef]
- Sentosa, B.O.B.; Bui, Q.B.; Ple, O.; Plassiard, J.P.; Perrotin, P. Assessing Damage to Beam-Column Connections in Reinforced Concrete Structures from Vibrational Measurement Results. Struct. Eng. Int. 2019, 29, 396–403. [Google Scholar] [CrossRef]
- Katkhuda, H.N.; Dwairi, H.M.; Shatarat, N. System identification of steel framed structures with semi-rigid connections. Struct. Eng. Mech. 2010, 34, 351. [Google Scholar] [CrossRef]
- Bui, Q.B.; Mommessin, M.; Perrotin, P.; Plassiard, J.P.; Plé, O. Assessing local-scale damage in reinforced concrete frame structures using dynamic measurements. Eng. Struct. 2014, 79, 22–31. [Google Scholar] [CrossRef]
- Antunes, P.; Lima, H.; Varum, H.; André, P. Optical fiber sensors for static and dynamic health monitoring of civil engineering infrastructures: Abode wall case study. Measurement 2012, 45, 1695–1705. [Google Scholar] [CrossRef]
- Xing, Z.; Wang, G.; Lin, X.; Pang, J.; Zhao, C.; Chen, Q. Study of the Mechanical Properties of Beam-Column Joints in a New Type of AAPF. Buildings 2023, 13, 2698. [Google Scholar] [CrossRef]
- GB/T 50429-2007; Code for Design of Aluminium Structures. General Administration of Quality Supervision, Inspection and Quarantine of the People’s Republic of China: Beijing, China, 2007.
- GB/T 228.1-2010; Metallic Materials-TENSILE Testing—Part 1: Method of Test at Room Temperature. General Administration of Quality Supervision, Inspection and Quarantine of the People’s Republic of China: Beijing, China, 2011.
- Ramberg, W.; Osgood, W.R. Description of Stress-Strain Curves by Three Parameters; NACA TN-902; NACA: Washington, DC, USA, 1943. [Google Scholar]
- Yilmaz, S.; Karahasan, O.S.; Altunisik, A.C.; Vural, N.; Demir, S. A New Type Notched Slab Approach for Timber-Concrete Composite Construction: Experimental and Numerical Investigation. Struct. Eng. Mech. 2022, 81, 737–750. [Google Scholar]
- Yilmaz, Z.; Okur, F.Y.; Günaydin, M.; Altunişik, A.C. Enhanced Modal Participation Ratio-Based Structural Damage Identification: A New Filtering Approach Using Modal Assurance Criteria. Buildings 2023, 13, 2467. [Google Scholar] [CrossRef]
- Sesli, H.; Hüsem, M.; Sunca, F.; Altunışık, A.C.; Okur, F.Y. Experimental Investigation on New Mechanical Systems Effectiveness to Reduce the Coupling Beam Damages. Bull. Earthq. Eng. 2023, 21, 535–582. [Google Scholar] [CrossRef]
- You, R.Z.; Yi, T.H.; Ren, L.; Li, H.N. Distributed bending stiffness estimation of bridges using adaptive inverse unit load method. Eng. Struct. 2023, 297, 116981. [Google Scholar] [CrossRef]
- You, R.Z.; Yi, T.H.; Ren, L.; Li, H.N. Equivalent estimation method for quasi-distributed bridge-deflection measurement using only strain data. Measurement 2023, 221, 113492. [Google Scholar] [CrossRef]


| No. | Diameter of Bolt (mm) | Angle of Arch (°) | Sectional Size of Beam (mm) | Sectional Size of Connector (mm) |
|---|---|---|---|---|
| SJ-A | 8 | 108 | H203 × 106 × 11 × 11 | 2C181 × 47.5 × 5 × 10 |
| SJ-B | 14 | 108 | H203 × 106 × 11 × 11 | 2C181 × 47.5 × 5 × 10 |
| SJ-C | 20 | 108 | H203 × 106 × 11 × 11 | 2C181 × 47.5 × 5 × 10 |
| SJ-D | 20 | 90 | H203 × 106 × 11 × 11 | 2C181 × 47.5 × 5 × 10 |
| SJ-E | 20 | 126 | H203 × 106 × 11 × 11 | 2C181 × 47.5 × 5 × 10 |
| Material | Yield Strength MPa | Tensile Strength MPa | Elastic Modulus GPa |
|---|---|---|---|
| Aluminum alloy | 239 | 264 | 70.5 |
| Steel | 235 | 360 | 206 |
| Bolt | 887 | 992 | 204 |
| Specimen | Source | Deformation (mm) | Load (kN) |
|---|---|---|---|
| SJ-A | Test | 64.4 | 94.1 |
| FEA | 68.2 | 95.4 | |
| SJ-E | Test | 53.9 | 84.9 |
| FEA | 54.4 | 83.2 |
| Specimen | Bolt Diameter (mm) | Arch Angle (°) | Bolt Preload (N·m) | Bolt Clearance (mm) |
|---|---|---|---|---|
| SJ-1 | 20 | 106 | 20 | 0.4 |
| SJ-2 | 20 | 112 | 20 | 0.4 |
| SJ-3 | 20 | 118 | 20 | 0.4 |
| SJ-4 | 20 | 124 | 20 | 0.4 |
| SJ-5 | 20 | 130 | 20 | 0.4 |
| SJ-6 | 20 | 136 | 20 | 0.4 |
| The Angle of Arching | 106° | 112° | 118° | 124° | 130° | 136° |
|---|---|---|---|---|---|---|
| Limit value of vertical displacement | 1/47 | 1/50 | 1/54 | 1/36 | 1/30 | 1/26 |
| Limit value of horizontal displacement | 1/43 | 1/43 | 1/45 | 1/52 | 1/59 | 1/62 |
| The size of the cross-section | 200 × 100 × 10 × 10 | 220 × 110 × 11 × 11 | 240 × 120 × 12 × 12 |
| Limit value of frequency (Hz) | 221 | 243 | 265 |
| The size of the cross-section | 260 × 130 × 14 × 14 | 280 × 140 × 16 × 16 | 300 × 150 × 18 × 18 |
| Limit value of frequency (Hz) | 287 | 309 | 332 |
Disclaimer/Publisher’s Note: The statements, opinions and data contained in all publications are solely those of the individual author(s) and contributor(s) and not of MDPI and/or the editor(s). MDPI and/or the editor(s) disclaim responsibility for any injury to people or property resulting from any ideas, methods, instructions or products referred to in the content. |
© 2024 by the authors. Licensee MDPI, Basel, Switzerland. This article is an open access article distributed under the terms and conditions of the Creative Commons Attribution (CC BY) license (https://creativecommons.org/licenses/by/4.0/).
Share and Cite
Xing, Z.; Wang, G.; Pang, J. Experimental Study on the Mechanical Properties and Health Monitoring Methods of Joints in AAPF. Buildings 2024, 14, 1886. https://doi.org/10.3390/buildings14071886
Xing Z, Wang G, Pang J. Experimental Study on the Mechanical Properties and Health Monitoring Methods of Joints in AAPF. Buildings. 2024; 14(7):1886. https://doi.org/10.3390/buildings14071886
Chicago/Turabian StyleXing, Zhanqing, Gang Wang, and Jing Pang. 2024. "Experimental Study on the Mechanical Properties and Health Monitoring Methods of Joints in AAPF" Buildings 14, no. 7: 1886. https://doi.org/10.3390/buildings14071886