Article

Fast Cable-Force Measurement for Large-Span Cable-Stayed Bridges Based on the Alignment Recognition Method and Smartphone-Captured Video

1
School of Civil Engineering and Architecture, Jiaxing Nanhu University, Jiaxing 314001, China
2
School of Civil Engineering, Suzhou University of Science and Technology, Suzhou 215009, China
3
College of Civil and Architecture Engineering, Zhejiang University, Hangzhou 310058, China
4
Zhejiang Communications Construction Group Co., Ltd., Hangzhou 310051, China
5
Zhejiang Huifeng Construction Engineering Testing Co., Ltd., Jiaxing 314001, China
6
Baoye Group Co., Ltd., Shaoxing 312000, China
*
Author to whom correspondence should be addressed.
Buildings 2024, 14(7), 1941; https://doi.org/10.3390/buildings14071941
Submission received: 10 May 2024 / Revised: 6 June 2024 / Accepted: 25 June 2024 / Published: 26 June 2024
(This article belongs to the Topic IntelliSense and Its Application in Engineering)

Abstract

:
The accurate measurement of cable force plays an important role in the structural form, structural behavior, and safety evaluation of large-span cable-stayed bridges. A fast cable-force estimation method is proposed based on the alignment recognition method and smartphone-captured video. This method can realize real-time, non-contact, and non-destructive force measurements. Videos of bridge cables were collected using a portable smartphone, and an alignment recognition method was employed to obtain the lateral displacement along the cable, followed by numerical differentiation of the lateral displacement of the cable to acquire the acceleration time history. Based on the fundamental dynamic equation of beam elements, a unified explicit formula for cable-force calculation considering service characteristics was established in the frequency method. Finally, the method was applied to the cable-force measurement during the operation and maintenance stage of the Gengcun Dou Bridge. The measured cable forces were compared with the values obtained from the on-site monitoring system. The results show that the proposed method can accurately identify the acceleration time history at different positions of the cable, and the corresponding frequency components are essentially consistent. The average relative deviation of the measured cable forces from the reference method is within 3%. The proposed cable-force measurement method is simple as regards equipment, convenient for operation, and high in efficiency, providing a new method for the measurement of cable forces in large-span cable-stayed bridges, which can offer reliable measured cable-force data for structural analysis during bridge operation and the maintenance stage.

1. Introduction

Cable is one of the main components used in large-span cable-stayed bridges, whose use is becoming increasingly widespread [1]. The force-bearing performance and working state of cable components directly reflect the safety and stability of the structure. It is important to develop an accurate and convenient method for the measurement of cable force for large-span cable-stayed bridges, as efficient cable-force measurement is of great significance for evaluating the service performance of cable components and ensuring the operational safety of structures [2].
Currently, The method of cable-force measurement consists of direct and indirect methods based on measurement principles [3]. The direct method mainly includes the hydraulic jack method, the pressure-gauge measuring method [4], the magnetic flux method [5], and the classical strain method [6,7], among others. The hydraulic jack method converts the hydraulic jack pressure to the cable force, which is primarily used for cable-force measurement during the construction stage. The pressure-gauge measuring method establishes the force balance equation for cable anchors, deducing the cable force by measuring pressure changes [8]. This method has been successfully applied to the Hwamyung Bridge, where pressure sensors were installed on the cross-core anchors to measure cable force [4]. The classical strain method is a straightforward and clear measurement method. Its monitoring principle involves detecting the cable’s strain and then using the cable’s elastic modulus to convert it into the cable force [6]. Fu et al. [9] derived the relationship between surface strain of the stay cable and axial force, achieving large-scale wireless monitoring of cable forces through externally mounted vibrating wire sensors. Kim et al. [10] proposed a technique involving smart optical fibers embedded within cable anchors. However, the encapsulation process for the optical fibers is complex and can affect the load-bearing performance of the anchors. The connection between the sensors and the cable is relatively complicated, introducing a certain degree of installation cost. The magnetic flux technique surmounts the limitations previously associated with strain measurement methods, while concurrently retaining the benefits inherent in standard non-destructive testing (NDT) approaches [11]. The magnetic flux method has achieved relative maturity and enjoys widespread utilization. It incurs considerable monitoring expenses and necessitates intricate on-site calibration procedures. These factors present significant challenges to the deployment of extensive cable-force monitoring systems, particularly in the context of large-span bridges [4]. Indirect methods predominantly utilize the frequency method, which obtains the natural frequency of the cables to compute the cable force. This calculation is premised on the correlation between the cable force and the natural frequency [12,13,14]. The frequency method has been extensively applied in various large-span prestressed bridges. The frequency method has evolved from simplified models to detailed analyses. Scholars have studied the effects of external factors (such as bending stiffness, sag, temperature, and concentrated mass) on the measurement of cable force with different ratios of effective cable length and diameter [15,16]. However, issues such as complex signal processing and susceptibility to environmental interference persist. The aforementioned traditional methods all require the installation of different types of sensors to measure the mechanical properties of the cables. The installation of sensors is complicated, restricted in terms of placement, and significantly disruptive to building operations, making it difficult to achieve full-coverage testing of the prestressed cable system.
The first step of the frequency method to achieve the cable-force estimation is to obtain the natural frequency of the cable [17,18]. To overcome the aforementioned issues, cable-force measurement methods based on smart devices, such as smartphones, machine vision, laser sensors, and microwave radars, have garnered widespread attention among researchers [19]. Weng et al. [20] utilized microwave radar sensing technology to develop a fully automatic non-contact method for identifying cable forces capable of recognizing the forces of multiple cables simultaneously. Zhao et al. [21] utilized the accelerometer in smartphones to capture the dynamic response of the cable and developed the Orion CC 1.0 software for on-site cable-force measurements. Ye et al. [22] combined the empirical mode-decomposition method and wavelet decomposition to eliminate the effects of smartphone movement and environmental interferences on the estimated acceleration, which improved the measurement accuracy of the frequency method. To further improve the sampling frequency and accuracy of cable-force measurements, digital image correlation (DIC) technology has been employed to capture multi-point images of the cables [23,24]. Most methods for sensing cable vibrations using computer vision employ target-based or feature-based approaches to obtain the acceleration time history of one point on the cable and identify its frequency [25]. Chien et al. [26] employed digital image tracking technology to measure the lateral vibrations of stay cables, notably without the use of artificial targets. They utilized the midpoint of the cable’s edge line as a pseudo-target for image processing, enabling them to acquire the time history of lateral displacement and its corresponding frequency. Chu et al. [27] designed a static tensile experiment, which was used for verifying a vision-based non-contact cable-force monitoring system. In practical engineering applications, the operational complexity of bridges often results in cables being subject to noisy environments. This ambient noise can adversely affect the precision of lateral deformation measurements obtained through machine vision techniques. To address the challenges associated with ground-based measurements, Tian et al. [28] utilized drone-mounted cameras to record the dynamic behavior of stay cables. and extracted vibrational characteristics through image recognition and frequency analysis. Li et al. [29] implemented a method to extract the video background from footage captured by aerial vehicles. This method combines the k-means and line-segment-detector algorithms, thereby enhancing the efficiency and precision of cable-force measurement techniques based on digital images. All of the above-mentioned measurement methods require either a target on the cable or a feature point at the measurement point. In addition, depending on the shape of the target, additional algorithms may be required to interpret the image. Measuring the cable force may be difficult if no feature points can be found on the cable.
Extensive scholarly research on cable-force measurement has produced applicable and cost-effective results. However, it has predominantly focused on the frequency method without addressing its intrinsic limitations. The main contribution of this paper includes developing a novel cable-force measurement method based on the smartphone-captured video and addressing the limitation of installing sensors for cable measurement. To advance beyond the limitations of conventional cable-force measurement methods, we proposed a cable-force measurement method with simple equipment and convenient operation based on the image recognition of the geometric shape of the cable. This approach is distinguished by its straightforwardness and user-friendly operation. It entails capturing the cable’s video with a portable camera to efficiently extract the lateral acceleration. Furthermore, the method incorporates considerations for bending stiffness, support conditions, and concentrated mass, drawing upon the fundamental dynamic equation for a beam element. A theoretical formula has been developed, reflecting the correlation between cable tension and frequency while accounting for operational characteristics. The measurement accuracy and stability of this method have been investigated through field tests conducted on the Gengcun Dou Bridge.
The remainder of this paper is organized as follows. Section 2 describes the basic principle of the proposed cable-force measurement method. Section 3 presents the description of the Gengcun Dou Bridge and its structural monitoring system. Section 4 investigates the effectiveness and accuracy of the proposed method via practical engineering. Finally, the conclusions of this work are drawn in Section 5.

2. Basic Principle of Cable-Force Measurement

2.1. Dynamic Response Evaluation Using Alignment Recognition Method

A dynamic-displacement measurement method for the cable is proposed, based on the alignment recognition method, as shown in Figure 1. D and A denote the deformation and acceleration, respectively. The calculated acceleration is used for identifying the modal parameters of the cable and subsequently calculating the cable force using the frequency method. The cable images captured by portable image-acquisition equipment are color images containing many interfering pieces of information. Initially, it is essential to remove any interference and identify the region of interest (ROI). The selected color images must then be converted to grayscale to acquire their grayscale histograms [30]. Given that the measurement of cable dynamic displacement typically necessitates only a brief segment of straight cable, the images are consequently cropped to include this specific section. To enhance the accuracy of the cable dynamic-displacement image recognition, the captured cable images should meet the following three conditions [31]:
  • The cable segment in all images is assumed to be straight, that is, sag is not considered.
  • In the monochrome images, the cable has a similar grayscale intensity along the axial direction, and there is usually a sufficient intensity difference between the cable and the image background.
  • In the images, the part of the cable to be studied should traverse from the left side to the right side.
Based on the above three main conditions, the proposed method can be divided into two parts: selecting the target in the cable preliminarily, and identifying the contouring of the cable.
For an 8-bit image, the grayscale ranges from 0 to 255, with 255 representing white and 0 representing black. The edges of the cable image in the ROI can be determined by vertical searches on both sides, followed by a search along the axial direction of the cable to locate its central line. This method preliminarily identifies the central line of the target to be measured. During the search process, the pixel size of the search window should be smaller than the pixel size of the cable diameter, to ensure accurate identification. At the same time, the threshold of grayscale values is typically set as the average between that of the background image and the object to be measured. When the condition shown in Equation (1) is satisfied, the detected subset can be considered as one of the target linear objects.
{ g t < G e t g l < G e l
where gt and gl denote the maximum grayscale of the subset search in the x direction and y direction; and Get and Gel denote the threshold of the subset search in the x direction and y direction.
The first part of the algorithm establishes the cable’s central line, representing each point with integer pixel values throughout the computational process. Employing subpixel detection techniques enhances the precision of the dynamic response calculations. This research concentrates on detecting the contours of the target, particularly by processing the edges within the cable image. These edges are crucial in delineating the target’s appearance and shape, marking the boundaries between regions. The primary technique used in this paper is grayscale-image edge detection. By determining the segmentation threshold based on the average grayscale between the target cable and background, the grayscale image is segmented into a binary image. Binary images are advantageous for obtaining more accurate line shapes. There are various methods for grayscale-image edge detection, among which the Canny edge-detection method is one of the most successful and widely used [32]. This method derives from the notion that the first derivative of the Gaussian function is the best approximation for the optimal edge-detection operator [33]. Therefore, the image is smoothed using a two-dimensional Gaussian function:
G a ( y 1 , y 2 ) = 1 2 π σ 2 exp ( y 1 2 + y 2 2 2 σ 2 )
where σ denotes the empirical parameter in the Gaussian function, which controls the degree of image smoothing. Subsequently, the gradient magnitude and gradient direction of each point in the smoothed image I are calculated. Specifically, the gradient magnitude and gradient direction of point (i, j) are obtained as follows:
G ( i , j ) = G x 2 ( i , j ) + G y 2 ( i , j )
θ ( i , j ) = arctan ( G x ( i , j ) G y ( i , j ) )
where Gx and Gy denote the partial derivative in the x and y direction, which can be calculated as follows:
{ G x ( i , j ) = ( I ( i , j + 1 ) I ( i , j ) + I ( i + 1 , j + 1 ) I ( i + 1 , j ) ) / 2 G y ( i , j ) = ( I ( i , j ) I ( i + 1 , j ) + I ( i , j + 1 ) I ( i + 1 , j + 1 ) ) / 2
In the gradient magnitude image G, interpolation is conducted within a 3 × 3 neighborhood centered on the point (i, j) along the gradient direction θ(i, j). If the gradient magnitude G(i, j) at the point (i, j) is greater than the interpolations of the two neighboring points along the direction θ(i, j), then the point (i, j) is marked as a candidate edge point. Otherwise, it is marked as a non-edge point. Finally, the dual-threshold method is utilized to detect and connect the final edges from the candidate edge points. The dynamic lateral-deformation time histories of the ROI in the cable are obtained by the above method. The acceleration is measured at the same frequency as the video frame rate. The video frame rate of smartphones commonly ranges from 30 Hz to 60 Hz, which satisfies the measuring requirement of the cable force. Subsequently, the lateral acceleration of the cable can be calculated using the central finite-difference approximation method:
{ a ( t k ) = [ u ( t k + 1 ) 2 u ( t k ) + u ( t k 1 ) ] Δ t 2 Δ t = 1 / f v
where a denotes the lateral acceleration of the stay cable; u denotes the lateral deformation of the stay cable; and fv denotes the frame rate of the video. Upon obtaining the comprehensive acceleration time history of the stay cable, modal identification methods may be employed to estimate the natural frequencies of the cable [34,35,36]. The estimated natural frequencies serve as inputs for the frequency method to calculate the actual cable force.

2.2. Cable-Force Estimation Based on the Frequency Test Method

Theoretical derivations for the relationship between cable force and natural frequency were performed considering the effects of bending stiffness, boundary conditions, and concentrated mass on the dynamic performance of stay cables. It is assumed that the cable mass is uniformly distributed along the axial direction. The material is in the elastic stage, and the effects of rotational moment inertia, shear deformation, and sag are neglected. Treating the cable segment as a beam element capable of resisting bending, the dynamic equation is established. Figure 2 shows the schematic of cable vibration considering flexural rigidity, and the dynamic vibration equation of the cable element can be expressed as [37]:
m 2 y 2 t + E I 4 y x 4 T 2 y x 2 = 0
where E, I, and m denote the elastic modulus, inertia moment, and mass of unit length; T denotes the axial force of the stay cable to be measured.
The differential equation shown in Equation (7) is solved with the general solution
Q ( x ) = C 1 e β 1 x + C 2 e β 1 x + C 3 cos ( β 2 x ) + C 4 sin ( β 2 x )
where C1, C2, C3, and C4 are coefficients to be determined and are related to the boundary conditions of the stay cable. Usually, the stay cables are assumed to be hinged at both ends in large-span cable-stayed bridges. Therefore, the transverse displacements and bending moments at points A and B are assumed to be both zero:
Q ( 0 ) = Q ( l 0 ) = Q ( 0 ) = Q ( l 0 ) = 0
Combining Equations (8) and (9), we can obtain an equation group:
( 1 1 1 0 e β 1 l e β t cos ( β 2 l ) sin ( β 2 l ) β 1 2 β 1 2 β 2 2 0 β 1 2 e β l β 1 2 e β 1 l β 2 2 cos ( β 2 l ) β 2 2 sin ( β 2 l ) ) ( C 1 C 2 C 3 C 4 ) = 0
The equation for the relationship between cable force and the nth natural frequency can be obtained as shown in Equation (11):
T = 4 m l 2 f n 2 n 2 ξ ( E I l 2 )
where fn denotes the nth natural frequency of the cable, ξ is the discount factor considering the boundary conditions of the cable, and ξ = π2 when the cable is in ideal hinged-support condition. The boundary condition of the cable in practical engineering is complex. When the boundary conditions of the cable do not satisfy the assumption of the ideal hinged-support condition, the condition of the existence of a non-zero solution of Equation (7) is transcendental to the equations that cannot be solved directly. Equation (11) should be corrected when using the frequency method to measure the cable force. A determined coefficient has been added for correcting Equation (11):
T = ζ ( 4 m l 2 f n 2 n 2 ) ξ ( E I l 2 )
where ζ and ξ are undetermined coefficients concerning the boundary conditions and bending stiffness, respectively. These parameters can be determined based on the cable force and natural frequency from the cable-testing tests under the corresponding boundary conditions. In summary, the collation of Equations (11) and (12) lead to the following unified presumption formula for the cable force:
T s = μ 1 m l 2 f n 2 n 2 + μ 2 E I l 2
where μ1 and μ2 are characteristic parameters of the stay cable under test, respectively. Researchers have conducted static tensile tests on cables to study the above-mentioned parameters. The main factors affecting the values of characteristic parameters are the ratio of cable length and diameter ψ and boundary conditions [38]. When ψ is greater than 150, the influence of cable bending stiffness can be neglected. The values of the cable characteristic parameters are listed in Table 1.

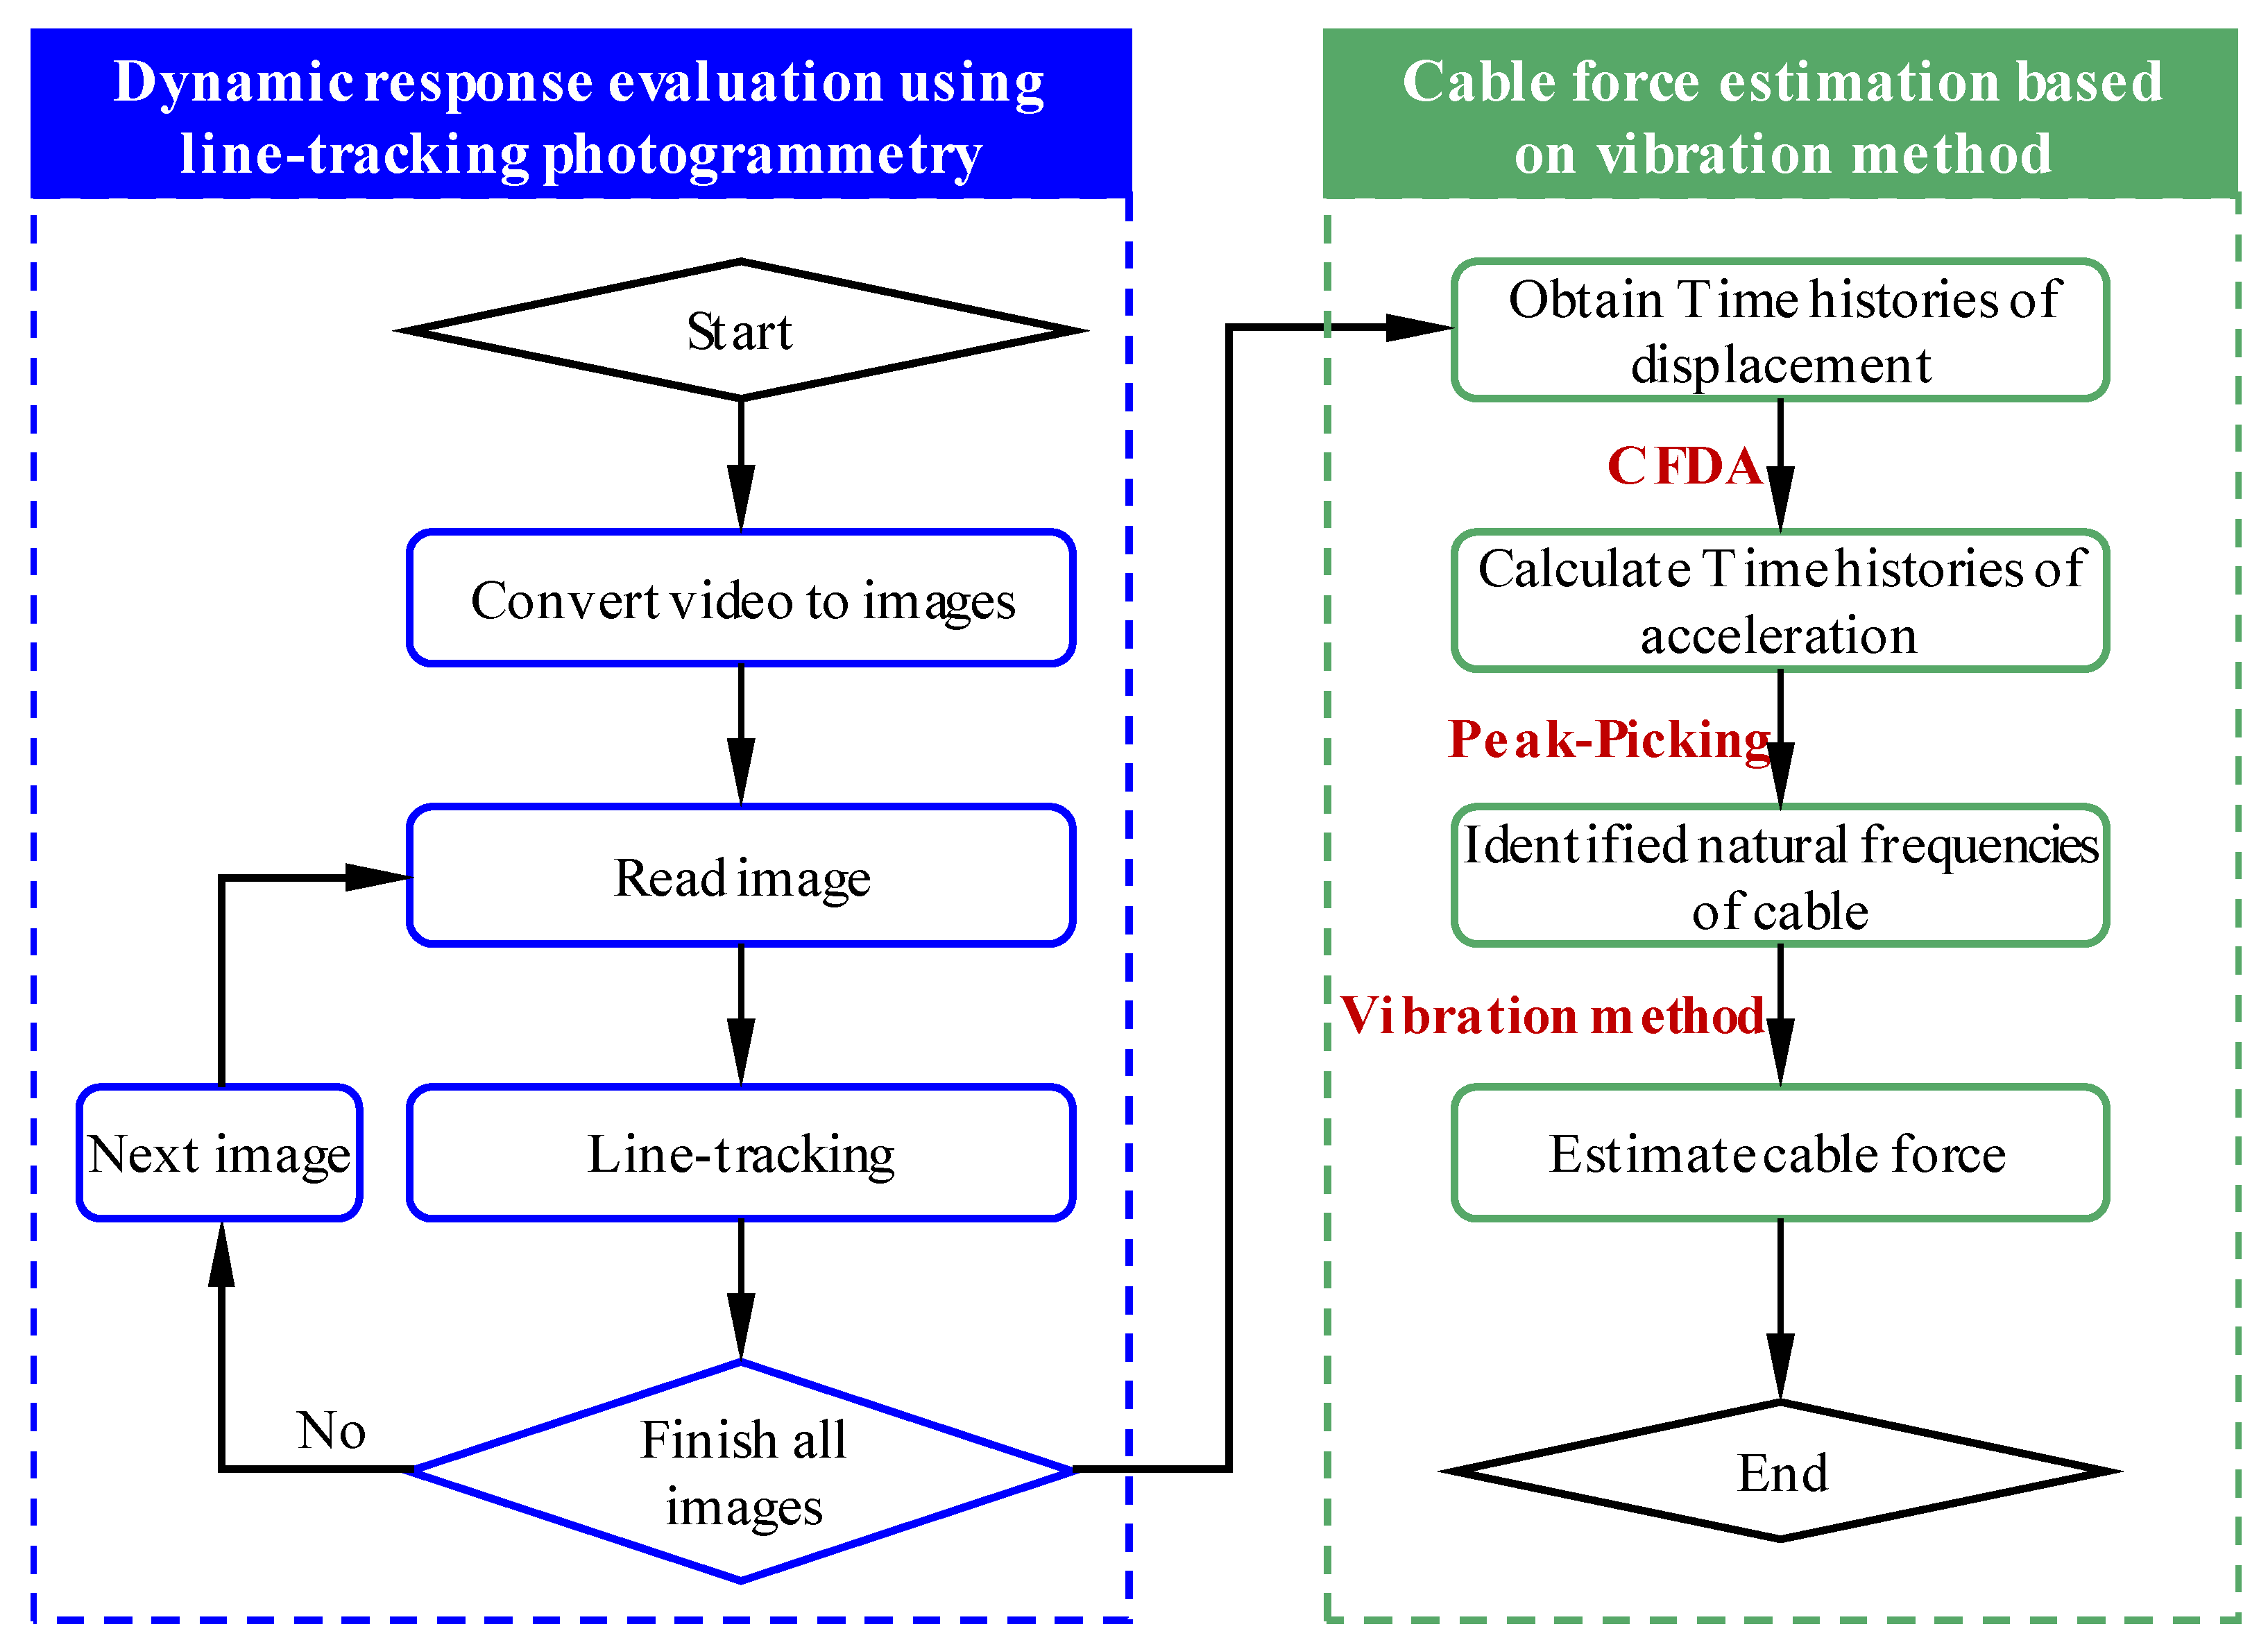
2.3. Computational Procedure

A fast cable-force measurement method is proposed based on digital image processing and a cable-force mechanics model, which can achieve real-time, non-contact, and non-destructive measurement of cable force. This method realized the purpose of convenient, fast, economical, and non-contact cable-force measurement. The videos of the cable used in this paper are shot by smartphones, which are mounted on an abutment of the bridge. The principal benefit of this measurement technology is its capacity to seamlessly incorporate image data acquisition with an unmanned aerial vehicle (UAV). This integration transcends the limitations of terrestrial constraints and mitigates the safety hazards inherent in traditional data collection methods. The flowsheet of the calculation of cable force is shown in Figure 3:
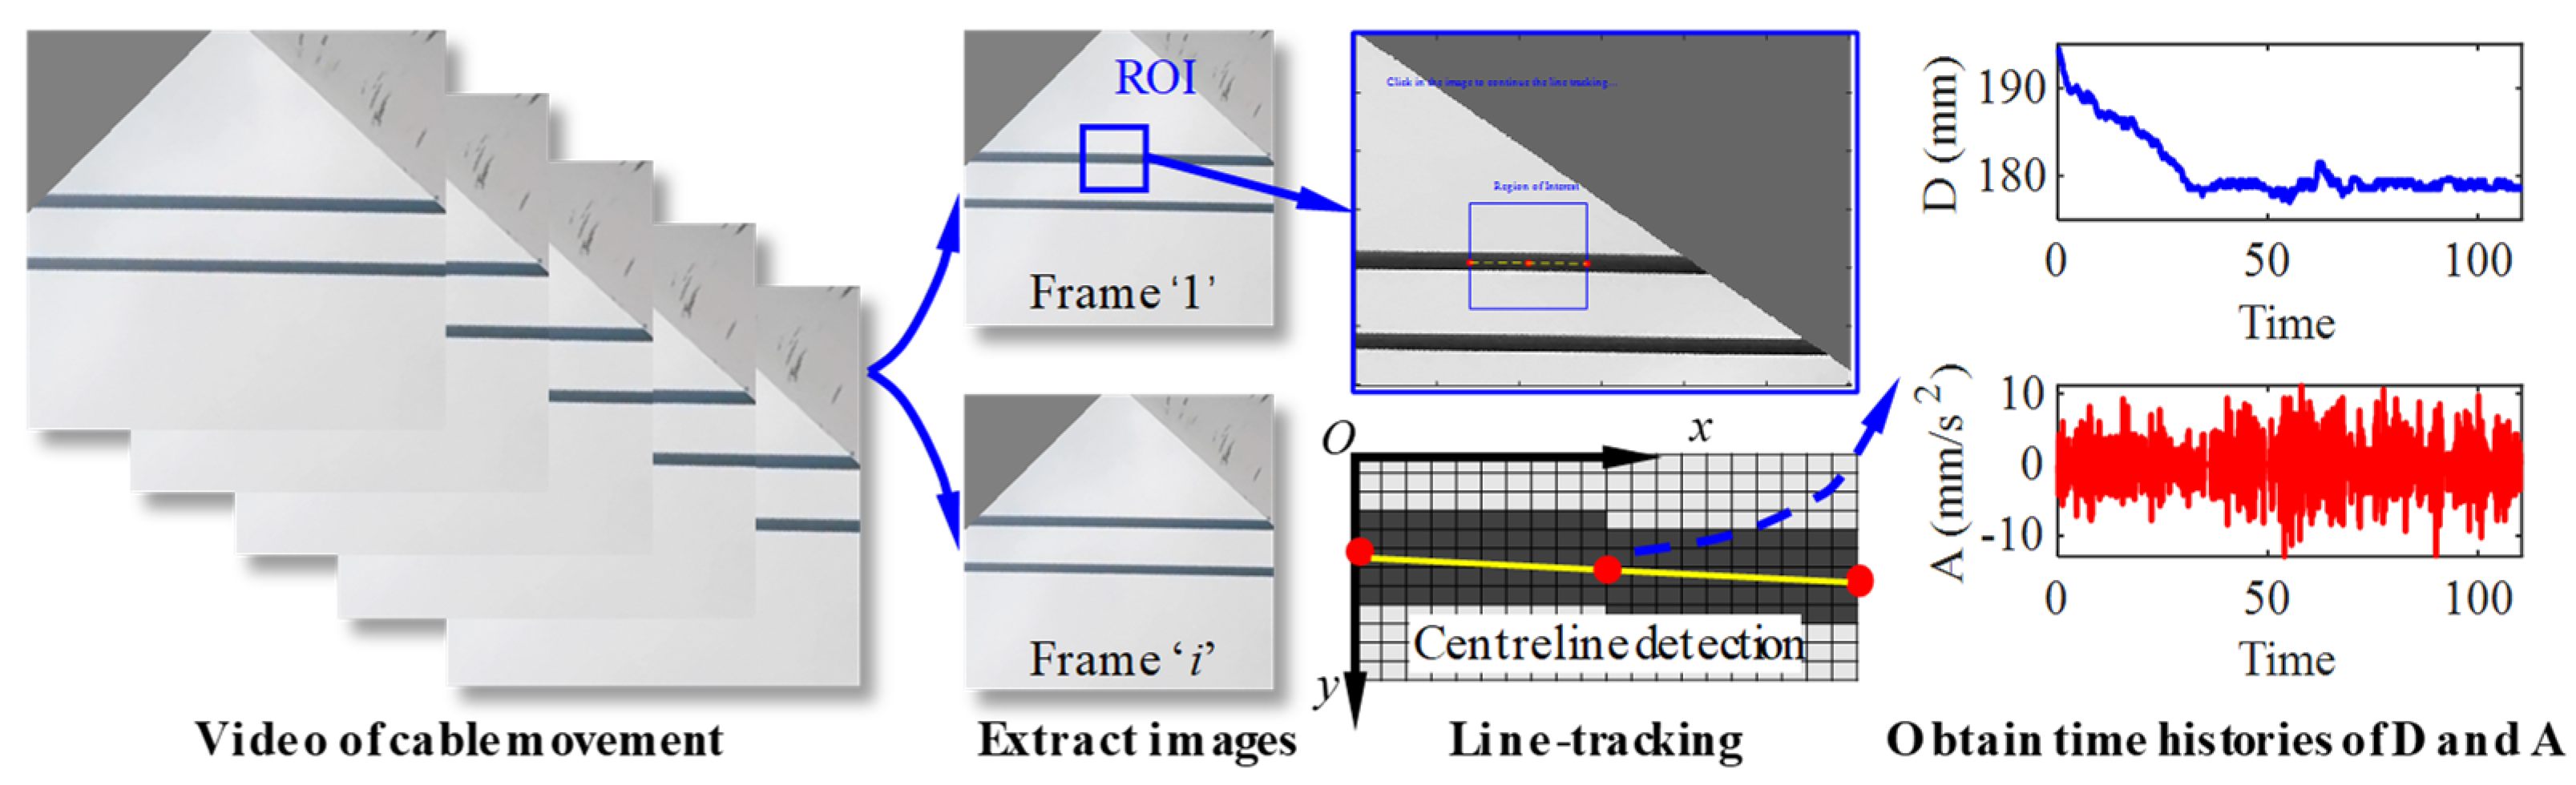
  • Acquire videos of the stay cables using high-precision image-capture equipment or UAV remote sensing technology, then convert them into image data of the stay cable;
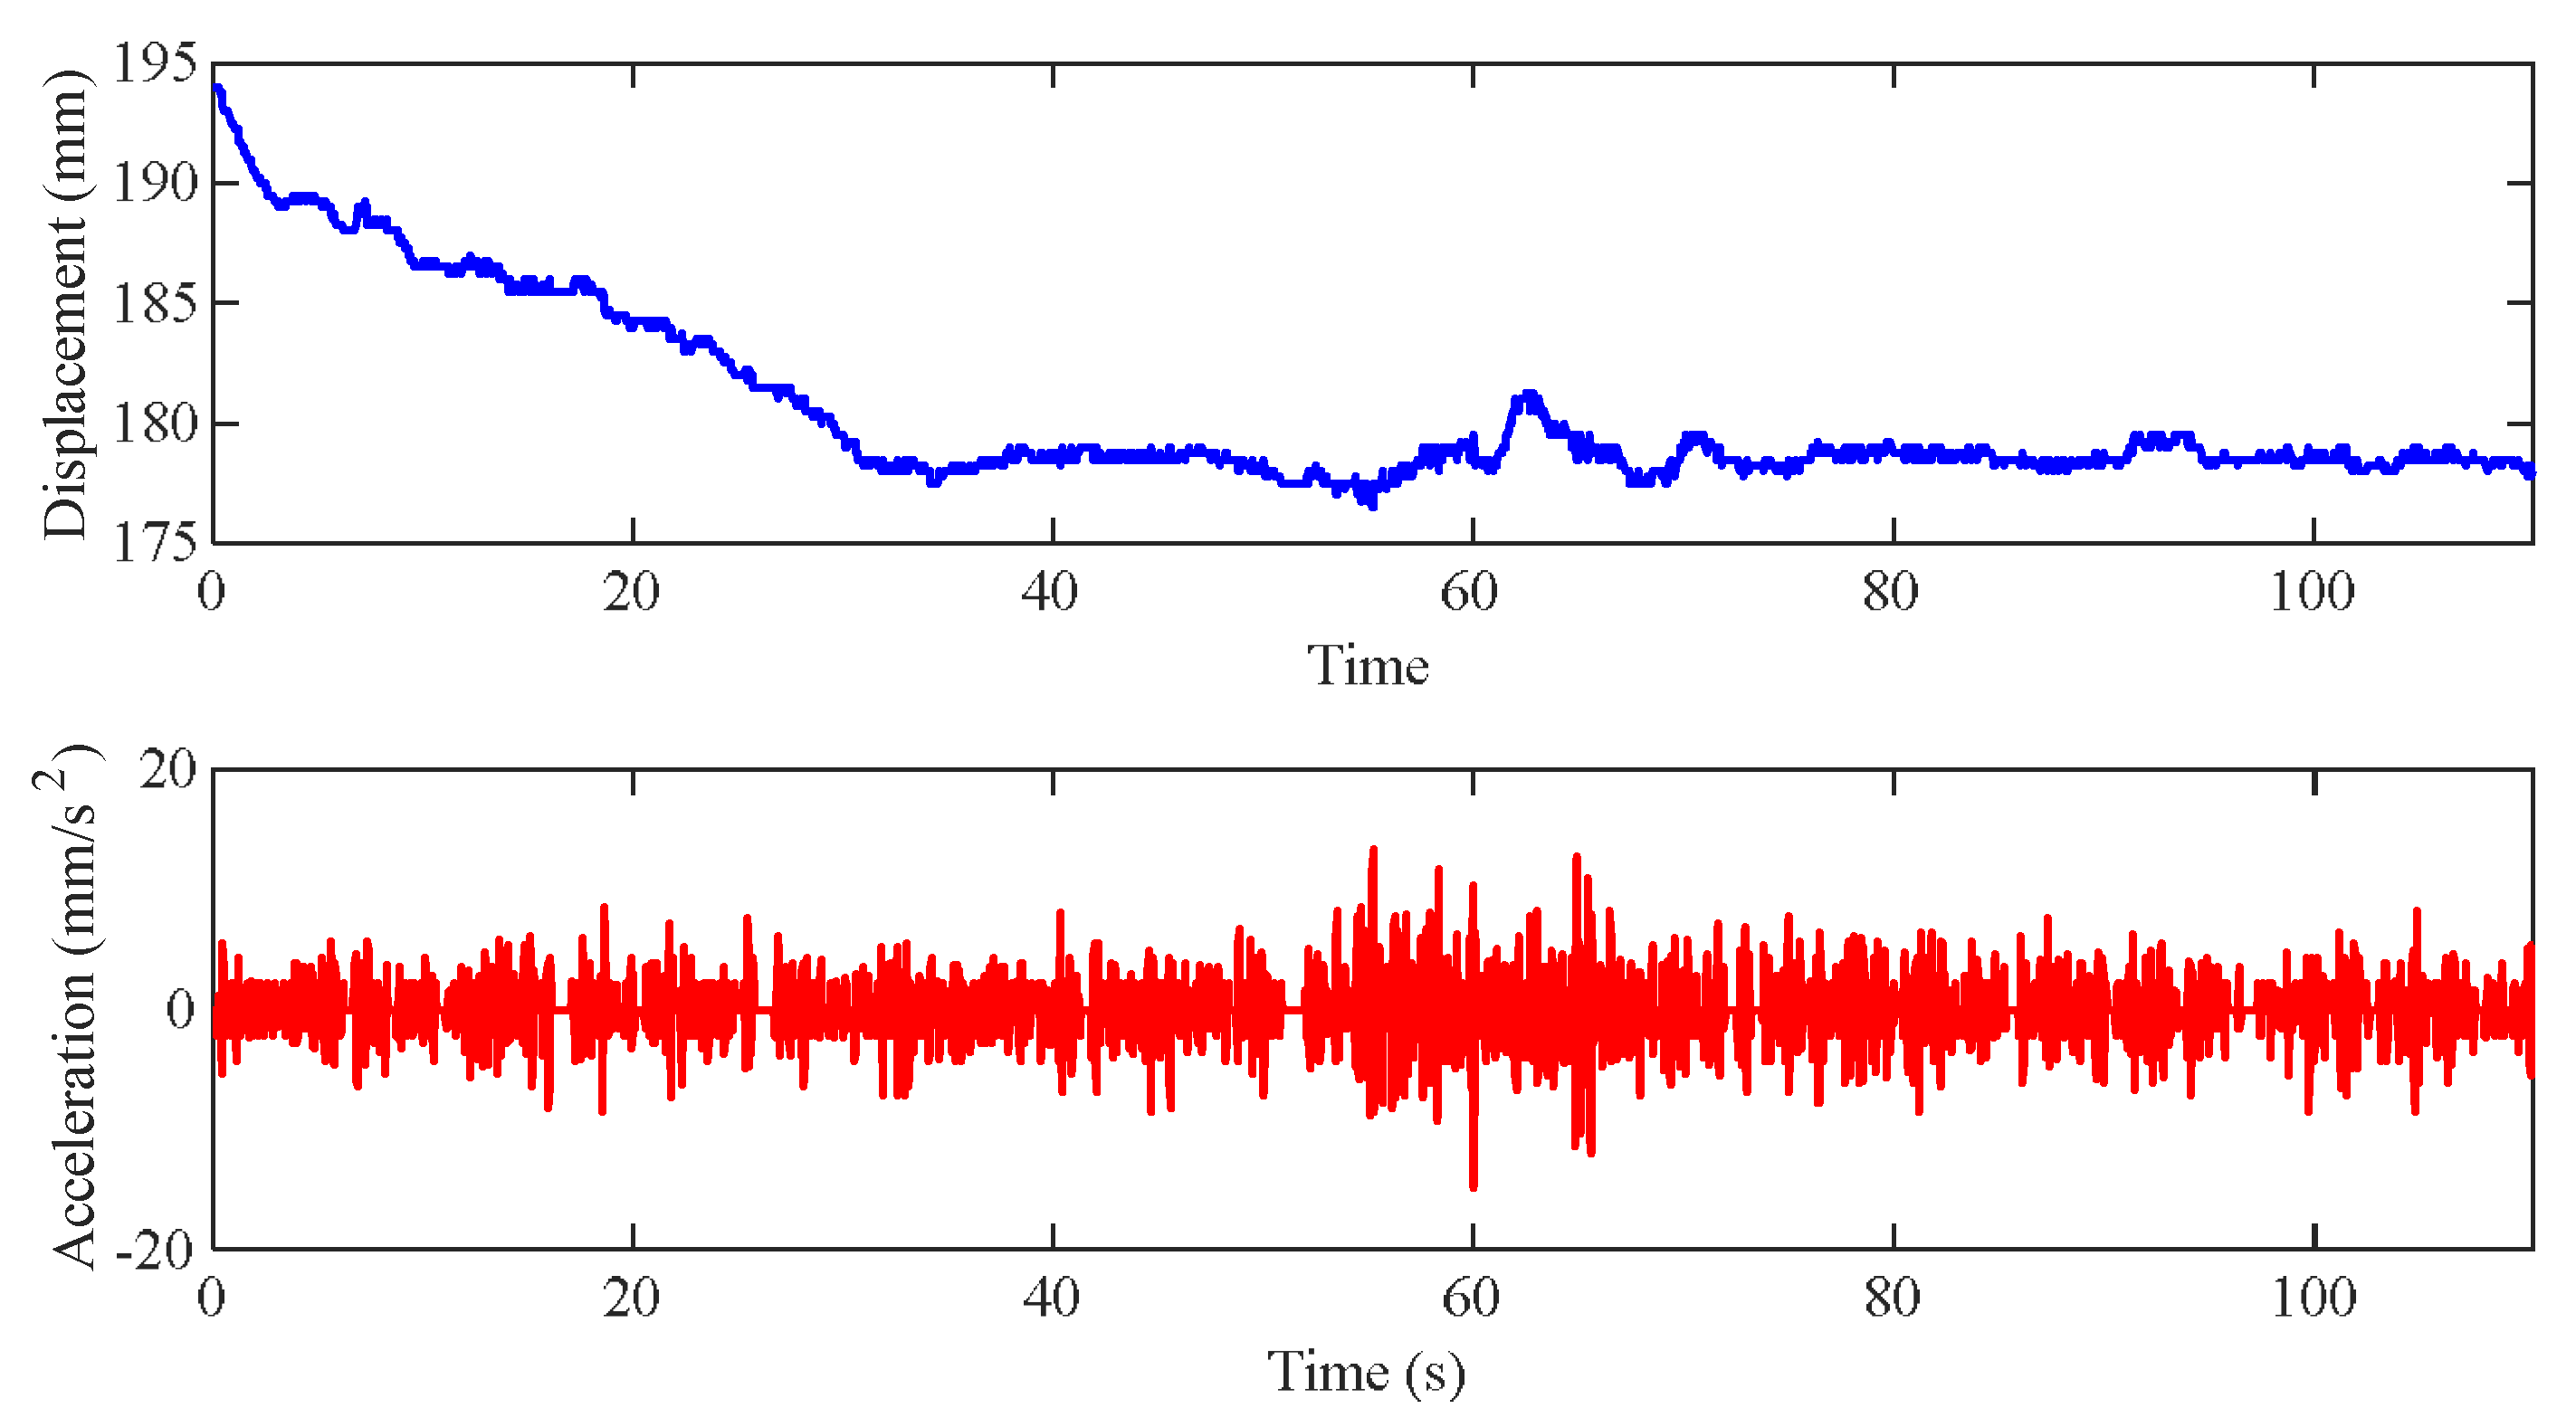
  • Rely on digital image-processing technology to identify and extract the cable line shape, thereby obtaining line-shape data and the geometric coordinates of spatial points. By comparing with the initial images, obtain the dynamic displacement of the target points in the region of interest (ROI).
  • Use the central finite-difference approximation method to numerically differentiate the dynamic displacement to obtain the cable’s acceleration time history.
  • Derive the relationship between cable force and parameters such as natural frequency, bending stiffness, support conditions, and concentrated mass based on the dynamic equation of beam elements.
  • Substitute the identified natural frequency of the cable and the relevant geometric and physical parameters into Equation (11) to calculate the corresponding cable force.

3. Gengcun Dou Bridge and Health Monitoring System

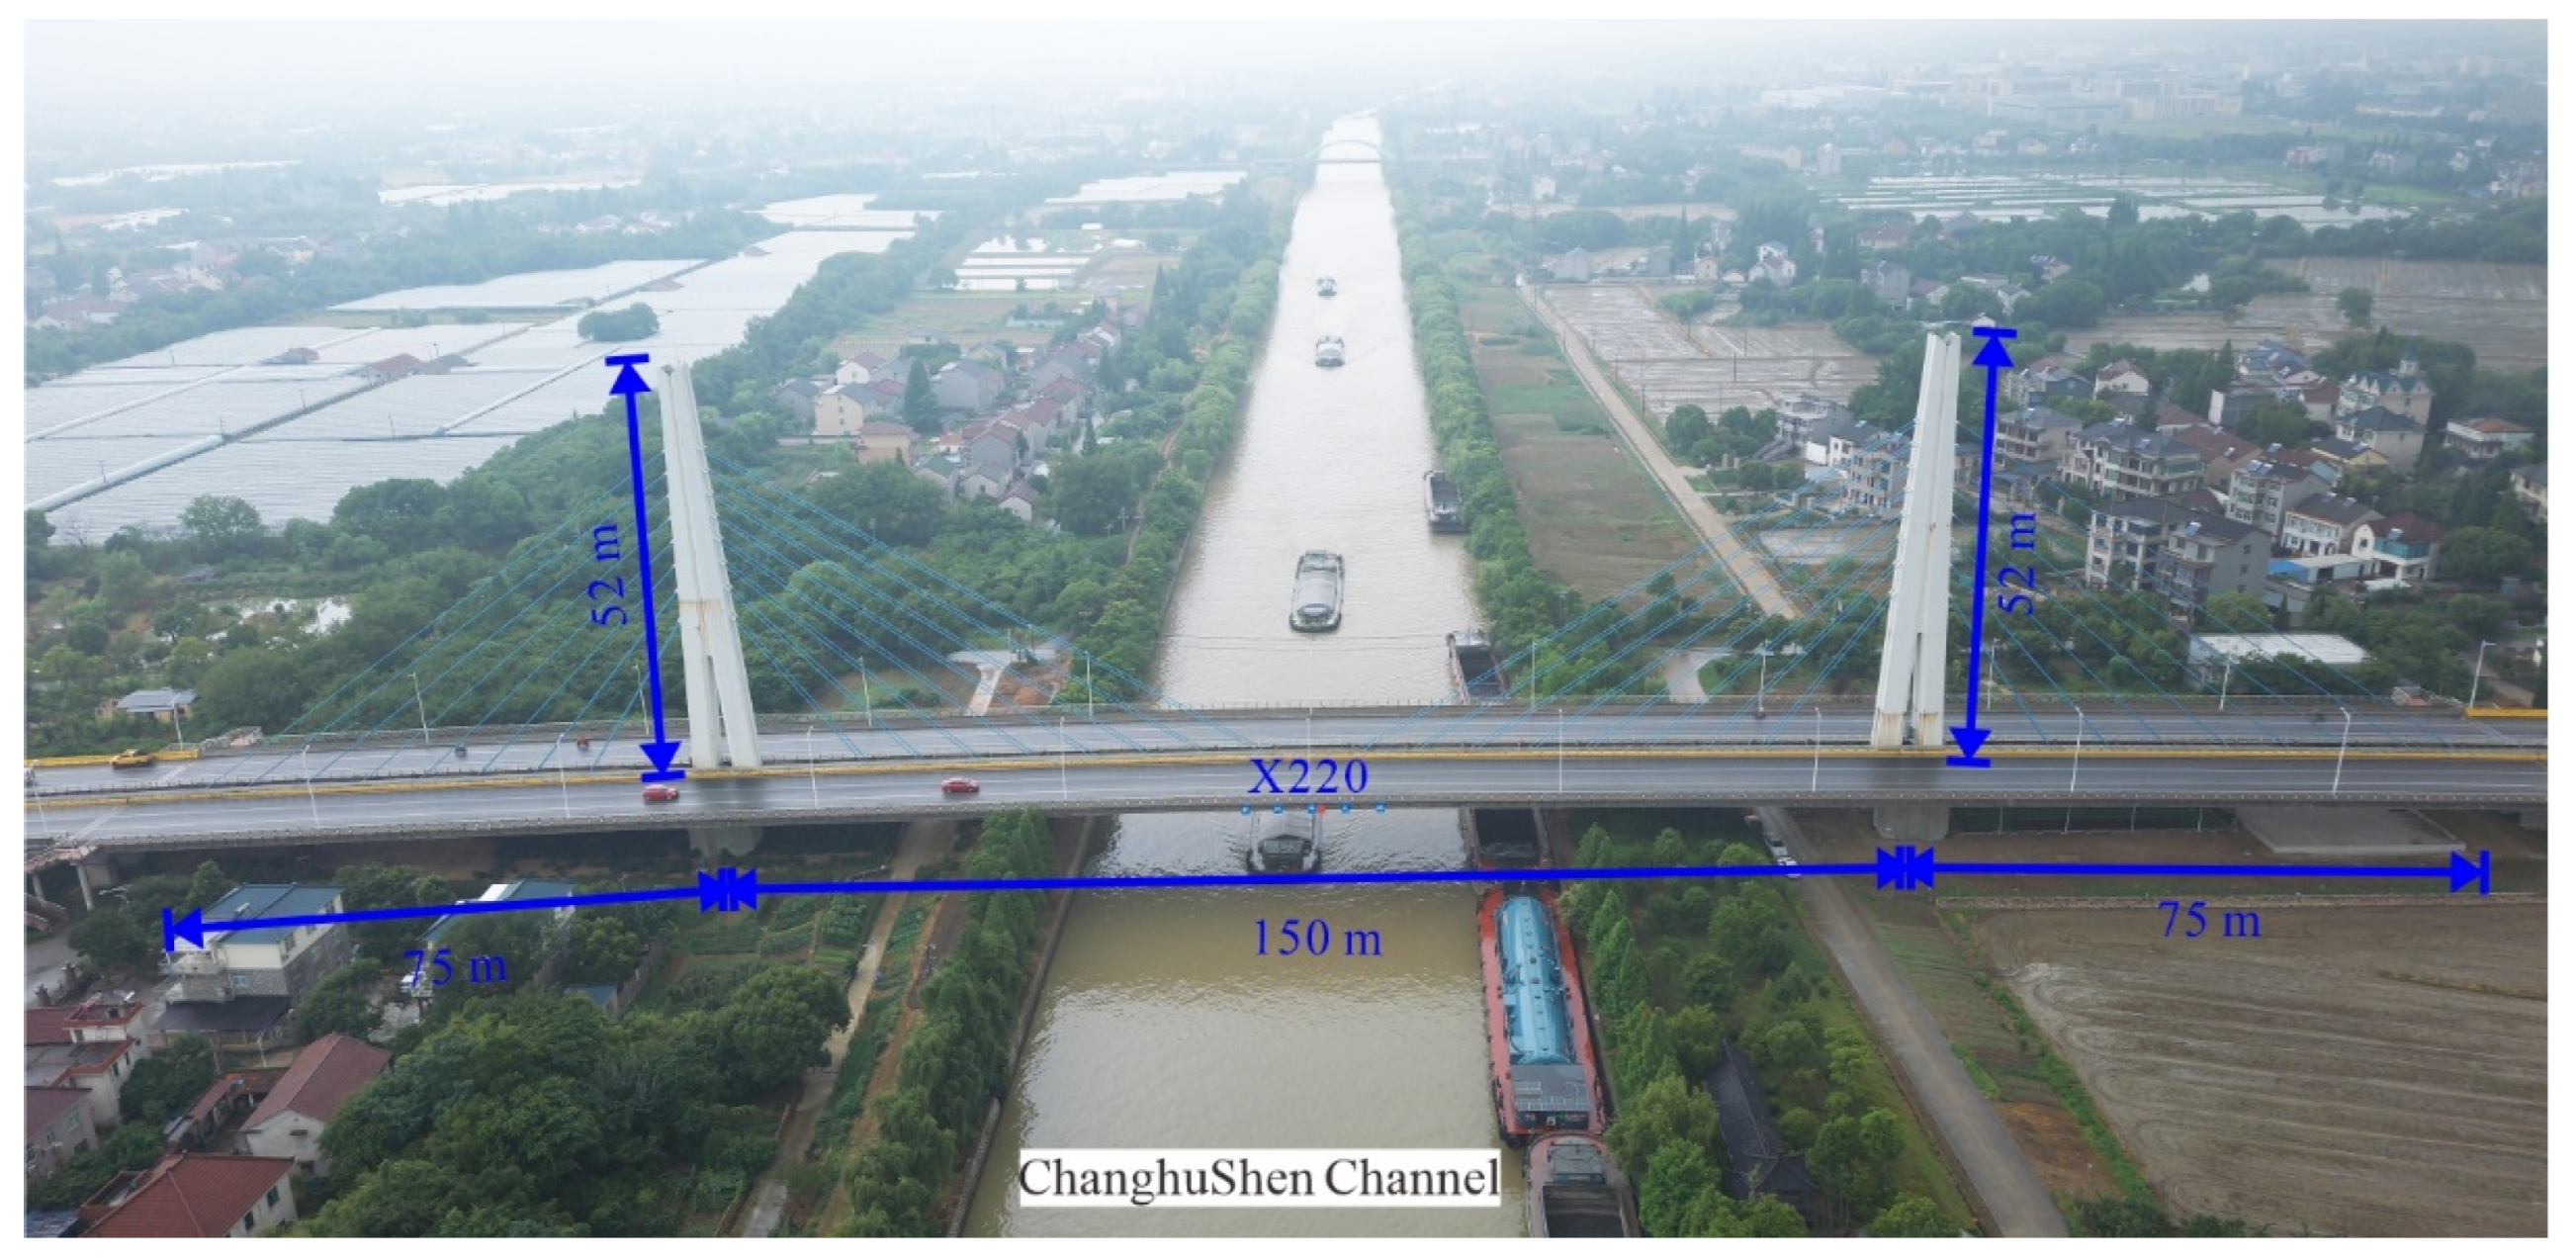
3.1. Description of Gengcun Dou Bridge

The Gengcun Dou Bridge is located in Huzhou, Zhejiang Province, China, on the Changxing–Lvshan route (X220). The primary structure is a dual-tower, single-pylon cable-stayed concrete bridge featuring a single plane of prestressed cables. The approach sections on either side comprise continuous five-span prestressed concrete box-girder bridges with uniform cross-sectional profiles. The total length of the bridge is 608.25 m, whose structural form is shown in Figure 4. The stay cables are arranged in a fan pattern, with eight pairs of stay cables on each side of the main tower, totaling sixty-four cables. The stay cables on the beam are located in the central divider, with a tower cable spacing of 2.6 m and a cable plane distance of 1.32 m. The PESM 7-187 cable system is used for the Gengcun Dou Bridge, with a cable diameter of 95.7 mm. The main girder of the bridge is designed as a triangular box structure, composed of a top plate and bottom plate, inclined webs and vertical webs, cantilever plates, and transverse diaphragms forming three chambers. The clear width at the top of the main girder is 32.5 m, and the clear width at the bottom is 4 m, with each component varying in thickness. The detailed features of the stayed cables are presented in Table 2.

3.2. Structural Health Monitoring System

The Gengcun Dou Bridge is equipped with a structural health monitoring system as shown in Figure 5. A total of 32 accelerometers were used to measure the lateral acceleration of the cables. The accelerometers were installed approximately 3 m above the bridge deck to monitor the internal force changes in the cables during the service stage. Considering the convenience of installing the monitoring equipment and the symmetry of the structure, the entire bridge was divided into four sensing areas (Zone 1~4). Each area is fitted with eight accelerometers, which are used for measuring the cable force. The structural monitoring data is transmitted to an on-site base station through routing nodes. Upon completion of each data collection task, all acquired monitoring data are transmitted to the cloud platform using a 4 G network. This information is then synchronized in real-time at the monitoring center and subsequently displayed.

4. Experimental Validation

4.1. Results of Dynamic Response Evaluation

To validate the effectiveness and accuracy of the proposed measurement method, the research team conducted on-site measurements on 11 December 2023, using portable cameras to measure four cables on the south side of the bridge. The serial numbers of the cables are 2-R-8, 2-R-7, 2-L-8, and 2-L-7. The serial numbers and positions of the four cables are shown in Figure 6.
By applying the image processing method described in Section 2.1 to the video footage of cable 2-L-7, the time histories of lateral deformation and acceleration of the cable can be obtained as shown in Figure 7. Furthermore, the first natural frequency of the cable is identified as 3.98 Hz using the Pick Peaking (PP) method, and the estimated results of the acceleration power spectrum density (PSD) are shown in Figure 8. Similarly, the analysis of the acceleration data measured on-site reveals that the natural frequency of cable 2-R-7 is 4.09 Hz, with a relative error of 2.77%. The results indicate that the identification method proposed in this paper can accurately estimate the lateral acceleration of the cable and effectively extract the corresponding frequency components, meeting the general requirements for the actual measurement of cable forces.
Furthermore, acceleration time histories of the cables from different locations were extracted to verify the applicability of the proposed method. Taking 2-R-6 as an example, the three selected locations are marked with blue boxes in Figure 6. The time history of displacements in these three locations was extracted. Using the computational procedure in Section 2.3, the lateral accelerations of the cables at the three positions were calculated as shown in Figure 9. The amplitude changes of the accelerations at the three positions are consistent. A Fourier transform was performed on the accelerations from the three different locations, producing the frequency spectrums as shown in Figure 10. Since the video frame rate is 30 Hz, the frequency content is restricted to 15 Hz. It can be seen that the characteristics of the three frequency spectra are consistent, effectively identifying the first-order natural frequency of the cable as 3.98 Hz. This finding validates the effectiveness of the proposed method in precisely determining the natural frequency of the cable’s lateral vibrations and in identifying its key frequency-domain characteristics. Consequently, the method demonstrates its capability to reliably extract the natural frequency associated with the cable’s lateral movement. During the measurement process, an appropriate region of interest (ROI) can be selected by considering the interaction between the environmental background and the target object, which is the foundation for the next step of calculating the cable force based on the frequency method.

4.2. Results of Cable-Force Measurement

Upon determining the natural frequencies of the cables, the forces exerted on the four cables within the video capture range were calculated using the prescribed mathematical formula from Section 2.2 and compared with the actual values measured by the monitoring system. The main physical and geometric parameters of the cables are shown in Table 3. The minimum ratio of effective length and diameter of cable to be measured is 286.2, which is larger than 150. Therefore, the bending stiffness of all stay cables can be ignored. The identified results of the natural frequencies and related parameters were substituted into Equation (11) to calculate the cable forces, and the measured results are shown in Table 4. The accuracy and effectiveness of the proposed method is demonstrated by comparing the results of the proposed method with those of the monitoring system. The smaller the relative deviation between these two results, the higher the accuracy of the proposed method.
The results indicate that the cable forces, as measured using the proposed method, align closely with the results acquired from the monitoring system. Specifically, the average relative deviation remained within a 3.0% range, while the maximum relative deviation did not surpass 4.0%. The main reasons for the deviations stem from differences in the identification of the cable natural frequencies. This discrepancy primarily arises from sunlight in the bridge environment, which differentially illuminates the cable’s upper and lower surfaces. Consequently, this leads to higher grayscale values on the upper surface and lower values on the underside. This phenomenon leads to reduced precision in grayscale-image edge detection, thereby affecting the accuracy of dynamic displacement identification. Furthermore, by analyzing the video footage captured from 10:00 to 11:00 on 11 December 2023, the time histories of the cable forces for cables 2-L-7 and 2-R-7 are plotted in Figure 11. The figure reveals that the trends in cable-force changes for the two symmetric cables are essentially consistent, demonstrating that the method proposed in this paper can effectively measure the trend of cable-force variations in large-span bridges.

5. Conclusions

This paper combines digital image processing and cable-force mechanics models to propose a rapid and efficient method for the actual measurement of cable forces. The method uses a smartphone to record videos of the cables, and accurately measures the lateral vibration acceleration of the cables, based on linear recognition. The proposed method can measure the structural dynamic response of a cable, with the advantage of not requiring the installation of arbitrary targets or the setting of feature points. It then effectively calculates the cable force using the frequency method. This method has been successfully applied during the operation and the maintenance phase of the Gengcun Dou Bridge to measure the actual cable forces, and its effectiveness and accuracy have been verified. The main conclusions are as follows:
(1)
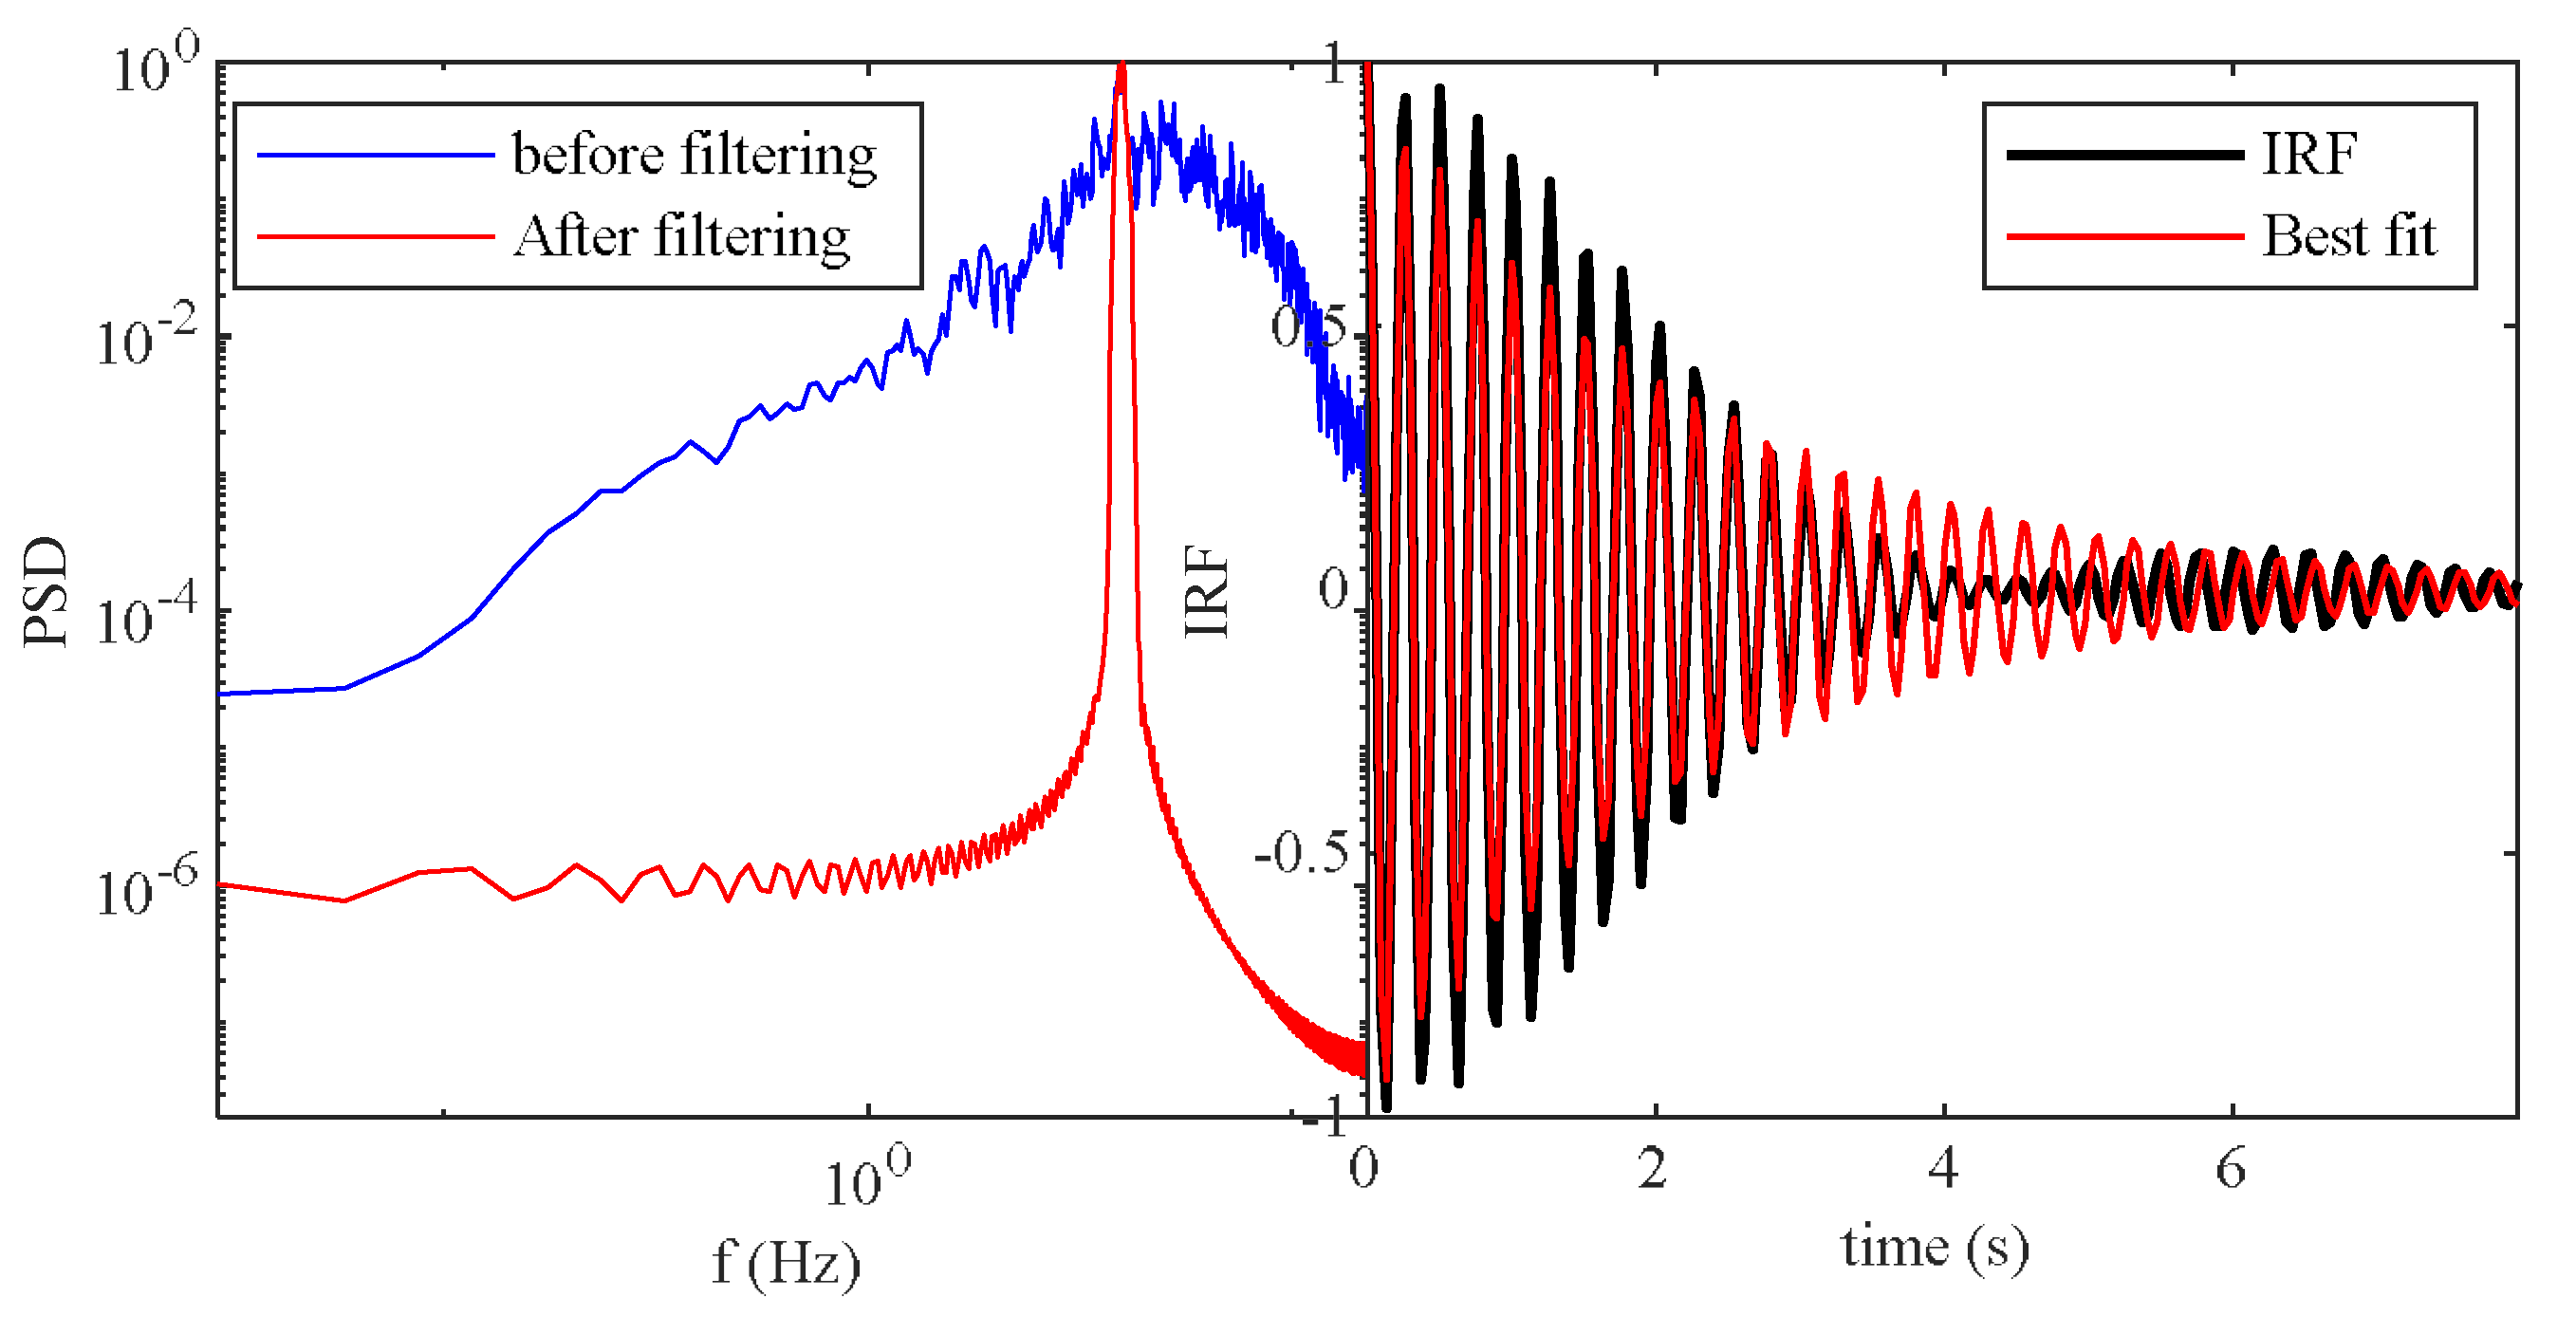
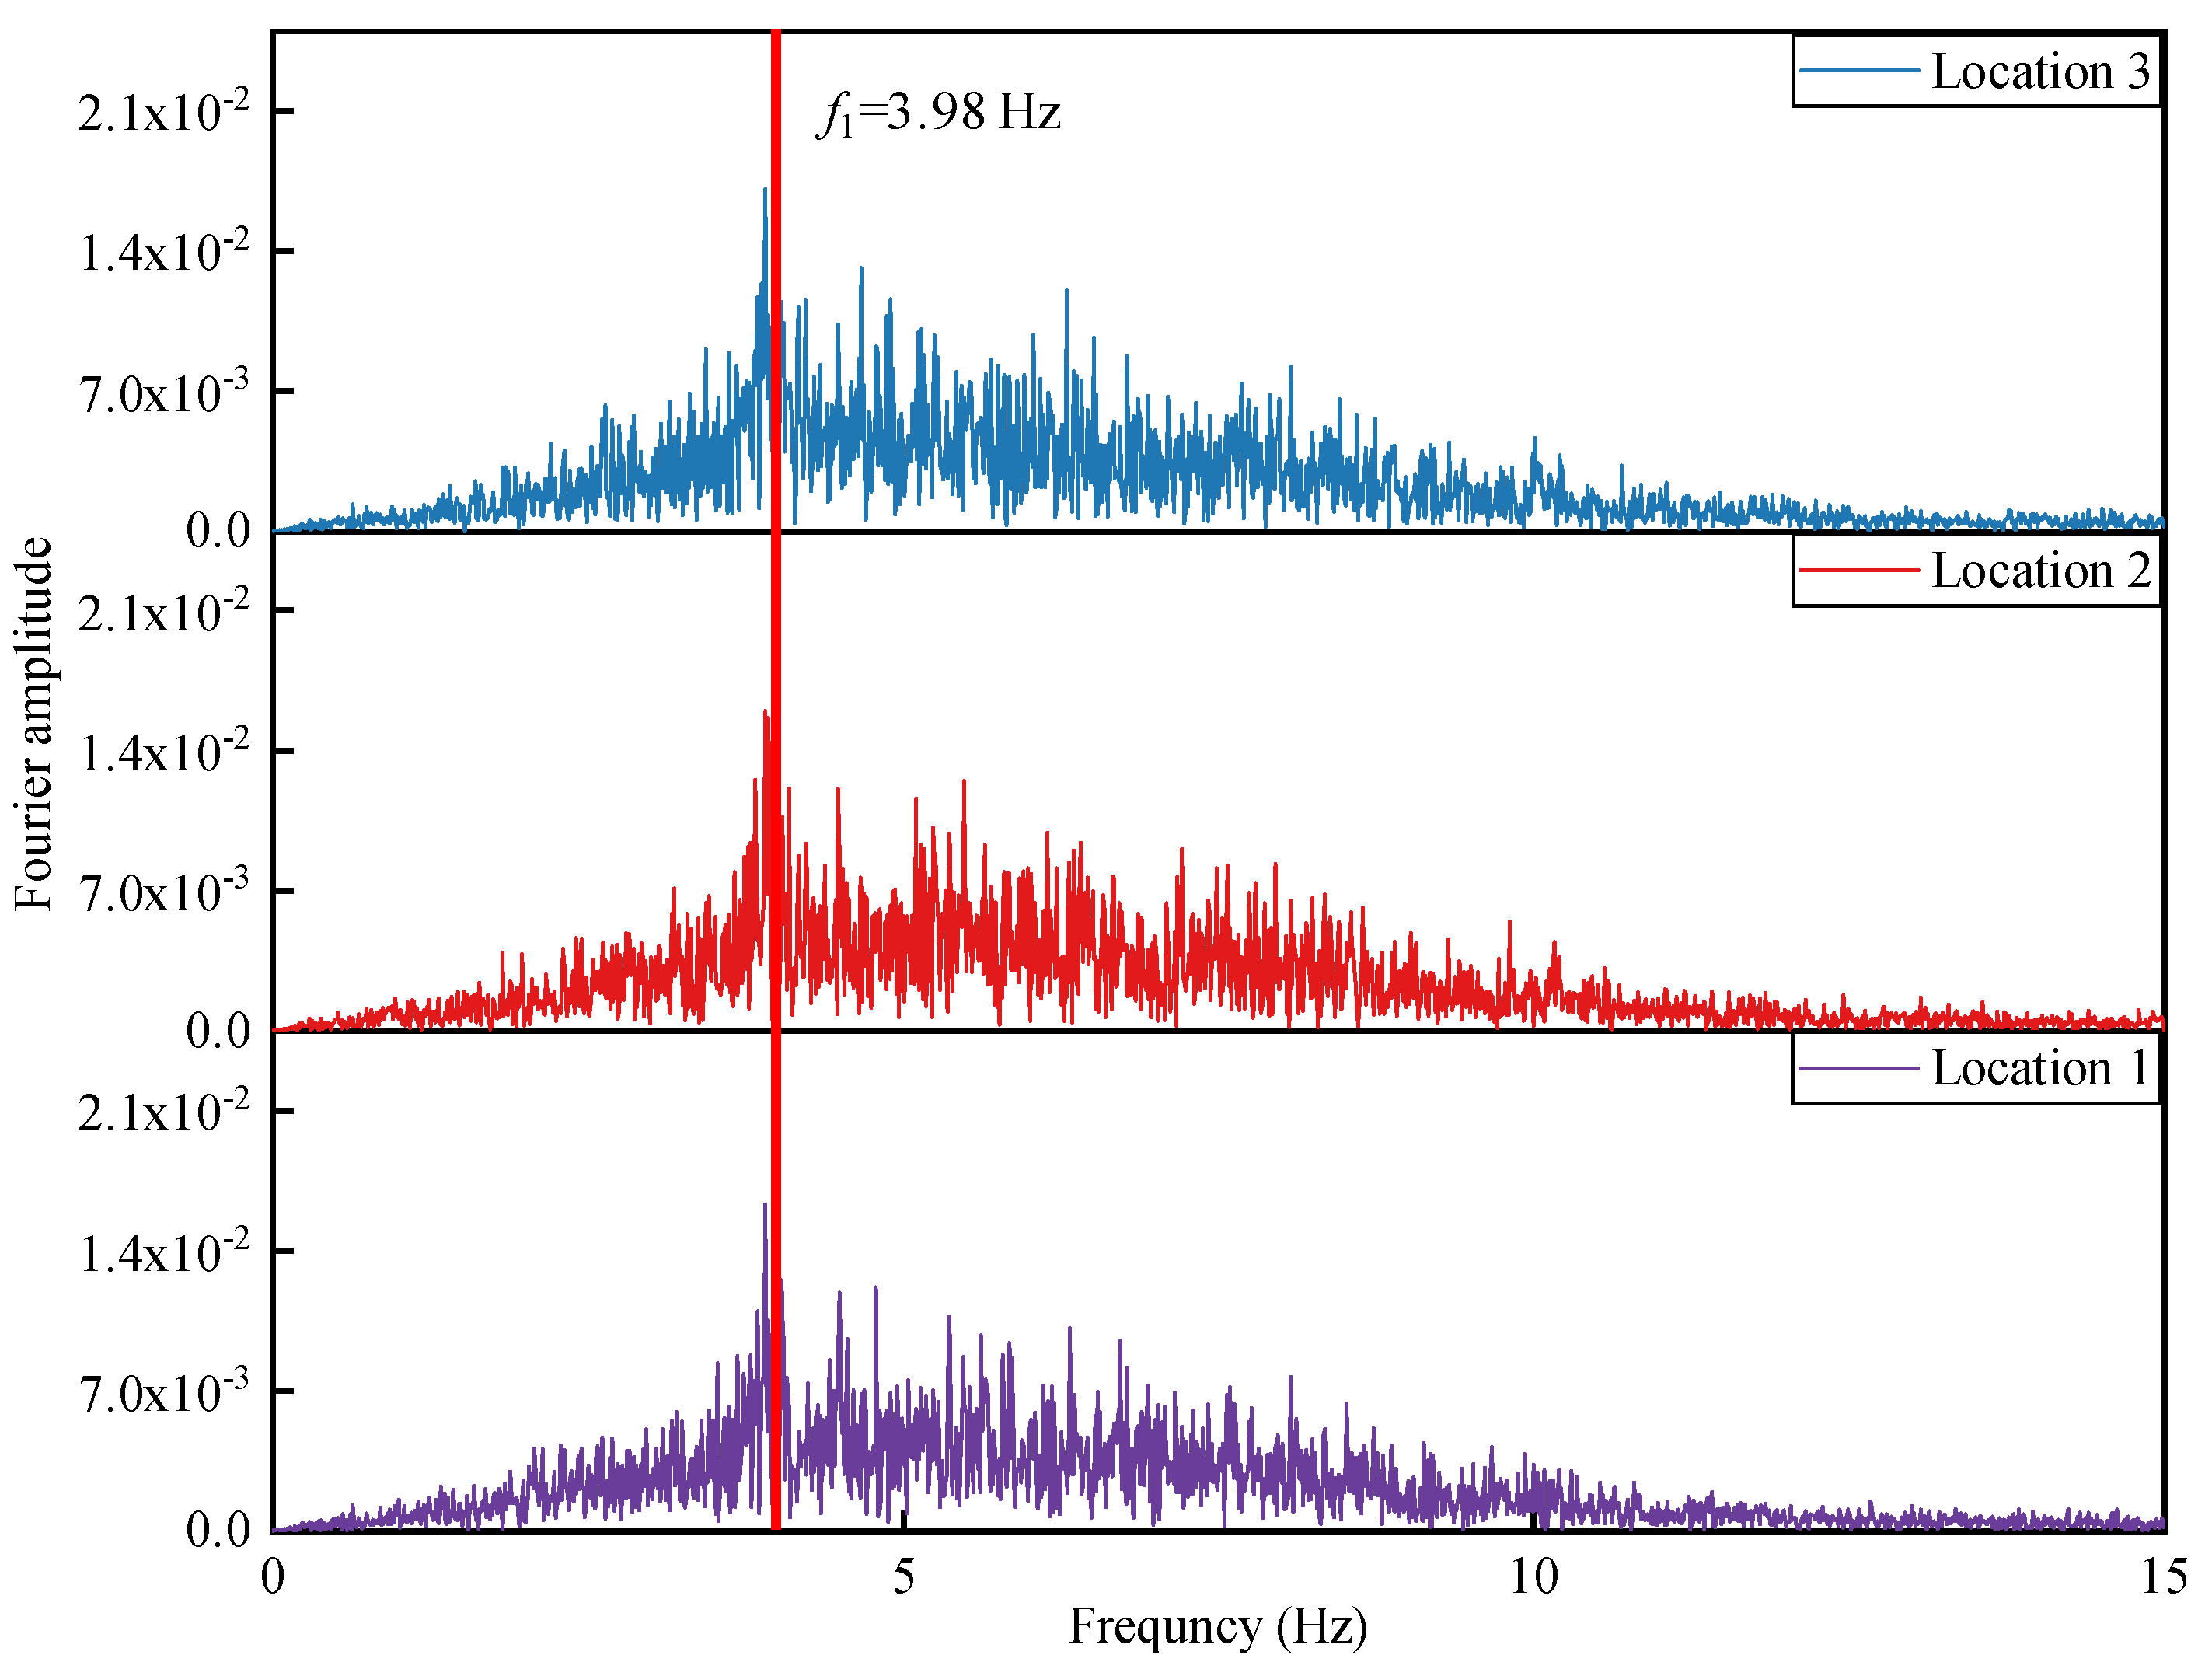
By comparing the acceleration data collected by the monitoring system, the cable dynamic-response assessment method proposed in this paper can accurately capture the frequency components in the acceleration response. The identified relative error of the first-order natural frequency of the cable does not exceed 3.0%. The dynamic response measurements at different positions of the same cable are consistent. During the measurement process, an appropriate region of interest (ROI) can be selected based on the relationship between the environmental background and the target object to perform the cable-force measurement.
(2)
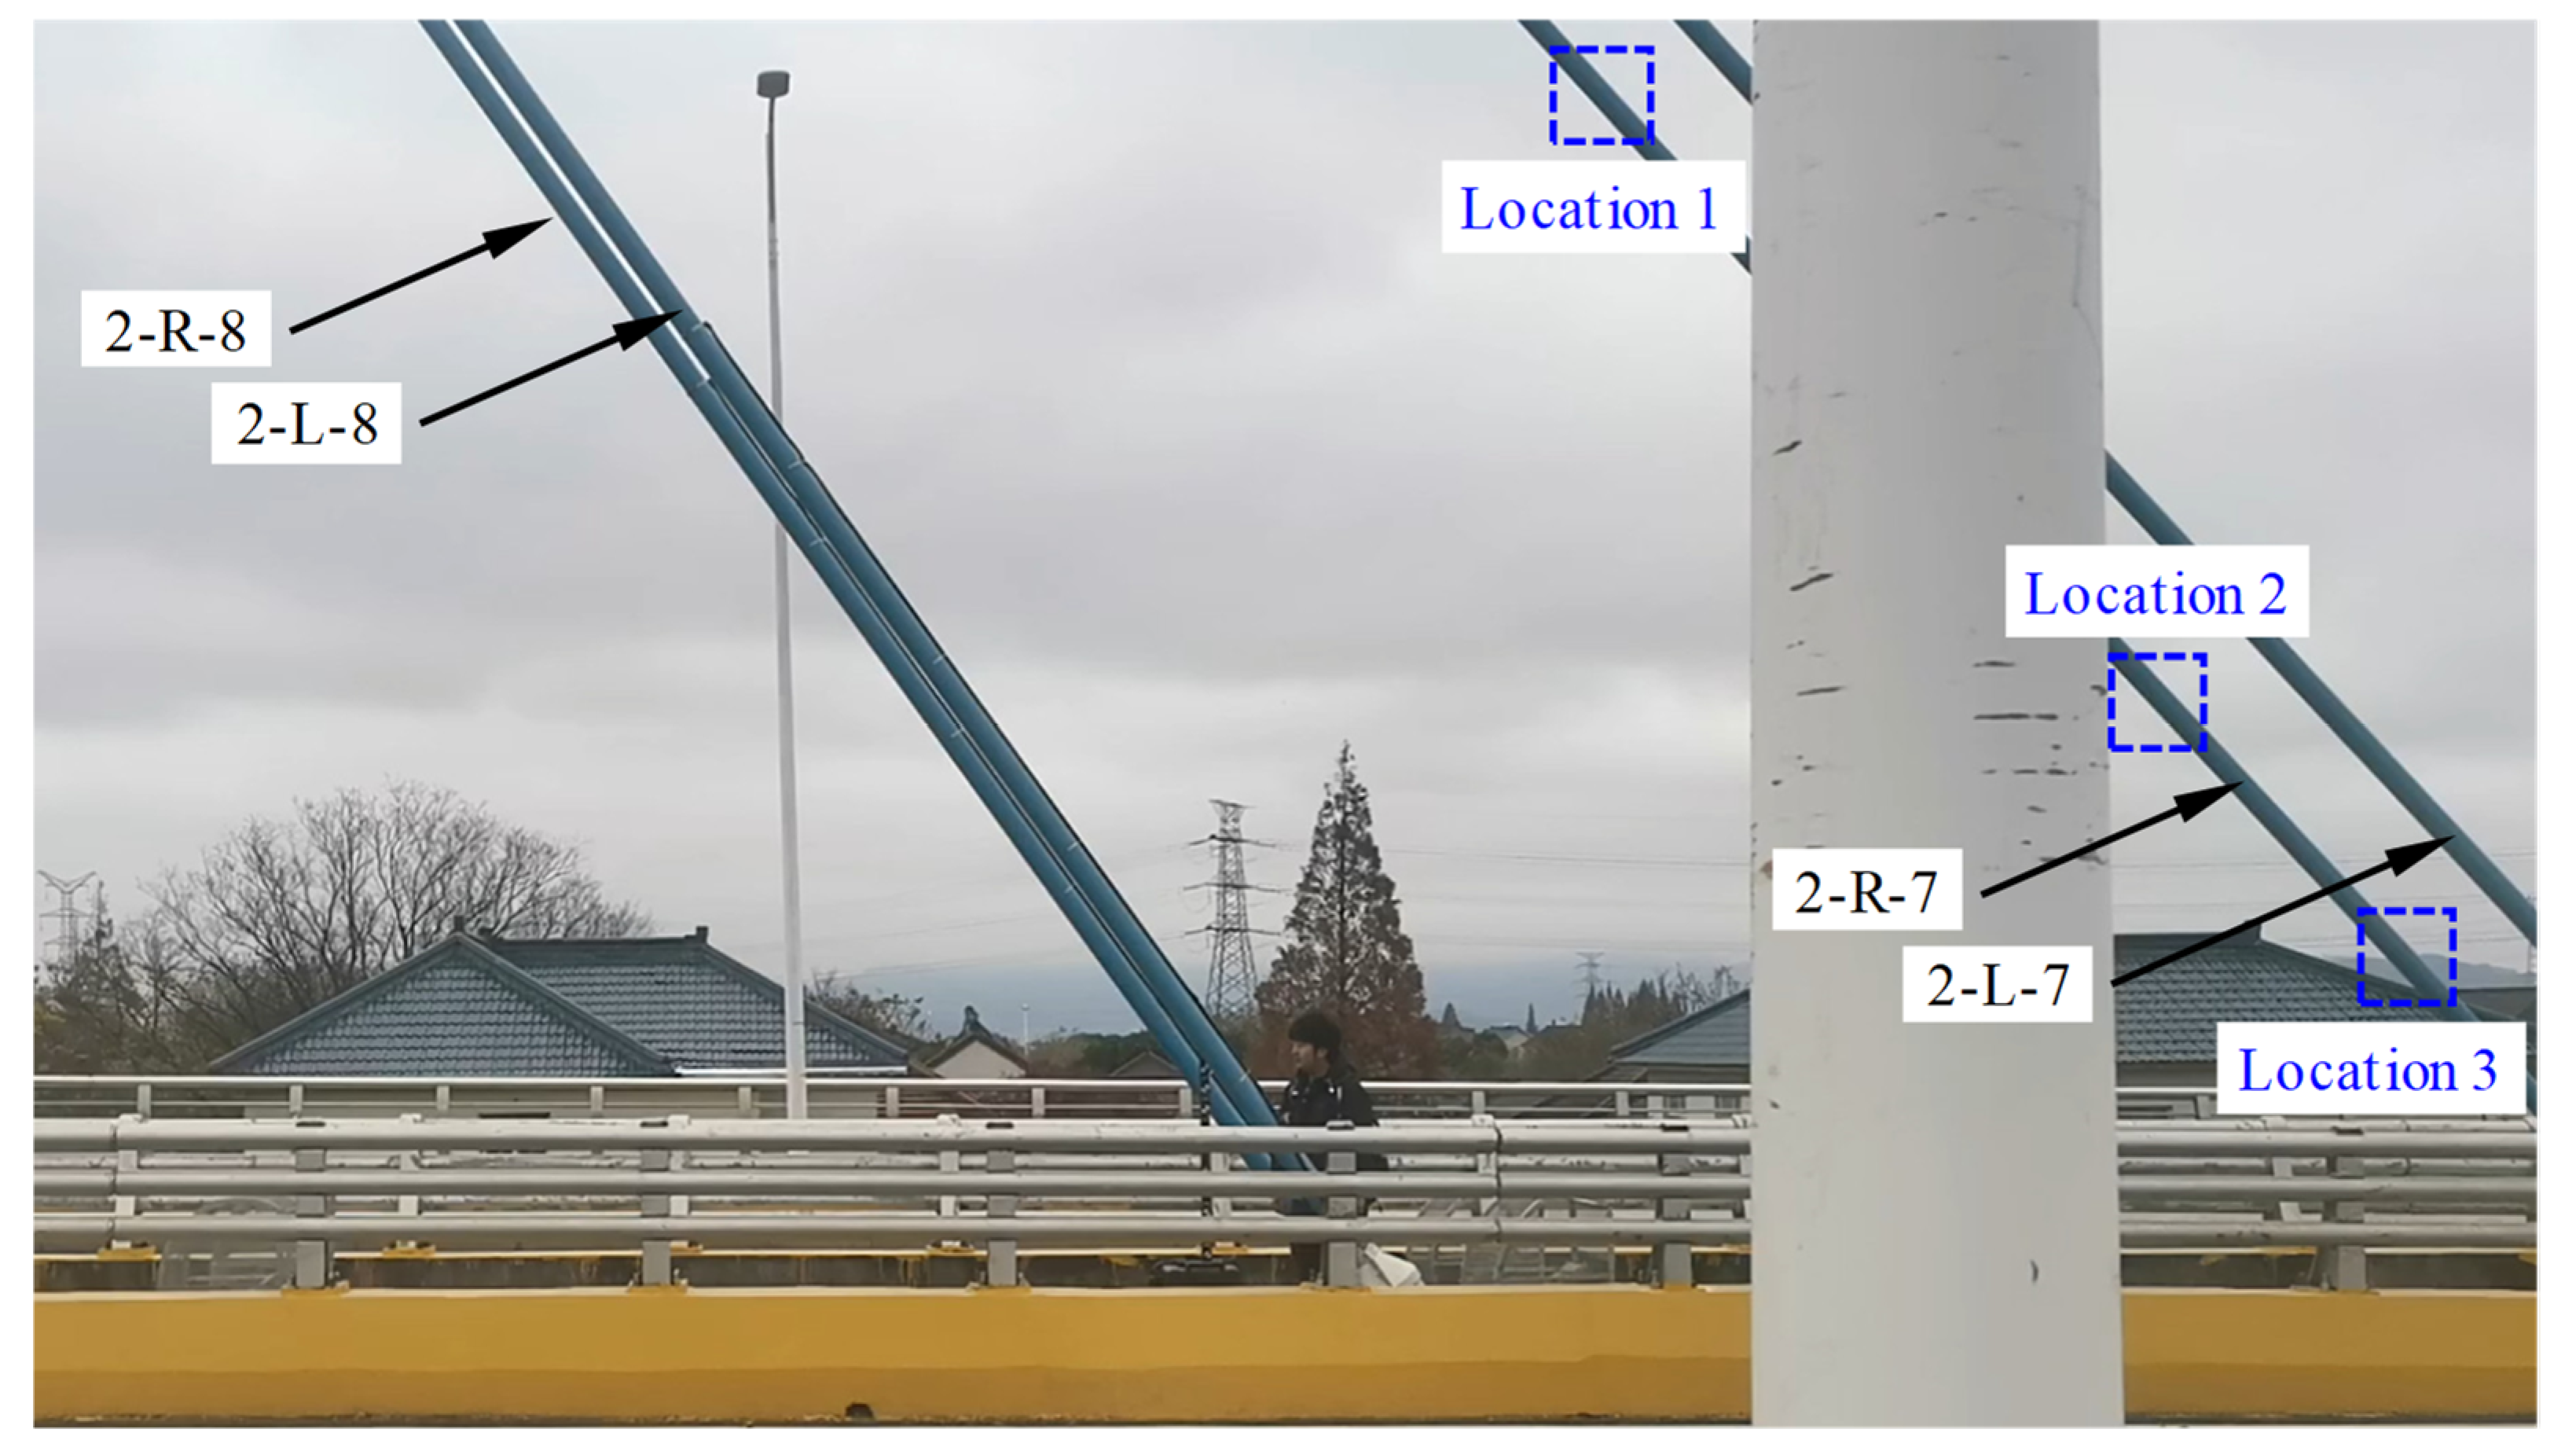
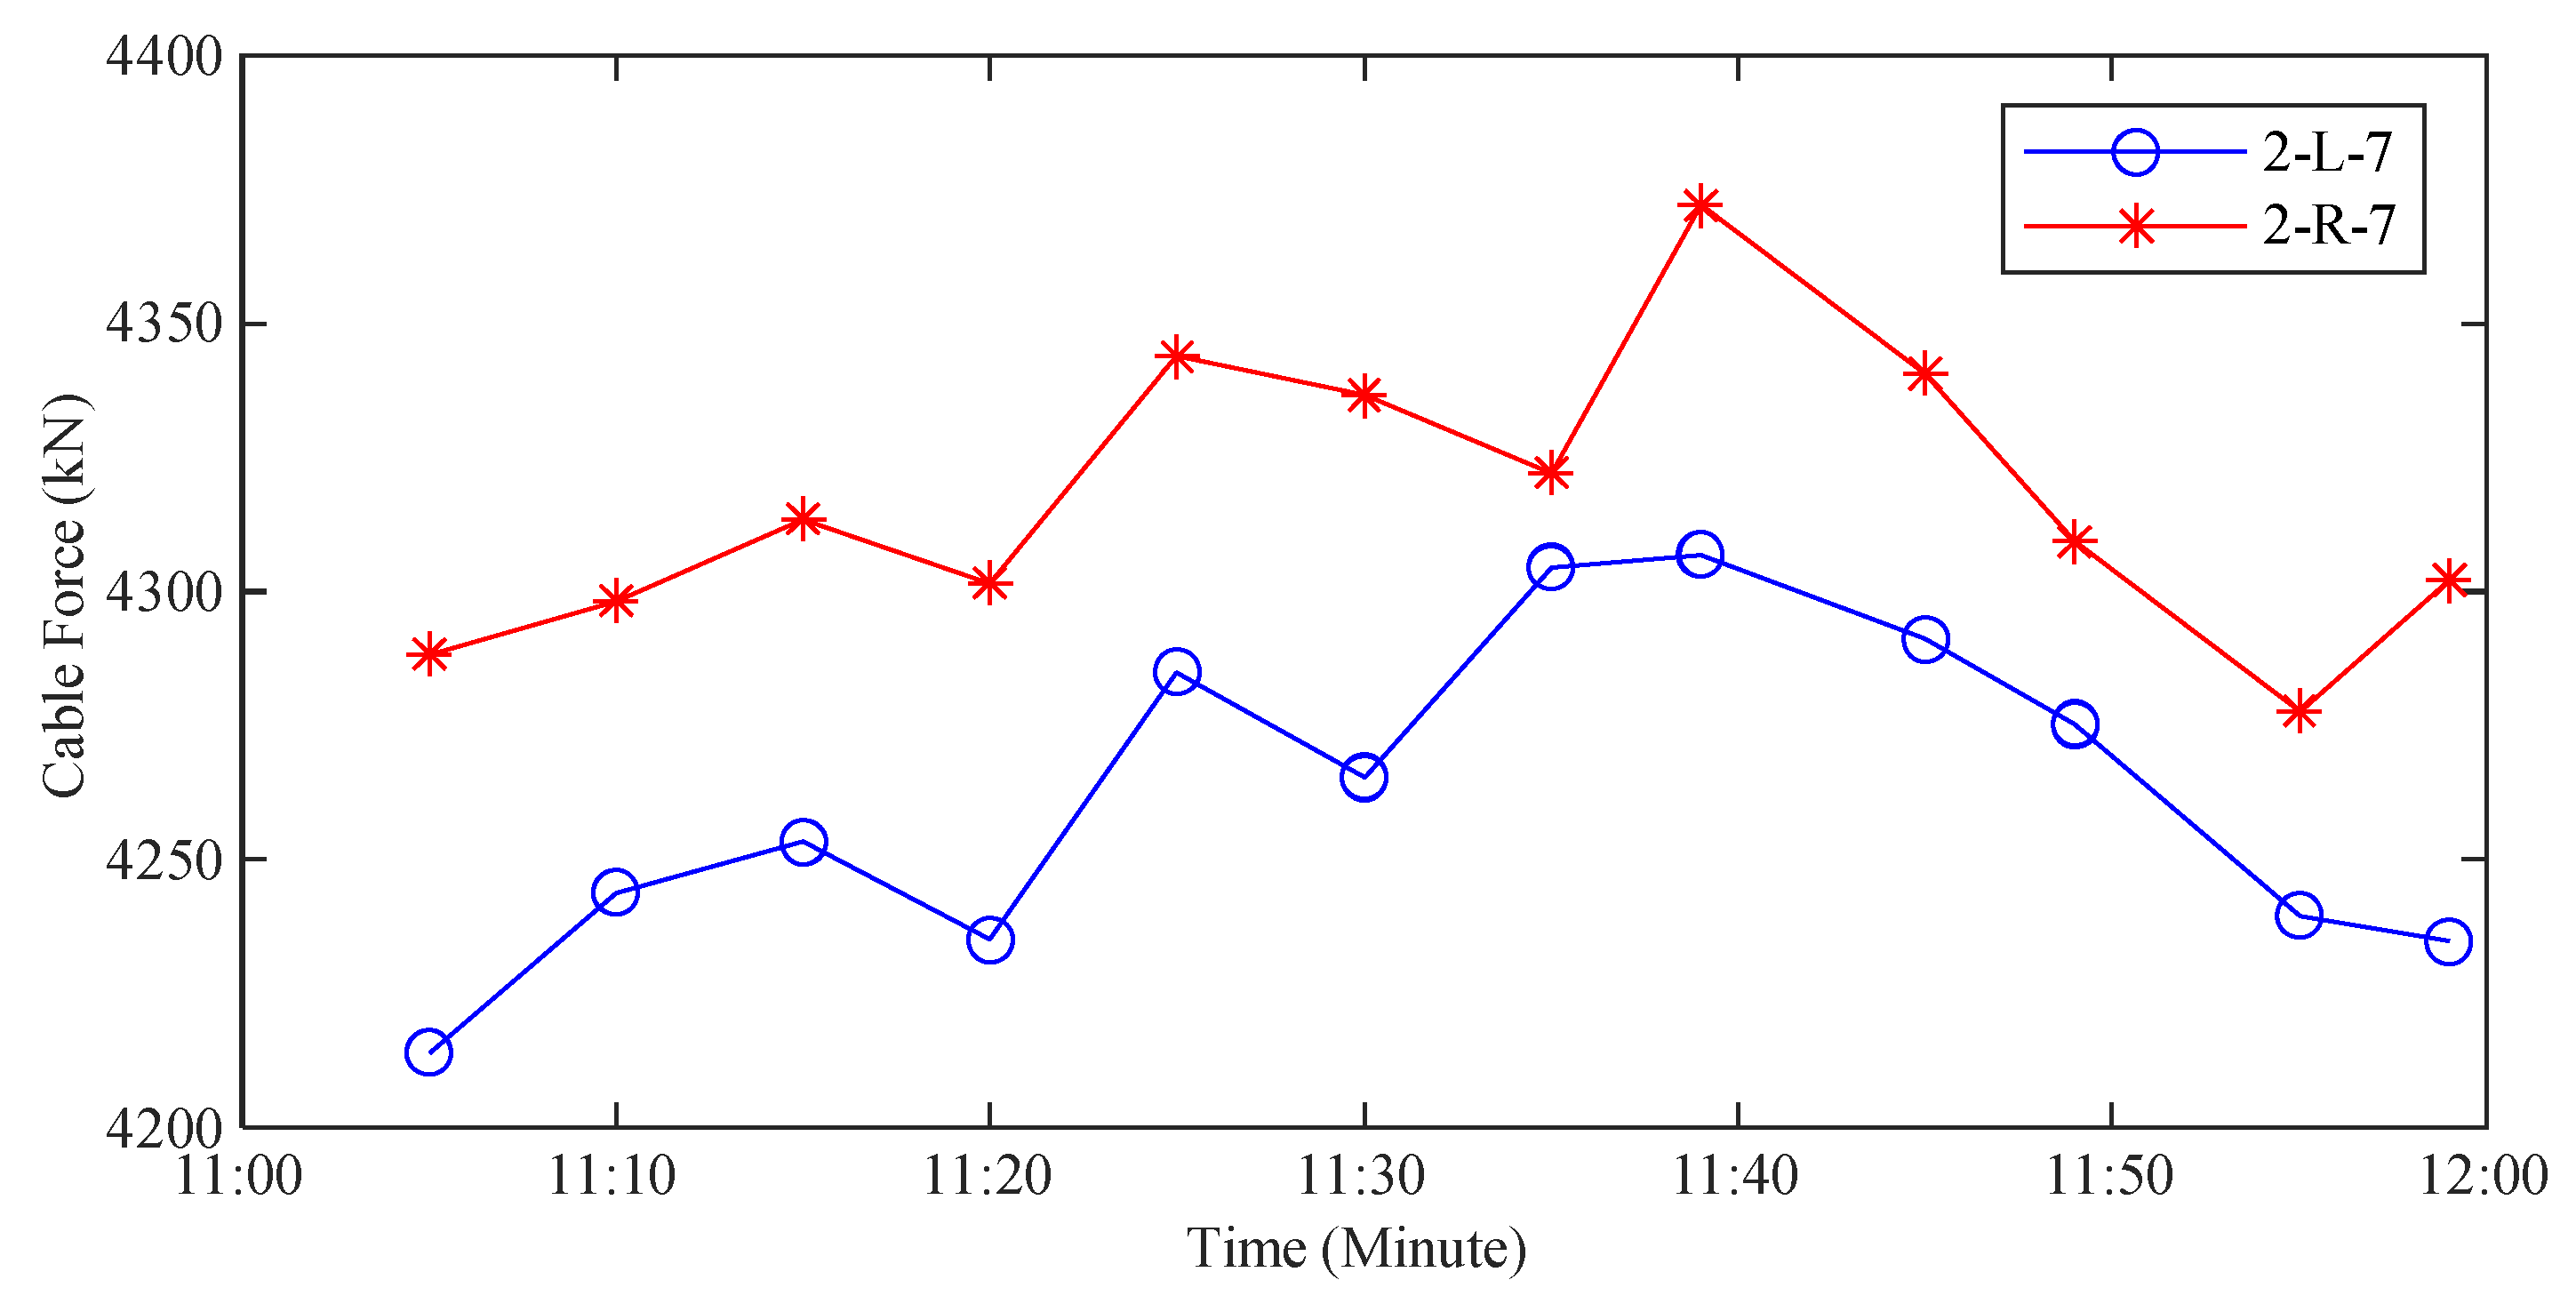
The actual measurement results of the cable force from the on-site monitoring system have verified the accuracy and stability of the method proposed in the paper. The average relative deviation of the actual measured cable force does not exceed 3.0%, and the maximum relative deviation does not exceed 4.0%. Two symmetrically positioned cables were extracted for comparative analysis, and the trend of cable-force changes of the two cables was consistent. This indicates that the method proposed in the paper can effectively measure the trend in cable-force changes in long-span bridges.
(3)
The cable-force measurement method has been applied to the operation and maintenance phase of the Gengcun Dou Bridge for cable-force monitoring, achieving rapid measurement of cable forces for large-span bridge structures. This method has a clear principle and simple installation, providing a novel method for the actual measurement of cable forces in large-span bridge structures. It can offer reliable cable-force monitoring data for structural status analysis during the operation and the maintenance phase.
The findings of this study facilitate high-precision measurement of cable forces over specific lengths. Nevertheless, the methodology exhibits limitations when applied to shorter cables (ψ < 50), which present persistent challenges in cable-force assessment due to their beam-like behavior. Future research will aim to address these deficiencies and improve the measurement accuracy for cables with small ψ.

Author Contributions

Conceptualization, H.L. and W.F.; methodology, W.F.; software, Y.C.; validation, H.L.; formal analysis, B.L.; investigation, Y.C. and B.L.; resources, B.L.; data curation, Y.L.; writing—original draft, H.L.; writing—review and editing, W.F.; visualization, Y.L.; project administration, Y.C.; funding acquisition, Y.C. All authors have read and agreed to the published version of the manuscript.

Funding

This work was supported by the Zhejiang Provincial Key Research and Development Program (2021C03154) and the National Natural Science Foundation of China (Grant Nos. 51878235, 51778568, 51578491).

Data Availability Statement

All data, models, or codes that support the findings of this study are available from the corresponding author on reasonable request.

Conflicts of Interest

The all authors declare that the research was conducted in the absence of any commercial or financial relationships that could be construed as a potential conflict of interest.

References

  1. Li, H.; Ou, J. The State of the Art in Structural Health Monitoring of Cable-Stayed Bridges. J. Civ. Struct. Health Monit. 2016, 6, 43–67. [Google Scholar] [CrossRef]
  2. Brownjohn, J.M.W. Structural Health Monitoring of Civil Infrastructure. Philos. Trans. R. Soc. A Math. Phys. Eng. Sci. 2007, 365, 589–622. [Google Scholar] [CrossRef] [PubMed]
  3. Kim, B.H.; Park, T. Estimation of Cable Tension Force Using the Frequency-Based System Identification Method. J. Sound Vib. 2007, 304, 660–676. [Google Scholar] [CrossRef]
  4. Cho, S.; Yim, J.; Shin, S.W.; Jung, H.-J.; Yun, C.-B.; Wang, M.L. Comparative Field Study of Cable Tension Measurement for a Cable-Stayed Bridge. J. Bridge Eng. 2013, 18, 748–757. [Google Scholar] [CrossRef]
  5. Duan, Y.F.; Zhang, R.; Dong, C.Z.; Luo, Y.Z.; Or, S.W.; Zhao, Y.; Fan, K.Q. Development of Elasto-Magneto-Electric (EME) Sensor for In-Service Cable Force Monitoring. Int. J. Struct. Stab. Dyn. 2016, 16, 1640016. [Google Scholar] [CrossRef]
  6. Yao, Y.; Yan, M.; Bao, Y. Measurement of Cable Forces for Automated Monitoring of Engineering Structures Using Fiber Optic Sensors: A Review. Autom. Constr. 2021, 126, 103687. [Google Scholar] [CrossRef]
  7. Zheng, R.; Liu, L.; Zhao, X.; Chen, Z.; Zhang, C.; Hua, X. Investigation of Measurability and Reliability of Adhesive-Bonded Built-in Fiber Bragg Grating Sensors on Steel Wire for Bridge Cable Force Monitoring. Meas. J. Int. Meas. Confed. 2018, 129, 349–357. [Google Scholar] [CrossRef]
  8. Li, X.X.; Ren, W.X.; Bi, K.M. FBG Force-Testing Ring for Bridge Cable Force Monitoring and Temperature Compensation. Sens. Actuators A Phys. 2015, 223, 105–113. [Google Scholar] [CrossRef]
  9. Fu, W.W.; Luo, Y.Z.; Wan, H.P.; Shen, Y.B.; Li, J.L.; Chen, L.M. Research on a Cable Force Measurement Method of National Speed Skating Oval Based on Surface Strain. China Civ. Eng. J. 2022, 55, 91–96. [Google Scholar]
  10. Kim, S.T.; Park, Y.; Park, S.Y.; Cho, K.; Cho, J.-R. A Sensor-Type PC Strand with an Embedded FBG Sensor for Monitoring Prestress Forces. Sensors 2015, 15, 1060–1070. [Google Scholar] [CrossRef]
  11. Zhou, Y.S.; An, P.; Cao, J.J.; Zhang, J.N.; Liu, C. Design of By-Pass Excitation Cable Force Sensor. J. Phys. Conf. Ser. 2019, 1267, 12068. [Google Scholar] [CrossRef]
  12. Haji Agha Mohammad Zarbaf, S.E.; Norouzi, M.; Allemang, R.; Hunt, V.; Helmicki, A.; Venkatesh, C. Vibration-Based Cable Condition Assessment: A Novel Application of Neural Networks. Eng. Struct. 2018, 177, 291–305. [Google Scholar] [CrossRef]
  13. Sim, S.H.; Li, J.; Jo, H.; Park, J.W.; Cho, S.; Spencer, B.F.; Jung, H.J. A Wireless Smart Sensor Network for Automated Monitoring of Cable Tension. Smart Mater. Struct. 2014, 23, 025006. [Google Scholar] [CrossRef]
  14. Amabili, M.; Carra, S.; Collini, L.; Garziera, R.; Panno, A. Estimation of Tensile Force in Tie-Rods Using a Frequency-Based Identification Method. J. Sound Vib. 2010, 329, 2057–2067. [Google Scholar] [CrossRef]
  15. Fang, Z.; Wang, J.Q. Practical Formula for Cable Tension Estimation by Vibration Method. J. Bridge Eng. 2012, 17, 161–164. [Google Scholar] [CrossRef]
  16. Zuo, D.; Jones, N.P. Interpretation of Field Observations of Wind- and Rain-Wind-Induced Stay Cable Vibrations. J. Wind Eng. Ind. Aerodyn. 2010, 98, 73–87. [Google Scholar] [CrossRef]
  17. Li, X.; Huang, X.; Ding, P.; Wang, Q.; Wang, Q. Research on an Intelligent Identification Method for Cable-Stayed Force with a Damper Based on Microwave Radar Measurements. Buildings 2024, 14, 568. [Google Scholar] [CrossRef]
  18. Yu, S.; Zhang, J.; Su, Z.; Jiang, P. Fast and Robust Vision-Based Cable Force Monitoring Method Free from Environmental Disturbances. Mech. Syst. Signal Process. 2023, 201, 110617. [Google Scholar] [CrossRef]
  19. Zhang, L.; Qiu, G.; Chen, Z. Structural Health Monitoring Methods of Cables in Cable-Stayed Bridge: A Review. Meas. J. Int. Meas. Confed. 2021, 168, 108343. [Google Scholar] [CrossRef]
  20. Weng, J.; Chen, L.; Sun, L.; Zou, Y.; Liu, Z.; Guo, H. Fully Automated and Non-Contact Force Identification of Bridge Cables Using Microwave Remote Sensing. Meas. J. Int. Meas. Confed. 2023, 209, 112508. [Google Scholar] [CrossRef]
  21. Zhao, X.; Han, R.; Yu, Y.; Hu, W.; Jiao, D.; Mao, X.; Li, M.; Ou, J. Smartphone-Based Mobile Testing Technique for Quick Bridge Cable–Force Measurement. J. Bridge Eng. 2017, 22, 06016012. [Google Scholar] [CrossRef]
  22. Ye, X.W.; Que, W.M.; Ding, Y.; Jin, T. Fast Force Estimation of Cable Structures Using Smartphone-Captured Video and Template Matching Algorithm. Struct. Control Health Monit. 2024, 2024, 5512085. [Google Scholar] [CrossRef]
  23. Du, W.; Lei, D.; Bai, P.; Zhu, F.; Huang, Z. Dynamic Measurement of Stay-Cable Force Using Digital Image Techniques. Meas. J. Int. Meas. Confed. 2020, 151, 107211. [Google Scholar] [CrossRef]
  24. Kim, S.W.; Cheung, J.H.; Park, J.B.; Na, S.O. Image-Based Back Analysis for Tension Estimation of Suspension Bridge Hanger Cables. Struct. Control Health Monit. 2020, 27, e2508. [Google Scholar] [CrossRef]
  25. Feng, D.; Scarangello, T.; Feng, M.Q.; Ye, Q. Cable Tension Force Estimate Using Novel Noncontact Vision-Based Sensor. Meas. J. Int. Meas. Confed. 2017, 99, 44–52. [Google Scholar] [CrossRef]
  26. Chen, C.-C.; Tseng, H.-Z.; Wu, W.-H.; Chen, C.-H. Modal Frequency Identification of Stay Cables with Ambient Vibration Measurements Based on Nontarget Image Processing Techniques. Adv. Struct. Eng. 2012, 15, 929–942. [Google Scholar] [CrossRef]
  27. Chu, C.; Ghrib, F.; Cheng, S. Cable Tension Monitoring through Feature-Based Video Image Processing. J. Civ. Struct. Health Monit. 2021, 11, 69–84. [Google Scholar] [CrossRef]
  28. Tian, Y.; Zhang, C.; Jiang, S.; Zhang, J.; Duan, W. Noncontact Cable Force Estimation with Unmanned Aerial Vehicle and Computer Vision. Comput. Civ. Infrastruct. Eng. 2021, 36, 73–88. [Google Scholar] [CrossRef]
  29. Li, S.; Cao, Z.; Li, J.; Li, P.; Xu, B.; Gao, W. Complex Background Removal Method for Video of an Inclined Cable Based on UAV Detection of Structural Vibration Frequencies. Struct. Control Health Monit. 2024, 2024, 1630928. [Google Scholar] [CrossRef]
  30. Deng, L.; Yan, W.C.; Li, S.F. Computer Modeling and Weight Limit Analysis for Bridge Structure Fatigue Using OpenSEES. J. Bridge Eng. 2019, 24, 4019081. [Google Scholar] [CrossRef]
  31. Jiang, T.; Frøseth, G.T.; Rønnquist, A.; Fagerholt, E. A Robust Line-Tracking Photogrammetry Method for Uplift Measurements of Railway Catenary Systems in Noisy Backgrounds. Mech. Syst. Signal Process. 2020, 144, 106888. [Google Scholar] [CrossRef]
  32. Canny, J. A Computational Approach to Edge Detection. IEEE Trans. Pattern Anal. Mach. Intell. 1986, PAMI-8, 679–698. [Google Scholar] [CrossRef]
  33. Grompone von Gioi, R.; Jakubowicz, J.; Morel, J.-M.; Randall, G. LSD: A Line Segment Detector. Image Process. Line 2012, 2, 35–55. [Google Scholar] [CrossRef]
  34. Jana, D.; Nagarajaiah, S.; Yang, Y. Computer Vision-Based Real-Time Cable Tension Estimation Algorithm Using Complexity Pursuit from Video and Its Application in Fred-Hartman Cable-Stayed Bridge. Struct. Control Health Monit. 2022, 29, e2985. [Google Scholar] [CrossRef]
  35. Fan, G.; Li, J.; Hao, H. Improved Automated Operational Modal Identification of Structures Based on Clustering. Struct. Control Health Monit. 2019, 26, e2450. [Google Scholar] [CrossRef]
  36. Ren, W.-X.; Zong, Z.-H. Output-Only Modal Parameter Identification of Civil Engineering Structures. Struct. Eng. Mech. 2004, 17, 429–444. [Google Scholar] [CrossRef]
  37. Ren, W.X.; Chen, G.; Hu, W.H. Empirical Formulas to Estimate Cable Tension by Cable Fundamental Frequency. Struct. Eng. Mech. 2005, 20, 363–380. [Google Scholar] [CrossRef]
  38. Xu, M.; Xu, Q.; Zeng, B.; Li, J.Z. Unified Presumption Formula for Estimating Cable Force by Frequency Test Method Considering Service Characteristics. J. Build. Struct. 2023, 44, 456–473. [Google Scholar]
Figure 1. Line-tracking photogrammetry of ROI for cropped image.
Buildings 14 01941 g001
Figure 2. Mechanical model of cable.
Buildings 14 01941 g002
Figure 3. Flowsheet of calculation of cable force.
Buildings 14 01941 g003
Figure 4. Gencun Dou Bridge in Zhejiang Province (China).
Buildings 14 01941 g004
Figure 5. Sensor locations and structural health monitoring systems.
Buildings 14 01941 g005
Figure 6. Selected cables for dynamic response evaluation.
Buildings 14 01941 g006
Figure 7. Identified time histories of displacement and acceleration for 2−L−7.
Buildings 14 01941 g007
Figure 8. Estimated first natural frequency of 2−L−7.
Buildings 14 01941 g008
Figure 9. Time histories of acceleration of 2−R−7 at different locations.
Buildings 14 01941 g009
Figure 10. Frequency components of 2−R−7 at three different locations.
Buildings 14 01941 g010
Figure 11. Time histories of estimated cable force.
Buildings 14 01941 g011
Table 1. μ1 and μ2 for different stay cables [38].
Boundary ConditionsRaito of Cable Length and DiameterCharacteristic Parameters
μ1μ2
Hinged50 < ψ ≤ 1504π2
Ψ > 15040
Fixed50 < ψ ≤ 1503.94−61.62
Ψ > 1503.940
Table 2. Geometric feature of stayed cables.
No.TypeEffective Length (m)Mass per Unit Length
(kg/m)
Axial Stiffness (KN)
1-L-1PESM 7-18779.45 56.294979
1-L-2PESM 7-18773.19 56.294897
1-L-3PESM 7-18765.35 56.294875
1-L-4PESM 7-18757.56 56.294809
1-L-5PESM 7-18749.87 56.294749
1-L-6PESM 7-18742.27 56.294705
1-L-7PESM 7-18734.78 56.294621
1-L-8PESM 7-18727.39 56.294579
“PESM 7-187” represents “hot-extruding PE protection with 7 mm steel wire diameter and the wire number of 187 parallel wire system”; “axial stiffness” represents the designed axial force.
Table 3. Main parameters of four cables.
Serial NumberDiameter (mm)Effective Length (m)Mass per Unit Length (kg/m)Axial Stiffness (kN)
2-L-795.734.7856.294621
2-R-795.734.7856.294621
2-L-895.727.3956.294579
2-R-895.727.3956.294579
Table 4. Comparison of different cable-force measurement methods.
Serial NumberEstimated Cable Force (kN)Differences in Estimation
Image-BasedSensor-Based
2-L-74256.54377.6−2.77%
2-R-74312.74357.6−1.03%
2-L-84580.84706.5−2.67%
2-R-84856.74695.63.43%
Disclaimer/Publisher’s Note: The statements, opinions and data contained in all publications are solely those of the individual author(s) and contributor(s) and not of MDPI and/or the editor(s). MDPI and/or the editor(s) disclaim responsibility for any injury to people or property resulting from any ideas, methods, instructions or products referred to in the content.

