Article

Examination of Damage Evolution in Slurry Masonry Schist Subjected to Biaxial Compressive Stresses

1
College of Civil Engineering, Hebei University of Architecture, Zhangjiakou 075000, China
2
China Railway Design Group Limited, Tianjin 300380, China
3
No. 3 Geological Brigade, Hebei Provincial Geological Prospec Ting Bureau, Zhangjiakou 075000, China
*
Author to whom correspondence should be addressed.
Buildings 2024, 14(7), 1942; https://doi.org/10.3390/buildings14071942
Submission received: 28 April 2024 / Revised: 9 June 2024 / Accepted: 21 June 2024 / Published: 26 June 2024
(This article belongs to the Special Issue Building Foundation Analysis: Soil–Structure Interaction)

Abstract

:
This study used a static bidirectional multifunctional loading system. The system conducted bidirectional compression tests on scaled specimens of slurry masonry schist under freeze–thaw cycling conditions. This study aimed to investigate the influence of bidirectional stress coupling with freeze–thaw cycles on the mechanical properties of slurry masonry schist. The results indicate that lateral pressure can increase the peak stress of slurry masonry schist, while freeze–thaw cycles have an adverse effect on the material’s internal pore structure, counteracting the gain effect of lateral pressure. This study also employed acoustic emission (AE) technology to analyze the evolution of slurry masonry schist failure characteristics. The findings reveal that freeze–thaw cycles accelerate the failure of slurry masonry schist during loading, and lateral pressure to some extent mitigates the damage development of slurry masonry schist. The synergistic effect of lateral pressure and freeze–thaw cycles alters the fracture mode of slurry masonry schist. Acoustic emission signal localization demonstrates numerous AE localization points in the interface transition zone, forming a coherent signal band where cracks propagate toward complete interface penetration. The crack extension process of the slurry masonry schist was investigated using the digital image correlation (DIC) method. The results indicated that macroscopic cracks formed in the strain localization zone, resulting in fracture damage to the specimens, with interfacial debonding identified as the primary failure mode for slurry masonry schist structures.

1. Introduction

In the context of high-speed railroad and highway construction in China, slurry masonry schist lattice berms are extensively employed because of their convenient and cost-effective attributes. In service, slurry masonry schist often experiences biaxial forces; damage to slurry masonry schist under two-way coupling mechanics can occur prematurely, leading to potential safety hazards and, possibly, serious economic losses. In addition, frost damage has become a major problem for slope protection in cold regions. Understanding the effects of coupled biaxial stresses and freeze–thaw cycles on the damage evolution of slurry masonry schist can help to evaluate and predict the performance of slurry masonry structures under a variety of stresses and environmental conditions and improve the safety and durability of these structures.
Current research on slurry masonry schist slope protection has focused on the overall stability of slopes [1,2], and several scholars have established slope models through numerical simulation software to study the effects of freeze–thaw cycles, herbaceous root systems, and other factors on slope stability [3,4,5,6]. Several scholars have achieved good results by designing lattice beams and anchor cables to improve the overall stability of slopes [7,8,9,10]. Slurry masonry schist, a combination of schist and mortar, is different from ordinary concrete. The aggregate size of slurry masonry schist is usually greater than 150 mm [11], and the proportion of aggregate is greater than 70%. Consequently, the fracture properties of slurry masonry schist diverge from those of ordinary concrete. Caliskan et al. [12] reported that the bonding behavior between schist and mortar is mechanical rather than chemical in nature. Li et al. [13] concluded that the damage in slurry masonry schist structures occurs mainly in the form of interfacial debonding damage and that the interfacial transition zone (ITZ) between schist and mortar is the weakest place. Furthermore, several scholars have studied the debonding behavior of the interface transition zone between schist and mortar [14,15].
Numerous studies have analyzed the bidirectional force properties of cementitious materials to investigate the effect of coupled bidirectional forces on the mechanical properties of cementitious materials. Several scholars have investigated the effect of particle size on cementitious materials under biaxial loading [16,17,18]. Murad et al. [19] developed a model for predicting the shear strength of concrete columns under biaxial stresses by employing pertinent technical methods. Van Mier [20] examined the impact of structural effects on concrete softening during multiaxial compression. Shang et al. [21] explored the influence of freeze–thaw cycles on the strength and deformation of concrete under biaxial compression, proposing an equation to determine biaxial compressive strength in principal stress space. Zhu et al. [22] innovatively simulated the process of damage development in concrete subjected to biaxial loading by employing a correlation model grounded in elastic mechanics. Tschegg et al. [23] investigated type I fracture behavior of concrete subjected to biaxial loading. The dynamic mechanical properties of cementitious materials under biaxial loading have also been investigated by several scholars [24,25,26]. Li Z et al. [27] investigated the impact resistance of mortar–rock berm structures based on fracture mechanics theory.
Structural damage and crack formation under loading typically occur gradually. Therefore, continuous monitoring of damage and deformation throughout the loading process is imperative. Nondestructive testing techniques have been used by many scholars to study the damage mechanisms of materials. The current nondestructive testing techniques for cementitious materials mainly include digital image correlation (DIC) and acoustic emission analysis. DIC acquires the displacement field of the surface by analyzing the changes in the three-dimensional coordinates of each point in the measurement area at various deformation states and subsequently computes the strain field of the surface. Crack expansion has also been monitored using DIC during the deformation of cementitious materials to provide information on the evolution of the interface in the cracked zone [28,29,30,31,32]. Boulekbache et al. [33] employed DIC to analyze the fracture mechanism of steel fiber-reinforced concrete during tensile splitting. Huang et al. [34] investigated the deformation field of concrete under axial pressure based on DIC. The acoustic emission technique is extensively employed in the nondestructive evaluation of engineering structures. Li D et al. [35] investigated the evolution of the fracture process zone (FPZ) under static and fatigue loading using DIC analysis. Lakavath C et al. [36] employed DIC technology to identify the loading of interface shear cracks and potential failure modes, proposing a simplified model for load-bearing interface shear. Additionally, several scholars have conducted nondestructive testing to assess damage in concrete structures by analyzing acoustic emission data. Ohno et al. [37] classified concrete cracks based on acoustic emission data. Grosse [38] et al. quantitatively evaluated the fracture process of concrete based on acoustic emission data. Sagar [39] et al. investigated the fracture mechanism of concrete and mortar specimens based on the acoustic emission b-value. Zhang H et al. [40] investigated the dynamic tensile fracture characteristics of steel fiber-reinforced concrete using AE technology, enabling early warning of the critical stage under freeze–thaw cycling conditions. Barbosh M et al. [41] proposed a damage identification method combining multi-dimensional empirical mode decomposition (MEMD) and a Gaussian mixture model (GMM) using AE as the basis. Several scholars have studied the fracture behavior of concrete by combining DIC and acoustic emission techniques [42,43,44].
In this study, porous basalt, which is common in North China, was selected as the coarse aggregate for slurry masonry schist, and biaxial compression tests with different lateral pressures (LP) coupled with freeze–thaw cycles (FT) were carried out. Acoustic emission and DIC techniques were used to monitor the whole test process. The damage mode and damage mechanism of the slurry masonry schist were evaluated by closely monitoring the changes in the strain field on the surface of the specimen and collecting the acoustic signals generated by internal damage occurring in the material; these data were statistically processed and analyzed.

2. Test Profile

2.1. Test Preparation

The experiment employed porous basalt as the coarse aggregate for the slurry schist, utilizing Chinese standard (GB 175-99) PO.42.5 ordinary Portland cement as the cement [13] and medium sand as the fine aggregate. Since the grain sizes of the schist specimens were larger than 150 mm, the slurry schist structure was scaled down by a ratio of 1:2 according to similarity theory; hence, the grain size of the schist was set to 60~90 mm. The chemical composition of the porous basalt was measured via X-ray fluorescence analysis. The relevant technical indexes are shown in Table 1, Table 2 and Table 3. Under actual engineering conditions, the coarse aggregate in slurry masonry schist accounts for a large proportion of the total coarse aggregate; hence, the coarse aggregate content was set to 75%. The slurry masonry schist mix ratios are shown in Table 4. The specimen preparation was divided into five steps as follows:
  • Water, sand, and cement were mixed in the appropriate proportions with a mixer until the water was thoroughly incorporated and the consistency was suitable; at this point, the mortar mixing was complete.
  • To ensure that the sample was released from the mold smoothly, the bottom of the 300 mm × 300 mm × 80 mm mold was brushed with oil in advance.
  • The mold was filled with the mixed cement mortar in layers. First, a layer of mortar was applied to the bottom of the mold, and the mortar surface was smoothed. Subsequently, the moistened schist was placed in the mold. A concrete vibration table was used to vibrate the mold, and the samples were allowed to harden for 24 h after demolding.
  • The demolded specimens were transferred to a standard curing room set at a temperature of 20 °C and a relative humidity of 95% for the duration of 28 days.
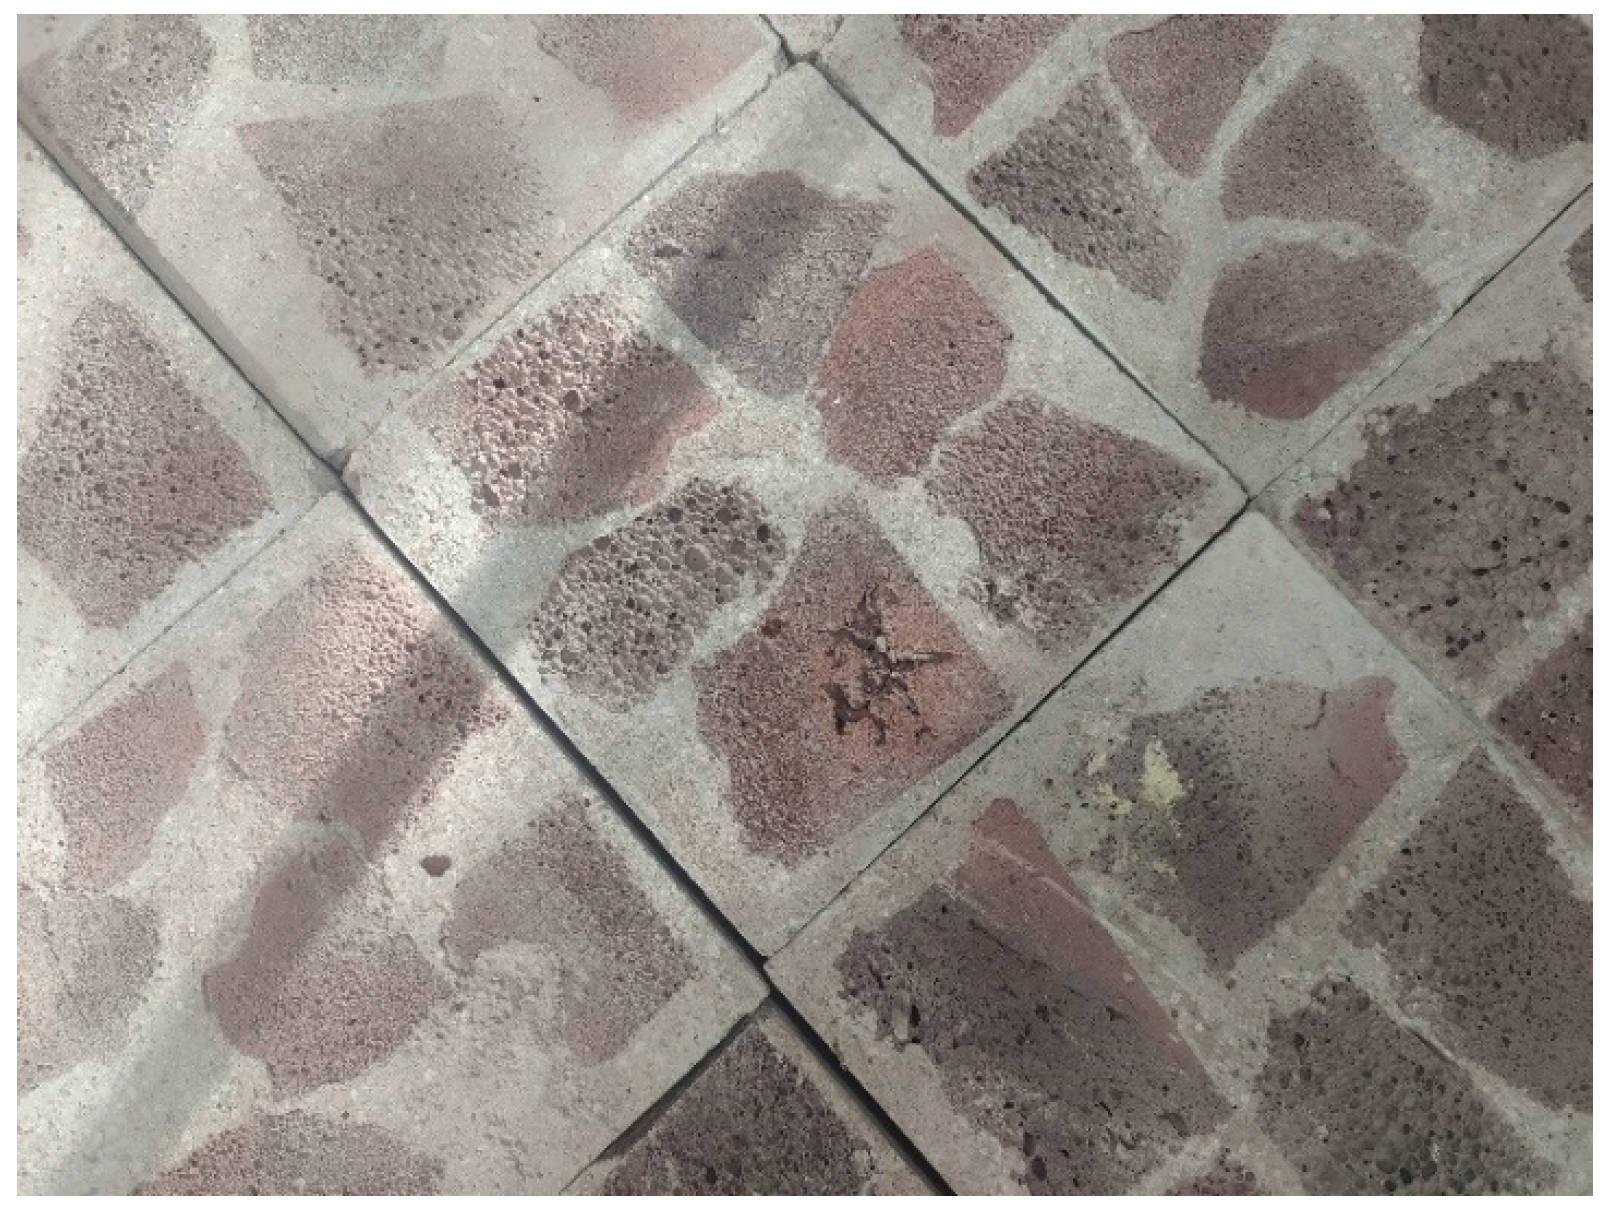
  • The surface of each slurry masonry specimen was polished, and Figure 1 shows a drawing of a polished slurry masonry specimen.
  • The slurry masonry schist was subjected to freeze–thaw cycles using a high- and low-temperature alternating test chamber. The cyclic temperature range was set to −20 °C to 20 °C, with each freeze–thaw cycle lasting 24 h. The number of freeze–thaw cycles was set to 0, 40, and 80, aligning with the climatic patterns in the North China region.
Table 1. Basic performance parameters of P.O42.5 cement.
Standard
Consistency/%
Fineness/mmInitial
Fluidity/mm
20 min Flow Rate/mmSolidification Time (min)24 h Compressive Strength/
MPa
24 h Flexural Strength/MPa
3 d7 d
29.80.03>195>18018037025.56.2
Table 2. Sand fineness and density.
Aperture Size7.5 mm4.5 mm2.5 mm1.25 mm600 µm300 µm≤150 µm
Subtotal sieve residue %0.10.310.218.526.444.20.3
Cumulative sieve rate %0.10.410.629.155.599.7100
Fineness modulus2.5 belongs to the medium sand aggregate
Packing density (g/cm3)1.45
Table 3. Chemical composition of the porous basalt.
Rock TypeChemical Composition (%)
Porous basaltSiO2CaOAl2O3MgOFe2O3
47.456.7515.185.4216.03
Na2OK2OTiO2SO3-
4.301.743.080.05-
Table 4. Slurry masonry schist mixing ratio.
Mortar:AggregateWater
(kg/m3)
Cement
(kg/m3)
Sand
(kg/m3)
Aggregate (kg/m3)
1:3280250.21208.35215.4
Figure 1. Slurry masonry schist specimen.
Buildings 14 01942 g001

2.2. Experimental Design
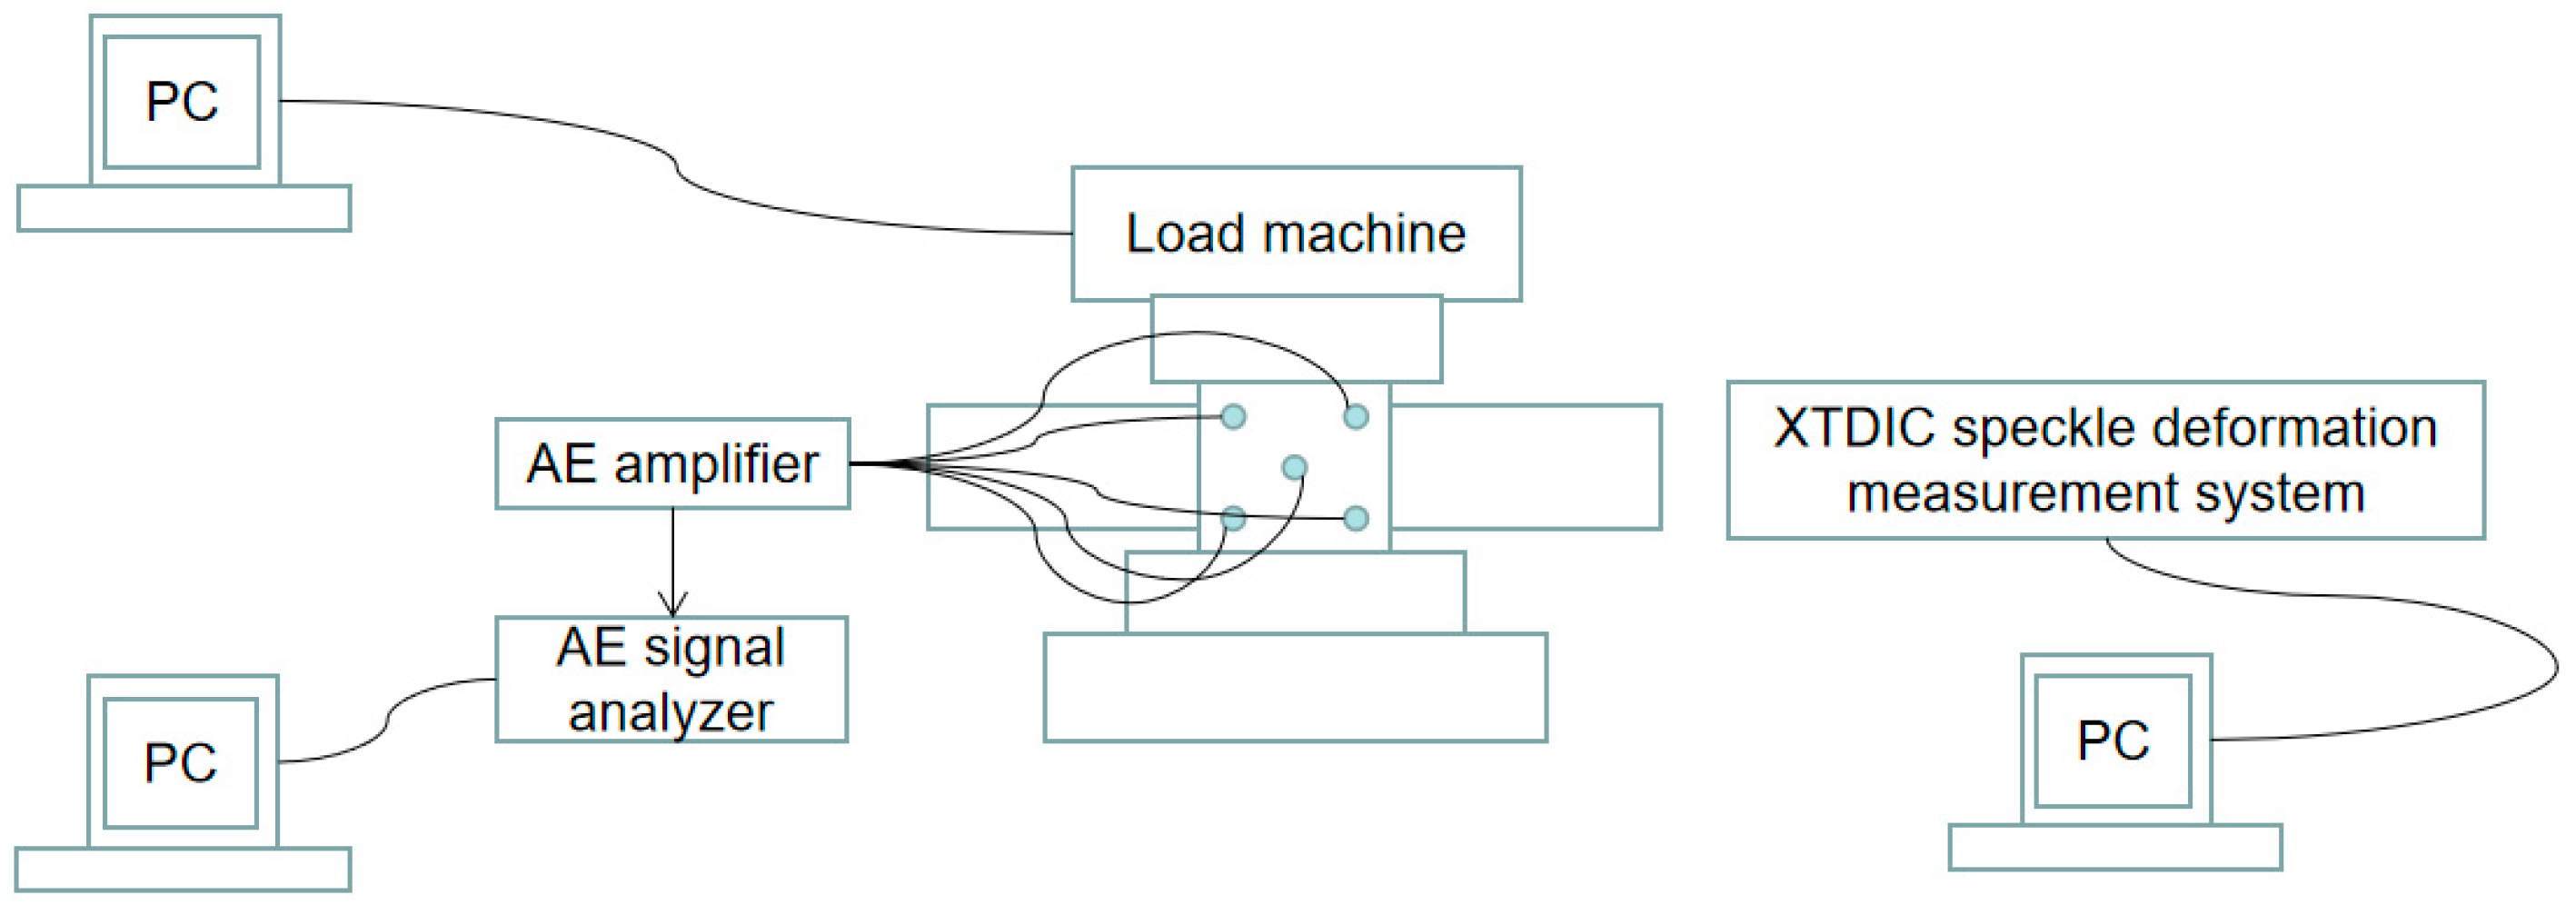
The stress states studied in this experiment included uniaxial and biaxial forces, as shown in Figure 2. In this study, constant lateral pressure loading was used, and the vertical pressure direction was specified as the main axial direction of loading. The compressive stress in the main axis direction was y, the horizontal direction was the direction of the loaded subaxis, and the compressive stress in the subaxis direction was x. To clarify the effect of lateral pressure on the mechanical properties of the slurry masonry schist, the horizontal pressure was set to 0, 0.2 fc, 0.4 fc, and 0.6 fc, where fc is the uniaxial compressive strength of the slurry masonry schist.
In this study, the fixed lateral pressure loading method was adopted. First, load control is adopted for the horizontal direction x. After reaching the set stress, the fixed lateral pressure was unchanged, and y was loaded according to the static loading rate (0.5 mm/min) until damage occurred in the specimen. The loading schematic is shown in Figure 3. In the process of slurry masonry schist pressurization, because of the different stiffnesses between the specimen and the loading plate, shear stress, resulting in uneven force on the specimen, affected the test results. To determine the real compressive strength, according to the research by Shiming et al. [45], two layers of butter were brushed between three layers of plastic film to reduce friction on the four sides.

2.3. Test Methods

To enhance the reliability of the acquired data, biaxial loading was conducted using a YDW-300/2 static two-way multifunctional loading test system manufactured by Jilin Guanteng Automation Technology Co. (Changchun, China). An XTDIC scattering deformation measurement system from Shenzhen Xintuo 3D Co. (Shenzhen, China). was employed in each test. Additionally, the DS-8 digital acoustic emission system manufactured by Beijing Soft Island Times Technology Co. (Beijing, China) was utilized. Figure 4 shows a schematic diagram depicting the test layout.

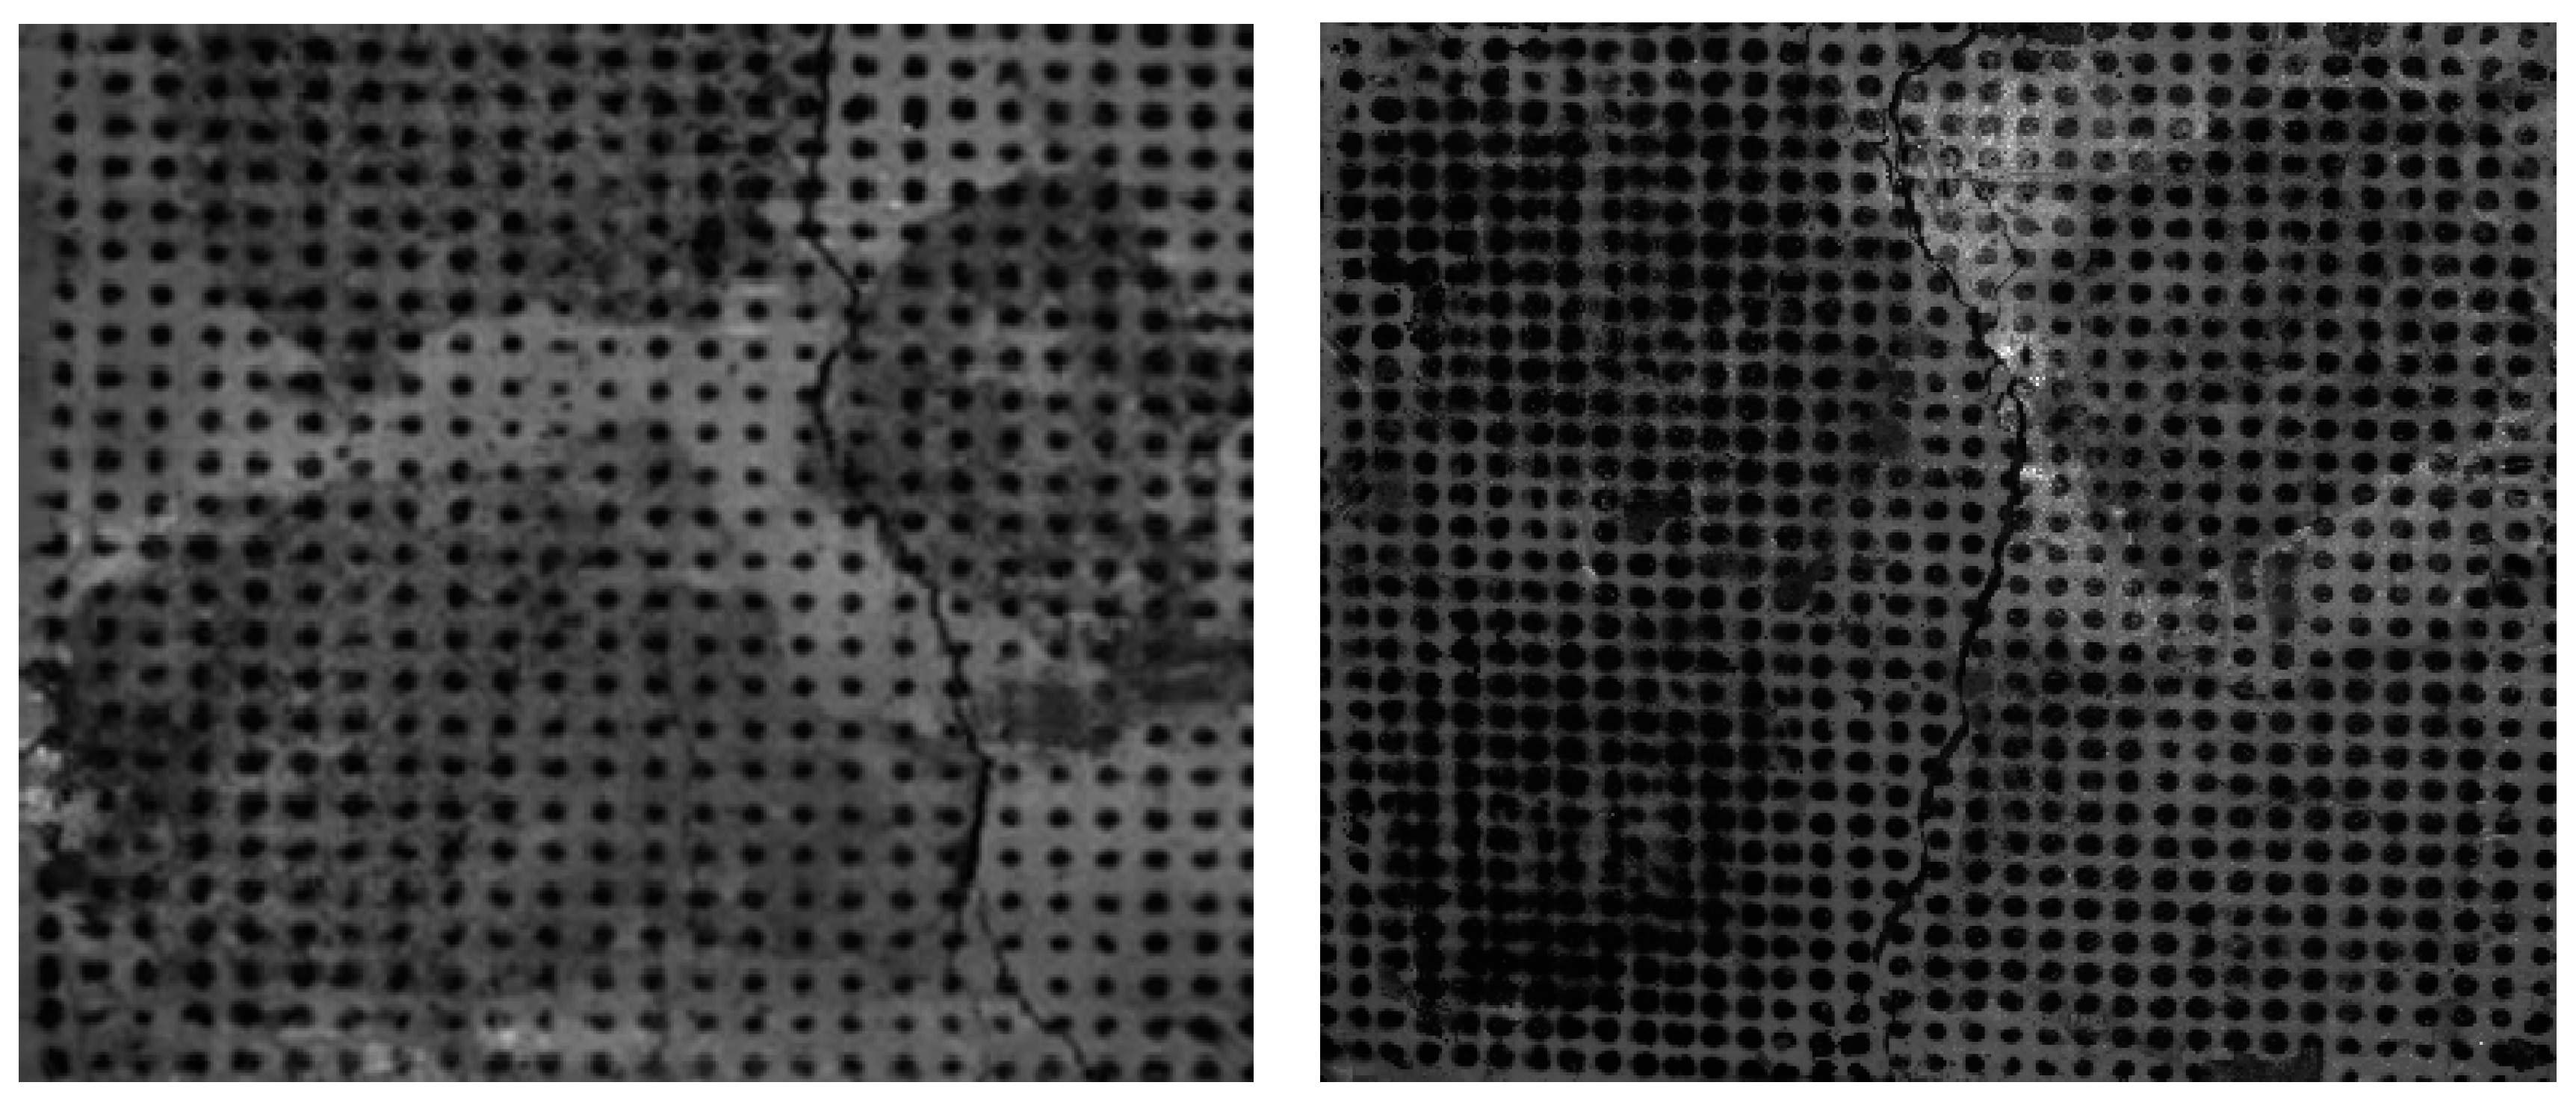
2.3.1. DIC Test Method

The DIC speckle deformation measurement system employs two high-precision cameras to capture real-time speckle images of the object at various deformation stages. It utilizes digital image correlation to match deformation points on the object’s surface and reconstructs the three-dimensional coordinates of surface calculation points based on the disparity data of each point and the pre-calibrated camera parameters. By comparing the changes in the three-dimensional coordinates of each point within the measurement area for each deformation state, the displacement field of the object’s surface is obtained, further calculating the strain field of the surface. The displacement and strain of the specimen were determined using Equations (1)–(3) [46]. The parameters of the DIC speckle deformation measurement system were configured as shown in Table 5. The testing standards were referenced from the study on the failure mechanism of slurry masonry schist conducted by Li et al. [13].
ε x x = 1 2 2 u x + u x 2 + v x 2
ε y y = 1 2 2 v y + u y 2 + v y 2
ε x y = 1 2 ( u y + v x ) + 1 2 ( u x u y + v x v y )
where ε x x , ε y y , and ε x y are the transverse strain, longitudinal strain, and shear strain, respectively, and u and v denote the displacement fields in the x- and y-axes, respectively.

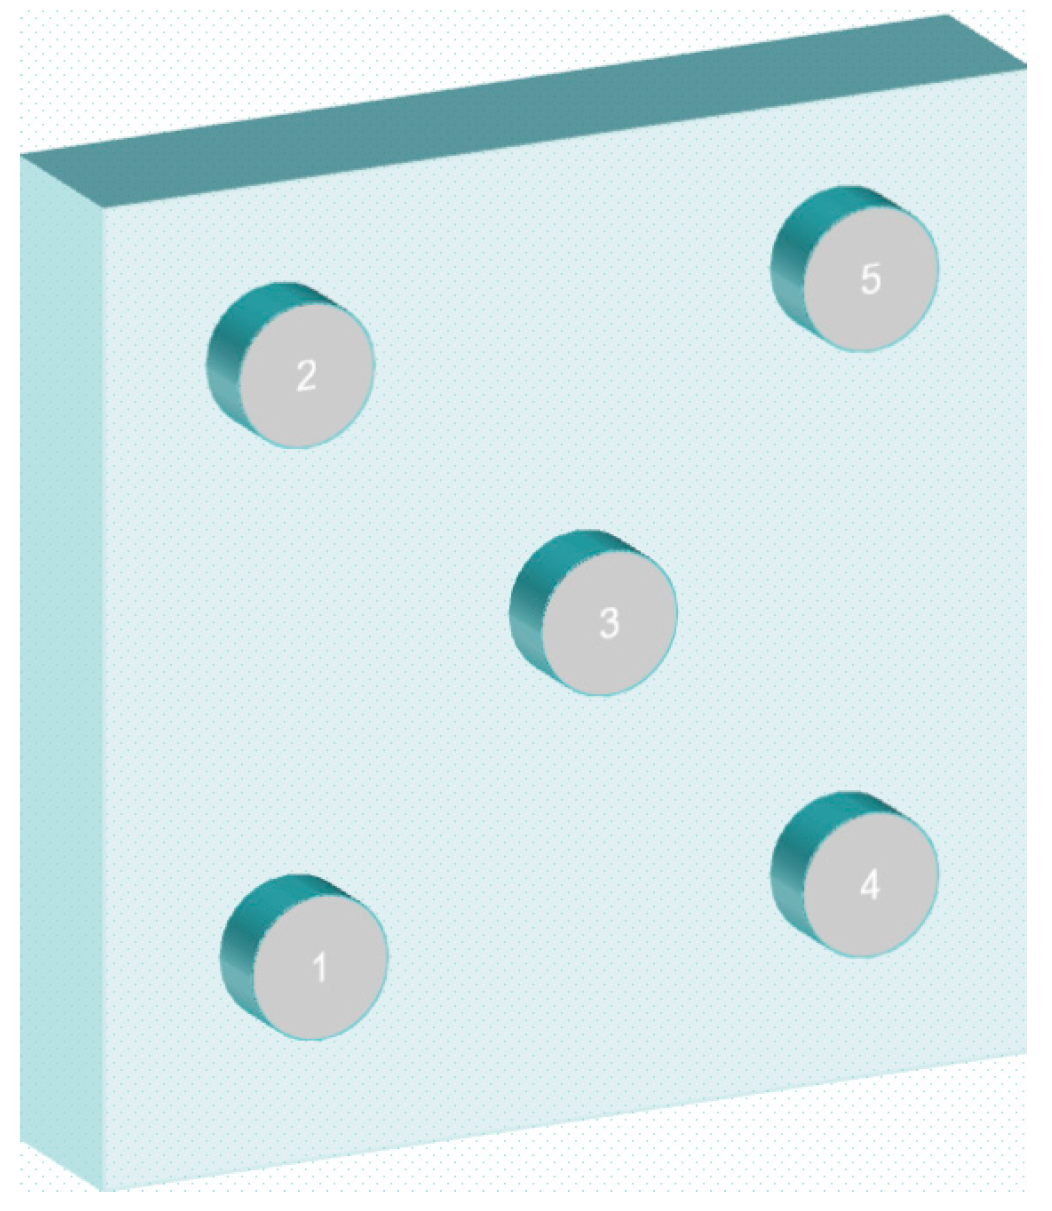
2.3.2. Acoustic Emission Test Method

The acoustic emission system consisted of a digital acoustic emission system, transducer, and preamplifier. During each test, the acoustic emission equipment collected, processed, and displayed the acoustic emission signal parameters in real time. The main parameters of the acoustic emission system are shown in Table 6. The testing standards were referenced from the study on the failure mechanism of slurry masonry schist conducted by Li et al. [13].
To enhance the conduction between the sensor and the slurry schist, the sensor was coupled to the slurry schist with petroleum jelly, and then the sensor was secured with electrical tape. A minimum of four sensors were needed to determine the spatial location of an acoustic emission source. To enhance the localization effect, five sensors were arranged on the surface of the slurry schist. The locations of the sensors are shown in Figure 5.

3. Test Results and Analysis

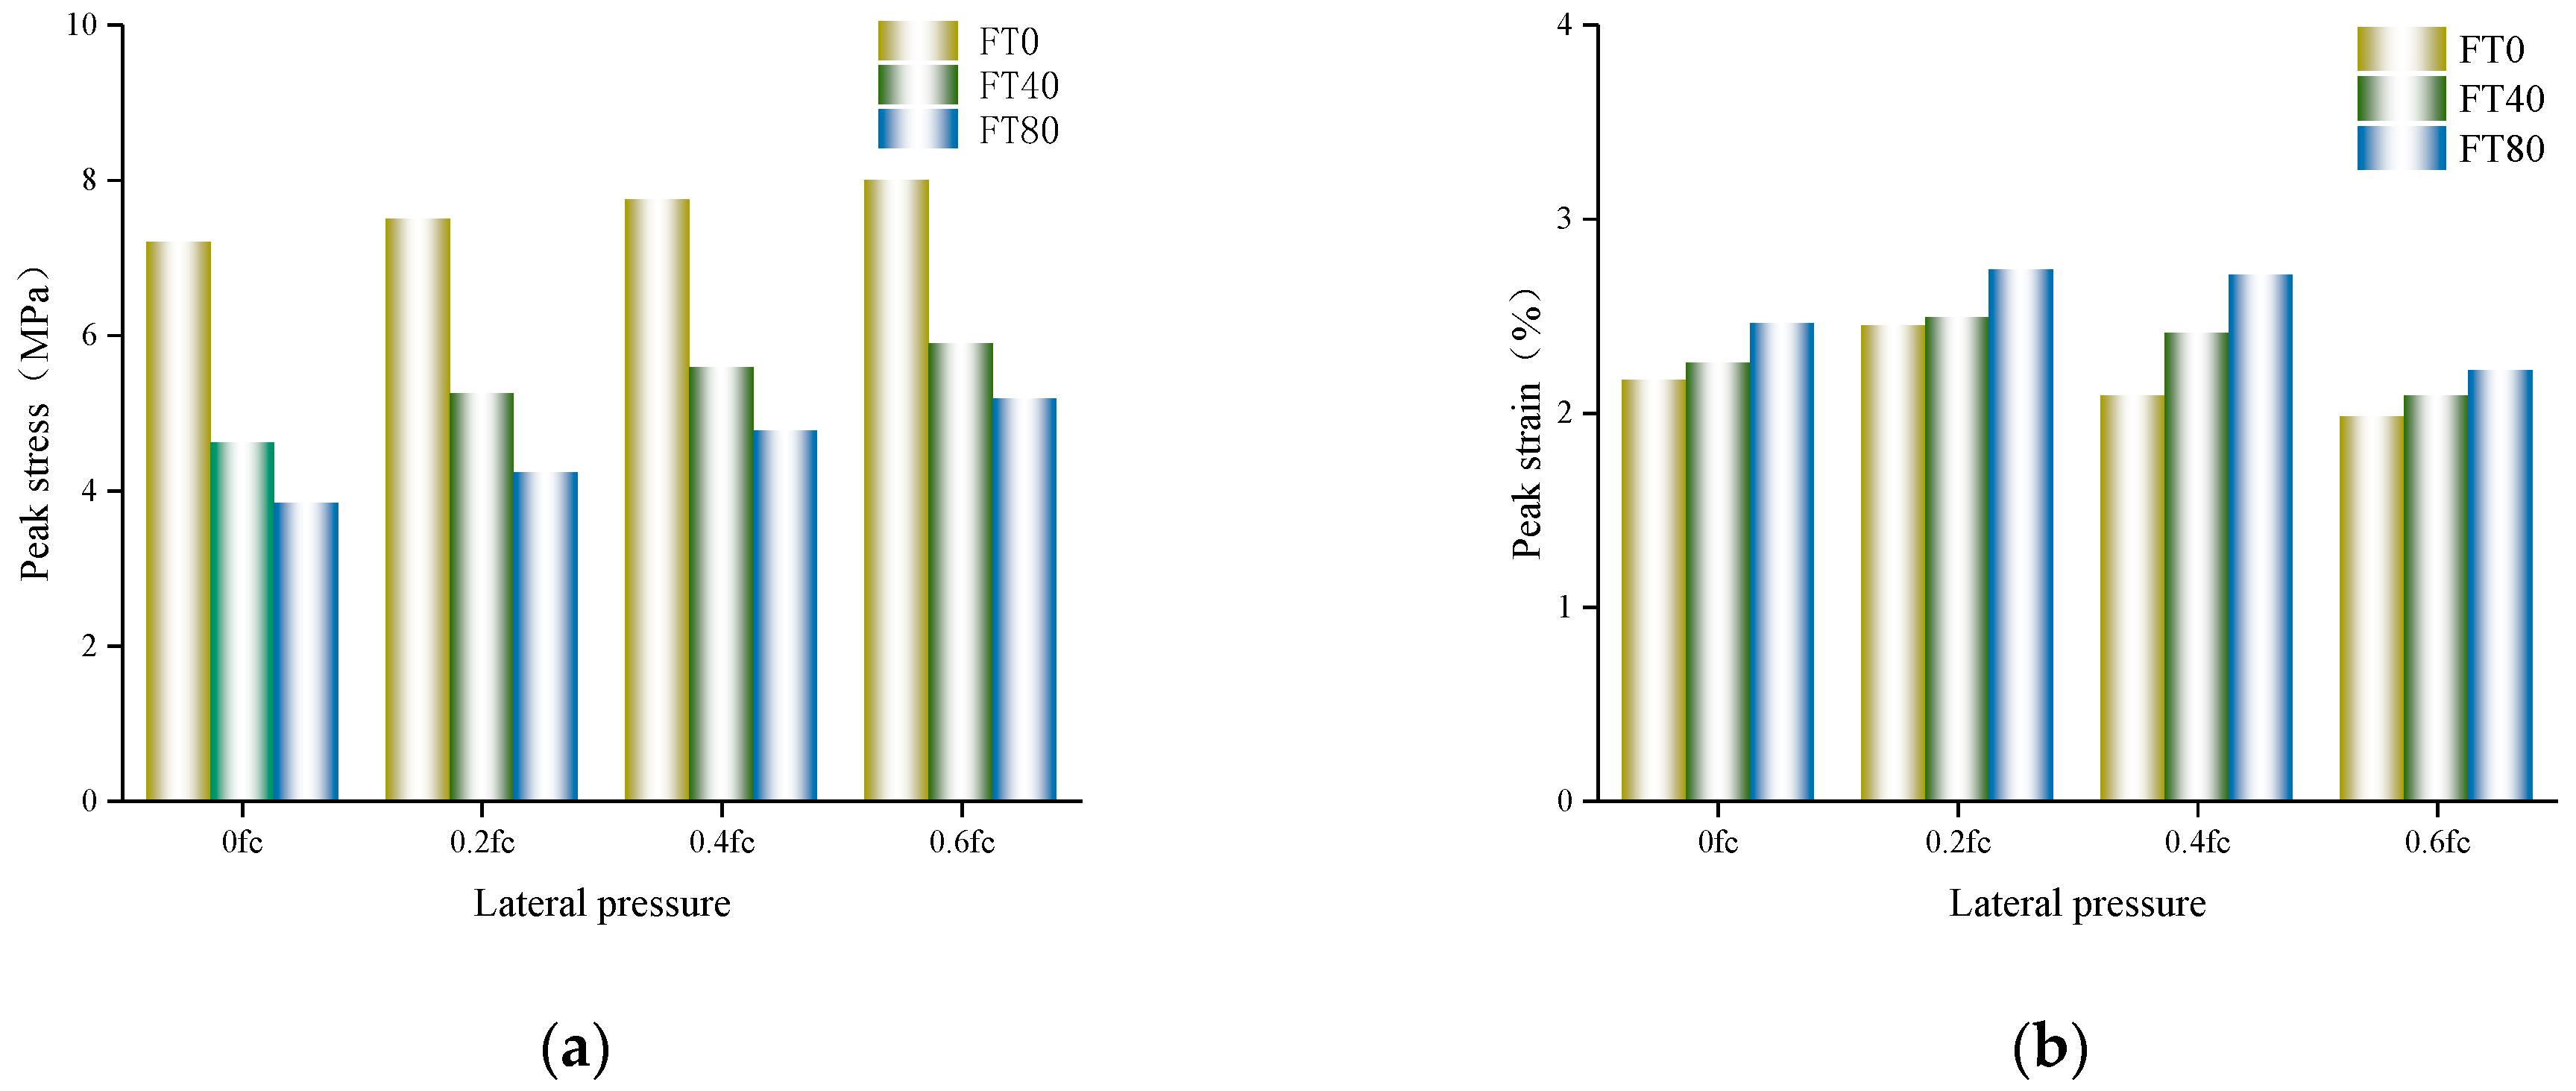
3.1. Peak Stress and Peak Strain

Figure 6a illustrates the relationship between the compressive strength of the slurry masonry schist and the number of freeze–thaw cycles under different lateral pressure conditions. This study indicates that with an increase in the number of freeze–thaw cycles, the compressive strength of the slurry masonry schist exhibits a decreasing trend. This phenomenon is attributed to the expansion of internal moisture in the slurry masonry schist during freezing, leading to pore enlargement. Subsequently, upon thawing, new pores and microcracks form and continue to absorb water, causing the internal structure of the slurry masonry schist to become loose and the bonds among aggregates to weaken, thus reducing the compressive strength. Additionally, the experiment reveals that increasing lateral pressure enhances the peak stress of the slurry masonry schist specimens, but the internal structural damage caused by freeze–thaw cycles weakens their compressive strength. Therefore, within the range of 0 to 0.6 fc lateral pressure, despite the enhancement in peak stress due to lateral pressure, the overall decrease in compressive strength is still caused by the damaging effects of freeze–thaw cycles. This suggests a competitive relationship between lateral pressure and freeze–thaw effects, where the gain effect of lateral pressure is counteracted by the damage and weakening induced by freeze–thaw cycles.
Figure 6b illustrates the relationship between the peak strain of the slurry masonry schist and the number of freeze–thaw cycles under different lateral pressure conditions. As the number of freeze–thaw cycles increases, the peak strain of the slurry masonry schist specimens continues to rise. This is because with the increase in freeze–thaw cycles, the porosity inside the slurry masonry schist increases, weakening the bonds among aggregates and leading to the accumulation of microscopic damage and cracks within the slurry masonry schist. This diminishes the inherent brittleness of the slurry masonry schist, which no longer exhibits a trend of sudden failure but gradually deteriorates instead. Furthermore, for the same degree of freeze–thawing, the peak strain of the slurry masonry schist exhibits a trend of increase followed by a decrease with increasing lateral pressure. This is because at lower lateral pressures, the lateral expansion caused by vertical compression of the slurry masonry schist is less constrained, and, at this point, the peak strain of the slurry masonry schist is mainly influenced by the vertical load pressure. However, under higher lateral pressure, when the slurry masonry schist specimens are compressed vertically to the point of peak stress, the lateral pressure constrains them, preventing significant deformation.

3.2. Acoustic Emission Signal Analysis

3.2.1. Damage Path Analysis

The damage variable D is defined as the ratio of the area of microdefects Ad on a material section to the area of undamaged section A [47], and this variable can be expressed in terms of the amount of acoustic emission energy:
D = N/Nm
where N is the cumulative number of acoustic emission counts at a certain stage of destruction of a cross-sectional area and Nm is the cumulative number of acoustic emission counts at complete destruction.
Figure 7a depicts the relationship between the stress level and damage degree under different freeze–thaw cycle numbers with a lateral pressure of 0.4 fc, while Figure 7b illustrates the relationship between the stress level and damage degree under different lateral pressures with 80 freeze–thaw cycles. In Figure 7a, it can be observed that at low stress levels, the damage degree of the slurry masonry schist after freeze–thaw cycles is greater than those without freeze–thaw cycles. This may be attributed to the gradual compaction of the internal pores in the slurry masonry schist at low stress levels, leading to increased ductility of the slurry masonry schist after freeze–thaw cycles [48,49] and resulting in relatively reduced damage. As the stress level increases and exceeds the compaction point of the slurry masonry schist, under the same stress level, the damage degree of the slurry masonry schist increases with the number of freeze–thaw cycles. This is because, at this stage, the factor influencing the damage degree shifts to the bond strength between stones and mortar, while freeze–thaw cycles weaken the bonds among aggregates. At peak stress, the damage degree values of the slurry masonry schist specimens with 0, 40, and 80 freeze–thaw cycles are 0.71, 0.9, and 0.938, respectively. The analysis reveals that the slurry masonry schist without freeze–thaw cycles has not reached complete failure at the peak stress, while those subjected to freeze–thaw cycles tend to be completely damaged at the peak stress, indicating that freeze–thaw cycles accelerate the damage development in slurry masonry schist. In Figure 7b, it can be observed that at lateral pressures of 0, 0.2 fc, 0.4 fc, and 0.6 fc, the damage degree (D) of the slurry masonry schist at peak stress is 0.969, 0.958, 0.938, and 0.91, respectively, indicating that lateral pressure to some extent inhibits damage development in slurry masonry schist.
According to the research by Ohtsu, M. et al. [50,51], there is a relationship between the level of applied stress V(%) and the total number of acoustic emission events N.
N = c V a exp ( b V )
where a, b, and c are material fitting parameters.
With the combination of Equations (4) and (5), the expression for the damage can be found:
D = c V a exp ( b V ) N m
Hence, there exists a corresponding relationship between the stress level V(%) and the damage value (D) during the loading process of slurry masonry schist. The fitting results obtained using Equation (6) are shown in Figure 8, and the fitting parameters are listed in Table 7. Figure 8a illustrates the fitting graph of the stress level and damage degree under different freeze–thaw cycle numbers with a lateral pressure of 0.4 fc, while Figure 8b depicts the fitting graph of the stress level and damage degree under the effect of different lateral pressures with 80 freeze–thaw cycles. The analysis results indicate that the fitting effect of the damage model established based on the relationship between the damage value (D) and stress level is significant, effectively reflecting the relationship between the stress level and damage during the loading process of slurry masonry schist.

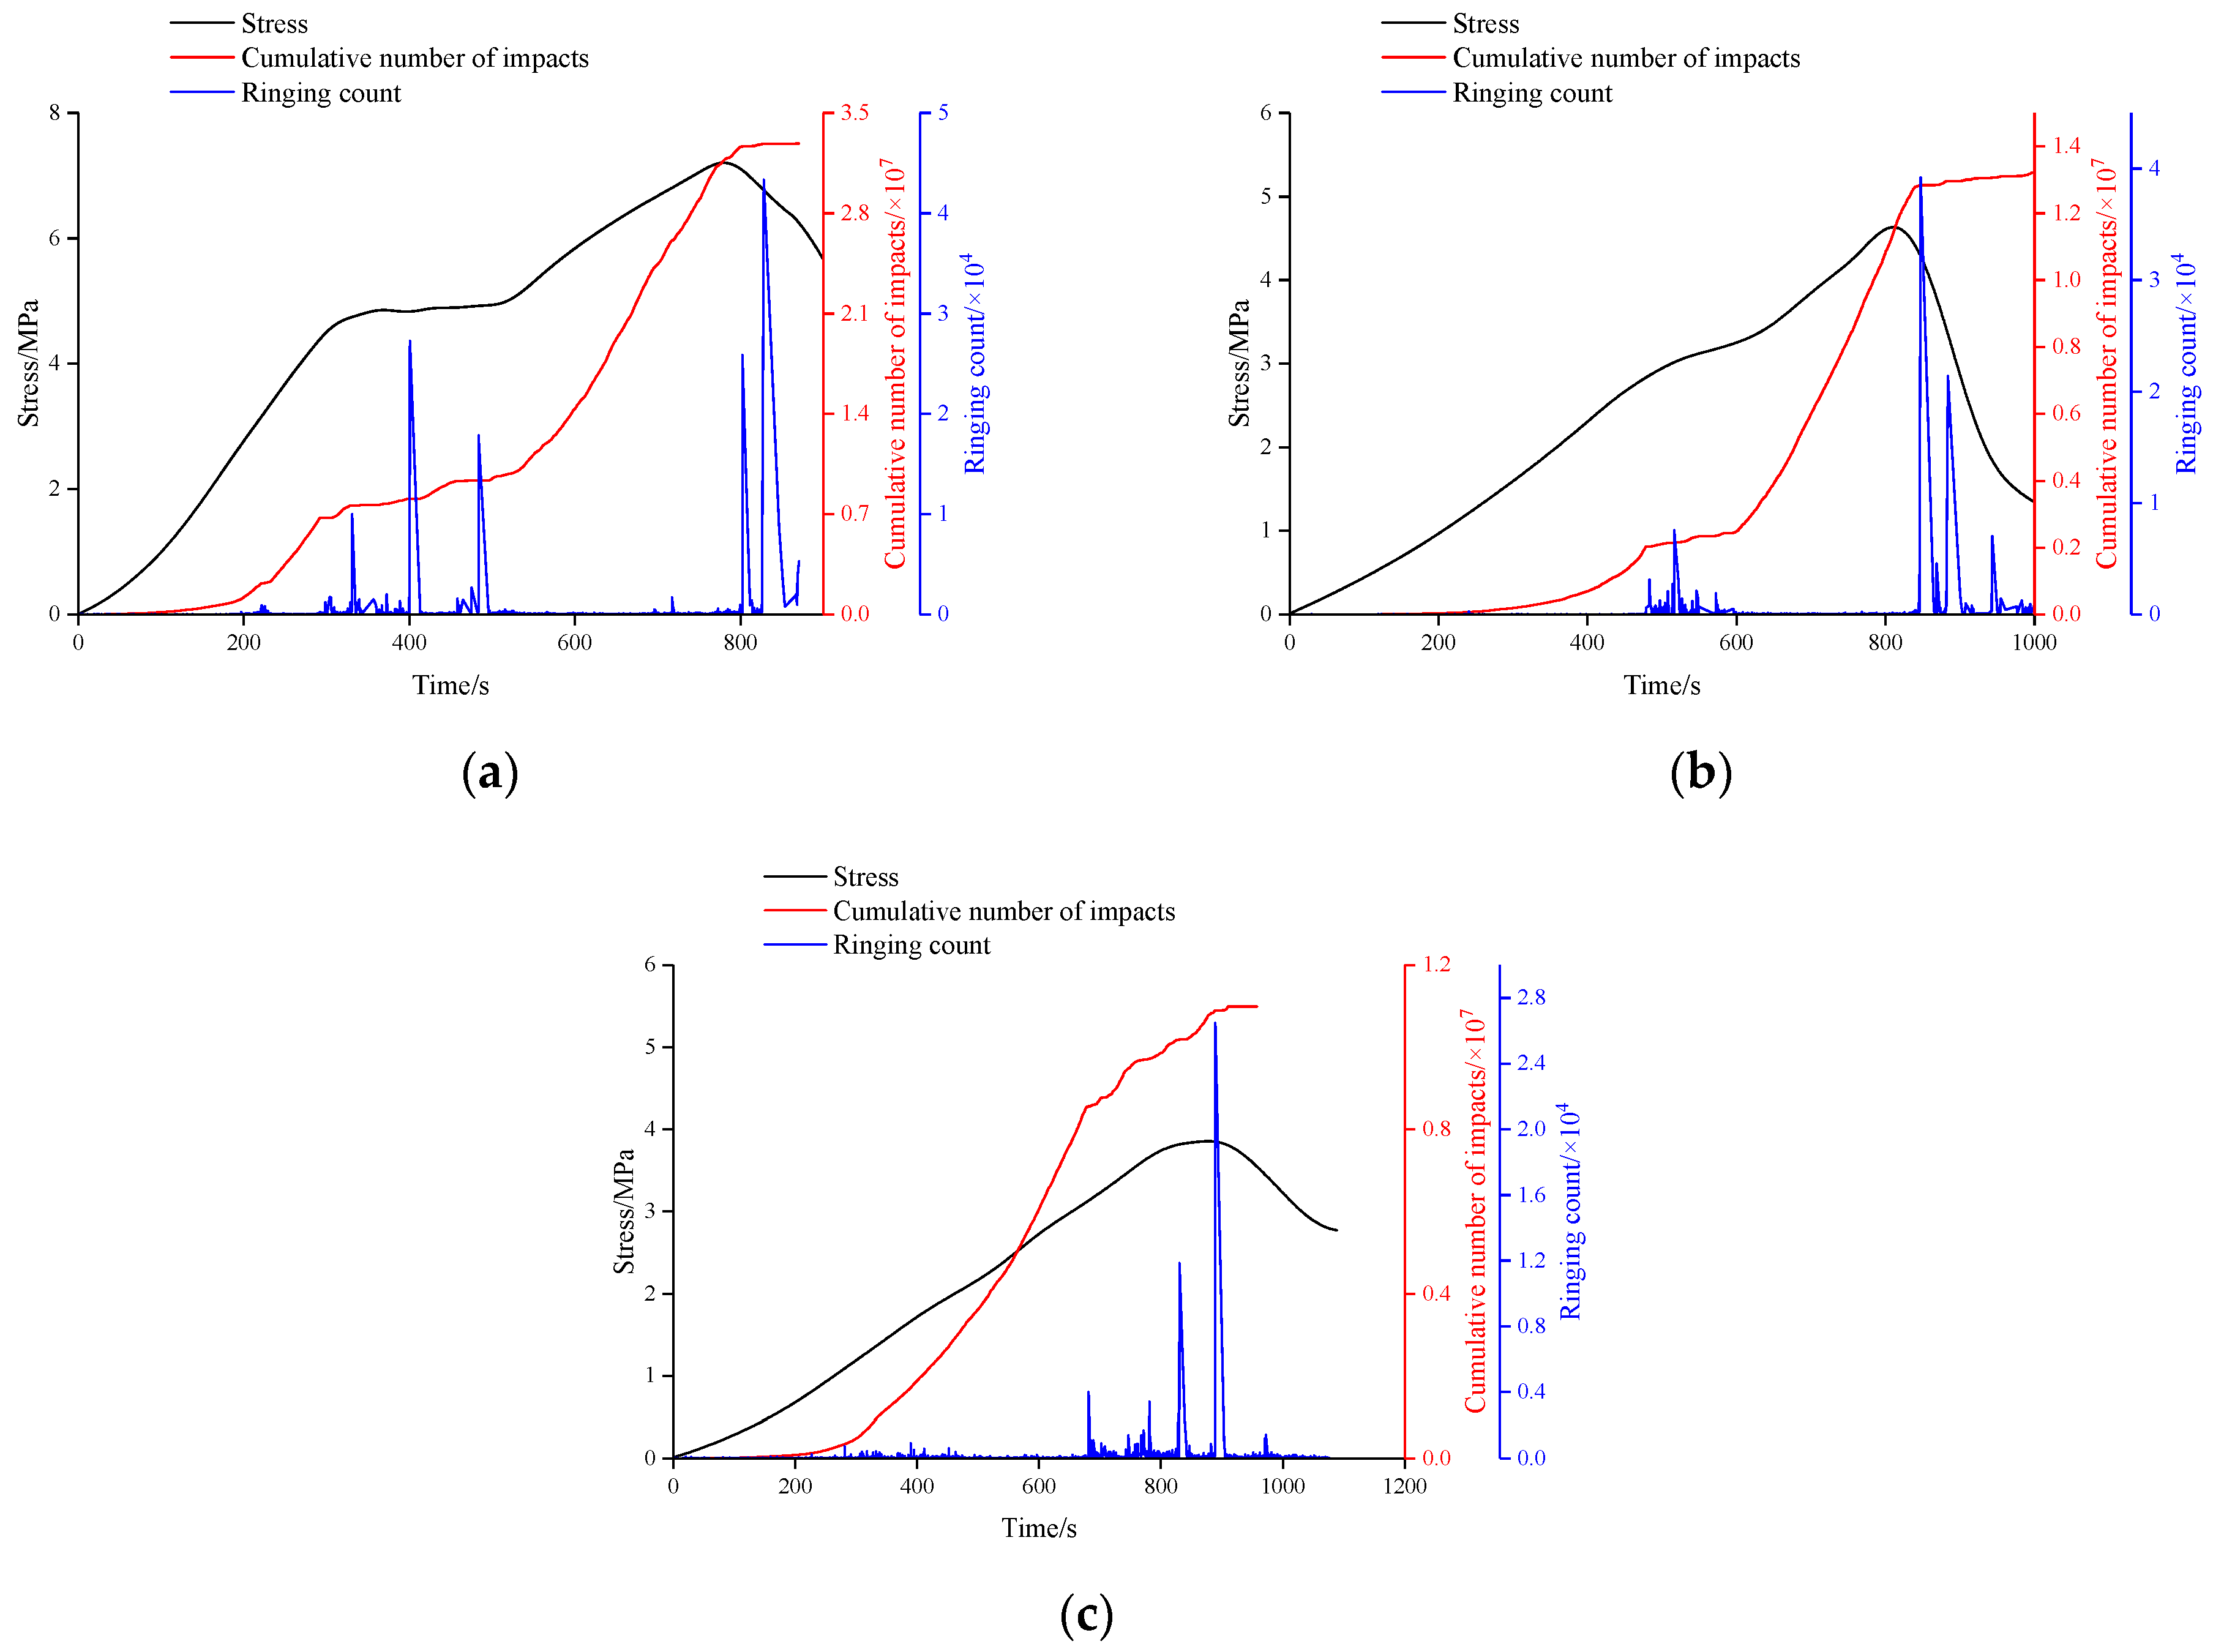
3.2.2. Stress, Acoustic Emission Ringing Count, and Cumulative Impact Curve Characteristics

Figure 9 displays the acoustic emission characteristic curve of the slurry schist under uniaxial compressive load. From the acoustic emission characteristic curve, it can be observed that the initial value of ringing times is relatively small. After surpassing the initial load, the amplitude of the acoustic emission signal increases, consistent with the findings of Nosov et al. [52]. As the load increases, the ringing times sharply increase when the specimens are about to fail. The cumulative impact count of AE shows a continuously increasing trend, which can be divided into three stages as follows: firstly, the initial compaction stage, during which, because of the absence of cracks, AE signals are few, and the cumulative impact count increases slowly. Secondly, the crack generation stage, where AE signals increase because of crack formation, and the cumulative impact count rises more rapidly. Finally, as the load continues to increase, the slurry masonry schist enters the crack expansion and failure stage, during which, because of crack expansion, AE signals significantly increase, and the cumulative impact count growth rate significantly accelerates. When the specimen is about to fail, the cumulative impact count sharply rises and reaches a peak, and then the growth rate slows down. During this period, AE signals mainly come from shear slip in the interface transition zone. These three stages reveal the variation law of acoustic emission activity in slurry masonry schist specimens under different loading stages.
The cumulative number of impacts and ringing counts of the slurry masonry schist specimens decrease with an increasing number of freeze–thaw cycles. This phenomenon is attributed to the freeze–thaw cycles causing a loosening of the internal structure of the slurry masonry schist, leading to gradual expansion and penetration of internal cracks. The ingress of moisture from the air reduces the friction among particles within the slurry masonry schist, thereby diminishing acoustic emission activity.

3.2.3. Crack Classification Analysis Based on Acoustic Emission Parameters

In acoustic emission monitoring, RA and AF values are often used to characterize the rupture mechanism, and, in general, tensile damage corresponds to acoustic emission events with lower RA values and higher AF values. In contrast, the acoustic emission events corresponding to shear damage usually have higher RA values and lower AF values. These acoustic emission characteristic parameters reflect the different features of acoustic emission events for different damage types. The damage in slurry schist is caused mainly by the expansion and penetration of internal microcracks. This type of damage mainly includes tensile damage and shear damage, as shown in Figure 10. Studying the ratio of tensile to shear cracks is important for understanding the damage mechanism of slurry schist because different types of cracks reflect different stress states and damage mechanisms when the material is subjected to stresses. RA denotes the ratio of the rise time of an acoustic emission event to its amplitude, and AF denotes the ratio of the ringing counts of an acoustic emission event to its duration. Researchers usually denote the ratio of RA to AF as the k value, which, according to LI et al. [53], is taken to be 50 to help characterize acoustic emission events.
Figure 11 presents scatter plots depicting the behavior of the slurry masonry schist specimens labeled RA-AF under uniaxial and biaxial compression conditions. These specimens exhibit two distinct failure modes, namely, tensile and shear failure, under compressive loading. Statistical analysis of RA-AF acoustic emission events reveals the relationship between the proportion of tensile cracks and lateral pressure, as shown in Figure 12. Tensile fracture predominates during specimen failure, with relatively fewer instances of shear failure. With increasing lateral pressure, there is a notable decreasing trend in the proportion of tensile cracks during specimen fracture. This trend is attributed to the lateral pressure’s imposition of transverse expansion constraints on the vertical compression of the slurry masonry schist, thereby intensifying the constraint on tensile cracks with higher lateral pressure. Additionally, freeze–thaw cycles disrupt the internal structure of the slurry masonry schist, resulting in fluctuations in the proportion of tensile cracks. These findings indicate that both lateral pressure and freeze–thaw cycles induce changes in the fracture pattern of the slurry masonry schist specimens, consistent with the findings of Li et al. [53].

3.2.4. (B) Value Analysis

The (b) value in acoustic emission experiments is a crucial parameter, as it reflects the material’s fracture process. Specifically, it represents the ratio of small to large events in acoustic emission events, which is vital for understanding the material’s fracture behavior. The variation in (b) values during specimen fracture is considered a significant precursor to rupture. In cement-based materials, (b) values can also reflect the average stress level and the degree of proximity to the ultimate strength. The change in (b) values can provide information about the stress state and the scale of internal microcracks, thus possessing spatiotemporal evolution characteristics. By monitoring the variation in (b) values, a better understanding of the material’s behavior under different stress conditions, including fracture mechanisms and precursors, can be achieved.
Based on the Gutenberg–Richter relationship and the raw acoustic emission data, the acoustic emission (b) value can be calculated [39] with the following equation:
lg N = a b M M = A d B / 20
where M is the earthquake magnitude, N is the number of earthquakes, a and b are constants, b is the value of b in seismology, and AdB is the amplitude of the acoustic emission. In seismology, it is common to use the amplitude of the acoustic emission divided by 20 instead of the earthquake magnitude.
Figure 13 depicts the fluctuation in the (b) value as the load increases. Throughout various loading phases on the slurry masonry schist specimen, changes in acoustic emission (b) values offer crucial insights into the internal propagation of cracks and damage. Initially, minor oscillations in the (b) values indicate uniform crack propagation within the specimen. As the load rises, slight declines in (b) values suggest significant crack penetration within the specimen, albeit with minor damage. As loading progresses, the (b) values of the slurry masonry schist demonstrate an upward trajectory, indicating continuous generation and spread of internal microcracks. A notable difference between biaxial and uniaxial compression lies in a sudden surge in (b) values following a period of axial loading, likely because of lateral pressure impeding crack development during axial loading, resulting in the accumulation of numerous microcracks within the slurry masonry schist. Subsequently, there is stable expansion of microcracks, accompanied by fluctuating (b) values. Upon reaching peak stress load, a significant decrease in (b) values is observed, indicating substantial internal damage within the slurry masonry schist at this stage. The fluctuation in (b) values elucidates the progression of damage within the specimen across different loading stages, consistent with the findings of Xu et al. [54] on cement-based materials.

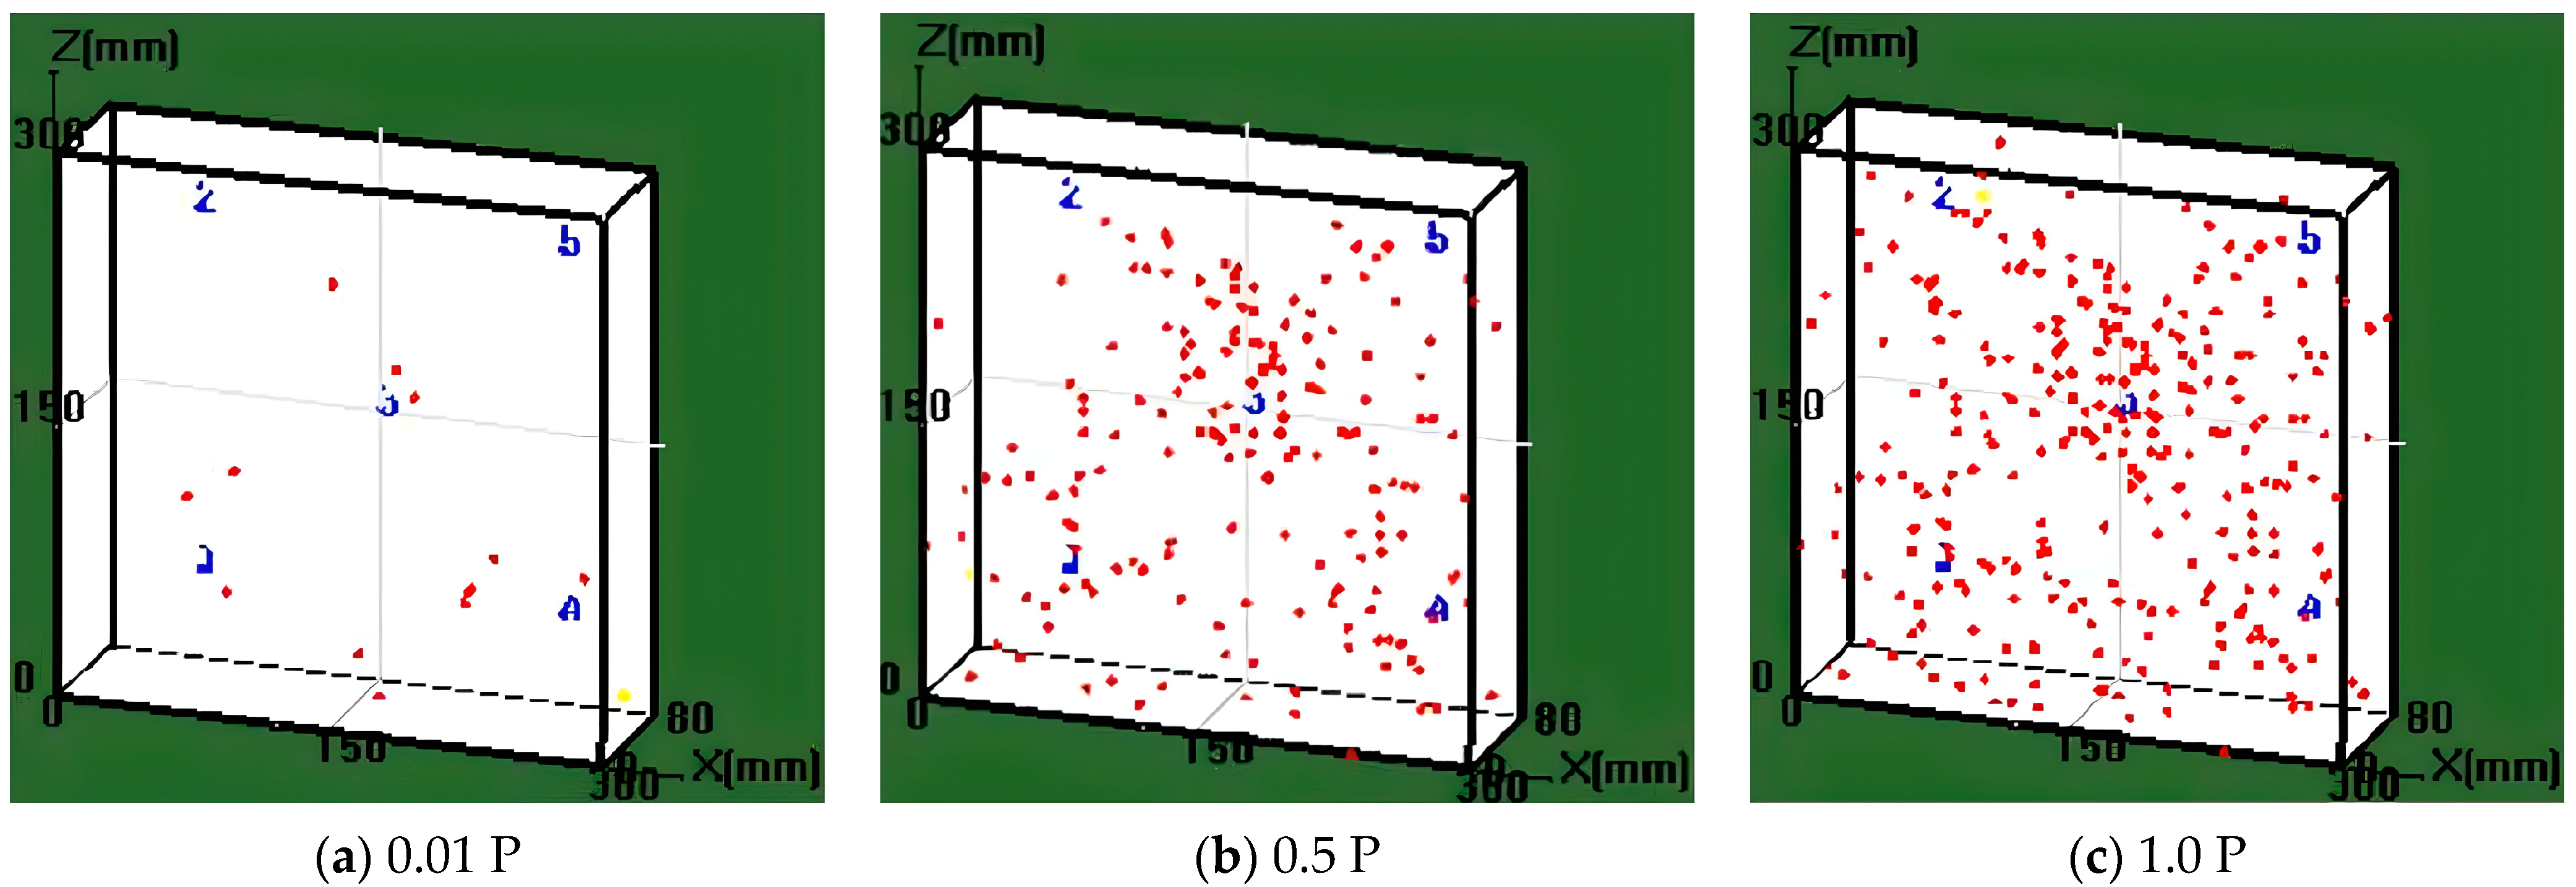
3.2.5. Analysis of Damage Localization Points

Figure 14 illustrates the evolution of damage localization points in the slurry masonry schist during uniaxial compression at different stress stages. Initially, damage localization points tend to occur at weak locations. With increasing vertical load, the number of acoustic emission localization points significantly rises. At 50% of Pmax, a large number of acoustic emission localization points appear in the interface transition zone, forming coherent signal bands. As the load reaches Pmax, the quantity of acoustic emission signals sharply increases, forming a distinct damage band. Overall, AE signals first manifest at both ends of the specimen, with slightly more AE signals at the loading end, which is attributed to the “Poisson effect” of the cement-based material at the loading end. With increasing vertical load, AE signals gradually propagate towards the middle of the specimen; upon reaching the peak load Pmax, cracks develop along the interface transition zone, penetrating the entire interface.

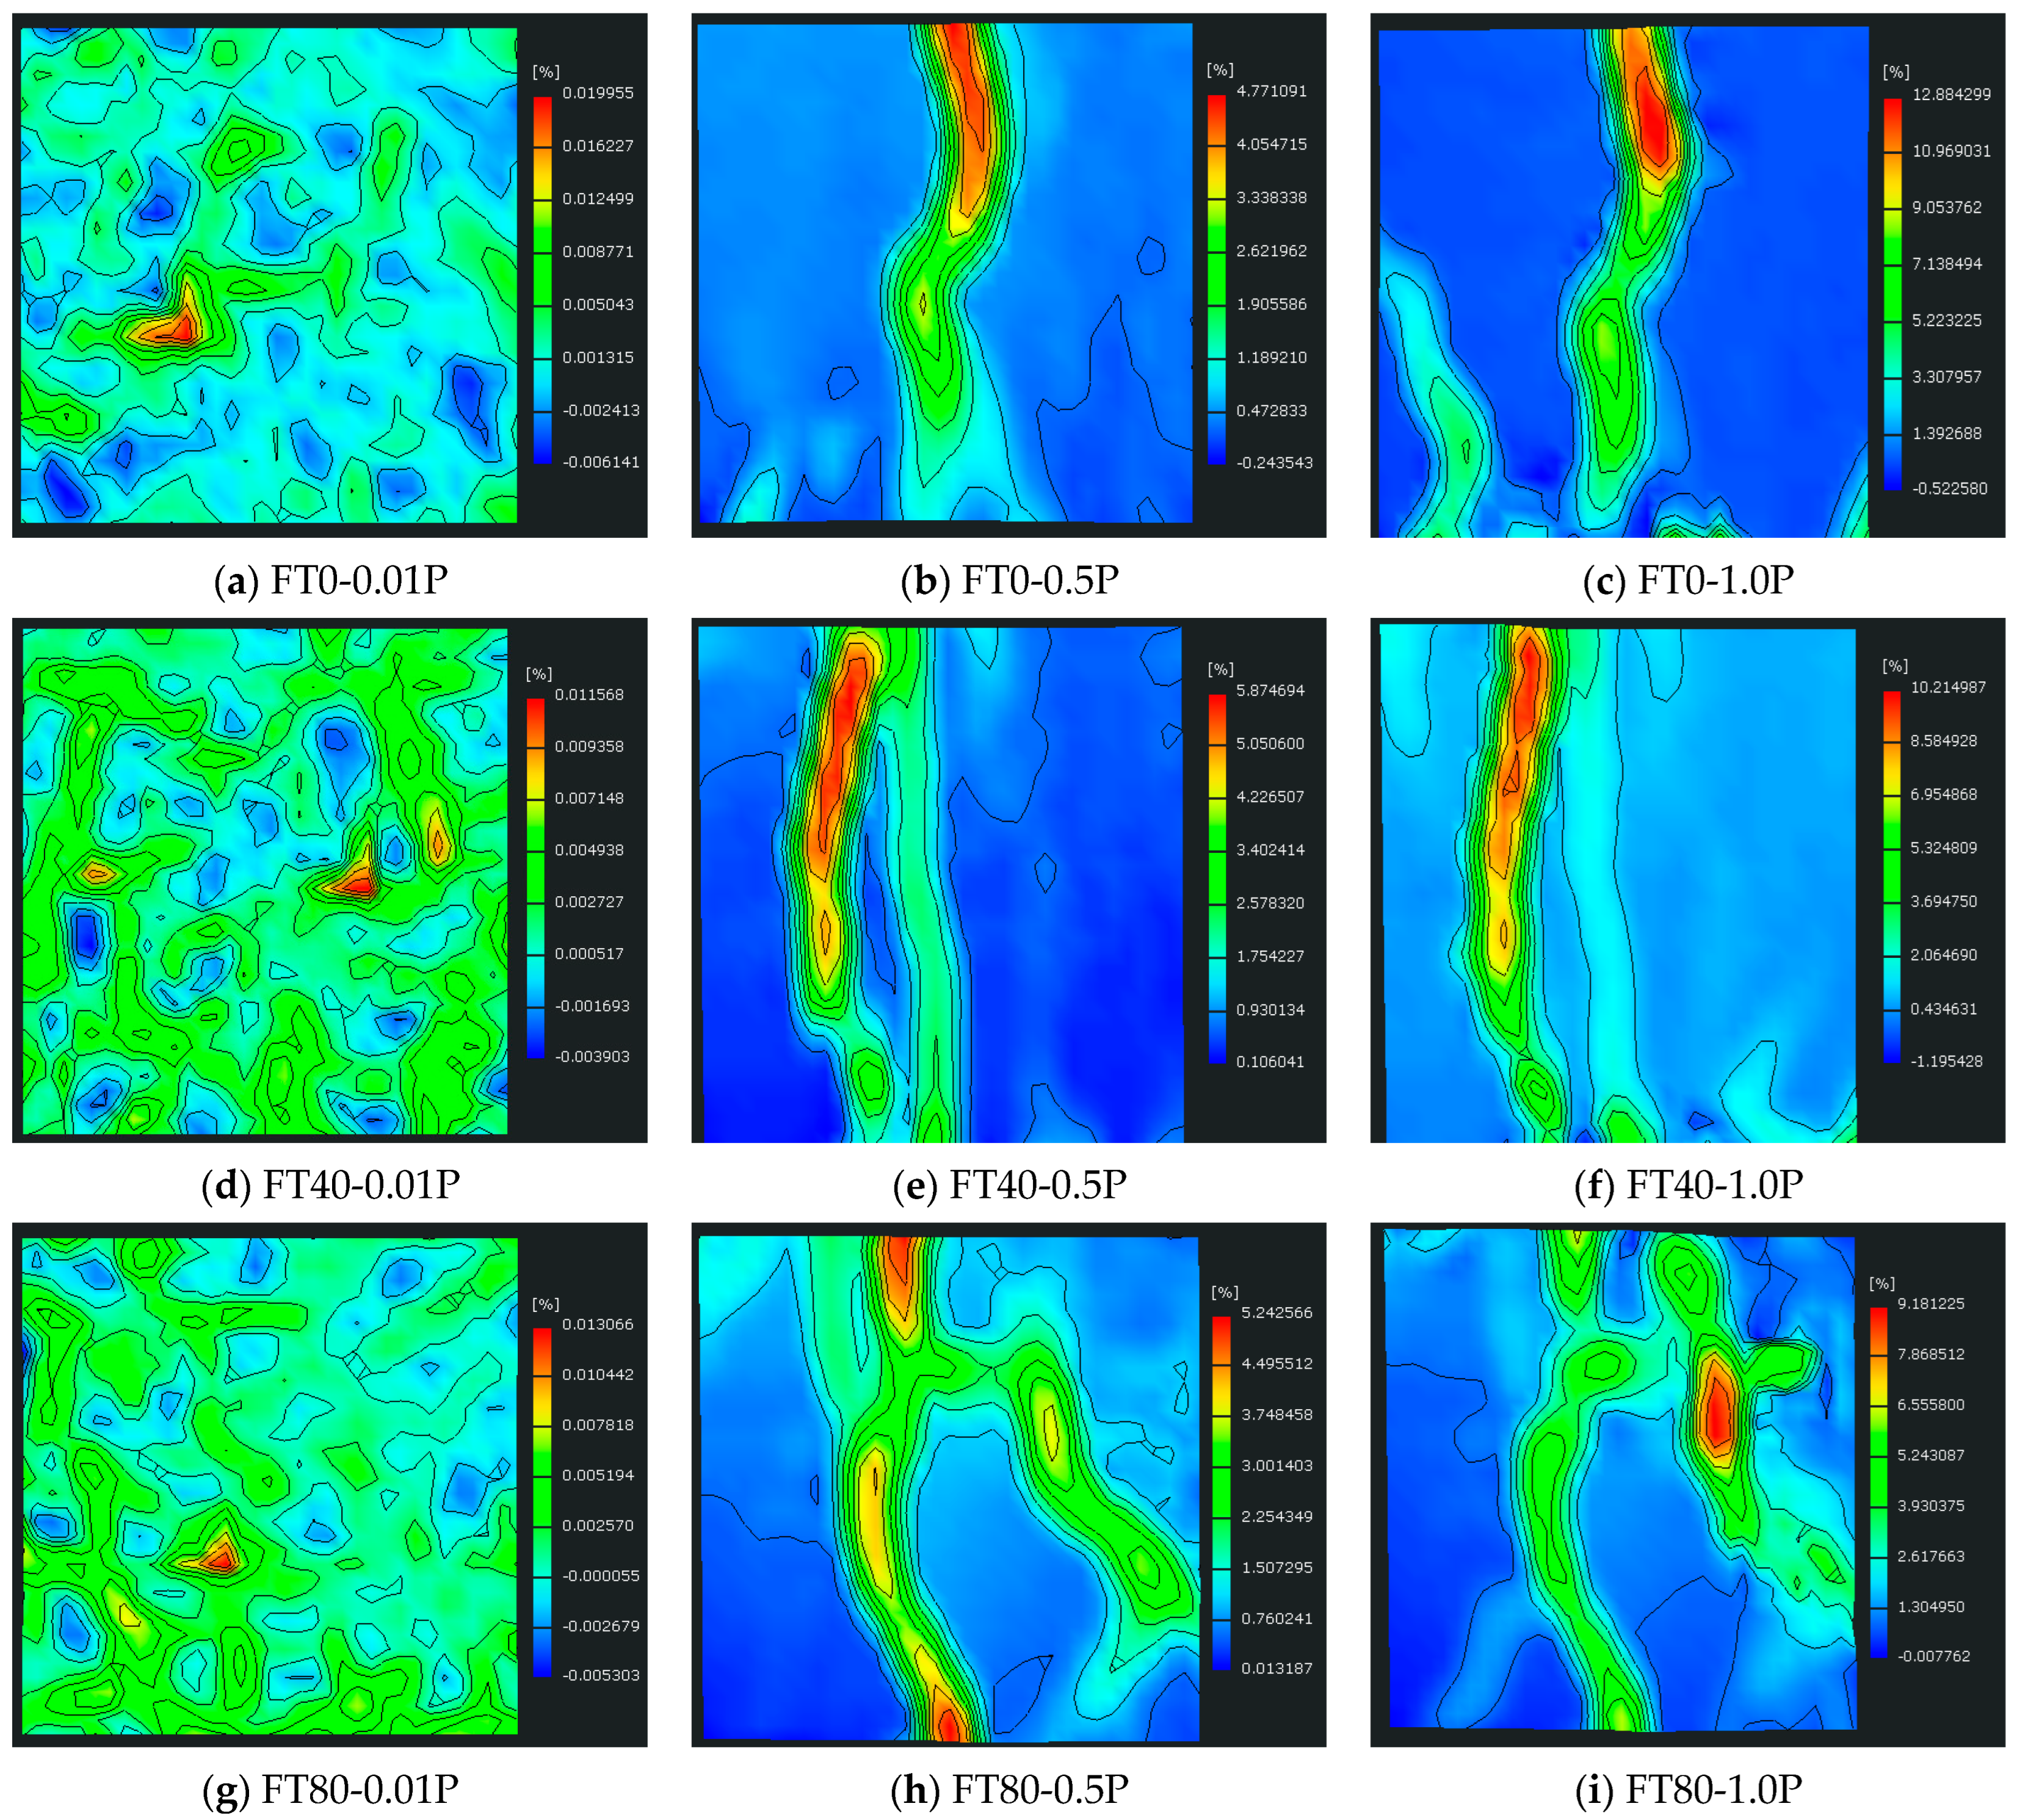
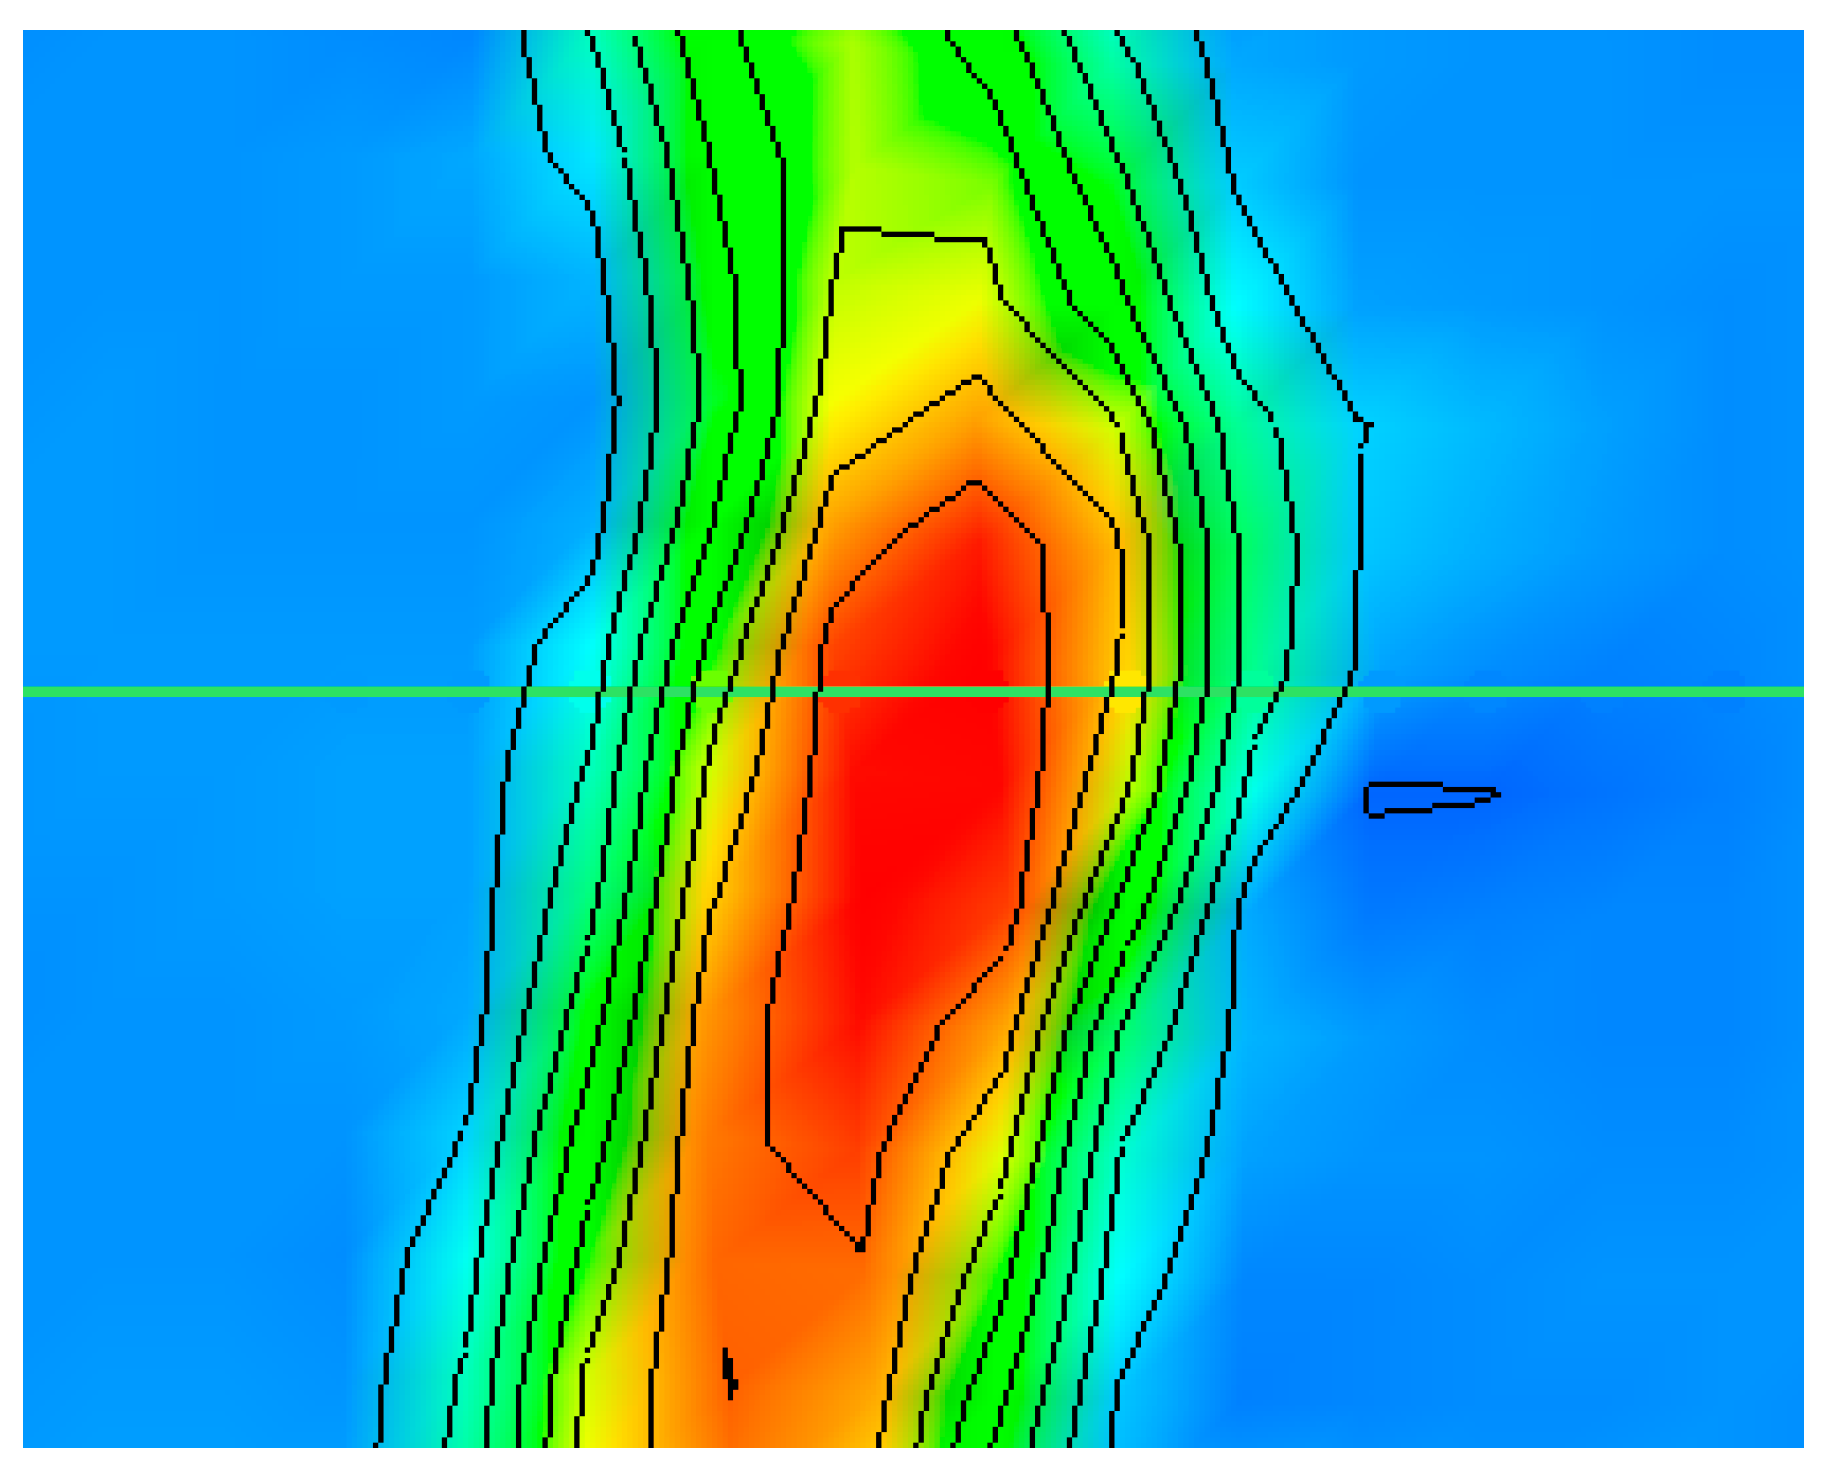
3.2.6. Maximum Principal Strain Analysis

The strain results of the slurry masonry schist under a lateral pressure of 0.6 fc are shown in Figure 15, corresponding to the maximum principal strain cloud maps and failure modes at peak strengths of 0%, 50%, and 100%. When the load reaches 50% of Pmax, the specimen exhibits visible longitudinal crack extension with prominent color gradients, accompanied by gradual development and enlargement of interface cracks. As the load reaches Pmax, the cracks further propagate, leading to the phenomenon of crack propagation along the interface between aggregate and mortar. Sudden strain changes indicate interface debonding between aggregate and mortar, resulting in the formation of macroscopic cracks along localized strain bands and ultimately leading to specimen failure. These results indicate that interface debonding is the primary failure mode for slurry masonry schist structures, consistent with the acoustic emission findings. The typical failure states of the specimens are illustrated in Figure 16.
To clarify the evolution of strain at the interfaces in slurry masonry schist, a truncation line was set along the horizontal direction in the strain cloud map to ensure that the truncation line passed through the tip of the notch with a mature crack. The location of the truncation line is shown in Figure 17. Figure 18 shows the distribution pattern of the maximum principal strains along the truncation line. The maximum principal strains of the slurry schist along the truncation line tend to decrease with an increasing number of freezing and thawing cycles. This may be because water expands as it freezes during the freezing and thawing cycle, which leads to greater stresses in the pore space, thus causing microcracks in the slurry schist. When the specimen thaws, these microcracks may expand, leading to changes in the pore properties within the concrete. These changes in pore properties result in a decrease in the compressive properties of the slurry masonry schist. As the freeze–thaw cycles are repeated, microcracks accumulate within the slurry schist. These microcracks weaken the overall strength and deformability of slurry masonry schist, resulting in a reduction in the maximum principal strain.

4. Conclusions

In this study, the effect of coupled lateral pressure and freeze–thaw cycles on the performance of slurry masonry schist specimens was investigated, and the whole test process was monitored using acoustic emission and DIC techniques. By organizing and analyzing the test data, we obtained the following conclusions:
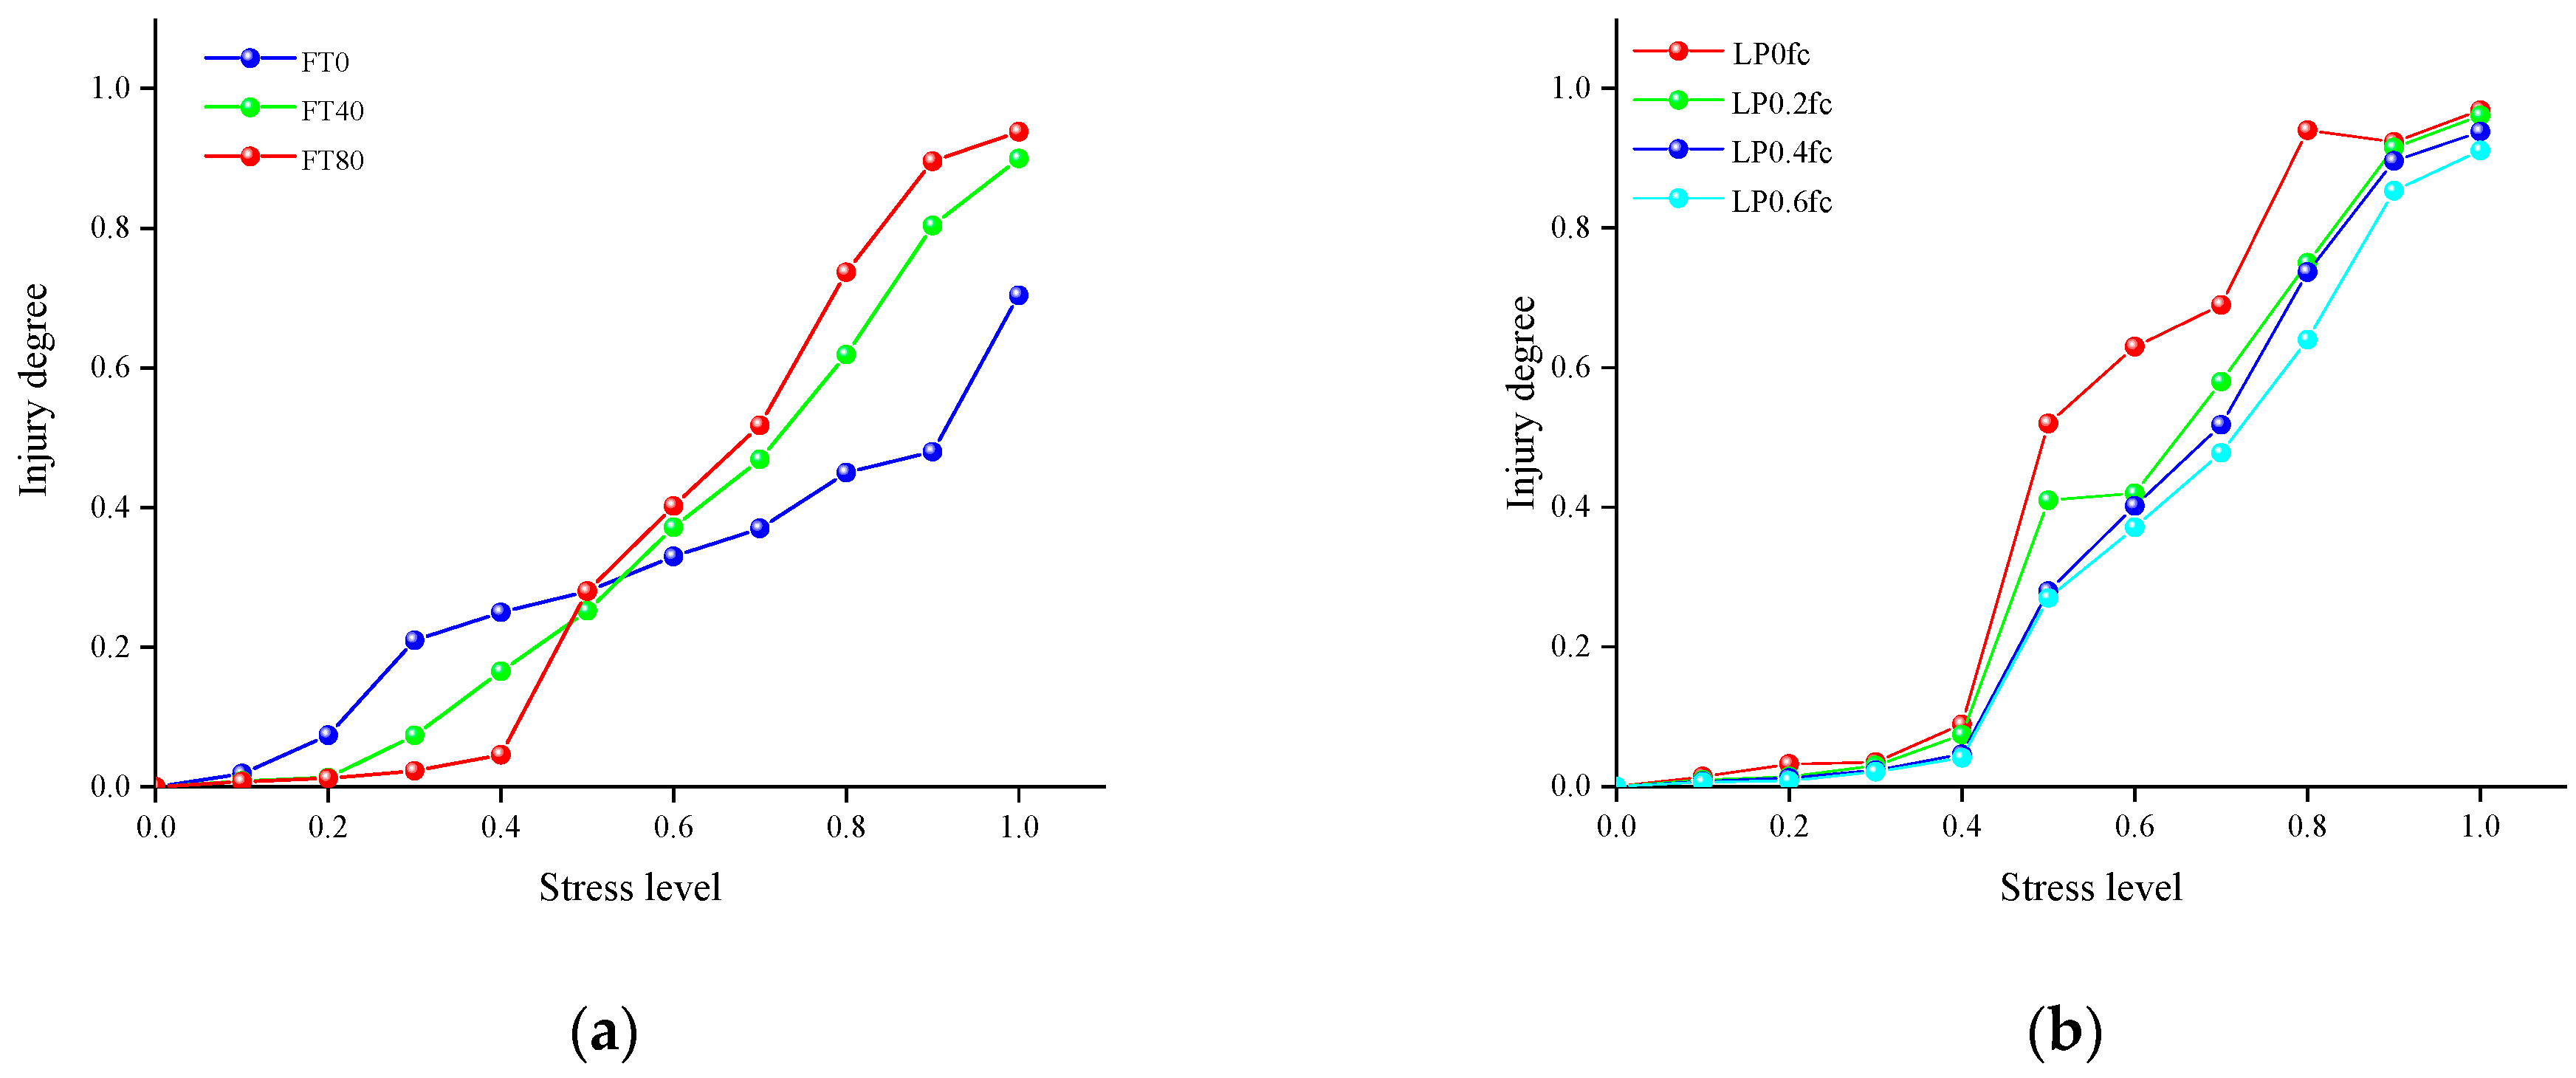
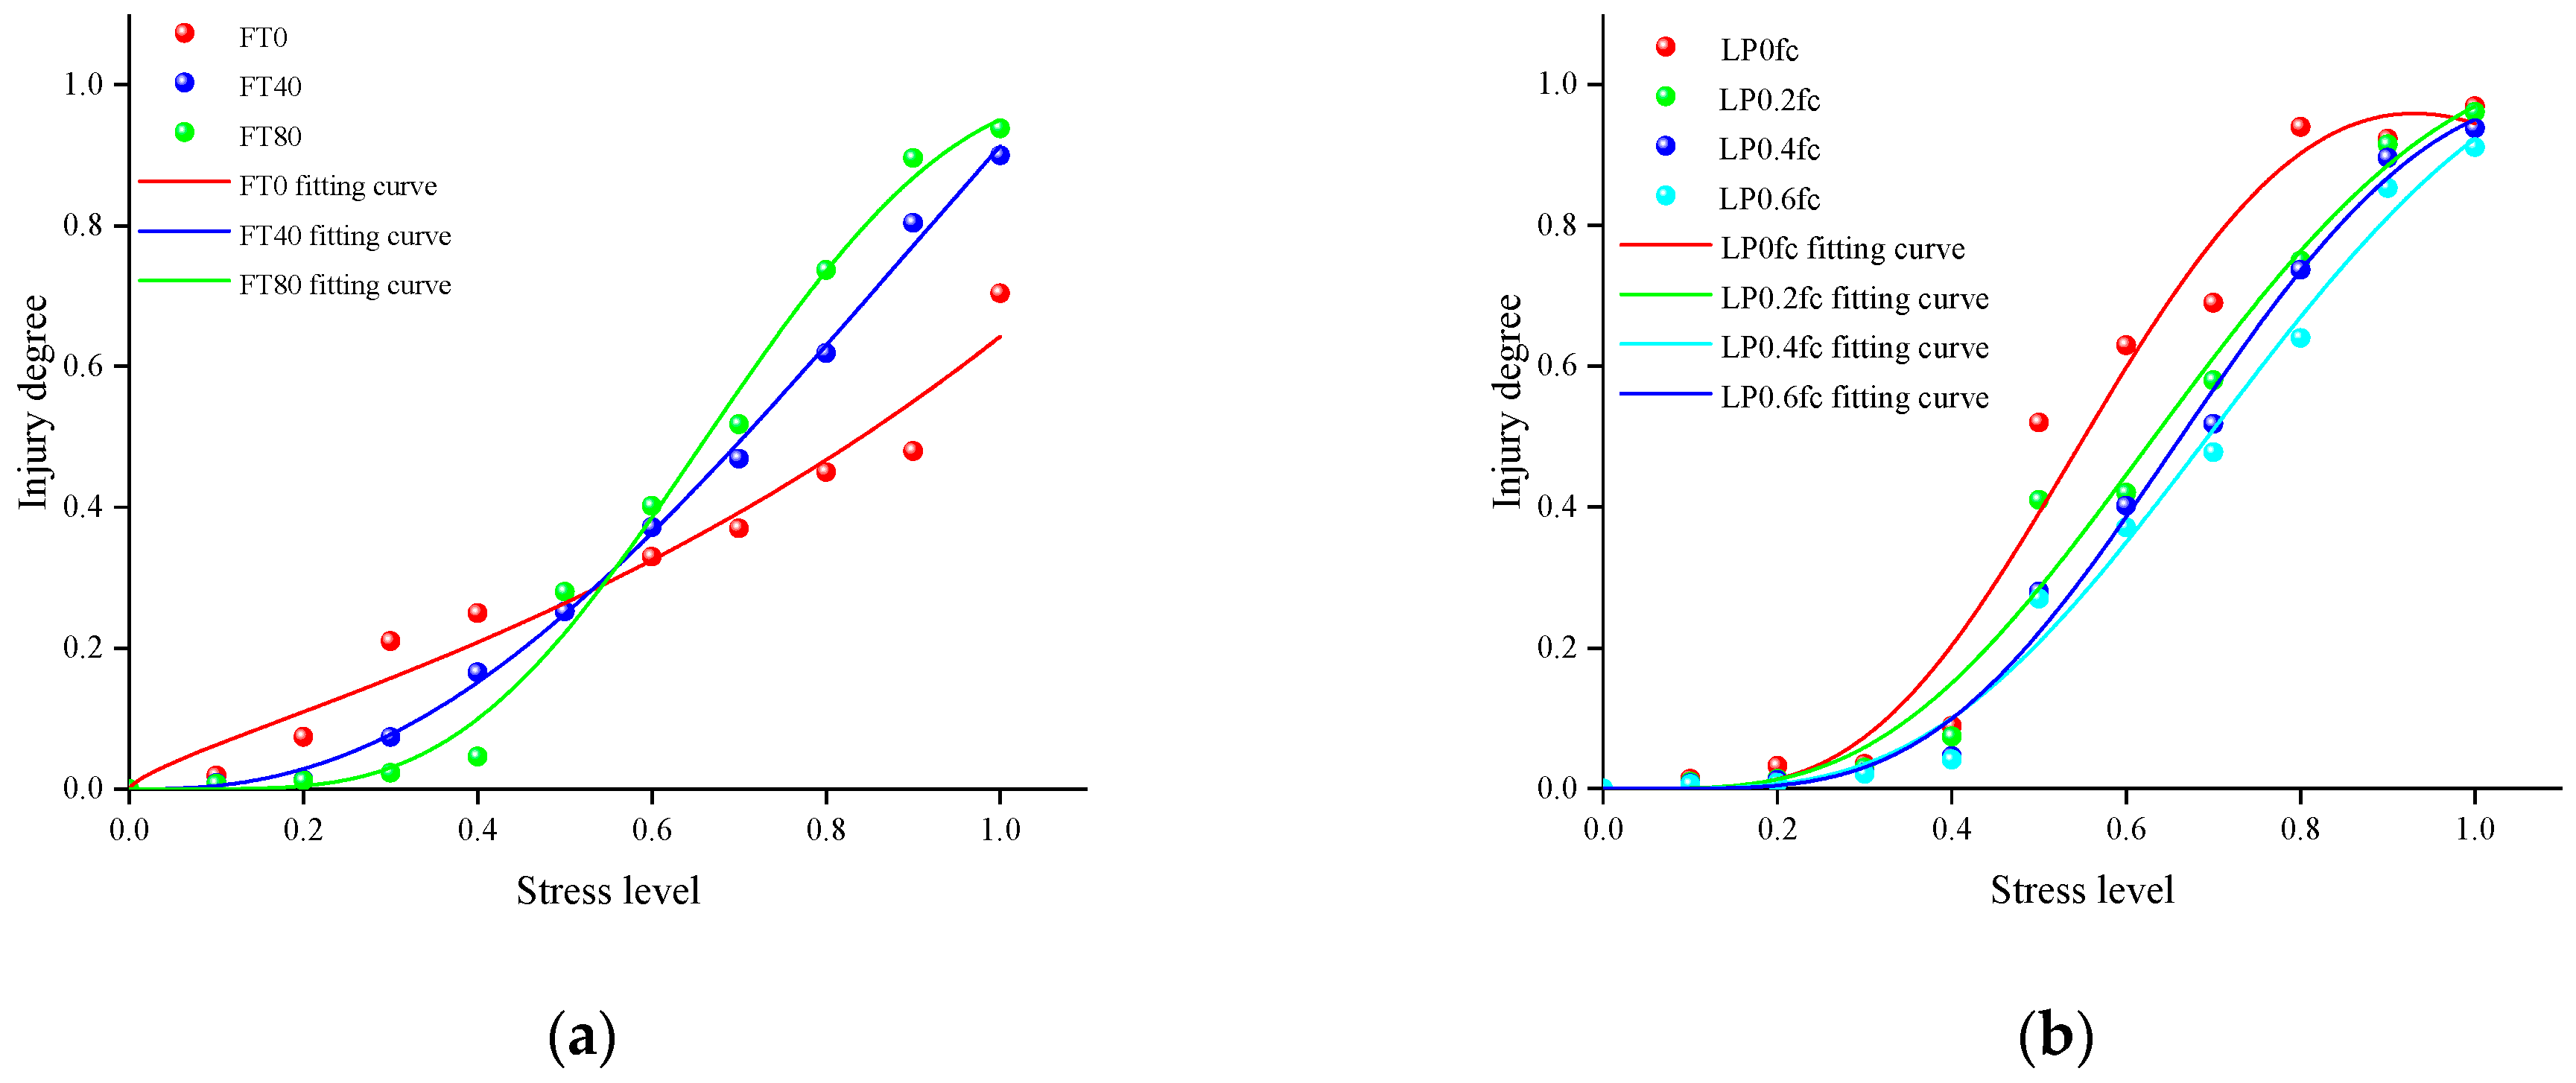
  • Freezing and thawing cycles expedite the damage process in slurry masonry schist during loading. As the number of freeze–thaw cycles increases, the damage evolution path shifts forward. Despite the overlap of the starting and ending points of the damage curve, the curve’s trajectory significantly shortens, resulting in earlier damage to the slurry masonry schist during the loading process. The presence of lateral pressure partially inhibits the development of damage in slurry masonry schist.
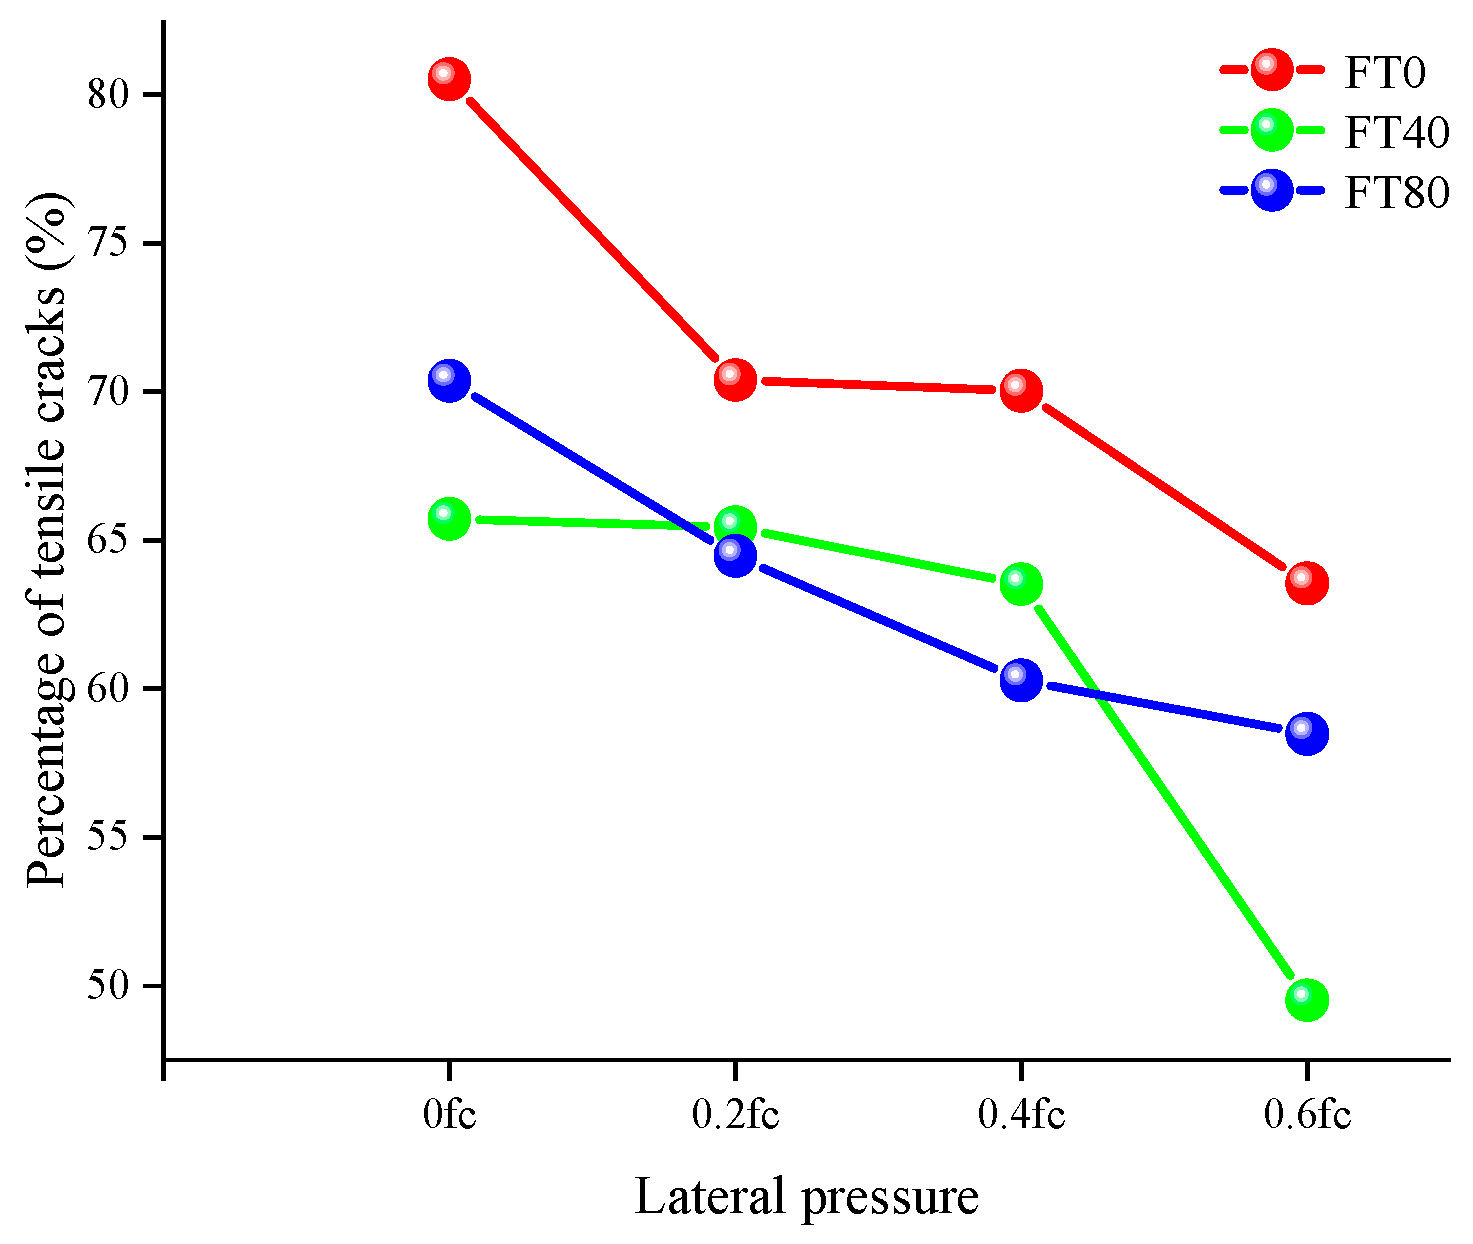
  • The fracturing of the slurry schist is dominated by tensile damage and, to a lesser extent, by shear damage. The presence of lateral pressure produces lateral expansion constraints during the vertical compression of the slurry schist, and the greater the lateral pressure is, the stronger the constraints on tensile cracks. Freeze–thaw cycles damage the internal structure of the slurry schist, and the percentage of tensile cracks fluctuates. Lateral pressure and freeze–thaw cycles induce alterations in the fracture pattern of the slurry schists.
  • The fluctuation in the acoustic emission (b) value offers crucial insights into crack ex-tension and damage within slurry masonry schist. An increase in the (b) value signifies a prevalence of microcracks within the material, whereas a decrease indicates a dominance of larger crack extension and penetration. Fluctuations in the (b) value reveal the damage evolution of the slurry masonry schist during various loading stages.
  • Under loading, crack propagation occurs in the interface zone between the aggregate and mortar in slurry masonry schist, and the sudden change in strain indicates that the interface between the aggregate and mortar experiences debonding. During the loading process, the cracks produce macroscopic cracks along the localized zone of strain, leading to damage to the specimens by fracturing. The findings from digital image correlation (DIC) strain monitoring and acoustic emission (AE) signal localization suggest that the primary mode of damage in slurry schist structures is interfacial debonding.

Author Contributions

Conceptualization, J.D.; data curation, S.C.; formal analysis, Y.Z.; funding acquisition, J.D.; investigation, J.D. and Y.Z.; methodology, J.D., H.C. and H.Z.; resources, H.C., supervision, G.Z.; validation, H.C.; visualization, G.Z. and F.G.; writing—original draft, S.C.; writing—review and editing, H.Z. and F.G. All authors have read and agreed to the published version of the manuscript.

Funding

The research described in this paper was financially supported by the Natural Science Foundation of China (NO. 51878242), the Natural Science Foundation of Hebei Province of China (NO. E2020404007), the Research Project of Young Top Talent in Hebei Province (BJK2024116), and the Project of Research Start-up Fund (B-202307).

Data Availability Statement

The data presented in this study are available on request from the corresponding author.

Conflicts of Interest

Author Guoxiang Zhang was employed by the company China Railway Design Group Limited. The remaining authors declare that the research was conducted in the absence of any commercial or financial relationships that could be construed as a potential conflict of interest.

References

  1. Kokutse, N.K.; Temgoua, A.G.T.; Kavazović, Z. Slope stability and vegetation: Conceptual and numerical investigation of mechanical effects. Ecol. Eng. 2016, 86, 146–153. [Google Scholar] [CrossRef]
  2. Li, J.; Zhou, K.; Liu, W.; Zhang, Y. Analysis of the effect of freeze–thaw cycles on the degradation of mechanical parameters and slope stability. Bull. Eng. Geol. Environ. 2018, 77, 573–580. [Google Scholar] [CrossRef]
  3. Su, H.; Wu, D.; Lu, Y.; Peng, X.; Wang, X.; Chen, W.; Wang, S. Experimental and numerical study on stability performance of new ecological slope protection using bolt-hinge anchored block. Ecol. Eng. 2021, 172, 106409. [Google Scholar] [CrossRef]
  4. Gentilini, C.; Govoni, L.; de Miranda, S.; Gottardi, G.; Ubertini, F. Three-dimensional numerical modelling of falling rock protection barriers. Comput. Geotech. 2012, 44, 58–72. [Google Scholar] [CrossRef]
  5. Yang, Y.; Wang, J.; Duan, Q.; Su, C.; Yan, M.; Dong, Y. The Investigation and 3D Numerical Simulation of Herb Roots in Reinforcing Soil and Stabilizing Slope. KSCE J. Civ. Eng. 2018, 22, 4909–4921. [Google Scholar] [CrossRef]
  6. Yu, S.Y.; Ren, X.H.; Zhang, J.X.; Wang, H.J.; Sun, Z.H.; Zhou, Y. Numerical simulation on the stability of rock slope based on an improved SPH Method. J. Mt. Sci. 2021, 18, 1937–1950. [Google Scholar] [CrossRef]
  7. Liu, Y.; Han, D.; Liu, N.; Wang, W. Reinforcement mechanism analysis of lattice beam and prestressed anchor rod system for loess slope. Front. Earth Sci. 2023, 11, 1121172. [Google Scholar] [CrossRef]
  8. Zhu, X.; Chen, Z.; Ren, Y. The Application of Ecological Treatment Technology of Bolt and Lattice Beam in Highway Mountain Slope Support. Geotech. Geol. Eng. 2019, 37, 1891–1896. [Google Scholar] [CrossRef]
  9. Zhang, J.J.; Niu, J.Y.; Fu, X.; Cao, L.C.; Xie, Q. Shaking table test of seismic responses of anchor cable and lattice beam reinforced slope. J. Mt. Sci. 2020, 17, 1251–1268. [Google Scholar] [CrossRef]
  10. Li, J.; Hu, D.; Li, L.; Li, C. Research on Application of Lattice Anchor System Design and Construction Monitoring in Slope Protection. IOP Conf. Series Earth Environ. Sci. 2021, 781, 22049. [Google Scholar] [CrossRef]
  11. Dong, J.; Li, Z.Q.; Yan, X.; Liu, Y.; Zhao, S.R.; Qian, R.; Jiang, T. Effects of coarse aggregates on the mechanical properties, durability and microscopic behaviour of mortar rubble. Constr. Build. Mater. 2022, 354, 129187. [Google Scholar] [CrossRef]
  12. Caliskan, S.; Karihaloo, B.L.; Barr, B.I.G. Study of rock—Mortar interfaces. Part I: Surface roughness of rock aggregates and microstructural characteristics of interface. Mag. Concr. Res. 2002, 54, 449–461. [Google Scholar] [CrossRef]
  13. Li, Z.Q.; Chen, H.; Dong, J.; Yan, X.; Zhao, S.R.; Zheng, Y.H.; Liu, Y. Study of the Failure Mechanism of Mortar Rubble Using Digital Image Correlation, Acoustic Emission and Scanning Electron Microscopy. Buildings 2022, 12, 1313. [Google Scholar] [CrossRef]
  14. Scrivener, K.L.; Crumbie, A.K.; Laugesen, P. The interfacial transition zone (ITZ) between cement paste and aggregate in concrete. Interface Sci. 2004, 12, 411–421. [Google Scholar] [CrossRef]
  15. Pan, J.; Shen, Y.; Yang, G.; Zhang, H.; Yang, H.; Zhou, Z. Debonding behaviors and micro-mechanism of the interface transition zone in sandstone-concrete interface in response to freeze-thaw conditions. Cold Reg. Sci. Technol. 2021, 191, 103359. [Google Scholar] [CrossRef]
  16. Jin, L.; Fan, L.; Li, P.; Du, X. Size effect of axial-loaded concrete-filled steel tubular columns with different confinement coefficients. Eng. Struct. 2019, 198, 109503. [Google Scholar] [CrossRef]
  17. Jin, L.; Li, J.; Yu, W.; Du, X. Size effect modelling for dynamic biaxial compressive strength of concrete: Influence of lateral stress ratio and strain rate. Int. J. Impact Eng. 2021, 156, 103942. [Google Scholar] [CrossRef]
  18. Jin, L.; Li, J.; Yu, W.; Du, X. Mesoscopic simulations on the strength and size effect of concrete under biaxial loading. Eng. Fract. Mech. 2021, 253, 107870. [Google Scholar] [CrossRef]
  19. Murad, Y.Z. Predictive model for bidirectional shear strength of reinforced concrete columns subjected to biaxial cyclic loading. Eng. Struct. 2021, 244, 112781. [Google Scholar] [CrossRef]
  20. Van Mier, J.G.M.; Vonk, R.A. Fracture of concrete under multiaxial stress-recent developments. Mater. Struct. 1991, 24, 61–65. [Google Scholar] [CrossRef]
  21. Shang, H.S.; Song, Y.P. Experimental study of strength and deformation of plain concrete under biaxial compression after freezing and thawing cycles. Cem. Concr. Res. 2006, 36, 1857–1864. [Google Scholar] [CrossRef]
  22. Zhu, W.C.; Teng, J.G.; Tang, C.A. Numerical simulation of strength envelope and fracture patterns of concrete under biaxial loading. Mag. Concr. Res. 2002, 54, 395–409. [Google Scholar] [CrossRef]
  23. Tschegg, E.K.; Elser, M.; Kreuzer, H. Model fracture behaviour of concrete under biaxial loading. J. Mater. Sci. 1995, 30, 235–242. [Google Scholar] [CrossRef]
  24. Wang, H.T.; Zhou, Y.; Shen, J.Y. Experimental study of dynamic biaxial compressive properties of full grade aggregate concrete after freeze thaw cycles. Cold Reg. Sci. Technol. 2023, 205, 103710. [Google Scholar] [CrossRef]
  25. He, Z.J.; Ding, M.J.; Zhang, X.J.; Zhang, X.S. The Biaxial Compressive Mechanical Properties and Strength Criterion of Recycled Aggregate Concrete Under Different Dynamic Strain Rates. Iran. J. Sci. Technol. Trans. Civ. Eng. 2021, 45, 125–146. [Google Scholar] [CrossRef]
  26. Gao, S.; Hu, G. Experimental Study on Biaxial Dynamic Compressive Properties of ECC. Materials 2021, 14, 1257. [Google Scholar] [CrossRef] [PubMed]
  27. Li, Z.; Dong, J.; Jiang, T.; Feng, K.; Cheng, S.; Liu, Y.; Tian, X. Experimental Study on the Dynamic Fracture Characteristics of Mortar–Rock Interface Zones with Different Interface Inclinations and Shapes. Materials 2023, 16, 5475. [Google Scholar] [CrossRef] [PubMed]
  28. Wu, Z.; Rong, H.; Zheng, J.; Xu, F.; Dong, W. An experimental investigation on the FPZ properties in concrete using digital image correlation technique. Eng. Fract. Mech. 2011, 78, 2978–2990. [Google Scholar] [CrossRef]
  29. Fayyad, T.M.; Lees, J.M. Application of Digital Image Correlation to Reinforced Concrete Fracture. Procedia Mater. Sci. 2014, 3, 1585–1590. [Google Scholar] [CrossRef]
  30. Alam, S.Y.; Loukili, A.; Grondin, F. Monitoring size effect on crack opening in concrete by digital image correlation. Eur. J. Environ. Civ. Eng. 2012, 16, 818–836. [Google Scholar] [CrossRef]
  31. Jing, G.; Yunchang, D.; You, R.; Siahkouhi, M. Comparison study of crack propagation in rubberized and conventional prestressed concrete sleepers using digital image correlation. Proc. Inst. Mech. Eng. Part F J. Rail Rapid Transit 2022, 236, 350–361. [Google Scholar] [CrossRef]
  32. Thirumalaiselvi, A.; Sindu, B.S.; Sasmal, S. Crack propagation studies in strain hardened concrete using acoustic emission and digital image correlation investigations. Eur. J. Environ. Civ. Eng. 2022, 26, 4346–4373. [Google Scholar] [CrossRef]
  33. Boulekbache, B.; Hamrat, M.; Chemrouk, M.; Amziane, S. Failure mechanism of fibre reinforced concrete under splitting test using digital image correlation. Mater. Struct. 2015, 48, 2713–2726. [Google Scholar] [CrossRef]
  34. Huang, Y.; He, X.; Wang, Q.; Xiao, J. Deformation field and crack analyses of concrete using digital image correlation method. Front. Struct. Civ. Eng. 2019, 13, 1183–1199. [Google Scholar] [CrossRef]
  35. Li, D.; Huang, P.; Chen, Z.; Yao, G.; Guo, X.; Zheng, X.; Yang, Y. Experimental study on fracture and fatigue crack propagation processes in concrete based on DIC technology. Eng. Fract. Mech. 2020, 235, 107166. [Google Scholar] [CrossRef]
  36. Lakavath, C.; Prakash, S.S. Interface Shear Behavior of Ultrahigh-Performance Fiber-Reinforced Concrete Using Digital Image Correlation Technique. J. Mater. Civ. Eng. 2024, 36, 04023589. [Google Scholar] [CrossRef]
  37. Ohno, K.; Ohtsu, M. Crack classification in concrete based on acoustic emission. Constr. Build. Mater. 2010, 24, 2339–2346. [Google Scholar] [CrossRef]
  38. Grosse, C.U.; Finck, F. Quantitative evaluation of fracture processes in concrete using signal-based acoustic emission techniques. Cem. Concr. Compos. 2006, 28, 330–336. [Google Scholar] [CrossRef]
  39. Sagar, R.V.; Prasad, B.R.; Kumar, S.S. An experimental study on cracking evolution in concrete and cement mortar by the b-value analysis of acoustic emission technique. Cem. Concr. Res. 2012, 42, 1094–1104. [Google Scholar] [CrossRef]
  40. Zhang, H.; Ji, S.S.; Liu, H.; Liu, X.Y.; Li, X.C.; Zheng, S.Z.; Cao, Z.X. Research on dynamic splitting tensile damage characteristics of steel fiber reinforced concrete under freeze-thaw cycle environment based on AE. J. Build. Eng. 2024, 84, 108490. [Google Scholar] [CrossRef]
  41. Barbosh, M.; Sadhu, A. Damage identification in concrete structures using a hybrid time–frequency decomposition of acoustic emission responses. J. Civ. Struct. Health Monit. 2024, 14, 237–253. [Google Scholar] [CrossRef]
  42. Alam, S.Y.; Saliba, J.; Loukili, A. Fracture examination in concrete through combined digital image correlation and acoustic emission techniques. Constr. Build. Mater. 2014, 69, 232–242. [Google Scholar] [CrossRef]
  43. Fan, X.; Li, S.; Chen, X.; Liu, S.; Guo, Y. Fracture behaviour analysis of the full-graded concrete based on digital image correlation and acoustic emission technique. Fatigue Fract. Eng. Mater. Struct. 2020, 43, 1274–1289. [Google Scholar] [CrossRef]
  44. Feiteira, J.; Tsangouri, E.; Gruyaert, E.; Lors, C.; Louis, G.; De Belie, N. Monitoring crack movement in polymer-based self-healing concrete through digital image correlation, acoustic emission analysis and SEM in-situ loading. Mater. Des. 2017, 115, 238–246. [Google Scholar] [CrossRef]
  45. Shang, S.; Song, Y. Dynamic biaxial tensile–compressive strength and failure criterion of plain concrete. Constr. Build. Mater. 2013, 40, 322–329. [Google Scholar] [CrossRef]
  46. Sun, Y.; Pang, J.H.; Wong, C.K.; Su, F. Finite element formulation for a digital image correlation method. Appl. Opt. 2005, 44, 7357–7363. [Google Scholar] [CrossRef] [PubMed]
  47. Kachanov, L.M. Rupture time under creep conditions. Int. J. Fract. 1999, 97, 11–18. [Google Scholar] [CrossRef]
  48. Lian, S.; Zheng, K.; Zhao, Y.; Bi, J.; Wang, C.; Huang, Y.S. Investigation the effect of freeze–thaw cycle on fracture mode classification in concrete based on acoustic emission parameter analysis. Constr. Build. Mater. 2023, 362, 129789. [Google Scholar] [CrossRef]
  49. Zhao, Y.-R.; Wang, L.; Lei, Z.-K.; Han, X.-F.; Shi, J.-N. Study on bending damage and failure of basalt fiber reinforced concrete under freeze-thaw cycles. Constr. Build. Mater. 2018, 163, 460–470. [Google Scholar] [CrossRef]
  50. Ohtsu, M. Rate process analysis of acoustic emission activity in core test of concrete. Doboku Gakkai Ronbunshu 1992, 1992, 211–217. [Google Scholar] [CrossRef]
  51. Ohtsu, M.; Watanabe, H. Quantitative damage estimation of concrete by acoustic emission. Constr. Build. Mater. 2001, 15, 217–224. [Google Scholar] [CrossRef]
  52. Nosov, V.V.; Chaplin, I.E.; Gilyazetdinov, E.R.; Grigoriev, E.V.; Pavlenko, I.A. Micromechanics, nanophysics and non-destructive testing of the strength of structural materials. Mater. Phys. Mech. 2019, 42, 808–824. [Google Scholar]
  53. Li, Z.; Dong, J.; Chen, H.; Wu, Z.; Feng, K.; Zhang, G.; Jiang, T. Mechanical behaviour and acoustic emission characteristics of basalt fibre mortar rubble under uniaxial cyclic compression. Constr. Build. Mater. 2023, 393, 132145. [Google Scholar] [CrossRef]
  54. Xu, J.; Niu, X.; Yao, Z. Mechanical properties and acoustic emission data analyses of crumb rubber concrete under biaxial compression stress states. Constr. Build. Mater. 2021, 298, 123778. [Google Scholar] [CrossRef]
Figure 2. Schematic representation of stress states: (a) uniaxial compression and (b) biaxial compression.
Buildings 14 01942 g002
Figure 3. Bidirectional loading path schematic.
Buildings 14 01942 g003
Figure 4. Test layout schematic.
Buildings 14 01942 g004
Figure 5. Acoustic emission sensor layout.
Buildings 14 01942 g005
Figure 6. Peak stress and peak strain of the slurry masonry schist samples under different lateral pressures: (a) peak stress and (b) peak strain.
Buildings 14 01942 g006
Figure 7. Relationship between stress level and damage: (a) LP0.4 fc and (b) FT80.
Buildings 14 01942 g007
Figure 8. Damage prediction models: (a) LP0.4 fc and (b) FT80.
Buildings 14 01942 g008
Figure 9. Stress, acoustic emission ringing count, and cumulative impact curves: (a) FT0; (b) FT40; and (c) FT80.
Buildings 14 01942 g009
Figure 10. Crack classification.
Buildings 14 01942 g010
Figure 11. Characteristic diagrams of RA–AF: (a) uniaxial compression and (b) biaxial compression.
Buildings 14 01942 g011
Figure 12. Schematic diagram of the percentage of tensile cracks.
Buildings 14 01942 g012
Figure 13. Plots of (b) value changes: (a) uniaxial compression; (b) biaxial compression.
Buildings 14 01942 g013
Figure 14. Analysis of localized damage points: The blue symbols indicate sensor positions, while the red symbols represent acoustic emission signals.
Buildings 14 01942 g014
Figure 15. Main strain cloud diagrams of the slurry masonry schist samples (this figure shows the main strain clouds of the slurry masonry schist samples in different stress stages with the number of freezing and thawing cycles at a lateral pressure of 0.6 fc).
Buildings 14 01942 g015
Figure 16. Damaged state of a slurry masonry schist sample.
Buildings 14 01942 g016
Figure 17. Intersecting line position.
Buildings 14 01942 g017
Figure 18. Plot of the maximum principal strain variation along the truncation direction (this figure shows the strain variation along the truncation direction at a lateral pressure of 0.6 fc).
Buildings 14 01942 g018
Table 5. The main parameters of the DIC scattering deformation measurement system.
Pixel SizeCaptureMatching MethodSearch Range RadiusBackground Check ThresholdContinuity Threshold
1960 × 12802 HzHorizontal matching7511
Table 6. Main parameters of the acoustic emission system.
Sampling FrequencyPDTHDTHLFHigh Pass
On-Board Filter
Low Pass
On-Board Filter
2.5 MHz100 μs300 μs200 μs100 kHz20 kHz
Table 7. Parameter fitting table.
Test Conditionsabc/NmR2
FT00.6890.8250.2820.938
FT402.758−1.2223.0990.991
FT8024.241−22.3184.6310.926
LP0fc5.661−6.086415.2270.962
LP0.2fc4.659−4.00753.2530.975
LP0.4fc6.018−5.432217.3410.989
LP0.6fc5.092−4.07654.3960.986
Disclaimer/Publisher’s Note: The statements, opinions and data contained in all publications are solely those of the individual author(s) and contributor(s) and not of MDPI and/or the editor(s). MDPI and/or the editor(s) disclaim responsibility for any injury to people or property resulting from any ideas, methods, instructions or products referred to in the content.

