Article

Pix2Pix-Assisted Beijing Hutong Renovation Optimization Method: An Application to the UTCI and Thermal and Ventilation Performance

1
School of Geomatics and Urban Spatial Informatics, Beijing University of Civil Engineering and Architecture, Beijing 102616, China
2
School of Architecture Civil Engineering, Huangshan University, Huangshan 245041, China
3
Engineering Research Center of Representative Building and Architectural Heritage Database, Key Laboratory for Urban Geomatics of National Administration of Surveying, Mapping and Geoinformation, The Ministry of Education, Beijing 100044, China
4
Beijing Construction Engineering Group, Beijing 100055, China
5
BCEG No. 4 Construction Engineering Co., Ltd., Beijing 100024, China
6
School of Architecture and Urban Planning, Beijing University of Civil Engineering and Architecture, Beijing 102616, China
*
Author to whom correspondence should be addressed.
Buildings 2024, 14(7), 1957; https://doi.org/10.3390/buildings14071957
Submission received: 27 May 2024 / Revised: 20 June 2024 / Accepted: 21 June 2024 / Published: 27 June 2024
(This article belongs to the Section Architectural Design, Urban Science, and Real Estate)

Abstract

:
In response to the issues of low outdoor thermal comfort and poor ventilation environment in Beijing Hutong, this paper proposes a rapid intelligent optimization method combining Pix2Pix (Image-to-Image Translation with Conditional Adversarial Networks) with a genetic algorithm. Firstly, the architectural types of the research objects are highly refined and summarized into four traditional building types. Then, they are placed in the site with open spaces in a certain proportion, and a multi-objective optimization model for the UTCI (Universal Thermal Climate Index) and building area is constructed using a genetic algorithm, generating and iteratively optimizing the spatial layout of the building population. Finally, Pix2Pix is used to learn and train a large number of Hutong combination samples, rapidly generating the UTCI and ventilation results, which serve as the optimization objectives to obtain the optimal solution set for Hutong spatial forms. Compared with traditional empirical design methods, this method allows for a rapid and efficient traversal of vast solution spaces, intelligently generating Hutong renovation schemes that balance cultural heritage and healthy comfort. The research results demonstrate that this method can quickly find (26.4 times faster than traditional performance simulation methods) that the reasonable proportions of Siheyuan, Sanheyuan, Erheyuan, new buildings, and empty spaces in the Da Yuan Hutong in Beijing should be controlled at 11.8%, 16.9%, 23.8%, 33.8%, and 13.7%, respectively. Meanwhile, the building density should be maintained between 0.5 and 0.58, and the floor area ratio should be kept between 0.96 and 1.14. This significantly improves outdoor comfort, enhances the living environment of the Hutong, and promotes sustainable urban development.

1. Introduction

With the acceleration of urbanization and the intensification of climate change, the issue of urban heat island effect [1] has become increasingly prominent, severely affecting the quality of life for urban residents [2,3]. Enhancing thermal comfort in the Hutong areas of Beijing has thus become a critical task in China’s urban renewal efforts. Beijing’s Hutong areas are renowned for their unique urban form and cultural characteristics, yet the problems of high density and poor ventilation directly impact residents’ quality of life and the city’s livability. This paper aims to provide scientific basis and technical support for the renewal of Beijing’s Hutong areas through the study of thermal comfort [4], thereby promoting sustainable development in these areas and advancing urban construction and social progress. Traditional methods for simulating building performance have some limitations. Firstly, they require high computer specifications, including specialized software and powerful computing capabilities. Secondly, they demand a high level of expertise from personnel engaged in building performance simulation. Additionally, each simulation often takes a long time, making it difficult to quickly explore design space options. In contrast, Pix2Pix is a type of image transformation model based on conditional generative adversarial networks [5]. Utilizing this technology can address these limitations. It only requires learning from a small number of simulation results to rapidly generate a large quantity of performance predictions. These results can directly serve as inputs for genetic algorithm optimization, significantly accelerating the iterative optimization of design proposals. This approach represents an effective means of AI-assisted performance modelling in architecture, enabling the intelligent optimization of architectural spatial forms and providing new avenues for the digitalization and intelligence of architectural design [6].
In the field of outdoor thermal comfort research, the issue of outdoor thermal stress during summer in the Beijing-Tianjin-Hebei region was explored by Huang et al. [7]. Their findings revealed a significant increase in daytime UTCI and thermal stress frequency, highlighting the need for urban design to mitigate thermal stress and calling for a further exploration of its long-term impacts on the environment and health. Liu et al. compared indoor and outdoor thermal comfort data, uncovering that outdoor thermal comfort is relatively easier to achieve, and advocated for the establishment of a global standardized database to advance research in outdoor thermal comfort [8]. Liu et al. investigated the impact of wind speed and solar radiation on outdoor thermal comfort, using linear regression analysis to systematically evaluate these effects, and suggested further studies on the combined effects under different climatic conditions [9]. Overall, both domestic and international scholars have conducted in-depth research on urban thermal environments and outdoor thermal comfort from multiple perspectives, including comparing indoor and outdoor thermal comfort [10], exploring influencing factors [11], and proposing improvement strategies [12]. The findings indicate that urban design plays a crucial role in alleviating thermal stress [13,14,15], with factors such as wind speed and solar radiation having significant impacts on the urban thermal environment. Psychological factors are also critical in studies of outdoor comfort. Although research has identified some potential improvement pathways, there is still a need to enhance standardized databases and optimize design methods to address the challenges of urban thermal environments.
The Beijing Hutong bear rich historical and cultural heritage and a unique urban landscape. Effectively preserving this heritage while achieving modern development has become a global focus for urban planners and decision-makers [16]. Traditional urban planning and renewal methods often struggle to balance heritage preservation with modernization. Hence, there is an urgent need for intelligent optimization methods [17] that can advance renovation and preservation while retaining the unique spatial and cultural features of the Hutongs. This paper explores an intelligent approach to assist in optimizing the Beijing Hutong renovations using genetic algorithm technology, aiming to offer innovative ideas and technical support for urban renewal in China and contribute to national urban renewal strategies [18]. Addressing the impact of architectural and urban design parameters on energy performance, Natanian and Wortmann proposed simplified evaluation indicators to assess the potential of architectural and urban forms in tropical climates for energy balance, demonstrating their applicability in multi-objective optimization [19]. Dorrah and Marzouk introduced a multi-objective optimization-based decision support tool for architectural spatial layout, aiming to enhance layout design to improve building energy efficiency and comfort [20]. Rosso et al. utilized genetic algorithms to address architectural energy performance optimization, emphasizing the need for user-friendly tools to facilitate wider adoption [21]. In architectural design, Brown et al. proposed a data-driven design toolbox, highlighting the importance of prioritizing in multi-objective design [22]. Overall, over the past five years, domestic and international research has extensively applied genetic algorithm multi-objective optimization techniques in various fields such as intelligent building energy optimization [23], building operation optimization [24], renewable energy system design [25], urban design multi-objective optimization [26], architectural space layout optimization [20], and data-driven design [27]. The application prospects are broad, and innovative solutions and methods tailored to specific practical issues in each field have been proposed. These studies have not only expanded theoretical and practical knowledge within their respective domains but also provided valuable insights, robust technical support, and theoretical foundations for addressing critical issues such as energy efficiency, environmental impact, and intelligent design optimization in contemporary architecture and urbanization. They are actively promoting the smart and sustainable development of cities [28].
Pix2Pix has been successfully applied in various directions such as optimizing urban road networks and building forms, the intelligent generation of campus layout plans, the automated generation of green areas, architectural plan image generation, and infrared image conversion to real scene images. In the field of internal material behavior research, Grebo et al. proposed a novel method that combines infrared thermography and digital image correlation techniques, providing new insights for solving internal strain distribution problems in loaded structures [29]. Huang et al., using Pix2Pix technology, conducted a preliminary exploration of building form optimization and energy efficiency issues, demonstrating the potential of multi-objective optimization in urban design. However, further research is needed to address the challenges of performance simulation for large-scale urban forms [30]. Li et al. proposed urban block design strategies based on genetic algorithms and GAN technology, combined with CFD simulation techniques, optimized outdoor wind environments, and demonstrated the effectiveness of the design strategies. However, a further exploration of different design strategies is needed [31]. Addressing the dynamic response issues in urban environment simulation, an innovative approach based on the GAN algorithm has been proposed by Zhou et al. to dynamically adapt to urban spaces in real time. The exploration of optimal strategies to enhance flood resilience provides significant insights for urban planning, design, and environmental research [32]. Addressing current challenges in urban design such as complex and inefficient design processes, Gan et al., proposing the use of GAN deep learning for deeper and quantitative analysis, provides assistance to designers in overcoming learning bottlenecks [33]. Tang et al. introduced a multi-scale spatial pooling and multi-channel attention selection GAN method for image generation, aiming to improve image generation performance [34]. Although this method performs better on multiple datasets, there is still room for improvement in generating image layouts and content details. It requires a further optimization of semantic guidance accuracy and exploration of more effective generation network structures. In summary, the Pix2Pix model based on generative adversarial networks (GAN) has broad prospects for application in the field of architectural form optimization research. However, there is currently limited research combining the Pix2Pix algorithm with genetic algorithms for the rapid exploration of comfort-based renovation and optimization of urban Heritage Site Clusters. This approach effectively addresses issues such as determining appropriate ratios of different functional buildings, building density, and floor area ratio within Heritage Site Clusters.
Therefore, this paper proposes a rapid intelligent optimization design method based on parametric modeling, combined with Pix2Pix and multi-objective genetic algorithms, to address the problems of narrow spaces, poor ventilation, and discomfort in traditional Beijing Hutong. It aims to quickly obtain healthy and comfortable outdoor spaces and conduct an in-depth and meticulous analysis and interpretation of experimental data to identify patterns, formulate strategies, and achieve the organic renewal and sustainable development of Beijing Hutong.

2. Theoretical Method Analysis

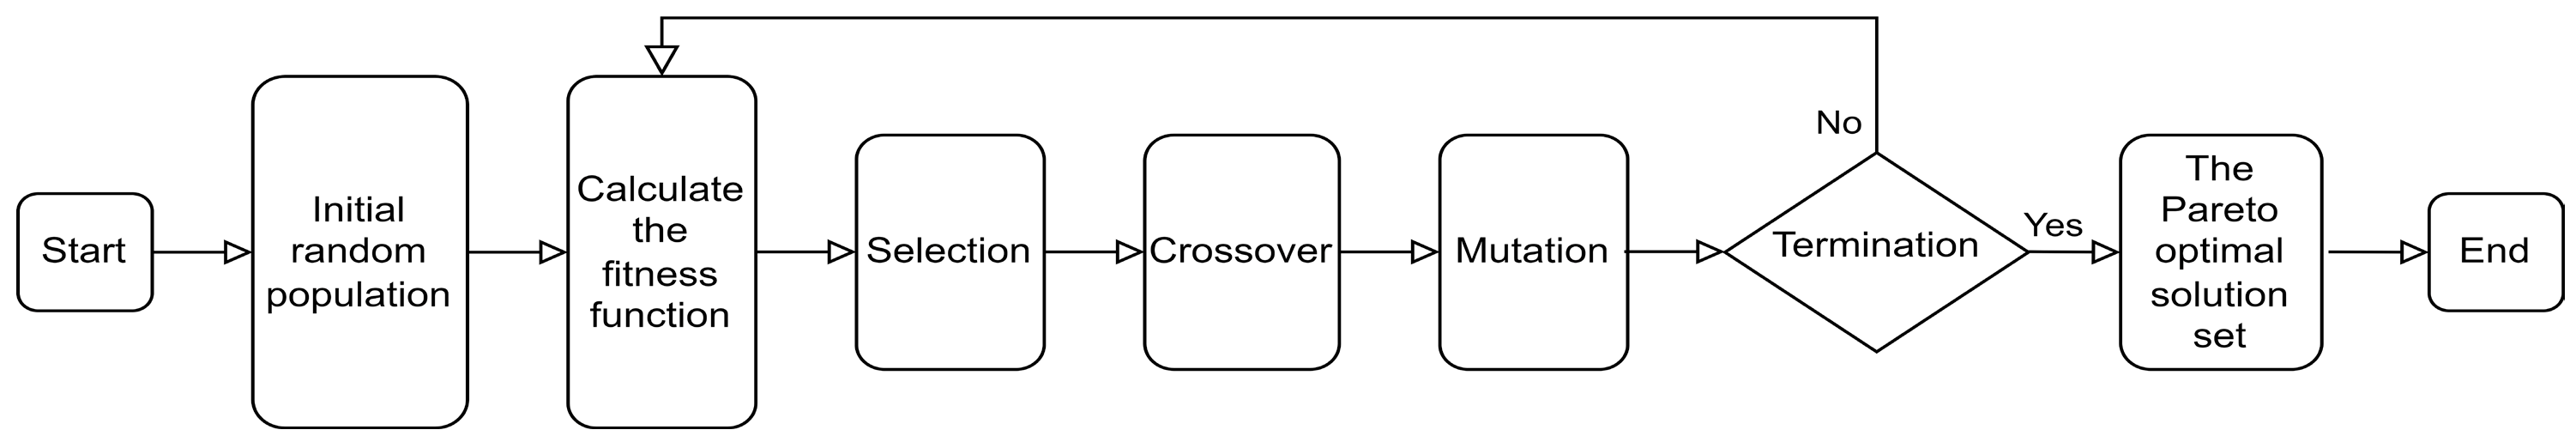
2.1. Genetic Algorithms

Genetic algorithms are not a single algorithm but rather a class of algorithms inspired by the process of natural selection [35,36,37]. Genetic algorithms are used to find approximate solutions to optimization and search problems. Their basic principle involves continuously applying genetic operations to candidate solutions, evolving increasingly superior solutions over generations. The operational steps of genetic algorithms include the initialization of the population, selection, crossover, mutation, and evaluation. In the initialization of population stage, a set of initial solutions is randomly generated as the population [38]. Subsequently, through the selection operation, individuals with higher fitness values are chosen based on their solutions. Then, the crossover operation simulates the mating process in biology to generate new solutions. Following that, the mutation operation introduces randomness to increase the diversity of the population. Finally, through the evaluation operation, the fitness value of each individual is calculated to guide the selection and mutation processes of the next generation. The overall process is illustrated in Figure 1.
In architecture, genetic algorithms are widely applied in areas such as architectural design optimization, energy management, and structural design. For example, in architectural design optimization, genetic algorithms can be used to search for the optimal combination of design parameters to meet multiple design objectives, such as building performance, cost, and environmental impact. In terms of energy management, genetic algorithms can be employed to optimize the control strategies of building energy systems, thereby improving energy efficiency and reducing energy consumption.
In the optimization of architectural spatial morphology, genetic algorithms are extensively utilized to meet thermal comfort requirements. Through genetic algorithms, the spatial morphology of Heritage Site Clusters can be explored and optimized to maximize thermal comfort [39]. Firstly, genetic algorithms can be used to optimize the layout and orientation of buildings to maximize natural ventilation and daylight utilization [40], thus reducing heat accumulation within the buildings. By adjusting parameters such as spacing, orientation, and height between buildings, a more ventilated and shaded environment can be created within Heritage Site Clusters, reducing heat transfer and accumulation. Secondly, genetic algorithms can optimize the design of building facades to enhance insulation performance and shading effects. By adjusting parameters such as materials, colors, and window-to-wall ratios, external heat ingress can be minimized while ensuring adequate daylighting and ventilation in interior spaces. Additionally, genetic algorithms can optimize the overall layout and structural form of Heritage Site Clusters [41] to reduce the urban heat island effect and local hotspots, thereby enhancing overall thermal comfort. Introducing green spaces, water features, and shading facilities within Heritage Site Clusters can effectively lower ambient temperatures and improve occupants’ thermal comfort. In summary, the application of genetic algorithms in the intelligent optimization of architectural spatial morphology can assist designers and planners in effectively improving the thermal environment of Heritage Site Clusters, enhancing occupants’ thermal comfort, and creating more comfortable and livable built environments.

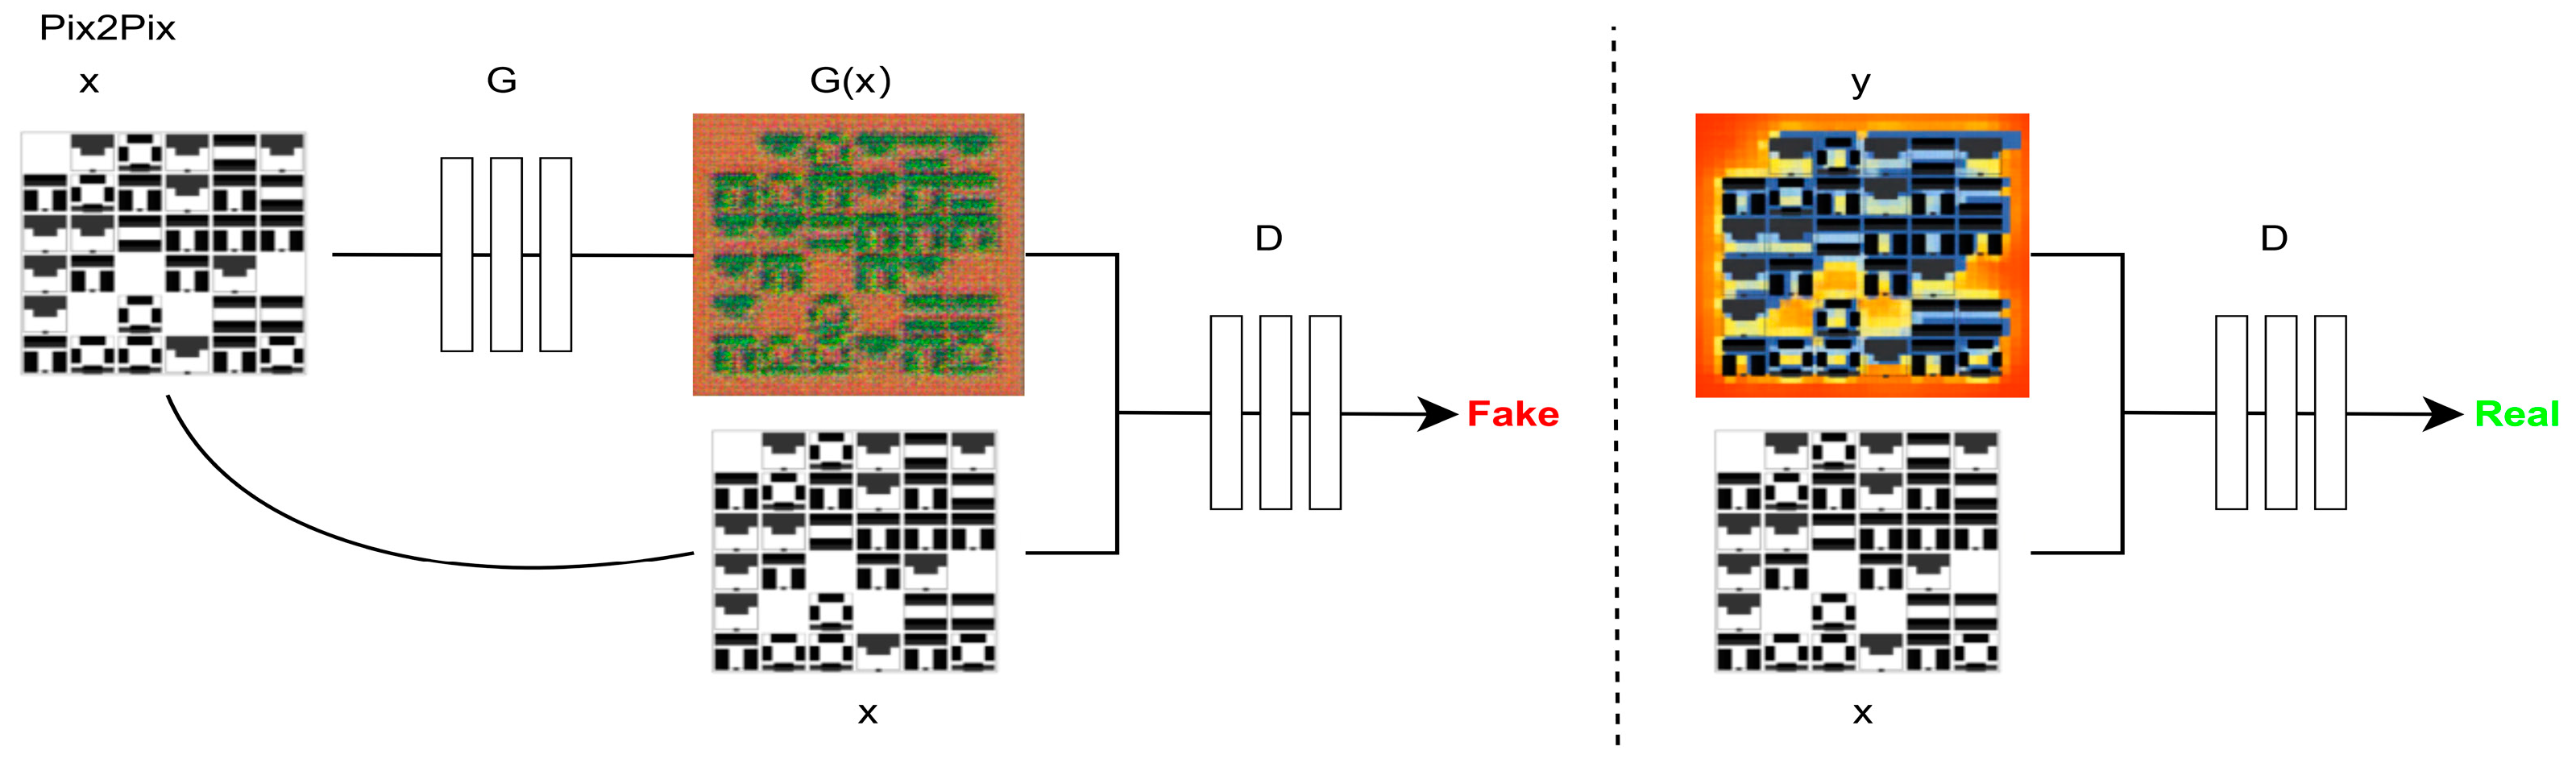
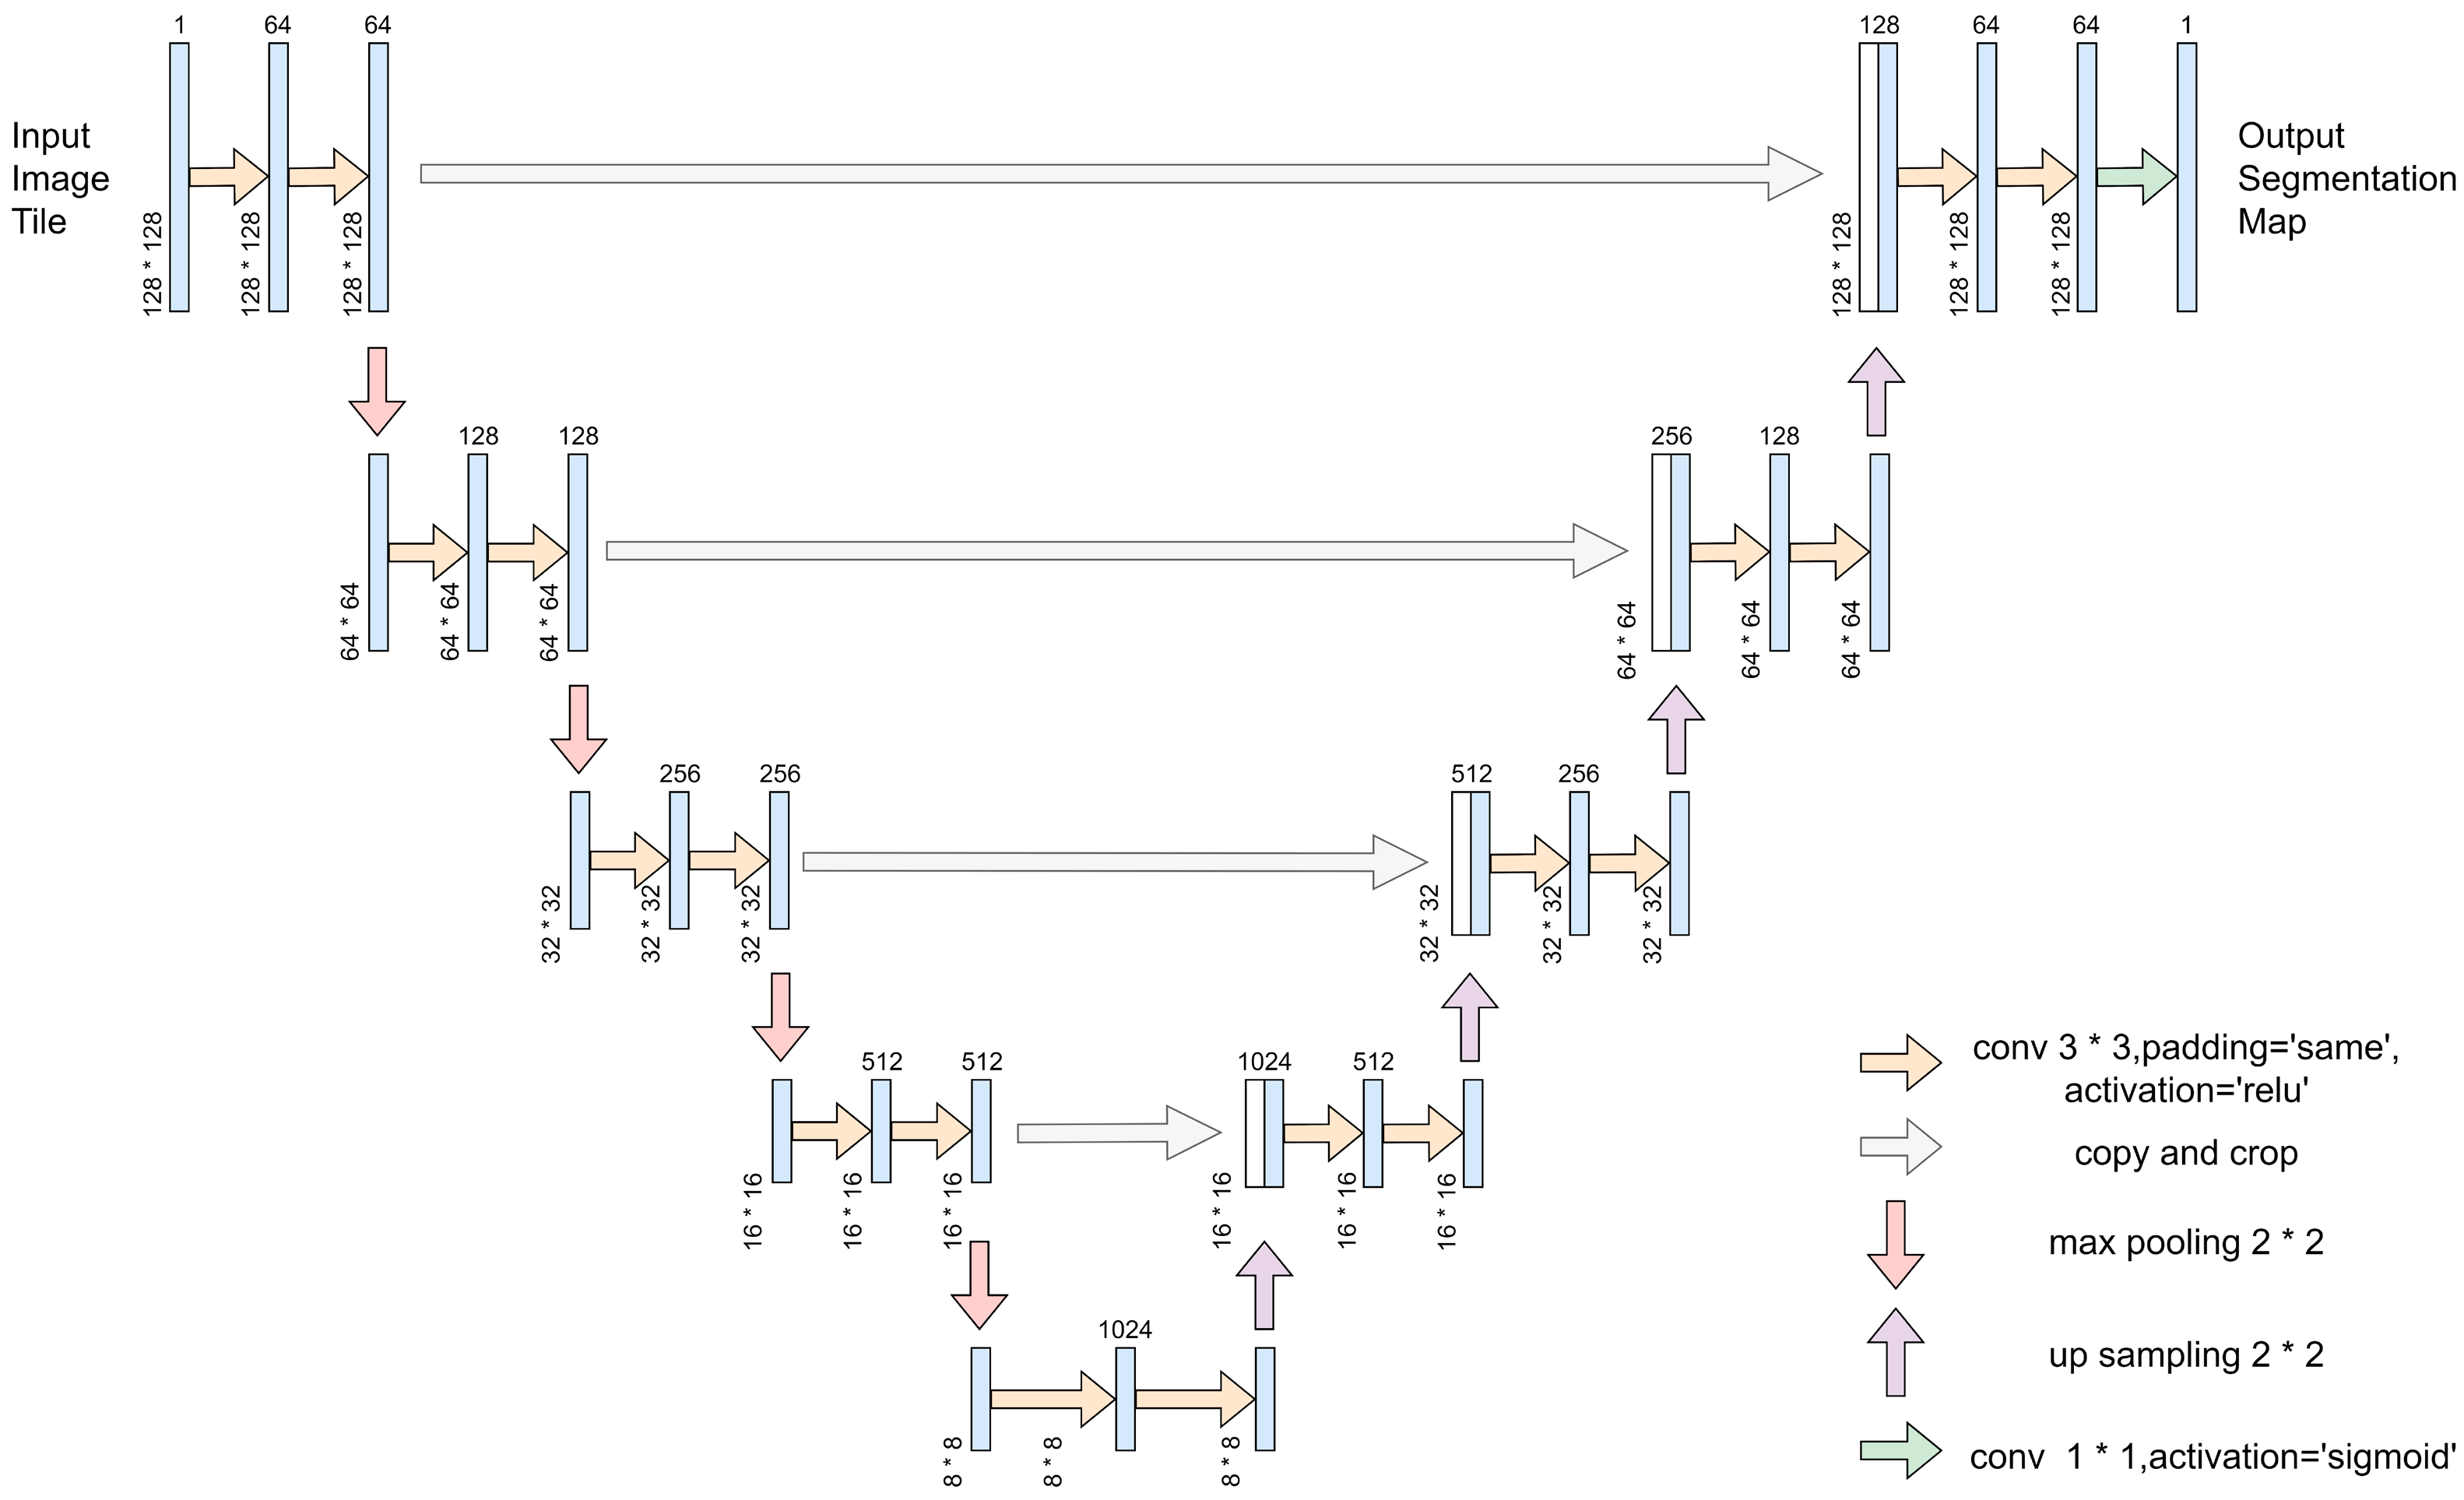
2.2. Pix2Pix Algorithm

Pix2Pix, as a type of image translation model based on conditional GANs, employs a GAN architecture consisting of both a generator model (G) and a discriminator model (D) [42]. These two modules engage in an adversarial game to produce high-quality outputs, as illustrated in Figure 2, where x is the original input of the architectural layout, G(x) is the result directly generated by the Pix2Pix algorithm, and y is the real result of the architectural performance simulation. An outstanding GAN requires an effective training method; otherwise, the flexibility of neural network models may result in poor output quality. The generator model adopts a U-Net structure, which not only features an encoder–decoder architecture but also includes skip connections. The workflow is depicted in Figure 3.
The discriminator employs a Patch GAN structure, which divides the input image into various N × N patches. Each patch serves as a receptive field, and the discriminator evaluates the authenticity of each patch independently. The final discriminator output is the average of the results from all patches [43]. The objective function for Pix2Pix is designed as follows: the generator G aims to minimize the objective function, while the discriminator D strives to maximize it. That is G * = argmin G max D L cGAN ( G , D ) :
cGAN ( G , D ) = E x , y [ logD ( x , y ) ] + E x , z [ log ( 1 D ( x , G ( x , z ) ) ) ]
where z is the conditional vector in conditional Generative Adversarial Network (cGAN), which provides additional information to help the generator produce more realistic outputs. In order to make the output images closer to real images, the L1 distance is used to reduce blurriness. The modified formula is as follows:
L 1 ( G ) = E x , y , z [ y G ( x , z ) 1 ]
The final obtained loss function is as follows:
G * = argmin G max D L cGAN ( G , D ) + λ L 1 ( G )
During training, Pix2Pix relies on paired images (x and y), where x serves as the input to the generator G to produce the image G(x). Subsequently, the generated image G(x) is concatenated with the original image x and fed into the discriminator D to obtain a prediction probability. This probability is used to determine whether the input is a real image pair; a value closer to 1 indicates a higher certainty by the discriminator D that the input is a real image pair. The training objective of the generator G is to make the probability values outputted by the discriminator D as close to 1 as possible, successfully deceiving the discriminator D. In the absence of explicitly shown random noise z, removing z does not significantly affect the generation performance. However, combining x and z as inputs to G results in more diverse output outcomes.

3. Experiment Logic Design
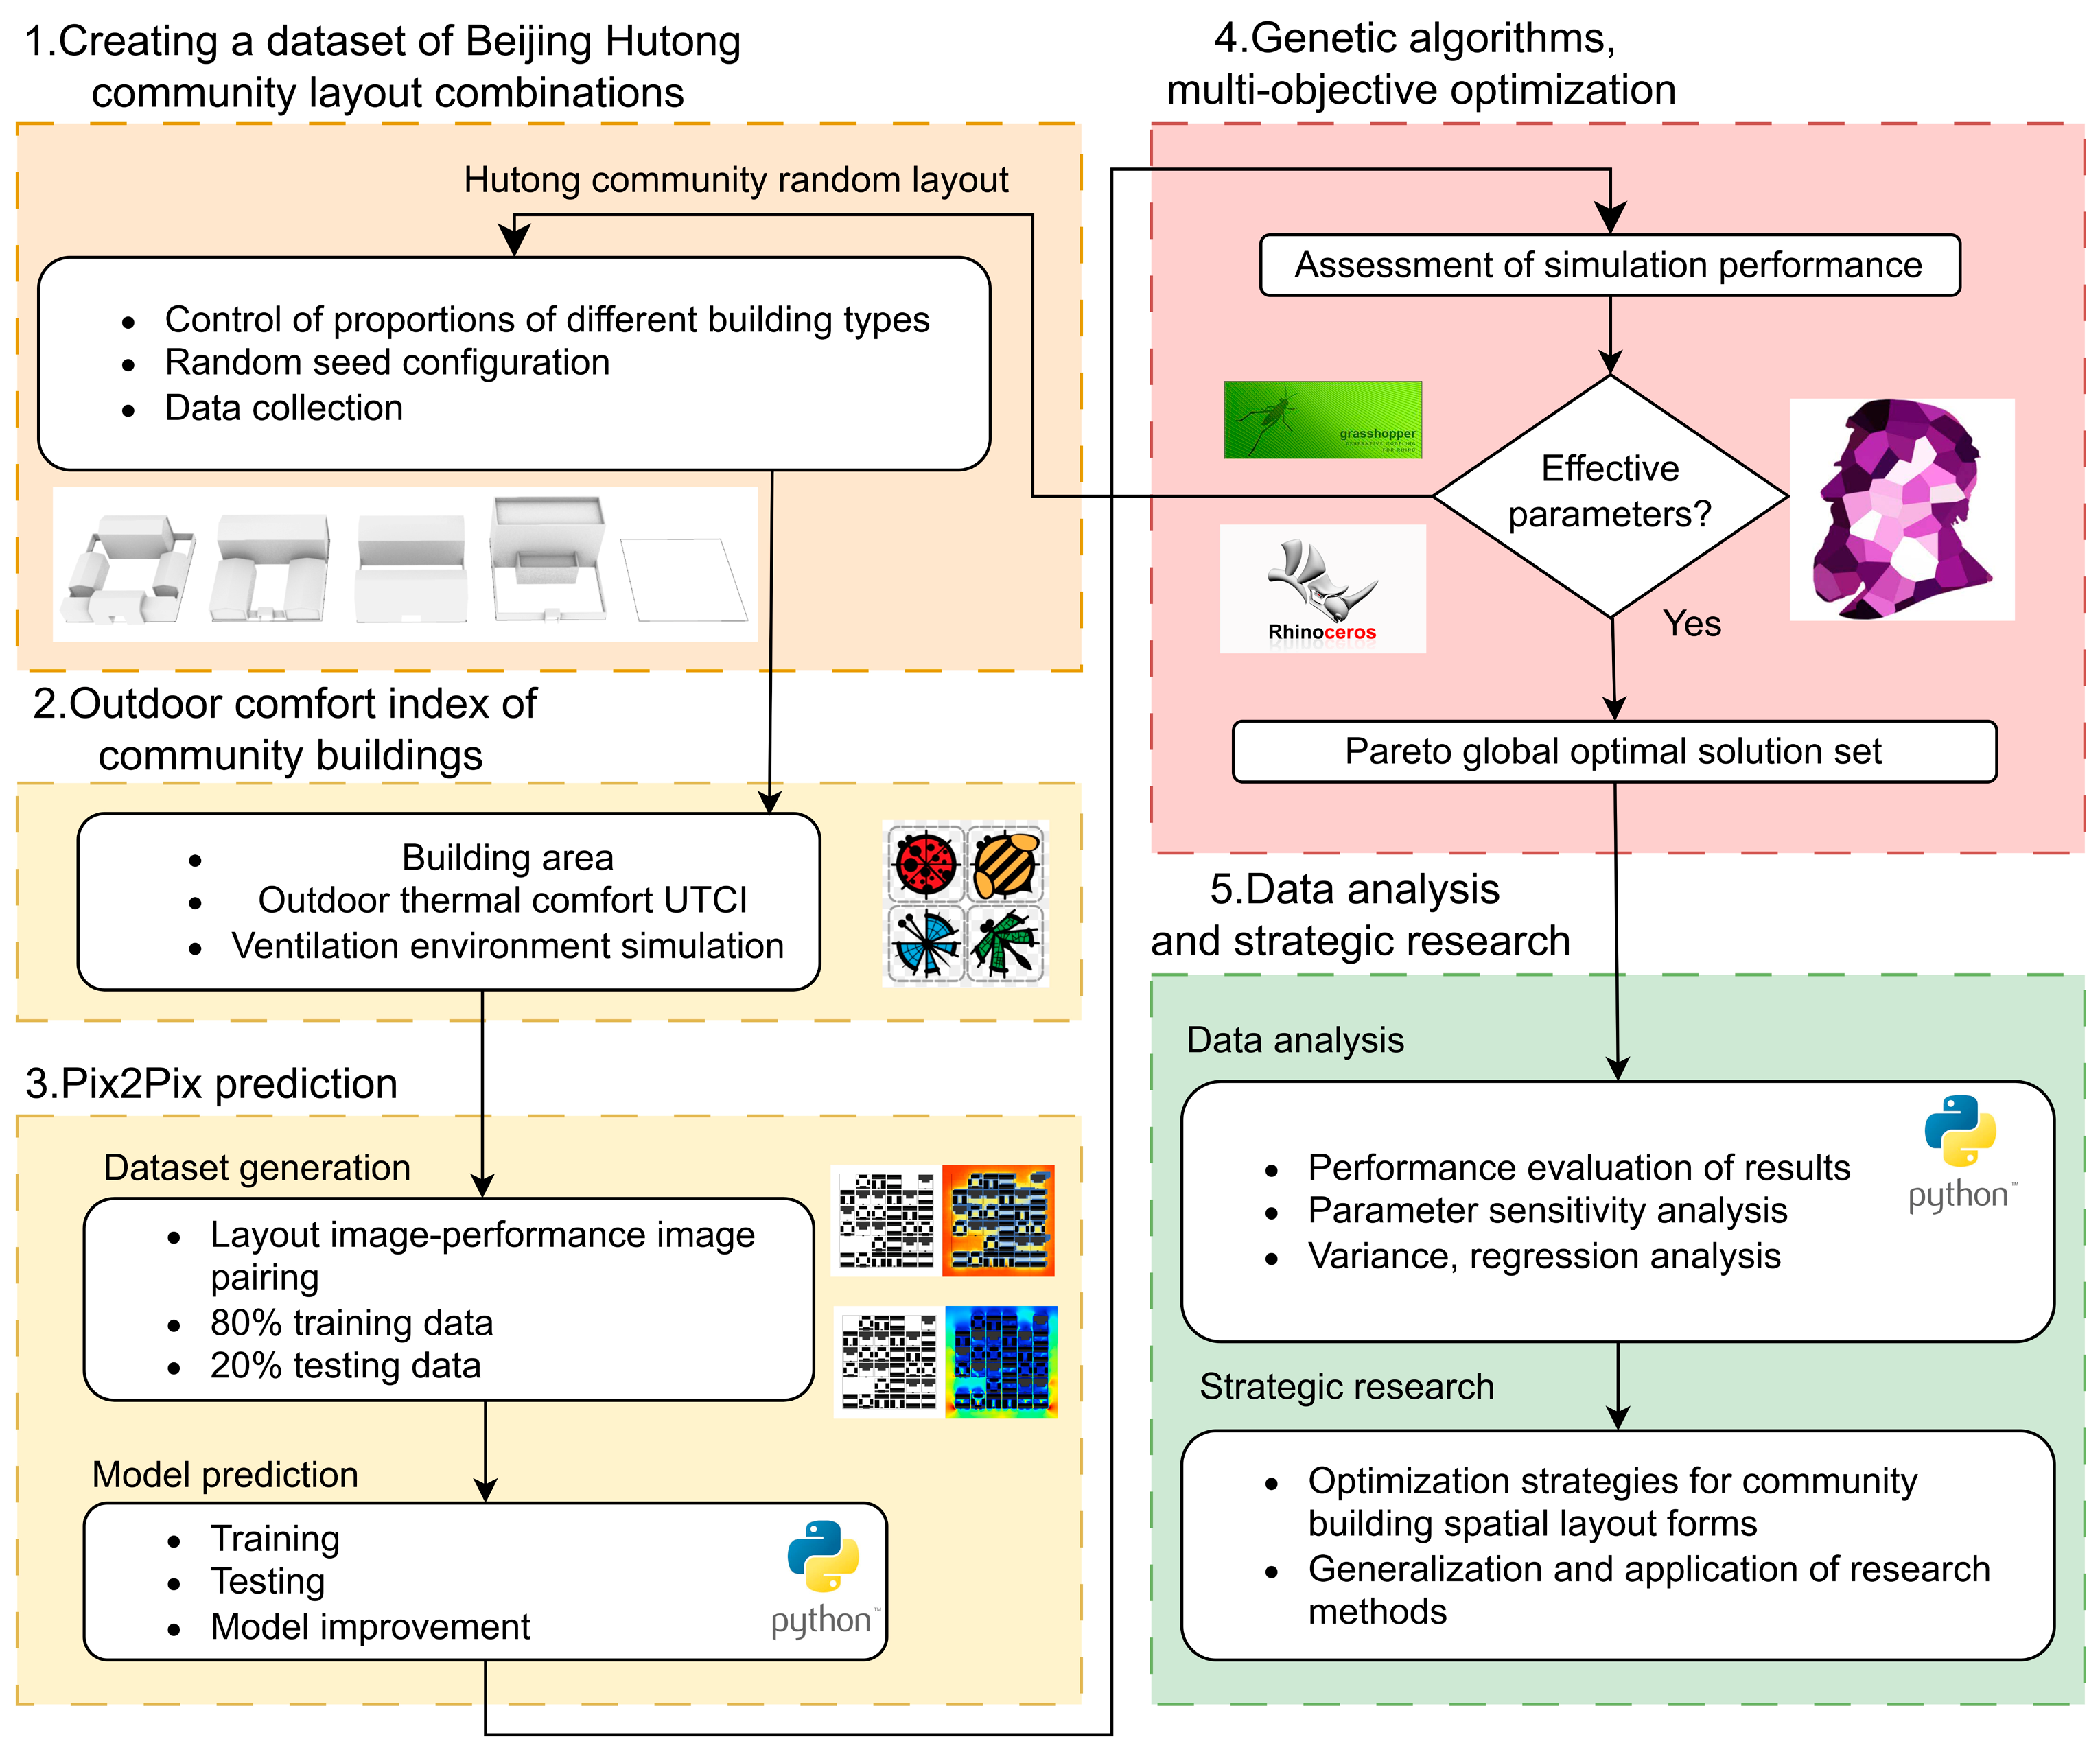
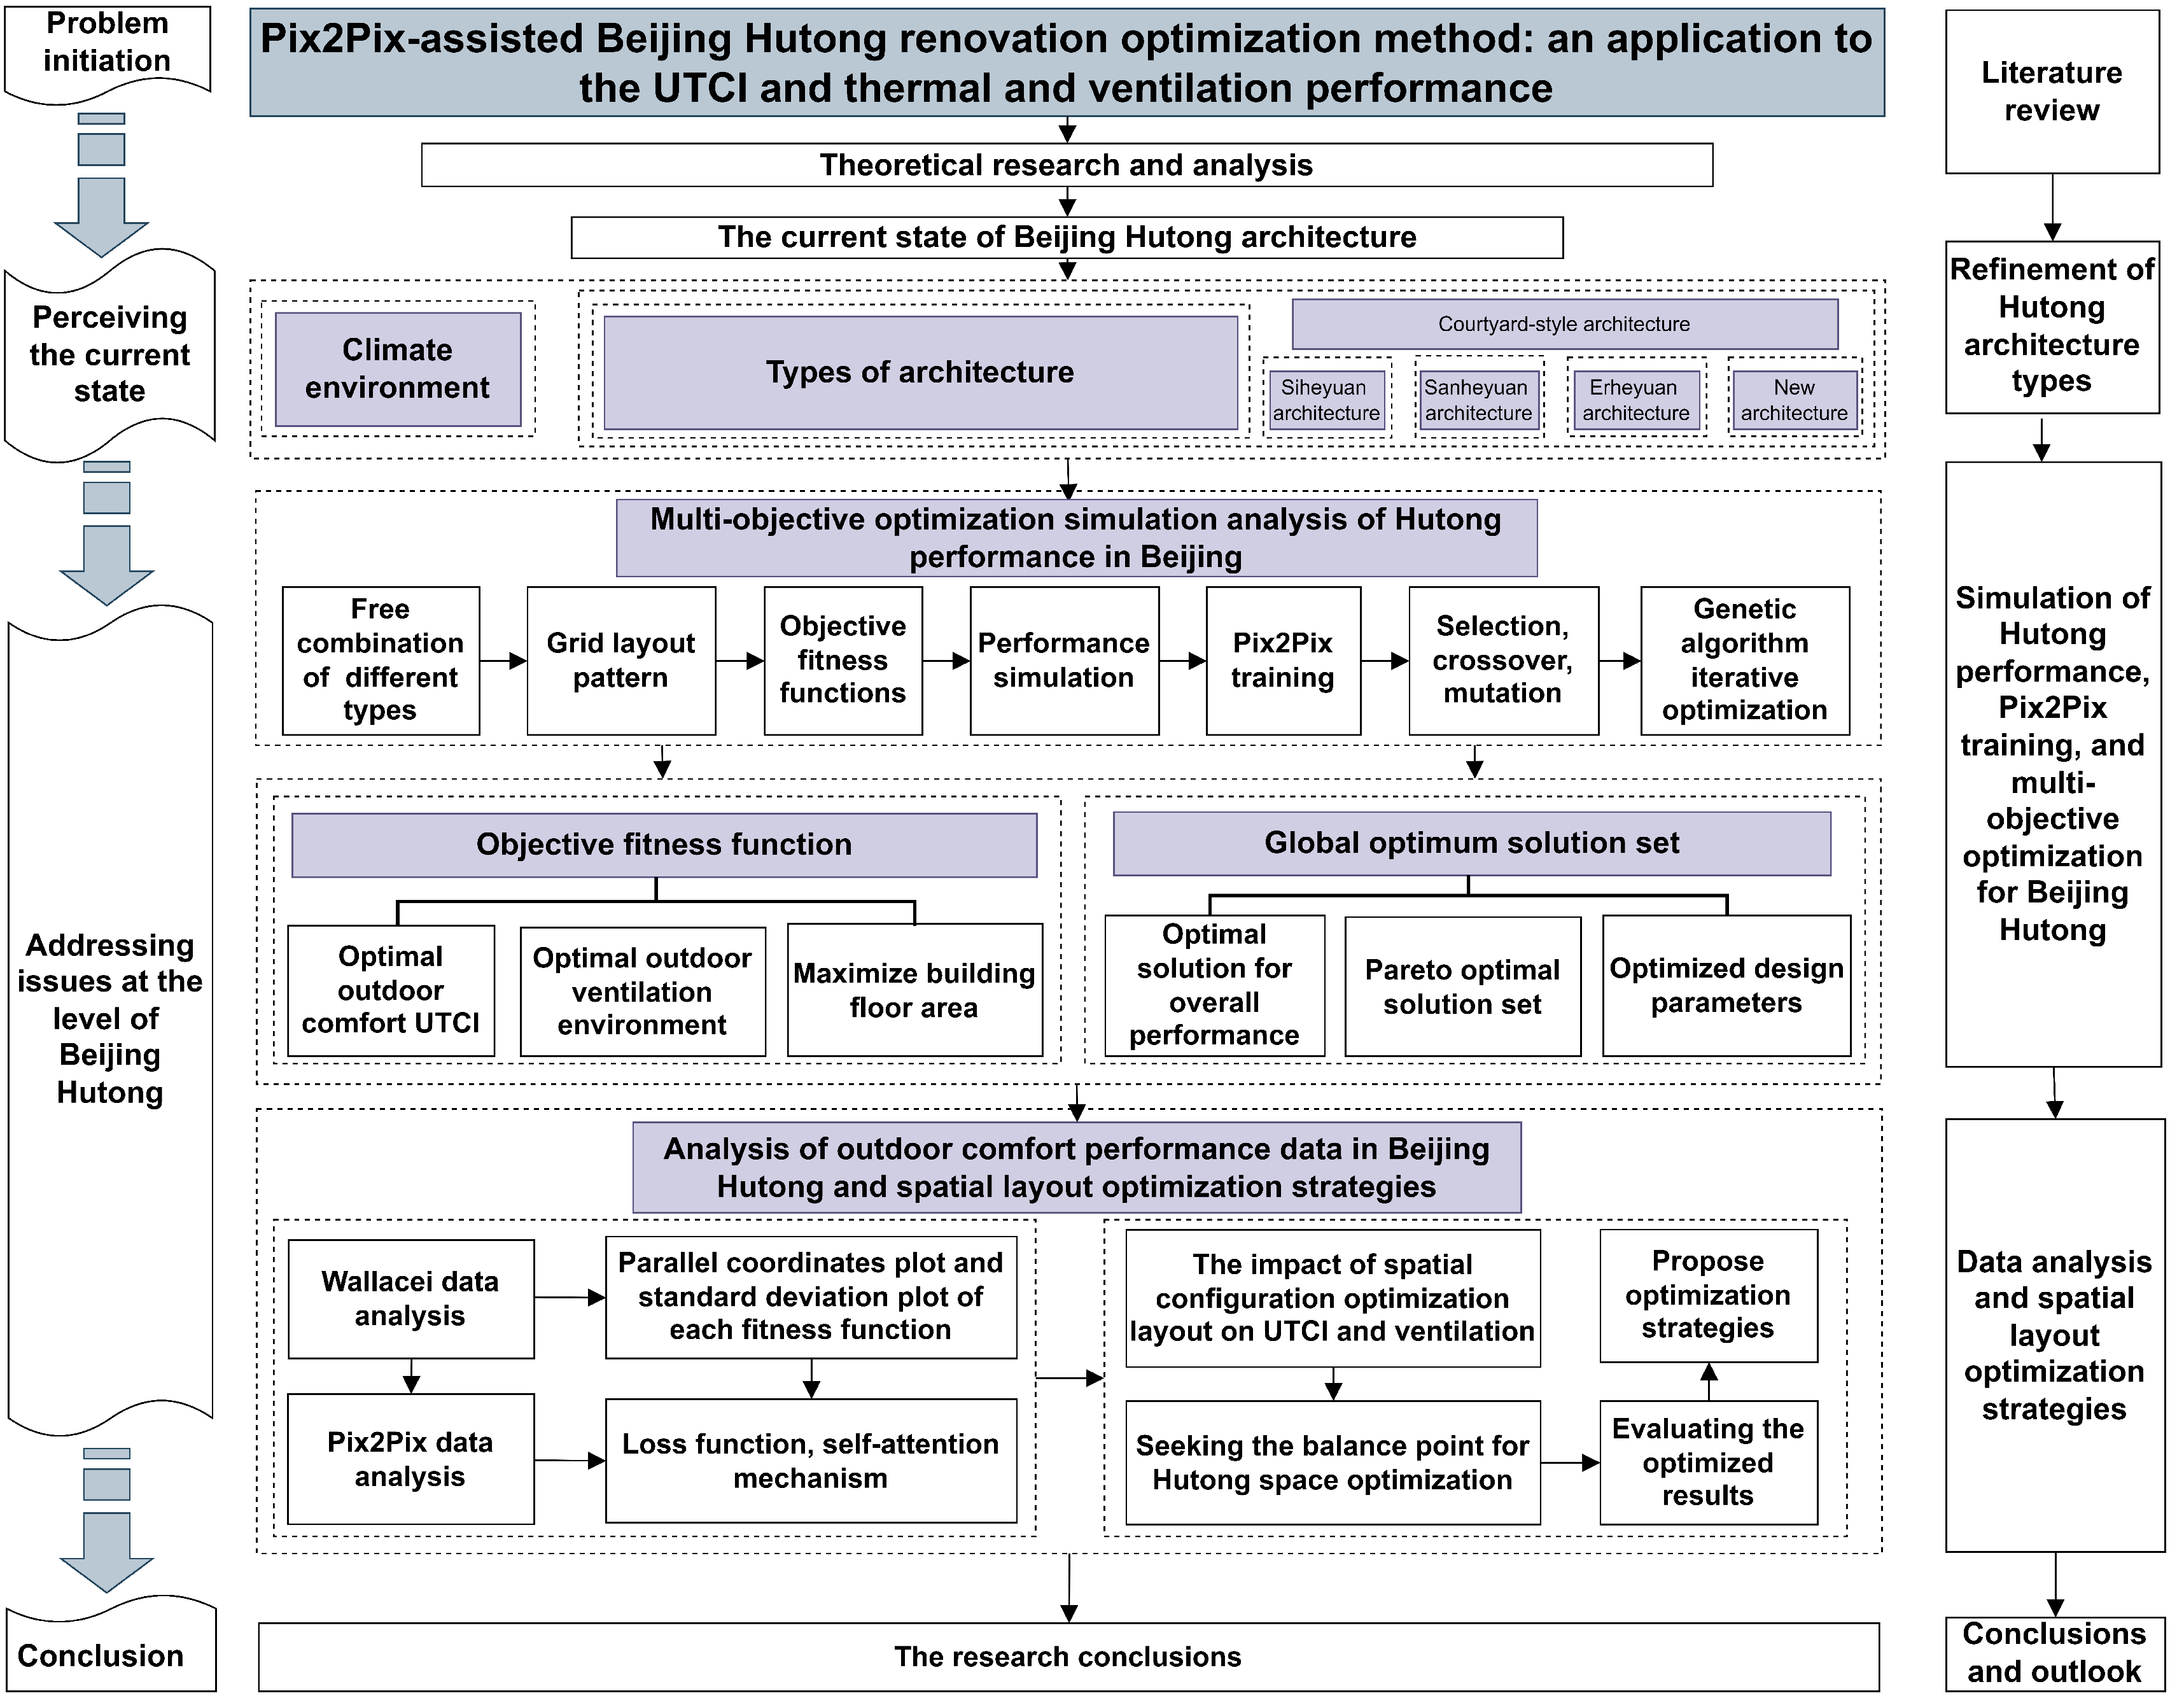
3.1. Workflow

This study can be divided into 5 parts, as depicted in Figure 4. Firstly, different combinations of building types are controlled by setting random seed numbers. Secondly, a multi-objective optimization fitness function for group building is selected to evaluate the comfort of Beijing Hutong based on indicators such as building area, UTCI, and ventilation speed. According to the Universal Thermal Climate Index (UTCI) evaluation standard, the comfort conditions are divided into 11 levels. Meanwhile, the scoring item 8.2.8 of the “Green Performance Calculation Standard for Civil Buildings” JGJ/T449-2018 [44] specifies that for the outdoor wind environment simulation, around the pedestrian area of the building at a height of 1.5 m above ground, the wind speed should be less than 5 m/s, and in outdoor rest areas and children’s play areas, the wind speed should be less than 2 m/s. Additionally, the outdoor wind speed amplification factor should be less than 2, and there should be no vortices or windless zones in the active areas of the site. Subsequently, 1000 performance simulation experiments are conducted using genetic algorithm multi-objective optimization, and experimental data are extracted. Next, all data are divided into 80% for the training set and 20% for the test set. The Pix2Pix deep learning model in Python 3.12 is used to predict and validate the outdoor ventilation environment of different building layouts. The improved Pix2Pix algorithm is employed to replace traditional aerodynamics-based ventilation simulations, greatly reducing time costs and computer configuration requirements. Furthermore, iterative calculations are performed using multi-objective genetic optimization (MOGO) to automatically optimize the spatial layout forms of Beijing Hutong, obtaining building data and forms provided by the Pareto frontier solutions. Finally, through data analysis, corresponding update strategies are formulated to provide direction for the organic renewal of Hutong.

3.2. Research Framework

The research framework consists of the following steps, as illustrated in Figure 5: Firstly, conducting in-depth research on the current status of Beijing’s Da yuan Hutong, including climate environment, building types, and spatial dimensions, and organizing the research data. Secondly, refining four typical building types and open spaces within the given site, by freely combining different types of buildings with random proportions. Then, selecting the UTCI and outdoor ventilation environment as the fitness evaluation functions, and optimizing them through genetic operations (including selection, crossover, mutation, etc.) to obtain the optimal solution set for the courtyard building spatial form. Finally, conducting a data sensitivity analysis and proposing optimization strategies for the spatial form of Beijing Hutong.

4. Research Case Analysis

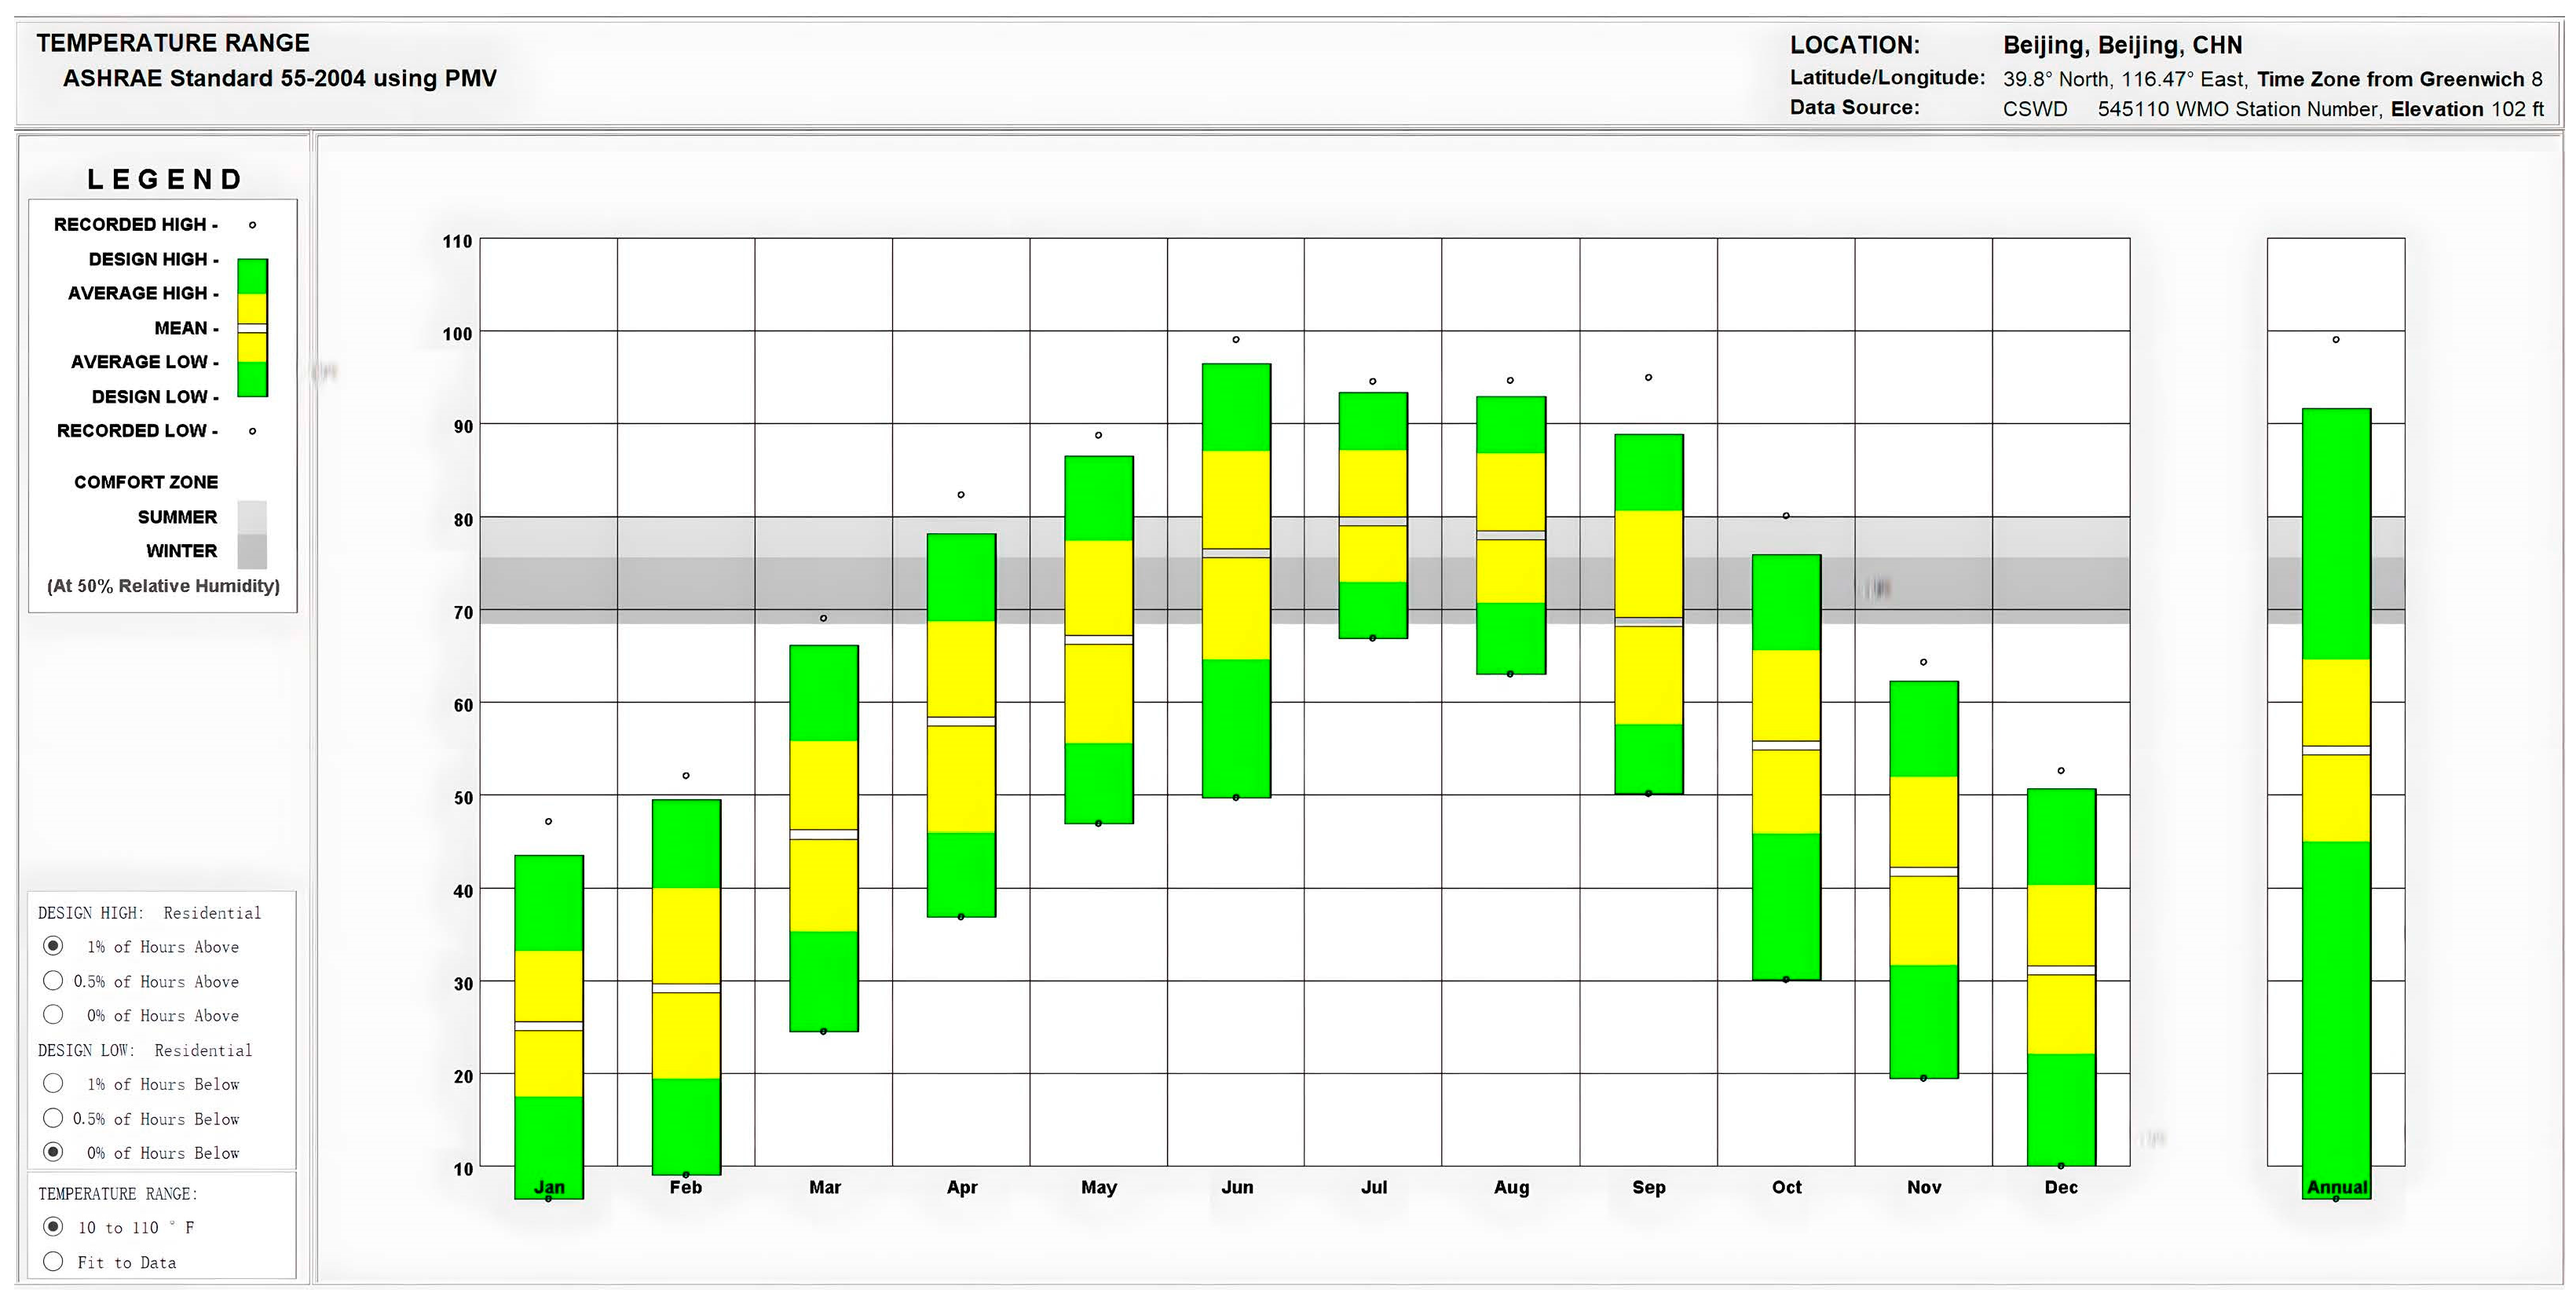
4.1. Analysis of Beijing Meteorological Data

The study area is located in Beijing, situated at the northwest end of the North China Plain (39°28′–41°05′ N, 115°20′–117°30′ E), bordering Tianjin to the east and adjacent to Hebei Province elsewhere. The region exhibits a continental monsoon climate, characterized by a semi-humid and semi-arid condition in the temperate zone. Summers are relatively rainy and warm, while winters are dry and cold. The annual average sunshine hours range from 2000 to 2800 h. During summer, prevailing winds are predominantly from the east and southeast, with relatively low wind speeds. The average temperature in the hottest month exceeds 26 °C in the southern part and is slightly lower in the northern part but not below 20 °C, with a relative humidity of about 60%. In winter, influenced by the Siberian cold high-pressure system, winds tend to be from the west and northwest, with stronger wind speeds. There is a significant temperature difference between the north and south in the coldest month, with temperatures dropping below 0 degrees Celsius in the south and reaching as low as minus 20 °C in the north, with a relative humidity of about 40%.
The typical meteorological year data for Beijing are provided by the Energy Plus official website, including parameters such as prevailing wind direction, average wind speed, atmospheric temperature, solar radiation, and relative humidity for all 8760 h of the year. Analysis using the ASHRAE 55 [45] comfort standard revealed that for most of the time, Beijing does not meet the comfort requirements, with several months in spring and winter falling below the comfort level overall. In summer, only a portion of the average temperatures fall within the comfort zone, totaling 501 h, accounting for 5.7% of the year. Refer to the gray area in Figure 6 for further details.
The ASHRAE 55 Comfort Standard psychrometric chart is shown in Figure 7. Various design strategies are listed on the left side aimed at maximizing comfort hours. Active energy-consuming HVAC systems such as mechanical ventilation, cooling, and heating are only used when the building itself cannot achieve comfort and are not considered in this paper. Some design strategies increase comfort time by less than 1%, offering low cost-effectiveness, and are not worth the investment. To avoid wasteful spending, overlapping strategies have been eliminated, and other design strategies already meet comfort requirements. The percentages in the graph represent the proportion of hours using the strategy over the entire year, with each point representing hours in a year, and each boxed area indicating the range of comfort hours obtained by the corresponding strategy. We strive to use passive design strategies as much as possible to achieve optimal comfort effects. The analysis results show that, by controlling window shading, night ventilation, internal heat gain, passive solar, dehumidification, and other strategies at appropriate times, 4173 comfortable hours can be obtained, accounting for 47.6% of the entire year.

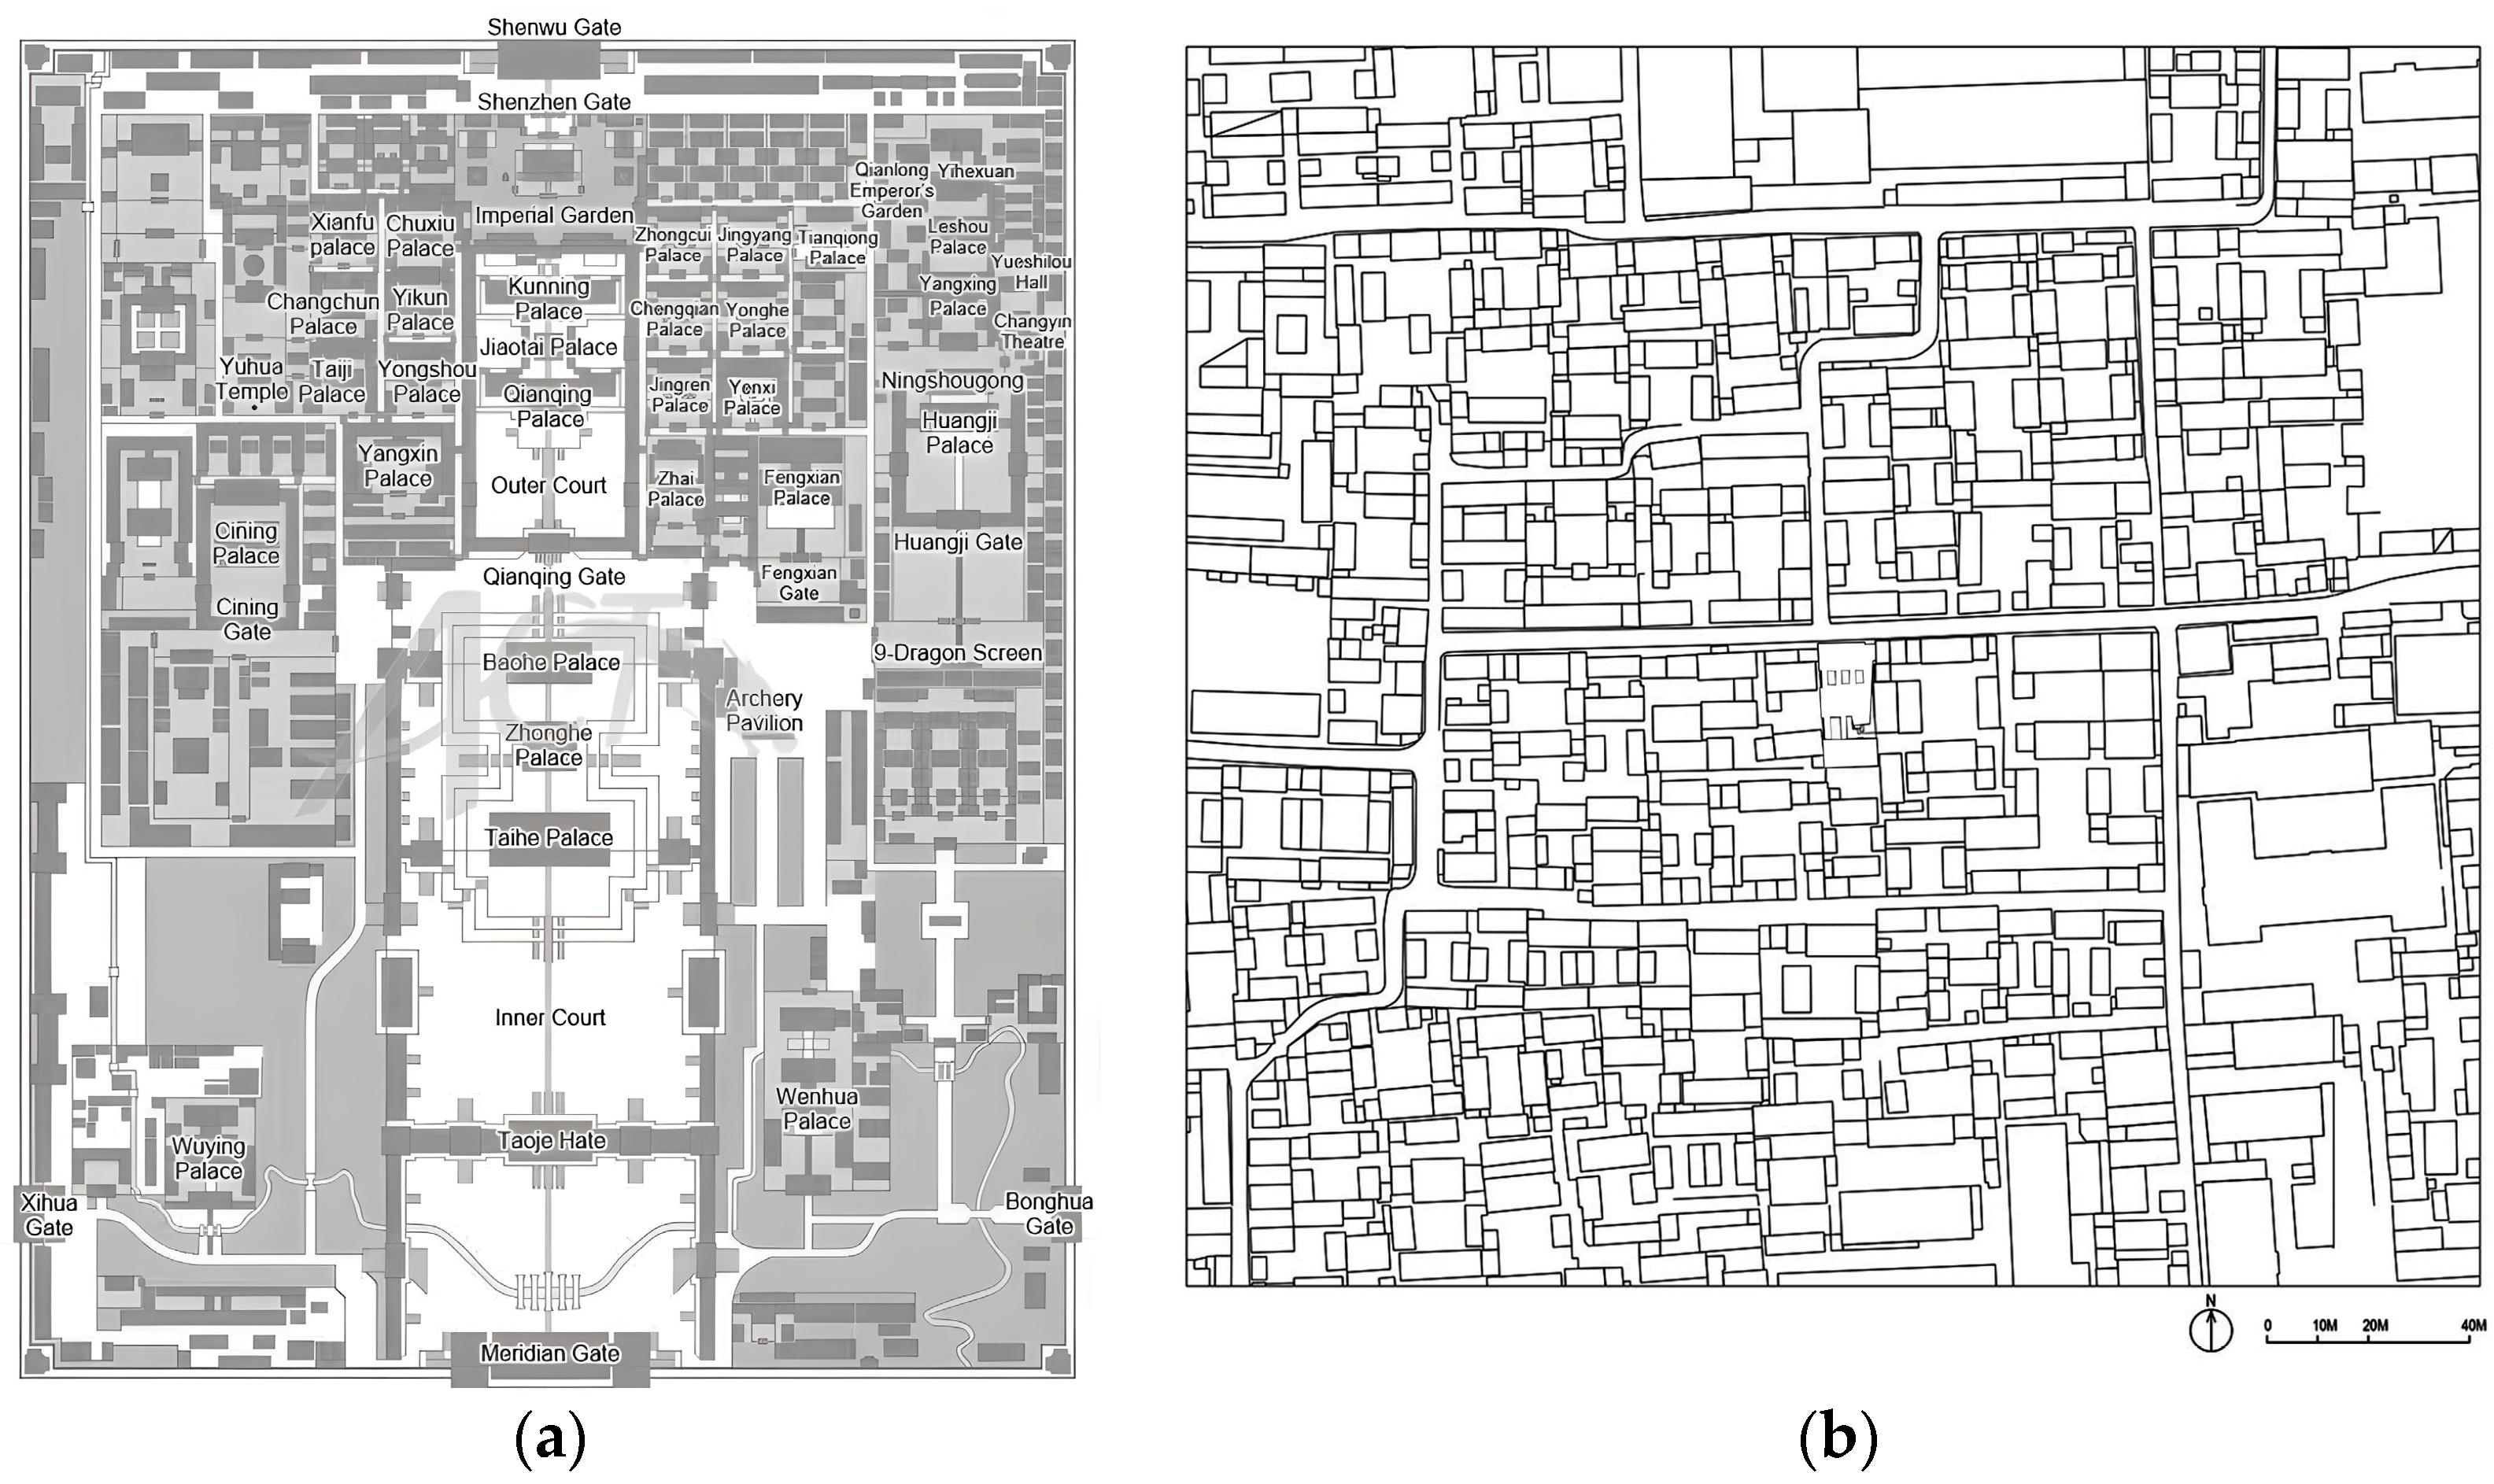
4.2. Traditional Architectural Cultural Features

The quadrangle courtyard, known as the “miniature Beijing”, forms a homologous relationship with the Forbidden City [46], as depicted in Figure 8. In terms of architectural layout, symmetry and balance are highly valued, representing the adherence to the axial principle and hierarchy, while also showcasing the aesthetic pursuit of ancient Chinese architecture. Whether it is the main house, wing rooms, and gardens of the quadrangle courtyard, or the halls, palaces, and gardens of the Forbidden City, they strictly adhere to this principle, creating an overall sense of harmony. The quadrangle courtyard divides the internal space from the external environment through the setting of courtyard walls and gates, forming independent and private spaces. The structural features and styles of the buildings, such as brick-and-wood structures, roof forms, decorative elements, etc., all demonstrate traditional Chinese architectural styles, presenting unique charm. Additionally, both the quadrangle courtyard and the Forbidden City inherit the cultural characteristics and ceremonial systems of ancient China, embodying the cultural connotation of “rituals and music complementing each other”. This emphasis on order, harmony, dignity, and social relationships is not only reflected in architectural forms but also runs through the entire cultural tradition. Therefore, in terms of spatial layout, architectural forms, and cultural connotations, the quadrangle courtyard and the Forbidden City echo each other, constituting an important part of ancient Chinese urban and social life, showcasing the rich connotations and profound values of traditional Chinese architecture.

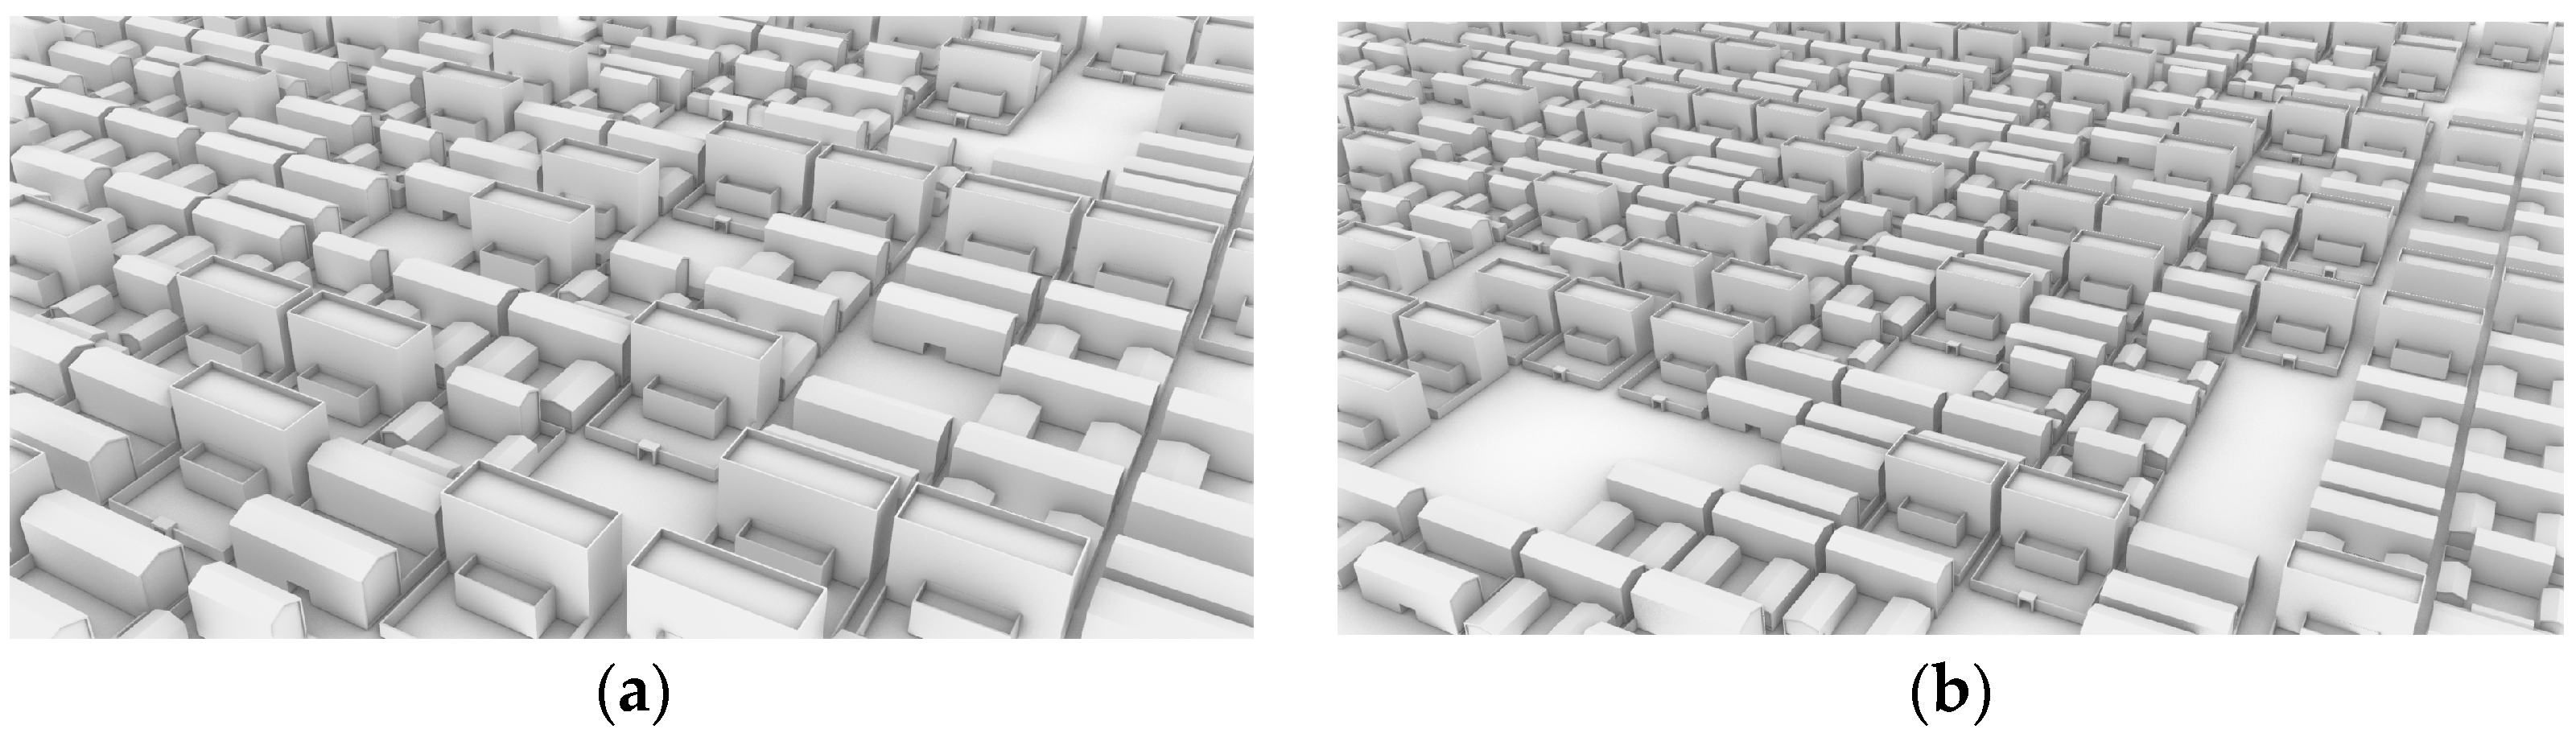
4.3. Distillation of Hutong Architectural Types

By carefully examining the satellite map of Da Yuan Hutong in Beijing and combining it with relevant architectural knowledge, each building in the alley is semantically labeled and categorized into Siheyuan, Sanheyuan, Erheyuan, and new buildings. Subsequently, common morphological features within each of these four categories of buildings are identified. Simplified parametric models are then developed, controlling parameter thresholds, and seeking Pareto front dominant solutions for each building type separately. This paper explores using the Pix2Pix method of freely combining front solutions of the four types of buildings and the impact of combining proportion control on UTCI and ventilation efficiency optimization. The roads within the Hutong are approximately 1 to 3 m wide, while individual building areas range from 150 to 300 square meters. To simplify the research model, we have set a road width of 1.5 m and a building footprint of 15 m by 15 m. Figure 9 illustrates these four building types along with concentrated green spaces or leisure squares.

4.4. Model Optimization Process

The optimization steps are as follows: Firstly, based on the size of the site, the five types mentioned above are combined in certain proportions. Secondly, for the purpose of the study, building area and the UTCI, as well as building area and ventilation speed, are selected as fitness functions in two consecutive steps. Then, considering the time-consuming nature of aerodynamics-based ventilation environment simulation, an improved Pix2Pix deep learning method is adopted instead of traditional building performance simulation to save time and enhance optimization speed. Finally, through iterative optimization using genetic algorithms, the Pareto optimal solution set is sought, thereby determining the optimal proportions and architectural layout methods for different building types. Simultaneously, the appropriate building density and plot ratio range for the site are determined. The UTCI results are typically represented as a numerical value, divided into 11 categories ranging from −5 (UTCI < −40) indicating extremely cold to +5 (UTCI > 46) indicating extremely hot [47]. Therefore, the optimization objective is to maximize the building area while minimizing the sum of the absolute values of the UTCI.

5. Experimental Results Presentation

5.1. UTCI Optimization

The optimized results of each building type are placed in a 120 m × 120 m site environment according to random proportions. The optimization fitness function still includes the building area and the outdoor comfort index UTCI. The UTCI is divided into 11 levels, ranging from −5 (UTCI < −40) indicating extremely cold to +5 (UTCI > 46) indicating extremely hot. Therefore, the optimization objective is to maximize the building area while simultaneously minimizing the sum of the absolute values of the UTCI.
Evolutionary simulations are conducted using the Wallacei (which includes Wallacei Analytics and Wallacei X) [48], with real-time monitoring of the optimization process. In order to achieve better convergence of results, we combined existing reference literature and underwent multiple rounds of tuning. Finally, the population size and number of iterations are both set to 20, the crossover probability is 0.9, and the mutation probability is set to 1/r, where r is a specific parameter of the problem [49]. The distribution index for crossover and mutation is set to 20, and the random seed is defaulted to 1. All results are presented in three-dimensional form, with a total of 400 samples. The total floor area ranges from 10,752.69 to 16,129.03 square meters. The sum of UTCI absolute values at each sampling point ranges from 33,216.71 to 34,304.29 °C. The optimized Pareto front solutions indicate a total floor area range of 15,625 to 15,873.02 square meters, with the sum of UTCI absolute values at each sampling point ranging from 33,331.62 to 33,359.15 °C. Among them, the overall plan of the 6th individual in the 12th generation and the 8th individual in the 14th generation is shown in Figure 10, while the bird’s-eye view of the 12th individual in the 14th generation and the 12th individual in the 16th generation is depicted in Figure 11.
The final optimized results are shown in Figure 12, Figure 13 and Figure 14. The 12 datasets represent the Pareto front dominating solution set after genetic optimization [50], including the 6th individual in the 0th generation, the 6th individual in the 1st generation, the 6th individual in the 2nd generation, the 9th individual in the 3rd generation, the 3rd individual in the 4th generation, the 9th individual in the 5th generation, the 6th, 7th, and 8th individuals in the 6th generation, the 9th individual in the 8th generation, and the 2nd and 9th individuals in the 9th generation. The morphological results after optimization show staggered building heights, well-balanced spatial openness, the coexistence of small-scale open spaces with large-scale outdoor open spaces, and the combination layout of buildings conducive to forming ventilation corridors. The quantity relationship among the dominant solutions of Siheyuan, Sanheyuan, Erheyuan, new buildings and empty spaces is shown in Table 1, with corresponding value ranges of 2–8, 3–8, 2–15, 9–16, and 0–13, respectively. It can be observed that the proportion of standalone new buildings is significantly higher, followed by Erheyuan, then Sanheyuan. The empty space has the widest adjustable range and the greatest flexibility. Based on the mean values, their respective proportions should be controlled around 11.8%, 16.9%, 23.8%, 33.8%, and 13.7%, with the sum of Erheyuan and new buildings around 58%.
When using Pix2Pix for architectural performance simulation, the goal is to employ image translation technology to convert input images (building floor layouts) into output images (predictions of outdoor comfort index UTCI and predictions of outdoor wind environment), thereby establishing a mapping between input and output. The advantages of Pix2Pix are primarily manifested in the following aspects:
End-to-end image translation: Pix2Pix is capable of directly generating corresponding output images from input images without requiring additional preprocessing or post-processing steps, thus simplifying the architectural performance simulation process.
High-quality image generation: Through adversarial training, Pix2Pix can generate synthetic images that resemble real images, enhancing the visual realism and credibility of the output images, which helps improve the accuracy of architectural performance simulation.
Flexible application domains: Pix2Pix can be applied to various architectural performance simulation tasks such as thermal bridge identification, energy consumption prediction, daylight simulation, etc., as long as input images and output images can be paired.
When using Pix2Pix for simulating outdoor comfort UTCI in architecture, the following points should be noted:
Data pairing: Ensure that there is a clear correspondence between input and output images in the training data. The dataset should contain a sufficient number of samples to cover various scenarios, and it should be prepared in pairs of input and output images, as shown in Figure 15.
Data preprocessing: Preprocess the input and output images with operations such as image normalization, cropping, resizing, etc., as illustrated in Figure 16, to match the input requirements of the Pix2Pix model.
Network architecture selection: Choose a Pix2Pix variant and improved version that is suitable for the task requirements and dataset characteristics. For this task, the conditional Generative Adversarial Network (cGAN) architecture is selected.
Appropriate training strategy: Select suitable loss functions, optimizers, and hyperparameters, and adopt appropriate training strategies such as learning rate scheduling, weight initialization, etc., to achieve better model performance. The parameter settings are as follows: b1 = 0.5, b2 = 0.999, batch_size = 1, channels = 3, checkpoint_interval = −1, dataset_name = ‘UTCI’, decay_epoch = 100, epoch = 0, img_height = 256, img_width = 256, lr = 0.0002, n_cpu = 8, n_epochs = 200, sample_interval = 500.
In Grasshopper for Rhino 7.0, the prediction simulation of the UTCI was implemented through CPython scripting, utilizing Pix2Pix technology. The simulated data obtained directly participates in the next stage of multi-objective optimization using genetic algorithms, as shown in Figure 17. Through this process, the comfort index of the building environment can be effectively combined with optimization algorithms to achieve a comprehensive optimization of architectural design solutions.
As shown in Figure 18a, during the initial stages of training, the generated images may appear blurry or unrealistic. This is because the model has not fully learned the features and patterns of the dataset. As training progresses, the model will gradually improve its learning ability, acquiring more accurate feature representations and image generation techniques. Consequently, the quality of the generated images will progressively enhance.
After 200 rounds of thorough training, the model has converged well. As shown in Figure 18b, the image results generated in the 15,500th batch (2nd row, 5th row) exhibit no obvious distortion compared to the real simulation results (3rd row, 6th row) under visual inspection. The level of detail reproduction and clarity is high, and the generated images closely resemble the real ones. Therefore, it can be preliminarily judged by visual inspection that the results generated by this model possess high fidelity and quality.

5.2. Ventilation Environment Optimization

In a ventilation environment, appropriate airflow can effectively help remove indoor pollutants, maintain air freshness and uniformity, provide a comfortable thermal sensation, and assist in regulating humidity [51]. Similarly, utilizing the Pix2Pix model can rapidly predict wind speed and conduct multi-objective optimization through genetic algorithms. As shown in Figure 19, different colors represent different wind speeds. Before optimization, many areas within the site exhibit windless zones, resulting in inadequate air quality and significant humidity accumulation. By creating open spaces or setting up plazas to increase spatial openness and optimizing the layout of building spaces, ventilation efficiency is improved, as depicted in Figure 20. Following optimization, air circulation on the site increases. It is clearly visible that many previously windless areas can now achieve wind speeds of 1.2–1.5 m/s, meeting the requirements of Section 8.2.8 of the “Technical Standard for Green Building Performance Assessment” (JGJ/T449-2018): around buildings, at a height of 1.5 m above ground level, pedestrian areas should have wind speeds less than 5 m/s, and outdoor resting areas and children’s play areas should have wind speeds less than 2 m/s. A good ventilation environment facilitates heat exchange and humidity regulation, making indoor and outdoor temperatures more comfortable and reducing humidity accumulation [52], thereby enhancing the comfort of the residential area.

6. Data Analysis and Discussion

6.1. Wallacei Data Analysis

In the genetic algorithm optimization process for outdoor comfort in Beijing Hutong, there are two objective functions: maximizing building area and minimizing the sum of absolute values of the UTCI. The Pareto front solutions of 100 generations are displayed on the Cartesian coordinate plane shown in Figure 21. Different colors and transparency variations represent the magnitude of the sum of the UTCI absolute values at each sampling point on the site sampling plane. As shown in the figure, all of the optimization results are clearly divided into two major categories. Taking 11:00 AM on June 28th as the observation point, the UTCI values within the red circle are high and uncomfortable. The UTCI values within the blue circle are lower and more comfortable. The corresponding horizontal and vertical coordinate ranges represent suitable building density and floor area ratio ranges. When the building density and plot ratio are relatively low, the distance between buildings is large, the received solar radiation is strong, and the sum of the absolute UTCI values at each sampling point is large, making it too hot and uncomfortable. When maintaining the building density approximately between 0.5 and 0.58 and the plot ratio approximately between 0.96 and 1.14, the sum of the UTCI absolute values decreases, resulting in a favorable outdoor comfort environment. The results within the blue dashed box in the figure represent our optimal range. As the building density and plot ratio continue to increase, buildings increasingly block each other, the distance between buildings becomes very small, the received solar radiation is very limited, and the UTCI values at each sampling point are negative. The sum of the UTCI absolute values also tends to be large, making it cold and uncomfortable. This result deviates from our multi-objective optimization fitness function of minimizing the sum of the UTCI absolute values, hence there are no Pareto front solutions.
Based on the above research results, urban planners and policymakers can scientifically and reasonably allocate the proportions of different functional areas in urban planning, urban renewal projects, retro commercial street designs, or historical area protection projects. Additionally, they can control indicators such as building density and floor area ratio in regional planning to achieve a favorable urban thermal comfort environment.

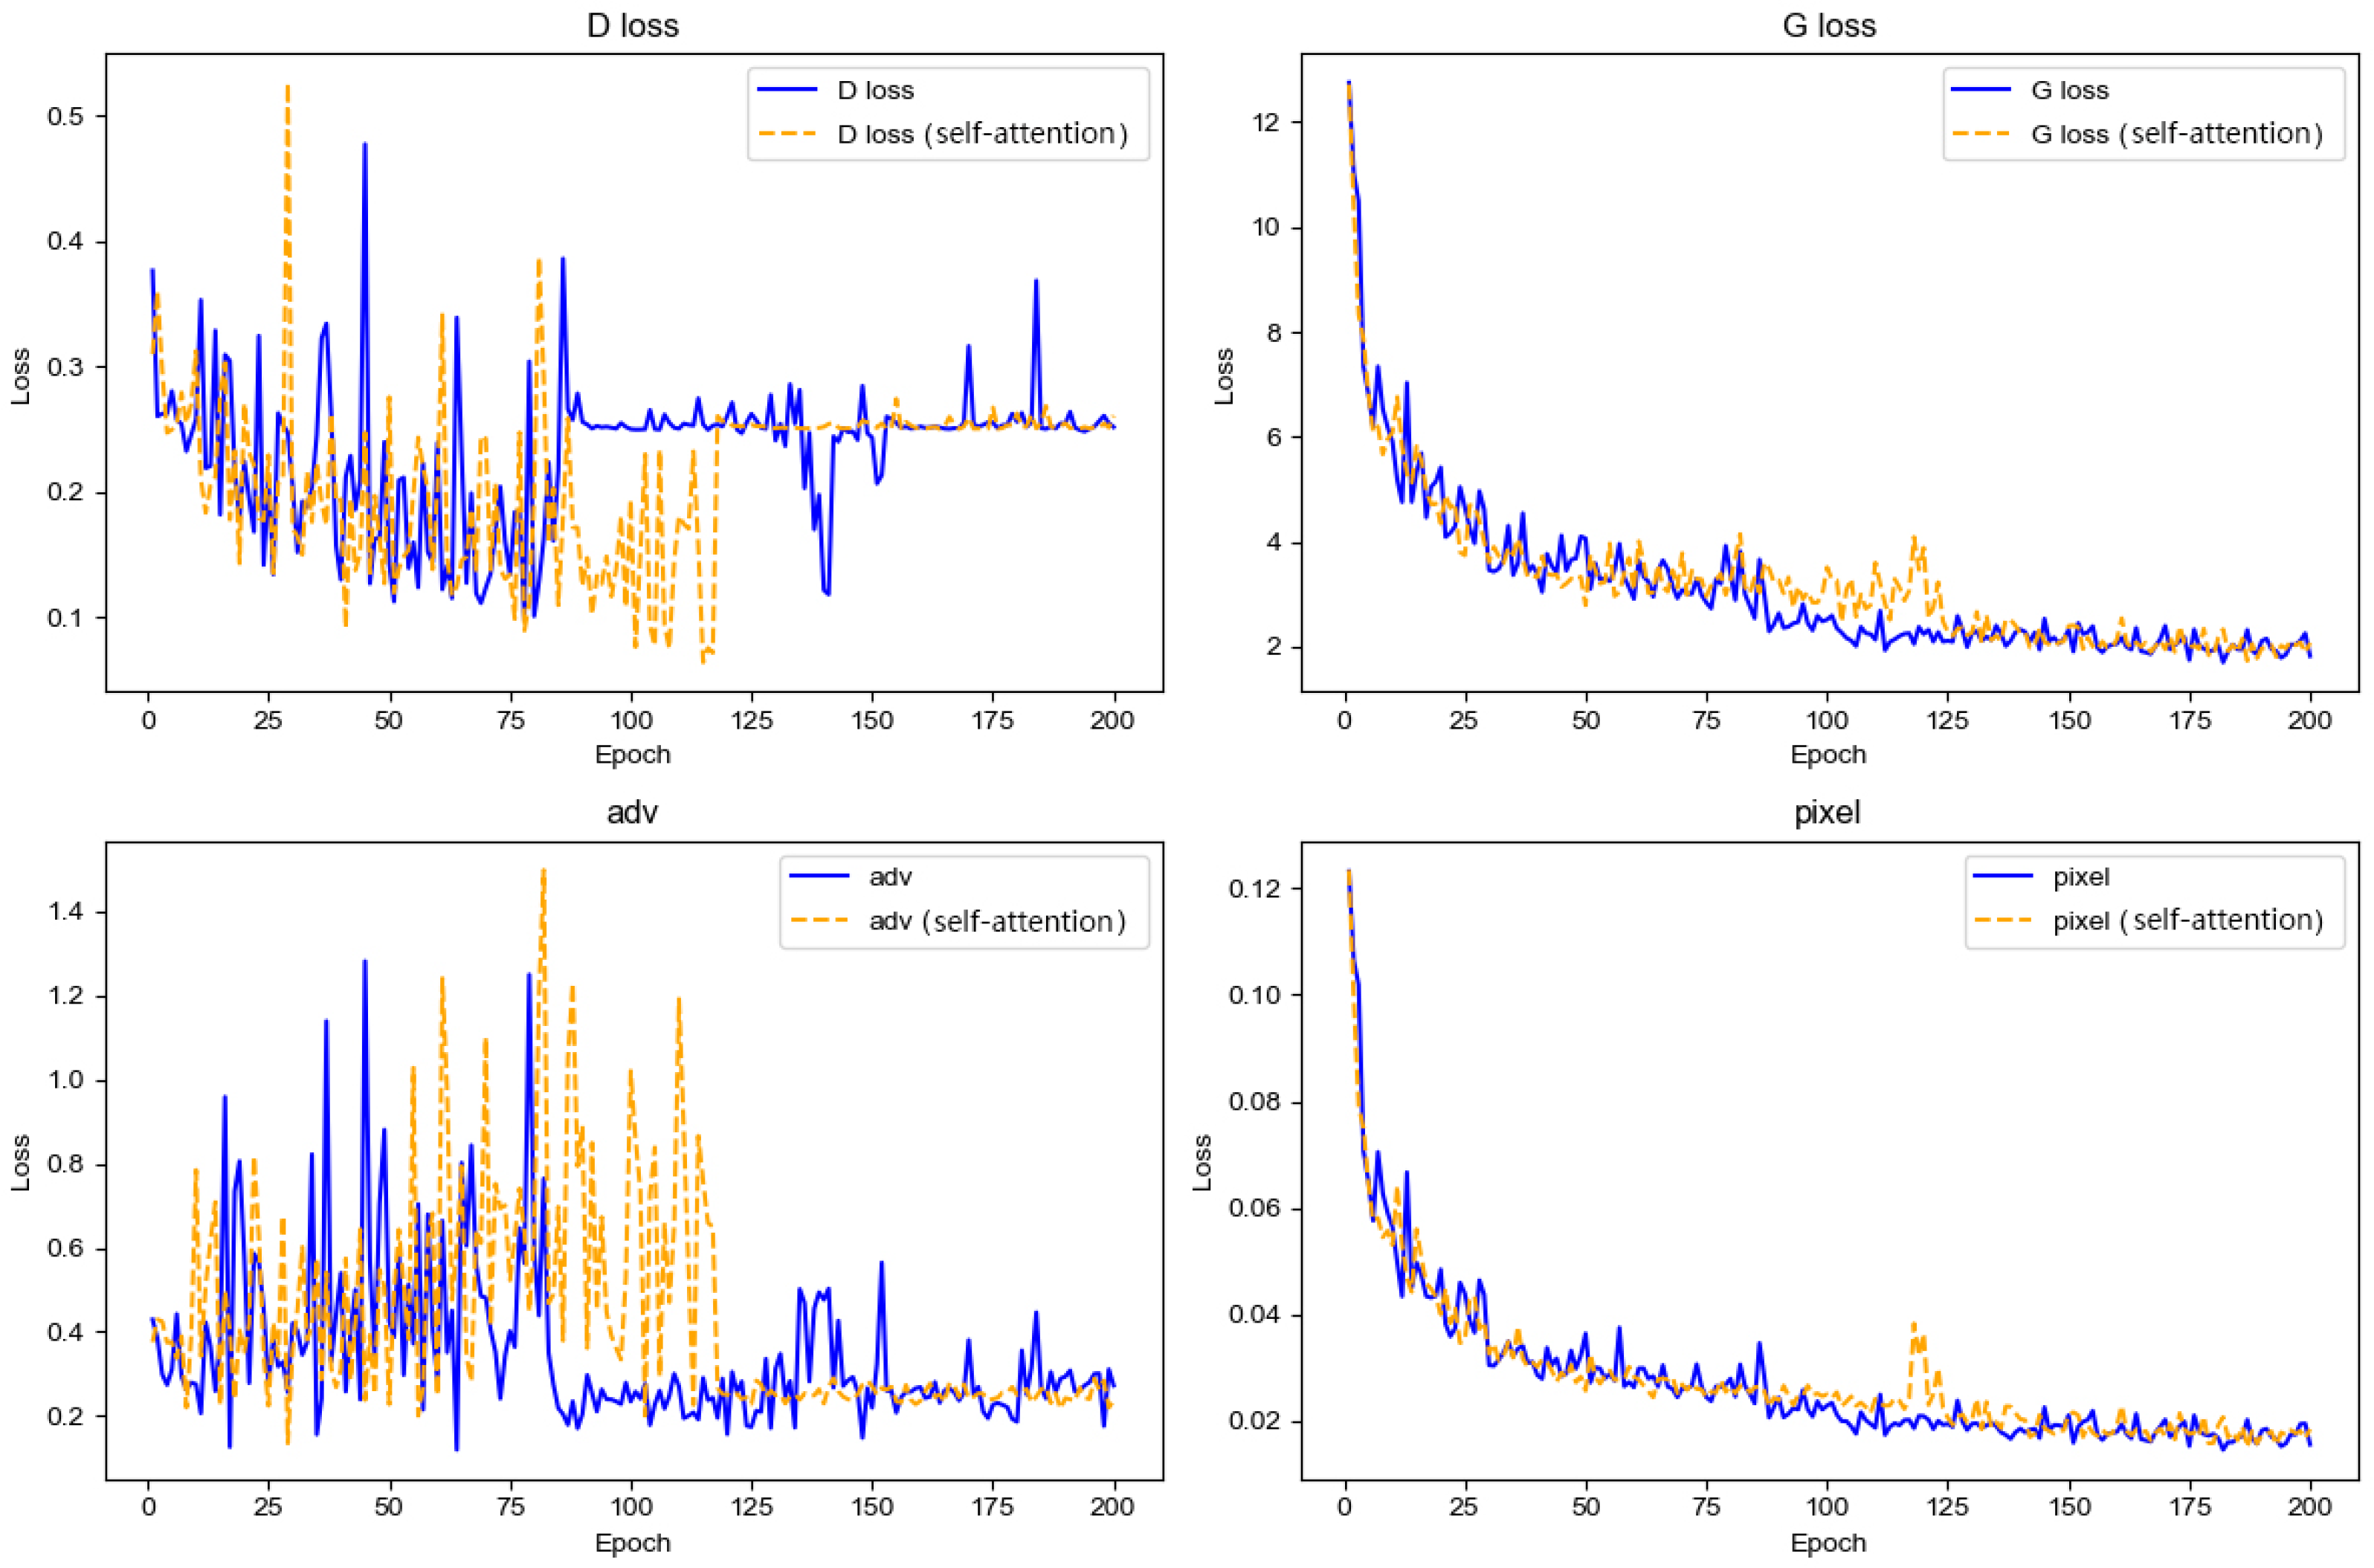
6.2. Pix2Pix Data Analysis

When using Pix2Pix to replace traditional building performance simulation, the decreasing trends of generator loss (G loss), discriminator loss (D loss), adversarial loss (Adv loss), and pixel loss (Pixel loss) indicate that the generator is undergoing training to produce more realistic synthetic images, while the discriminator is also better trained to distinguish between real and synthetic images. Minimizing adversarial loss means the generator is being trained to generate more realistic synthetic images. Minimizing pixel loss indicates that the generator is being trained to minimize the pixel-level differences between synthetic and real images [42,53]. As shown in Figure 22, the trends of discriminator loss (D loss) and adversarial loss (Adv loss) are similar, indicating a good balance in adversarial training between the generator and the discriminator. This suggests that the fake images generated by the generator have successfully deceived the discriminator to some extent, while the discriminator is relatively accurate in classifying real and synthetic images. This balance indicates that the model is gradually converging and generating more realistic synthetic images. The trends of generator loss (G loss) and pixel loss (Pixel loss) are similar, indicating that the generator is minimizing overall loss while also minimizing pixel-level differences, suggesting that the generator can generate synthetic images similar to real images with small differences at the pixel level.
Moreover, it is observed from Figure 22 that the Pix2Pix improved algorithm with the inclusion of a self-attention mechanism makes the model more complex. The balance between the generator and discriminator requires more epochs of learning and adversarial training [54], delayed from the previous 90 epochs to 120 epochs. Although various loss values are almost consistent with the previous ones, after balance, both D loss and Adv loss are more stable with less fluctuation. Hence, the performance of the Pix2Pix model is better after improvement.
The rapid prediction method for urban UTCI and wind speed using Pix2Pix can also be applied to different regions’ building or urban performance indicators, as well as to the scientific prediction of real-world environmental data. It is important to recognize potential biases in the training data used for Pix2Pix, such as irregular terrain, variations in ground elevation, or the impact of local microclimates.
Compared to traditional building performance simulation methods, the primary advantage of using the Pix2Pix method lies in its ability to significantly reduce computation time. On the same computer, for example, with a UTCI training set of 80 data points, a batch size of 1, and 200 epochs, generating 16,000 images, the estimated time of arrival (ETA) is 13:26:24.304047, averaging 0.05 min per image. In contrast, traditional performance simulation methods take 2.2 h to generate a dataset of 100 images, averaging 1.32 min per image. Thus, generating 16,000 images would take 352 h, or approximately 14.67 days. Moreover, traditional ventilation performance simulations take 2–3 times longer than UTCI simulations. Therefore, traditional building performance simulations are suitable for one-time or a few simulations and adjustments of a given building, but they are not suitable for rapidly performing multi-objective iterative optimization from large datasets using genetic algorithms.

7. Conclusions

The transformation of architectural spatial forms and their scientifically rational arrangement have a significant impact on local microclimates, especially crucial in urban renewal and planning processes. Alleyways, as a unique urban architectural form, with their dense and low-rise structures, lead to poor ventilation environments, thereby affecting residents’ comfort. Therefore, in the urban renewal process, the climatic characteristics of alleyways should be fully considered, and methods such as the intelligent optimization of land use and scientifically guided architectural layout should be employed to improve alleyway ventilation conditions, thereby enhancing outdoor thermal comfort and improving the quality of people’s living environment.
The innovation of this study lies in the utilization of an improved Pix2Pix model to replace traditional building performance simulations, reducing reliance on computer performance and the expertise of professionals, and shortening the iteration time of the genetic algorithm. This accelerates the multi-objective automatic optimization process and compares the reliability of the models. In UTCI image generation, utilizing the Pix2Pix method takes an average of 0.05 min per image, whereas traditional performance simulation methods take an average of 1.32 min per image. Pix2Pix operates 26.4 times faster than traditional architectural performance simulation methods. Furthermore, traditional ventilation performance simulations require 2–3 times more time compared to UTCI simulations.
Experimental results indicate that to simultaneously maximize the area of Hutongs and optimize the UTCI index, the proportions of Siheyuan, Sanheyuan, Erheyuan, new buildings and empty spaces within the site need to be, respectively, controlled around 11.8%, 16.9%, 23.8%, 33.8%, and 13.7%; the combined proportion of Erheyuan and new buildings should be controlled at around 58%. At the same time, the optimization results ensure diversity for selection.
Regarding the combination of three-dimensional architectural spaces, consideration should be given to the layout of high and low buildings, promoting the formation of ventilation corridors, and setting open activity squares in appropriate locations, scientifically arranging green water systems. The site should maintain building density approximately between 0.5 and 0.58, and the plot ratio is approximately between 0.96 and 1.14. This approach can fully utilize land resources while improving thermal comfort environments and enhancing outdoor comfort.
This research method provides scientific reference and theoretical guidance for practical applications in urban planning, urban renewal projects, retro commercial street design, and historical area protection. It can quickly identify the reasonable proportions of different functional areas within a region and effectively control building density and floor area ratio.

8. Limitations and Outlook

The research methodology presented holds broad application prospects and can be promoted in areas such as urban renewal and rural revitalization. Through mathematical models and genetic algorithms, we can quickly generate intelligent architectural design solutions, providing effective approaches to addressing urban development challenges. The improvement of the Pix2Pix algorithm makes it a powerful tool for optimizing fitness functions, aiding in obtaining optimized results for the thermal comfort spatial forms of Beijing Hutong. However, our study has yet to fully consider subjective psychological factors such as artificial lighting and noise, thus requiring further case verification to enhance the accuracy and credibility of the research. Future research will further explore the applicability, the feasibility, and the application prospects of these methods in different environments, and refine corresponding algorithms, tools, and evaluation techniques to enhance the efficiency and accuracy of data processing in this method, including improving the prediction accuracy of real-world UTCI and other metrics using the Pix2Pix method, improving tool interfaces and functionality, promoting innovative applications of data-driven design, integrating terrain features, exploring the impact of different urban textures on thermal comfort, and incorporating them into optimization models to provide more scientific guidance for urban renewal and architectural design, promoting sustainable urban development and improving residents’ quality of life.

Author Contributions

Conceptualization, R.W. and M.H.; methodology, R.W.; software, R.W.; validation, R.W., L.W. and W.H.; formal analysis, R.W.; investigation, R.W., Z.Y., L.Z. and Y.Z.; resources, R.W., Z.Y. and L.Z.; data curation, R.W.; writing—original draft preparation, R.W.; writing—review and editing, M.H.; visualization, L.W.; supervision, W.H.; project administration, W.H.; funding acquisition, M.H., W.H., R.W., Y.Z. and L.W. All authors have read and agreed to the published version of the manuscript.

Funding

This research was funded by the National Natural Science Foundation of China (42171416), Huangshan University Natural Science Research Foundation (2021xkjq003), Huangshan University School-Level “Golden Course” Architectural Science (2021JK102), the BUCEA Doctor Graduate Scientific Research Ability Improvement Project (DG2023001, DG2024034) and National Key Research and Development Program of China (Grant No. 2022YFF0904400).

Data Availability Statement

Conflicts of Interest

Author Zhenqing Yang is employed by the Beijing Construction Engineering Group. Author Lili Zhang is employed by the BCEG No. 4 Construction Engineering Co., Ltd. The remaining authors declare that the research was conducted in the absence of any commercial or financial relationships that could be construed as a potential conflict of interest.

References

  1. Akkose, G.; Akgul, C.M.; Dino, I.G. Educational building retrofit under climate change and urban heat island effect. J. Build. Eng. 2021, 40, 102294. [Google Scholar] [CrossRef]
  2. Zhao, H.; Xu, G.; Shi, Y.; Li, J.; Zhang, Y. The characteristics of dynamic and non-uniform thermal radiation experienced by pedestrians in a street canyon. Build. Environ. 2022, 222, 109361. [Google Scholar] [CrossRef]
  3. Alijani, S.; Pourahmad, A.; Nejad, H.H.; Ziari, K.; Sodoudi, S. A new approach of urban livability in Tehran: Thermal comfort as a primitive indicator. Case study, district 22. Urban Clim. 2020, 33, 100656. [Google Scholar] [CrossRef]
  4. Wang, W.; Shu, J. Urban renewal can mitigate urban heat islands. Geophys. Res. Lett. 2020, 47, e2019GL085948. [Google Scholar] [CrossRef]
  5. Yuan, Z.; Li, H.; Liu, J.; Luo, J. Multiview scene image inpainting based on conditional generative adversarial networks. IEEE Trans. Intell. Veh. 2019, 5, 314–323. [Google Scholar] [CrossRef]
  6. Zhang, Q.; Zhou, D.; Xu, D.; Rogora, A. Association between Wind Environment and Spatial Characteristics of High-Rise Residential Buildings in Cold Regions through Field Measurements in Xi’an. Buildings 2023, 13, 2007. [Google Scholar] [CrossRef]
  7. Huang, J.; Shen, S.; Zhao, M.; Cheng, C. Assessment of Summer Regional Outdoor Heat Stress and Regional Comfort in the Beijing-Tianjin-Hebei Agglomeration Over the Last 40 Years. GeoHealth 2023, 7, e2022GH000725. [Google Scholar] [CrossRef] [PubMed]
  8. Liu, S.; Xie, Y.; Zhu, Y.; Lin, B.; Cao, B.; Wong, N.H.; Niu, J.; Fang, Z.; Lai, D.; Liu, W.; et al. Comparative analysis on indoor and outdoor thermal comfort in transitional seasons and summer based on multiple databases: Lessons learnt from the outdoors. Sci. Total Environ. 2022, 848, 157694. [Google Scholar] [CrossRef] [PubMed]
  9. Liu, K.; Lian, Z.; Dai, X.; Lai, D. Comparing the effects of sun and wind on outdoor thermal comfort: A case study based on longitudinal subject tests in cold climate region. Sci. Total Environ. 2022, 825, 154009. [Google Scholar] [CrossRef]
  10. Sacht, H.M.; Bragança, L.; Almeida, M.; Caram, R. Specification of glazings for façades based on spectrophotometric characterization of transmittance. Sustainability 2021, 13, 5437. [Google Scholar] [CrossRef]
  11. Deevi, B.; Chundeli, F.A. Quantitative outdoor thermal comfort assessment of street: A case in a warm and humid climate of India. Urban Clim. 2020, 34, 100718. [Google Scholar] [CrossRef]
  12. Grassi, B.; Piana, E.A.; Lezzi, A.M.; Pilotelli, M. A review of recent literature on systems and methods for the control of thermal comfort in buildings. Appl. Sci. 2022, 12, 5473. [Google Scholar] [CrossRef]
  13. Tomkins, A.; Lange, E. Planning and Designing Natural and Urban Environments with an Adaptive Visualization Framework: The Case of Pazhou Island, Guangzhou, Pearl River Delta. Land 2023, 12, 377. [Google Scholar] [CrossRef]
  14. Wang, Y.; Ni, Z.; Hu, M.; Chen, S.; Xia, B. A practical approach of urban green infrastructure planning to mitigate urban overheating: A case study of Guangzhou. J. Clean. Prod. 2021, 287, 124995. [Google Scholar] [CrossRef]
  15. Xiao, J.; Yuizono, T. Climate-adaptive landscape design: Microclimate and thermal comfort regulation of station square in the Hokuriku Region, Japan. Build. Environ. 2022, 212, 108813. [Google Scholar] [CrossRef]
  16. Tang, J.; Long, Y.J.L.; Planning, U. Measuring visual quality of street space and its temporal variation: Methodology and its application in the Hutong area in Beijing. Landsc. Urban Plan. 2019, 191, 103436. [Google Scholar] [CrossRef]
  17. Liu, Y.; Chen, X.; Xiao, H.; Duan, J. Study on the smart transformation strategy of old neighbourhoods based on urban renewal. Proc. Inst. Civ. Eng. Smart Infrastruct. Constr. 2023, 40, 1–10. [Google Scholar] [CrossRef]
  18. Huo, X.; Xue, H.; Jiao, L. Risk management of retrofit project in old residential areas under green development. Energy Build. 2023, 279, 112708. [Google Scholar] [CrossRef]
  19. Natanian, J.; Wortmann, T. Simplified evaluation metrics for generative energy-driven urban design: A morphological study of residential blocks in Tel Aviv. Energy Build. 2021, 240, 110916. [Google Scholar] [CrossRef]
  20. Dorrah, D.H.; Marzouk, M. Integrated multi-objective optimization and agent-based building occupancy modeling for space layout planning. J. Build. Eng. 2021, 34, 101902. [Google Scholar] [CrossRef]
  21. Rosso, F.; Ciancio, V.; Dell’Olmo, J.; Salata, F. Multi-objective optimization of building retrofit in the Mediterranean climate by means of genetic algorithm application. Energy Build. 2020, 216, 109945. [Google Scholar] [CrossRef]
  22. Brown, N.C.; Jusiega, V.; Mueller, C. Implementing data-driven parametric building design with a flexible toolbox approach. Autom. Constr. 2020, 118, 103252. [Google Scholar] [CrossRef]
  23. Haidar, N.; Tamani, N.; Ghamri-Doudane, Y.; Boujou, A. Selective reinforcement graph mining approach for smart building energy and occupant comfort optimization. Build. Environ. 2023, 228, 109806. [Google Scholar] [CrossRef]
  24. Zhu, M.; Pan, Y.; Lyu, Y.; Huang, Z.; Li, P. A New Explication of Minimum Variable Sets (MVS) for Building Energy Prediction Based on Building Performance Database. Buildings 2022, 12, 1907. [Google Scholar] [CrossRef]
  25. Ogunmodede, O.; Anderson, K.; Cutler, D.; Newman, A. Optimizing design and dispatch of a renewable energy system. Appl. Energy 2021, 287, 116527. [Google Scholar] [CrossRef]
  26. Chen, R.; Tsay, Y.-S.; Ni, S. An integrated framework for multi-objective optimization of building performance: Carbon emissions, thermal comfort, and global cost. J. Clean. Prod. 2022, 359, 131978. [Google Scholar] [CrossRef]
  27. Gupta, R.; Roughgarden, T. Data-driven algorithm design. Commun. ACM 2020, 63, 87–94. [Google Scholar] [CrossRef]
  28. Su, Y.; Fan, D. Smart cities and sustainable development. Reg. Stud. 2023, 57, 722–738. [Google Scholar] [CrossRef]
  29. Grebo, A.; Krstulović-Opara, L.; Domazet, Ž. Thermal to digital image correlation image to image translation with CycleGAN and Pix2Pix. Mater. Today Proc. 2023, 93, 752–760. [Google Scholar] [CrossRef]
  30. Huang, C.; Zhang, G.; Yao, J.; Wang, X.; Calautit, J.K.; Zhao, C.; An, N.; Peng, X. Accelerated environmental performance-driven urban design with generative adversarial network. Build. Environ. 2022, 224, 109575. [Google Scholar] [CrossRef]
  31. Li, J.; Guo, F.; Chen, H. A study on urban block design strategies for improving pedestrian-level wind conditions: CFD-based optimization and generative adversarial networks. Energy Build. 2024, 304, 113863. [Google Scholar] [CrossRef]
  32. Zhou, S.; Wang, Y.; Jia, W.; Wang, M.; Wu, Y.; Qiao, R.; Wu, Z. Automatic responsive-generation of 3D urban morphology coupled with local climate zones using generative adversarial network. Build. Environ. 2023, 245, 110855. [Google Scholar] [CrossRef]
  33. Gan, W.; Zhao, Z.; Wang, Y.; Zou, Y.; Zhou, S.; Wu, Z. UDGAN: A new urban design inspiration approach driven by using generative adversarial networks. J. Comput. Des. Eng. 2023, 11, 305–324. [Google Scholar] [CrossRef]
  34. Tang, H.; Torr, P.H.S.; Sebe, N. Multi-Channel Attention Selection GANs for Guided Image-to-Image Translation. IEEE Trans. Pattern Anal. Mach. Intell. 2022, 45, 6055–6071. [Google Scholar] [CrossRef]
  35. Pawan Shivan, O.; Rasheed Reber, I.; Reving Masoud, A. The Genetic Algorithm (GA) in Relation to Natural Evolution. Acad. J. Nawroz Univ. 2022, 11, 243–250. [Google Scholar] [CrossRef]
  36. Noskova, E.; Ulyantsev, V.; Koepfli, K.-P.; O’Brien, S.J.; Dobrynin, P. GADMA: Genetic algorithm for inferring demographic history of multiple populations from allele frequency spectrum data. GigaScience 2020, 9, giaa005. [Google Scholar] [CrossRef]
  37. Chen, Q.; Zhang, C.; Hu, T.; Zhou, Y.; Ni, H.; Xue, X. Posture optimization in robotic machining based on comprehensive deformation index considering spindle weight and cutting force. Robot. Comput. Integr. Manuf. 2022, 74, 102290. [Google Scholar] [CrossRef]
  38. Veeramani, C.; Sharanya, S. An improved evaporation rate-water cycle algorithm based genetic algorithm for solving generalized ratio problems. RAIRO Oper. Res. 2021, 55, S461–S480. [Google Scholar] [CrossRef]
  39. Zhang, K. Energy-saving parameterized design of buildings based on genetic algorithm. Int. J. Build. Pathol. Adapt. 2020, 38, 785–795. [Google Scholar] [CrossRef]
  40. Mata, J.L.; Orejudos, J.N.; Opon, J.G.; Guirnaldo, S.A. Optimizing Building Orientation and Roof Angle of a Typhoon-Resilient Single-Family House Using Genetic Algorithm and Computational Fluid Dynamics. Buildings 2022, 13, 107. [Google Scholar] [CrossRef]
  41. Wang, L.; Liu, J.; Zeng, Y.; Cheng, G.; Hu, H.; Hu, J.; Huang, X. Automated building layout generation using deep learning and graph algorithms. Autom. Constr. 2023, 154, 105036. [Google Scholar] [CrossRef]
  42. Zhao, X.; Yu, H.; Bian, H. Image to Image Translation Based on Differential Image Pix2Pix Model. CMC Comput. Mater. Contin. 2023, 77, 181–198. [Google Scholar] [CrossRef]
  43. Kushwaha, V.; Shukla, P.; Nandi, G.C. Generating quality grasp rectangle using Pix2Pix GAN for intelligent robot grasping. Mach. Vis. Appl. 2023, 34, 15. [Google Scholar] [CrossRef]
  44. JGJ/T 449-2018; Standard for Green Performance Calculation of Civil Buildings. China Architecture & Building Press: Beijing, China, 2018.
  45. ASHRAE 55-2004; Thermal Environmental Conditions for Human Occupancy. ASHRAE: Atlanta, GA, USA, 2004.
  46. Jie, D.; Hao, Y.; Rongrong, Y. Artistic and Structural Connections Between Architecture and Music—A Comparative Case Study of the Forbidden City and Palace Memories. Nexus Netw. J. 2024, 26, 353–367. [Google Scholar] [CrossRef]
  47. Zhang, T.; Hong, B.; Su, X.; Li, Y.; Song, L. Effects of tree seasonal characteristics on thermal-visual perception and thermal comfort. Build. Environ. 2022, 212, 108793. [Google Scholar] [CrossRef]
  48. Liu, K.; Xu, X.; Huang, W.; Zhang, R.; Kong, L.; Wang, X. A multi-objective optimization framework for designing urban block forms considering daylight, energy consumption, and photovoltaic energy potential. Build. Environ. 2023, 242, 110585. [Google Scholar] [CrossRef]
  49. Sun, X.; Yang, Z.; Wei, X.; Tao, Y.; Boczkaj, G.; Yoon, J.Y.; Xuan, X.; Chen, S. Multi-objective optimization of the cavitation generation unit structure of an advanced rotational hydrodynamic cavitation reactor. Ultrason. Sonochem. 2021, 80, 105771. [Google Scholar] [CrossRef] [PubMed]
  50. Xu, F.; Gao, M.; Ma, C.; Zhao, H.; Zhu, J.; Zhang, Z. Pareto optimal solution set strategy based on multiobjective optimization for the clinching tools. Int. J. Adv. Manuf. Technol. 2023, 128, 3375–3389. [Google Scholar] [CrossRef]
  51. Liu, Z.; Zhou, Q.; Yin, H.; Xu, W.; Yang, X.; Gao, J. Indoor environmental quality and energy consumption real-time assessment: A field measurement of a nearly zero-energy building in cold region of China. Energy Build. 2021, 246, 111093. [Google Scholar] [CrossRef]
  52. Girnik, I.; Yang, T.; Gordeeva, L.; Wang, W.; Ge, T.; Aristov, Y. New adsorption method for moisture and heat exchange in ventilation systems in cold countries: Concept and mathematical simulation. Energies 2020, 13, 1386. [Google Scholar] [CrossRef]
  53. Christovam, L.E.; Shimabukuro, M.H.; Galo, M.d.L.B.; Honkavaara, E. Pix2pix conditional generative adversarial network with MLP loss function for cloud removal in a cropland time series. Remote Sens. 2021, 14, 144. [Google Scholar] [CrossRef]
  54. Mi, Z.; Jiang, X.; Sun, T.; Xu, K. GAN-generated image detection with self-attention mechanism against GAN generator defect. IEEE J. Sel. Top. Signal Process. 2020, 14, 969–981. [Google Scholar] [CrossRef]
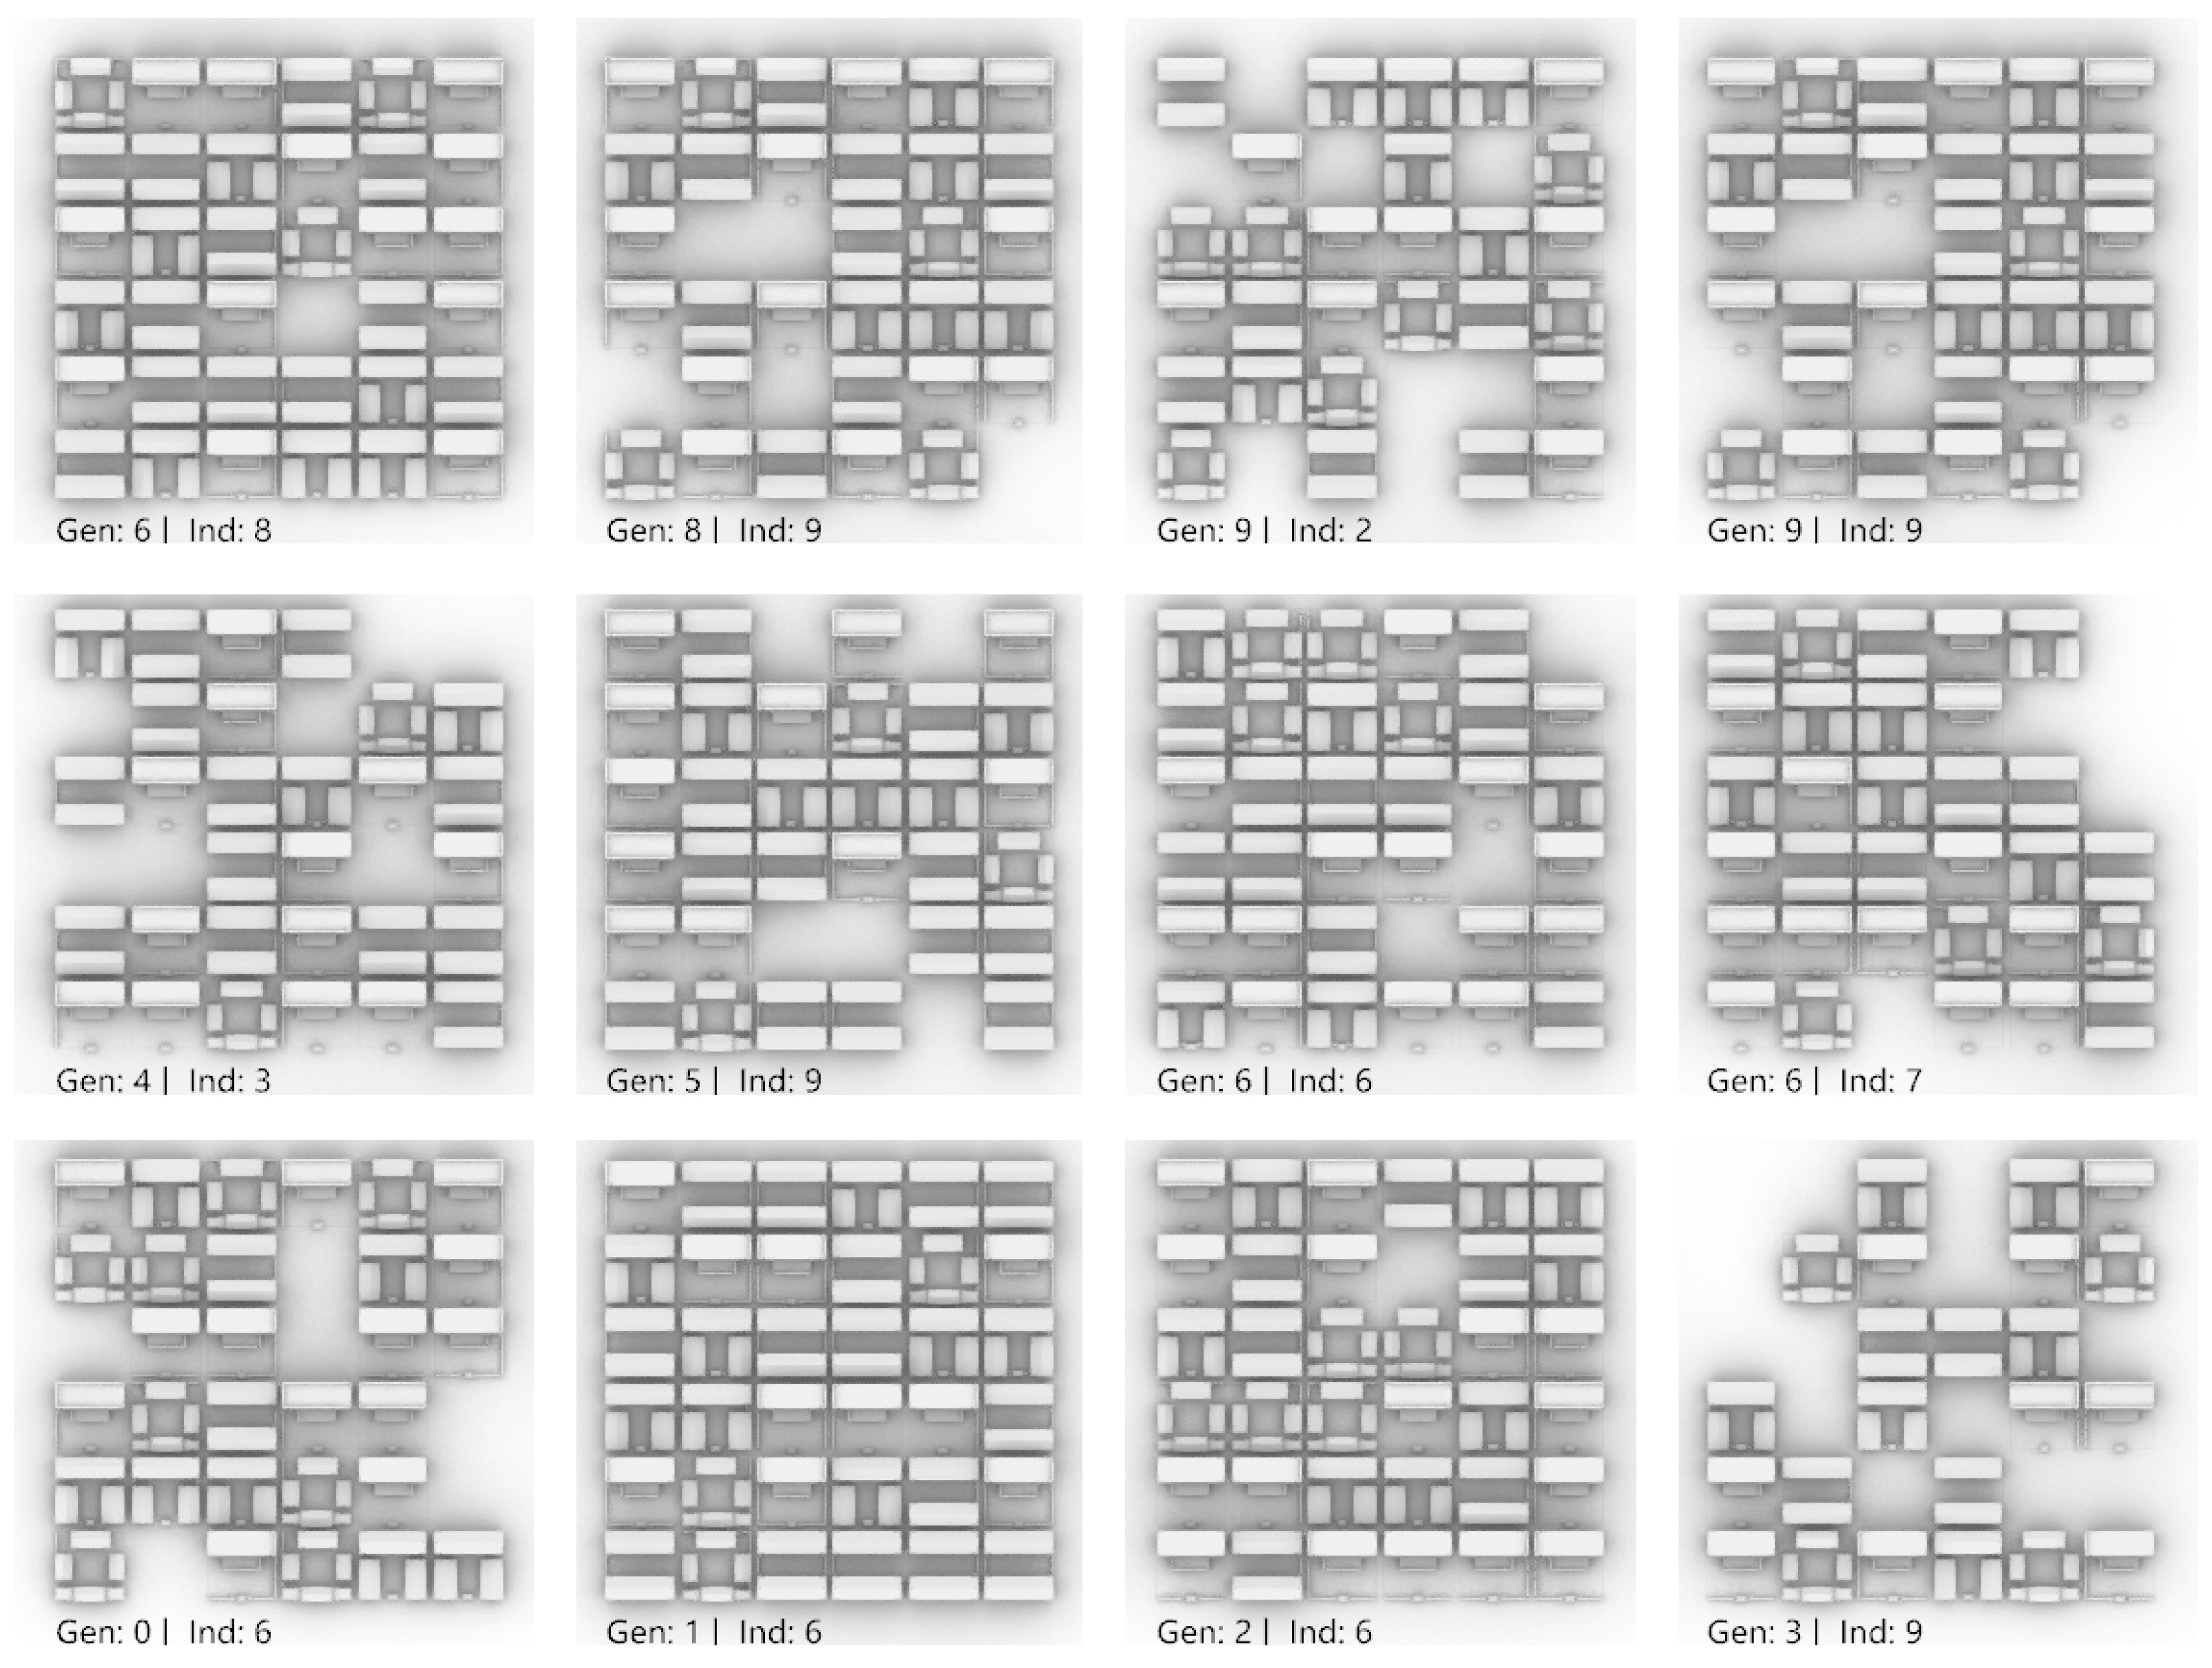
Figure 1. Workflow of genetic algorithms.
Buildings 14 01957 g001
Figure 2. Visually representing the processes of UTCI generation: illustration of the Pix2Pix architecture.
Buildings 14 01957 g002
Figure 3. Generator workflow diagram (Through four down-sampling operations, convolutional feature extraction is performed on the input images. Then, by employing four up-sampling operations, the images are restored to their original dimensions, and pixel-wise classification is carried out).
Buildings 14 01957 g003
Figure 4. Research workflow diagram.
Buildings 14 01957 g004
Figure 5. Research framework diagram.
Buildings 14 01957 g005
Figure 6. The PMV (predicted mean vote) situation for the Beijing standard meteorological year based on the ASHRAE 55 comfort standard: monthly air temperature.
Buildings 14 01957 g006
Figure 7. Enthalpy–humidity chart for the standard meteorological year in Beijing based on the ASHRAE 55 comfort standard.
Buildings 14 01957 g007
Figure 8. Diagram of isomorphic relationship between quadrangle courtyard and the forbidden city: (a) Beijing Imperial city overall layout plan and (b) the plan of Beijing da yuan quadrangle courtyard.
Buildings 14 01957 g008
Figure 9. Satellite map of Da Yuan Hutong in Beijing with highly refined top-view and perspective-view diagrams of four building types and leisure squares.
Buildings 14 01957 g009
Figure 10. Optimization process based on UTCI and building area. Site plan: (a) the 12th generation, 6th individual and (b) the 14th generation, 8th individual.
Buildings 14 01957 g010
Figure 11. The optimization process based on UTCI and building area. Aerial view: (a) the 12th individual of the 14th generation and (b) the 12th individual of the 16th generation.
Buildings 14 01957 g011
Figure 12. The Pareto frontiers dominated by genetic optimization based on UTCI and building area—plan view.
Buildings 14 01957 g012
Figure 13. The Pareto frontiers dominated by genetic optimization based on UTCI and building area—aerial view.
Buildings 14 01957 g013
Figure 14. The Pareto frontiers dominated by genetic optimization based on UTCI and building area—local magnification map.
Buildings 14 01957 g014
Figure 15. The pairing style of training data for UTCI simulation with Pix2Pix.
Buildings 14 01957 g015
Figure 16. The processing of training data for UTCI simulation with Pix2Pix.
Buildings 14 01957 g016
Figure 17. Implementing UTCI prediction simulation using Pix2Pix technology in Grasshopper.
Buildings 14 01957 g017
Figure 18. Performing UTCI prediction simulation using Pix2Pix technology for (a) the initial round of the first batch and (b) the 15,500th batch of the 200th round.
Buildings 14 01957 g018
Figure 19. Original site wind speed simulation results.
Buildings 14 01957 g019
Figure 20. Optimized wind speed results using Pix2Pix technology.
Buildings 14 01957 g020
Figure 21. Scatter plot of building density, plot ratio, and UTCI.
Buildings 14 01957 g021
Figure 22. Comparison of G loss, D loss, Adv loss, and Pixel loss before and after incorporating the self-attention mechanism in the Pix2Pix algorithm.
Buildings 14 01957 g022
Table 1. Quantity relationship among Siheyuan, Sanheyuan, Erheyuan, new buildings, and empty spaces in the Pareto frontier dominating solution set.
IndividualSiheyuanSanheyuanErheyuanNew BuildingsEmpty Spaces
Gen:0 Ind:6872136
Gen:1 Ind:63815100
Gen:2 Ind:6586161
Gen:3 Ind:9464913
Gen:4 Ind:32312127
Gen:5 Ind:93512115
Gen:6 Ind:64510143
Gen:6 Ind:7468135
Gen:6 Ind:83712131
Gen:8 Ind:9468135
Gen:9 Ind:276698
Gen:9 Ind:9468135
Disclaimer/Publisher’s Note: The statements, opinions and data contained in all publications are solely those of the individual author(s) and contributor(s) and not of MDPI and/or the editor(s). MDPI and/or the editor(s) disclaim responsibility for any injury to people or property resulting from any ideas, methods, instructions or products referred to in the content.

