Article

Study of Void Detection Beneath Concrete Pavement Panels through Numerical Simulation

1
The Key Laboratory of Road and Traffic Engineering, Ministry of Education, Tongji University, Shanghai 201804, China
2
China Airport Planning & Design Institute Co., Ltd., Beijing 100029, China
3
Ctrip Computer Technology (Shanghai) Co., Ltd., Shanghai 200335, China
4
China Shanghai Tongke Transportation Technology Co., Ltd., Shanghai 200092, China
*
Authors to whom correspondence should be addressed.
Buildings 2024, 14(7), 1956; https://doi.org/10.3390/buildings14071956
Submission received: 26 May 2024 / Revised: 13 June 2024 / Accepted: 21 June 2024 / Published: 27 June 2024
(This article belongs to the Special Issue Advances in Composite Construction in Civil Engineering)

Abstract

:
In the structure of composite pavement, the formation of voids beneath concrete panels poses significant risks to structural integrity and operational safety. Ground-Penetrating Radar (GPR) detection serves as an effective method for identifying voids beneath concrete pavement panels. This paper focuses on analyzing the morphological features of GPR echo signals. Leveraging the GprMax numerical simulation software, a numerical simulation model for void conditions in concrete pavement is established by setting reasonable pavement structure parameters, signal parameters, and model space parameters. The reliability of the numerical simulation model is validated based on field data from full-scale test sites with pre-fabricated voids. Various void conditions, including different void thicknesses, sizes, shapes, and filling mediums, are analyzed. The main conclusions of the study are as follows: the correlation coefficient between measured and simulated signals is above 0.8; a noticeable distinction exists between echo signals from intact and voided structures; signals exhibit similar phase and time delays for different void thicknesses and sizes but significant differences are observed in the A-scan signal intensity, the signal intensity, and the width of the B-scan signal; the impact of void shape on GPR echo signals mainly manifests in the variation of void thickness at different measurement points; and the relationship between the dielectric properties of the void-filling medium and the surrounding environment dictates the phase and time delay characteristics of the echo signal.

1. Introduction

Pavement is a composite structure composed of layers of different materials, and achieving seamless integration between these layers is often a challenge. The presence of voids beneath concrete pavement panels is a common hidden defect, often manifested by the deterioration of the base support at the edges or corners of the pavement panels. This condition leads to uneven load-bearing capacity of the panels and greatly reduces the fatigue life of the pavement [1]. If not detected and treated promptly, the void area can rapidly expand under the influence of various factors such as rainfall and load, resulting in the exacerbation of issues like cracks, misalignment, and fragmentation, ultimately culminating in the complete fracturing of the pavement panels, thereby compromising the operational safety of aircraft [2,3].
Ground-penetrating radar (GPR) testing technology involves the use of high-frequency electromagnetic pulse waves to detect the morphology of subterranean structural layers. Perceiving variations in the dielectric properties of subterranean layers enables the reconstruction of underground structures. GPR testing boasts high detection efficiency and non-destructive pavement assessment advantages [4,5]. For road pavement detection, Yu et al.[6] proposed a dehollowing width and depth detection algorithm based on ground-penetrating radar signals to identify the dehollowing area and verified the feasibility of the method in numerical and physical laboratory models; Xiao et al. [7] used GPR and core drilling sample methods to detect pavement conditions and conducted a comparative analysis based on the coring drilling sample results, finding that the accuracy rate of determination of under-slab cavitation was up to 86.7% and the accuracy rate of determination of under-slab cavitation location was up to 80%, which could meet the needs of judgment and evaluation of under-slab void in cement concrete pavement. At present, GPR has matured in pavement dehollowing detection technology, and corresponding detection standards have been proposed to guide the application of ground-penetrating radar for actual detection [8]. However, compared with the cement concrete pavement, the airport pavement surface cement concrete plate is thicker, the development of disease is slower, the use of GPR detection is more difficult, and the analysis of GPR echo signal data is more demanding. To address limitations such as incomplete feature extraction and low accuracy in analyzing GPR echo signals, Li et al. [9] validated the effectiveness of refined semantic feature extraction based on an improved attention mechanism for inverting GPR images, thereby enhancing inversion quality. Qiu et al. [10] employed the YOLOV5 network framework to detect feature curves in GPR images, achieving real-time detection and precise localization of foreign objects in GPR images. Jiang [11] obtained radar reflection spectra through forward numerical simulation, applied robust principal component analysis for clutter suppression, and extracted features such as signal time domain, frequency domain, wavelet domain waveforms, power spectral density, and wavelet packet energy, achieving significant application effectiveness. By extracting salient waveform features combined with high-precision deep learning algorithms [12], the resolution of GPR echo signals has been largely achieved. However, due to the concealed nature of pavement voids, mapping GPR echo signal analysis data with actual void dimensions such as width and depth remains challenging, impeding the comprehensive understanding of echo signal response laws [13].
Forward simulation of GPR is a crucial tool for theoretically investigating the response laws of GPR echo signals. He et al. [14] initially established a two-dimensional Finite-Difference Time-Domain (FDTD) mathematical model for GPR and successfully conducted numerical simulations. Feng [15] derived ideal dispersion relations and super-absorbing boundary conditions by deducing numerical dispersion. Shu [16] developed a Uniaxial Perfectly Matched Layer (UPML) absorbing boundary conditions under medium magnetic loss. Building on these studies, GprMax has enabled the exploration of echo signal response laws for extensive sample data under limited real-world sample conditions. Zhang et al. [17] analyzed various influencing factors on underground pipeline detection images using GprMax software (version 3). They established a forward simulation synthetic image library for the interpretation of actual detection images. Chen [18] used forward simulation data based on the Finite-Difference Time-Domain method and a small amount of field-collected data. By combining the time-frequency information characteristics of GPR A-scan signals and the horizontal cross-sectional image characteristics of C-scan, they extensively explored the echo signal response laws, enabling the identification and determination of underground voids.
Against this background, for ground-penetrating radar echo signals aimed at the concrete pavement, it is necessary to conduct a systematic research analysis using GprMax numerical simulation software to thoroughly investigate and analyze the characteristics of echo signals. This research aims to delve deeply into the mapping relationship between void states and echo signals, understand the evolutionary patterns of echo signals concerning void state variations, proficiently resolve echo signals, timely monitor the support state of pavement panel bases, and guide on-site engineering detection work using ground-penetrating radar.

2. Principles of GprMax Numerical Simulation

GprMax is a software used for numerical simulation in GPR based on the FDTD method to solve Maxwell’s equations [19,20]. This software simulates the propagation of electromagnetic waves in ground-penetrating radar by discretizing Maxwell’s equations differentially. It possesses significant advantages, such as simplicity, intuitiveness, wide applicability, and high computational efficiency, and is widely employed in the simulation and modeling of electromagnetic wave propagation in ground-penetrating radar

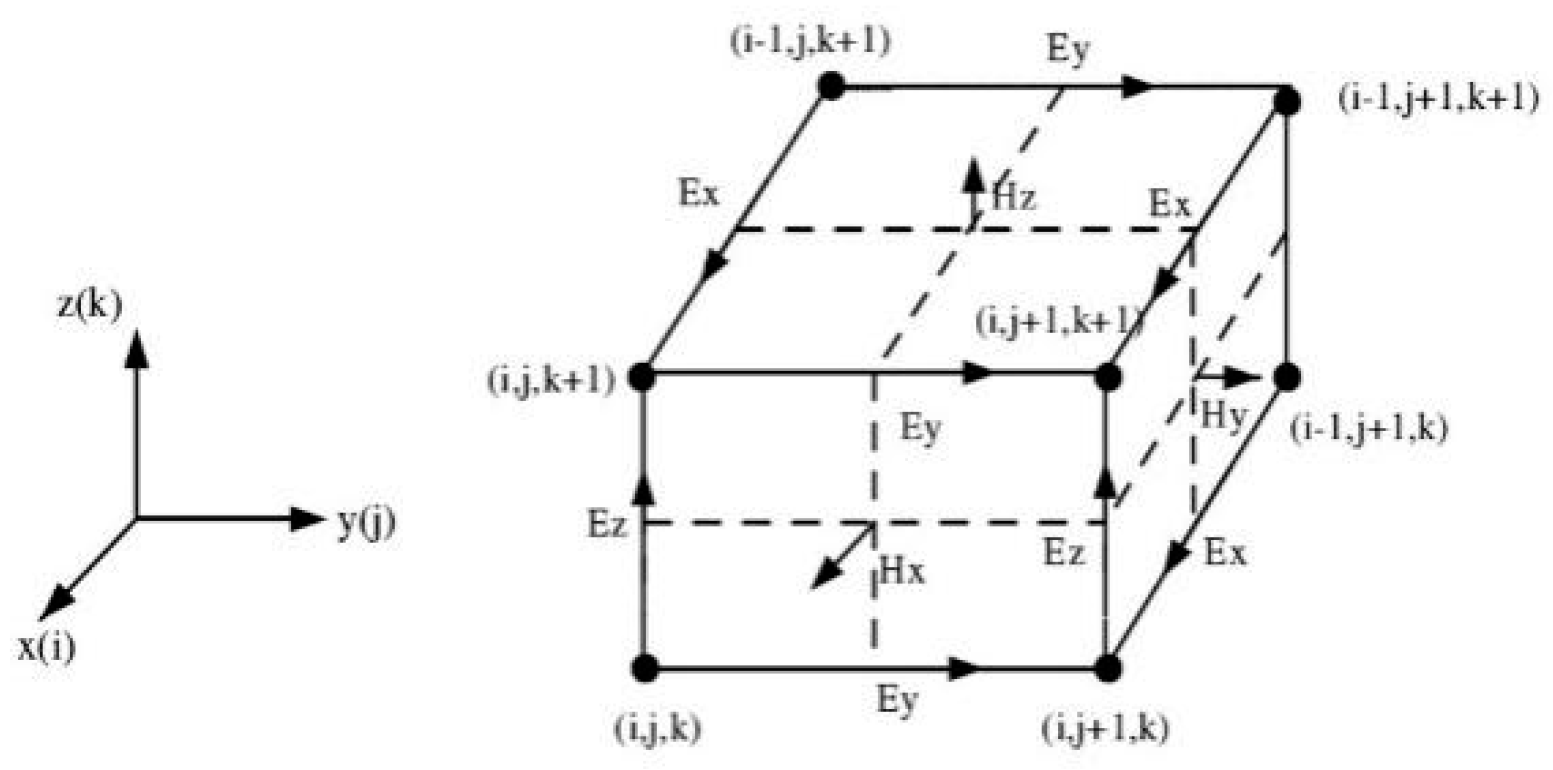
2.1. Discretization Format of Maxwell’s Equations

Maxwell’s equations, the fundamental equations of electromagnetic theory, describe the relationship between electric and magnetic fields, charge density, and current density. They represent the basic propagation laws that electromagnetic waves follow [21]. The discretized formulas for Maxwell’s equations are shown as Equations (1)–(4).
× H = J + D t
× E = B t
· B = 0
· D = ρ
= x i + y j + z k
where H is the magnetic field strength (A/m), J is the charge density (A/m2), D is the potential shift (C/m2), E is the electric field strength (V/m), B is the magnetic induction strength (T), ρ is the charge density (C/m3), and is shown in Equation (5).
The various structural layers of the pavement are linear and isotropic media [22]. The constitutive relationship for such media is expressed in Equations (6)–(8). In the spatial Cartesian coordinate system, the three-dimensional Maxwell curl equations are derived based on the magnetic field intensity and electric field intensity, as formulated in Equations (9) and (10).
J = σ E
D = ε E
B = μ H
H z y H y z = ε E x t + σ E x H x z H z x = ε E y t + σ E y H y x H x y = ε E z t + σ E z
E z y E y z = μ H x t σ m H x E x z E z x = μ H y t σ m H y E y x E x y = μ H z t σ m H z
where σ is the electrical conductivity (S/m), ε is the relative permittivity, μ is the magnetic permeability, and σ m is the electrical conductivity (Ω/m).
Based on the above formulas, let f(x, y, z, t) denote any component in space, as shown in Equation (11). By taking the central differences of the first-order partial derivatives of f(x, y, z, t) with respect to the x, y, and z directions and time ‘t’, the difference format of Maxwell’s equations is obtained, as expressed in Equations (12)–(15).
f x , y , z , t = f i x , j y , k z , n t = f ( i , j , k )
f ( x , y , z , t ) x x = i t f i + 1 2 , j , k f n ( i 1 2 , j , k ) x
f ( x , y , z , t ) y y = i t f n i , j + 1 2 , k f n ( i , j 1 2 , k ) y
f ( x , y , z , t ) z z = i t f n i , j , k + 1 2 f n ( i , j , k 1 2 ) z
  f ( x , y , z , t ) t t = n t f n + 1 2 i , j , k f n 1 2 ( i , j , k ) t
The differential discretization of electromagnetic wave signals in the pavement simulation model was achieved based on Equations (12)–(15), resulting in the discrete values of the electromagnetic field signals in both the time and spatial domains.

2.2. Numerical Stability and Numerical Dispersion

When simulating the propagation of electromagnetic waves in the GprMax software, it is necessary to set a finite time step for recursive calculation in limited space. However, the time step and spatial step along each coordinate axis are not independent. Both the time step and spatial step must satisfy numerical stability conditions to ensure the convergence and stability of the solution. Therefore, when setting the time step, it is necessary to meet the requirements as described in Equations (16) and (17).
t = T π
t 1 c 1 x 2 + 1 y 2 + 1 z 2
where T is the electromagnetic wave propagation period (s), and c is the speed of light (m/s).
Moreover, FDTD essentially approximates solutions through discretization. Under discretization approximations, non-dispersive media experience numerical dispersion due to the discretization process, resulting in the simulation of electromagnetic wave propagation speed variations based on conditions such as wavelength, frequency, and propagation direction. Numerical dispersion is an inherent error in numerical simulations of electromagnetic waves using FDTD. It requires setting reasonable spatial steps to reduce numerical dispersion and avoid significant errors in computational results. The spatial steps in different propagation media should satisfy the limiting conditions as described in Equation (18).
l λ 12
where ∆l is the spatial step (m), and λ is the wavelength of the electromagnetic wave as it propagates through the medium (m).

2.3. Absorbing Boundary Conditions

During numerical simulation, it is necessary to confine the space for the propagation of electromagnetic waves. However, directly truncating the free space would lead to reflections and refractions at the subjectively set boundaries of electromagnetic wave propagation, consequently affecting the final simulation results. To mitigate this issue, Perfectly Matched Layer (PML) absorbing boundary conditions are integrated into the numerical simulation model. These boundary conditions involve adding a special layer of material at the boundary of the computational region to effectively absorb electromagnetic waves, thereby avoiding the influence of reflections and refractions on the calculated results and enhancing the accuracy of numerical simulations.
In this paper, the Yee grid spatial discretization method is used, as shown in Figure 1, to segment the finite space into spatial grids, obtaining differential equations for electric and magnetic fields in both temporal and spatial domains. In Yee cells, each component of the electric or magnetic field is surrounded by four components of the magnetic or electric field, where electric and magnetic fields are alternately sampled in the time sequence. At each time step, the updated value of the magnetic field is initially computed based on the discrete values of the electric field. Then, the updated value of the electric field is calculated based on the discrete values of the magnetic field. Through iterative processes, Maxwell’s equations are advanced in time, outlining the evolutionary process of electromagnetic fields within the spatial domain.

3. Building Numerical Simulation Model Based on GprMax

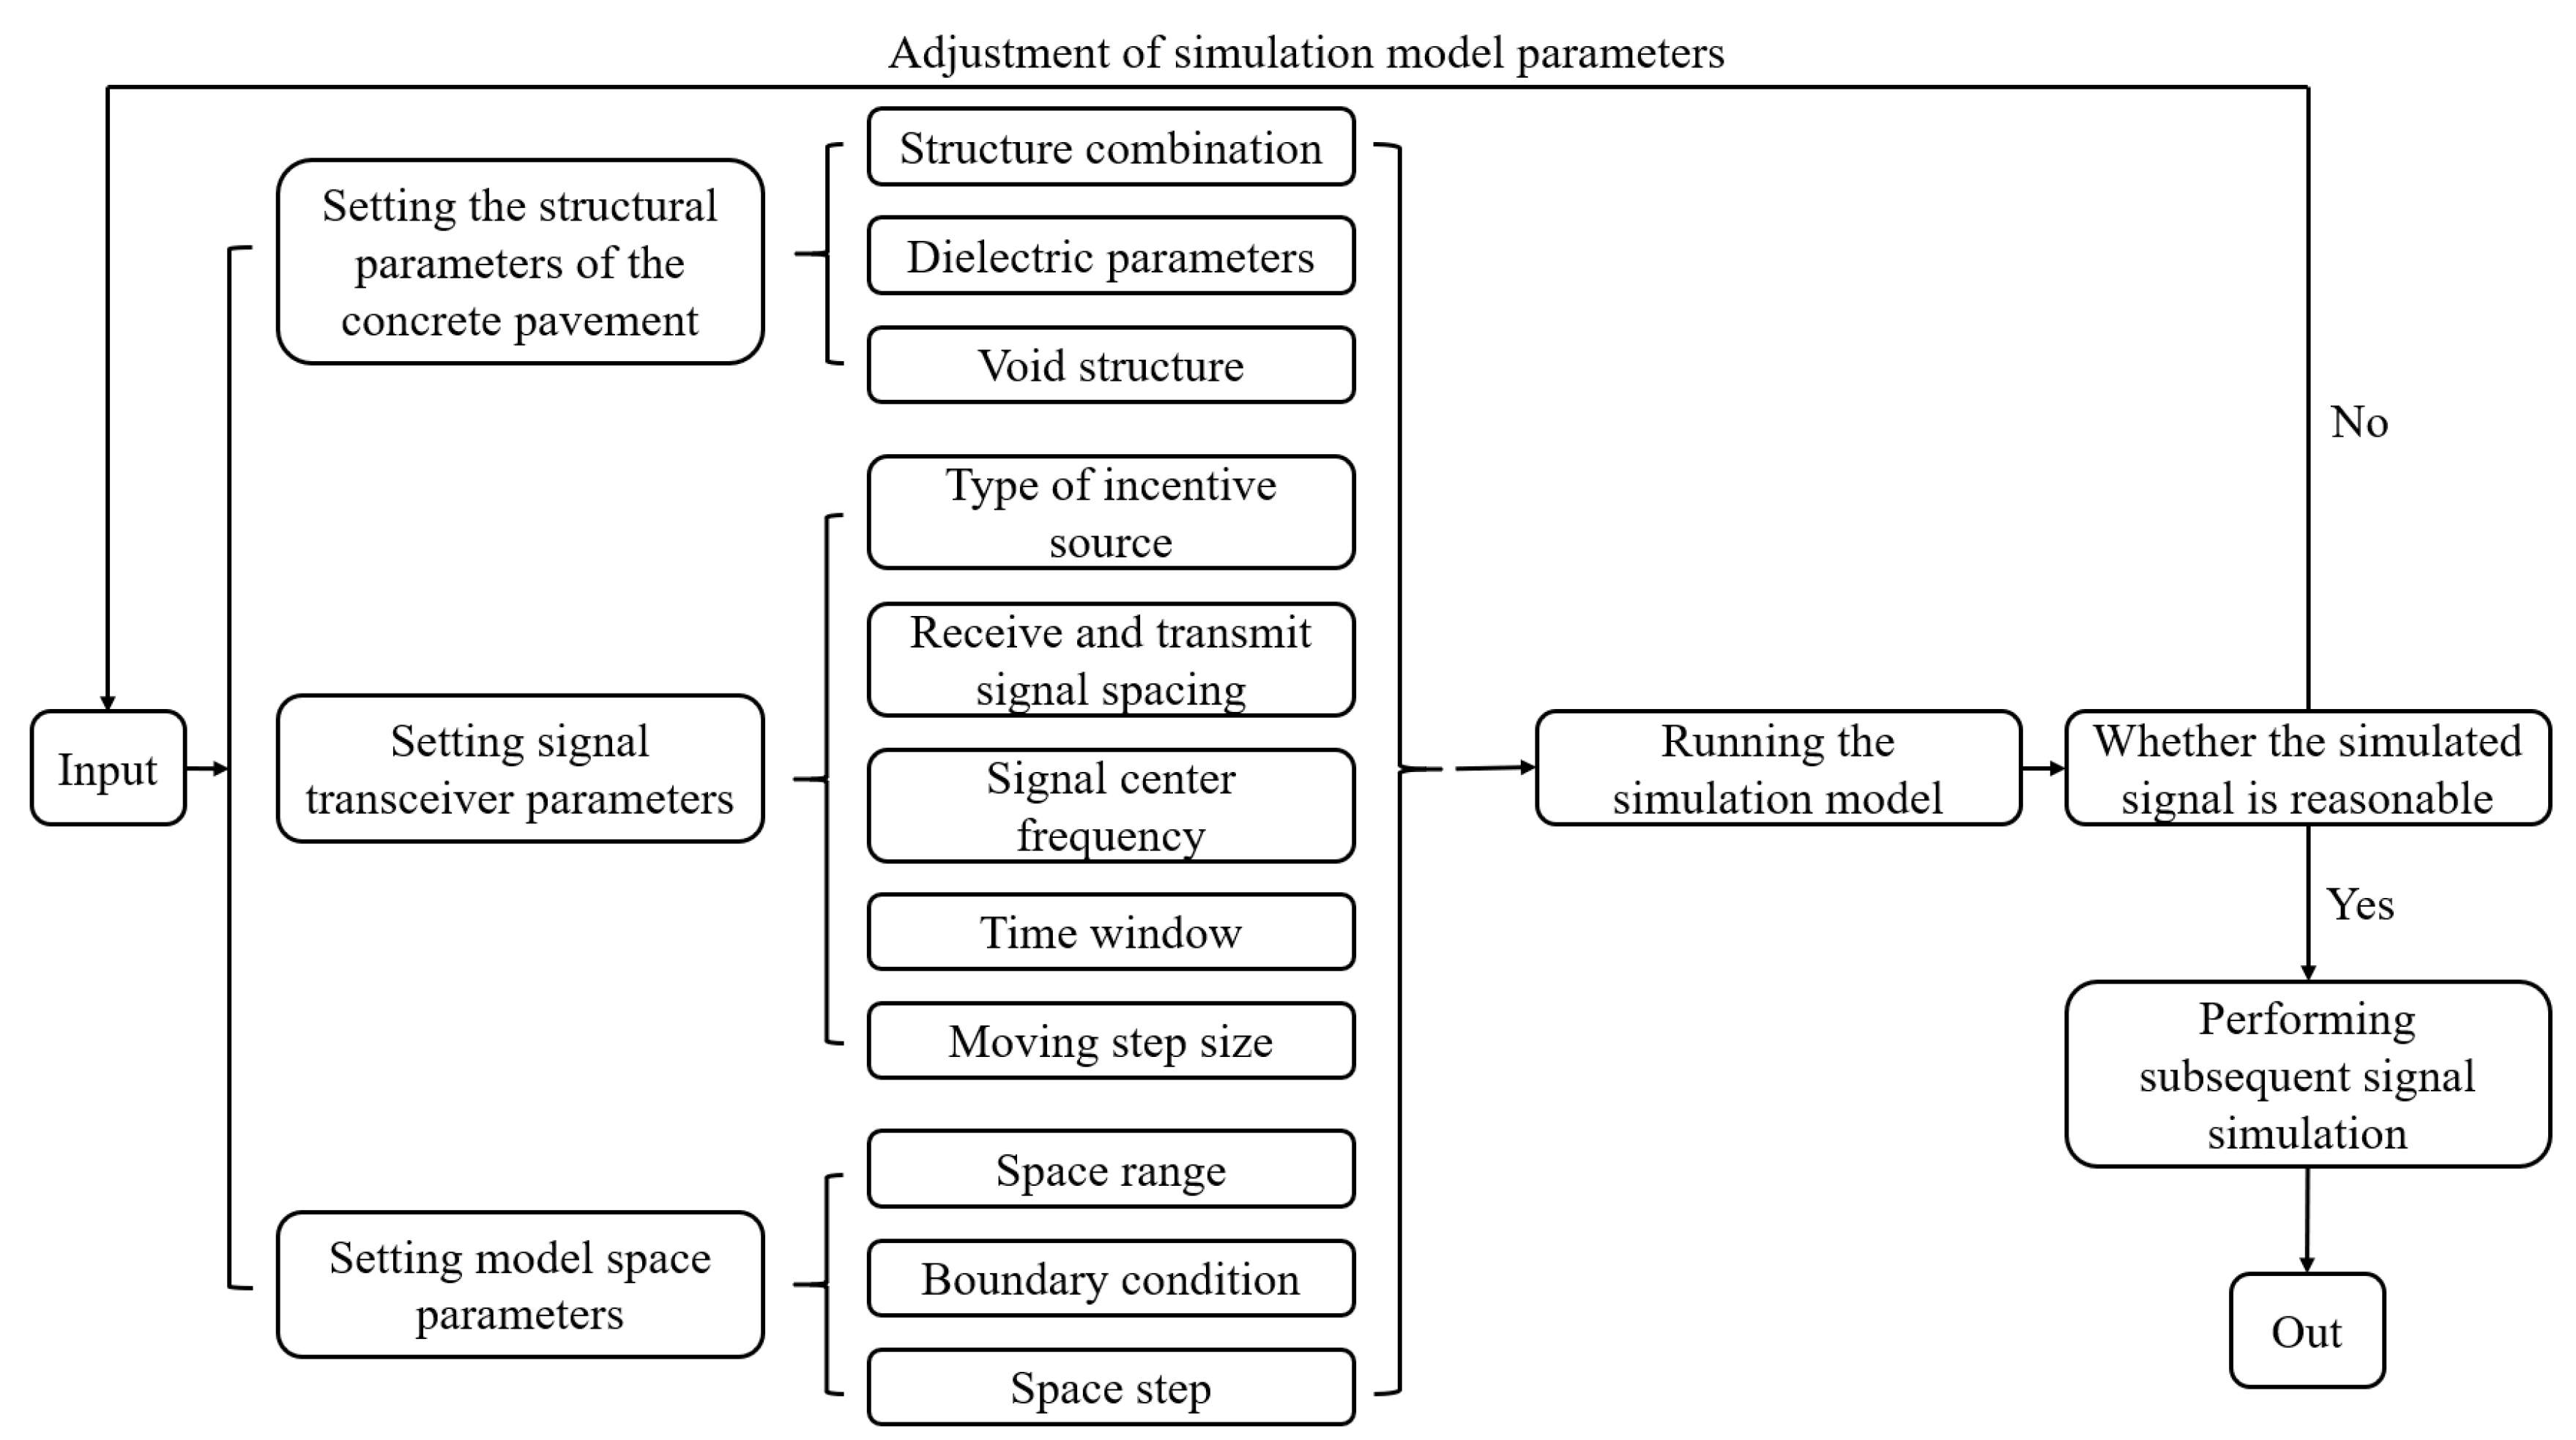
3.1. Modeling Process

The modeling process involves writing input files in GprMax to set the spatial, structural, and signal parameters of the numerical simulation model. Based on the numerical simulation results regarding the response of void conditions, signal parameters are optimized to meet the accuracy requirements of the numerical simulation. Following this, data collection and processing are performed on the output ‘out’ file. The specific detailed process is shown in Figure 2.

3.2. Modeling Parameters

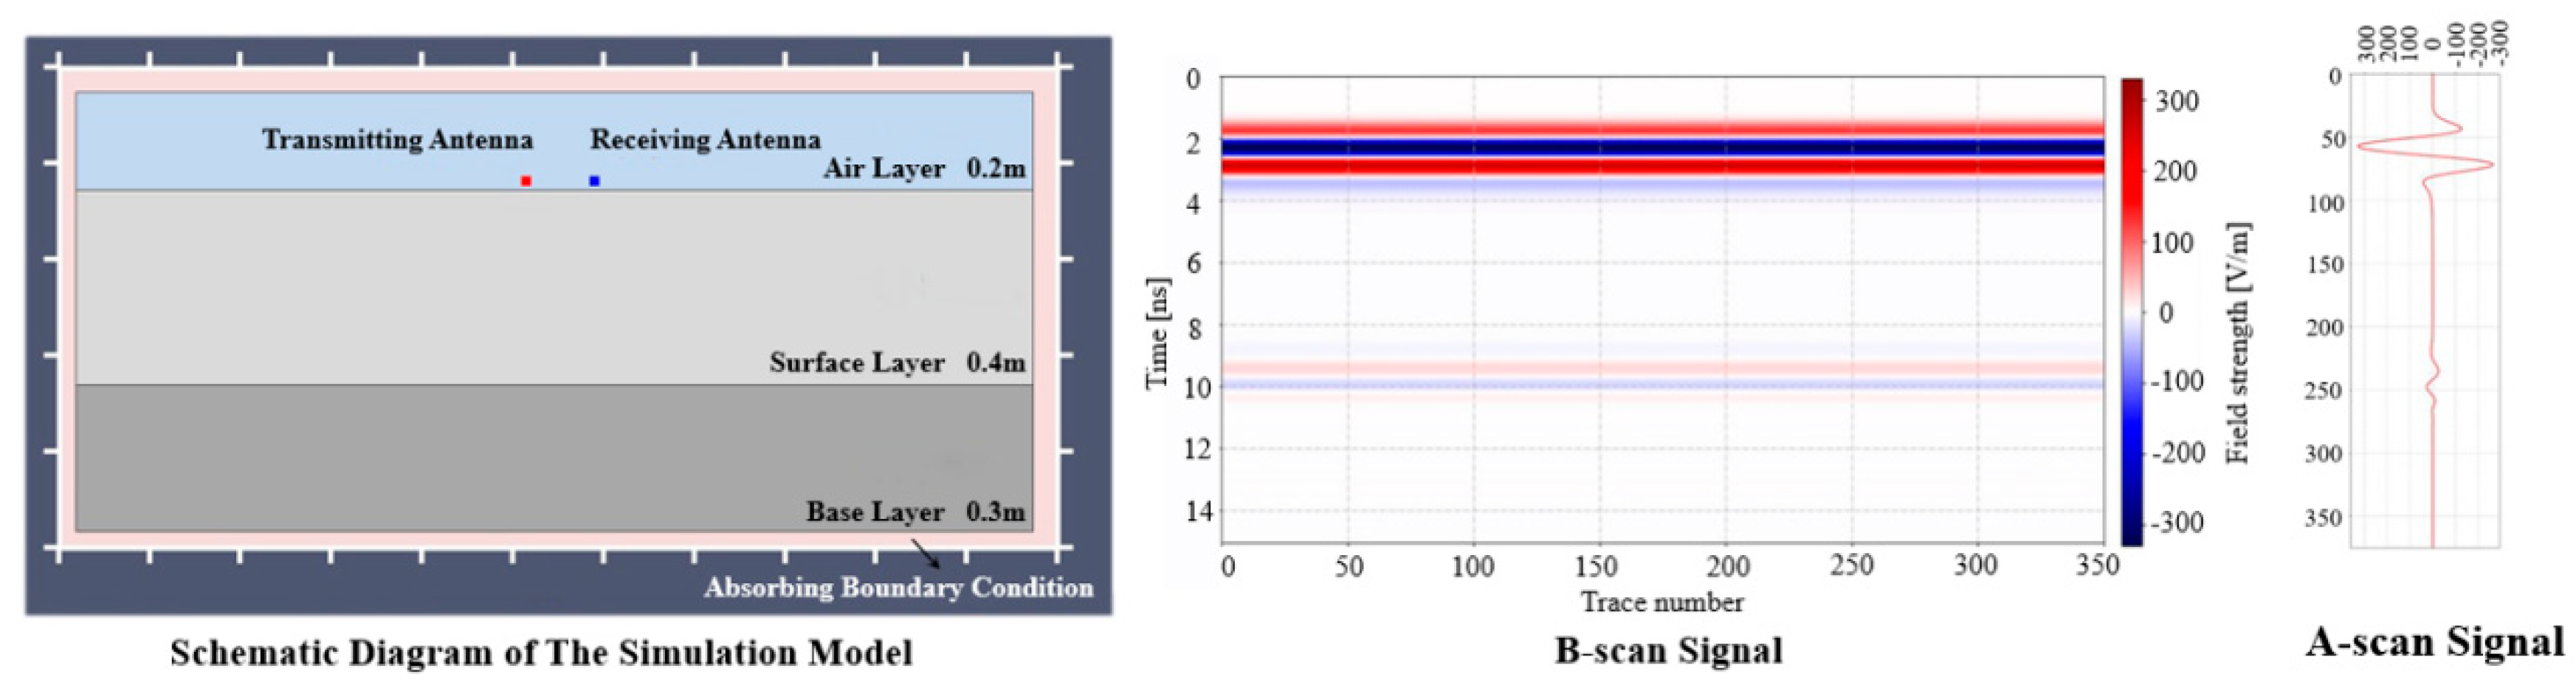
3.2.1. Pavement Structural Parameters

Pavement structural parameters include layer thickness and dielectric properties. Layer thickness influences the fluctuation position of the echo signal but does not affect the morphology of the echo signal. To ensure that the numerical simulation model accurately reflects the structural state of the pavement, model parameters are set based on common pavement structural parameters. Dielectric properties are described by parameters such as dielectric constant, electrical conductivity, magnetic permeability, and magnetic loss rate. However, the various structural layers of airport pavements are composed of non-magnetic materials such as cement, sand, gravel, and water. The magnetic permeability is close to 1, and the magnetic loss rate is close to 0. Therefore, the electromagnetic properties of the pavement’s structural layers are represented using dielectric constant and electrical conductivity. The pavement structural parameters are shown in Table 1.

3.2.2. Ground-Penetrating Radar Signal Parameters

Following the practical application parameters of airport GPR detection projects, the GPR signal parameters of the model are set as listed in Table 2.

3.2.3. Spatial Parameters

Referencing the actual pavement structure dimensions and ensuring numerical stability conditions for the numerical simulation model, the spatial parameters of the model are shown in Table 3.
The left side of Figure 3 shows a two-dimensional schematic of the airport’s cement concrete pavement structure. The A-scan signal monitoring receiver–transmitter antennas are positioned along the pavement structure’s centerline. The B-scan signal monitoring transceiver antenna moves parallel to the plane’s glide direction, and the radar signal map of the profile of the track structure is formed by combining multiple measurement points.
After running the numerical simulation model, the obtained GPR echo signals, as depicted on the right side of Figure 3, demonstrate the behavior of the electromagnetic waves. Initially, at the interface of the air layer and the surface layer, there is a reflection resulting in a direct wave reflected from the surface, characterized by strong energy and a short time delay. Similarly, at the interface of the surface and the base layer, another reflection occurs, presenting a weaker energy compared to the direct wave. The A-scan signal vividly exhibits the signal fluctuations caused by the changes in the medium at the air–surface and surface–base layer interfaces. Additionally, the B-scan signal displays the mapping relationship between the distribution of pavement structural layers and the corresponding strength and time delay of the echo signals. This verifies the rationality of parameters such as frequency, sampling interval, and time window set in the numerical simulation model.

4. Numerical Simulation Model Field Verification

To validate the accuracy and practicality of the cement concrete pavement numerical simulation model developed in this study and to ensure the reliability and authenticity of the subsequent analysis of echo signal morphology, a precast void test site was prepared. This allowed a comparative analysis of the GPR echo signal characteristics between the numerical simulation model and the actual precast void test site.

4.1. Basic Information of the Test Site

Following the airport pavement structure design specifications, a precast void test site was set up with a pavement structure of four 4 m × 4 m panels. Each panel comprised a 40 cm thick cement concrete surface layer, a 35 cm thick cement-stabilized crushed stone base layer, a 25 cm thick crushed stone cushion layer, and a 50 cm thick sand subbase, as schematically shown in Figure 4. The actual void areas were created using a mixture of air and loose fine aggregate. Consequently, the void structures in the precast test site were represented by elongated plastic plates with dielectric properties similar to the actual void material. Two void conditions were introduced underground in the GPR test line: void condition one measured 845 mm × 325 mm × 40 mm, while void condition two measured 545 mm × 200 mm × 15 mm.

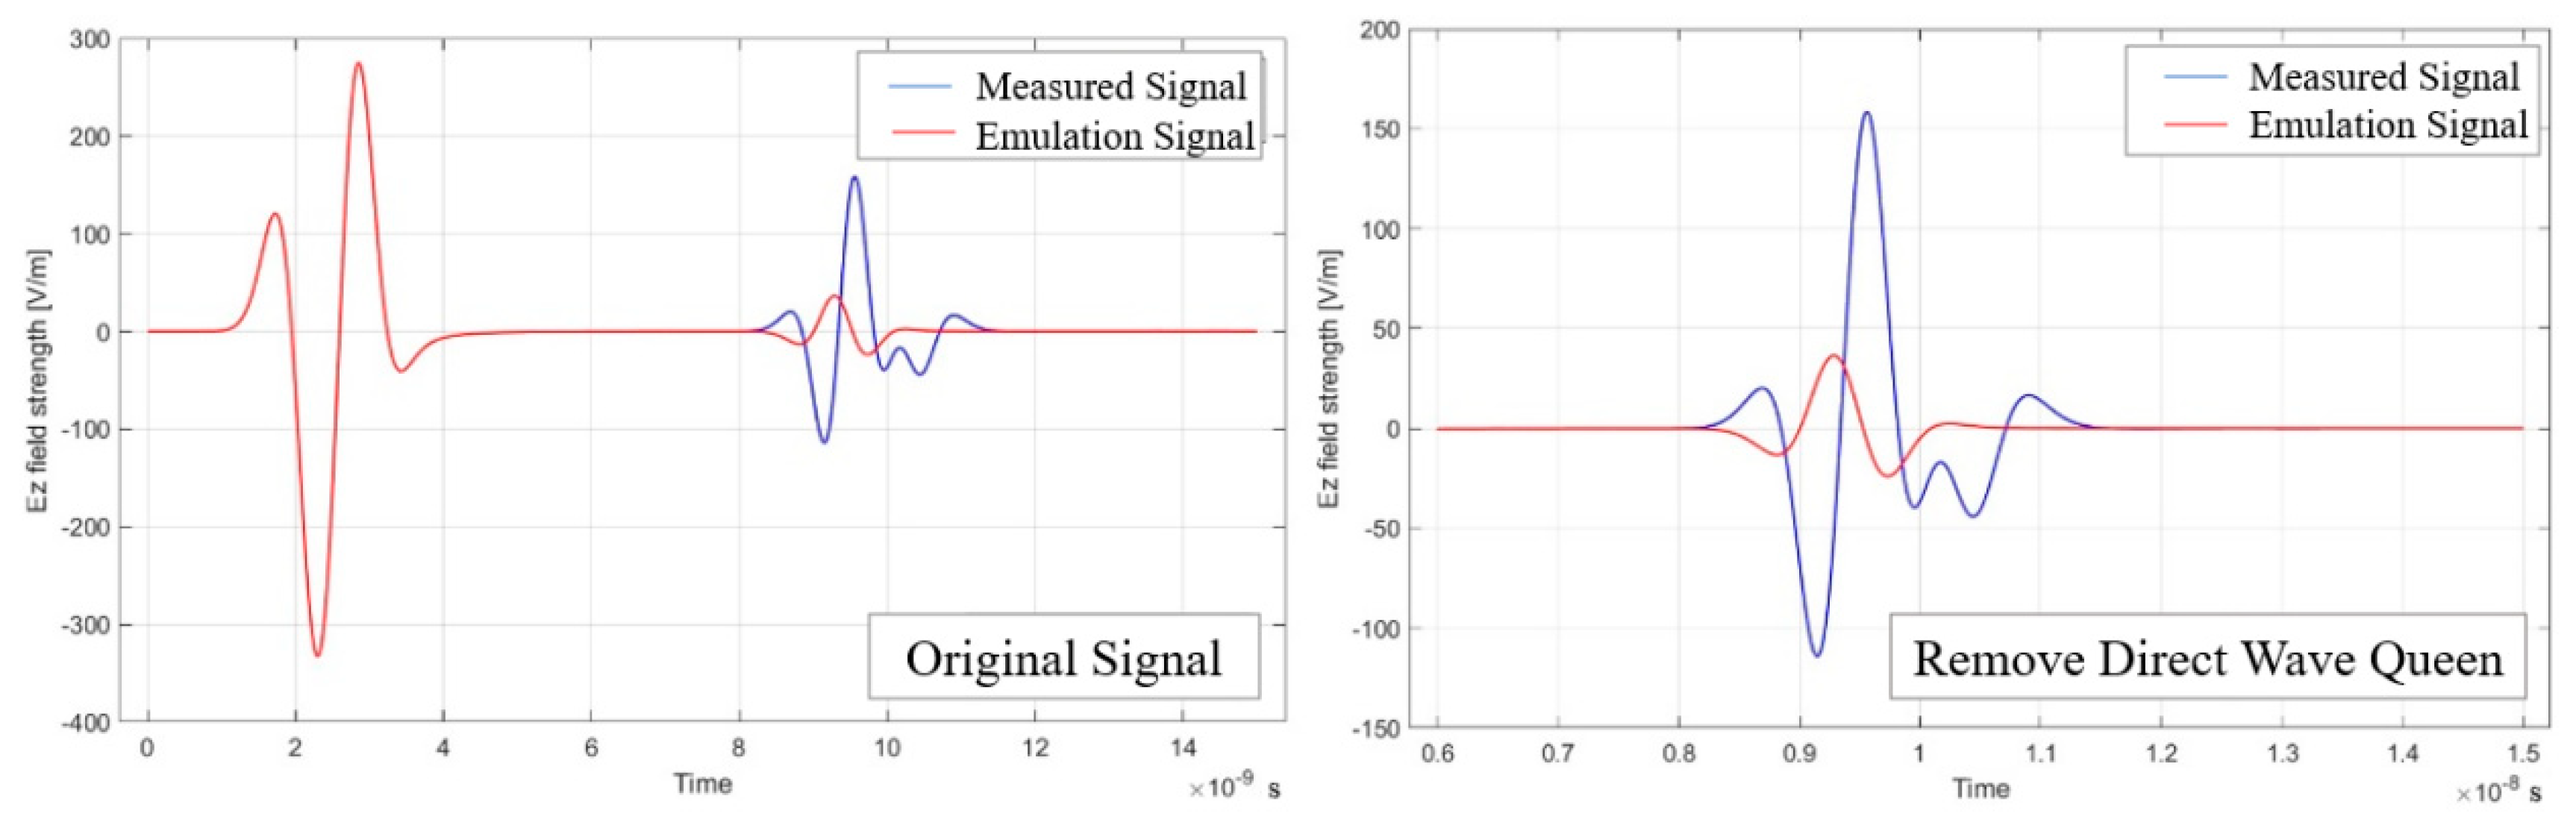
4.2. Analysis of Echo Signal Verification

Multiple tests were conducted on the precast test site using a GPR device attached to an intelligent inspection robot. The device had a central frequency of 600 MHz, with 14 channels spaced at intervals of 0.1 m and 512 sampling points. Utilizing the locating information, such as position, amplitude, and channel number of the buried void construction areas on the GPR test line, the A-scan signals were segmented and integrated. This process extracted the original radar signal sets for the two predetermined void construction positions. These were subjected to preprocessing steps such as zero-offset correction and direct wave removal to serve as actual measured signal samples for validation and analysis against the numerical simulation signals.
Corresponding GprMax numerical simulation models were created based on the actual structural parameters of the test site, specifically for the two precast void constructions. Simulations were conducted accordingly, extracting A-scan signals for preprocessing by removing the direct wave to generate simulated void condition signals.
The comparative diagrams between the measured signal samples and simulated signals are shown on the left side of Figure 5 and Figure 6. To further quantify the correlation between the two sets, two metrics were employed: the correlation coefficient [23] and the root mean square error [24]. The calculation formulas are as per Equations (19) and (20), and the computed results are shown on the right side of Figure 5 and Figure 6.
ρ X , Y = c o v ( X , Y ) σ X σ Y = E [ X μ X Y μ Y ] σ X σ Y
R M S E X , Y = 1 m i = 1 m h X i Y i 2
Based on Figure 5, it is evident that the measured signal sample set of void condition one aligns closely with the simulated signal without any substantial differences in form. There is a strong consistency and synchronization between both sets. The correlation coefficient between the simulated and measured signal samples remains around 0.8, indicating a strong correlation and high similarity in phase characteristics. Simultaneously, the root mean square error lies between 10 and 14, showing a relatively minor influence compared to the overall signal intensity. Although some numerical disparities exist, they remain within an acceptable range.
Comparing Figure 5 and Figure 6, it can be seen that the signal strength of void condition two is slightly reduced, with no significant difference observed in the shapes of both sets of signals. Additionally, the correlation coefficients between the simulated signals and various measured signals range from 0.8 to 0.85, with a root mean square error ranging from 6 to 7.5. This indicates that void condition two demonstrates a higher simulation accuracy compared to void condition one.
Overall, the simulated signals for both void conditions show a high degree of similarity with the measured signal samples, exhibiting a substantial correlation in signal form. Despite some differences in signal intensity, these differences fall within an acceptable range. Consequently, the cement concrete pavement GPR numerical simulation model constructed in this study holds practical significance for engineering applications.

5. Analysis of Echo Signal Forms in Numerical Simulation Model

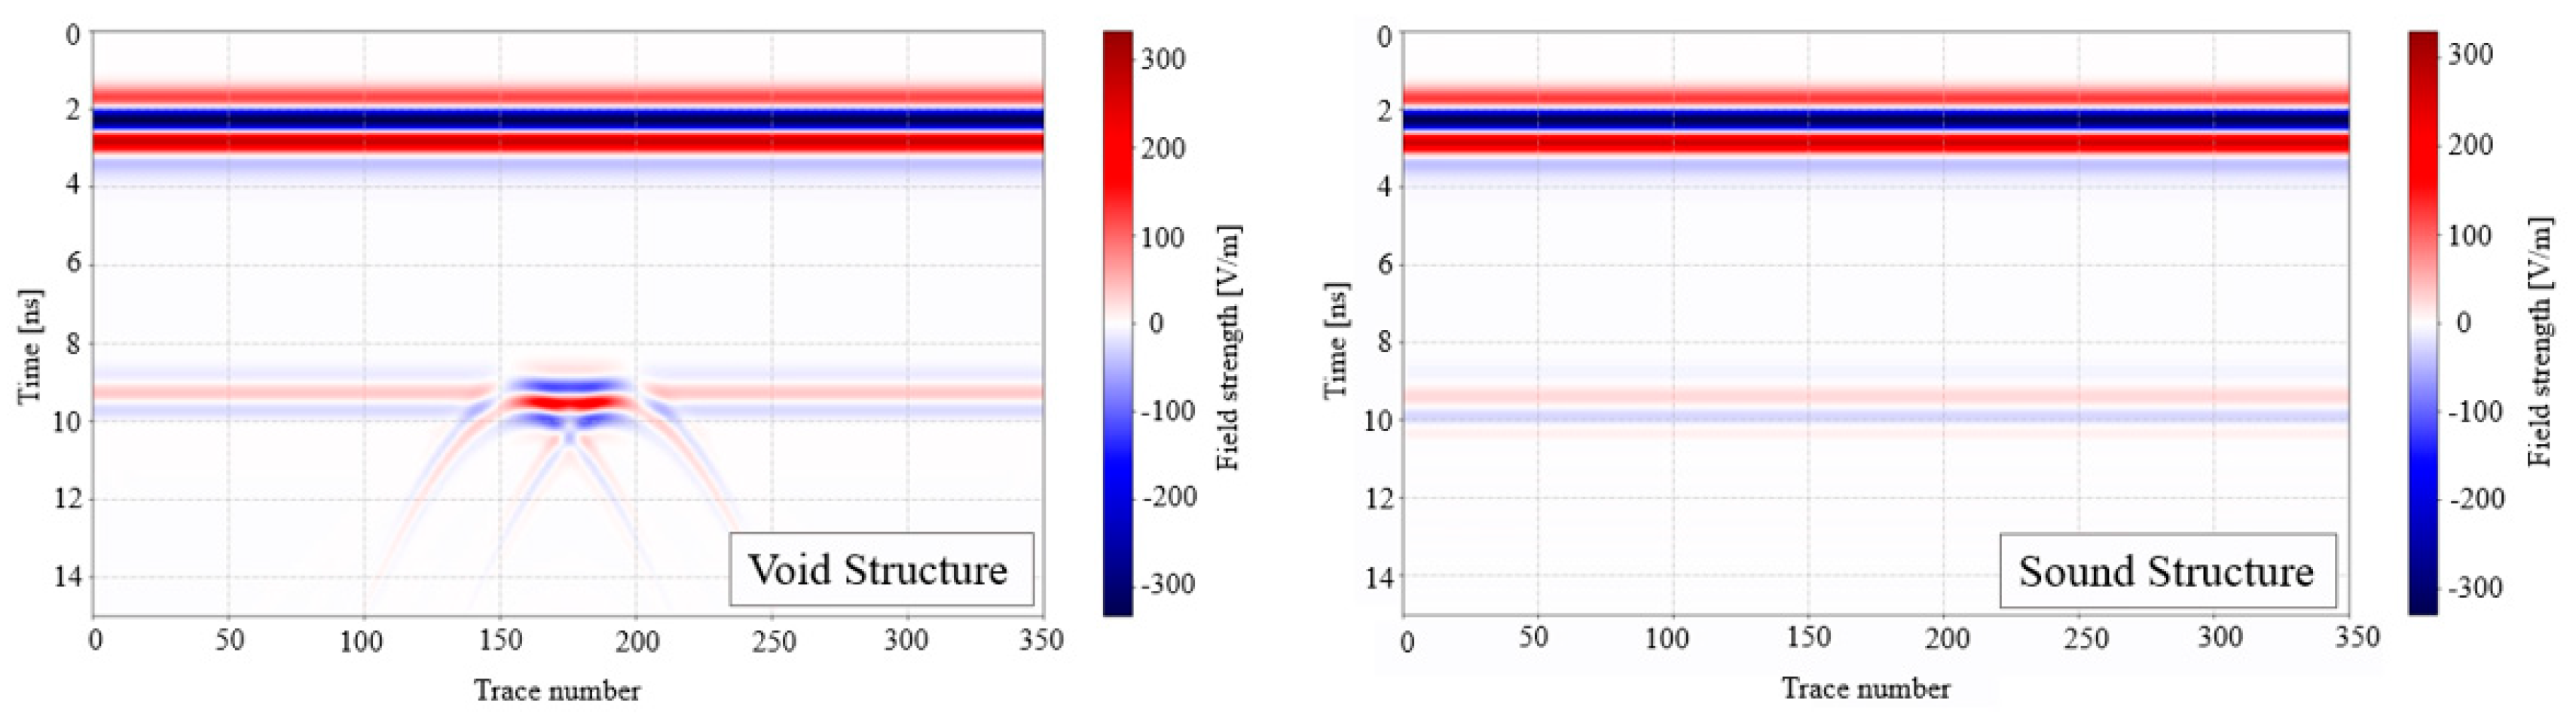
5.1. Analysis of Echo Signal Forms for Void and Intact Structures

The two-dimensional numerical simulation model was constructed based on the modeling process and parameters outlined in Section 3. The void was positioned between the surface and the base layer, with a thickness of 2 cm and dimensions of 40 cm, filled with air, and structured as a rectangle. Following simulation calculations, a comparative graph of the A-scan echo signal forms between the void and intact structures is shown in Figure 7.
From Figure 7, it is evident that the direct wave signal at 2 ns remains consistent in its timing and amplitude regardless of the differences between the void and intact structures. This signal, referred to as the ground direct wave, maintains a consistent waveform with “short delay, strong energy” characteristics [25], primarily due to the proximity of the transmission antenna to the ground and the high proportion of the transmission signal’s energy represented by the direct wave. When using ground-penetrating radar for underground target detection, the ground direct wave can interfere with the return echo signal of the detection target. This requires suppression techniques based on signal analysis and the characteristics of the ground direct wave, commonly employing algorithms such as time-domain thresholding, windowing, de-meaning, independent component analysis, etc.
Considering the characteristics of the echo signals in the numerical simulation model, particularly the fixed timing of the ground direct wave and its non-overlapping with the target echo signal from the void area, the time-domain thresholding method was employed to eliminate the direct wave from the A-scan signal. The following removal of the ground direct wave from the echo signal employed the same technique.
The phase of the echo signal in the intact structure is simple, exhibiting three phases of negative–positive–negative. In contrast, the echo signal phase in the void structure is more complex, with larger amplitude intensity and a later signal termination delay. This complexity arises from multiple dielectric change interfaces present in the void structure, including the surface-air, surface-base, and air-base, causing the superposition of various interfaces’ echo signals, forming the final signal waveform in terms of phase, amplitude, and delay.
The B-scan signal is a composite of the signals from various measurement points within the same section. The B-scan signals of the intact and void structures are shown in Figure 8. The intact structure’s signal spectrum includes only the echo signal from the surface-base interface apart from the ground direct wave. In the void structure, a distinct rectangular highlighted area appears at the void location, indicating a higher echo signal intensity within the void region. The signal spectrum in the void area displays continuous alternation between positive and negative amplitudes along the same phase axis, consistent with the phase, amplitude, and delay distribution features of the void structure in the A-scan. This validates the complementarity between the two signal types.

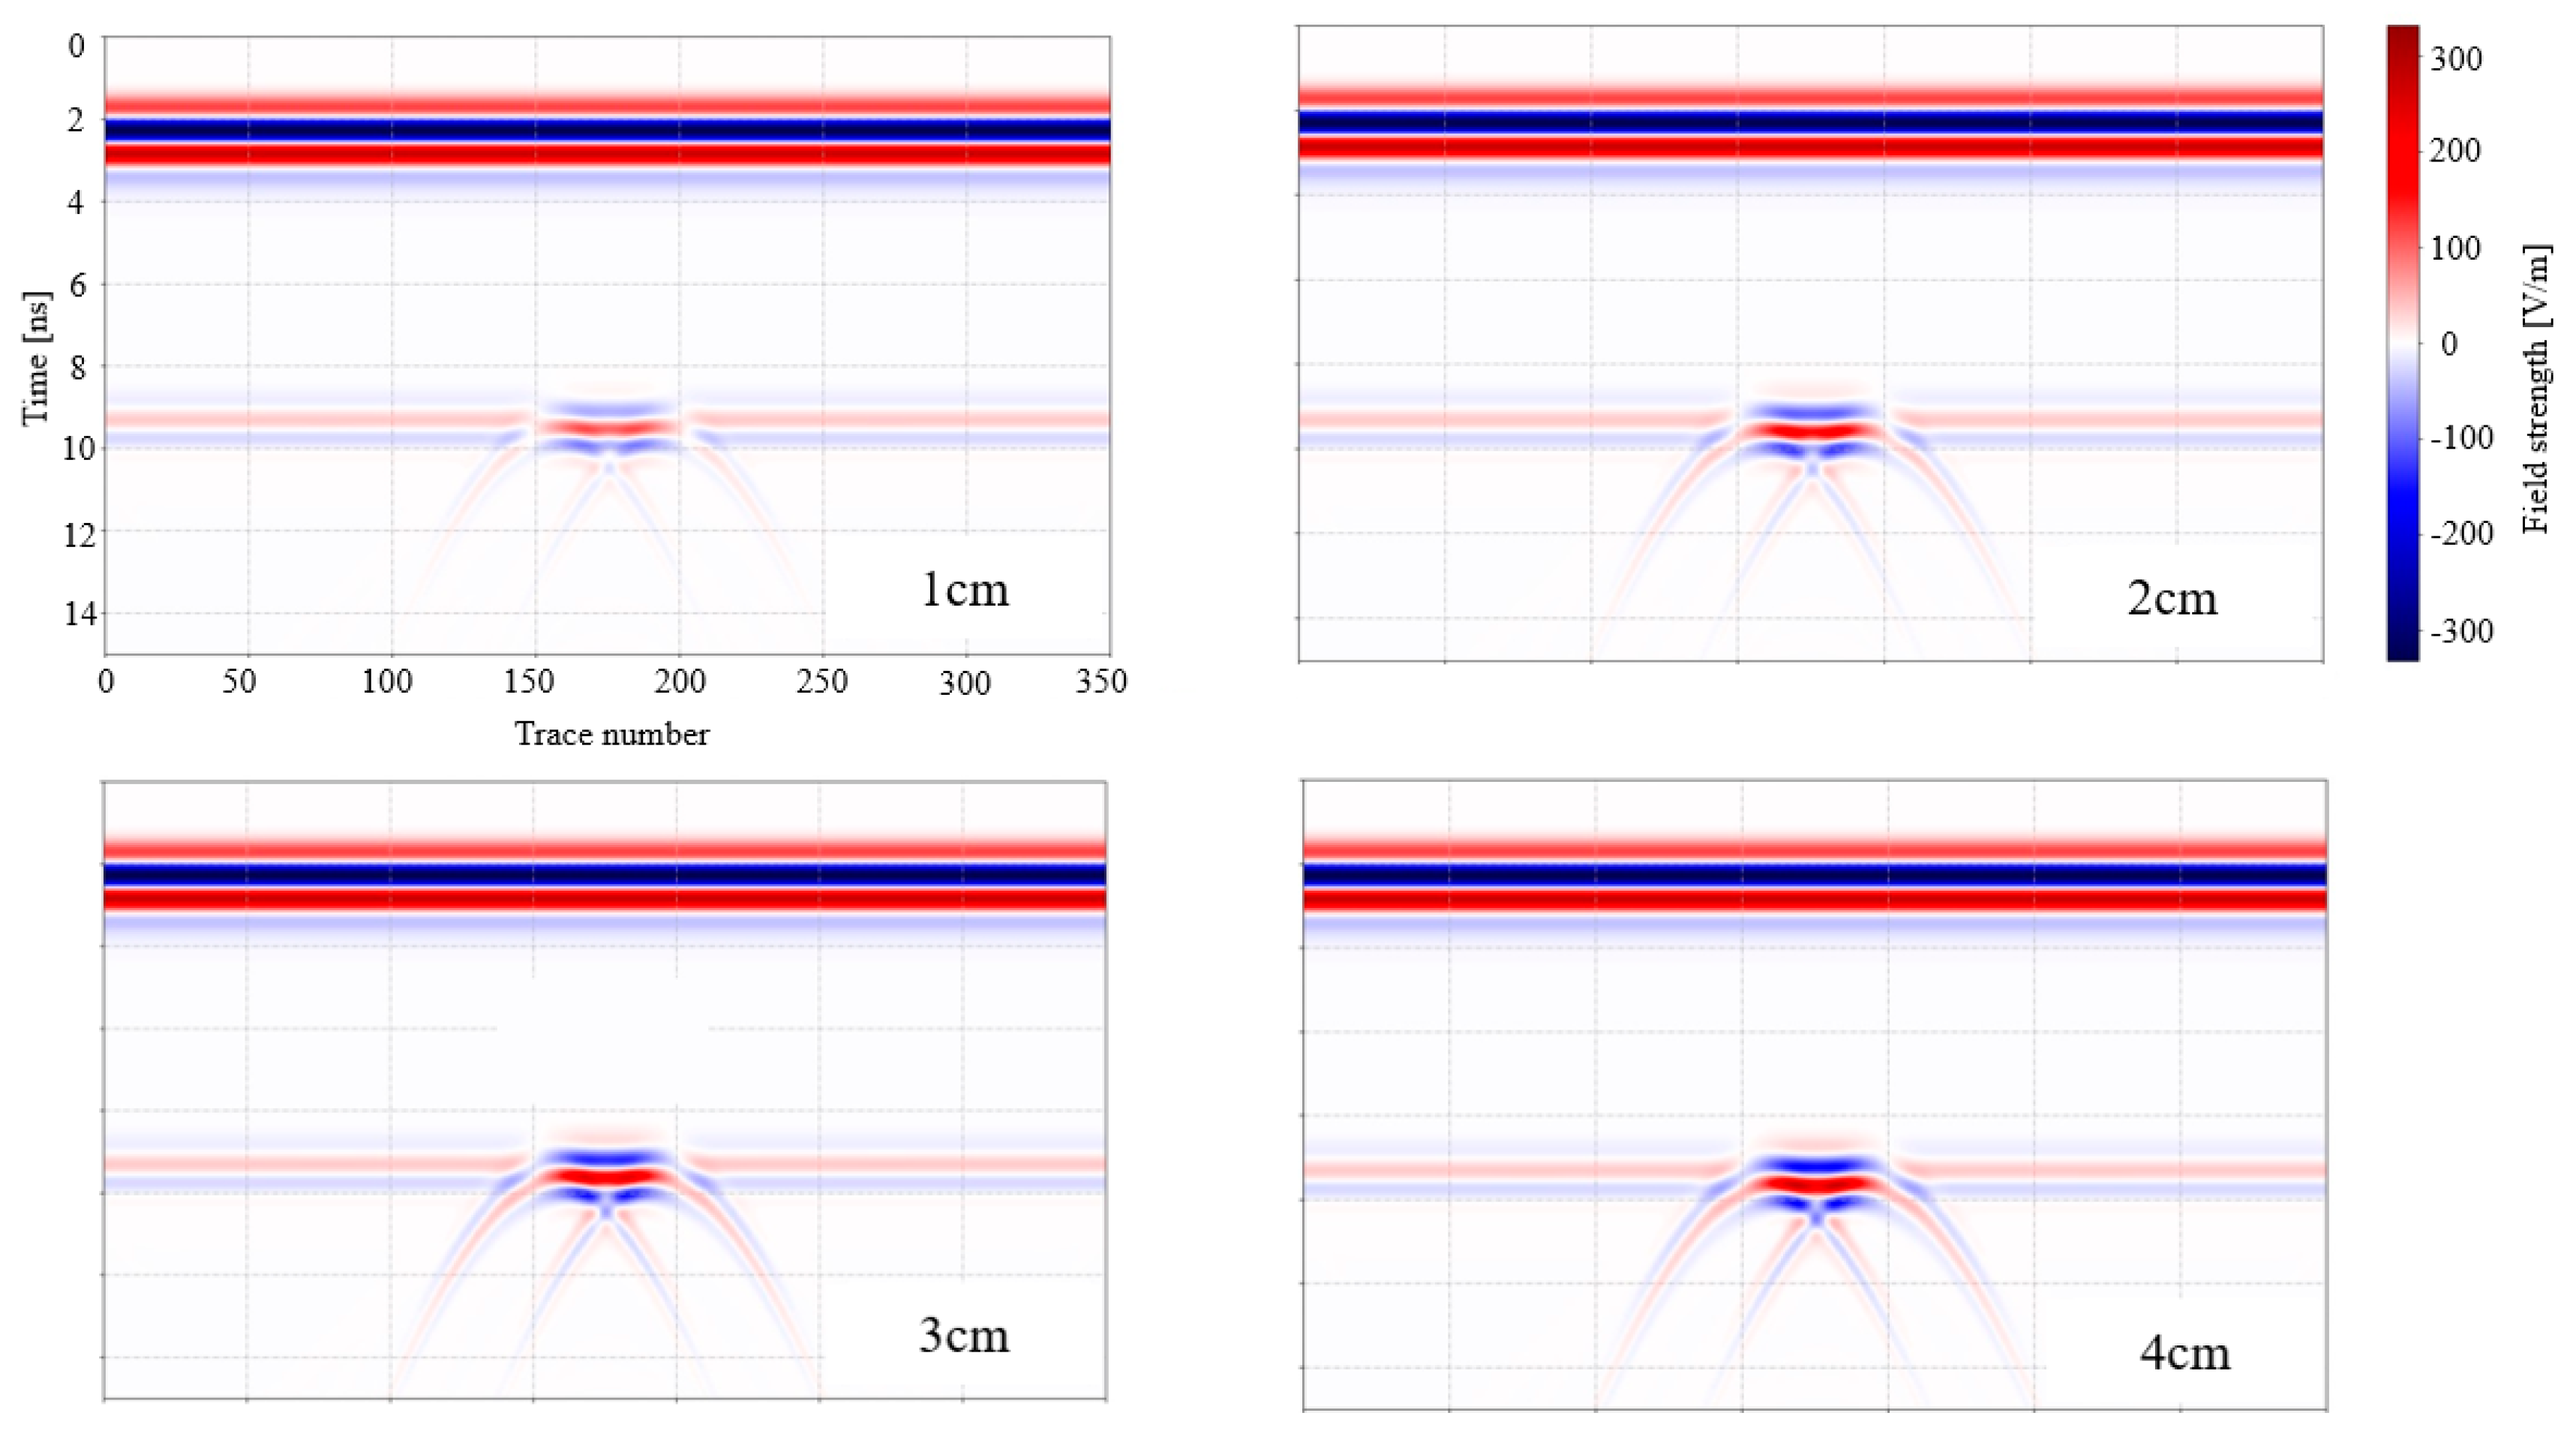
5.2. Analysis of Echo Signal Forms at Different Thicknesses of Voids

Gradient void conditions with thicknesses ranging from 0 to 4 cm at intervals of 0.5 cm were set. The void size, shape, filling material, and other factors remained constant. The simulation results of A-scan and B-scan signals are shown in Figure 9 and Figure 10.
The A-scan signals at various void thicknesses exhibit overall similar phase distribution characteristics and maintain a substantial distinction in signal morphology compared to the complete structure. As the void thickness increases, the amplitude of the reflected signal shows a nonlinear relationship, with the growth rate gradually diminishing, confirmed by the brightness in the B-scan signal. However, the peak intensity’s corresponding time delay remains unchanged. Analyzing the electromagnetic wave propagation mechanism, despite the void location remaining constant, the starting and ending positions of the signal fluctuation at different void thicknesses remain consistent. But with the increase in the longitudinal propagation distance of electromagnetic waves within the void, the proportion of reflected signal intensity from the upper and lower void surfaces relative to the transmitted signal intensifies nonlinearly.
Moreover, the vertical resolution of GPR, referring to the minimum thickness of a structure resolved by the receiving end in the time domain, typically stands at λ/4, with the ultimate limit being λ/8 [26]. For an 800 MHz GPR system with a wavelength (λ) of about 0.375 m, the resolution equates to approximately 10 cm. Therefore, for void thicknesses less than 10 cm, the reflected signal in terms of phase, time delay, and amplitude remains indistinguishable. However, for void thicknesses exceeding 10 cm, as shown in Figure 11, the reflected signals exhibit significant differences in terms of phase, time delay, and amplitude. Actual void thicknesses in voids under airport pavements are typically within 10 cm, smaller than the vertical resolution of GPR. This renders it possible to rely on the amplitude intensity of the A-scan signal and the brightness in the B-scan signal to assess the thickness of the void.

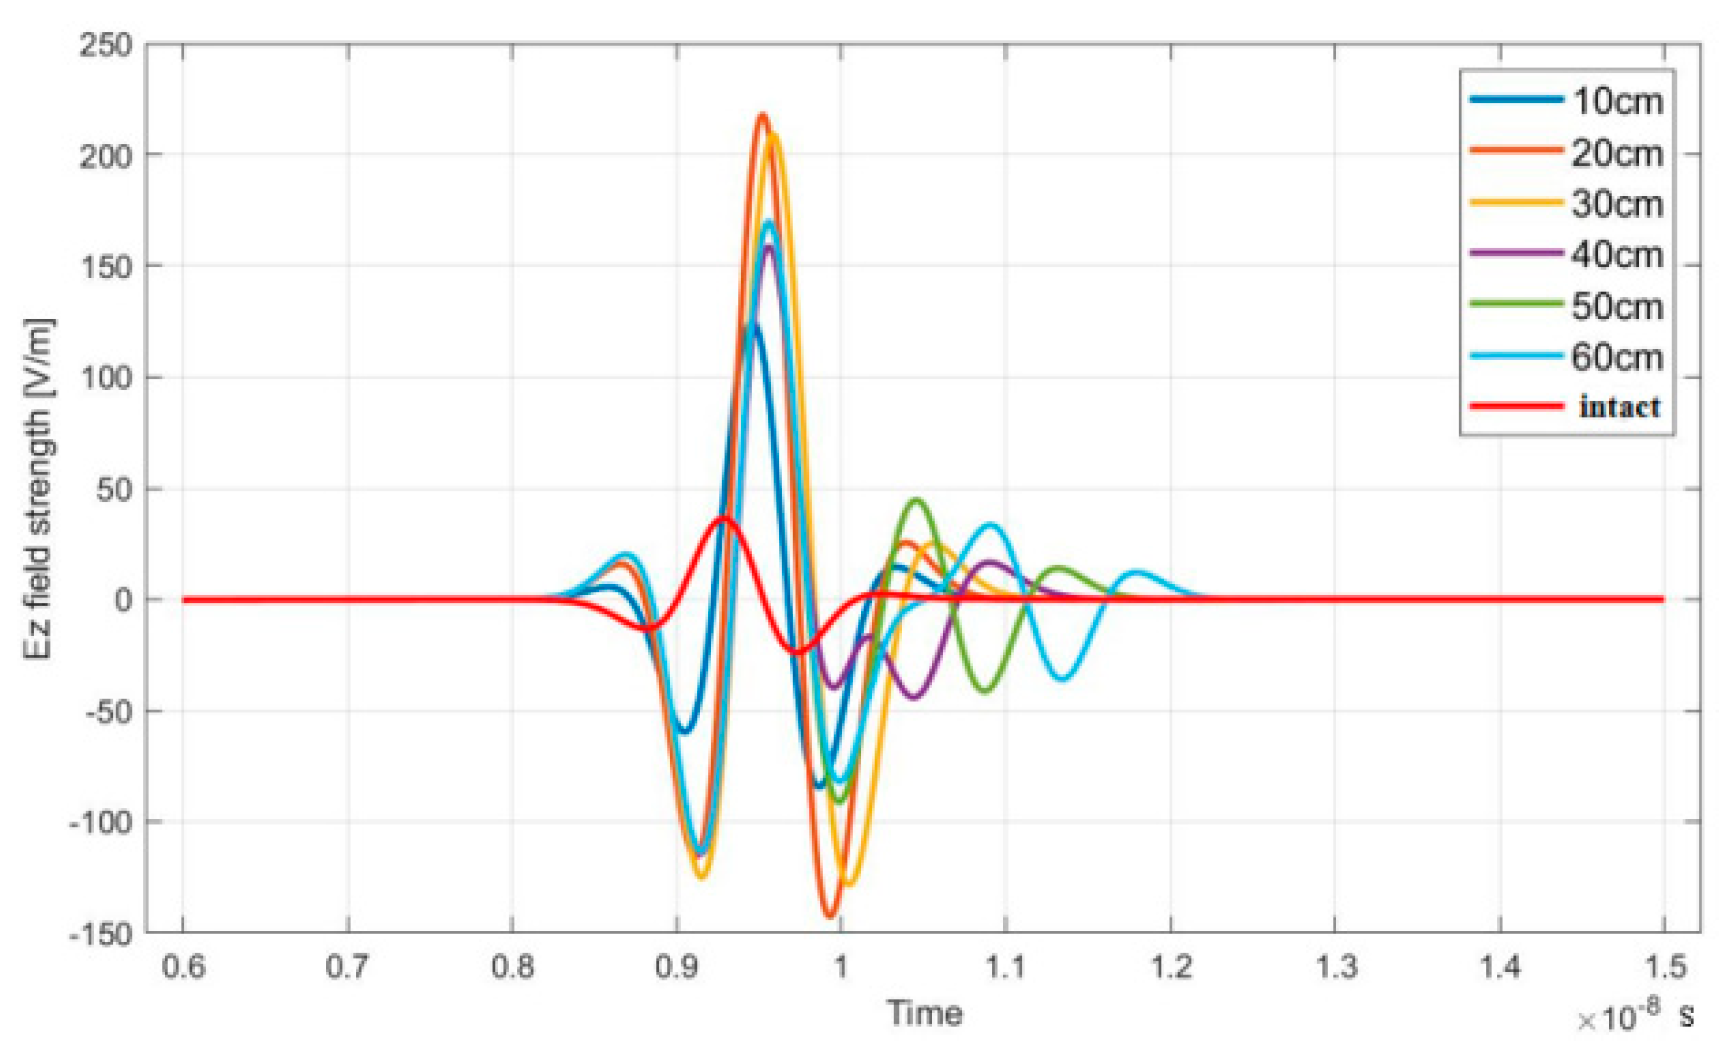
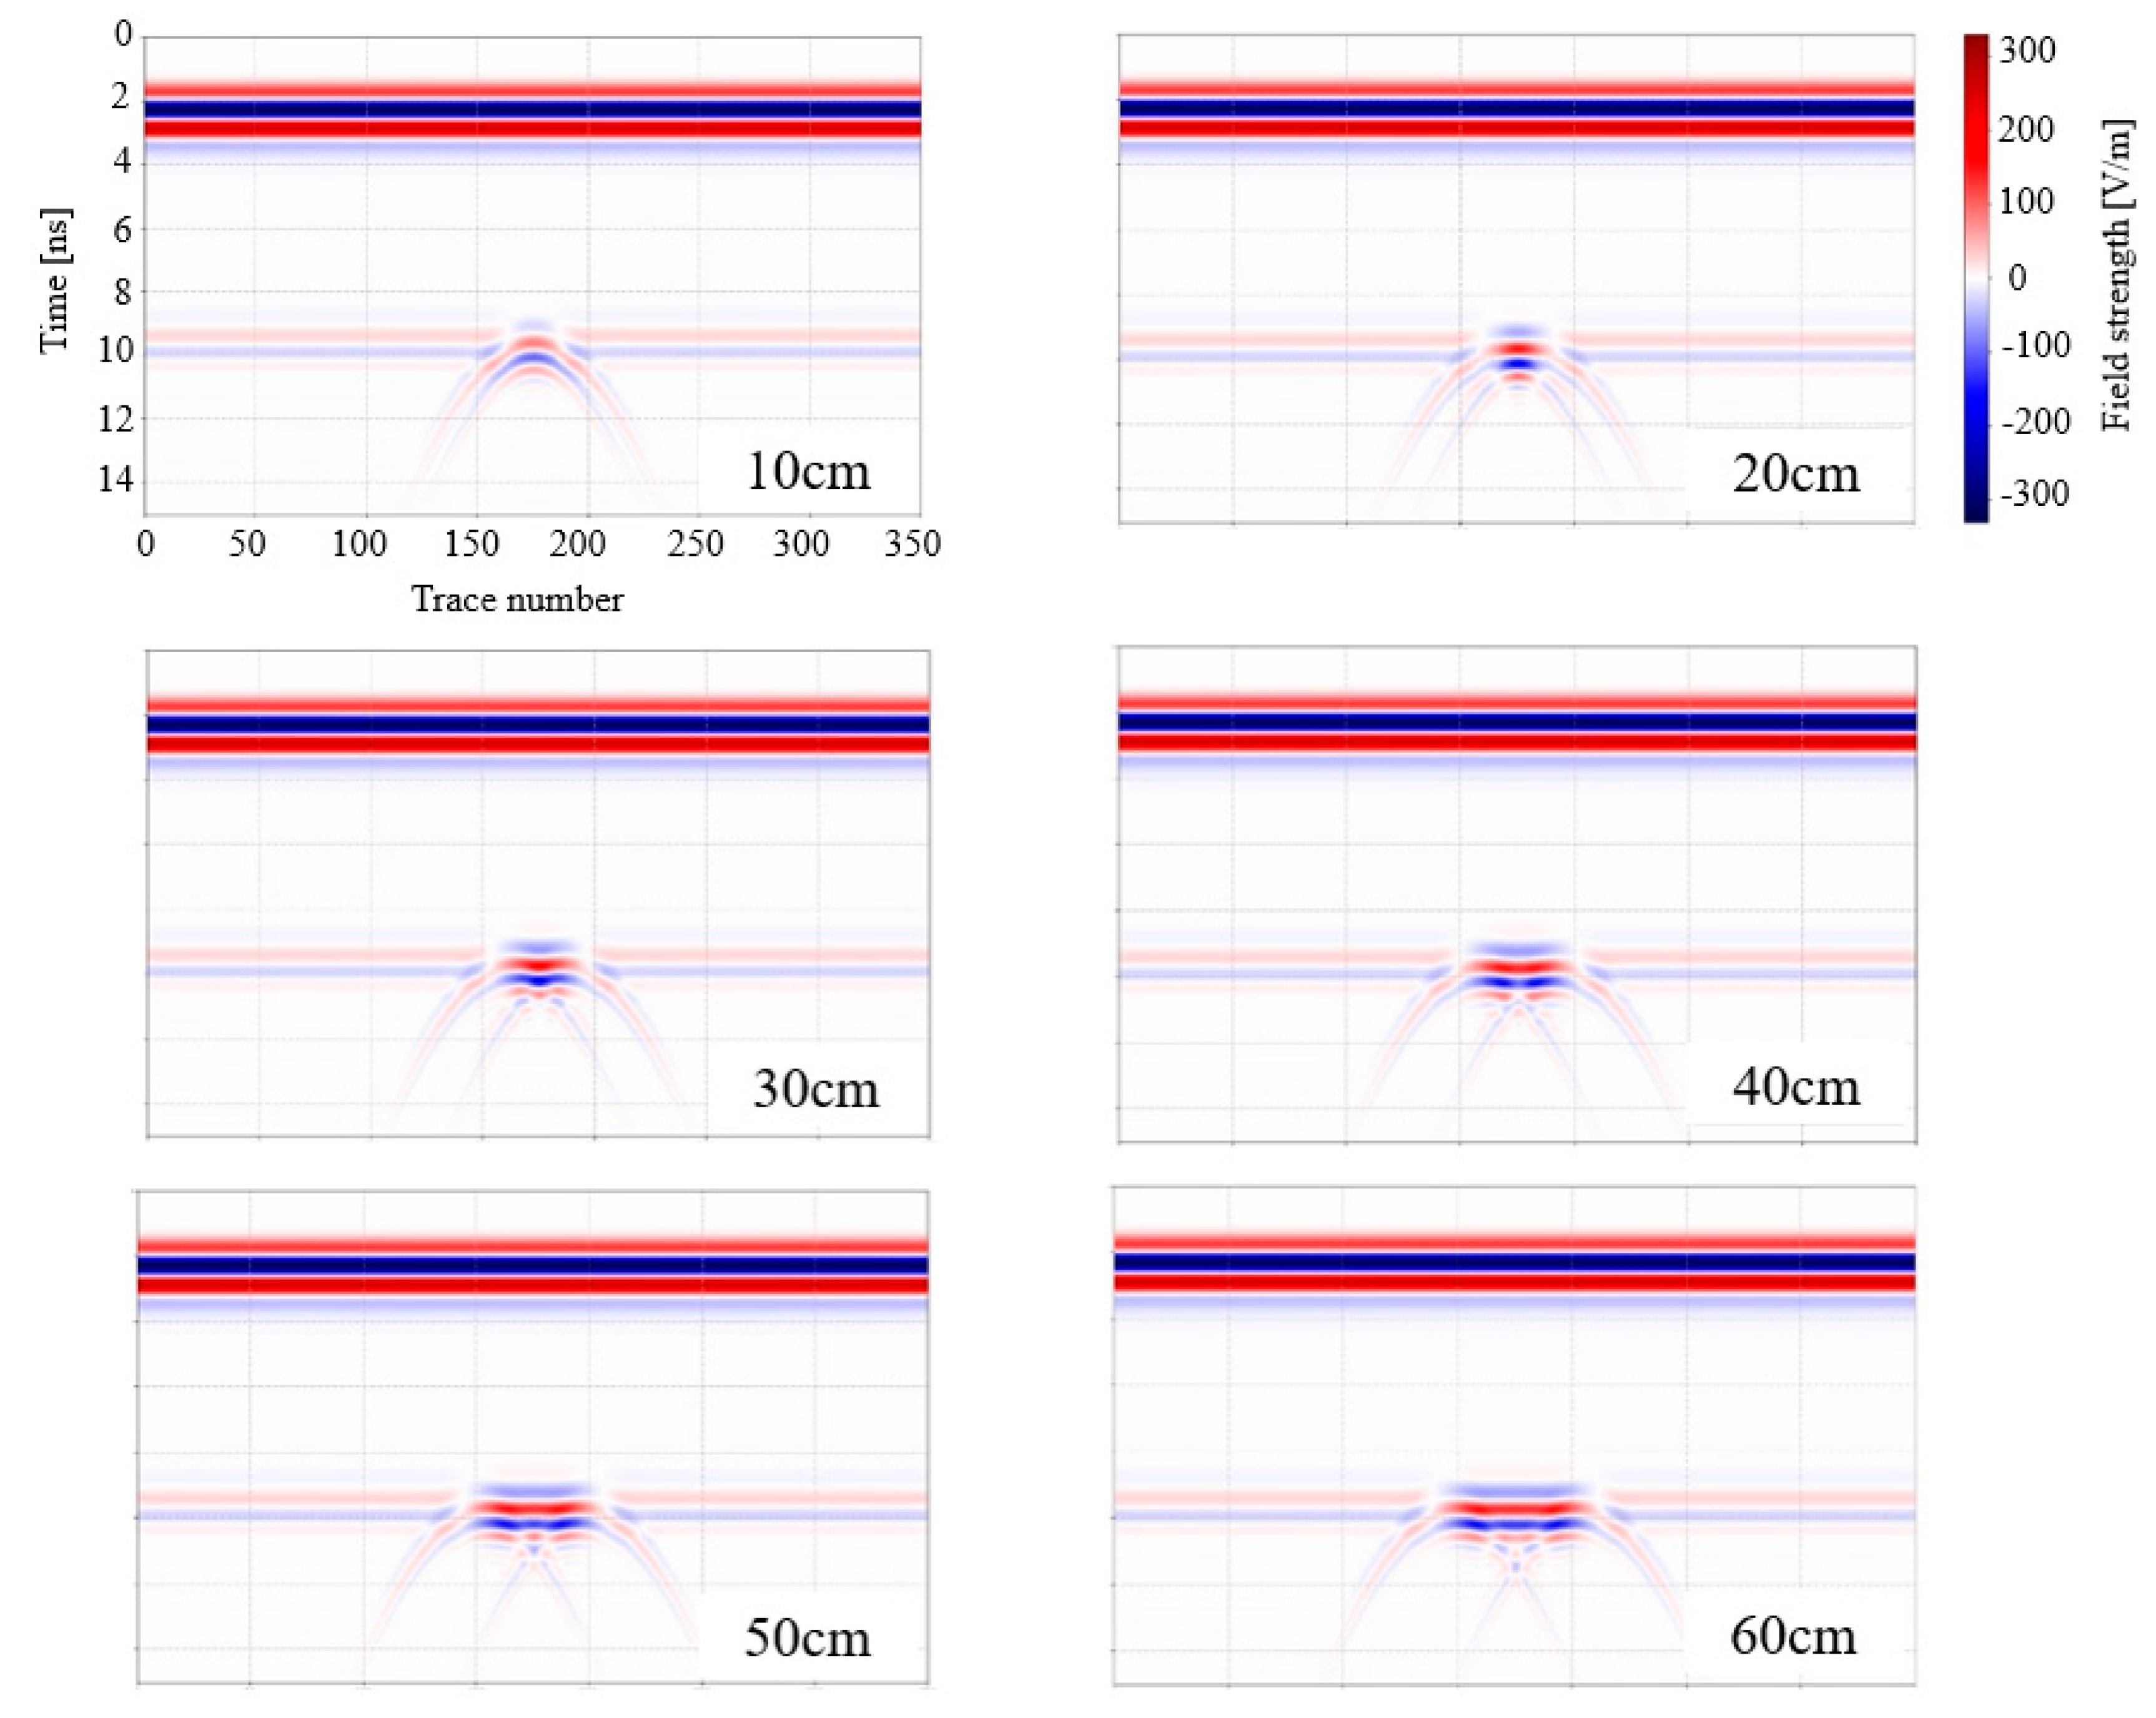
5.3. Analysis of Echo Signal Forms at Different Void Sizes

Gradient void conditions were set at intervals of 10cm, ranging from 10 cm to 60 cm in width. The starting detection position, thickness, shape, filling medium, and other factors remained constant. The simulation results of A-scan and B-scan signals are shown in Figure 12 and Figure 13.
The A-scan signals at different void sizes, while retaining distinctive features distinguishing them from the intact structure, do not exhibit a significant regularity among the reflected signals concerning changes in the void size, showing a jump in amplitude intensity. The detection position of the A-scan signal is directly above the void structure, resulting in a signal spectrum presenting continuous features along the same phase axis within the void area. The influence of void size on the individual echo signal from a single measurement point is not pronounced. Subtle signal differences arise from the distortion of reflections at the edges and corners of the rectangle. As the void size increases, the brightness in the B-scan signal’s highlighted areas markedly widens, showing a mapping relationship between the void size and the width of the highlighted region in the signal spectrum.
However, this relationship is not evident when the void size is less than 20 cm. This is because the horizontal resolution of the 800 MHz GPR is approximately 20 cm. When the void size is smaller than the horizontal resolution, the void area cannot be resolved, resulting in less apparent continuous signal spectrum characteristics. Yong et al. [27] also conducted forward modeling of subgrade void diseases and found that the size of the void greatly affects the accuracy of identification. When the depth-to-diameter ratio is less than 0.08, it is difficult to detect the void. Overall, the shape of the reflected signal is not sensitive to the void width. The signal features do not show a significant correlation with the void width. Therefore, void width estimation can be made solely through the amplitude intensity of the A-scan signal and the width of the highlighted region in the B-scan signal.

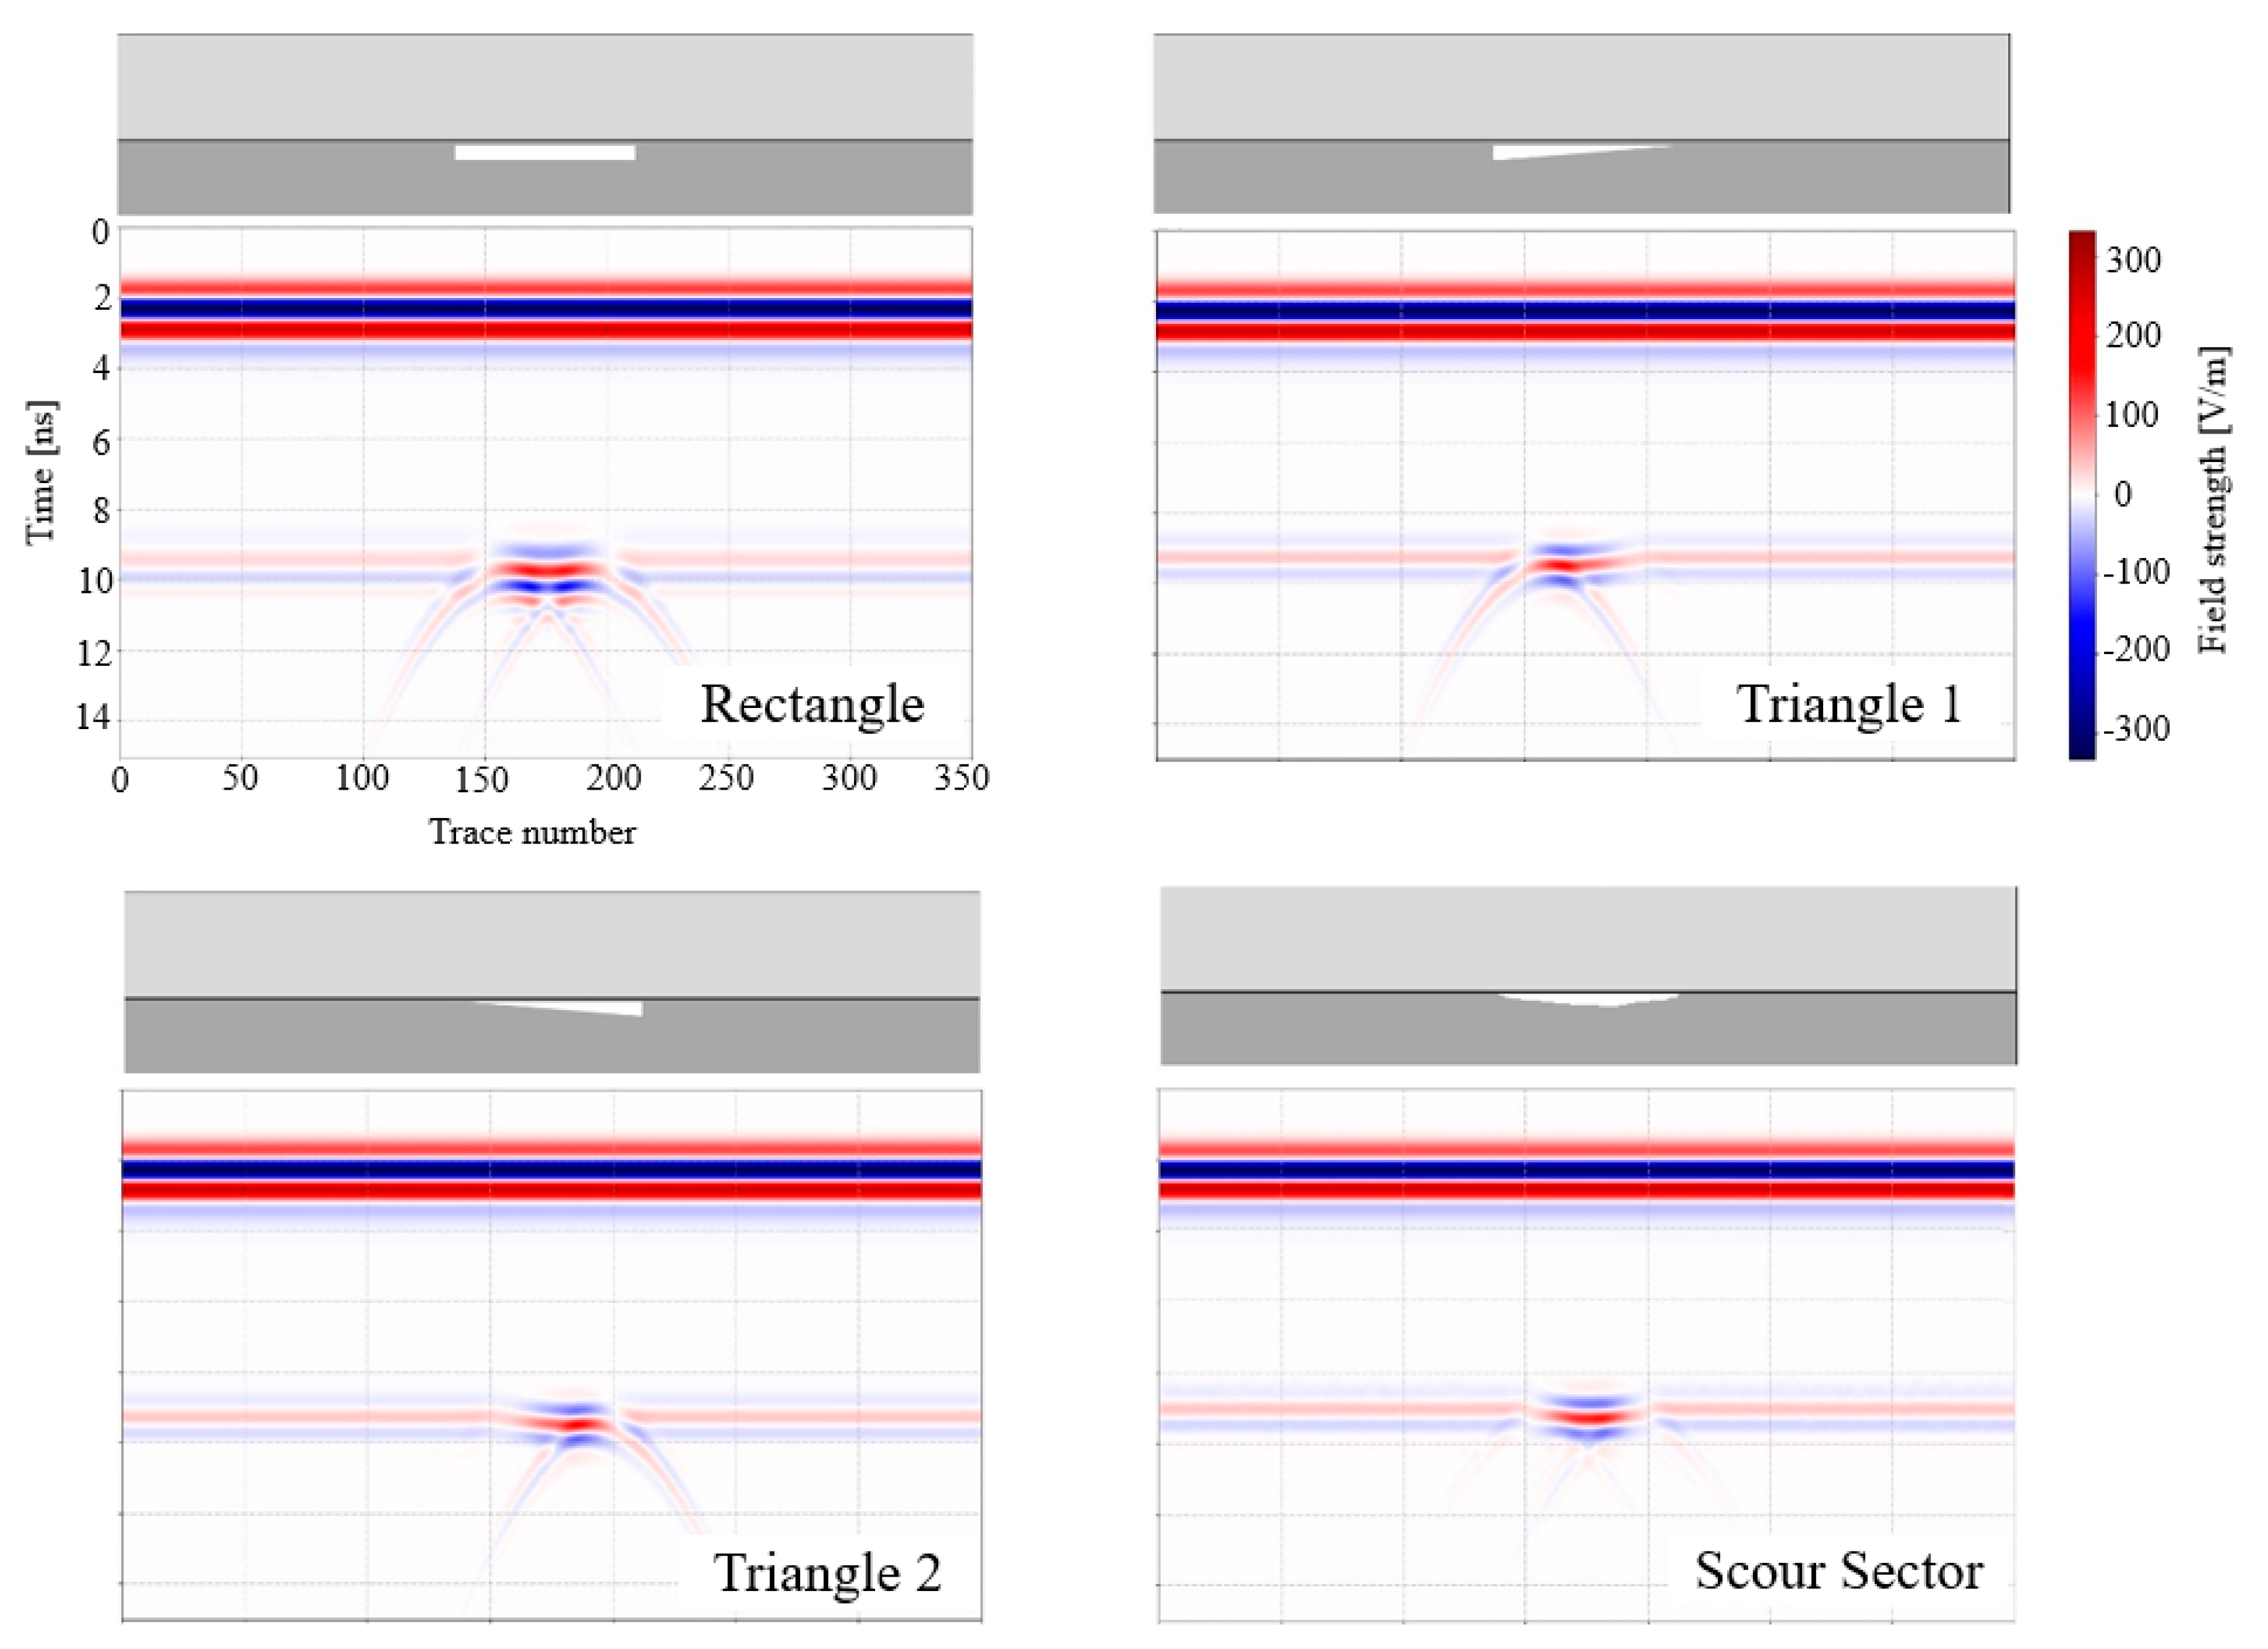
5.4. Analysis of Echo Signal Forms at Different Void Shapes

The voids at the bottom of the pavement panels include a regular rectangular shape, a triangular shape gradually extending from the seam towards the center of the panel, and a mud-spattering-shaped void caused by water erosion between pressure layers. This section constructs corresponding numerical simulation models for these three void shapes while keeping other parameters constant. According to the principles of ground-penetrating radar detection, it is understood that A-scan signals are not sensitive to the void shape, so the focus is primarily on analyzing the morphology of B-scan signals.
As shown in Figure 14, the cross-sectional signal of a triangular void presents a slanted, continuous, same-phase axis feature as the void’s thickness decreases. At the point of maximum thickness for the triangular void, which is the panel’s corner or seam where the void initially develops, the signal morphology is similar to that of a rectangular void. The cross-sectional signal of a spattering-shaped void shows a concave, continuous, same-phase axis feature, reflecting a trend similar to the shape’s thickness settings.
In summary, the influence of different void shapes on GPR echo signals is more evident in the differences in void thickness at different measurement points. Overall, the characteristics of various void shapes, such as color block area highlighting, alternating positive–negative amplitude, and continuous same-phase axis, are similar to the rectangular void shape, while slight differences correspond to the thickness change trends of the void shape.

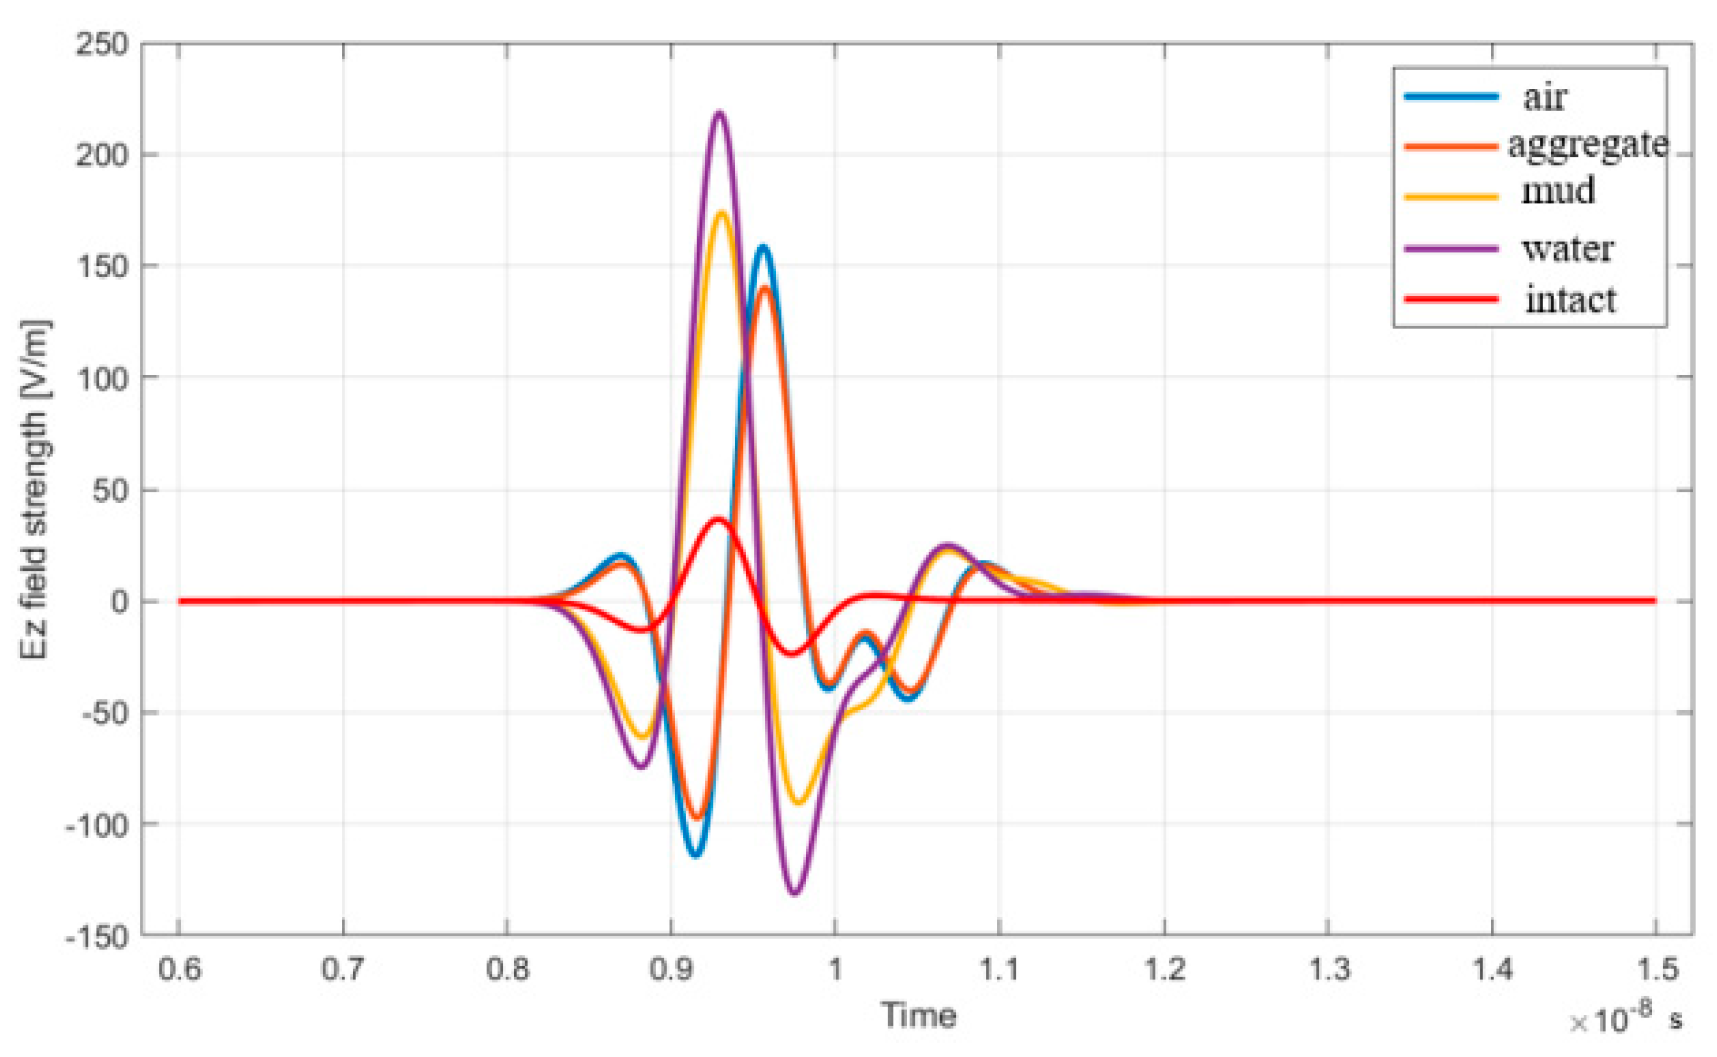
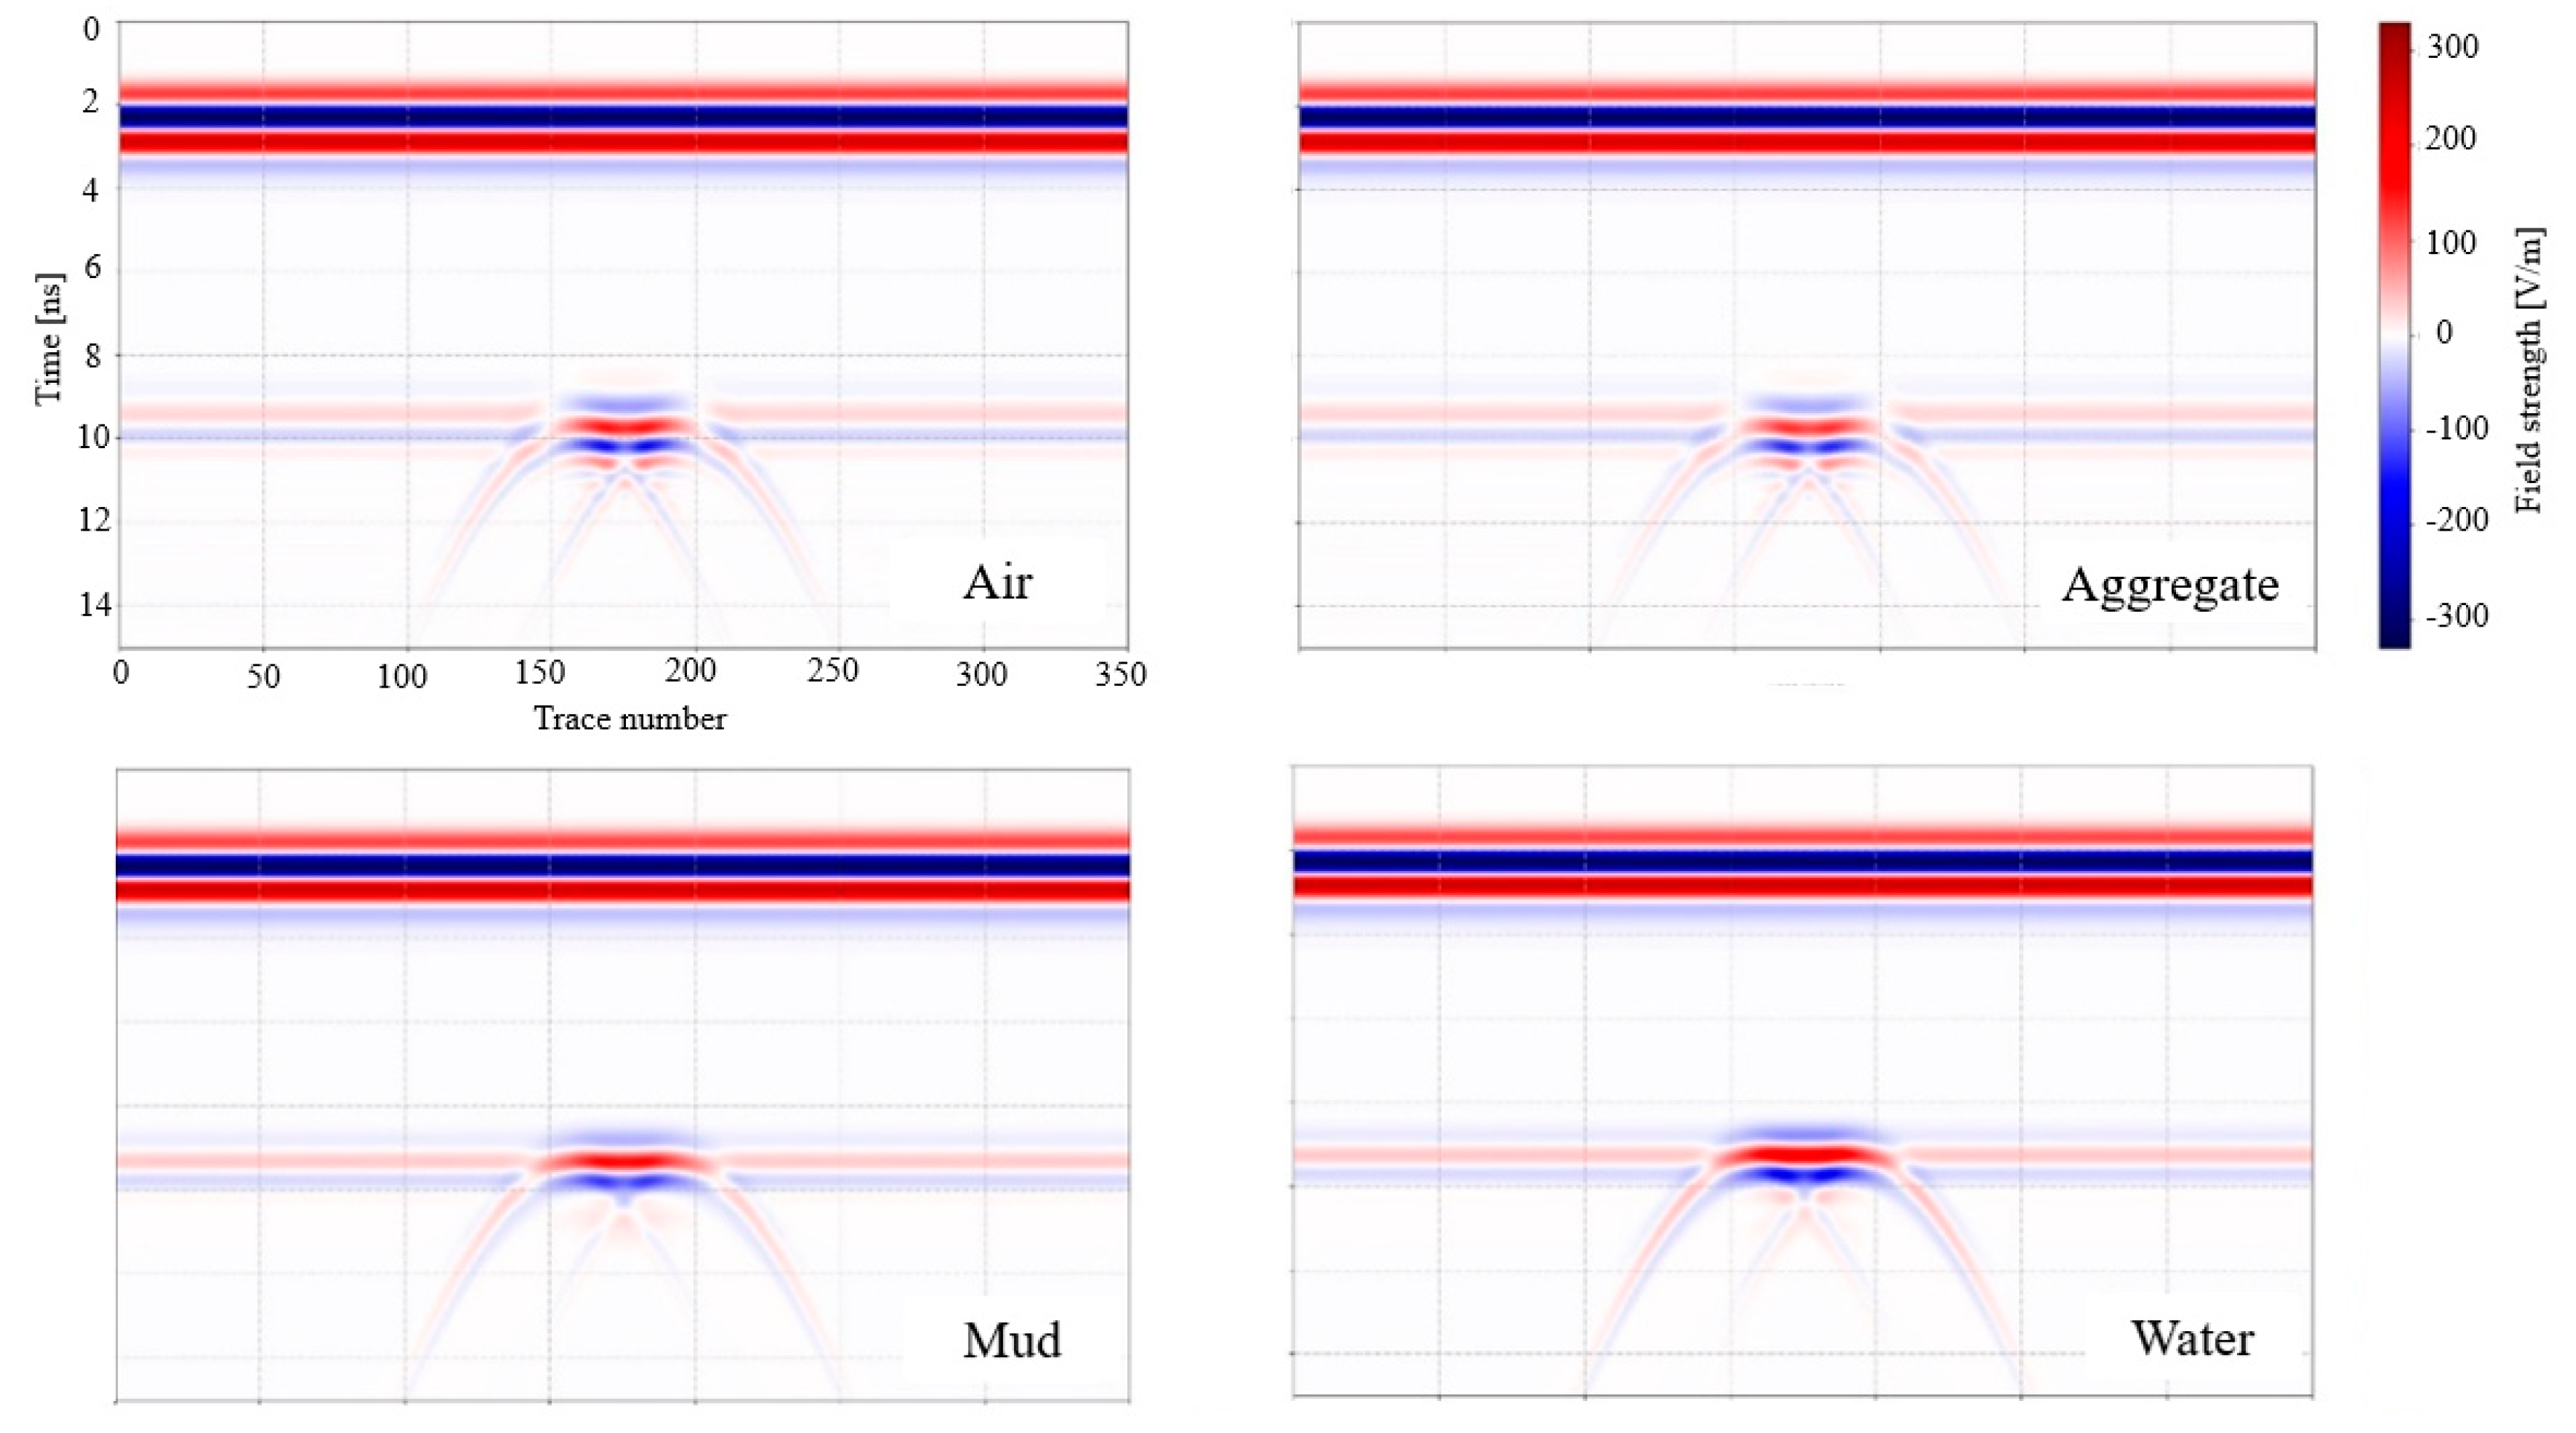
5.5. Analysis of Echo Signal Forms in Different Void-Filling Media

The properties of the void-filling medium in the void space are influenced by factors such as pavement structural strength, aircraft loading frequency, rainfall, temperature, etc. These factors lead to varying dielectric characteristics in different stages of void development, consequently affecting the echo signal morphology of the void structure. Therefore, within the numerical simulation model, four different void-filling media are established to investigate the influence of various void-filling media on the morphology of echo signals. The dielectric characteristics of each medium and the simulated scenarios are presented in Table 4 [28,29].
From Figure 15, it can be seen that the A-scan signal morphology exhibits significantly distinctive features between two sets of signals: one set for air and loose granular material and the other for mud slurry and water. The signal morphologies in both groups show opposing features in terms of phase: the air and loose granular material demonstrate a positive–negative–positive phase, while the mud slurry and water show a negative–positive–negative phase. In terms of amplitude, the peak signal strength at various phases for mud slurry and water is greater than that for air and loose granular material. Regarding time delay, the signal’s peak intensity corresponding to air and loose granular material appears earlier.
Analysis indicates that the reflected echo signal characteristics during GPR detection of underground targets are highly correlated with the dielectric properties of the target structure and the dielectric properties of its surrounding environment. Among the four types of filling media used, the dielectric constant of air and loose granular material is smaller than that of pavement engineering materials, while the dielectric constant of mud slurry and water is significantly larger than that of pavement engineering materials. The relationship between the dielectric constants determines the reflection coefficient at the interface of the medium change when reflection occurs, thereby affecting the phase of the reflected echo signal at the radar receiving end. So, the phase characteristics of the echo signal for air and loose granular material exhibit an opposite trend compared to the phase characteristics for mud slurry and water. The greater the difference in the dielectric constants between the medium and the base material, the stronger the reflection signal [16]. Therefore, the echo signal amplitude of mud and water is higher. Additionally, the difference in the propagation speed of electromagnetic waves in different media causes the time delay differences between the two sets of signal morphologies.
From Figure 16, both sets of medium show echo signal morphologies that retain the continuous rectangular bright blocks along the same phase axis of the void structure. The difference lies in the color order of the void area blocks for air and loose granular material, which is opposite to the color order at the surface–base medium change, whereas the color order of the void area blocks for mud slurry and water is the same as the sequence of pavement structure medium changes.

6. Conclusions

This paper has presented the principles of numerical simulation using the GprMax software and has established a comprehensive numerical simulation modeling process for void conditions in airport cement concrete pavement based on the GprMax software. The accuracy of the numerical simulation model was validated through measured data from actual full-scale void test sites. Subsequently, numerical simulation models were constructed for void conditions with different thicknesses, sizes, shapes, and filling media. The echo signal morphology under the influence of various void structures and composition parameters was analyzed, leading to the following main achievements and conclusions:
(1)
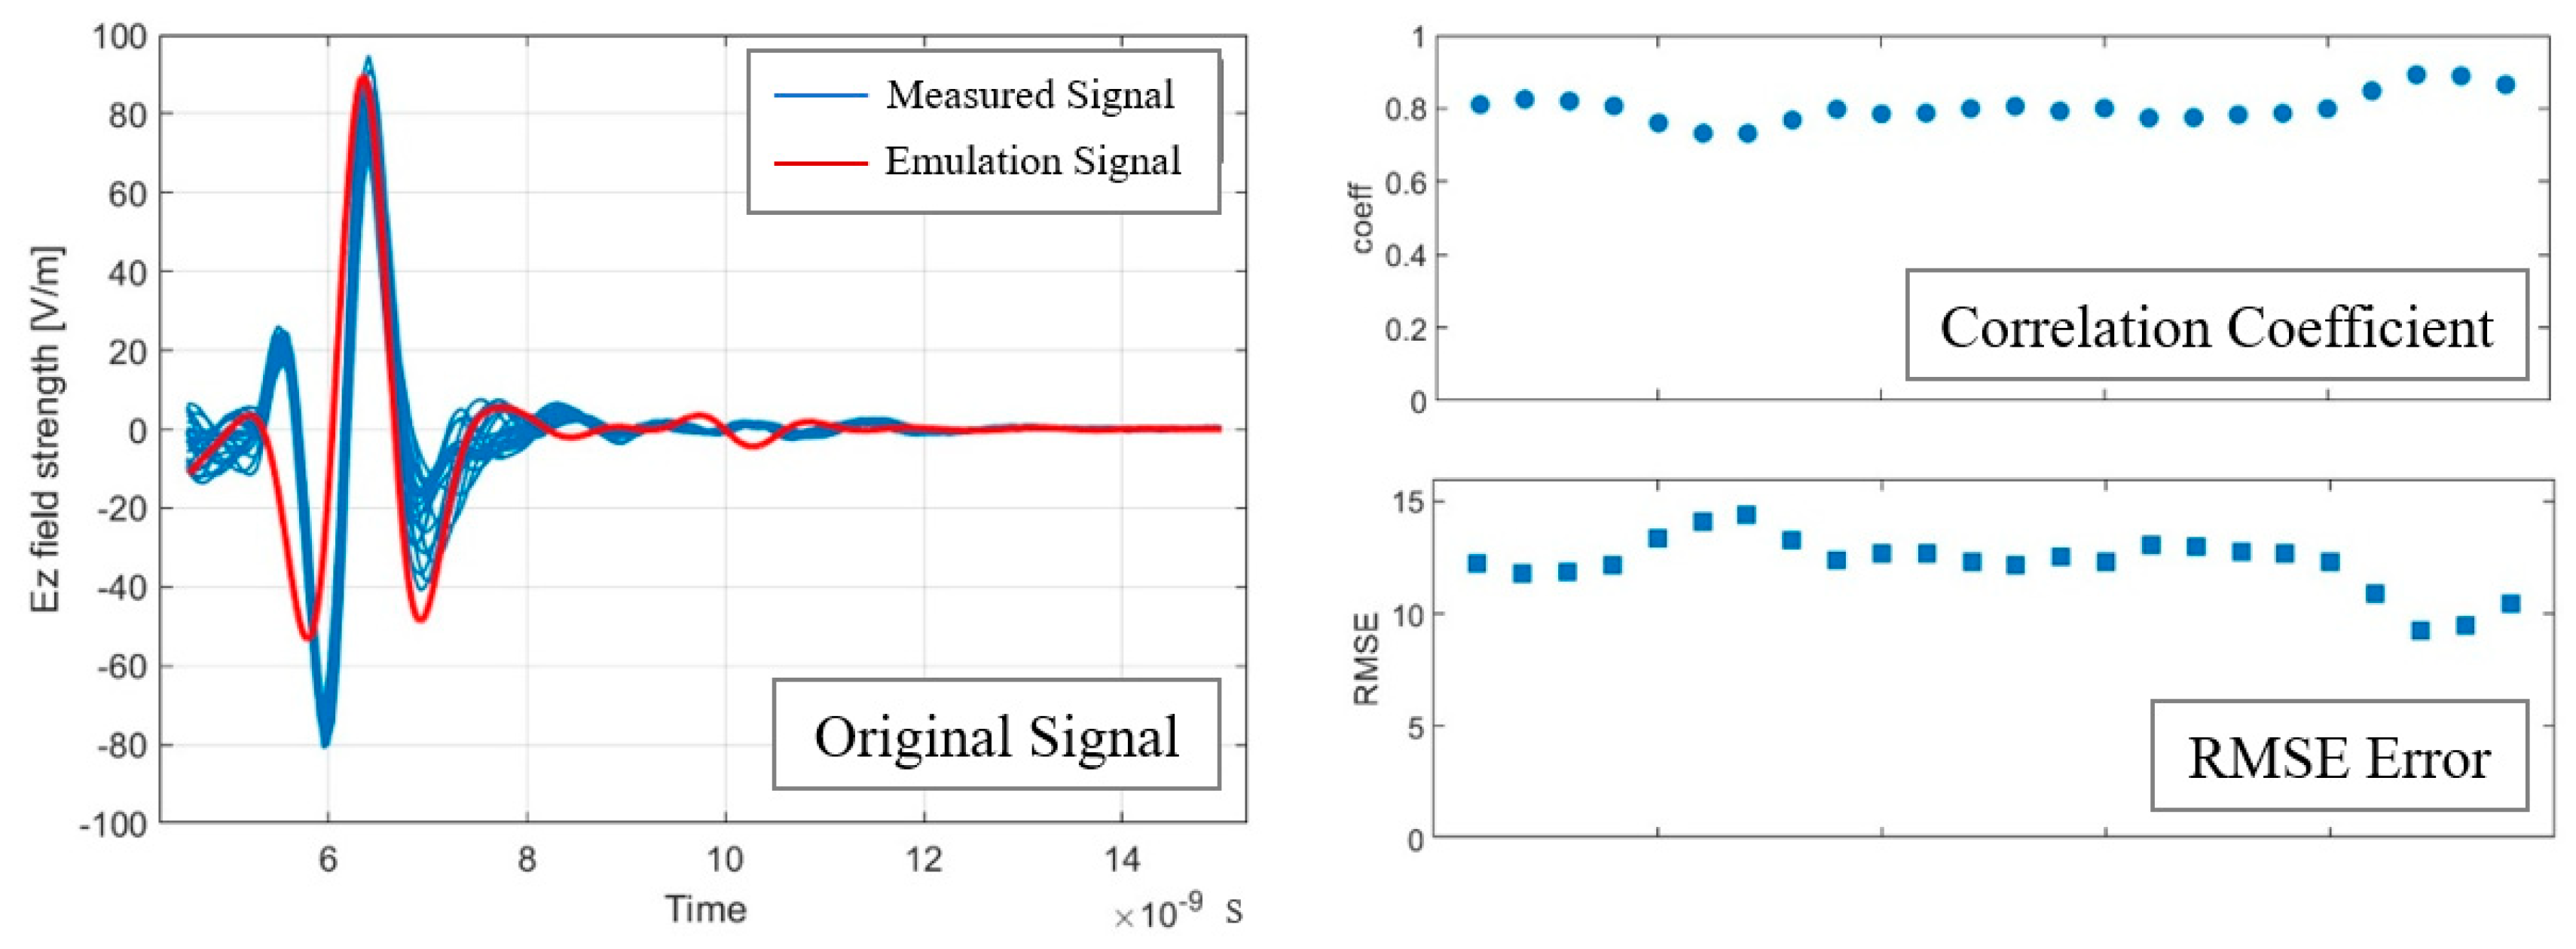
The parameterization process of constructing the numerical simulation model for ground-penetrating radar under void conditions in cement concrete pavement was achieved by writing input files. By comparing ground-penetrating radar test data from the actual full-scale void test site with the numerical simulation model under void conditions, differences between the simulated signals and the measured signal samples were analyzed. The results showed outstanding performance of the numerical simulation model in signal morphology and root mean square error, and the correlation coefficient is above 0.8, verifying the accuracy and reasonableness of the numerical simulation model;
(2)
The analysis explored the impact of various void structures and composition parameters on the echo signal morphology. Clear distinctions were observed between echo signals from intact and void structures. Different void thicknesses and sizes showed minimal differences in signal phase and time delay, with only the amplitude intensity of the A-scan signal and the brightness of the B-scan signal representing the morphologies of different void thicknesses and sizes, but with limited capability to characterize void sizes;
(3)
The signal morphologies and cross-sectional maps for the different void shapes were generally consistent, primarily manifesting differences in void thickness at various measurement points. Mud slurry and water, compared to air and loose granular material, exhibited opposing phase characteristics and significant differences in amplitude and time delay due to their different dielectric properties.
This study has revealed the influence patterns of void structure and composition parameters on simulated model echo signals, providing a theoretical basis for the practical analysis of ground-penetrating radar echo signal morphology.

7. Research Limitations

(1)
Although the amplitude and brightness of the signals can distinguish between different void thicknesses and sizes, the ability to precisely characterize specific dimensions is limited.
(2)
Different void shapes, despite having similar echo signal forms, may obscure the potential impacts of subtle shape differences on the signals.

8. Future Prospects

(1)
Research and develop more advanced signal processing algorithms or models to improve the accuracy of recognizing void sizes and shapes;
(2)
Expand the simulation model to include the composite effects of multiple media to further study the impact of different media combinations on GPR signals.

Author Contributions

Conceptualization, J.Y.; Formal Analysis, B.W.; Investigation, F.L., H.D. and J.L.; Methodology, J.Y., H.J., B.W. and W.L.; Resources, J.Y.; Software, F.L.; Validation, F.L. and W.L.; Visualization, H.J.; Writing—Original Draft, H.J.; Writing—Review and Editing, J.Y., B.W. and F.L. All authors have read and agreed to the published version of the manuscript.

Funding

This research was supported by the Project of the Civil Aviation Administration of China [grant name: the Precise Identification of Concrete Pavement Void and Preventive Maintenance with Targeted Grouting Technology 2023–2024].

Data Availability Statement

Data not available due to privacy or ethical restrictions.

Conflicts of Interest

Author Biao Wu was employed by the China Airport Planning & Design Institute Co., Ltd.; Author Wenhao Li was employed by the Ctrip Computer Technology (Shanghai) Co., Ltd.; Author Hao Du was employed by the China Shanghai Tongke Transportation Technology Co., Ltd. The remaining authors declare that the research was conducted in the absence of any commercial or financial relationships that could be construed as a potential conflict of interest.

References

  1. Lu, H.; Zhao, C.; Yuan, J.; Yin, W.; Wang, Y.; Xiao, R. Study on the Properties and Benefits of a Composite Separator Layer in Airport Cement Concrete Pavement. Buildings 2022, 12, 2190. [Google Scholar] [CrossRef]
  2. Zhang, Y.; Bao, F.; Tong, Z.; Ma, T.; Zhang, W.G.; Fan, J.W.; Huang, X.M. Radar Response of Heterogeneous Airport Cement Pavement Panel Void. J. Southeast Univ. (Nat. Sci. Ed.) 2023, 53, 137–148. [Google Scholar]
  3. Tan, Y.; Ling, J.; Yuan, J.; Xu, Z.J. Influence of Voids on Stress in Airport Cement Concrete Pavement. J. Tongji Univ. (Nat. Sci. Ed.) 2010, 38, 552–556+568. [Google Scholar]
  4. Khudoyarov, S.; Kim, N.; Lee, J.J. Three-dimensional convolutional neural network–based underground object classification using three-dimensional ground penetrating radar data. Struct. Health Monit. 2020, 19, 1884–1893. [Google Scholar] [CrossRef]
  5. Liu, X.; Dong, X.; Leskovar, D.I. Ground penetrating radar for underground sensing in agriculture: A review. Int. Agrophys. 2016, 30, 533–543. [Google Scholar] [CrossRef]
  6. Yu, Q.; Li, Y.; Luo, T.; Zhang, J.; Tao, L.; Zhu, X.; Zhang, Y.; Luo, L.; Xu, X. Cement pavement void detection algorithm based on GPR signal and continuous wavelet transform method. Sci. Rep. 2023, 13, 19710. [Google Scholar] [CrossRef]
  7. Xiao, X.Z.; Li, Q.S. Study of method for identify void beneath cement concrete pavement slabs: A case study of meiguan expressway. J. Highw. Transp. Res. Dev. 2016, 33, 39–45. [Google Scholar]
  8. Spears, M.; Hedjazi, S.; Taheri, H. An Evaluation of ASTM Standards for Implementation of Ground Penetrating Radar for Pavement and Bridge Deck Evaluations. J. Test. Eval. 2024, 52, 1234–1247. [Google Scholar] [CrossRef]
  9. Li, C.; Li, X. Ground Penetrating Radar Image Inversion Based on Improved Attention Mechanism. J. Radio Sci. 2023, 38, 825–834. [Google Scholar]
  10. Qiu, Z.; Zeng, J.; Tang, W.; Yang, H.; Lu, J.; Zhao, Z. Research on Real-Time Automatic Picking of Ground-Penetrating Radar Image Features by Using Machine Learning. Horticulturae 2022, 8, 1116. [Google Scholar] [CrossRef]
  11. Jiang, H. Research on Detection of Underground Cavity Targets by Ground Penetrating Radar. Master’s Thesis, Institute of Technology, Harbin, China, 2017. [Google Scholar]
  12. Kang, M.S.; Kim, N.; Lee, J.J.; An, Y.K. Deep learning-based automated underground cavity detection using three-dimensional ground penetrating radar. Struct. Health Monit. 2020, 19, 173–185. [Google Scholar] [CrossRef]
  13. Bao, Y.W.; Gao, R.X.; Guo, D.; Bai, S.S.; Xin, X.J. Forward Modelling and Detection of GPR in Urban Road Base Disease. Chem. Eng. Trans. 2015, 46, 445–450. [Google Scholar]
  14. He, B.; Zhang, H. Frequency Dispersion Suppression and Absorbing Boundary Improvement in Geological Radar Forward Modeling. Geol. Explor. 2000, 59–63. [Google Scholar]
  15. Feng, D.; Dai, Q.; Weng, J. Application of Time Domain Multiresolution Method in Three-Dimensional Ground Penetrating Radar Forward Simulation. J. Cent. South Univ. (Sci. Technol.) 2007, 975–980. [Google Scholar]
  16. Shu, Z. Research on Detection and Inversion of Tunnel Lining Cavity by Ground Penetrating Radar. Ph.D. Thesis, Chongqing University, Chongqing, China, 2011. [Google Scholar]
  17. Zhang, J.W.; Liu, B.F.; Li, X.; Zhu, Q.B.; Ren, Y.Q. Fine Detection Method of Underground Pipeline Based on GPRMax2D. Geophys. Geochem. Explor. 2019, 43, 435–440. [Google Scholar]
  18. Chen, H. Image Recognition of Underground Cavity Targets by Ground Penetrating Radar Based on Machine Learning. Master’s Thesis, Institute of Technology, Harbin, China, 2020. [Google Scholar]
  19. Liu, Z.; Yeoh, J.K.; Gu, X.; Dong, Q.; Chen, Y.; Wu, W.; Wang, L.; Wang, D. Automatic pixel-level detection of vertical cracks in asphalt pavement based on GPR investigation and improved mask R-CNN. Autom. Constr. 2023, 146, 104689. [Google Scholar] [CrossRef]
  20. Faize, A.; Lahalal, F.; Atounti, M. Study and simulation of soil salinity evolution by Reflexw and GprMax. Ann. Univ. Craiova-Math. Comput. Sci. Ser. 2019, 46, 426–432. [Google Scholar]
  21. Wang, Z.L. On the expanded Maxwell’s equations for moving charged media system–General theory, mathematical solutions and applications in TENG. Mater. Today 2022, 52, 348–363. [Google Scholar] [CrossRef]
  22. Gao, H.; Wen, M. Dynamic Characteristics of Semi-Saturated Viscoelastic Soil-Tunnel Lining System. Eng. Mech. 2013, 30, 90–96. [Google Scholar]
  23. Liao, H.; Xu, Z.; Zeng, X.J.; Merigó, J.M. Qualitative decision making with correlation coefficients of hesitant fuzzy linguistic term sets. Knowl.-Based Syst. 2015, 76, 127–138. [Google Scholar] [CrossRef]
  24. Karunasingha, D.S.K. Root mean square error or mean absolute error? Use their ratio as well. Inf. Sci. 2022, 585, 609–629. [Google Scholar] [CrossRef]
  25. Zeng, B.; Liu, S.; Yang, J.; Feng, D.S.; Yuan, Z.M.; Liu, J.; Wang, X. Influence of Surface Undulation on Underground Pipeline GPR Detection. Geophys. Geochem. Explor. 2023, 47, 1064–1070. [Google Scholar]
  26. Liu, H.; Shi, Z.; Li, J.; Liu, C.; Meng, X.; Du, Y.; Chen, J. Detection of road cavities in urban cities by 3D ground-penetrating radar. Geophysics 2021, 86, WA25–WA33. [Google Scholar] [CrossRef]
  27. Xie, Y.Y.; Liao, H.J.; Zan, Y.W. Two-dimensional forward simulation of railway subgrade disease detection by ground penetrating radar. J. Zhejiang Univ. (Eng. Technol.) 2010, 44, 1907–1911. [Google Scholar]
  28. Schlaich, A.; Knapp, E.W.; Netz, R.R. Water dielectric effects in planar confinement. Phys. Rev. Lett. 2016, 117, 048001. [Google Scholar] [CrossRef]
  29. Lu, D.; Huo, Y.; Jiang, Z.; Zhong, J. Carbon nanotube polymer nanocomposites coated aggregate enabled highly conductive concrete for structural health monitoring. Carbon 2023, 206, 340–350. [Google Scholar] [CrossRef]
Figure 1. Schematic diagram of Yee tuple in FDTD.
Buildings 14 01956 g001
Figure 2. Simulation model building process of GprMax.
Buildings 14 01956 g002
Figure 3. Example of two-dimensional airport cement pavement simulation model and simulation results.
Buildings 14 01956 g003
Figure 4. Schematic composition of pavement structure.
Buildings 14 01956 g004
Figure 5. Results of radar signal verification of void disease 1.
Buildings 14 01956 g005
Figure 6. Results of radar signal verification of void disease 2.
Buildings 14 01956 g006
Figure 7. A-scan signal morphology of void structure and intact structure.
Buildings 14 01956 g007
Figure 8. B-scan signal morphology of void structure and intact structure.
Buildings 14 01956 g008
Figure 9. A-scan signal morphology at different void thicknesses.
Buildings 14 01956 g009
Figure 10. B-scan signal morphology at different void thicknesses.
Buildings 14 01956 g010
Figure 11. A-scan signal morphology at extreme void thickness.
Buildings 14 01956 g011
Figure 12. A-scan signal morphology at different void sizes.
Buildings 14 01956 g012
Figure 13. B-scan signal morphology at different void sizes.
Buildings 14 01956 g013
Figure 14. B-scan signal morphology under different void shapes.
Buildings 14 01956 g014
Figure 15. A-scan signal morphology of different void-filling media.
Buildings 14 01956 g015
Figure 16. B-scan signal morphology of different void-filling media.
Buildings 14 01956 g016
Table 1. Numerical simulation model’s structural parameters for cement concrete pavement.
LayerMaterialThicknessRelative Dielectric ConstantElectrical Conductivity
Air LayerAir20 cm10
SurfaceCement Concrete40 cm80.005
BaseCement-Stabilized Crushed Stone30 cm120.05
Table 2. GPR signal parameters in the numerical simulation model.
Parameter TypeModel Signal Parameters
Excitation SourceRicker Signal
Center Frequency800 MHz
Tx-Rx Antenna Spacing10 cm
Time Window15 ns
Step Size1 cm
Table 3. Spatial parameters in the numerical simulation model.
Parameter TypeModel Signal Parameters
Spatial Range4 m ∗ 0.9 m
Boundary ConditionPML
Spatial Step0.002 m
Table 4. Dielectric properties of different void-filling media and simulated scenarios.
Filling MediumRelative PermittivityElectrical ConductivitySimulation Scene
Air10Complete void condition
Loose fine20.01Inter-layer non-compaction, degradation of panel bottom support
Mud slurry402Seepage and mud flushing after joint damage
Water815Rainy conditions with water pooling between layers
Disclaimer/Publisher’s Note: The statements, opinions and data contained in all publications are solely those of the individual author(s) and contributor(s) and not of MDPI and/or the editor(s). MDPI and/or the editor(s) disclaim responsibility for any injury to people or property resulting from any ideas, methods, instructions or products referred to in the content.

