
The Effect of Slope on Smoke Characteristics of Natural Ventilation Tunnel with Shafts

Abstract
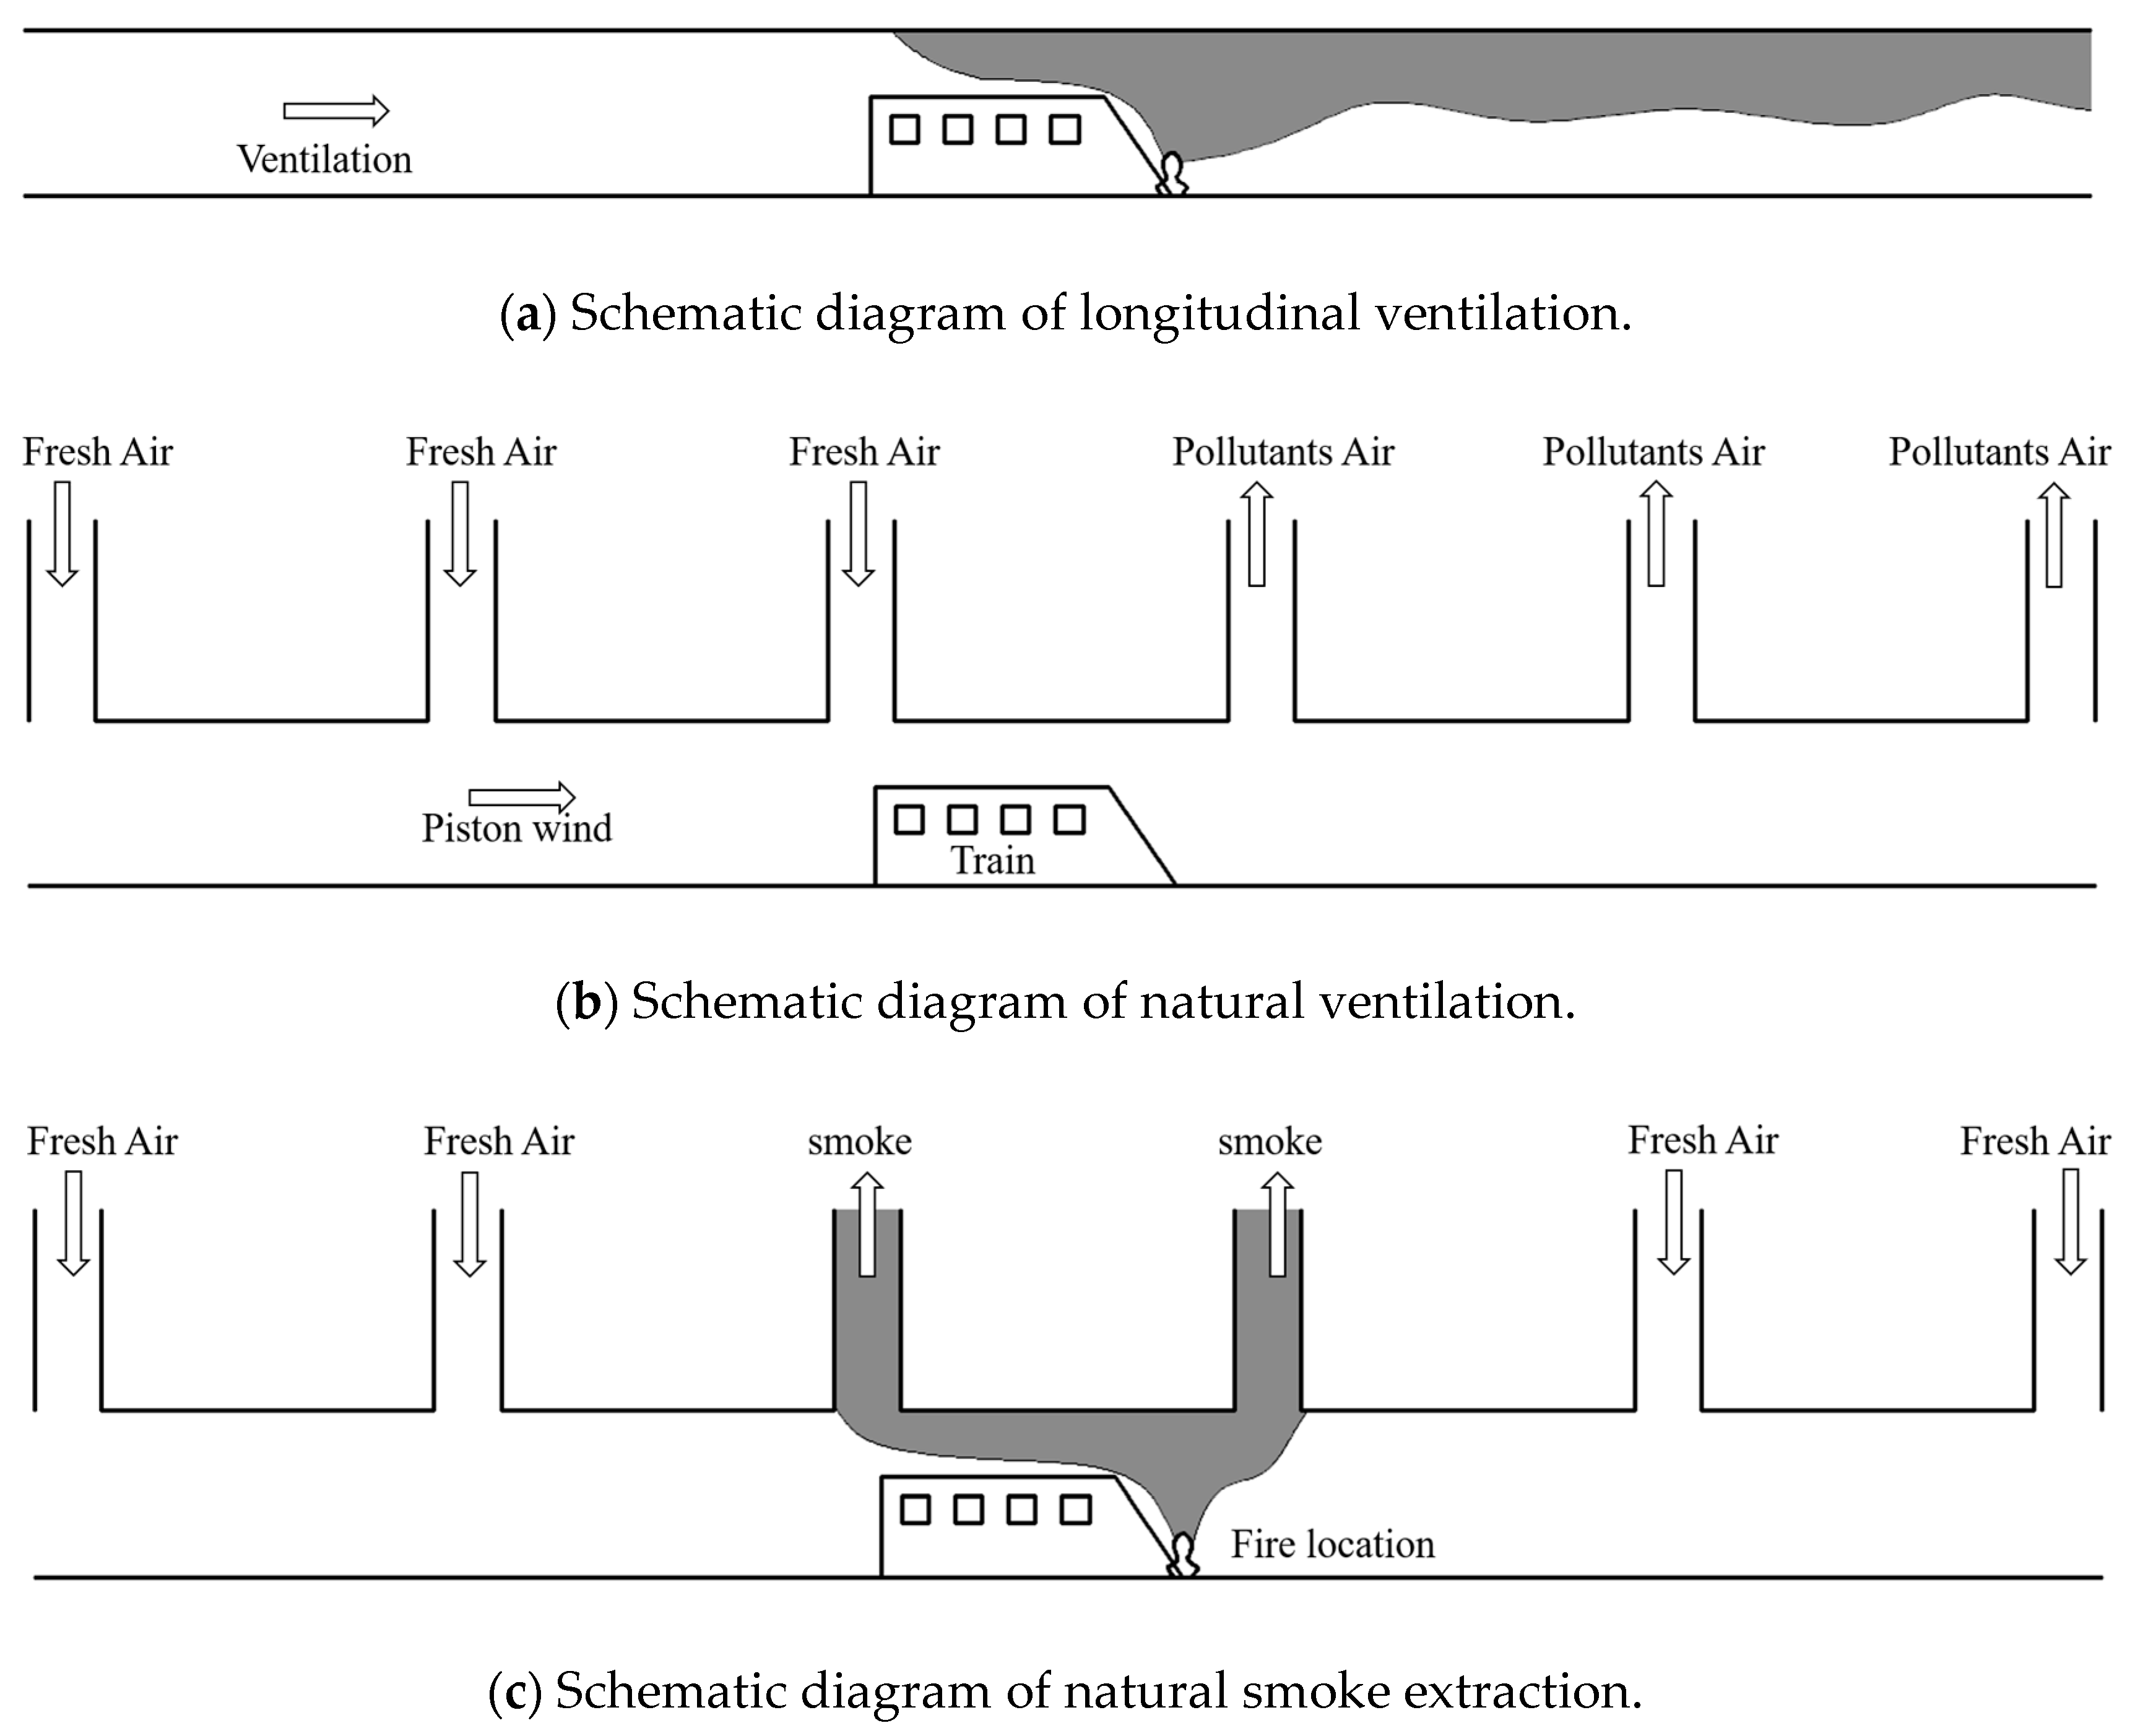
1. Introduction
2. Experimental Settings
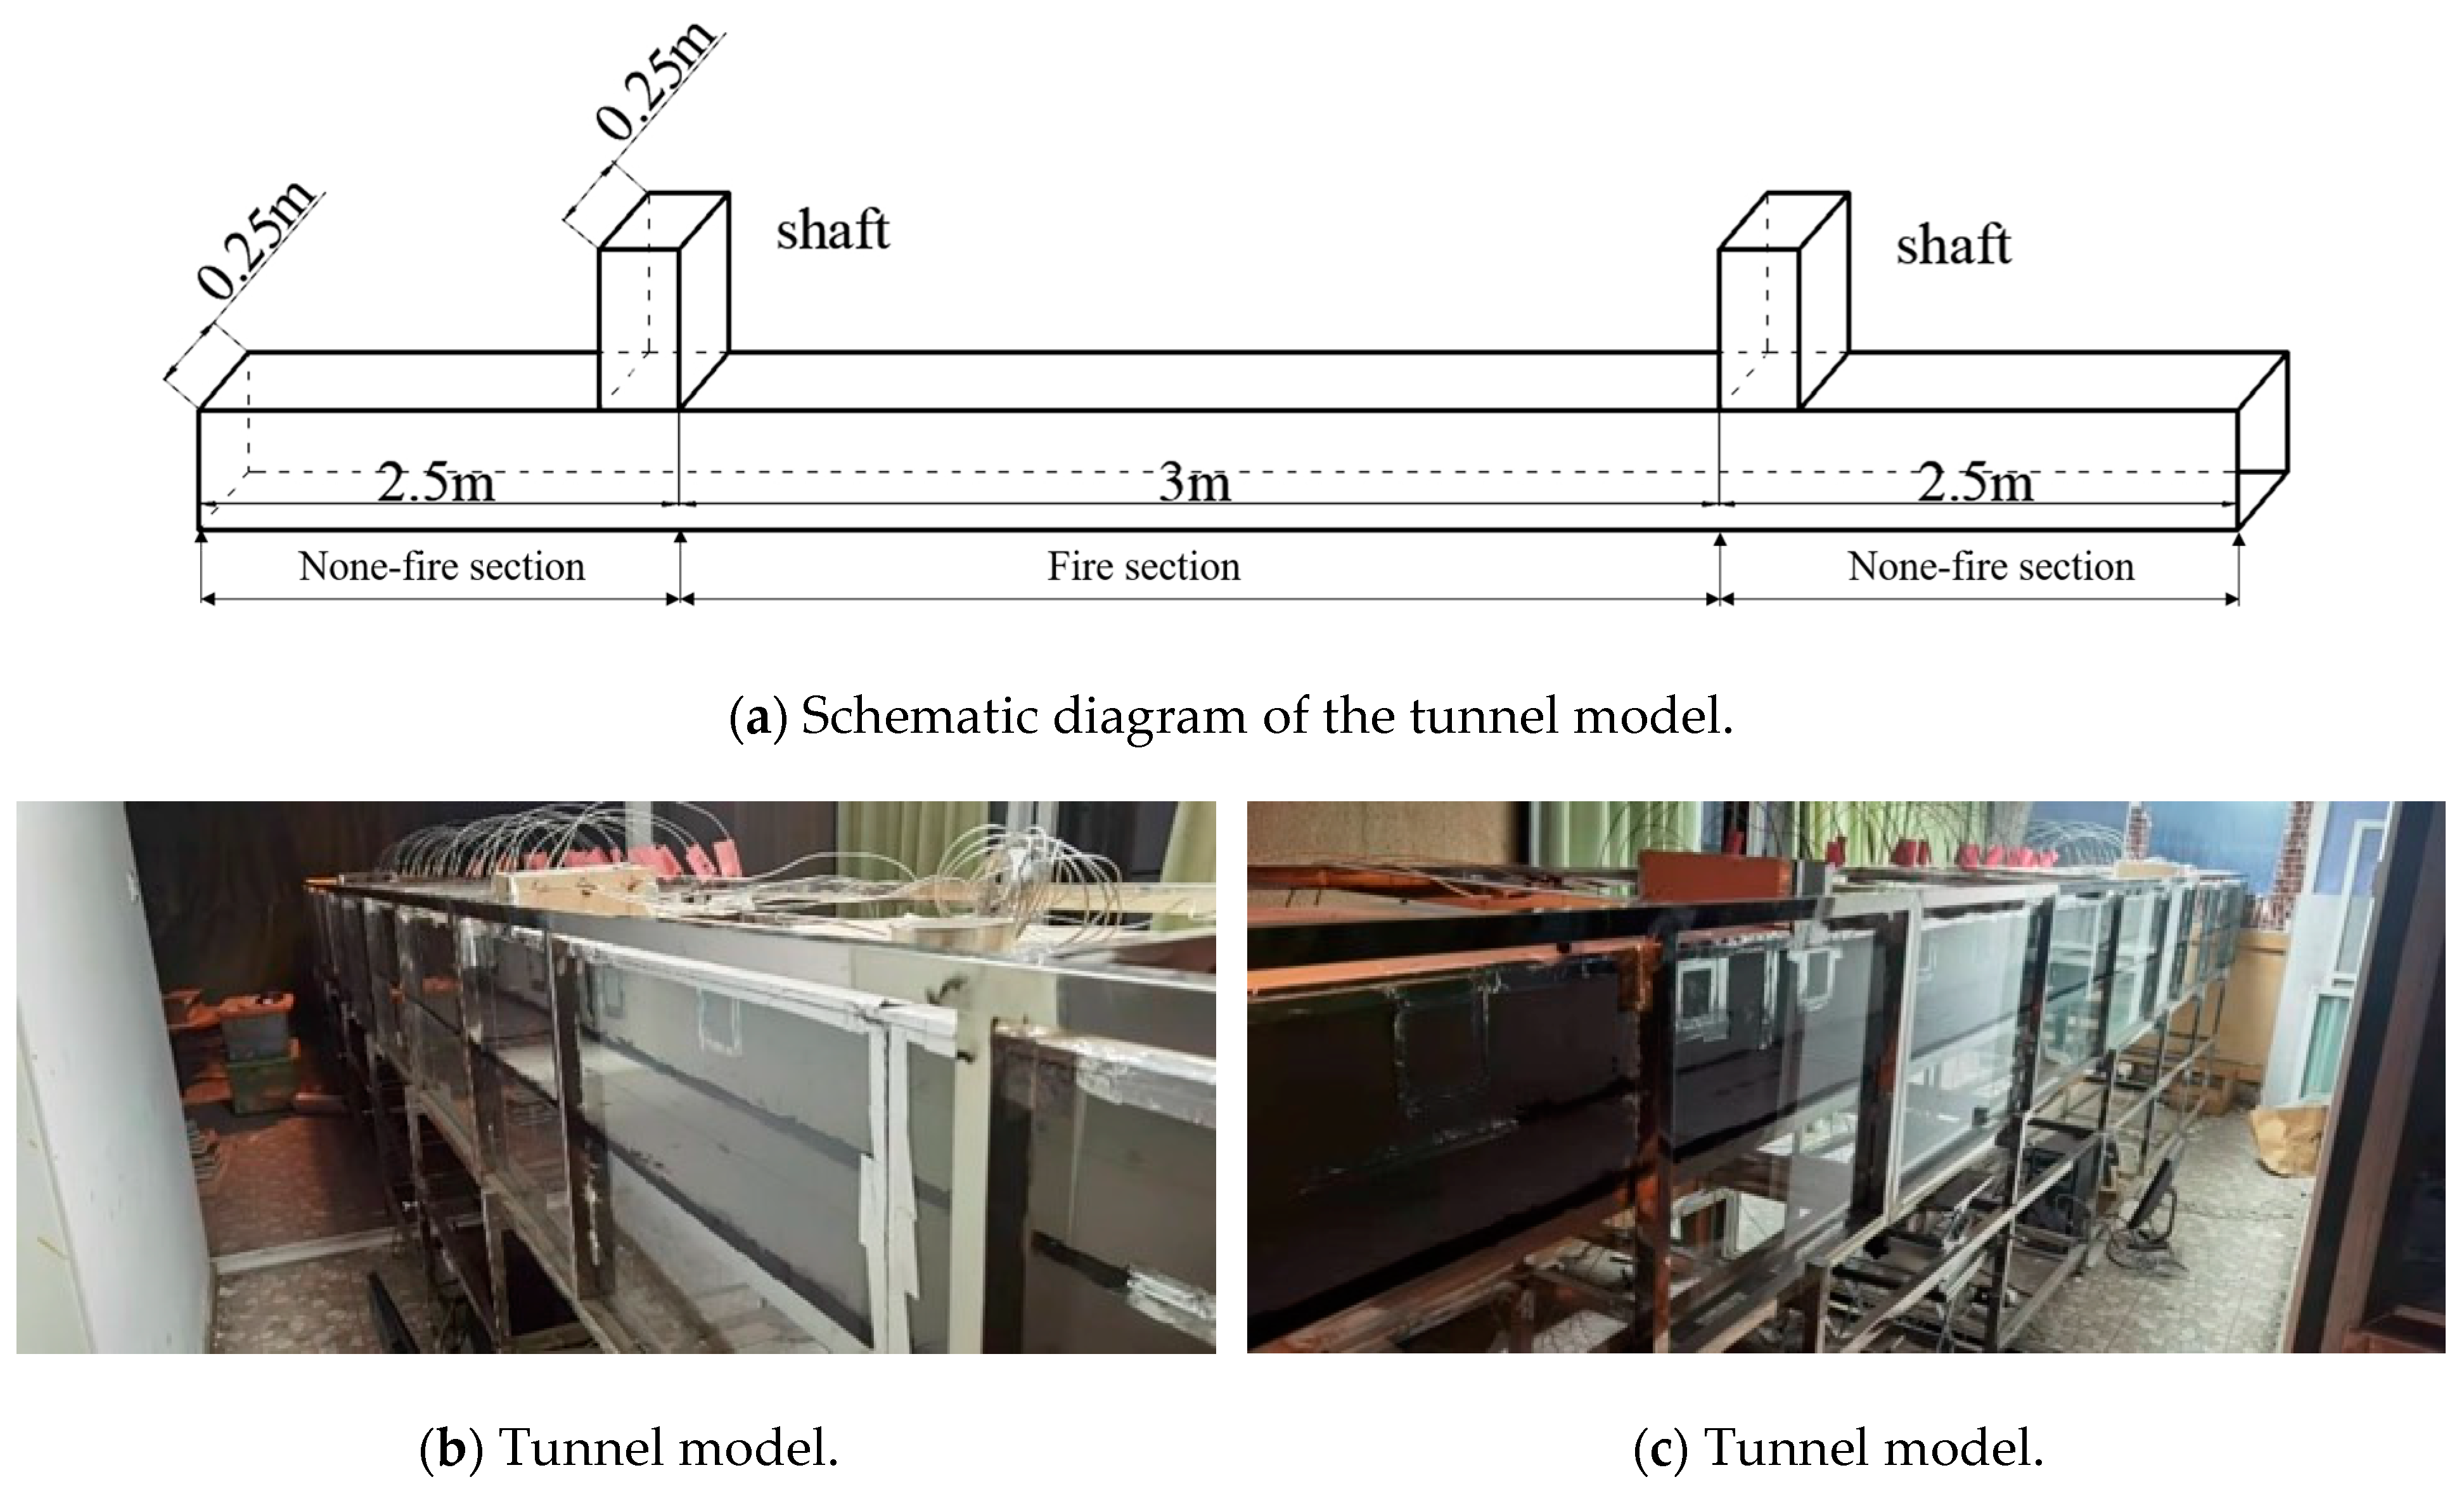
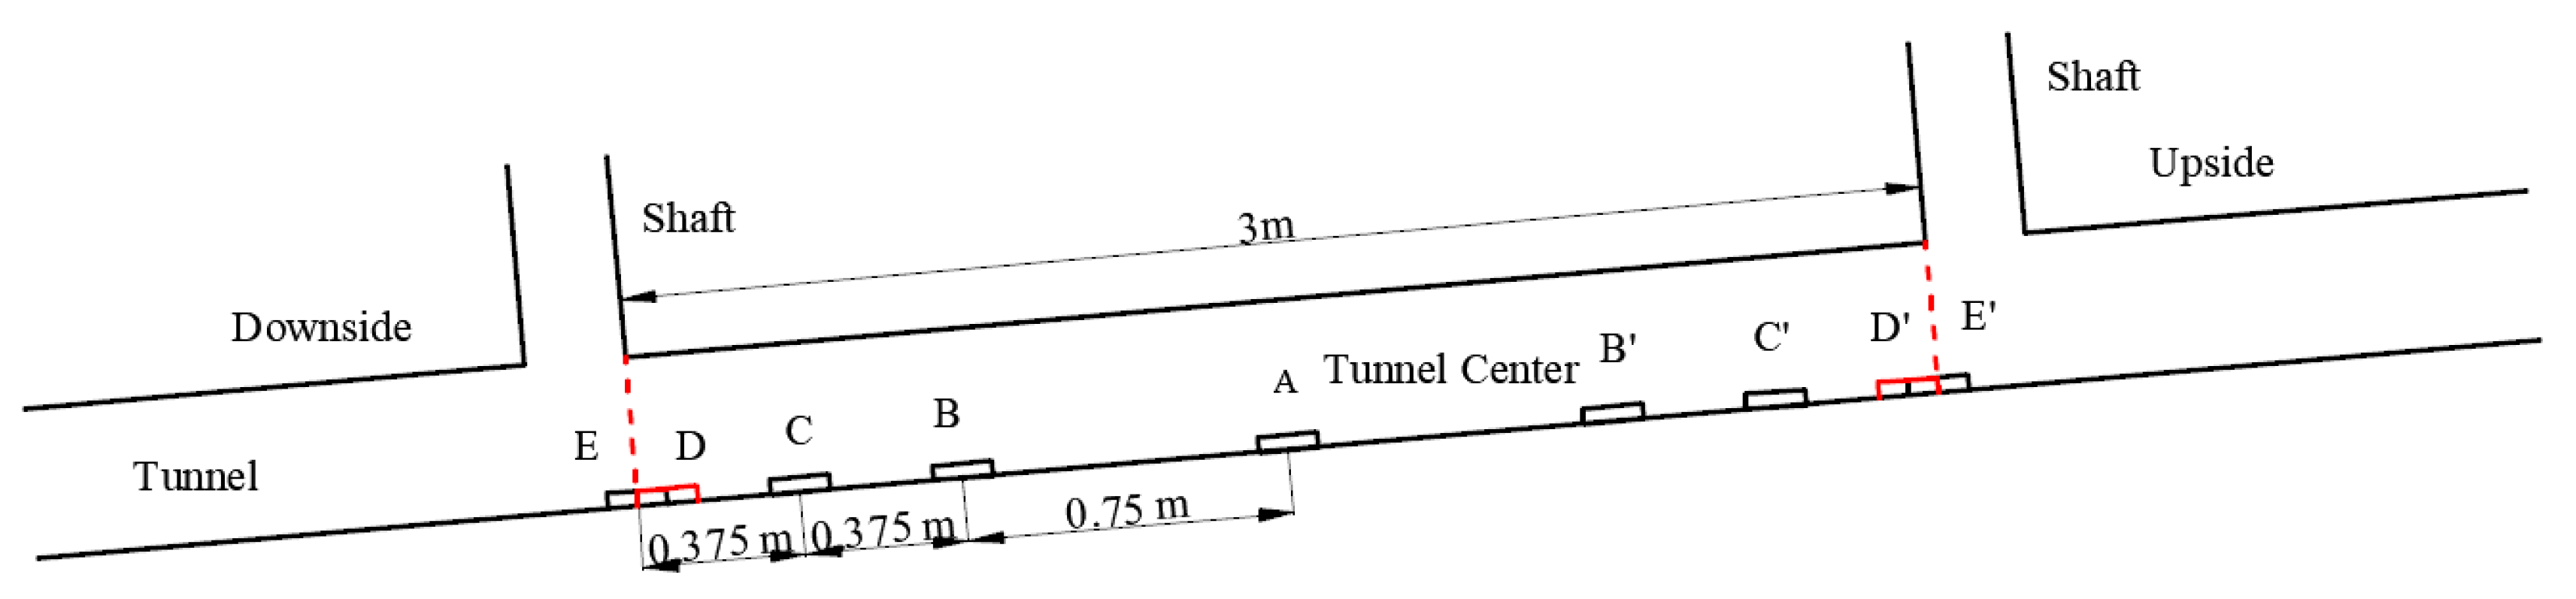
2.1. Reduced-Scale Tunnel Model
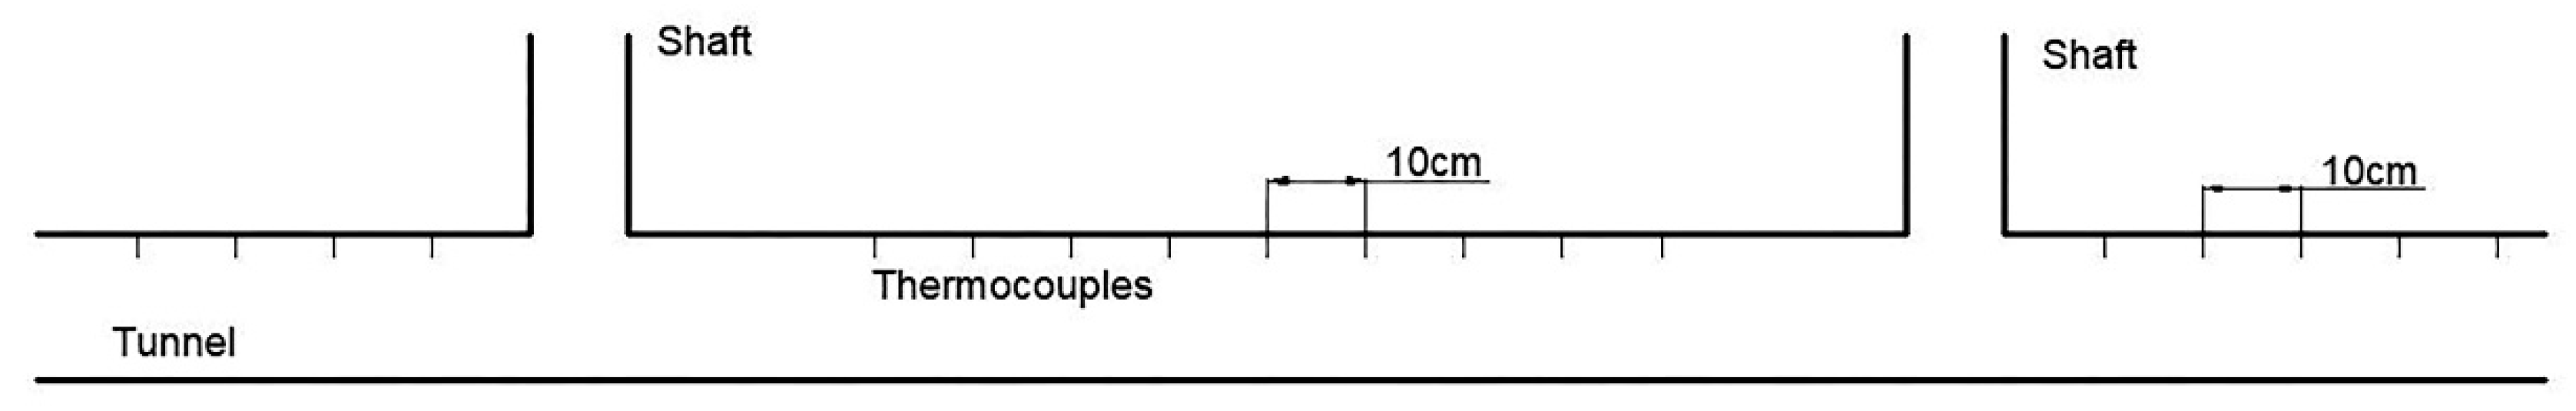
2.2. Temperature System
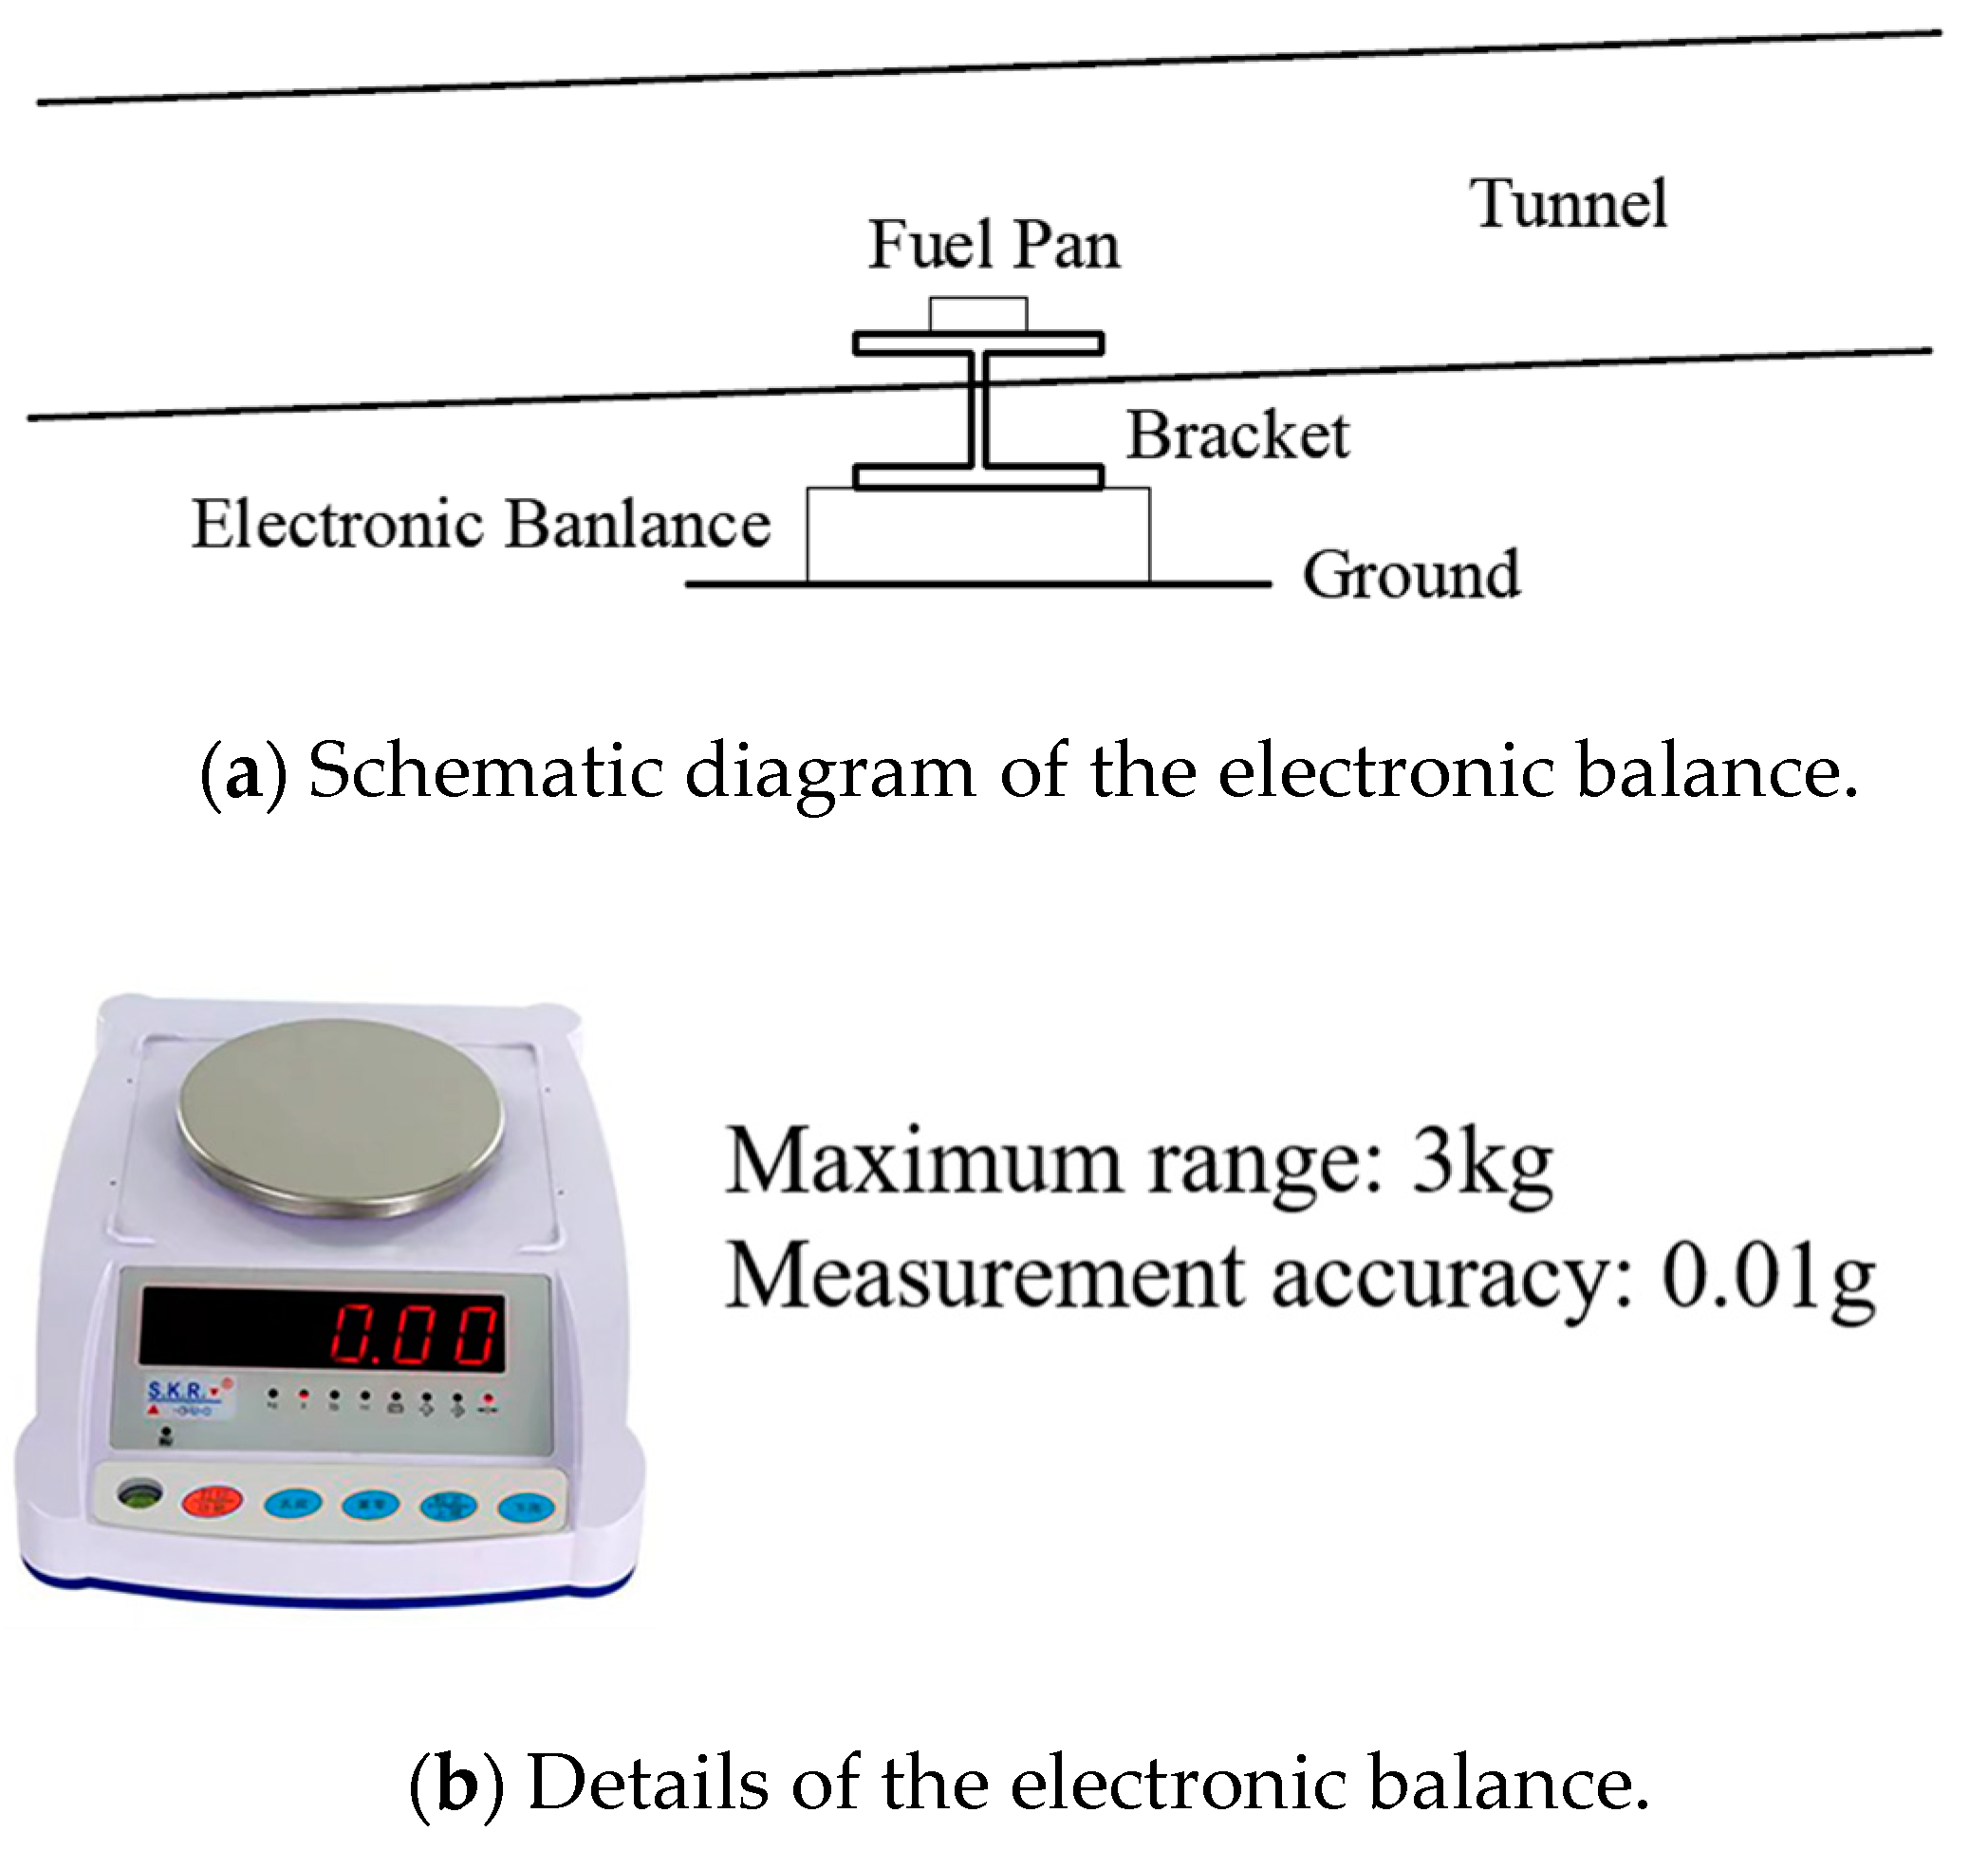
2.3. Heat Release Rate
2.4. Experimental Scenarios
3. Results and Discussion
3.1. Diffusion of Fire Smoke in Tunnel
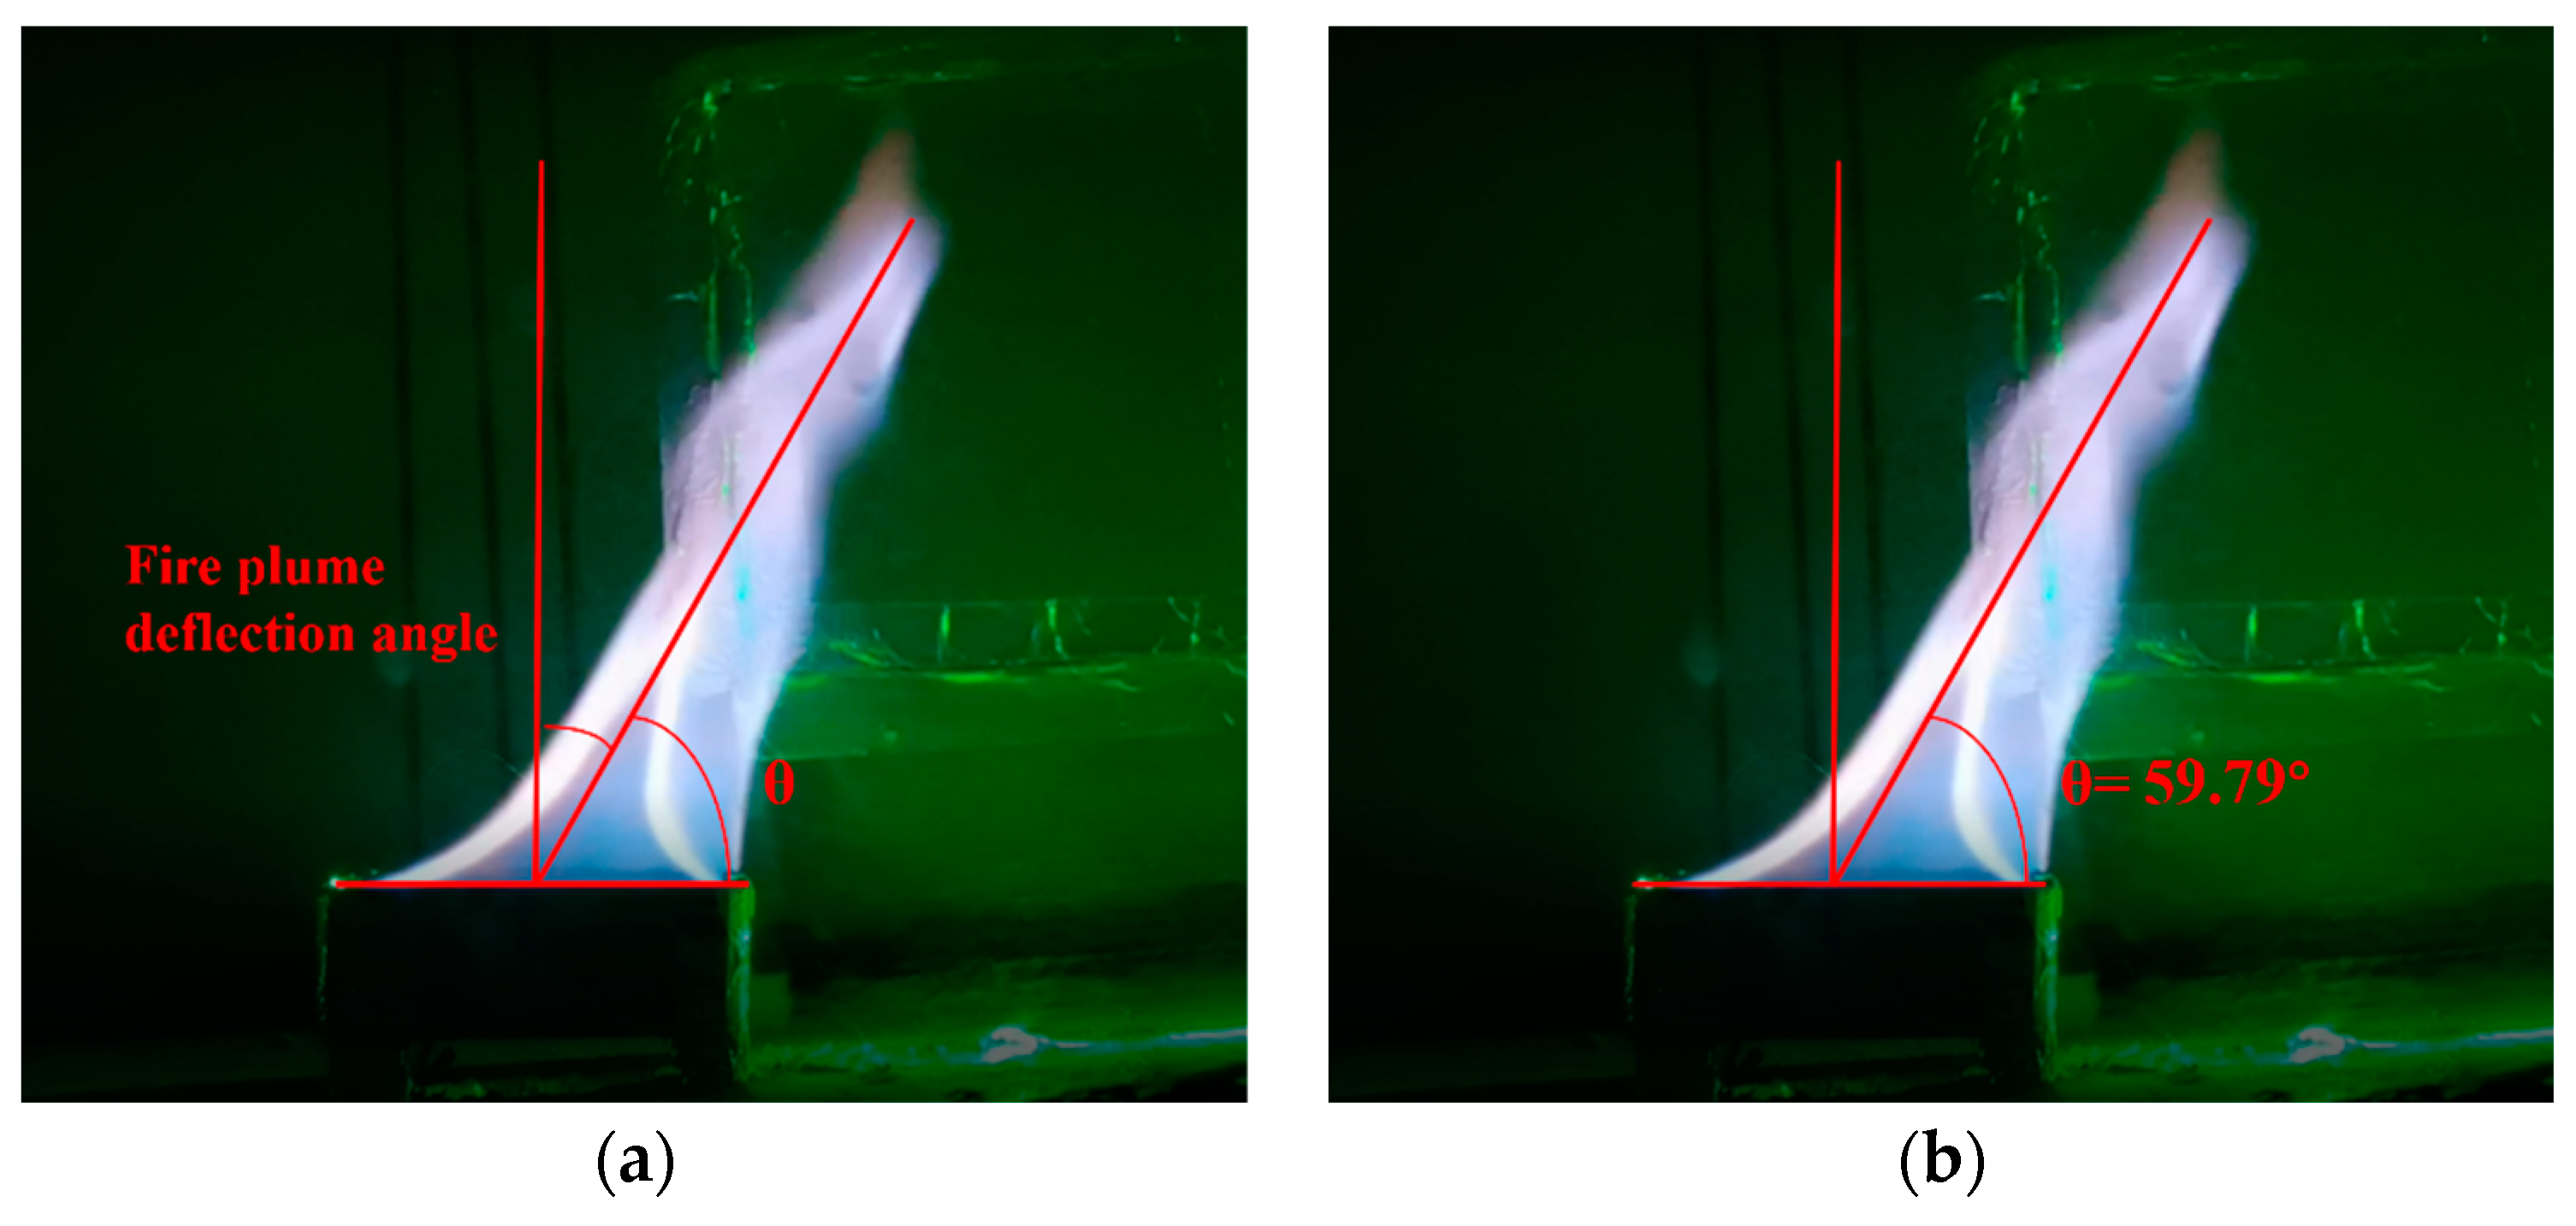
3.1.1. Fire Plume
3.1.2. Deflection Angle of Fire Plume
- (1)
- Cases 1–15 show that the HRR has little effect on the deflection angle of fire plume for the same location of the fire source.
- (2)
- Cases 4–15 show that the location of the fire source has little effect on the deflection angle of the fire plume, which indicates that different longitudinal fire source positions have little effect on the plume entrainment.
- (3)
- Cases 1–3 and 16–24 show that the change in the height and length of the shaft has little effect on the entrainment of the fire plume, and the deflection angle of the fire plume hardly changed.
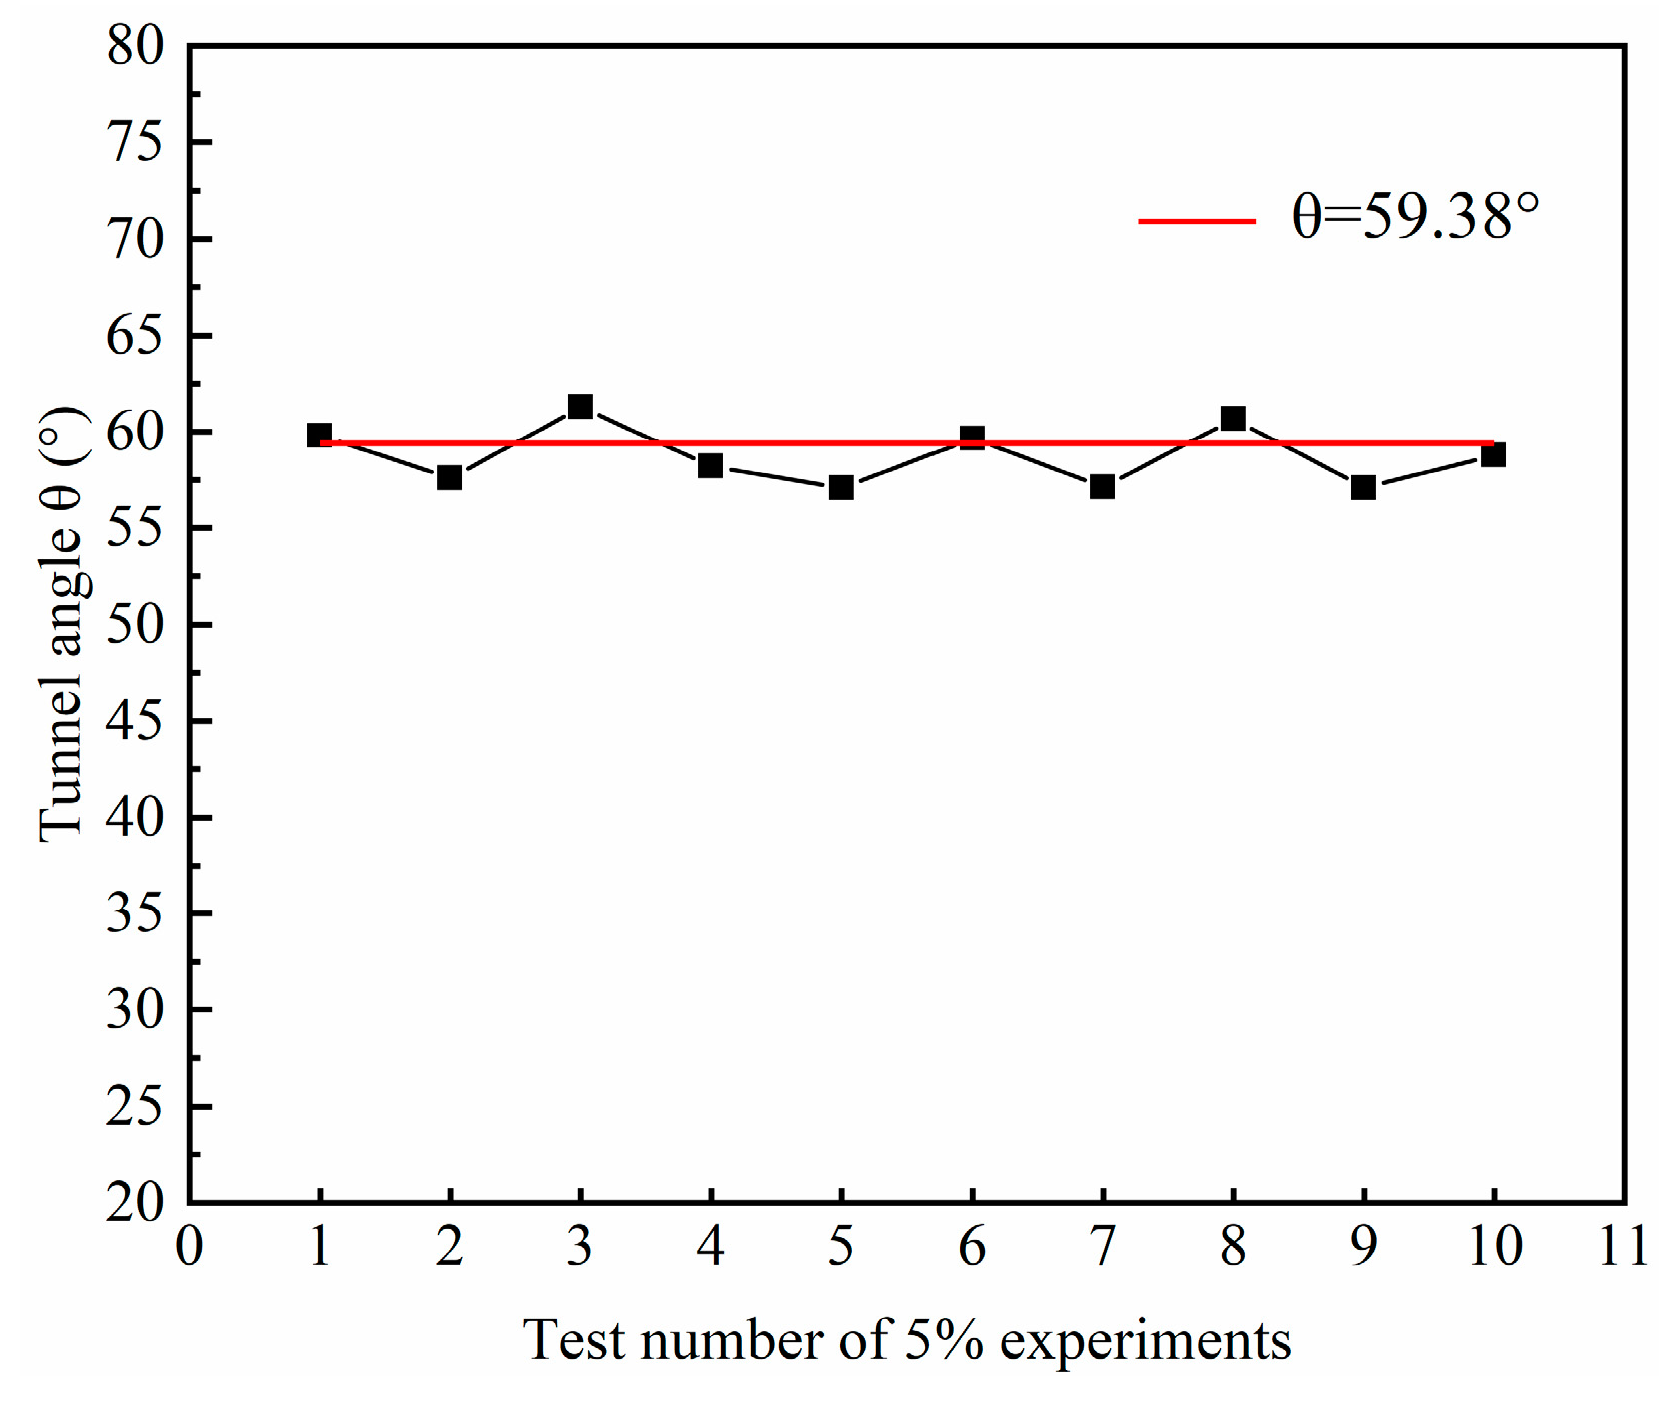
3.2. Effect of Slope on Angle θ of Fire Plume
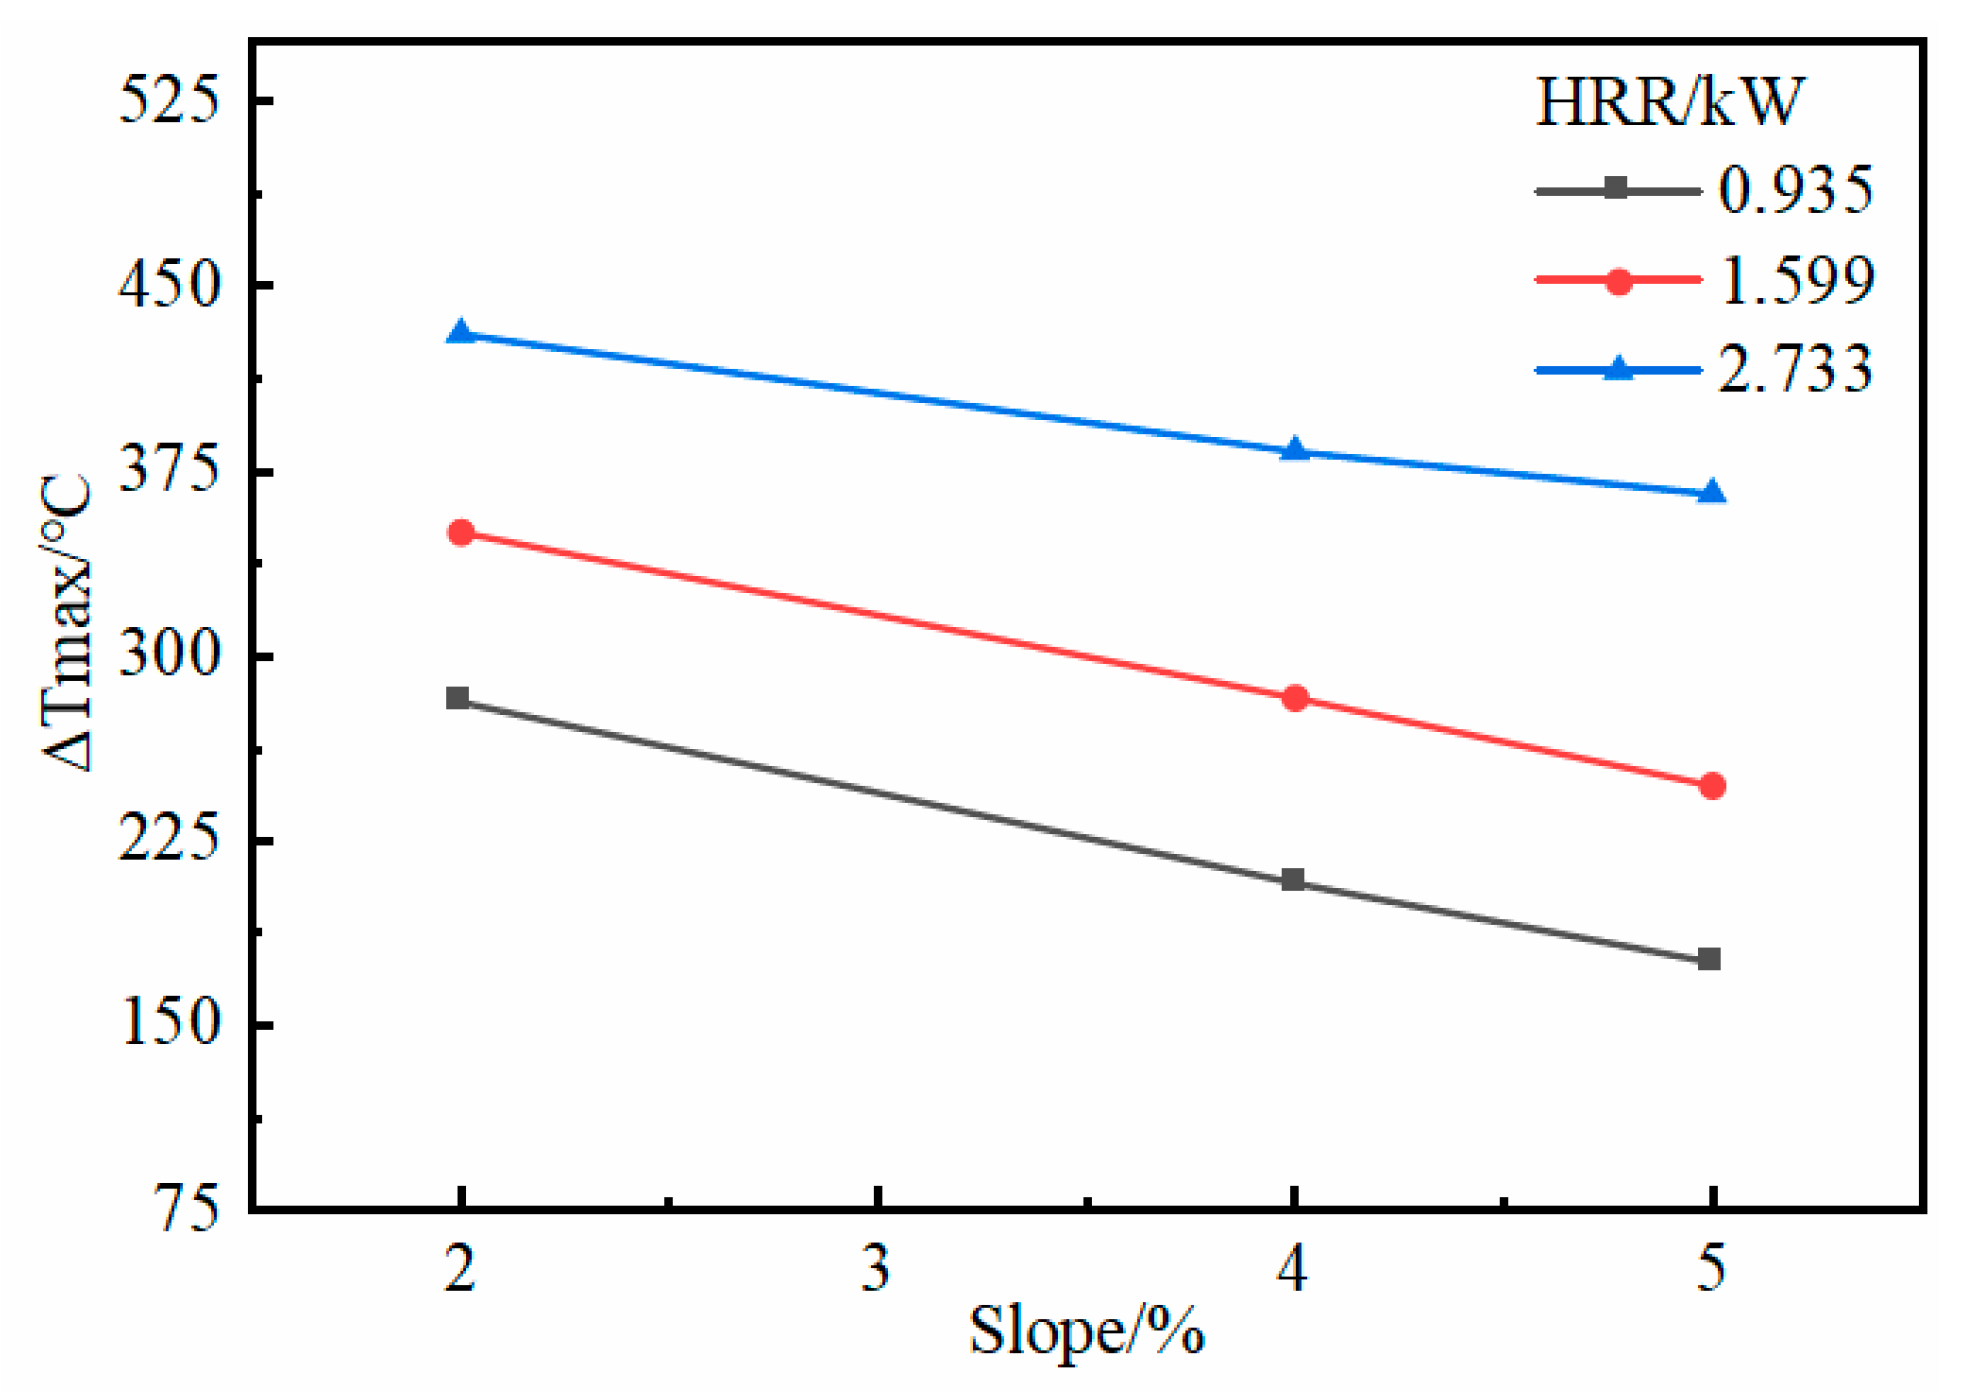
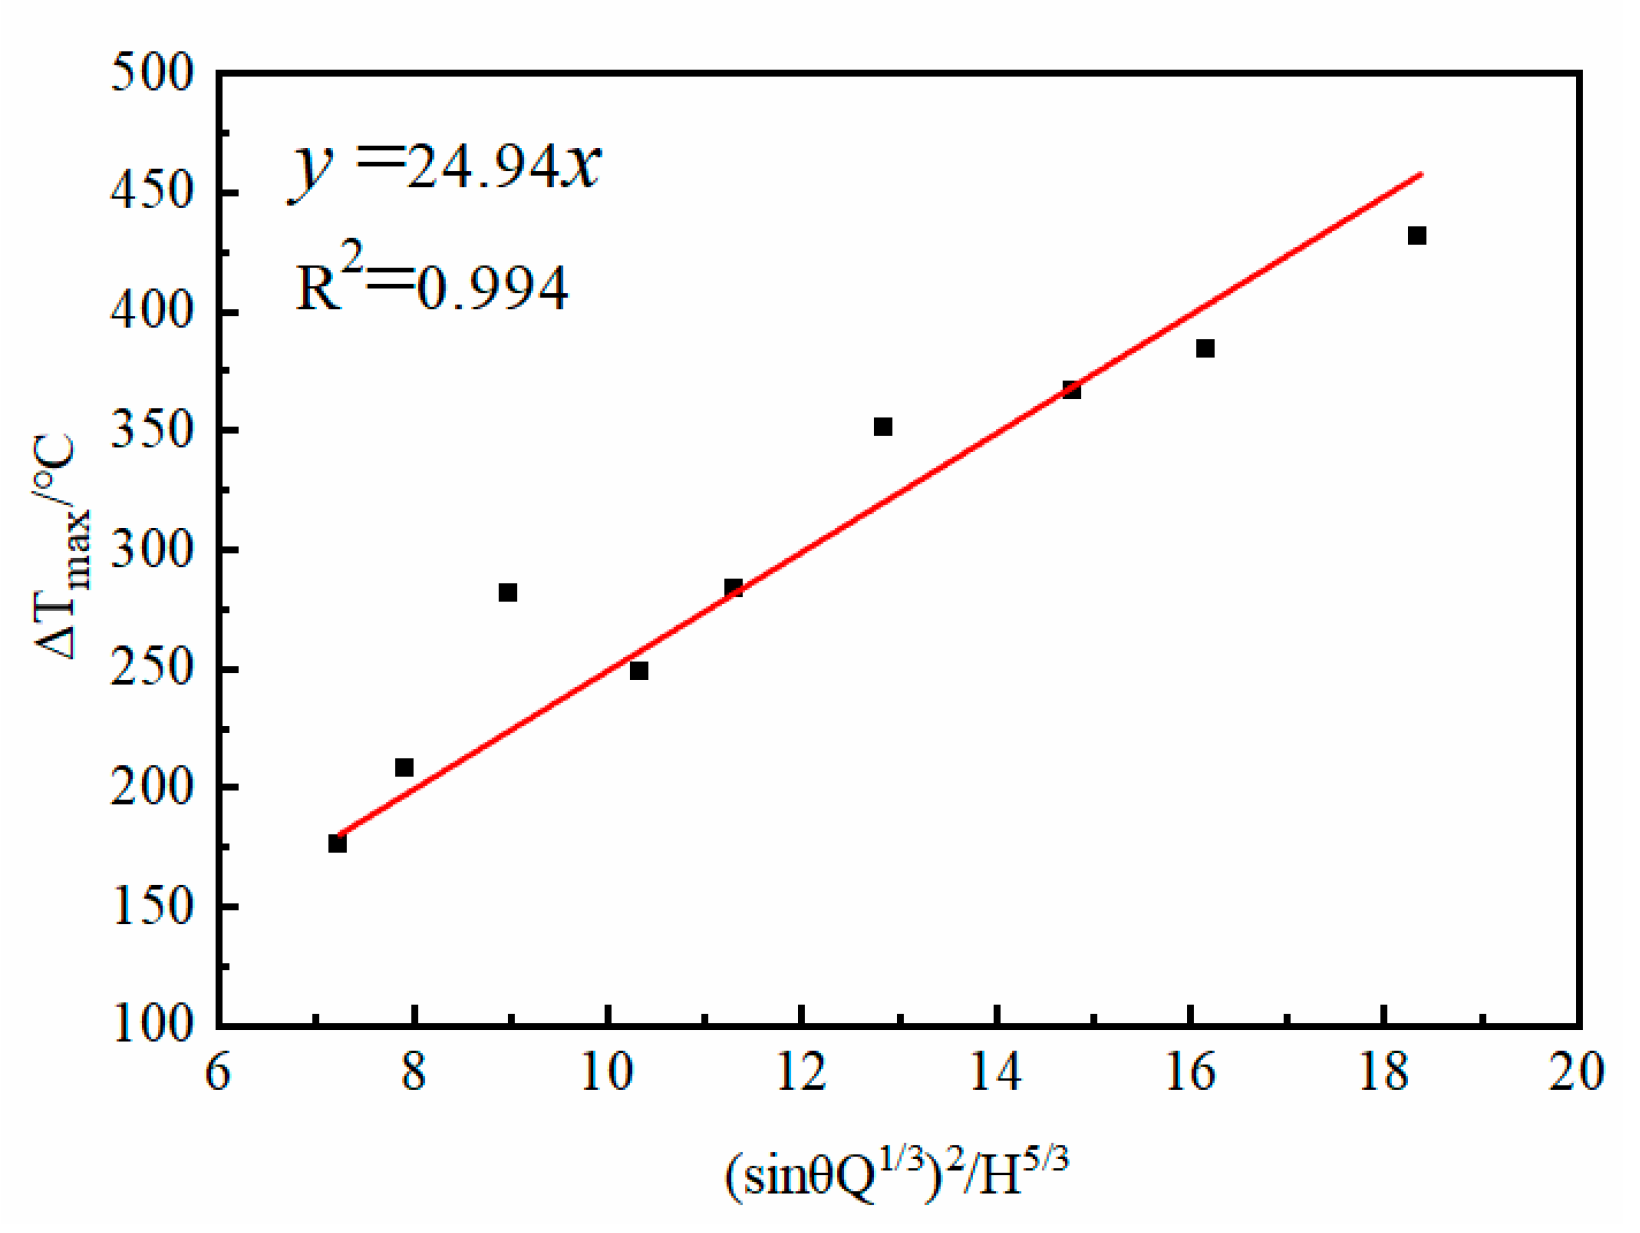
3.3. Maximum Smoke Temperature Beneath the Ceiling
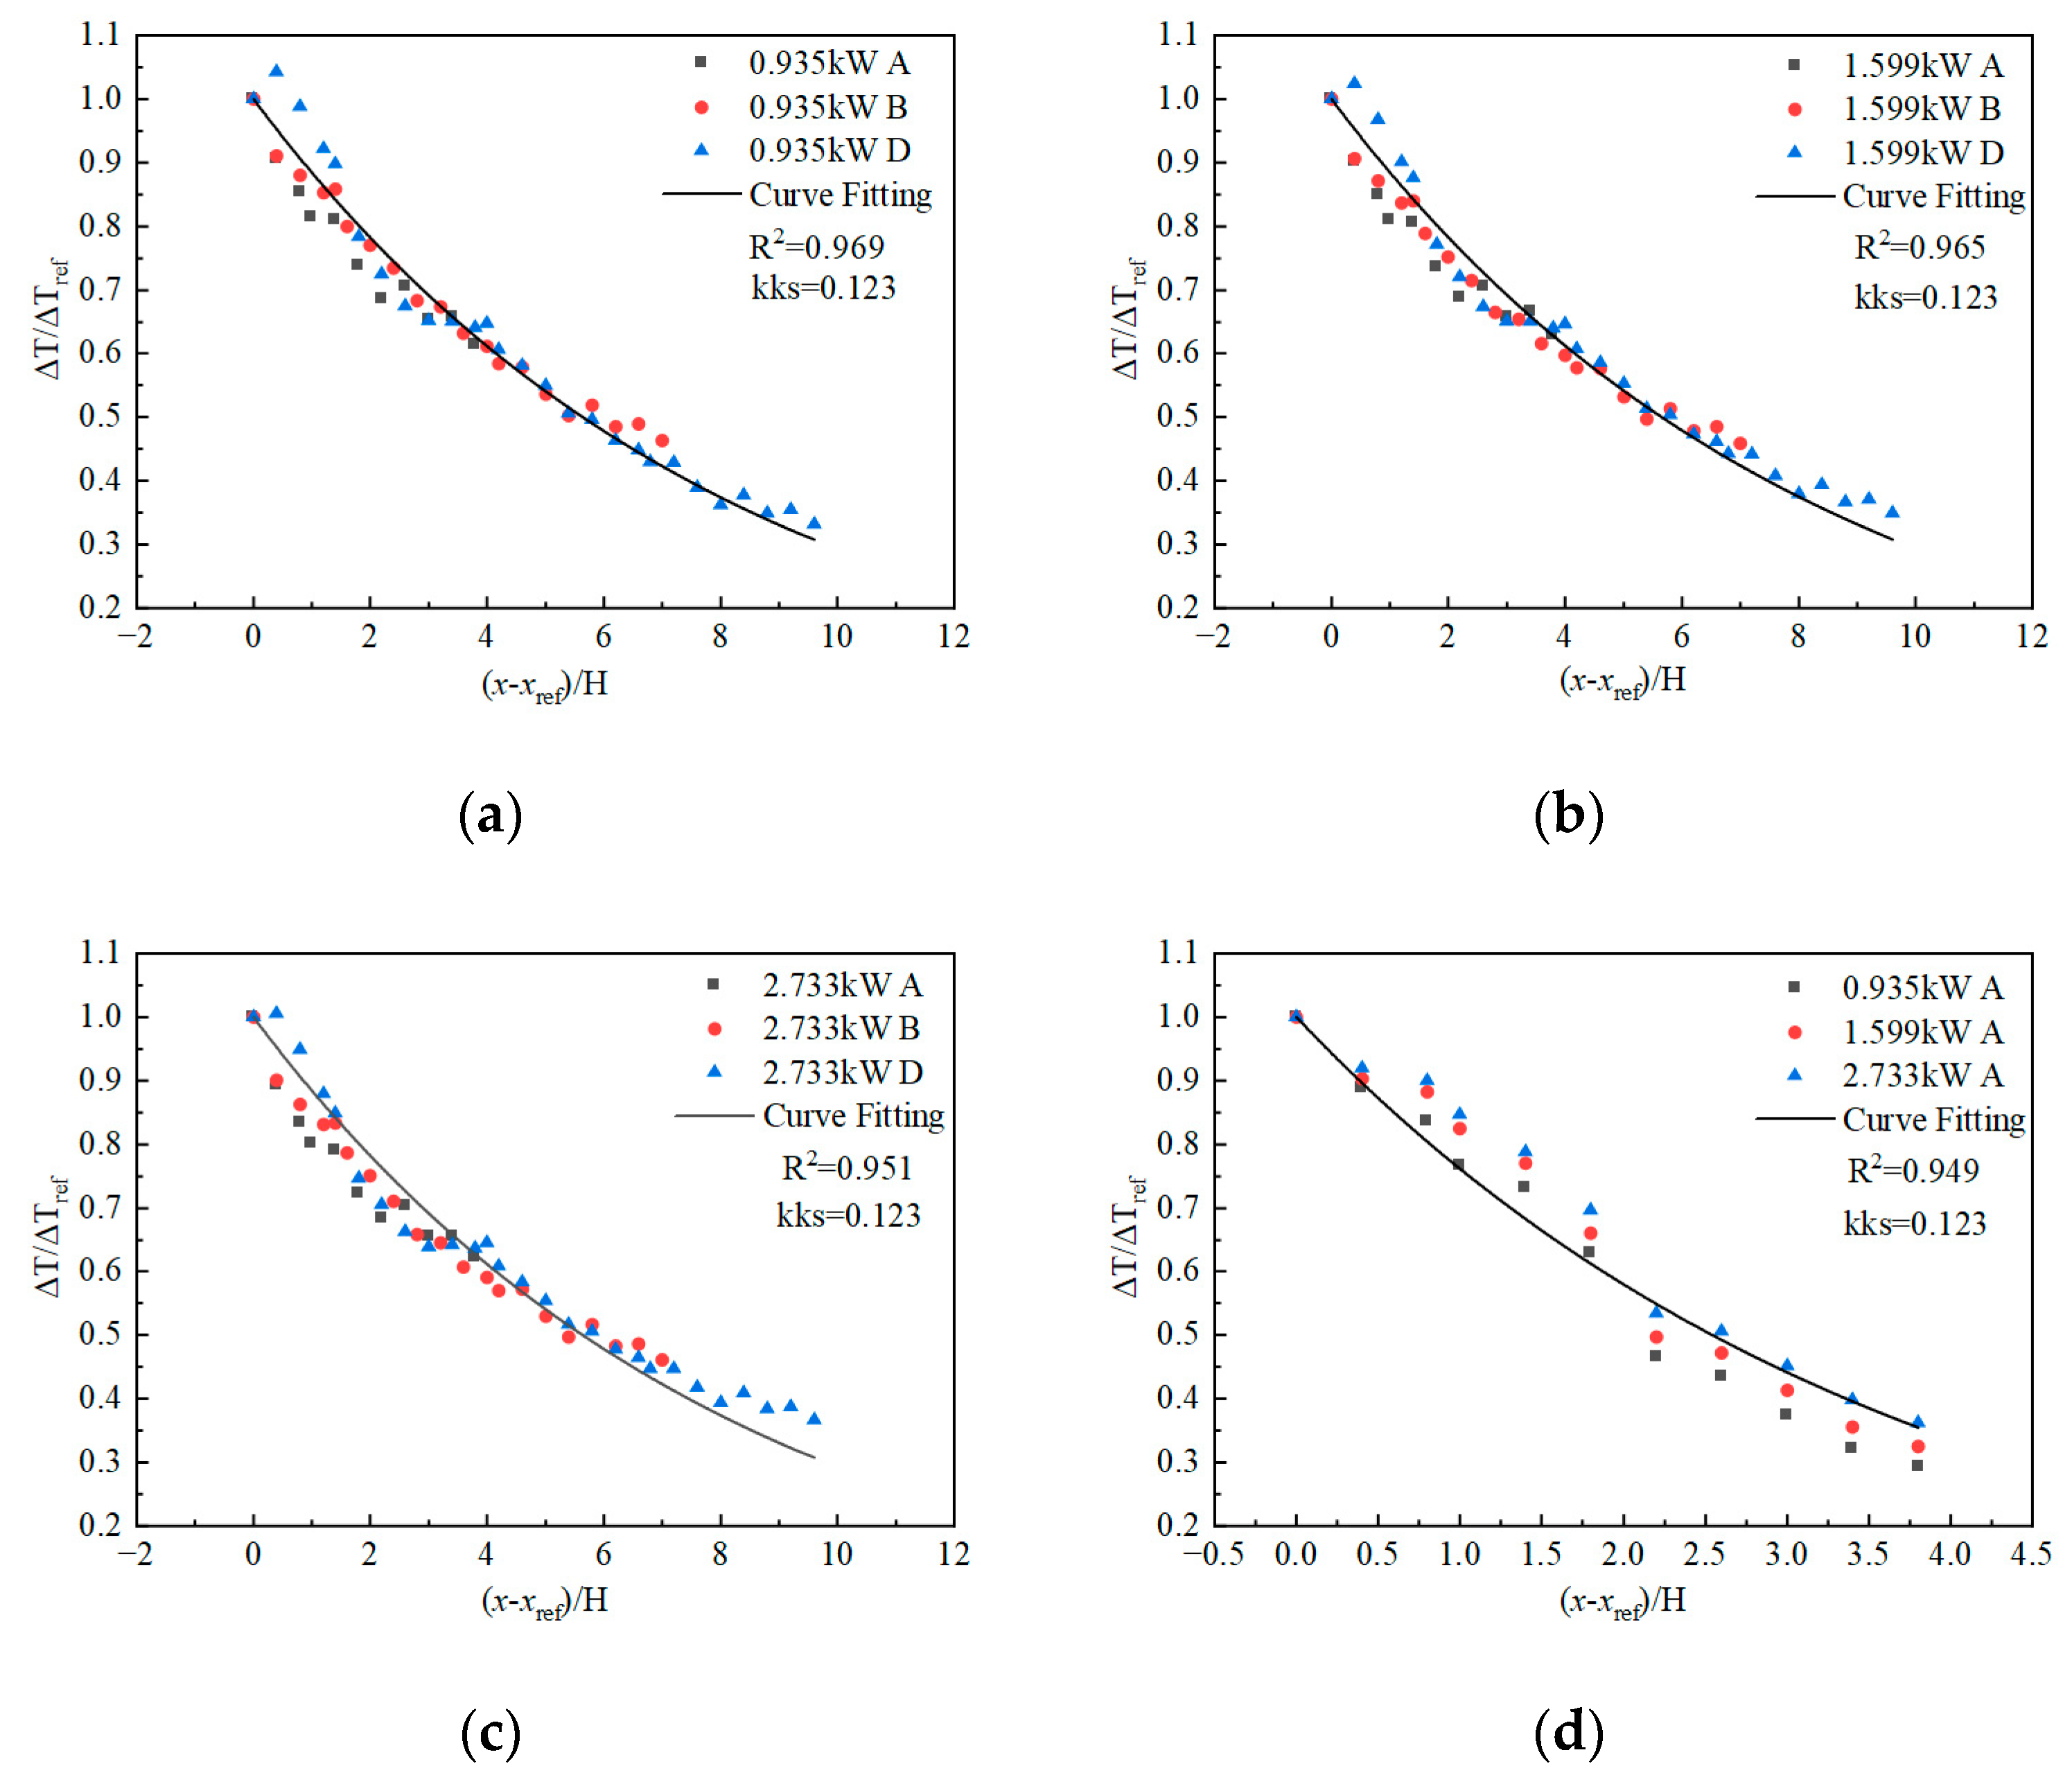
3.4. Smoke Temperature Distribution
- (1)
- Near the fire source (within 0.15 m): The tunnel slope significantly impacts the smoke temperature beneath the ceiling. In this range, the smoke temperature is mainly influenced by the fire plume and the larger slopes causing a stronger disturbance of the fire plume, resulting in a decrease in smoke temperature as the slope increases.
- (2)
- Far from the fire source: As the smoke spreads, the smoke temperature distribution on the upside does not change much with the slope.
- (3)
- Downside of the tunnel: The smoke temperature increases gradually with the decrease in the tunnel slope. When the tunnel slope is 0, the temperature on the downside and upside is symmetrically distributed on both the downside and upside, with the fire source at the center.
4. Conclusions
- (1)
- In slope tunnels with natural smoke extraction, the fire plume deflects to the upside when a fire occurs.
- (2)
- For slope tunnels with natural smoke extraction, the deflection angle of the fire plume is not affected by the longitudinal fire source position.
- (3)
- The maximum smoke temperature rise decreases with the increase in the slope, so and are linearly related. This can be predicted by Equation (10).
- (4)
- Within 0.15 m of the fire source, the temperature of the smoke decreases with increasing slope. While in the area far from the fire source (the distance from the fire source was greater than 0.15 m), the slope had little effect on the smoke temperature distribution in the upside, but increased with the decrease in the slope on the downside.
Author Contributions
Funding
Data Availability Statement
Conflicts of Interest
Nomenclature
| bf | The radius of fire source |
| cp | Heat capacity (kJ∙kg−1∙K−1) |
| CT | Temperature correction factor |
| g | Gravity acceleration (m/s2) |
| k | Decay coefficient (m−1) |
| ks | Decay coefficient of slope tunnel (m−1) |
| H | Tunnel height (m) |
| ΔH | Heat of combustion (kJ/g) |
| mf | Mass loss rate (g/s) |
| Q | Heat release rate (kW) |
| Qc | Conductive heat release rate |
| Q* | Non-dimensional heat release rate |
| T | Temperature (K) |
| T* | Non-dimensional temperature |
| u | Ventilation velocity (m/s) |
| V* | Dimensionless ventilation velocity |
| w | Extraction vent width (m) |
| W | Tunnel width (m) |
| x | Distance from fire location (m) |
| Greek symbols | |
| θ | Tilted angle |
| β | Tunnel slope |
| ρ | Density (kg/m3) |
| Δ | Difference property between smoke and ambient environment |
| ω* | Characteristic velocity of fire plume |
| χ | Combustion efficiency |
| χr | The ratio of radiative heat dissipation |
| Subscript | |
| f | Full-scale property |
| m | Reduced-scale property |
| 0 | Ambient property |
| s | Slope tunnel |
| ref | Reference property in the fire section |
References
- Yuan, Z.Y. The Smoke Propagation Mechanism and Control Method for Fires in Subway Tunnel with Roof Openings. Ph.D. Thesis, Soutnwest Jiaotong University, Chengdu, China, 2012. [Google Scholar]
- Wan, H.X.; Gao, Z.H.; Han, J.Y.; Ji, J.; Ye, M.J.; Zhang, Y.M. A numerical study on smoke back-layering length and inlet air velocity of fires in an inclined tunnel under natural ventilation with a vertical shaft. Int. J. Therm. Sci. 2019, 138, 293–303. [Google Scholar] [CrossRef]
- Mao, J.F.; HUang, Y.L.; Zhu, P.G.; Yao, Y.J.; Li, H.W.; Jiang, G.Z. Experiment of city tunnel model with natural ventilation in case of fire. J. Army Eng. Univ. PLA 2008, 9, 357–362. [Google Scholar]
- Tong, Y.; Shi, M.H.; Gong, Y.F.; He, J.P. Full-scale experimental study on smoke flow in natural ventilation road tunnel fires with shafts. Tunn. Undergr. Space Technol. 2009, 24, 627–633. [Google Scholar] [CrossRef]
- Li, M. Application of natural ventilation in subway. Build. Energy Environ. 2013, 32, 85–88+64. [Google Scholar]
- Tanaka, F.; Yoshida, K.; Ueda, K.; Ji, J. A simple model for predicting the smoke spread length during a fire in a shallow urban road tunnel with roof openings under natural ventilation. Fire Saf. J. 2021, 120, 103106. [Google Scholar] [CrossRef]
- Jiang, X.P.; Xiang, Y.; Wang, Z.Y.; Mao, Y.; Park, H. A numerical study on the effect of the shaft group arrangement on the natural ventilation performance in tunnel fires. Tunn. Undergr. Space Technol. 2020, 103, 103464. [Google Scholar] [CrossRef]
- Chen, P.Y. Experimental Study and Numerical Simulation of Subway Tunnel Fire with Nature Ventilation. Master’s Thesis, Southwest Jiaotong University, Chengdu, China, 2010. [Google Scholar]
- Kashef, A.; Yuan, Z.Y.; Lei, B. Ceiling temperature distribution and smoke diffusion in tunnel fires with natural ventilation. Fire Saf. J. 2013, 62, 249–255. [Google Scholar] [CrossRef]
- Takeuchi, S.; Aoki, T.; Tanaka, F.; Moinuddin, K.A.M. Modeling for predicting the temperature distribution of smoke during a fire in an underground road tunnel with vertical shafts. Fire Saf. J. 2017, 91, 312–319. [Google Scholar] [CrossRef]
- Guo, Q.H.; Zhu, H.H.; Yan, Z.G.; Zhang, Y.; Zhang, Y.P.; Huang, T.R. Experimental studies on the gas temperature and smoke back-layering length of fires in a shallow urban road tunnel with large cross-sectional vertical shafts. Tunn. Undergr. Space Technol. 2019, 83, 565–576. [Google Scholar] [CrossRef]
- Yuan, Z.Y.; Lei, B.; Kashef, A. Reduced-scale experimental research on fires in tunnels with natural ventilation. In Proceedings of the 9th Asia-Oceania Symposium on Fire Science and Technology, Univ Sci & Technol China, Hefei, China, 17–20 October 2012; pp. 907–915. [Google Scholar]
- Yuan, Z.Y.; Lei, B.; Kashef, A. Experimental and Theoretical Study for Tunnel Fires with Natural Ventilation. Fire Technol. 2015, 51, 691–706. [Google Scholar] [CrossRef]
- Wang, Y.; Jiang, J.; Zhu, D. Full-scale experiment research and theoretical study for fires in tunnels with roof openings. Fire Saf. J. 2009, 44, 339–348. [Google Scholar] [CrossRef]
- Wang, Y.F.; Sun, X.F.; Liu, S.; Yan, P.N.; Qin, T.; Zhang, B. Simulation of back-layering length in tunnel fire with vertical shafts. Appl. Therm. Eng. 2016, 109, 344–350. [Google Scholar] [CrossRef]
- He, K.; Cheng, X.D.; Zhang, S.G.; Yang, H.; Yao, Y.Z.; Peng, M.; Cong, W. Critical roof opening longitudinal length for complete smoke exhaustion in subway tunnel fires. Int. J. Therm. Sci. 2018, 133, 55–61. [Google Scholar] [CrossRef]
- He, K.; Cheng, X.D.; Zhang, S.G.; Yao, Y.Z.; Peng, M.; Yang, H.; Cong, W.; Shi, Z.C.; Chen, Z.Q. Experimental study on smoke control using wide shafts in a natural ventilated tunnel. J. Wind. Eng. Ind. Aerodyn. 2019, 195, 104015. [Google Scholar] [CrossRef]
- Zhang, S.G.; He, K.; Yao, Y.Z.; Peng, M.; Yang, H.; Wang, J.H.; Cheng, X.D. Investigation on the critical shaft height of plug-holing in the natural ventilated tunnel fire. Int. J. Therm. Sci. 2018, 132, 517–533. [Google Scholar] [CrossRef]
- Zhao, P.; Chen, T.; Yuan, Z.Y.; Xie, Y.Y.; Yu, N.Y. Critical shaft height for complete smoke exhaustion during fire at the worst longitudinal fire location in tunnels with natural ventilation. Fire Saf. J. 2020, 116, 103207. [Google Scholar] [CrossRef]
- Wang, J.; Fan, Y.J.; Wei, Y.Q.; Jiang, X.P.; Lu, K.H. Effect of the blockage ratio on the smoke extraction efficiency in tunnel fires with natural ventilation. Tunn. Undergr. Space Technol. 2021, 117, 104165. [Google Scholar] [CrossRef]
- Liu, Y.L.; Yang, D. Experimental study on synergistic effect of exhaust vent layout and exhaust rate on performance of ceiling central smoke extraction in road tunnel fires. Int. J. Therm. Sci. 2023, 183, 107886. [Google Scholar] [CrossRef]
- Yang, D.; Ding, Y.; Du, T.; Mao, S.H.; Zhang, Z.J. Buoyant back-layering and the critical condition for preventing back-layering fluid in inclined tunnels under natural ventilation: Brine water experiments. Exp. Therm. Fluid Sci. 2018, 90, 319–329. [Google Scholar] [CrossRef]
- Zhou, Y.; Yang, Y.; Mao, Z.L.; Bu, R.W.; Gong, J.H.; Wang, Y.X.; Yi, L. Analytical and numerical study on natural ventilation performance in single- and gable-slope city tunnels. Sustain. Cities Soc. 2019, 45, 258–270. [Google Scholar] [CrossRef]
- Yi, L.; Wang, X.F.; Yang, Y.; Wang, Y.X.; Zhou, Y. A simplified mathematical model for estimating gas temperature and velocity under natural smoke exhaust in sloping city tunnel fires. Sustain. Cities Soc. 2020, 55, 102071. [Google Scholar] [CrossRef]
- Ji, J.; Wang, Z.Y.; Ding, L.; Yu, L.X.; Gao, Z.H.; Wan, H.X. Effects of ambient pressure on smoke movement and temperature distribution in inclined tunnel fires. Int. J. Therm. Sci. 2019, 145, 106006. [Google Scholar] [CrossRef]
- Wang, Z.Y.; Ding, L.; Wan, H.X.; Ji, J.; Gao, Z.H.; Yu, L.X. Numerical investigation on the effect of tunnel width and slope on ceiling gas temperature in inclined tunnels. Int. J. Therm. Sci. 2020, 152, 106272. [Google Scholar] [CrossRef]
- Yang, Y.X.; Long, Z.; Cheng, H.H.; Chen, J.F.; Liu, C.; Zhong, M.H. Experimental and numerical study of smoke temperature distribution characteristics in a sloped tunnel. Sustain. Cities Soc. 2021, 73, 103091. [Google Scholar] [CrossRef]
- Quintiere, J.G. Scaling applications in fire research. Fire Saf. J. 1989, 15, 3–29. [Google Scholar]
- Tewarson, A. Generation of heat and chemical compounds in fires. In SFPE Handbook of Fire Protection Engineering; National Fire Protection Association: Quincy, MA, USA, 2002; pp. 83–161. [Google Scholar]
- Ji, J.; Gao, Z.H.; Fan, C.G.; Zhong, W.; Sun, J.H. A study of the effect of plug-holing and boundary layer separation on natural ventilation with vertical shaft in urban road tunnel fires. Int. J. Heat Mass Transf. 2012, 55, 6032–6041. [Google Scholar] [CrossRef]
- Yu, H.; Yang, Y.H.; Yin, J.Y.; Deng, P.; Sun, Y.L.; Zhou, L.; Liu, Z.G. Experimental Study on the Smoke Temperature Decrease near Natural Vents Induced by Air Entrainment in a Tunnel Fire. Adv. Civ. Eng. 2023, 2023, 9344190. [Google Scholar] [CrossRef]
- Li, Y.Z. Study of Fire Characteristics and Smoke Control in Super Long Tunnels with Rescue Stations. Ph.D. Thesis, Soutnwest Jiaotong University, Chengdu, China, 2010. [Google Scholar]
- Raj, P.P.K.; Moussa, A.N.; Aravamudan, K. Experiments Involving Pool and Vapor Fires from Spills of Liquefied Natural Gas on Water; United States Coast Guard, Office of Research and Development: New London, CT, USA, 1979. [Google Scholar]
- Hu, L.H.; Chen, L.F.; Wu, L.; Li, Y.F.; Zhang, J.Y.; Meng, N. An experimental investigation and correlation on buoyant gas temperature below ceiling in a slopping tunnel fire. Appl. Therm. Eng. 2013, 51, 246–254. [Google Scholar] [CrossRef]


| Slope | HRR/kW | Shaft Length/m | Shaft Height/m | Shaft Interval/m | Fire Source Location |
|---|---|---|---|---|---|
| 5% | 0.935 | 0.1 | 0.13, 0.16 | 3 | A |
| 5% | 0.935, 1.599, 2.733 | 0.1 | 0.1 | 3 | A |
| 5% | 0.935, 1.599, 2.733 | 0.1 | 0.1 | 3 | B |
| 5% | 0.935, 1.599, 2.733 | 0.1 | 0.1 | 3 | C |
| 5% | 0.935, 1.599, 2.733 | 0.1 | 0.1 | 3 | D |
| 5% | 0.935, 1.599, 2.733 | 0.1 | 0.1 | 3 | E |
| 5% | 0.935, 1.599, 2.733 | 0.1 | 0.1 | 3 | B’ |
| 5% | 0.935, 1.599, 2.733 | 0.1 | 0.1 | 3 | C’ |
| 5% | 0.935, 1.599, 2.733 | 0.1 | 0.1 | 3 | D’ |
| 5% | 0.935, 1.599, 2.733 | 0.1 | 0.1 | 3 | E’ |
| 4% | 0.935, 1.599, 2.733 | 0.1 | 0.1 | 3 | A |
| 4% | 0.935, 1.599, 2.733 | 0.1 | 0.1 | 3 | B |
| 4% | 0.935, 1.599, 2.733 | 0.1 | 0.1 | 3 | D |
| 4% | 0.935 | 0.1 | 0.17, 0.175, 0.18 | 3 | D |
| 4% | 0.935 | 0.06, 0.07, 0.08 | 0.15 | 3 | B |
| 2% | 0.935 | 0.1, 0.13, 0.16 | 0.14 | 3 | D |
| 2% | 0.935, 1.599, 2.733 | 0.1 | 0.1 | 3 | A |
| 2% | 0.935, 1.599, 2.733 | 0.1 | 0.1 | 3 | B |
| 2% | 0.935, 1.599, 2.733 | 0.1 | 0.1 | 3 | D |
| 0% | 0.935, 1.599, 2.733 | 0.1 | 0.1 | 3 | A |
| 0% | 0.935, 1.599, 2.733 | 0.1 | 0.1 | 3 | B |
| 0% | 0.935, 1.599, 2.733 | 0.1 | 0.1 | 3 | D |
| No. | Slope | Fire Source Location | HRR/kW | Shaft Length/m | Shaft Height/m | Angle θ/° |
|---|---|---|---|---|---|---|
| 1 | 5% | A | 0.935 | 0.1 | 0.1 | 59.79 |
| 2 | A | 0.935 | 0.1 | 0.13 | 57.57 | |
| 3 | A | 0.935 | 0.1 | 0.16 | 61.28 | |
| 4 | A | 1.599 | 0.1 | 0.1 | 58.18 | |
| 5 | A | 2.733 | 0.1 | 0.1 | 57.05 | |
| 6 | B | 0.935 | 0.1 | 0.1 | 59.63 | |
| 7 | B | 1.599 | 0.1 | 0.1 | 57.1 | |
| 8 | B | 2.733 | 0.1 | 0.1 | 60.65 | |
| 9 | D | 0.935 | 0.1 | 0.1 | 57.07 | |
| 10 | D | 1.599 | 0.1 | 0.1 | 58.75 | |
| 11 | 4% | A | 0.935 | 0.1 | 0.1 | 64.5 |
| 12 | A | 1.599 | 0.1 | 0.1 | 65.97 | |
| 13 | A | 2.733 | 0.1 | 0.1 | 64.61 | |
| 14 | D | 0.935 | 0.1 | 0.1 | 66.02 | |
| 15 | D | 2.733 | 0.1 | 0.1 | 65.65 | |
| 16 | D | 0.935 | 0.1 | 0.17 | 66.98 | |
| 17 | D | 0.935 | 0.1 | 0.18 | 64.36 | |
| 18 | D | 0.935 | 0.1 | 0.175 | 67.35 | |
| 19 | B | 0.935 | 0.08 | 0.15 | 67.72 | |
| 20 | B | 0.935 | 0.07 | 0.15 | 65.59 | |
| 21 | B | 0.935 | 0.06 | 0.15 | 65.98 | |
| 22 | 2% | D | 0.935 | 0.13 | 0.14 | 74.02 |
| 23 | D | 0.935 | 0.1 | 0.14 | 74.57 | |
| 24 | D | 0.935 | 0.06 | 0.14 | 76.14 |
| Slope/% | ||||
|---|---|---|---|---|
| 5 | 3.059 | 2.271 | 0.123 | 0.273 |
| 4 | 3.033 | 2.458 | 0.129 | 0.234 |
| 2 | 2.992 | 2.805 | 0.141 | 0.180 |
| 0 | 2.973 | 2.973 | 0.131 | 0.131 |
Disclaimer/Publisher’s Note: The statements, opinions and data contained in all publications are solely those of the individual author(s) and contributor(s) and not of MDPI and/or the editor(s). MDPI and/or the editor(s) disclaim responsibility for any injury to people or property resulting from any ideas, methods, instructions or products referred to in the content. |
© 2024 by the authors. Licensee MDPI, Basel, Switzerland. This article is an open access article distributed under the terms and conditions of the Creative Commons Attribution (CC BY) license (https://creativecommons.org/licenses/by/4.0/).
Share and Cite
Liang, C.; Yuan, Z.; Qu, H.; Yu, N. The Effect of Slope on Smoke Characteristics of Natural Ventilation Tunnel with Shafts. Buildings 2024, 14, 1963. https://doi.org/10.3390/buildings14071963
Liang C, Yuan Z, Qu H, Yu N. The Effect of Slope on Smoke Characteristics of Natural Ventilation Tunnel with Shafts. Buildings. 2024; 14(7):1963. https://doi.org/10.3390/buildings14071963
Chicago/Turabian StyleLiang, Chenchen, Zhongyuan Yuan, Haoyu Qu, and Nanyang Yu. 2024. "The Effect of Slope on Smoke Characteristics of Natural Ventilation Tunnel with Shafts" Buildings 14, no. 7: 1963. https://doi.org/10.3390/buildings14071963
APA StyleLiang, C., Yuan, Z., Qu, H., & Yu, N. (2024). The Effect of Slope on Smoke Characteristics of Natural Ventilation Tunnel with Shafts. Buildings, 14(7), 1963. https://doi.org/10.3390/buildings14071963