Abstract
The formal beauty of “objects” is the main focus of modern rural landscapes, ignoring human interaction with the environment and the emotional reflection in this behavioral process. It is unable to satisfy the emotional needs of younger people who aspire to a high-quality life in the rural environment. The research idea of this paper is ‘first assessment—then design—then validation’. First, A 5-point Likert scale was used to investigate differences in contemporary young people’s emotional perceptions of the four rural natural landscapes in terms of instinct, behavior, and reflection. Then, using architectural design methods, a visual attraction element (viewing platform) was added by selecting samples that varied in all three dimensions (visual richness, behavioral attraction, and depth of thought). After that, a desktop eye tracker was used to record the eyeball characteristics of participants viewing the current images of natural landscapes and images of modified natural landscapes (pupil diameter, fixation duration, gaze point, etc.), and these data were combined with the subjective psychological perception scale score to determine whether or not the subjects’ positive emotions are evoked by the modified natural environment. The findings indicate that placing visually attractive elements between people and the natural world can cause subjects to feel good, think deeply, and feel more a part of the surroundings. Furthermore, we confirmed that subjects’ emotions can be evoked by 2D natural environment pictures and that the length of time subjects gaze at a picture is unaffected by the size of any individual element.
1. Introduction
The way that people interact with land has had a remarkable effect on the environment for many years [1]. The countryside is also a location with a rich natural ecological environment [2,3]. Early adulthood is a high-incidence period for mental health problems due to the acceleration of urbanization [4,5]. Numerous pressures are placed on young people living in cities [6], and they desire to get away from the city to visit rural areas [7]. They are excited to engage with nature through direct physical contact and sensory experience, as well as to feel the peace and comfort of rural natural landscapes [8,9,10]. People now find that being in nature is the best way to unwind and relieve mental exhaustion [11]. Consequently, tourism centered around natural scenery has grown in popularity [12], and there are therapeutic benefits to the natural world as well [13,14]. We must comprehend how to use the natural ecological environment to arouse people’s emotions and reduce their stress in light of this social context. Let tired young people gain a comprehensive experience of cognitive, behavioral, and emotional interactions in the natural environment [15]. Consequently, this study initially assesses the natural ecological environment’s emotional response to humans, develops a design based on the responses of the young people, and then confirms the design’s efficacy. The truth is that interactions between humans and the natural environment occur when they are in the same physical space or when they receive direct stimulation from it [16].
However, to draw tourists and encourage photo ops, the current efforts to improve China’s rural natural environment only concentrate on improving the physical elements’ sanitation [17] and increasing greening [18]. According to some research, just taking pictures can make you feel more satisfied with life [19], but it will not make you feel like you belong in your culture [20]. As per the theory of Maslow’s hierarchy of needs [21], a basic emotional need is a sense of belonging [22,23]. The interplay of people’s instincts, behaviors, and reflections occurs when their emotional needs are met [24]. Thus, we must design with the most fundamental and direct instinctive needs in mind if we hope to encourage emotional thinking in people in their natural habitat. In order to fully understand the significance of gaze and pupils in the expression of emotions, we first provide a summary of the relevant literature on the design of natural environments and human interaction in this article. The four rural natural environments were then compared for psychological differences in perceptions of vision, behavior, and reflection, and visual attraction elements were added. Next, we employed comparative data analysis and experimental measurement of eye movement indicators. Lastly, we talked about the outcomes, constraints, and upcoming projects.
2. Related Work
The idea of “interaction with the natural environment” is derived from environmental psychology and refers to the interaction that occurs as a result of this process between the environment (the object) and the tourist, the subject, during their perception of it [25]. People with diverse identities can direct their attention to the same area in natural landscapes [26], creating an environment in the landscape that is perceptible to all. In this process, “vision” serves as the basis for human interaction with the natural world [27], and ongoing human interaction with nature produces the emotional feedback of the natural world [28]. Many designers use biophilic design to accomplish the goal of enabling people to continuously interact with the natural environment. Biophilic design is a technique that integrates natural elements into architectural and landscape design with the goal of improving people’s health [29] and sense of well-being in life [30], according to previous studies. Furthermore, biophilic environments have been shown to dramatically lower stress and anxiety levels [31]. According to research, biophilic design is beneficial to the healthy growth of children and young people [32,33]. In addition, being close to the natural environment can enhance people’s responsibility and awareness of nature [34] while improving their sense of happiness in life. The comprehensive and interactive environmental processes found in the natural environment should be taken into account when designing it [35]. A number of techniques are frequently employed by designers to heighten the feelings evoked by human interaction with nature [30]. For instance, molding polymorphic window openings and water flow to let in more light [36], putting up greenery on the roof [37], changing the office setting to a natural setting [38], or putting potted plants in the workspace [39], employing natural plants rather than steel [40]. All of these techniques are intended to help people establish stronger relationships with nature and recognize the significance of the natural world in human development on the cognitive, emotional, and spiritual levels [41]. To satisfy a sense of belonging and help people feel connected to the place, some designers incorporate native plants and materials [42,43].
Research on multisensory environmental design has also attracted widespread attention from scholars, who emphasize the importance of design that combines multiple senses in improving the experience of the built environment. For instance, designers can create more interactive and engaging architectural scenarios by combining tactile, auditory, and visual elements [44,45]. The sense of smell can significantly influence a user’s mood and perception [46]. Natural plant scents have the power to ease stress and encourage the recovery of mental health [47]. Although hearing is frequently regarded as a secondary sense to vision [48], it can also aid in the formation of beliefs about the spatial properties of the environment [49]. Examples of things that can arouse people’s emotions are the music in places of worship [50] and the chirping of birds and insects in the outdoors [51]. Additionally, touch can transmit emotional information [52]. For instance, touch can improve the emotional immersion experienced when consuming media [53]. According to these studies, creating environments with multiple senses can enhance emotional health.
This begs the question, “How do we quantify this feeling?” Although they lacked scientific validity and precision, researchers in the past were adept at assessing people’s emotional feedback through language [54]. In neurology, physiological responses (electroencephalogram, electrocardiogram, electromyography) can be used to measure a subject’s emotional response that is outside of their conscious control [55,56,57]. For instance, we can investigate people’s emotional responses in the natural world by looking at photos of the area and analyzing people’s facial expressions [58]. Actually, information from the eyes is necessary for the brain to function as a thinking machine [59]. Eye images are very important for the study of human emotions and visual recognition [60]. The ability of the eyes to sense and convey emotion has also been demonstrated by researchers [61,62]. People’s emotions shift from a relaxed to an aroused state when their pupils dilate in response to visual stimulation [63]. Hess’s seminal study [64] demonstrated that viewing images that people find pleasing can cause their pupils to dilate. According to Just’s experiment, people who are processing long sentences will noticeably dilate their pupil diameter the longer they stare [65].
The related work above clarifies that people’s primary means of understanding their surroundings is through their eyes. Additionally, attention is drawn to a specific area when images stimulate the eyes [66]. Eye movement experiments were used in earlier studies on the assessment of natural environments to collect subjects’ gaze point heat maps and saccade trajectories in order to investigate people’s visual preferences for the surroundings [67,68]. Research on the transformation design of applying gaze and pupils to rural natural environments to enhance people’s positive emotions is still lacking, and the role of pupil diameter in emotional feedback research is typically disregarded. In order to provide design strategies for tourists to interact with the rural natural environment and deepen the rural natural environment, this article uses gaze and pupil changes to verify whether visual attraction elements can improve young people’s positive emotions (sense of belonging) towards the natural ecological environment, increasing the feeling of inclusion that young people have in the rural environment.
3. Materials and Methods
We used both objective data and subjective questionnaires. Firstly, in order to investigate the differences in the subjects’ emotional responses to the four types of natural environments, we randomly selected visitors from the local area and asked them to rate each type of natural environment using the questions from the psychological perception questionnaire. Next, we modify designs based on human visual receptors (eyes) to perceive the most distinct natural environment. Ultimately, eye-tracking technology will be employed to investigate the variations in eyeball indicators among individuals’ cognitive-behavioral processes. Our study intends to test the following hypotheses:
Hypothesis 1 (H1):
There are different factors influencing the psychological perception of different types of rural natural environments when people observe them.
Hypothesis 2 (H2):
Differences between the natural environment before and after transformation.
Hypothesis 3 (H3):
The connection between an element’s area and how much it attracts the eye among various natural environment elements.
Hypothesis 4 (H4):
The association between pupil modifications and the psychological perception questionnaire.
3.1. Four Types of Psychological Perception of the Rural Natural Environment
3.1.1. Evaluation Sample Selection
The landmark we selected is a village near the city in southern Hebei (Figure 1). The village offers easy access to transportation and a prime geographic location. It features distinctive rivers, mountains, lush forests, picturesque landscapes, hills, and other geological formations. The village can be reached by car in fifteen minutes from the edge of the main urban area, and the city center can be reached in thirty minutes. Emotional research on rural natural landscapes can be conducted there, as it is one of the primary areas for the development of rural tourism.
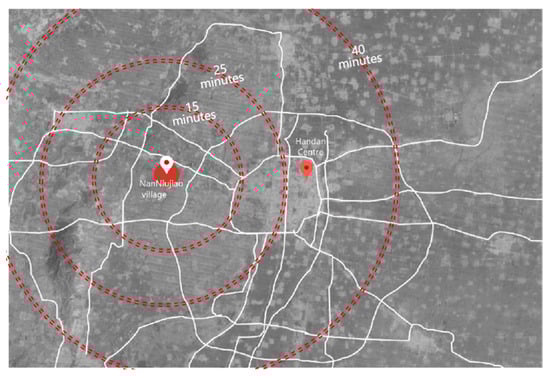
Figure 1.
Distance from countryside to city.
To investigate young people’s emotional perceptions of rural natural scenery, we conducted numerous visits to the countryside and identified four distinct categories of natural landscape areas (S1–S4) based on rural tourist routes and the screening criteria of easy access, large areas, and typical rural areas, as depicted in Figure 2.
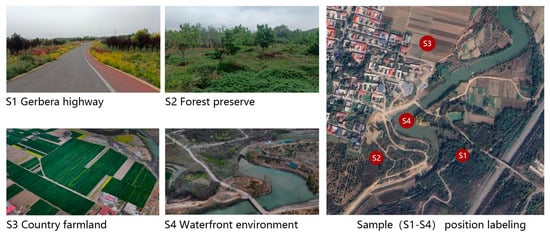
Figure 2.
The location distribution of the four rural natural environments in the countryside.
3.1.2. Questionnaire Design
Donald Arthur Norma initially developed the theory of emotional design in the context of industrial product design [69]. Three levels of responses, according to Norman, should be included in the emotional design [70]: instinctive (direct sensory organ sensation), behavioral (people and environment interaction), and reflective (situations that arouse people’s emotions). The emotional response of design can be assessed using the three-level theory and emotional design method, as demonstrated [24]. Therefore, this subjective questionnaire (Table 1) adopts a Likert scale of five measurements, where a larger number indicates a more positive emotion and a smaller number indicates a more negative emotion. There are a total of 12 questions (3 × 4). The three-level theory is combined with the semantic differential method commonly used in psychology to design three questions (instinct, behavioral, and reflective) for each sample. Two adjectives with opposing meanings appear in every question. From basic to sophisticated, the questions gradually elicit deep thinking from participants. Examples of these include whether or not a rich visual environment influences people’s behavior (e.g., making them want to approach or distance themselves) and whether or not it can induce relaxation or tension. Naturally, human instincts, behaviors, and reflections are expressed with a wide variety of adjectives. This time, the words chosen aim to explore the psychological process of people’s emotional perception of the natural world, starting from the shallow end and working their way up to the deep end from the viewpoint of visual perception.

Table 1.
Questionnaire on four types of rural natural environments (use S1 as an illustration).
We randomly invited 112 young people who visited the village to fill in the questionnaire in the local village. The adults involved range in age from 20 to 35. The results of the survey are more representative since travelers in this age range can more accurately represent the group of young tourists and are more conscious of their own emotional needs and reactions. Web-Questionnair-Designer was used for this questionnaire; it has features like time stamping participant responses and result summaries.
3.1.3. Analysis of Questionnaire
After screening the 112 surveys we obtained, we kept 98 of them after removing the ones that took less than three minutes to complete. Initially, SPSS 27.0.1 was used to import the questionnaire results for the validity and Cronbach’s reliability coefficient tests. The Cronbach’s alpha exceeded 0.8 (0.822), and KMO exceeded 0.7 (0.787).
We employed nonparametric tests to investigate the differences between the instinctive, behavioral, and reflective level scores in more detail. The research has indicated that the nonparametric rank-sum test is employed to examine variations in Y when X is in distinct groups and to contrast variations in data exhibiting unequal variance or non-normality (Y). The Kruskal–Wallis test is used when X is greater than two groups, and the Mann–Whitney test is used when X is less than two groups [71,72]. Since the results of our questionnaire did not fit into a normal distribution and could be compared between three groups (varied–monotonous, closer–leaving, and relaxed–stressed), we analyzed the data using the Kruskal–Wallis test statistic. The data indicate that p < 0.05 indicates a clear difference between the three levels (Table 2), necessitating post hoc multiple comparisons (Figure 3). According to the findings, there are variations in the “A: varied–monotonous” scores between S1 and S4, S3 and S4, “B: closer–leaving” scores between S3 and S4, and “C: relaxed–stressed” scores between S2 and S4.
Table 2.
Nonparametric test analysis.
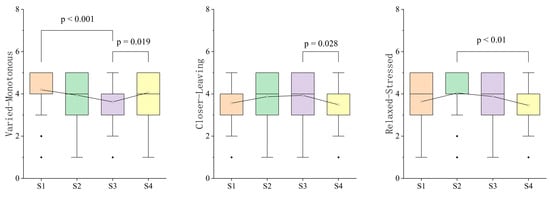
Figure 3.
Difference analysis of subjective questionnaires.
Sample S4 scored highly in visual richness but poorly in behavioral interaction and deep perception, according to the analysis above. Thus, it can be concluded that visual richness on its own is insufficient for natural environment design. Hence, for this visually attractive design, sample S4, which differs in three levels, was chosen as the transformation scene.
3.2. Design with Visually Appealing Elements
The primary water source in rural areas is Sample S4, which is a necessary component of the natural world. The water environment in nature tourism has the ability to calm the body and mind and heal emotions [73]. To bring people closer to the interactive relationship with the waterscape, we designed viewing platforms with varying sight heights and angles (Figure 4). Warm colors with greater saturation are used on the platform to draw the eye [74] and to help reduce stress and emotions [75]. The platform is arranged in a “line shape” alongside the riverbank. In architectural space design, “line elements” are frequently employed to direct the viewer’s gaze [76,77]. In order to accentuate the warm tones, we also added grey tiles along the riverbank and changed the roofs of the residential buildings adjacent to the river to dark grey [78,79]. Similarly, to enhance the overall environmental atmosphere and participants’ visual experience of the viewing platform, crabapple trees that are suitable for local planting are added.
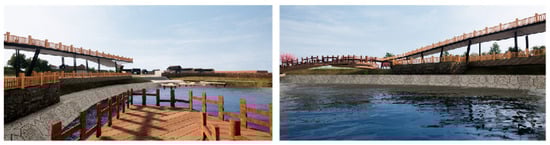
Figure 4.
Design of visually appealing elements in natural environments.
3.3. Eye Movement Experiment Comparison and Verification
The characteristic value of the observer’s eye movements changes along with the change in emotion when the observer becomes interested in the target stimulus [80]. The objective eye movement phenomenon’s changing characteristics were utilized, along with a subjective psychological evaluation questionnaire, to investigate the variations in the physiological and psychological assessments of the waterfront area before and after the renovation. To explore whether visual attraction elements can improve young tourists’ emotional belonging to the rural natural environment.
3.3.1. Stimuli Selection
We entered the countryside from the south side along the tourist route, walking along the river bank just as the entire viewing platform came into view, and used the modeling software’s roaming scene function to choose the stimuli for the eye movement experiment from this perspective (Figure 5b). The current state of the rural waterscape is transformed into a 3D model based on the same angle (Figure 5a). This can guarantee that the scene’s characteristics before and after the transformation are exactly the same, including the weather, sunlight, hue, saturation, and other elements. Sunny weather has the potential to enhance the enjoyment of travel [81]. In order to prevent the weather from impacting the subjects’ emotions, this article sets the weather parameters to sunny days.
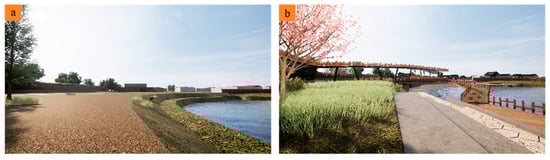
Figure 5.
(a) The present state of the rural environment; (b) rural natural landscape remodel.
3.3.2. Participants
Studies have demonstrated that there is no discernible relationship between the sample population’s regional differences and evaluations of visual aesthetics [82]. To ensure reliable recognition of visual stimuli, we recruited 32 participants, aged 20–30, with corrected visual acuity of 0.8 or above in both eyes, free from eye diseases, and without contact lenses or other items that block vision. None of these participants had visited the stimulus sample area before the experiment. To prevent influencing the psychological perception of visual information in the human cerebral cortex, we prohibited alcohol, caffeine, and other stimulants, and we required all subjects to maintain adequate sleep the day prior to the experiment. Lastly, a consent form was signed by each subject confirming that they had read about the experiment’s purpose and methodology and that they would receive payment for their time.
3.3.3. Experimental Protocol
The primary apparatus utilized in the eye-tracking investigation is a desktop eye-tracker called See Studio (Beijing 7invensun, Beijing, China) that has a sampling frequency of 120 Hz. It is linked to a 22-inch computer monitor that has a resolution of 1920 × 1080. The light- and sound-proof nature of the laboratory can reduce the subjects’ exposure to outside light, infrared radiation, temperature swings, and humidity. A constant 25 °C temperature and humidity are maintained in the laboratory. A steady artificial light source is used in the lab for the duration of the experiment, and the subjects carry out the entire procedure by themselves.
The following are the steps in the experiment (Figure 6):
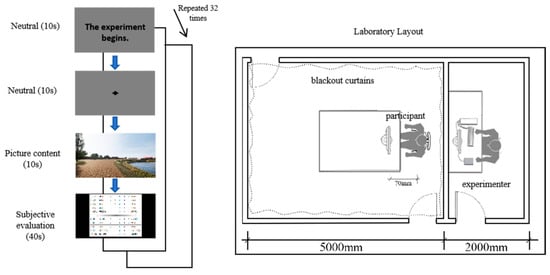
Figure 6.
Experimental process and laboratory layout.
- (1)
- Before starting the experiment, the researcher loaded the visual stimulus samples into SeeStudio, a program that supported eye tracking. All images have the following specifications: aspect ratio of 16:9, resolution of 1920 × 1080 pixels at 300 ppi, and switching time of 0 s for all images. The experimenter guided the subjects to sit 75 cm away from the monitor after completing the setup described above and gave them instructions to read the precautions and instructions. Once the experimenter was satisfied that the subjects comprehended the goal and procedure of the study, the subjects underwent a 5-point calibration to make sure their binocular viewpoint accuracy was greater than 95%. Only then could the experiment start.
- (2)
- The individual remained motionless while observing each of the stimuli one by one, with ten seconds allotted to each image. We placed a “cross” image before the stimulus material and displayed it for 10 s to make sure the subject’s pupil diameter returned to the baseline before viewing the experimental sample [83] and to keep them in a relaxed state of mind.
- (3)
- Following the display of each image, a psychological perception questionnaire (Table 3) came on the screen, and the participants had 30 s to independently complete the questions.
Table 3. Questionnaire on Psychological Perception of Eye Movement Experiments.
- (4)
- When a subject completed the test, the subsequent subject followed the same procedure until every subject completed the test.
It is a reasonably well-developed technique to assess emotions using perceptual words [84,85,86]. Using a five-point Likert scale, our questionnaire assesses the subjects’ psychological perception by selecting three levels of perceptual words: instinctive, behavioral, and reflective. The gathered scales were found to be reliable and valid; furthermore, the Cronbach reliability coefficient (α) value of 0.945 suggests that the results of the questionnaire are reliable. The validity test’s KMO value is 0.956, which suggests that the questionnaire has good validity.
3.4. Extracting Features from Eye Movements
3.4.1. Fixation Duration
Due to varying gaze durations, neurons react differently when people watch something [87,88]. In human visual cognition, the optimal time for extracting information is 150–900 ms [89]. The continuous gaze duration during this period will not cause fatigue to the subjects [90], while for a shorter duration (<150 ms), the subject has not yet entered the cognitive state and cannot extract information [91]. Fixation duration can be used to investigate attention to objects in addition to cognitive processes [92]. As a result, the fixation duration in this article was chosen to be 150–900 ms, and it is represented visually using a heat map that shows the area where the subject’s fixation points are concentrated in relation to the stimulus material (Figure 7). The length of the subjects’ continuous gaze and the concentrated area of their gaze are represented by these points of various colors. The color tends to be red when the gaze point is more concentrated and the continuous gaze time is longer. The color tends to be green and blue, and the area that is not paid attention to is transparent when the continuous gaze time is shorter and the area with fewer gaze points is smaller.
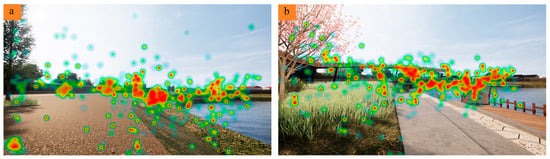
Figure 7.
(a) Heat map of attention points on the present state of the rural environment; (b) heat map of attention points on rural natural landscape remodel.
We can infer from the heat map the region where the subjects’ gaze points are concentrated. In Figure 7a, the scene before the transformation, the subjects’ gaze focus was smaller and more focused on the shoreline weeds, while their gaze durations on the sky and water were shorter and more dispersed. The subjects’ gaze points are more concentrated than those in Figure 7a after the viewing platform was added (Figure 7b), and the red area covers a greater area of the viewing platform. This is evident from the entire image. The gaze points on the water’s surface have not changed significantly, but the gaze points on the sky have significantly decreased. Therefore, drawing attention to the subject can be achieved by constructing a “line-shaped” viewing platform near the water. Once it has been established that the participants’ gaze is drawn to the viewing platform, we will investigate whether the altered scene elicits a positive or negative emotional response in the subjects.
3.4.2. Changes in Pupil Diameter
Research has demonstrated that pupil diameter is a valid measure for determining emotions [93]. People’s pupil diameters will enlarge when their emotions shift from relaxed to aroused [63]. Pupil dilation can result from both positive and negative emotions [94,95,96]. There is an asymmetry in the changes in left and right pupils [97,98], and the change in pupil diameter changes with the change in mental state [99]. To decrease the subjects’ pupil diameters when they observed the waterfront area before and after the transformation error in between adjustments, we contrasted the variations in the peak value and the pupils’ left and right, respectively (Figure 8 and Figure 9).
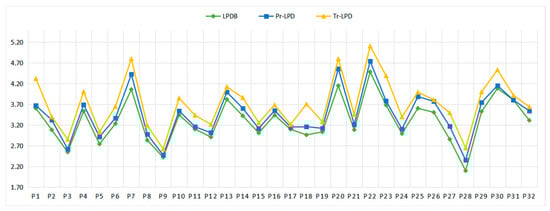
Figure 8.
Changes in participant’s left pupil diameter.
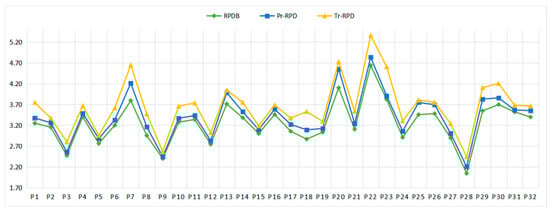
Figure 9.
Changes in participant’s right pupil diameter.
It is evident from the shift in left pupil diameter that both the participant’s pupil diameter prior to viewing the scene before modification and the pupil diameter of the scene following modification were greater than the baseline value (Pr-LPD and Tr-LPD > LPDB). Furthermore, participants observed that both the pre-modified and post-modified right pupil diameters were larger than the baseline values (Pr-RPD and Tr-RPD > RPDB).
This leads us to the conclusion that participants’ emotions can shift from a relaxed to an aroused state when they view photos of rural, natural settings. Furthermore, it was more likely that the altered scene would cause the participants’ emotions to shift.
4. Results
4.1. Comparative Analysis of Psychological Perception Data
The present and transformation scenarios were rated by each participant using a t-test (Figure 10), and the results showed clear differences between the two. The standard deviation after transformation was smaller (Figure 11), and the scene scores after transformation were higher than those before transformation (present), suggesting that the natural environment after transformation can more effectively elicit participants’ deep emotional thinking. We considered the possibility of influencing the participants’ gaze points and the fact that the areas of different elements in the natural environment before and after the transformation are unequal. So, we will look into the relationship between fixation duration and feature area in more detail.
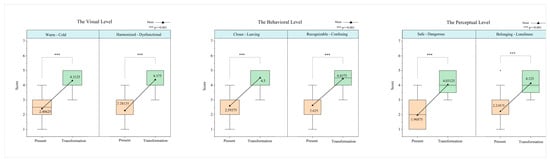
Figure 10.
Results of the scenario t-test present and after transformation.
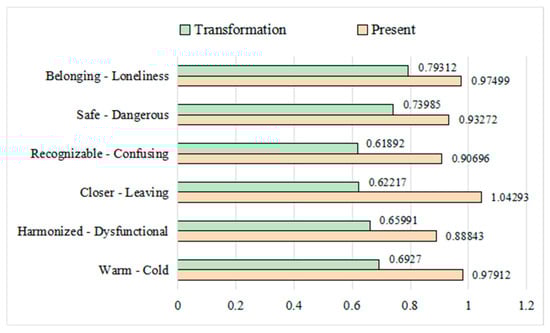
Figure 11.
Comparison of standard deviation present and after transformation.
4.2. The Relationship between Area of Interest (AOI) and Gaze
Eye gaze metrics from areas of interest (AOIs) have been found to be highly effective in identifying participants’ fixation locations in a number of studies using eye-tracking technology [100,101]. AOI is the gaze point’s area of focus, which is definable by the researcher and bounded by a closed shape [102]. The primary analysis carried out in this article is of the area of interest’s gaze time-related indicators. The image area is set to be equal. The area of the AOI is larger if the area of each component of the rural natural environment makes up a larger percentage of the image area.
As seen in Figure 12, we first segment areas of interest (AOI) based on various components of the natural environment.
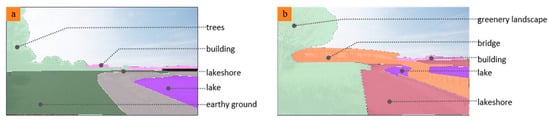
Figure 12.
(a) AOI division of the scene present; (b) AOI division of the scene transformation.
Second, as indicated in Table 4, we measured the area of the AOI by entering its color range using the program Photoshop2020.
Table 4.
The proportion of the area of interest in the image area.
Finally, the fixation count, first fixation duration, total fixation duration, and average fixation duration of our participants viewing the natural environment were analyzed using the Pearson correlation test with AOI area (see Table 5).
Table 5.
Pearson correlation test between AOI and fixation.
The findings indicate that the AOI area is only correlated with the first fixation time prior to transformation, but this does not prove that they are related. Therefore, the gaze of the area is unrelated to the size of the AOI. As a result, placing a “line-like” viewing platform in a natural setting can improve participants’ emotional reactions and draw their attention.
5. Conclusions and Discussion
Verification of the altered rural natural environment was performed this time using pupil diameter. This cutting-edge research applies eye-tracking technology to visual interaction design in natural environments. Our findings demonstrate that visual components in natural settings positively affect people’s emotions and can strengthen young people’s sense of place. This outcome can serve as an indicator for choosing superior design plans, as well as objective data to support the design concepts of environmental designers. It can also make human interaction with the natural environment more emotional and improve people’s sense of emotional belonging. This outcome has the potential to convert rural natural resources into significant economic benefits, like boosting tourism appeal through aesthetically pleasing landscape design [103] and raising the value of real estate near rural areas’ natural environments, particularly those near bodies of water [104]. This will encourage local economic growth, draw in more foreign investment [105], and encourage more people to return to the countryside. The majority of previous research on emotional feedback stopped at the semantic difference analysis stage [106,107]. To attain objectivity, we combined objective data with subjective questionnaires.
In this study, we reached the following conclusions:
- The water environment (sample S4) had the highest instinctive level score in the prior subjective assessment of the four natural environments. Research has indicated that scenes with water, whether natural or man-made, elicit higher levels of liking, positive affect, and perceived resilience [108]. According to the findings of our study, people’s affinity for aquatic settings is innate. By creating visually appealing elements, we can direct people’s visual interaction with the water environment and ensure that it continues to draw attention.
- Based on current research, the optimal time frame for information extraction is between 150 and 900 ms for fixation [89]. We kept the following other parameters constant during this time: the indoor temperature was 24 °C, the humidity was 60%, and there was only artificial lighting (400 lux). We discovered that when participants view images of rural natural settings, their emotions are evoked, and their pupil diameter dilates (Figure 8 and Figure 9). Similarly, studies have demonstrated that people’s positive emotions can be increased even when they are not in contact with the natural environment by reading picture books with nature stories [109] or watching nature documentaries [110]. You can also unwind mentally and physically in this way.
- It is evident from the fixation heatmap that we included visually stimulating elements to direct participants’ gaze (Figure 7). In architectural space design, “line elements” are frequently employed to direct the viewer’s line of sight [76], and warm, vivid colors are used in brand packaging to grab consumers’ attention [111]. Physiological data from our study support this conclusion.
- Studies have shown that human pupil diameter is asymmetric [97]. We also discovered that there was an asymmetrical change process in the participants’ left and right pupil diameters when they looked at images of rural natural settings by comparing the changes in pupil diameter (Figure 8 and Figure 9). However, we also discovered that variations in the pupil diameters on the left and right produce consistent results. When viewing the scene following the transformation, the participant’s pupil diameter was greater than it was before the transformation. In addition, the participant’s psychological perception score increased following the transformation compared to before the transformation state (Figure 10). This finding supports the theory that people are more likely to dilate their pupils when they are feeling happy or attracted [112,113].
- We discovered that there is no correlation between the area of the element and gaze time by examining the relationship between the area of the region of interest and gaze. This finding was similar to Florina-Gabriela’s research [114]; he discovered that when people view an art exhibition, they pay attention to the entire piece and even linger over smaller, more detailed portions due to the painting’s content.
Our research still has certain limitations: (1) We only talked about a comparison study conducted in one weather condition before and after the natural environment was altered. In order to compare people’s emotional reactions before and after the rural natural environment transformation scenes under different weather conditions, we will employ additional physiological data collection techniques in the future. (2) This study concentrated on visual aspects and did not consider the impact of additional sensory experiences on emotions. Future studies will, therefore, employ multisensory methods to investigate the responses of other sensory stimuli in a range of environmental contexts in order to offer more thorough insights into the emotionalization of architecture. In addition, we will gradually improve the emotional feedback of different age groups in the natural environment. Provide a more practical basis for the theoretical system of perceptual architecture [115].
Author Contributions
H.R.: conceptualization, methodology, validation, formal analysis, investigation, resources, data curation, writing, visualization, project administration; L.C.: methodology, validation, formal analysis, investigation, writing—review and editing; J.Z.: conceptualization, software, investigation, review, editing; Q.W.: review, supervision, funding acquisition; L.Z.: calculation. All authors have read and agreed to the published version of the manuscript.
Funding
This research was supported by Basic Science Research Program through the National Research Foundation of Korea(NRF) funded by the Ministry of Education (IRS-2023-00239818).
Institutional Review Board Statement
The study was conducted according to the guidelines of the Declaration of Helsinki and approved by the Institutional Review Board of Hebei University of Engineering (protocol code BER-YXY-2023031, approved 10 June 2023).
Informed Consent Statement
Informed consent was obtained from all subjects involved in the study. Written informed consent has been obtained from the subjects to publish this paper.
Data Availability Statement
The data presented in this study are available on request from the corresponding author. Because of the volume of data and its significance to other ongoing research projects in our research lab, these data are not yet publicly available.
Conflicts of Interest
The authors declare no conflicts of interest.
References
- Verstraeten, G. Quantification of human–environment interactions in the past. Anthropocene 2014, 8, 1–5. [Google Scholar] [CrossRef]
- Haines-Young, R.; Barr, C.; Black, H.; Briggs, D.; Bunce, R.; Clarke, R.; Cooper, A.; Dawson, F.; Firbank, L.; Fuller, R. Accounting for Nature: Assessing Habitats in the UK Countryside; DETR: London, UK, 2000. [Google Scholar]
- Barbati, A.; Corona, P.; Salvati, L.; Gasparella, L. Natural forest expansion into suburban countryside: Gained ground for a green infrastructure? Urban For. Urban Green. 2013, 12, 36–43. [Google Scholar] [CrossRef]
- Sims, J.; Coley, R.L. Examining economic risks in adolescents’ families, neighborhoods, and schools: Implications for mental and behavioral health in early adulthood. J. Adolesc. Health 2022, 70, 774–780. [Google Scholar] [CrossRef] [PubMed]
- De Girolamo, G.; Dagani, J.; Purcell, R.; Cocchi, A.; McGorry, P. Age of onset of mental disorders and use of mental health services: Needs, opportunities and obstacles. Epidemiol. Psychiatr. Sci. 2012, 21, 47–57. [Google Scholar] [PubMed]
- Nissen, S.; Prendergast, K.; Aoyagi, M.; Burningham, K.; Hasan, M.M.; Hayward, B.; Jackson, T.; Jha, V.; Mattar, H.; Schudel, I. Young people and environmental affordances in urban sustainable development: Insights into transport and green and public space in seven cities. Sustain. Earth 2020, 3, 17. [Google Scholar]
- Wang, C.-M. Escape to the countryside: Affects and rural eventful atmospheres. Habitat Int. 2023, 140, 102929. [Google Scholar]
- Valentine, G.; Holloway, S.; Knell, C.; Jayne, M. Drinking places: Young people and cultures of alcohol consumption in rural environments. J. Rural Stud. 2008, 24, 28–40. [Google Scholar] [CrossRef]
- Rantala, O.; Puhakka, R. Engaging with nature: Nature affords well-being for families and young people in Finland. Child. Geogr. 2020, 18, 490–503. [Google Scholar]
- Halfacree, K.H.; Rivera, M.J. Moving to the countryside... and staying: Lives beyond representations. Sociol. Rural. 2012, 52, 92–114. [Google Scholar] [CrossRef]
- Berto, R. The role of nature in coping with psycho-physiological stress: A literature review on restorativeness. Behav. Sci. 2014, 4, 394–409. [Google Scholar] [CrossRef]
- Avram, D. Trends of tourist demand in Romania. Positioning of rural tourism among the tourist preferences. Cactus Tour. J. 2017, 15, 14–25. [Google Scholar]
- Mitten, D. The healing power of nature. Taproot J. 2009, 19, 20–26. [Google Scholar]
- Dushkova, D.; Ignatieva, M. New trends in urban environmental health research: From geography of diseases to therapeutic landscapes and healing gardens. Geogr. Environ. Sustain. 2020, 13, 159–171. [Google Scholar] [CrossRef]
- Scopelliti, M.; Giuliani, M.V. Choosing restorative environments across the lifespan: A matter of place experience. J. Environ. Psychol. 2004, 24, 423–437. [Google Scholar] [CrossRef]
- Soga, M.; Gaston, K.J. The ecology of human–nature interactions. Proc. R. Soc. B 2020, 287, 20191882. [Google Scholar] [CrossRef]
- Zhang, S.; Li, Y.; Zhang, Y.; Lu, Z.-N.; Hao, Y. Does sanitation infrastructure in rural areas affect migrant workers’ health? Empirical evidence from China. Environ. Geochem. Health 2020, 42, 625–646. [Google Scholar] [CrossRef]
- Ren, Z.; Zheng, H.; He, X.; Zhang, D.; Shen, G.; Zhai, C. Changes in spatio-temporal patterns of urban forest and its above-ground carbon storage: Implication for urban CO2 emissions mitigation under China’s rapid urban expansion and greening. Environ. Int. 2019, 129, 438–450. [Google Scholar] [CrossRef] [PubMed]
- Swami, V.; Barron, D.; Furnham, A. Exposure to natural environments, and photographs of natural environments, promotes more positive body image. Body Image 2018, 24, 82–94. [Google Scholar] [CrossRef]
- Gillet, S.; Schmitz, P.; Mitas, O. The snap-happy tourist: The effects of photographing behavior on tourists’ happiness. J. Hosp. Tour. Res. 2016, 40, 37–57. [Google Scholar] [CrossRef]
- Poston, B. Maslow’s hierarchy of needs. Surg. Technol. 2009, 41, 347–353. [Google Scholar]
- Kim, E.; Irwin, J.P. College Students’ Sense of Belonging: A Key to Educational Success for All Students by Terrell L. Strayhorn. Rev. High. Educ. 2013, 37, 119–122. [Google Scholar]
- Allen, K.-A. Making sense of belonging. InPsych 2019, 41, 8–13. [Google Scholar]
- Yusa, I.; Ardhana, I.K.; Darma Putra, I.N.; Pujaastawa, I.B.G. Emotional Design: A Review of Theoretical Foundations, Methodologies, and Applications. J. Aesthet. Des. Art Manag. 2023, 3, 1–14. [Google Scholar] [CrossRef]
- Zube, E.H.; Sell, J.L.; Taylor, J.G. Landscape perception: Research, application and theory. Landsc. Plan. 1982, 9, 1–33. [Google Scholar] [CrossRef]
- Nassauer, J.I. Landscape as medium and method for synthesis in urban ecological design. Landsc. Urban Plan. 2012, 106, 221–229. [Google Scholar] [CrossRef]
- Walters, G.; Sparks, B.; Herington, C. The impact of consumption vision and emotion on the tourism consumer’s decision behavior. J. Hosp. Tour. Res. 2012, 36, 366–389. [Google Scholar] [CrossRef]
- Ulrich, R.S. Aesthetic and affective response to natural environment. In Behavior and the Natural Environment; Springer: Berlin/Heidelberg, Germany, 1983; pp. 85–125. [Google Scholar]
- Hady, S.I.M.A. Activating biophilic design patterns as a sustainable landscape approach. J. Eng. Appl. Sci. 2021, 68, 46. [Google Scholar] [CrossRef]
- Zhong, W.; Schröder, T.; Bekkering, J. Biophilic design in architecture and its contributions to health, well-being, and sustainability: A critical review. Front. Archit. Res. 2022, 11, 114–141. [Google Scholar] [CrossRef]
- Yin, J.; Yuan, J.; Arfaei, N.; Catalano, P.J.; Allen, J.G.; Spengler, J.D. Effects of biophilic indoor environment on stress and anxiety recovery: A between-subjects experiment in virtual reality. Environ. Int. 2020, 136, 105427. [Google Scholar] [CrossRef]
- Russo, A.; Andreucci, M.B. Raising healthy children: Promoting the multiple benefits of green open spaces through biophilic design. Sustainability 2023, 15, 1982. [Google Scholar] [CrossRef]
- Ghaziani, R.; Lemon, M.; Atmodiwirjo, P. Biophilic design patterns for primary schools. Sustainability 2021, 13, 12207. [Google Scholar] [CrossRef]
- Ryan, C.O.; Browning, W.D. Biophilic design. In Sustainable Built Environments; Springer: Berlin/Heidelberg, Germany, 2020; pp. 43–85. [Google Scholar]
- Nery, J.M.F.G.N.; Alves, A.C.N.; Garzedin, A.; Simões, C. Design with nature; Arquitectura y climas; Wasting away; Em busca de uma arquitetura sustentável para os trópicos. RUA Rev. Urban. Arquitetura 2008, 9, 118–123. [Google Scholar]
- Kellert, S.R. Nature by Design: The Practice of Biophilic Design; Yale University Press: New Haven, CT, USA, 2018. [Google Scholar]
- Benvenuti, S. Wildflower green roofs for urban landscaping, ecological sustainability and biodiversity. Landsc. Urban Plan. 2014, 124, 151–161. [Google Scholar] [CrossRef]
- Wallmann-Sperlich, B.; Hoffmann, S.; Salditt, A.; Bipp, T.; Froboese, I. Moving to an “Active” biophilic designed office workplace: A pilot study about the effects on sitting time and sitting habits of office-based workers. Int. J. Environ. Res. Public Health 2019, 16, 1559. [Google Scholar] [CrossRef] [PubMed]
- Hähn, N.; Essah, E.; Blanusa, T. Biophilic design and office planting: A case study of effects on perceived health, well-being and performance metrics in the workplace. Intell. Build. Int. 2021, 13, 241–260. [Google Scholar]
- Nurdiah, E.A. The potential of bamboo as building material in organic shaped buildings. Procedia-Soc. Behav. Sci. 2016, 216, 30–38. [Google Scholar]
- Colding, J.; Giusti, M.; Haga, A.; Wallhagen, M.; Barthel, S. Enabling relationships with nature in cities. Sustainability 2020, 12, 4394. [Google Scholar] [CrossRef]
- Scannell, L.; Gifford, R. The experienced psychological benefits of place attachment. J. Environ. Psychol. 2017, 51, 256–269. [Google Scholar]
- Hashemnezhad, H.; Heidari, A.A.; Mohammad Hoseini, P. Sense of place and place attachment. Int. J. Archit. Urban Dev. 2013, 3, 5–12. [Google Scholar]
- Spence, C. Senses of place: Architectural design for the multisensory mind. Cogn. Res. Princ. Implic. 2020, 5, 46. [Google Scholar] [CrossRef]
- Aristizabal, S.; Byun, K.; Porter, P.; Clements, N.; Campanella, C.; Li, L.; Mullan, A.; Ly, S.; Senerat, A.; Nenadic, I.Z. Biophilic office design: Exploring the impact of a multisensory approach on human well-being. J. Environ. Psychol. 2021, 77, 101682. [Google Scholar]
- Cornelio, P.; Maggioni, E.; Brianza, G.; Subramanian, S.; Obrist, M. SmellControl: The study of sense of agency in smell. In Proceedings of the 2020 International Conference on Multimodal Interaction, Virtual, 25–29 October 2020; pp. 470–480. [Google Scholar]
- Pálsdóttir, A.M.; Spendrup, S.; Mårtensson, L.; Wendin, K. Garden smellscape–experiences of plant scents in a nature-based intervention. Front. Psychol. 2021, 12, 667957. [Google Scholar]
- Lotto, A.; Holt, L. Psychology of auditory perception. Wiley Interdiscip. Rev. Cogn. Sci. 2011, 2, 479–489. [Google Scholar] [PubMed]
- O’Callaghan, C. Against hearing meanings. Philos. Q. 2011, 61, 783–807. [Google Scholar]
- Algargoosh, A.; Soleimani, B.; O’Modhrain, S.; Navvab, M. The impact of the acoustic environment on human emotion and experience: A case study of worship spaces. Build. Acoust. 2022, 29, 85–106. [Google Scholar]
- Ratcliffe, E.; Gatersleben, B.; Sowden, P.T. Associations with bird sounds: How do they relate to perceived restorative potential? J. Environ. Psychol. 2016, 47, 136–144. [Google Scholar]
- Salminen, K.; Surakka, V.; Lylykangas, J.; Raisamo, J.; Saarinen, R.; Raisamo, R.; Rantala, J.; Evreinov, G. Emotional and behavioral responses to haptic stimulation. In Proceedings of the SIGCHI Conference on Human Factors in Computing Systems, Florence, Italy, 5–10 April 2008; pp. 1555–1562. [Google Scholar]
- Eid, M.A.; Al Osman, H. Affective haptics: Current research and future directions. IEEE Access 2015, 4, 26–40. [Google Scholar] [CrossRef]
- Gottschalk, L.A. Quantification and psychological indicators of emotions: The content analysis of speech and other objective measures of psychological states. Int. J. Psychiatry Med. 1974, 5, 587–596. [Google Scholar]
- Eteläpelto, A.; Kykyri, V.-L.; Penttonen, M.; Hökkä, P.; Paloniemi, S.; Vähäsantanen, K.; Eteläpelto, T.; Lappalainen, V. A multi-componential methodology for exploring emotions in learning: Using self-reports, behaviour registration, and physiological indicators as complementary data. Frontline Learn. Res. 2018, 6, 6–36. [Google Scholar] [CrossRef]
- Egger, M.; Ley, M.; Hanke, S. Emotion recognition from physiological signal analysis: A review. Electron. Notes Theor. Comput. Sci. 2019, 343, 35–55. [Google Scholar] [CrossRef]
- Ciuk, D.; Troy, A.; Jones, M. Measuring Emotion: Self-Reports vs. Physiological Indicators. Physiol. Indic. 2015. Available online: https://www.researchgate.net/publication/288664313_Measuring_Emotion_Self-Reports_vs_Physiological_Indicators (accessed on 20 June 2024).
- Franěk, M.; Petružálek, J. Viewing natural vs. urban images and emotional facial expressions: An exploratory study. Int. J. Environ. Res. Public Health 2021, 18, 7651. [Google Scholar] [CrossRef] [PubMed]
- Madrid, J.; Hout, M.C. Eye spy: Why we need to move our eyes to gather information about the world. Front. Young Minds 2018, 6, 71. [Google Scholar] [CrossRef]
- Nishino, K.; Nayar, S.K. The world in an eye [eye image interpretation]. In Proceedings of the 2004 IEEE Computer Society Conference on Computer Vision and Pattern Recognition, CVPR 2004, Washington, DC, USA, 27 June–2 July 2004. [Google Scholar]
- Guarnera, M.; Hichy, Z.; Cascio, M.I.; Carrubba, S. Facial expressions and ability to recognize emotions from eyes or mouth in children. Eur. J. Psychol. 2015, 11, 183. [Google Scholar] [CrossRef] [PubMed]
- Calvo, M.G.; Fernández-Martín, A. Can the eyes reveal a person’s emotions? Biasing role of the mouth expression. Motiv. Emot. 2013, 37, 202–211. [Google Scholar] [CrossRef]
- Barreto, A.; Zhai, J.; Rishe, N.; Gao, Y. Measurement of pupil diameter variations as a physiological indicator of the affective state in a computer user. Biomed. Sci. Instrum. 2007, 43, 146–151. [Google Scholar] [PubMed]
- Hess, E.H.; Polt, J.M. Pupil size as related to interest value of visual stimuli. Science 1960, 132, 349–350. [Google Scholar] [CrossRef] [PubMed]
- Just, M.A.; Carpenter, P.A. The intensity dimension of thought: Pupillometric indices of sentence processing. In Reading and Language Processing; Psychology Press: East Sussex, UK, 2013; pp. 182–211. [Google Scholar]
- Liu, Q.; Zhu, Z.; Zeng, X.; Zhuo, Z.; Ye, B.; Fang, L.; Huang, Q.; Lai, P. The impact of landscape complexity on preference ratings and eye fixation of various urban green space settings. Urban For. Urban Green. 2021, 66, 127411. [Google Scholar]
- Ma, R.; Luo, Y.; Furuya, K. Classifying visually appealing elements in parks using social media data-assisted eye-tracking: Case study of Shinsui parks in Tokyo, Japan. J. Outdoor Recreat. Tour. 2023, 44, 100672. [Google Scholar]
- Liu, Y.; Hu, M.; Zhao, B. Interactions between forest landscape elements and eye movement behavior under audio-visual integrated conditions. J. For. Res. 2020, 25, 21–30. [Google Scholar]
- Norman, D. Emotional Design: Why We Love (or Hate) Everyday Things; Basic books: New York, NY, USA, 2007. [Google Scholar]
- Alaniz, T.; Biazzo, S. Emotional design: The development of a process to envision emotion-centric new product ideas. Procedia Comput. Sci. 2019, 158, 474–484. [Google Scholar] [CrossRef]
- Theodorsson-Norheim, E. Kruskal-Wallis test: BASIC computer program to perform nonparametric one-way analysis of variance and multiple comparisons on ranks of several independent samples. Comput. Methods Programs Biomed. 1986, 23, 57–62. [Google Scholar] [CrossRef] [PubMed]
- Elliott, A.C.; Hynan, L.S. A SAS® macro implementation of a multiple comparison post hoc test for a Kruskal–Wallis analysis. Comput. Methods Programs Biomed. 2011, 102, 75–80. [Google Scholar] [CrossRef] [PubMed]
- Găman, G. Air and water-indispensable elements of curative tourism. Case study: Moineşti, Târgu Ocna, Slănic Moldova. Air Water Compon. Environ./Aerul Apa Compon. Ale Mediu. 2014, 1, 469–476. [Google Scholar]
- Pal, R.; Mukherjee, J.; Mitra, P. How do warm colors affect visual attention? In Proceedings of the Eighth Indian Conference on Computer Vision, Graphics and Image Processing, Mumbai, India, 16–19 December 2012; pp. 1–8. [Google Scholar]
- Neale, C.; Griffiths, A.; Chalmin-Pui, L.S.; Mendu, S.; Boukhechba, M.; Roe, J. Color aesthetics: A transatlantic comparison of psychological and physiological impacts of warm and cool colors in garden landscapes. Wellbeing Space Soc. 2021, 2, 100038. [Google Scholar] [CrossRef]
- Sidhu, S.K.; Allen, H.A.; Keeble, D.R. Eye movements are made to the centre of gravity of texture-defined targets. Vis. Res. 2023, 210, 108264. [Google Scholar]
- Park, J.; Jin, Y.; Lee, S.; Ahn, S. The impact of design representation on visual perception: Comparing eye-tracking data of architectural scenes between photography and line drawing. Arch. Des. Res. 2019, 32, 5–28. [Google Scholar] [CrossRef]
- Plümacher, M. Color perception, color description and metaphor. In Speaking of Colors and Odors; John Benjamins Publishing Company: Amsterdam, The Netherlands, 2007; pp. 61–84. [Google Scholar]
- Avakumovic, F. The Role of Environmental Colour; University of British Columbia: Vancouver, BC, Canada, 1988. [Google Scholar]
- Zhang, J.; Park, S.; Cho, A.; Whang, M. Significant Measures of Gaze and Pupil Movement for Evaluating Empathy between Viewers and Digital Content. Sensors 2022, 22, 1700. [Google Scholar] [CrossRef] [PubMed]
- Böcker, L.; Dijst, M.; Faber, J. Weather, transport mode choices and emotional travel experiences. Transp. Res. Part A Policy Pract. 2016, 94, 360–373. [Google Scholar]
- Luo, T.; Yang, F.; Huang, L.; Min, X. Where goes the homesickness? Contemplation on the results of a comparative study on landscape preference between high school students from Xiamen and Xinjiang. Chin. Landsc. Archit. 2019, 35, 98–103. [Google Scholar]
- Wang, Q.; Wedel, M.; Huang, L.; Liu, X. Effects of model eye gaze direction on consumer visual processing: Evidence from China and America. Inf. Manag. 2018, 55, 588–597. [Google Scholar]
- Winter, B.; Perlman, M.; Majid, A. Vision dominates in perceptual language: English sensory vocabulary is optimized for usage. Cognition 2018, 179, 213–220. [Google Scholar] [CrossRef]
- Sakamoto, M.; Watanabe, J. Exploring tactile perceptual dimensions using materials associated with sensory vocabulary. Front. Psychol. 2017, 8, 250102. [Google Scholar] [CrossRef] [PubMed]
- Huang, W.; Wu, Q.; Dey, N.; Ashour, A.; Fong, S.J.; González-Crespo, R. Adjectives grouping in a dimensionality affective clustering model for fuzzy perceptual evaluation. Int. J. Interact. Multimed. Artif. Intell. 2020, 6, 28–37. [Google Scholar] [CrossRef]
- Schall, J.D.; Thompson, K.G. Neural selection and control of visually guided eye movements. Annu. Rev. Neurosci. 1999, 22, 241–259. [Google Scholar] [CrossRef] [PubMed]
- Emery, N.J. The eyes have it: The neuroethology, function and evolution of social gaze. Neurosci. Biobehav. Rev. 2000, 24, 581–604. [Google Scholar] [CrossRef] [PubMed]
- Schleicher, R.; Galley, N.; Briest, S.; Galley, L. Blinks and saccades as indicators of fatigue in sleepiness warnings: Looking tired? Ergonomics 2008, 51, 982–1010. [Google Scholar] [CrossRef] [PubMed]
- Hao, Q.; Sbert, M.; Feng, Q.; Zhang, J. Entropy Based Analysis of Gaze Fixation Duration. In Proceedings of the 2022 International Joint Conference on Neural Networks (IJCNN), Padua, Italy, 18–23 July 2022; pp. 1–9. [Google Scholar]
- Niemeyer, J.E.; Paradiso, M.A. Contrast sensitivity, V1 neural activity, and natural vision. J. Neurophysiol. 2017, 117, 492–508. [Google Scholar] [CrossRef] [PubMed]
- Negi, S.; Mitra, R. Fixation duration and the learning process: An eye tracking study with subtitled videos. J. Eye Mov. Res. 2020, 13. [Google Scholar] [CrossRef] [PubMed]
- Partala, T.; Surakka, V. Pupil size variation as an indication of affective processing. Int. J. Hum.-Comput. Stud. 2003, 59, 185–198. [Google Scholar] [CrossRef]
- Henderson, R.R.; Bradley, M.M.; Lang, P.J. Emotional imagery and pupil diameter. Psychophysiology 2018, 55, e13050. [Google Scholar]
- Geangu, E.; Hauf, P.; Bhardwaj, R.; Bentz, W. Infant pupil diameter changes in response to others’ positive and negative emotions. PLoS ONE 2011, 6, e27132. [Google Scholar] [CrossRef] [PubMed]
- Babiker, A.; Faye, I.; Prehn, K.; Malik, A. Machine learning to differentiate between positive and negative emotions using pupil diameter. Front. Psychol. 2015, 6, 160374. [Google Scholar] [CrossRef] [PubMed]
- Nakakoga, S.; Higashi, H.; Muramatsu, J.; Nakauchi, S.; Minami, T. Asymmetrical characteristics of emotional responses to pictures and sounds: Evidence from pupillometry. PLoS ONE 2020, 15, e0230775. [Google Scholar] [CrossRef] [PubMed]
- Kim, M.; Barrett, A.; Heilman, K. Lateral asymmetries of pupillary responses. Cortex 1998, 34, 753–762. [Google Scholar] [PubMed]
- Poynter, W.D. Pupil-size asymmetry is a physiologic trait related to gender, attentional function, and personality. Laterality Asymmetries Body Brain Cogn. 2017, 22, 654–670. [Google Scholar] [CrossRef] [PubMed]
- Zeng, G.; Simpson, E.A.; Paukner, A. Maximizing valid eye-tracking data in human and macaque infants by optimizing calibration and adjusting areas of interest. Behav. Res. Methods 2024, 56, 881–907. [Google Scholar] [CrossRef] [PubMed]
- Fichtel, E.; Lau, N.; Park, J.; Henrickson Parker, S.; Ponnala, S.; Fitzgibbons, S.; Safford, S.D. Eye tracking in surgical education: Gaze-based dynamic area of interest can discriminate adverse events and expertise. Surg. Endosc. 2019, 33, 2249–2256. [Google Scholar]
- Lagmay, E.A.D.; Rodrigo, M.M.T. Enhanced Automatic Areas of Interest (AOI) Bounding Boxes Estimation Algorithm for Dynamic Eye-Tracking Stimuli. APSIPA Trans. Signal Inf. Process. 2022, 11, e20. [Google Scholar] [CrossRef]
- Lee, T.H.; Jan, F.-H.; Tseng, C.H.; Lin, Y.F. Segmentation by recreation experience in island-based tourism: A case study of Taiwan’s Liuqiu Island. J. Sustain. Tour. 2018, 26, 362–378. [Google Scholar]
- Huang, T.; He, Q.; Yang, D.; Ouyang, X. Evaluating the impact of urban blue space accessibility on housing price: A spatial quantile regression approach applied in Changsha, China. Front. Environ. Sci. 2021, 9, 696626. [Google Scholar]
- Woods, M. The future of rural places. In The Routledge Companion to Rural Planning; Routledge: London, UK, 2019; pp. 622–632. [Google Scholar]
- Shieh, M.D.; Yeh, Y.E. A comparative study on perceptual evaluations of sports shoe exterior colors in Taiwan. Color Res. Appl. 2015, 40, 178–193. [Google Scholar] [CrossRef]
- Arslan, H.D.; Yıldırım, K. Perceptual Evaluation of Traditional Turkish House Façade. ICONARP Int. J. Archit. Plan. 2021, 9. [Google Scholar] [CrossRef]
- White, M.; Smith, A.; Humphryes, K.; Pahl, S.; Snelling, D.; Depledge, M. Blue space: The importance of water for preference, affect, and restorativeness ratings of natural and built scenes. J. Environ. Psychol. 2010, 30, 482–493. [Google Scholar] [CrossRef]
- Soga, M.; Gaston, K.J.; Yamaura, Y.; Kurisu, K.; Hanaki, K. Both direct and vicarious experiences of nature affect children’s willingness to conserve biodiversity. Int. J. Environ. Res. Public Health 2016, 13, 529. [Google Scholar] [CrossRef]
- Nadkarni, N.M.; Hasbach, P.H.; Thys, T.; Crockett, E.G.; Schnacker, L. Impacts of nature imagery on people in severely nature-deprived environments. Front. Ecol. Environ. 2017, 15, 395–403. [Google Scholar] [CrossRef]
- Kauppinen-Räisänen, H. Strategic use of colour in brand packaging. Packag. Technol. Sci. 2014, 27, 663–676. [Google Scholar] [CrossRef]
- Kret, M.E. The role of pupil size in communication. Is there room for learning? Cogn. Emot. 2018, 32, 1139–1145. [Google Scholar] [CrossRef] [PubMed]
- Hess, E.H. Attitude and pupil size. Sci. Am. 1965, 212, 46–55. [Google Scholar] [CrossRef]
- Florina-Gabriela Mitu, M.B. Consumers’ perception: Discovering the “law of attraction” in art using eye-tracking. Stud. Univ. Babes-Bolyai Negot. 2021, 66, 19–44. [Google Scholar] [CrossRef]
- Ren, H.; Shi, M.; Zhang, J. Research Contents, Methods and Prospects of Emotional Architecture Based on a Systematic Literature Review. Buildings 2024, 14, 997. [Google Scholar] [CrossRef]
Disclaimer/Publisher’s Note: The statements, opinions and data contained in all publications are solely those of the individual author(s) and contributor(s) and not of MDPI and/or the editor(s). MDPI and/or the editor(s) disclaim responsibility for any injury to people or property resulting from any ideas, methods, instructions or products referred to in the content. |
© 2024 by the authors. Licensee MDPI, Basel, Switzerland. This article is an open access article distributed under the terms and conditions of the Creative Commons Attribution (CC BY) license (https://creativecommons.org/licenses/by/4.0/).