Article

A Study on the Thermodynamic Response of Double-Armed Thin-Walled Piers under an FRP Anti-Collision Floating Pontoon Fire

1
National Key Laboratory of Safety and Resilience of Bridge Engineering, China Merchants Chongqing Communications Technology Research and Design Institute Co., Ltd., Chongqing 400067, China
2
School of Civil Engineering, Chongqing Jiaotong University, Chongqing 400074, China
*
Author to whom correspondence should be addressed.
Buildings 2024, 14(7), 1969; https://doi.org/10.3390/buildings14071969
Submission received: 17 May 2024 / Revised: 24 June 2024 / Accepted: 27 June 2024 / Published: 28 June 2024
(This article belongs to the Special Issue Engineering Disaster Prevention and Performance Improvement)

Abstract

:
As a potential fire scenario for bridge structures, the safety impact of an FRP anti-collision floating pontoon fire on bridge structures cannot be ignored. Taking the FRP anti-collision floating pontoon fire that occurred in a continuous rigid-frame bridge as the engineering background, the damage condition of the actual bridge fire scene was first investigated. In addition, FDS 5.3 software was used to simulate the FRP anti-collision floating pontoon fire scenario. Furthermore, the thermal–structural coupling method was used to investigate the thermodynamic response of double-armed thin-walled piers under fire. The results show that the FRP anti-collision floating pontoon fire causes localized concrete carbonization and spalling on the surface of the P2 pier, and the FRP anti-collision floating pontoons are largely destroyed. The fire has the greatest impact on the P2-1 pier, with the highest temperature of 667 °C on the windward side and the highest temperature of 326 °C on the leeward side. The temperature impact range is 6 m above the bearing platform, and the maximum damage depth of pier body concrete is 84.58 mm. The deformation and stress of the P2 pier under fire do not show significant changes and do not exceed the allowable limits for structural deformation and material stress. Therefore, the impact of this fire accident on the structural safety of the continuous rigid-frame bridge is minor. This study’s results provide reliable guidance for the fire safety assessment and post-fire structural repair of the continuous rigid-frame bridge.

1. Introduction

In recent years, bridge–ship collision accidents have occurred frequently, causing varying degrees of damage to bridge structures. Some ship collision accidents have even caused serious consequences such as bridge collapse, resulting in significant economic losses and negative social repercussions [1]. Implementing effective protection against ship collisions on bridge structures is an effective way to prevent direct impact from vessels and drifting objects on bridges [2]. Scholars both domestically and internationally have conducted research on bridge collision protection, proposing various collision prevention facilities such as collision guardrails, collision floating pontoons, gravity-based collision piles, and artificial islands to meet the collision prevention needs of different types of bridge structures [3]. The FRP anti-collision floating pontoon is a type of independent collision prevention facility that mainly relies on the deformation and energy absorption of the outer pontoon and inner lining structure. Its main advantages are good cushioning performance and the ability of the floating pontoon to move up and down with changes in water level, making it suitable for protecting bridges with large water level differences in the bridge area from ship collisions [4]. The outer pontoon of the FRP anti-collision floating pontoon is made of FRP material, while the inner lining structure is made of combustible materials such as polyurethane foam [5]. During the later operation and maintenance process, collision floating pontoons may experience fire accidents due to construction welding, lightning strikes, and collisions with oil-carrying vessels, which should not be overlooked due to their safety impact on bridge pier structures.
Like earthquake, wind, and wave loads, fire as an extreme load may cause fatal damage to bridge structures. Scholars have conducted a large amount of research on the fire resistance of bridge structures to reveal the mechanisms of fire-induced damage, fire resistance performance, and fire protection measures [6,7,8]. Zhang et al. [9] investigated the fire resistance of steel truss–concrete composite bridge girders and studied the spatial distribution properties of temperature when hydrocarbon fires are encountered on the lower and upper parts of the bridge. Zheng et al. [10] analyzed the static and dynamic performances of the bridge under the condition of cable fire damage. Zhang et al. [11] conducted relevant experiments and theoretical research on the fire resistance of prestressed concrete beam bridges and steel beam bridges, revealing the evolution mechanism and failure behavior of bridge fire resistance under oil tanker fires. Du et al. [12] studied the high-temperature heat transfer properties of a cable-supported bridge’s cable components, revealing the high-temperature heat transfer characteristics of cable components and establishing a theoretical model for heat transfer calculation. Kang et al. [13] studied the impact of automobile fires on the stress performance of large-span steel truss arch bridge structures, revealing the structural performance changes in steel truss arch bridges under different fire scenarios through a thermal–structural coupling analysis method. From the perspective of research progress, the current research on the fire resistance of bridge structures mainly focuses on the key load-bearing components of upper structures such as the main girders of beam bridges and cable components of cable-supported bridges. The fire source model used in the research is mainly vehicle fires occurring on bridge decks.
As the main load-bearing member of the bridge structure, it is crucial to reveal the thermodynamic behavior of bridge piers under fire and avoid serious damage or even collapse, etc. The internal filler material of the FRP anti-collision floating pontoon is combustible, and fire accidents may occur during the construction process. The fire temperature of the FRP anti-collision floating pontoon can reach over 600 °C, which is higher than the concrete spalling temperature [14]; therefore, the fire of the FRP anti-collision floating pontoon should be considered as a pier fire scenario. In this regard, this study takes the FRP anti-collision floating pontoon fire accident of a continuous rigid-frame bridge as the engineering background and reveals the thermodynamic response and damage condition of double-armed thin-walled piers under the FRP anti-collision floating pontoon fire, which provides a basis for the safety assessment and repair of bridge piers after fire.

2. Engineering Application

2.1. Design of Collision Avoidance Scheme of Main Pier of Continuous Rigid-Frame Bridge

The main pier of a continuous rigid-frame bridge No. 2~3 adopts the FRP anti-collision floating pontoon for anti-ship collision protection. The peripheral pontoon of the FRP anti-collision floating pontoon is the main anti-collision, energy dissipation structure, and buoyancy balance structure of the pier to prevent ship impact. The octagonal column shell lined with the FRP anti-collision floating pontoon is the impact buffer and support transmission-weakening member in direct contact between the pontoon and pier. The FRP anti-collision floating pontoon is connected to the pier by its lined octagonal column shell member, which has weak contact in daily operation. When the floating pontoon is hit, it will have strong contact with the pier surface. The floating pontoon is connected by a dovetail groove socket and self-locking. The structural dimensions of the FRP anti-collision floating pontoon of the P2 pier of the continuous rigid-frame bridge are shown in Figure 1.
The FRP collision-resistant floating pontoon absorbs energy by deforming through the outer pontoon and inner filling material when impacted by drifting objects such as ships, thereby dissipating the energy of the collision. The FRP anti-collision floating pontoon has three energy dissipation modes: the first mode is the energy dissipation of the outer pontoon structure, the second mode is the energy dissipation of the inner lining shell component, and the third mode is the energy dissipation of the flow resistance of water inside and outside the floating pontoon. Among them, the energy dissipation of the outer pontoon structure accounts for the highest proportion, reaching about 50% of the total energy dissipation. Through tripartite energy dissipation, the kinetic energy of the ship colliding with the bridge pier is reduced, thereby reducing the impact force borne by the pier.

2.2. The Scene Inspection of the FRP Anti-Collision Floating Pontoon

In the maintenance process of the FRP anti-collision floating pontoon of the continuous rigid-frame bridge’s P2 pier, an electric welding fire occurred. The main combustible materials in the fire were the float pontoon itself and the construction repair materials (Ashland vinyl ester resin). The fire lasted for approximately 2 h. After the fire broke out, water sprinklers were first used to extinguish the fire, followed by foam extinguishing to eliminate the source of the fire, and finally water sprinklers were used to cool down. The ignition point of the fire was in the middle section of the rear pontoon of the collision-resistant float pontoon, and the fire spread to the front pontoon and middle pontoon of the float pontoon, accompanied by a large amount of thick smoke. The inspection of the fire scene indicated that the collision-resistant float pontoon of the P2 pier was severely damaged and deformed, with the concrete surface of the P2 pier showing varying degrees of cracking, spalling, and exposed steel bars, corresponding to the damaged areas and the range of float pontoon burning. Based on the fire process, the condition of residual materials at the scene, and the extent of damage to the appearance of structural components, it can be concluded that the affected area of this fire accident mainly includes all four surfaces of the P2-1 pier and surfaces A, B, and D of the P2-2 and P2-3 piers, as shown in Figure 1.
On-site, a drone was used to film and investigate the overall appearance of the P2 pier and its anti-collision floating pontoon. The drone captured the scene of the collision float catching fire, the burn damage to the P2 pier, and the collision floats after the fire, as shown in Figure 2.

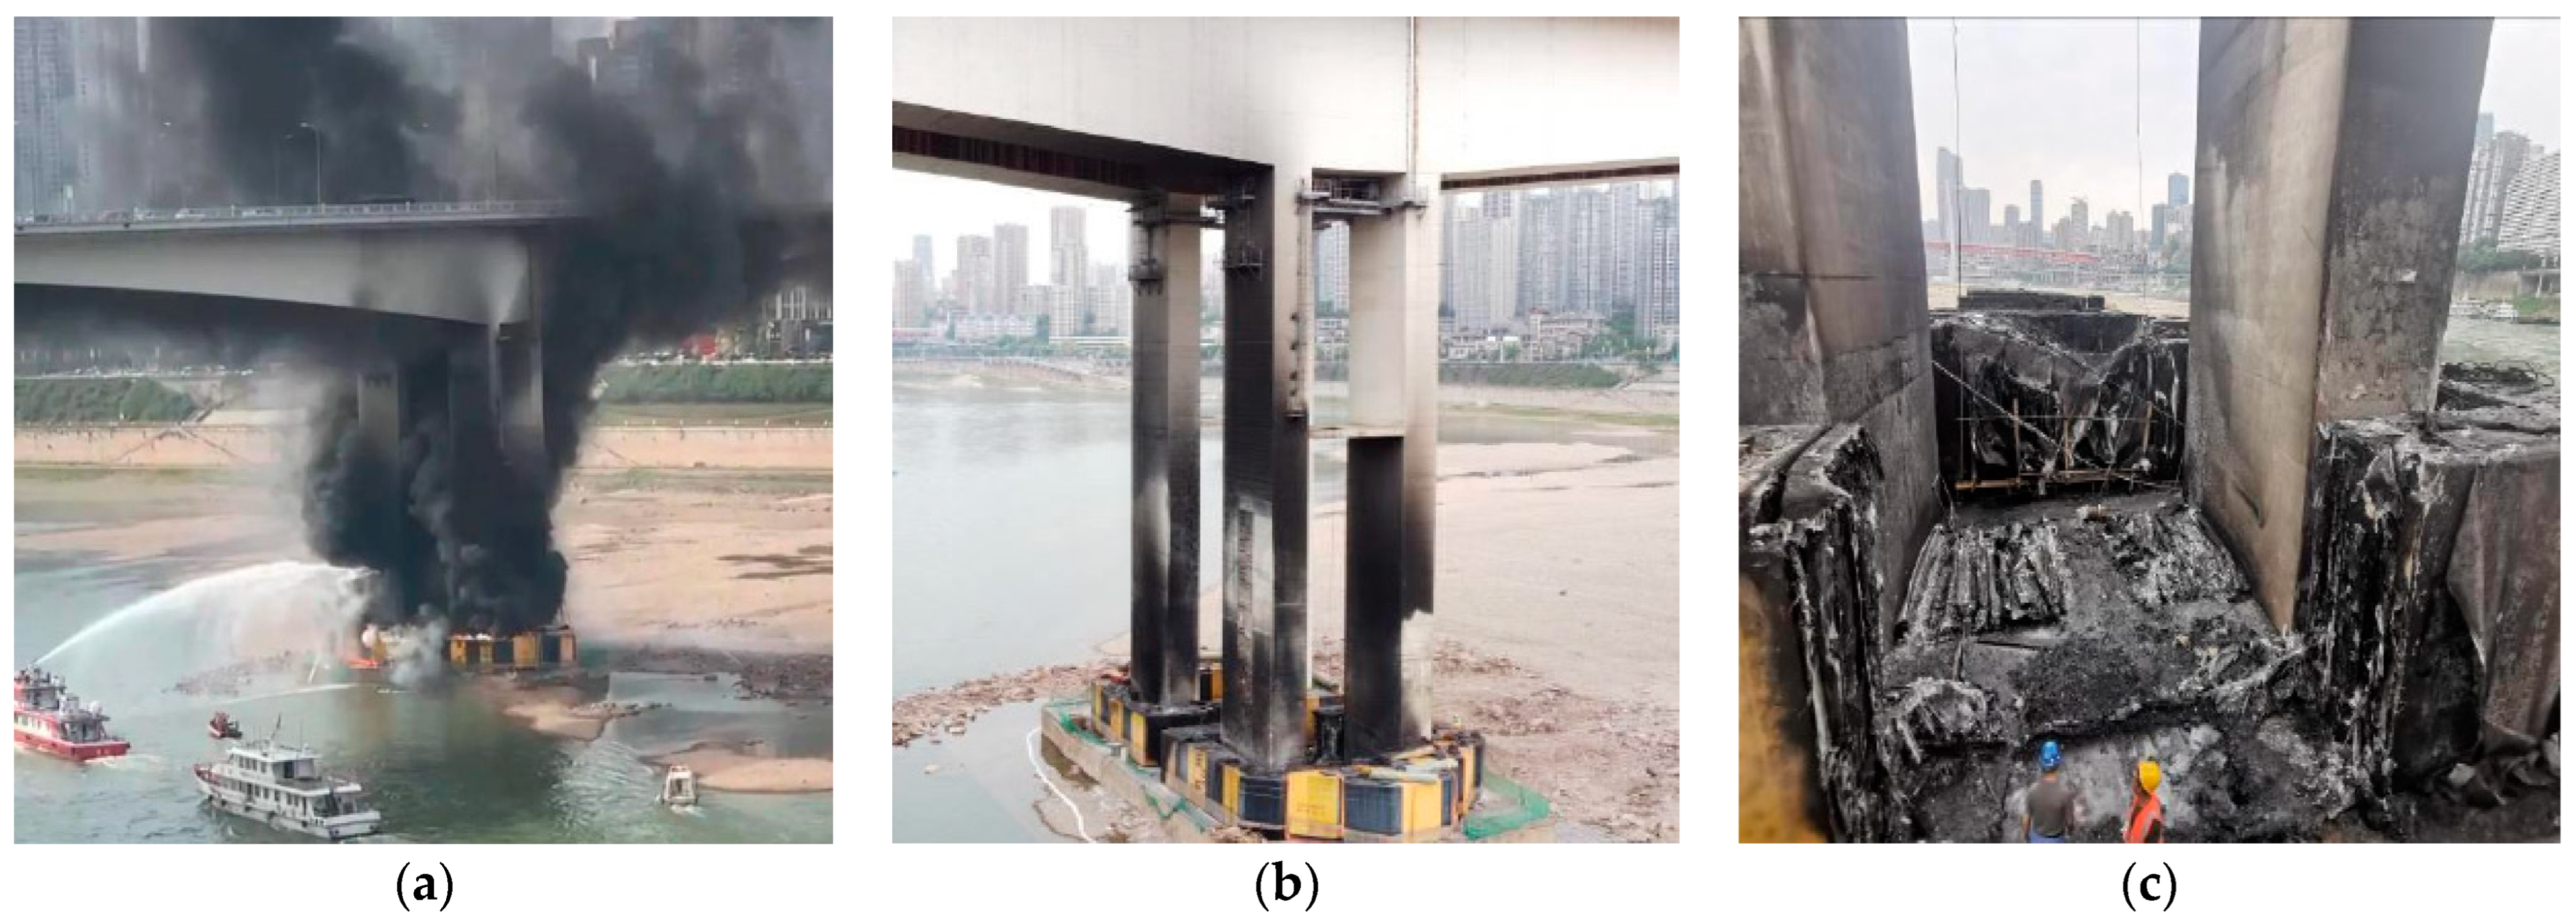
2.3. Post-Fire Damage to Bridge Piers

After the fire, the inspection of the bridge pier damage revealed the surface concrete spalling in the area affected by the fire on the P2 pier. In order to determine the thickness of the concrete damage caused by the fire, the surface of the fire-affected concrete was tapped and chiseled until fresh concrete was uncovered. The depth from the original concrete surface to the fresh concrete surface was measured to determine the depth of fire damage to the bridge pier surface. The inspection results are shown in Table 1.
From Table 1, it can be seen that the FRP anti-collision floating pontoon fire caused the maximum carbonization depth of concrete for the P2-1, P2-2, and P2-3 piers to be 1.92, 5.0, and 2.17 mm, respectively, and the maximum concrete spalling thickness to be 84.0, 30.0, and 80.0 mm, respectively. The concrete fire damage depth is defined as the sum of the concrete carbonization depth and spalling thickness. Therefore, the concrete damage thicknesses for the P2-1, P2-2, and P2-3 piers caused by the fire are 84.58, 35.0, and 80.58 mm, respectively. The results indicate that the fire damages to the P2-1 and P2-3 piers are the most severe, while the damage to the P2-2 pier is relatively minor, and the P2-4 pier is not affected by the fire. Since the dimensions of the P2-1, P2-2, P2-3, and P2-4 piers are the same, the subsequent analysis mainly focuses on the thermodynamic response of the P2-1 pier, which suffered the most severe fire damage in the FRP anti-collision floating pontoon fire.

3. Simulation of Fire Scene for FRP Anti-Collision Floating Pontoon

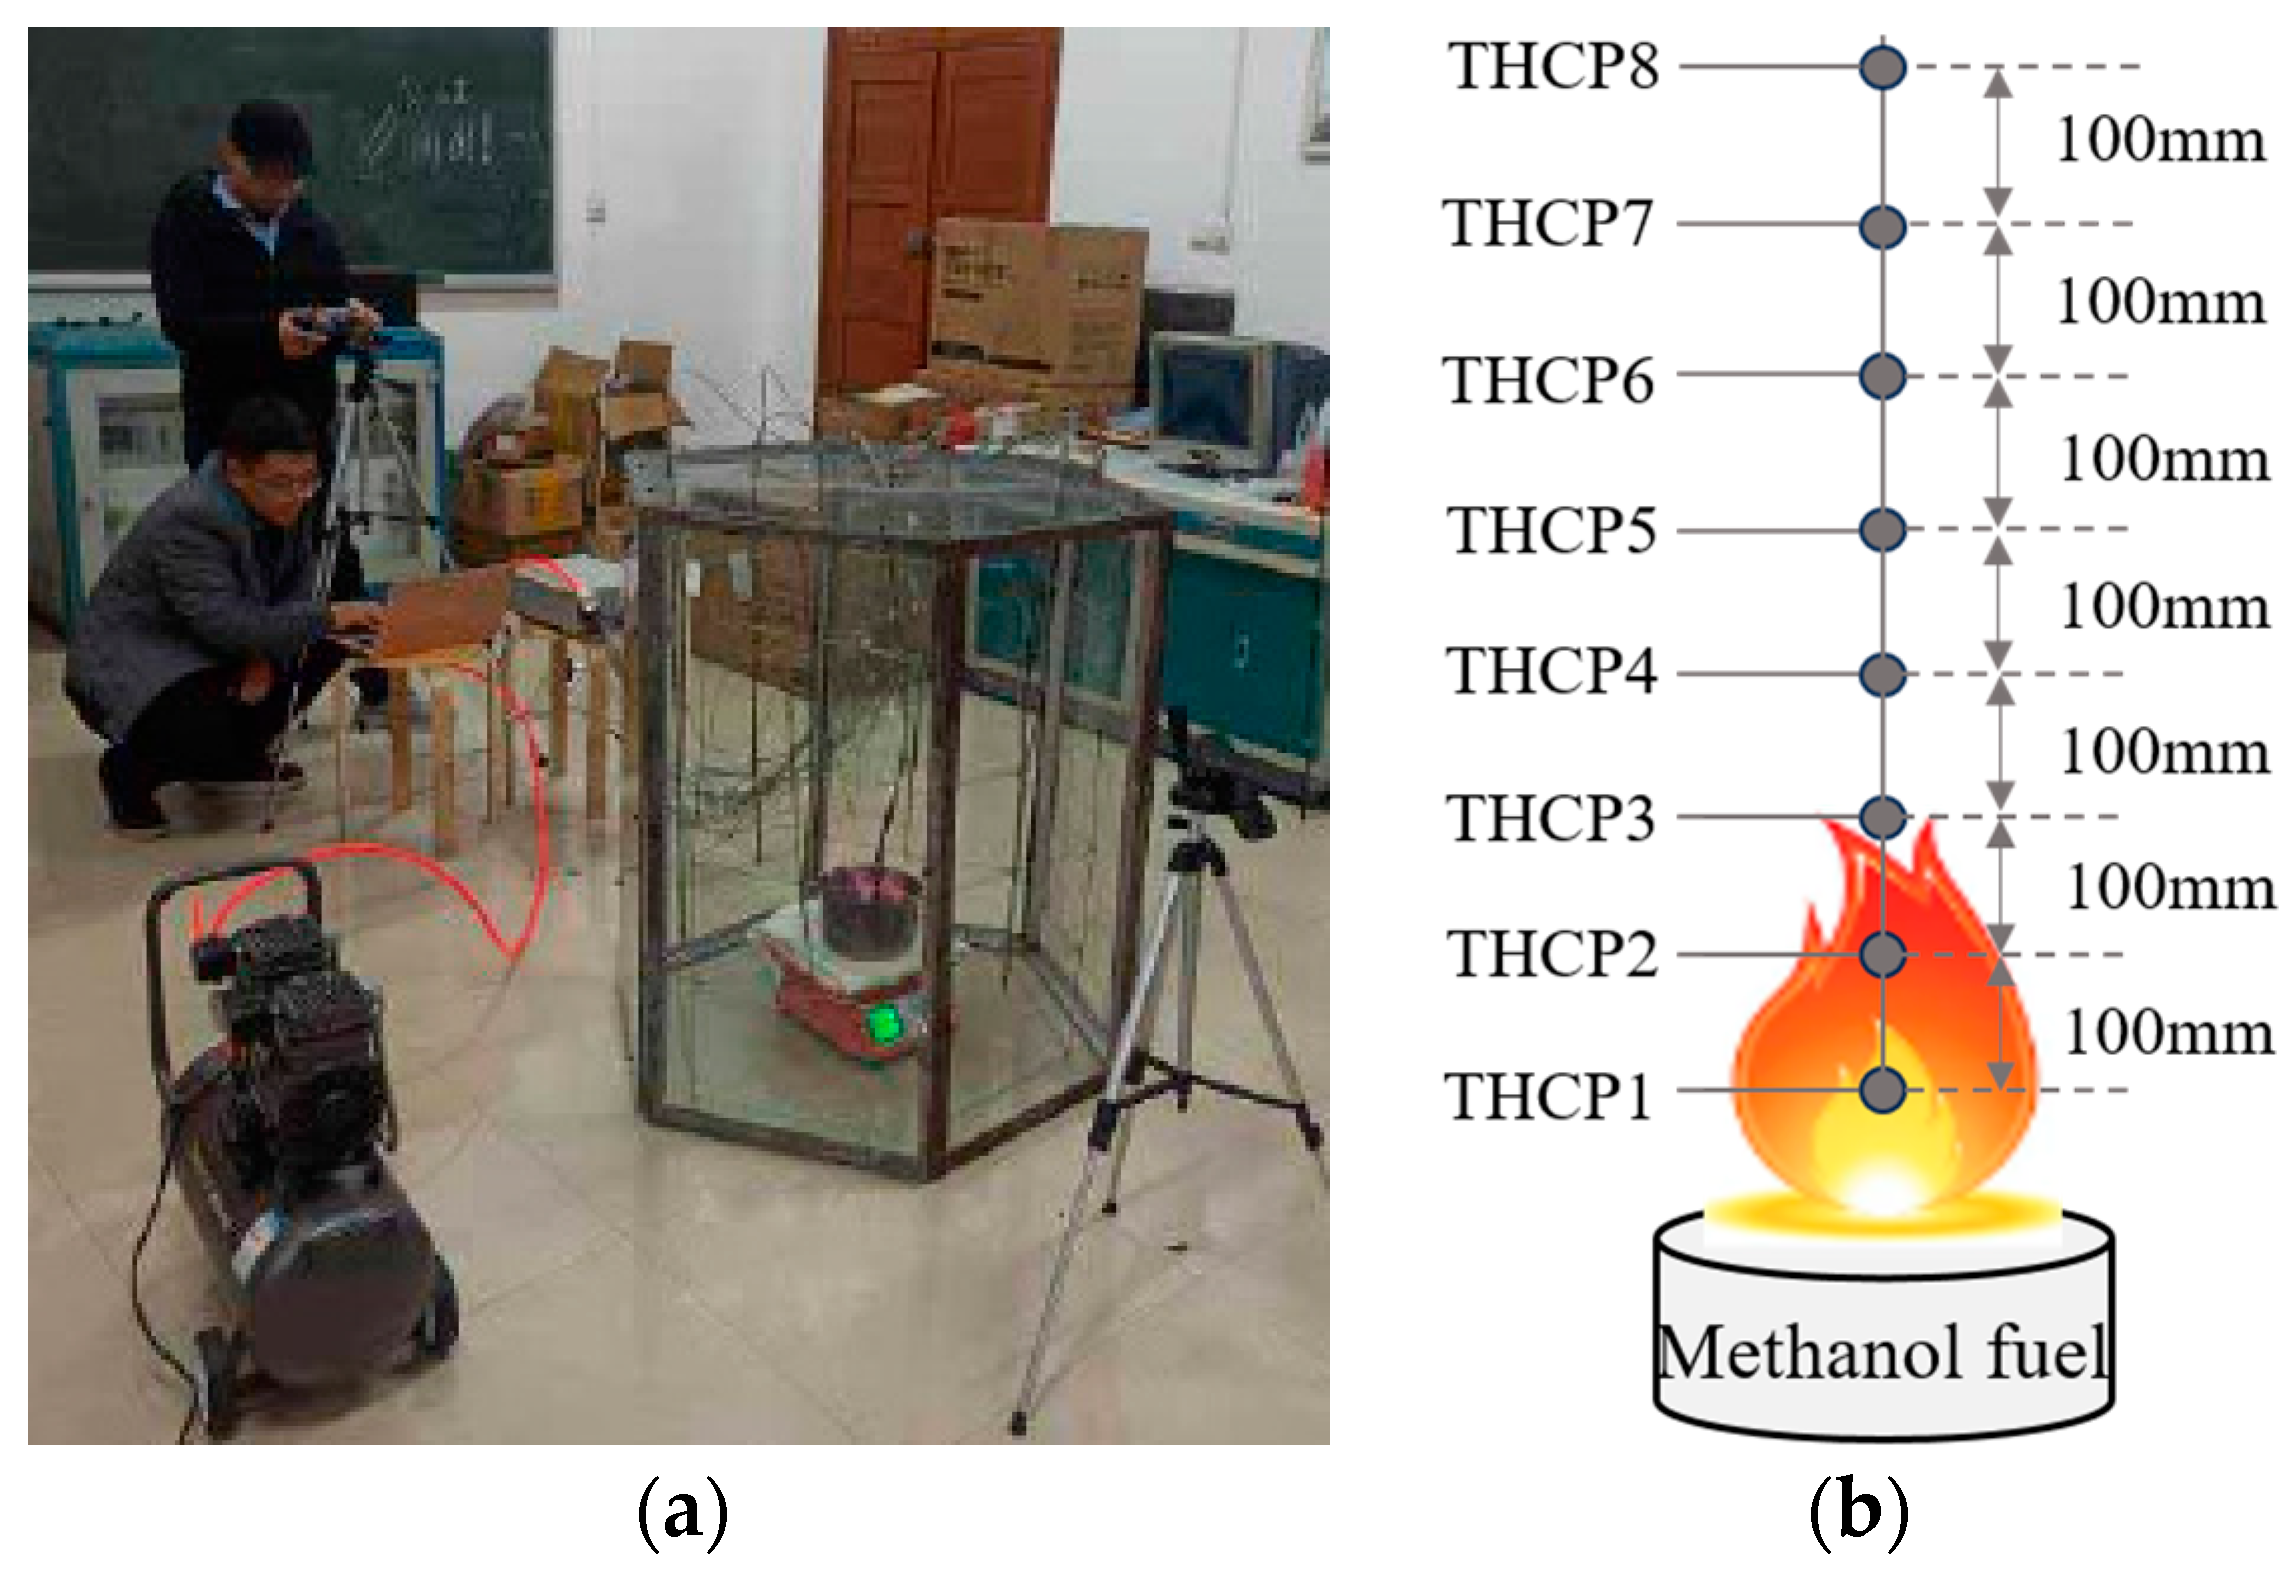
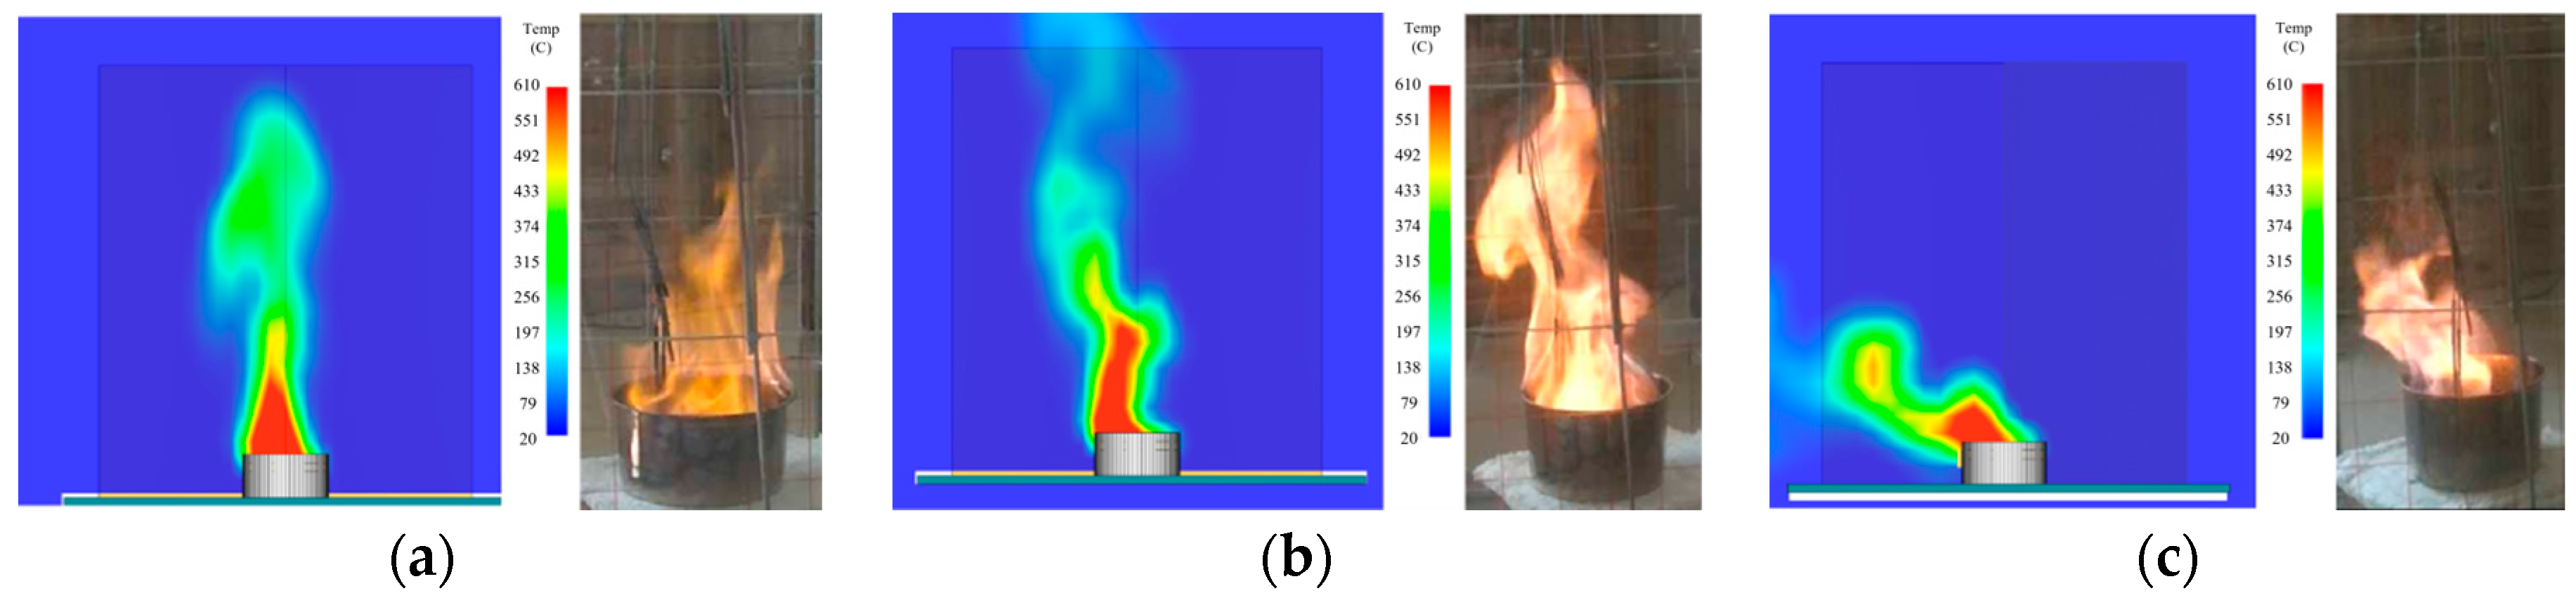
3.1. Numerical Simulation Verification of FDS

To simulate the fire burning scene of the FRP anti-collision floating pontoon on the P2 pier of the continuous rigid-frame bridge, the FDS 5.3 (Fire Dynamics Simulator) software is used to establish a CFD calculation model for the combustion of the FRP anti-collision floating pontoon. First, the accuracy of the FDS fire simulation is verified using the fire test conducted in the literature. Jiang et al. [15] designed an experimental device with a side length of 500 mm and a height of 1000 mm in the shape of a regular hexagonal prism. A stainless steel oil tank with a diameter of 200 mm and a height of 100 mm was used as the central fire source, and the fuel used was methanol gasoline. The experimental device used industrial heat-resistant glass as the wall, with one group of opposite sides and the top open for ventilation convenience. Eight thermocouples were installed along the height direction of the fire source, with a spacing of 100 mm, to measure the temperature distribution along the height direction. The experiment tested the temperature field distribution of methanol gasoline combustion under wind speeds ranging from 0.1 to 4 m/s, and the experimental site is shown in Figure 3.
Using FDS to establish a CFD calculation model for methanol gasoline combustion that is identical to the literature experiment, the mesh boundaries of the model are set at 0.8 × 1.36 × 1.2 m. In order to balance computational accuracy and efficiency, multiple-zone mesh divisions are applied in the spatial domain, with an increased density of mesh near the key fire positions. Specifically, the mesh size near the fire source is set at 0.01 m, while other positions are set at 0.02 m. The total number of meshes is 9.71 × 10⁵. Based on the experimental conditions, the heat release rate of the methanol gasoline combustion model is set at 8.1719 kW. Since the fuel mass in the experiment is constant, a fuel-controlled exponential growth model is used as the heat release rate growth function. The top surface of the calculation model is set as an open boundary, a pair of side surfaces are set as vent boundaries, and the remaining side surfaces are set as close boundaries, consistent with the experimental conditions. The wind speed is set from 0.1 to 4.0 m/s. The calculation model is shown in Figure 4.
CFD calculations are conducted to investigate the combustion of methanol gasoline and gas flow characteristics under different wind speeds. The CFD calculations under wind speeds of 0.1 m/s, 1.0 m/s, and 3.0 m/s are compared with experimental test results, as shown in Figure 5.
As shown in Figure 5, the combustion and smoke flow patterns of methanol gasoline obtained by CFD calculation are basically consistent with the experimental results, and the overall pattern is as follows: Under approximately no wind conditions (wind speed of 0.1 m/s), the smoke from the fire source mainly flows in the vertical direction, and the temperature distribution of the fire source is also in the vertical direction. Under certain wind conditions (wind speed of 1.0 m/s and 3.0 m/s), the smoke from the fire source mainly flows in the direction of wind speed, and the temperature distribution of the fire source is also influenced by the wind speed. In order to further verify the accuracy of the FDS calculation results, a comparison is made using a wind speed of 3 m/s, as shown in Figure 6.
It can be seen from Figure 6 that the temperature rise curves of different measuring points calculated by the FDS 5.3 software are in good agreement with the experimental results. In addition, when the heat release rate of the fire source reaches its maximum (around 200 s of combustion time), the maximum temperature difference between the CFD calculation results and the test results is about 50 °C, with a temperature difference rate of approximately 8.3%. This indicates that using FDS 5.3 software to simulate the fire source combustion process has sufficient calculation accuracy.

3.2. CFD Calculation Model for Fire Combustion

To simulate the fire and combustion scene of the FRP anti-collision floating pontoon on a continuous rigid-frame bridge pier, the FDS 5.3 software is used to establish a CFD calculation model for the combustion of the FRP anti-collision float pontoon, as shown in Figure 7. Based on the field investigation of the fire scene, the downstream side of the FRP anti-collision floating pontoon is more severely damaged and has a greater impact on the downstream of the P2 pier. Therefore, the downstream of the P2-1 and P2-2 piers is selected as the research object. Since the lower part of the bearing platform of the P2 pier is buried in the soil, the heights of the P2-1 and P2-2 piers are set at 35 m above the bearing platform (approximately the distance from the bearing platform to the top of the pier). The dimensions of the bridge pier and the FRP anti-collision floating pontoon are shown in Figure 1. The bridge pier is made of concrete, and the main material parameters are as follows: a density of 2280 kg/m³, specific heat capacity of 1.04 kJ/(kg K), thermal conductivity of 1.8 W/(mK), and radiation coefficient of 0.9 [16]. The FRP anti-collision floating pontoon is made of polyurethane rigid foam, and the main material parameters are as follows: a density of 28 kg/m³, specific heat capacity of 1.7 kJ/(kg K), thermal conductivity of 0.05 W/(mK), and radiation coefficient of 0.9 [17].
According to the size of the model, the mesh space is set as 22 × 22 × 40 m, and the mesh size is set as 0.5 m. The number of computational model units is 151,008. The top and side surfaces of the mesh space are set as open boundary conditions to simulate an open burning environment at the fire scene. Sixteen thermocouples are installed along the height direction of the P2-1 and P2-2 piers to monitor the temperature rise and distribution along the height direction of the P2 pier during the burning process of the FRP anti-collision floating pontoon. Considering the worst-case fire scenario, the entire top surface of the FRP anti-collision floating pontoon is set as the fire surface, and the combustion reaction follows the polyurethane reaction in the database, which is applicable to the combustion process of polyurethane materials. The fire heat release rate is an important indicator reflecting the severity of fire combustion. Hyeong et al. [18] determined the growth pattern of the fire heat release rate for polyurethane materials through experiments, and the results showed that the heat release rate of polyurethane materials increases according to a square exponential function, with a maximum heat release rate of 3004 kW. Therefore, this study adopts these test results to define the fire heat release rate function and maximum heat release rate of the FRP anti-collision floating pontoon.

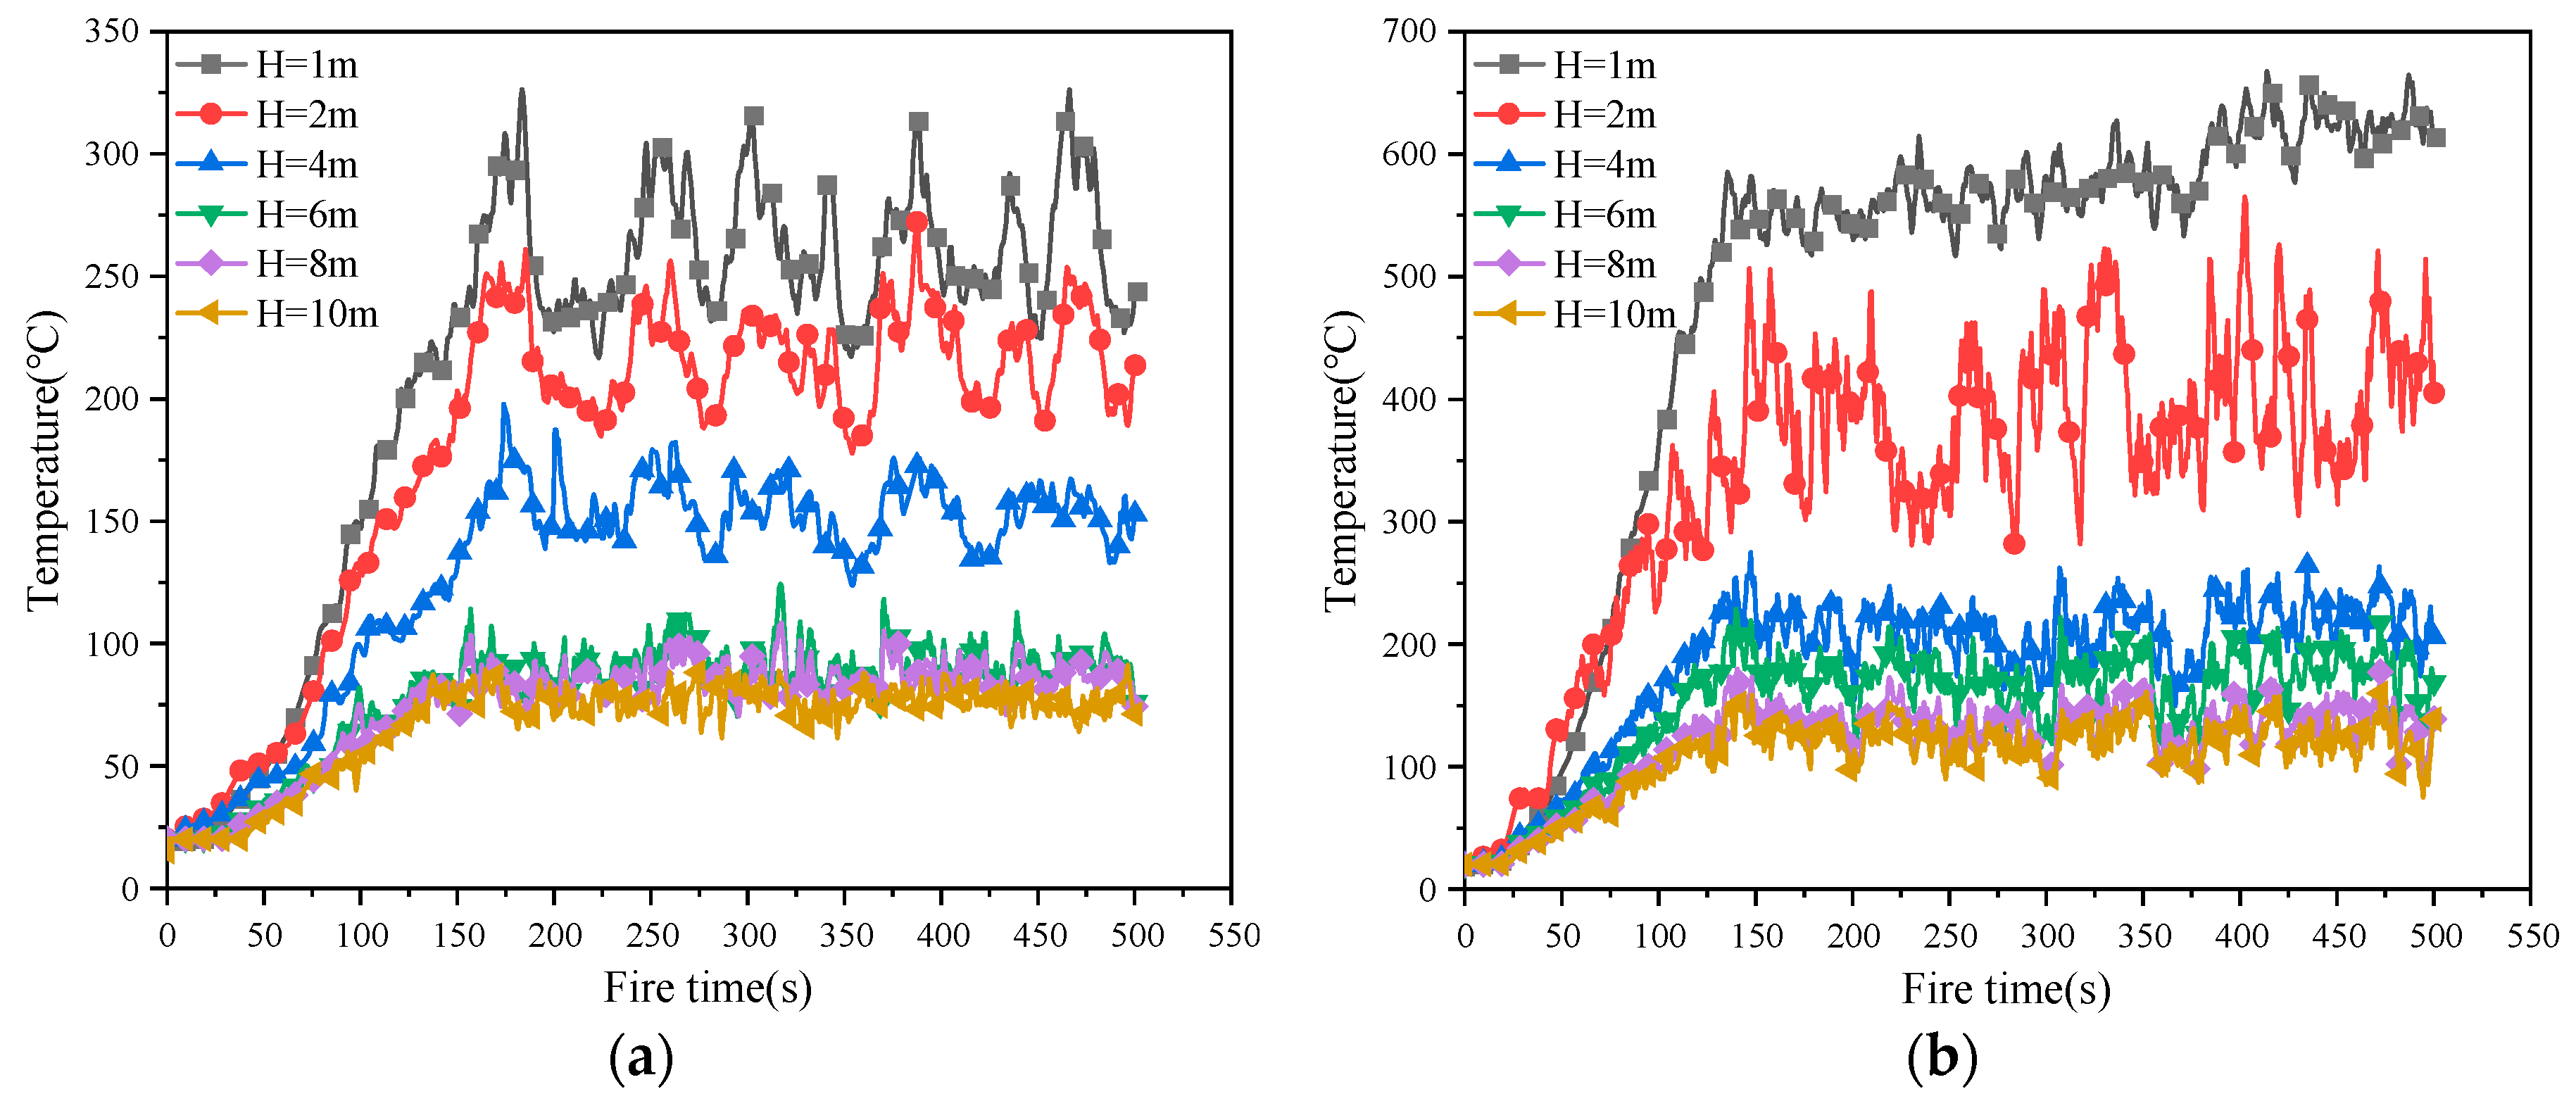
3.3. The Transient Temperature Distribution of the Fire Space

The transient temperature distribution of the FRP anti-collision floating pontoon in the event of a fire is calculated using FDS software and compared with the actual fire scene, as shown in Figure 8. The calculation was performed for a duration of 500 s, which simulated both the growth and steady stages of the fire in the FRP anti-collision floating pontoon, without considering the decay stage of the fire. From Figure 8, it can be observed that the temperature of the FRP anti-collision floating pontoon fire can reach 750 °C, causing the temperature on the surface of the P2 pier to exceed 650 °C. Research on the high-temperature spalling of concrete indicates that concrete is prone to spalling when the surface temperature is in the range of 200~500 °C. Therefore, it can be concluded that the FRP anti-collision floating pontoon fire can result in the spalling and peeling of the concrete of the P2 pier, and thus, the damage caused by the fire cannot be ignored. Taking 300 °C as the critical temperature for concrete spalling, it is determined that the FRP anti-collision floating pontoon fire causes concrete spalling in an area above the fire surface within a range of 6 m. The spalling mainly occurs on the A, B, and D surfaces of the P2-1 pier, while the inner C surface is minimally affected. Additionally, the CFD simulation results are consistent with the on-site detection results, demonstrating that the FDS software can accurately simulate the fire scenario of a continuous rigid-frame bridge with an FRP anti-collision floating pontoon.
The temperature rise process along the height direction of the P2-1 pier is tested by a thermocouple, with the thermocouple arranged on the surface and interior of the P2-1 pier. The calculation is considered under the worst-case fire scenario; that is, the entire top surface of the FRP anti-collision floating pontoon is set as the fire surface. The temperature rise pattern on the A, B, and D surfaces of the P2-1 pier is basically the same, and there are significant differences in the temperature rise pattern on the C surface. Therefore, the temperature rise process on the C and D surfaces of the P2-1 pier is plotted. The temperature rise processes at 1 m, 2 m, 4 m, 6 m, 8 m, and 10 m along the height direction of the P2-1 pier are calculated and shown in Figure 9.
From Figure 9, it can be seen that the temperature rise pattern of different measuring points on the surface of the P2-1 pier are basically the same, with the temperature reaching its peak at around 150 s after being exposed to fire and then fluctuating near the peak. Comparing the temperature rise curves of different surfaces of the P2-1 pier, it can be concluded that the temperature of surface D is significantly higher than that of surface C. This is because surface D is the front surface facing directly towards the fire, while surface C is on the back side shielded by the pier leg and thus has a lower temperature. The highest temperatures on both surfaces C and D are located approximately 1 m above the fire surface, which is coincident with the flame height of the FRP anti-collision floating pontoon fire. Comparing the temperature rise curves at different measuring points, it can be noted that as the height increases, the temperature gradually decreases. To reflect the temperature distribution gradient along the height direction of the P2-1 pier, the variation curve of the highest temperature at each measuring point with height is plotted, as shown in Figure 10.
According to Figure 10, the highest temperatures at different measuring points on surface D of the P2-1 pier are 667 °C, 565 °C, 275 °C, 228 °C, 180 °C, and 161 °C, respectively, while the highest temperatures at different measuring points on surface C of the P2-1 pier are 326 °C, 272 °C, 198 °C, 124 °C, 108 °C, and 91 °C, respectively. This indicates that when the height reaches 6 m, the maximum temperature on the surface of the P2-1 pier does not exceed 250 °C, which is below the temperature at which concrete is susceptible to cracking. That is, the impact range of the FRP anti-collision floating pontoon fire on the P2 pier is approximately 6 m. Therefore, in the subsequent thermodynamic response analysis of the P2 pier of the continuous rigid-frame bridge under the FRP anti-collision floating pontoon fire, the analysis can be conducted under the most unfavorable conditions, where the temperature load is taken as the temperature rise process at a location 1 m above the fire surface of the FRP anti-collision floating pontoon, and the temperature load range is taken as the range above the fire surface of the FRP anti-collision floating pontoon up to 6 m.

4. The Thermal Characteristics and Mechanical Response of the Bridge Pier under Fire

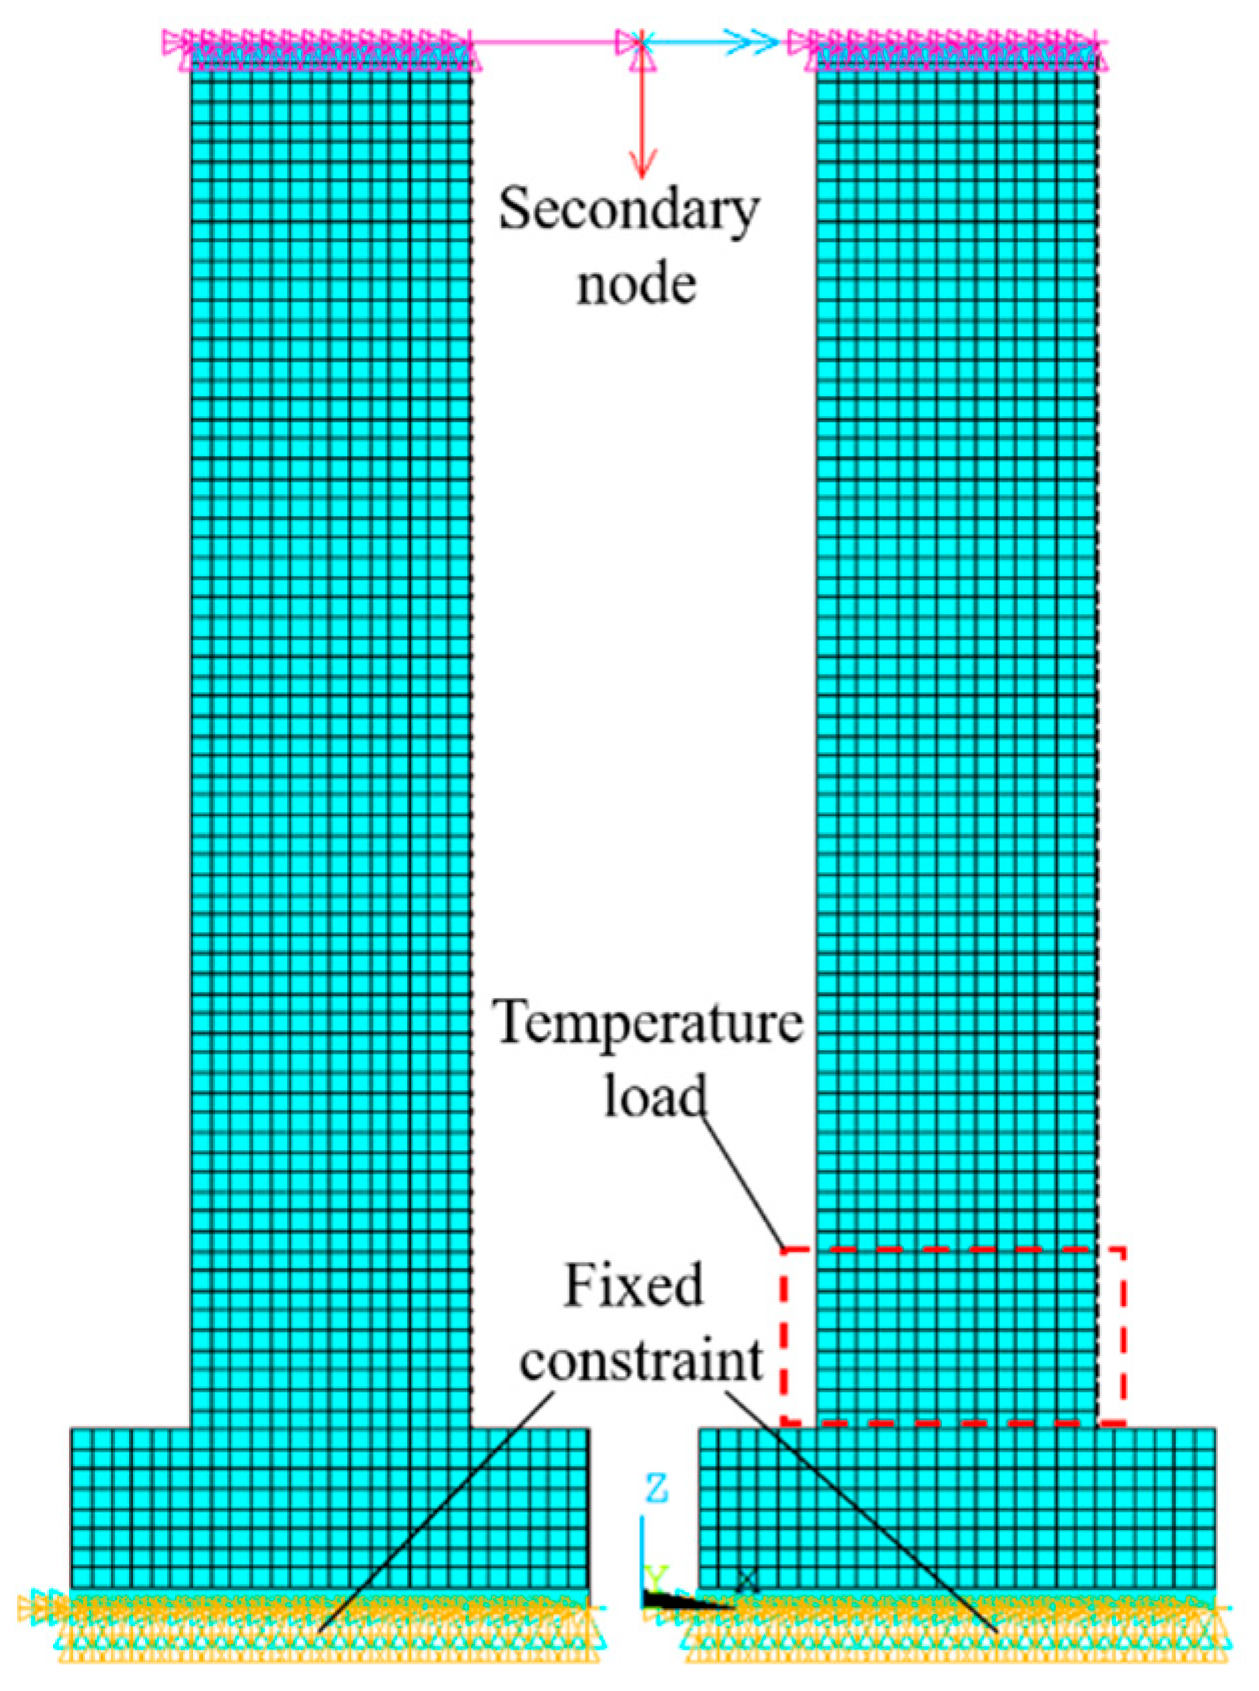
4.1. The Thermal–Structural Coupling Calculation Model of the Bridge Pier

A numerical calculation model of the P2 pier of the continuous rigid-frame bridge is established using ANSYS 17.0 software, as shown in Figure 11. The calculation model uses SOLID70 elements for thermal analysis and SOLID185 elements for structural analysis. The temperature load range for thermal analysis is set at 6 m above the bearing platform, and the load size is determined by the temperature rise process at the H = 1 m measuring point in Section 3.3. For structural analysis, the load is taken as the load transmitted by the upper structure to the pier top and the weight of the pier itself. The pier top internal forces under the condition of the completed bridge are calculated using Midas Civil 2022 software. The load is mainly considered as dead load (self-weight + second phase) and live load (vehicle load + crowd load + temperature load), and the load combination is based on the ultimate limit state of bearing capacity. The axial force, shear force, and bending moment at the top of the P2 pier under the completed bridge state are calculated to be 74,991 kN, 1411 kN, and 31,614 kN·m, respectively. An auxiliary node is established at the pier top, and the ‘*CERIG’ command is used to form a rigid domain between the auxiliary node and the pier top node. The internal forces of the completed bridge are applied to the auxiliary node to avoid stress concentration at the pier top.
The boundary constraints of the computational model are as follows: since the bearing platform of the P2 pier is embedded in the soil, a fixed boundary constraint is adopted for the bottom surface of the bearing platform. The material of the P2 pier is C50 concrete, and the thermal parameters of the concrete mainly include the convective coefficient, radiation rate, thermal conductivity coefficient, specific heat capacity, and thermal expansion coefficient. The mechanical parameters of concrete mainly include stress–strain curves, elastic modulus, and Poisson’s ratio. High temperature can affect the material performance, and the high temperature nonlinearity of concrete material is considered in this calculation. The values of the above thermodynamic parameters are determined according to the experimental results of Lie or specifications [19,20], and the functional relationship between the thermodynamic parameters and temperature is described in [21], which is not repeated in this study. The specific values of thermodynamic parameters are shown in Table 2.
Specific heat capacity:
C ( θ ) = 900 + 80 × θ 120 4 × θ 120
Conduction coefficient:
λ θ = 1.355 0     θ     293   ° C 0.001241 θ + 1.7162 θ θ > 293   ° C
Thermal expansion coefficient:
α θ = 0.008 θ + 6 × 10 6
In these, λ(θ) is the conduction coefficient of concrete at high temperatures; C(θ) is the specific heat capacity of concrete at high temperatures; α(θ) is the thermal expansion coefficient of concrete at high temperatures.

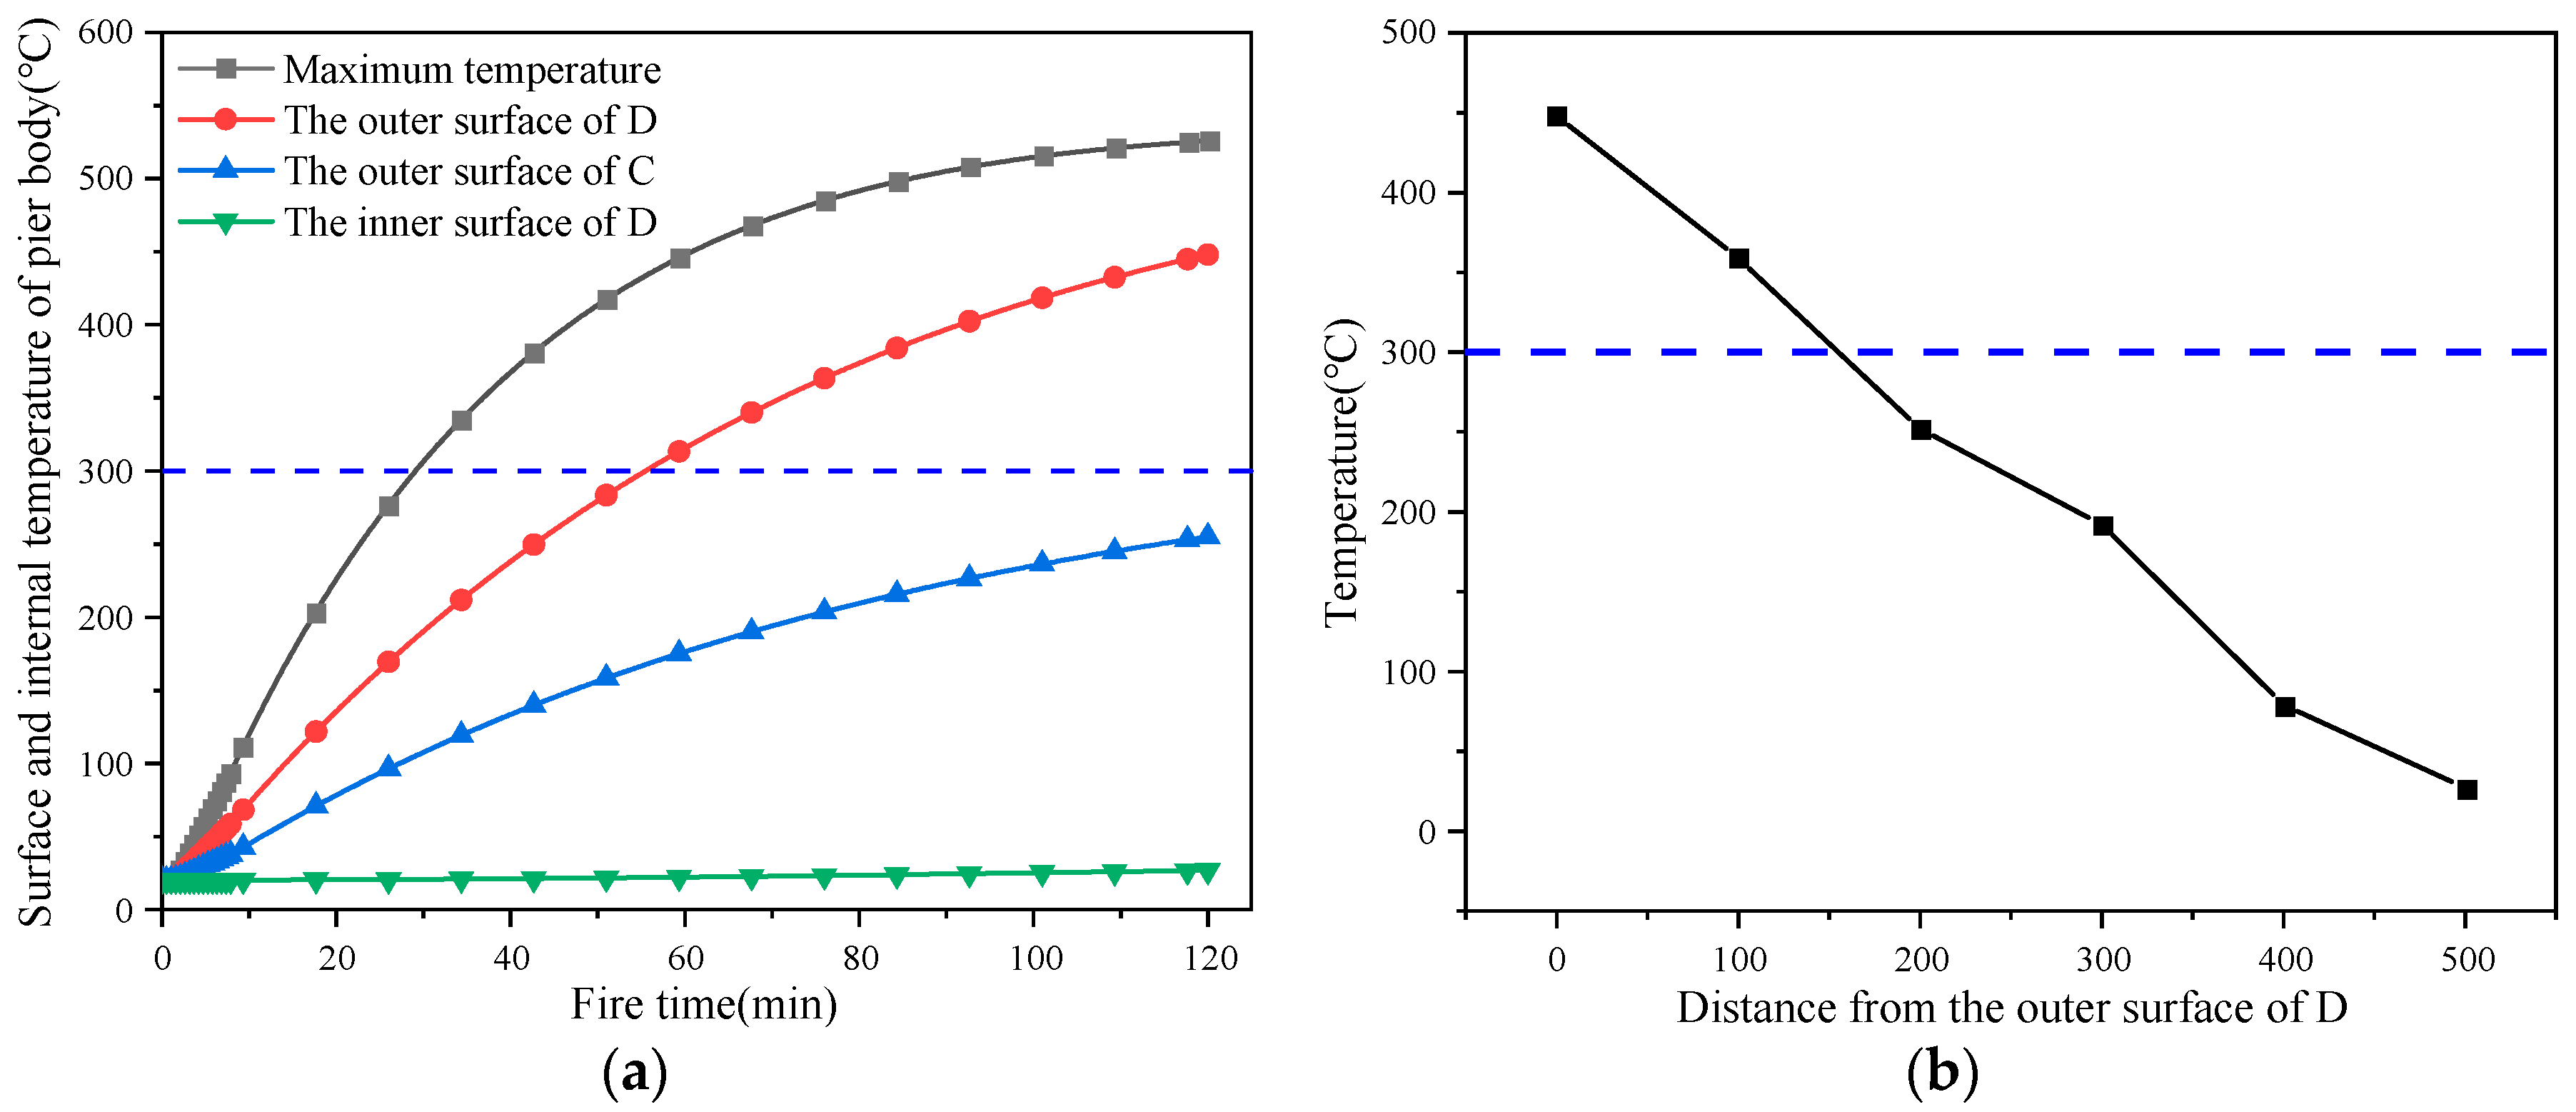
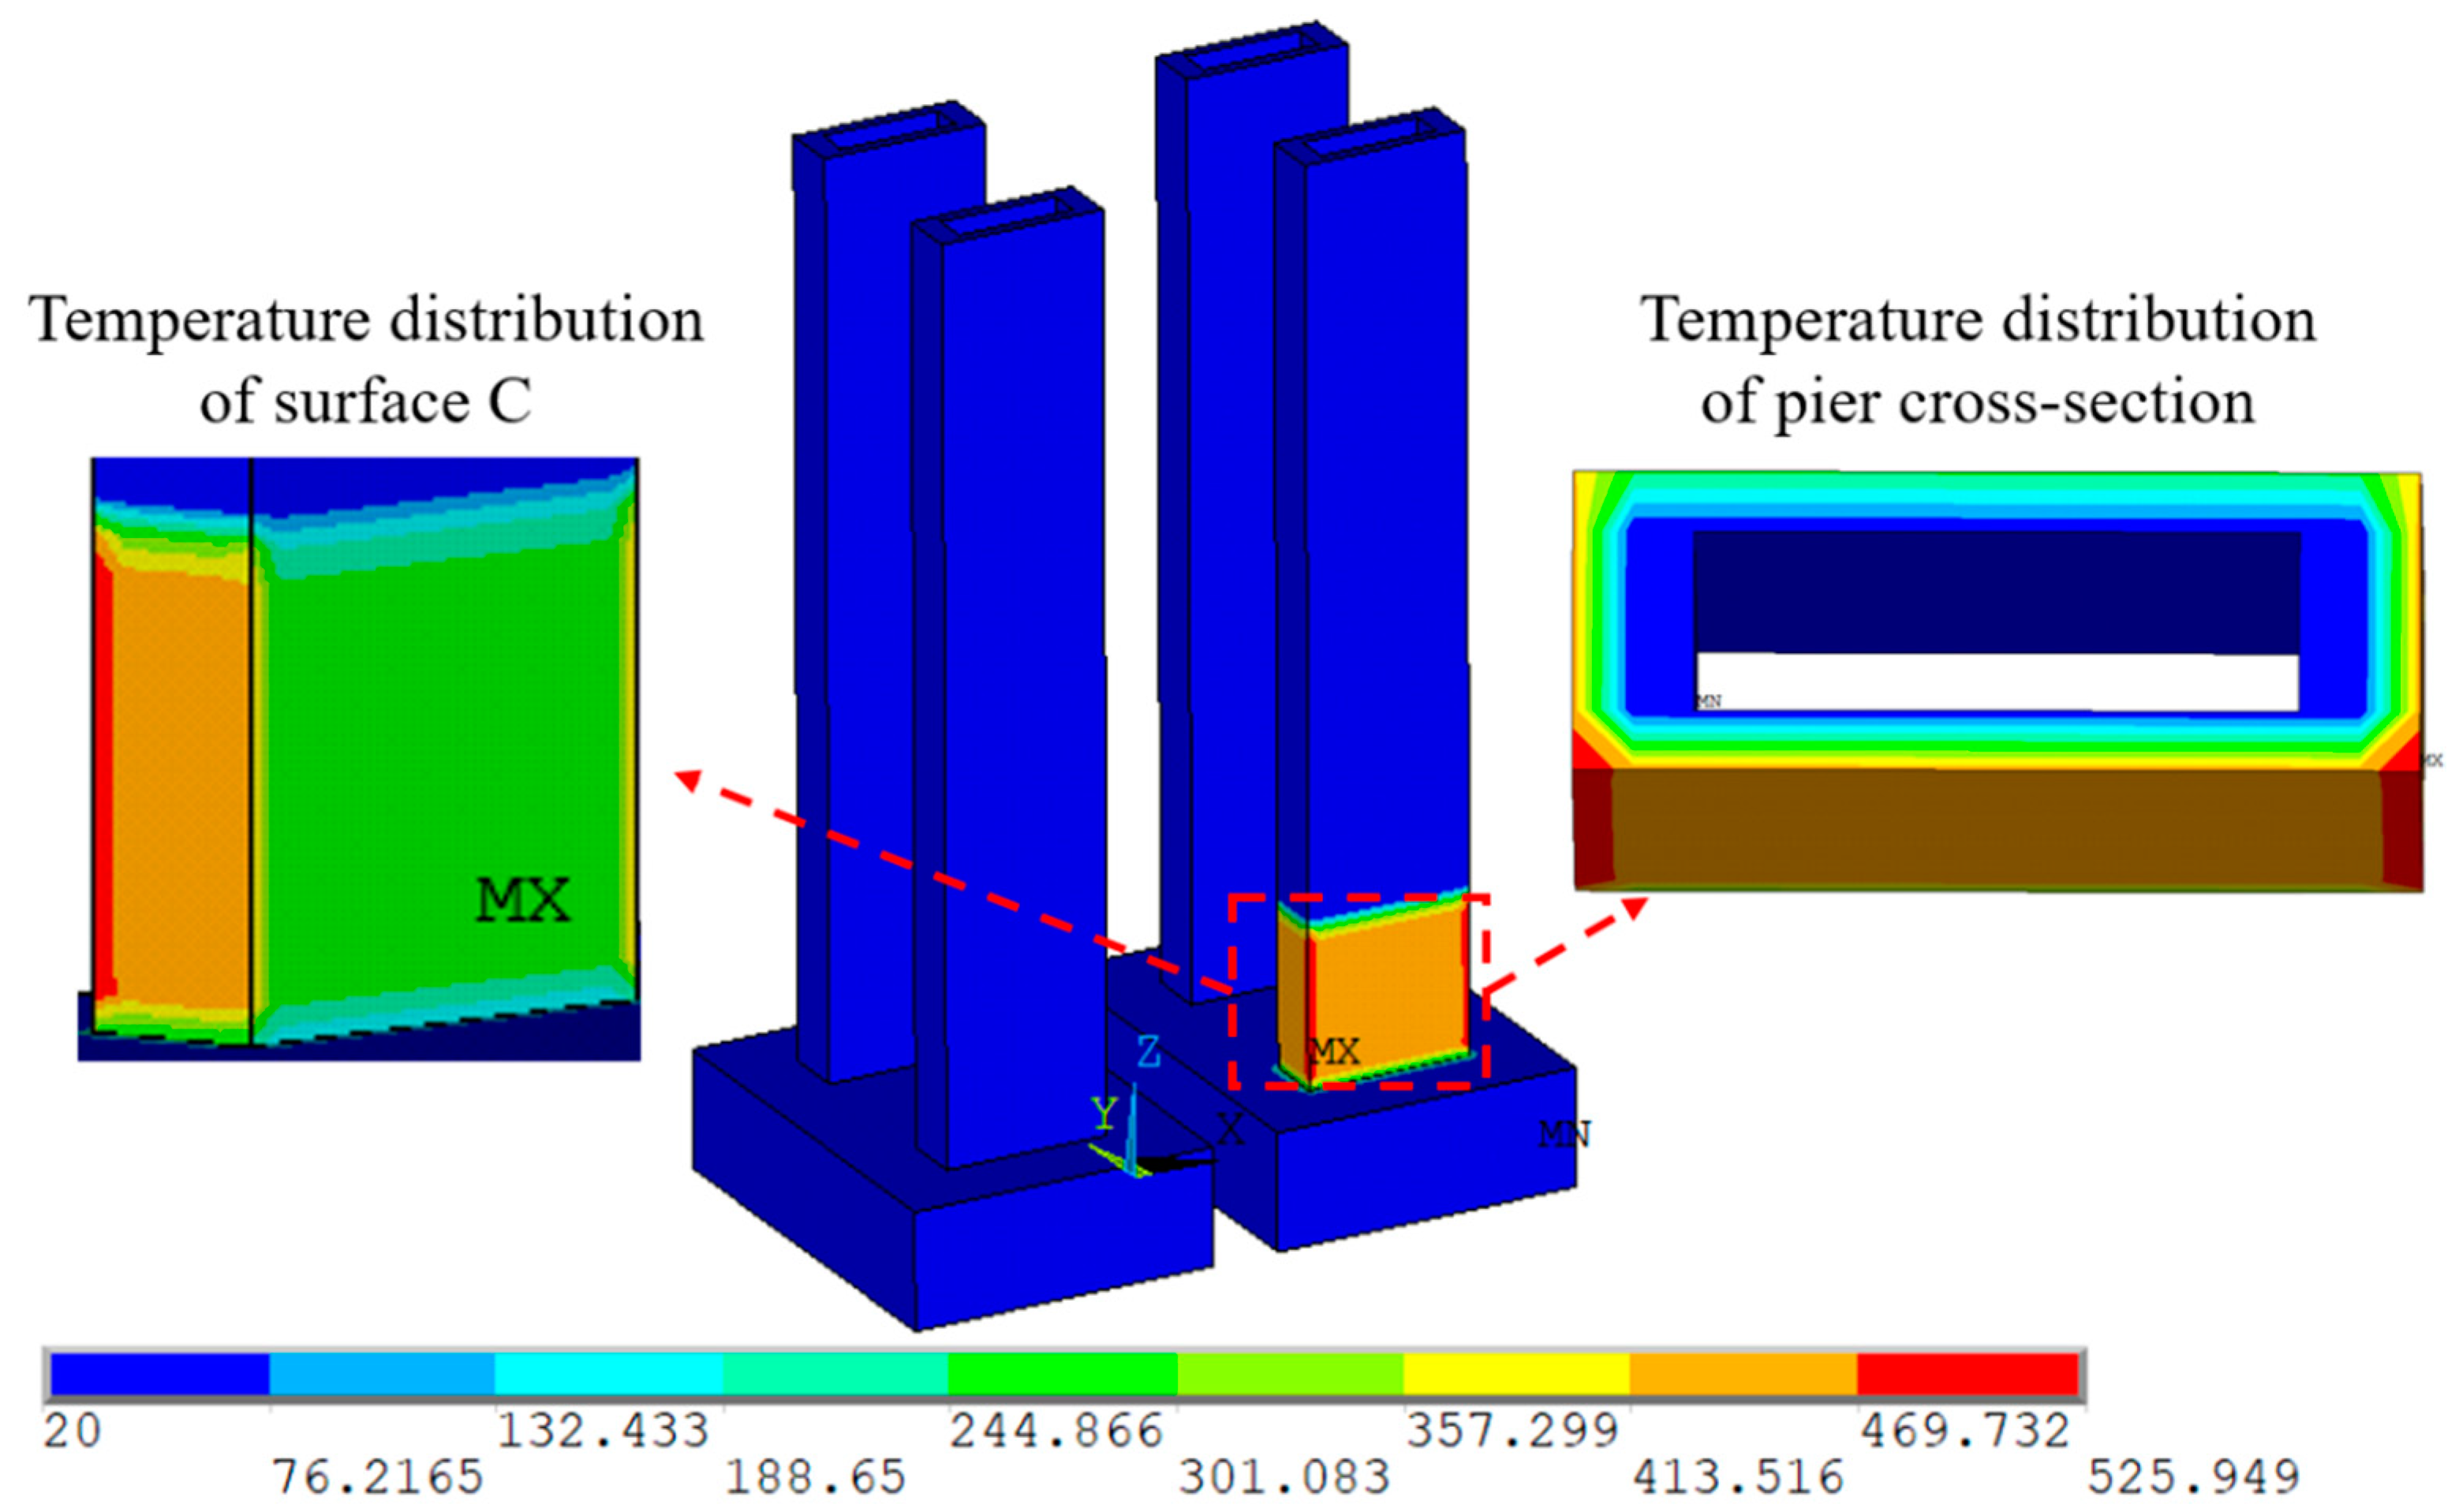
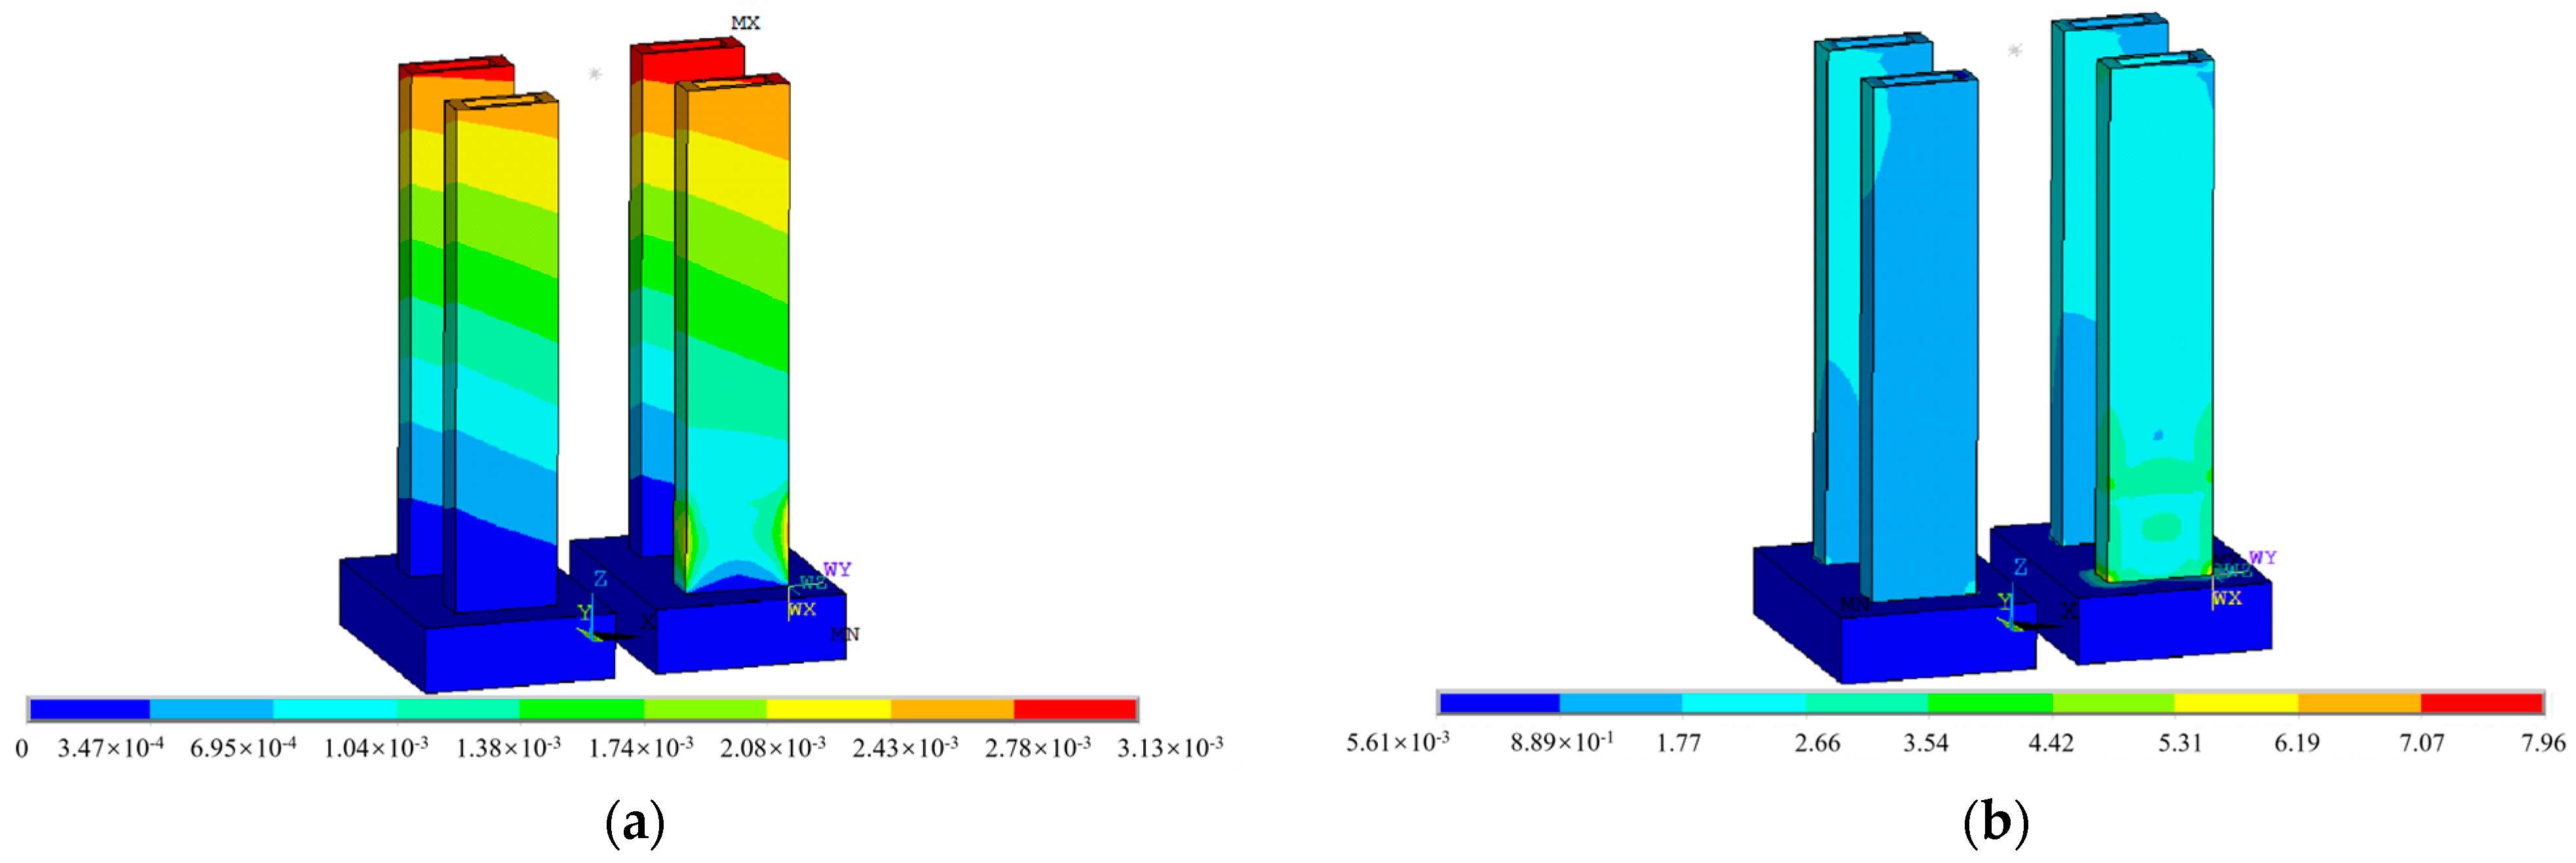
4.2. The Thermodynamic Response Analysis of the Bridge Pier

The indirect coupling method is used in the thermal–structural coupling method to conduct the thermodynamic response analysis of the P2 pier under the FRP anti-collision floating pontoon fire. The analysis approach of the indirect coupling method is as follows: Firstly, the structural heat transfer analysis is carried out. The heat boundary conditions of the structure subjected to fire are defined, and the material heat transfer parameters are input to calculate the temperature field distribution of the structure under fire. Secondly, the structural stress analysis is carried out. The structural load and boundary conditions are defined, and the thermal analysis calculation results are read in to calculate the mechanical response of the structure. The results of the temperature distribution and temperature rise process of the P2-1 pier are shown in Figure 12 and Figure 13.
According to Figure 12, the temperature rise patterns at different locations on the surface of the P2-1 pier are basically consistent. The temperatures on surfaces A, B, and D all reach above 450 °C, with localized temperatures exceeding 500 °C. The temperature on surface C is relatively lower, with a maximum temperature not exceeding 250 °C. Additionally, throughout the entire fire exposure process, the interior surface temperature of the hollow thin-wall pier remains below 30 °C, maintaining a near-room temperature state. This means that the internal surface of the P2-1 pier is not affected by the FRP anti-collision floating pontoon fire. The temperature distribution calculation results along the thickness direction of the P2-1 pier indicate that the internal temperature does not exceed 300 °C when the thickness reaches 150 mm. Therefore, the influence of the FRP anti-collision floating pontoon fire on the concrete layer of the P2-1 pier does not exceed 150 mm in thickness. On-site inspections revealed that the maximum depth of concrete damage caused by the FRP anti-collision floating pontoon fire on the P2-1 pier is approximately 85 mm, which is consistent with the numerical calculation results. The thermal calculation results are then applied as thermal loads in the structural mechanical response analysis, resulting in the maximum deformation and equivalent yield stress σ in the X, Y, and Z directions before and after the P2 pier is exposed to fire. The calculation results for the top and bottom of the P2 pier are shown in Table 3.
The comparison in Table 3 shows that under the FRP anti-collision floating pontoon fire, the maximum deformation increments of the top and bottom of the P2 pier are 2.05 mm and 0.15 mm (combined deformation), and the maximum equivalent yield stress increments are 0.02 MPa and 4.95 MPa, respectively. The distribution of the deformation and the stress for the P2 pier are shown in Figure 14. The calculation results show that the fire does not cause significant deformation and stress changes in the P2 pier, and the deformation and stress of the P2 pier do not exceed the allowable limits of structural deformation and material stress. Therefore, the impact of the FRP anti-collision floating pontoon fire accident on the structural safety of the P2 pier is minimal, and there is no need to close the bridge or close part of the lane. The bridge deck can be used normally after the fire. Due to the partial concrete spalling on the surface of the P2 pier and the almost complete destruction of the FRP anti-collision floating pontoon, it is necessary to repair the surface concrete of the P2 pier to prevent the exposure of internal steel bars to the air. In addition, it is necessary to timely replace the burned FRP anti-collision floating pontoon to ensure the collision prevention requirement of the P2 pier.

5. Conclusions

To figure out the safety impact of the FRP anti-collision floating pontoon on a continuous rigid-frame bridge structure, this study first conducted an investigation of the fire scene, identifying the degree of burning of the FRP anti-collision floating pontoon and the damage condition of the bridge piers. Next, the accuracy of the FDS software calculation was verified, and the simulation of a real bridge fire scene was achieved. Finally, based on the thermal–structural coupling method, the thermodynamic response of the bridge pier was analyzed. The main conclusions obtained are as follows:
(1) The inspection indicates that the fire caused basic destruction to the FRP anti-collision floating pontoon, and the surface concrete of the P2 pier displayed carbonation and spalling. The fire caused the maximum damage depth of the concrete surface of the bridge pier to exceed 80 mm. In addition, all damaged locations were at the bottom of the piers.
(2) The FDS calculation results show that under the influence of fire, the temperature of the bridge pier along the height direction shows a gradient decreasing distribution law, and the fire impact range of the glass fiber-reinforced plastic anti-collision floating bridge is 6 m above the bearing platform.
(3) The thermal–structural coupling calculation results show that the deformation and stress change in the P2 pier under fire is very small and does not exceed the allowable limit of structural deformation and material stress, which indicates that the fire has no significant effect on the structural safety of the continuous rigid-frame bridge.

Author Contributions

Investigation, B.G.; Resources, B.L.; Data curation, J.-N.S.; Writing—original draft, Y.-K.Z.; Writing—review & editing, P.Y. All authors have read and agreed to the published version of the manuscript.

Funding

This study was funded by Natural Science Foundation of Chongqing Municipality [Grant No. CSTB2022NSCQ-MSX1658]. The financial support from the grant is gratefully acknowledged.

Data Availability Statement

The datasets used during the current study are available from the corresponding author upon reasonable request.

Conflicts of Interest

Authors Yan-Kun Zhang, Pei Yuan, Bo Geng and Jun-Nian Shang were employed by the company China Merchants Chongqing Communications Technology Research and Design Institute Co., Ltd. The remaining author declares that the research was conducted in the absence of any commercial or financial relationships that could be construed as a potential conflict of interest.

References

  1. Fang, H.; Yao, P.F.; Shen, K.J.; Jia, E.S.; Dai, Z.W. Impact tests of multistage energy dissipation and collision protection device of combined floating steel pontoon and soft object. Bridge Constr. 2022, 52, 38–44. [Google Scholar]
  2. Fang, H.; Wang, J.; Zhu, L.; Liu, W.Q. Study of collision protection devices for central pylon pier of Yingwuzhou Changjiang River Bridge in Wuhan. Bridge Constr. 2020, 50, 20–25. [Google Scholar]
  3. Wang, F.; Lv, Z.D.; Zhao, Z.; Wang, Y.G. Research on flexible anti-collision device for bridges based on rigid-flexible matching. Bridge Constr. 2021, 51, 82–87. [Google Scholar]
  4. Chen, W.; Geng, B.; Shen, R.L. Study on anti-collision performance of rotary cylinder typed steel composite pontooned cofferdam. J. Disaster Prev. Mitig. Eng. 2020, 40, 936–944. [Google Scholar]
  5. Zheng, Z.; Geng, B.; Yuan, P.; Shang, J.N.; Wei, S.S.; Hu, Z.T. Reliability of butterfly type connection structure of bridge pier FRP composite anti-collision sleeve pontoon. J. Vib. Shock 2020, 39, 281–288. [Google Scholar]
  6. Zhang, G.; Zhao, X.; Song, C.; Li, X.; Tang, C.; Wan, H.; Lu, Z.; Ding, Y. Review on bridge fire science and safety guarantee technology. J. Traffic Transp. Eng. 2023, 23, 94–113. [Google Scholar]
  7. Ozturk, B.; Yilmaz, C. Analytical Investigation of Effect of Retrofit Application using FRP on Seismic Behavior of a Monumental Building at Historical Cappadocia Region of Turkey. In Proceedings of the 9th U.S. National and 10th Canadian Conference on Earthquake Engineering, Toronto, ON, Canada, 25–29 July 2010. [Google Scholar]
  8. Ozturk, B.; Yilmaz, C.; Senturk, T. Effect of frp retrofitting application on seismic behavior of a historical building at nigde, turkey. In Proceedings of the 14th European Conference on Earthquake Engineering, Ohrid, North Macedonia, 30 August–3 September 2010. [Google Scholar]
  9. Zhang, G.; Tang, C.; Li, X.; Zhao, X.; Lu, Z.; Song, C. Fire resistance of steel truss-concrete composite bridge girder. J. Build. Struct. 2023, 44, 214–226. [Google Scholar]
  10. Zheng, X.L.; Jian, J.S.; Liu, L.; Sun, B.T.; Zhang, K.X.; Gao, H.S. Static and Dynamic Performance Analysis of Cable-Stayed Bridges with Cables Damaged Fire. Buildings 2024, 14, 884. [Google Scholar] [CrossRef]
  11. Zhang, G.; Song, C.J.; Li, X.Y.; Tang, C.H.; Wan, H. Experimental study on failure of steel-concrete composite bridge girders under hydrocarbon fire exposure conditions. China J. Highw. Transp. 2022, 35, 135–146. [Google Scholar]
  12. Du, Y.; Sun, Y.K.; Jiang, J.; Li, G.Q. Effect of cavity radiation on transient temperature distribution in steel cables under ISO834 fire. Fire Saf. J. 2019, 104, 79–89. [Google Scholar] [CrossRef]
  13. Kang, J.T.; Wang, W. Analysis of structural performance of long-span steel trussed arch bridge exposed to fire. J. Harbin Inst. Technol. 2020, 52, 77–84. [Google Scholar]
  14. Zheng, W.Z.; Hou, X.M.; Shi, D.S.; Xu, M.X. Experimental study on concrete spalling in prestressed slabs subjected to fire. Fire Saf. J. 2010, 45, 283–297. [Google Scholar] [CrossRef]
  15. Jiang, Y. Experimental and simulation study on combustion and heat spread characteristics of methanol gasoline. Hunan Univ. Sci. Technol. 2021. [Google Scholar] [CrossRef]
  16. Aziz, E.M.; Kodur, V.K.; Glassman, J.D.; Moreyra Garlock, M.E. Behavior of steel bridge girders under fire conditions. J. Constr. Steel Res. 2015, 106, 11–22. [Google Scholar] [CrossRef]
  17. Chen, Y.G.; He, H.Z.; Liu, Z.Q. Experimental study on combustion of flexible polyurethane foam under different ignition modes. J. Saf. Sci. Technol. 2022, 18, 156–161. [Google Scholar]
  18. Kim, H.J.; Lilley, D.G. Heat Release Rates of Burning Items in Fires. J. Propuls. Power 2002, 18, 866–870. [Google Scholar] [CrossRef]
  19. Lv, X.T.; Zhang, T.; Wang, W.W.; Zhang, Y.Z. Fire resistance of rectangular hollow sections steel columns filled with bar-reinforced concrete being exposure to adjacent-two-side fire. J. Liaoning Tech. Univ. 2014, 3, 346–349. [Google Scholar]
  20. BS EN 1993-1-2:2005; Eurocode3 Design of Steel Structures (Part1/2), General Rules-Structural Fire Design. European Committee for Standardization: Brussels, Belgium, 2005.
  21. Chen, W.; Shen, R.L.; Gong, W.; Hou, S.Y.; Xue, S.L. Study on fire resistance of H-shaped steel-concrete composite beams. J. Disaster Prev. Mitig. Eng. 2021, 41, 960–967+1000. [Google Scholar]
Figure 1. Structural dimension drawing of FRP anti-collision floating pontoon of main pier of continuous rigid-frame bridge (unit: cm).
Buildings 14 01969 g001
Figure 2. The investigation findings at the scene of the fire. (a) The site of the fire and the process of extinguishing. (b) The condition of the piers’ body and collision-resistant floating pontoon after the fire. (c) The damage assessment of the collision-resistant floating pontoon at the point of ignition.
Buildings 14 01969 g002
Figure 3. Methanol gasoline fuel pool fire experiments conducted in the literature. (a) The experimental site. (b) The layout of temperature measurement points.
Buildings 14 01969 g003
Figure 4. CFD calculation model of methanol gasoline combustion. (a) Elevation view. (b) Layout plan.
Buildings 14 01969 g004
Figure 5. Comparison of methanol gasoline combustion tests and simulations under different wind speed conditions. (a) 0.1 m/s. (b) 1.0 m/s. (c) 3.0 m/s.
Buildings 14 01969 g005
Figure 6. Comparison between FDS simulation and experimental test results. (a) Comparison of heating processes. (b) Temperature differences between calculation and test results.
Buildings 14 01969 g006
Figure 7. CFD computational model for fire combustion of FRP anti-collision floating pontoon.
Buildings 14 01969 g007
Figure 8. The cloud map distribution of the transient temperature field of the FRP anti-collision floating pontoon during a fire (unit: °C).
Buildings 14 01969 g008
Figure 9. Temperature rise process at different measuring points along height direction of P2-1 pier. (a) Temperature rise process at different measurement points on surface C of P2-1 pier. (b) Temperature rise process at different measuring points on surface D of P2-1 pier.
Buildings 14 01969 g009
Figure 10. Temperature gradient distribution at different measuring points along the height direction of the P2-1 pier.
Buildings 14 01969 g010
Figure 11. Numerical calculation model for thermal–structural coupling analysis of P2 pier.
Buildings 14 01969 g011
Figure 12. Temperature rise process and temperature distribution gradient of P2-1 pier. (a) Temperature rise process. (b) Temperature distribution gradient.
Buildings 14 01969 g012
Figure 13. Cloud diagram of distribution of temperature field of P2-1 pier leg (Unit: °C).
Buildings 14 01969 g013
Figure 14. Cloud maps of deformation and equivalent yield stress distribution of P2 pier. (a) Deformation cloud map (unit: m). (b) Equivalent yield stress distribution map (unit: MPa).
Buildings 14 01969 g014
Table 1. Results of surface damage depth detection on bridge piers.
Pier NumberDetection PositionConcrete Carbonation Depth at Different Locations (mm)Concrete Spalling Thickness (mm)Concrete Damage Thickness (mm)
123
P2-1A2.001.752.001.9230.0084.58
B1.750.751.001.1755.00
C1.000.751.251.0030.00
D0.500.500.750.5884.00
P2-2A3.003.253.003.0828.0035.00
B2.753.253.003.0028.00
C4.755.005.255.0030.00
D00000
P2-3A2.501.502.502.17080.58
B2.001.752.001.9240.00
C00000
D0.750.500.500.5880.00
Table 2. The values of the key thermodynamic parameters for the calculation model.
ParameterConvection Coefficient
W/(m2·°C)
EmissivitySpecific Heat CapacityConduction CoefficientThermal Expansion CoefficientStress–StrainElastic ModulusPoisson’s Ratio
Value500.7LieLieLieEC4EC40.17
Table 3. Deformation and stress calculation results of P2-1 pier before and after fire.
Fire StatePier’s TopPier’s Bottom
X (mm)Y (mm)Z (mm)σ (MPa)X (mm)Y (mm)Z (mm)σ (MPa)
Before fire1.4702.621.930003.01
After fire1.471.841.711.950.1300.077.96
Increment01.84−0.910.020.1300.074.95
Disclaimer/Publisher’s Note: The statements, opinions and data contained in all publications are solely those of the individual author(s) and contributor(s) and not of MDPI and/or the editor(s). MDPI and/or the editor(s) disclaim responsibility for any injury to people or property resulting from any ideas, methods, instructions or products referred to in the content.

