

Experimental and Numerical Heat Transfer Assessment and Optimization of an IMSI Based Individual Building Block System of the Kingdom of Bahrain

 , ,
, ,
Abstract
:1. Introduction
1.1. Motivation
1.2. Scope
2. Methodology
2.1. Thermal Insulation
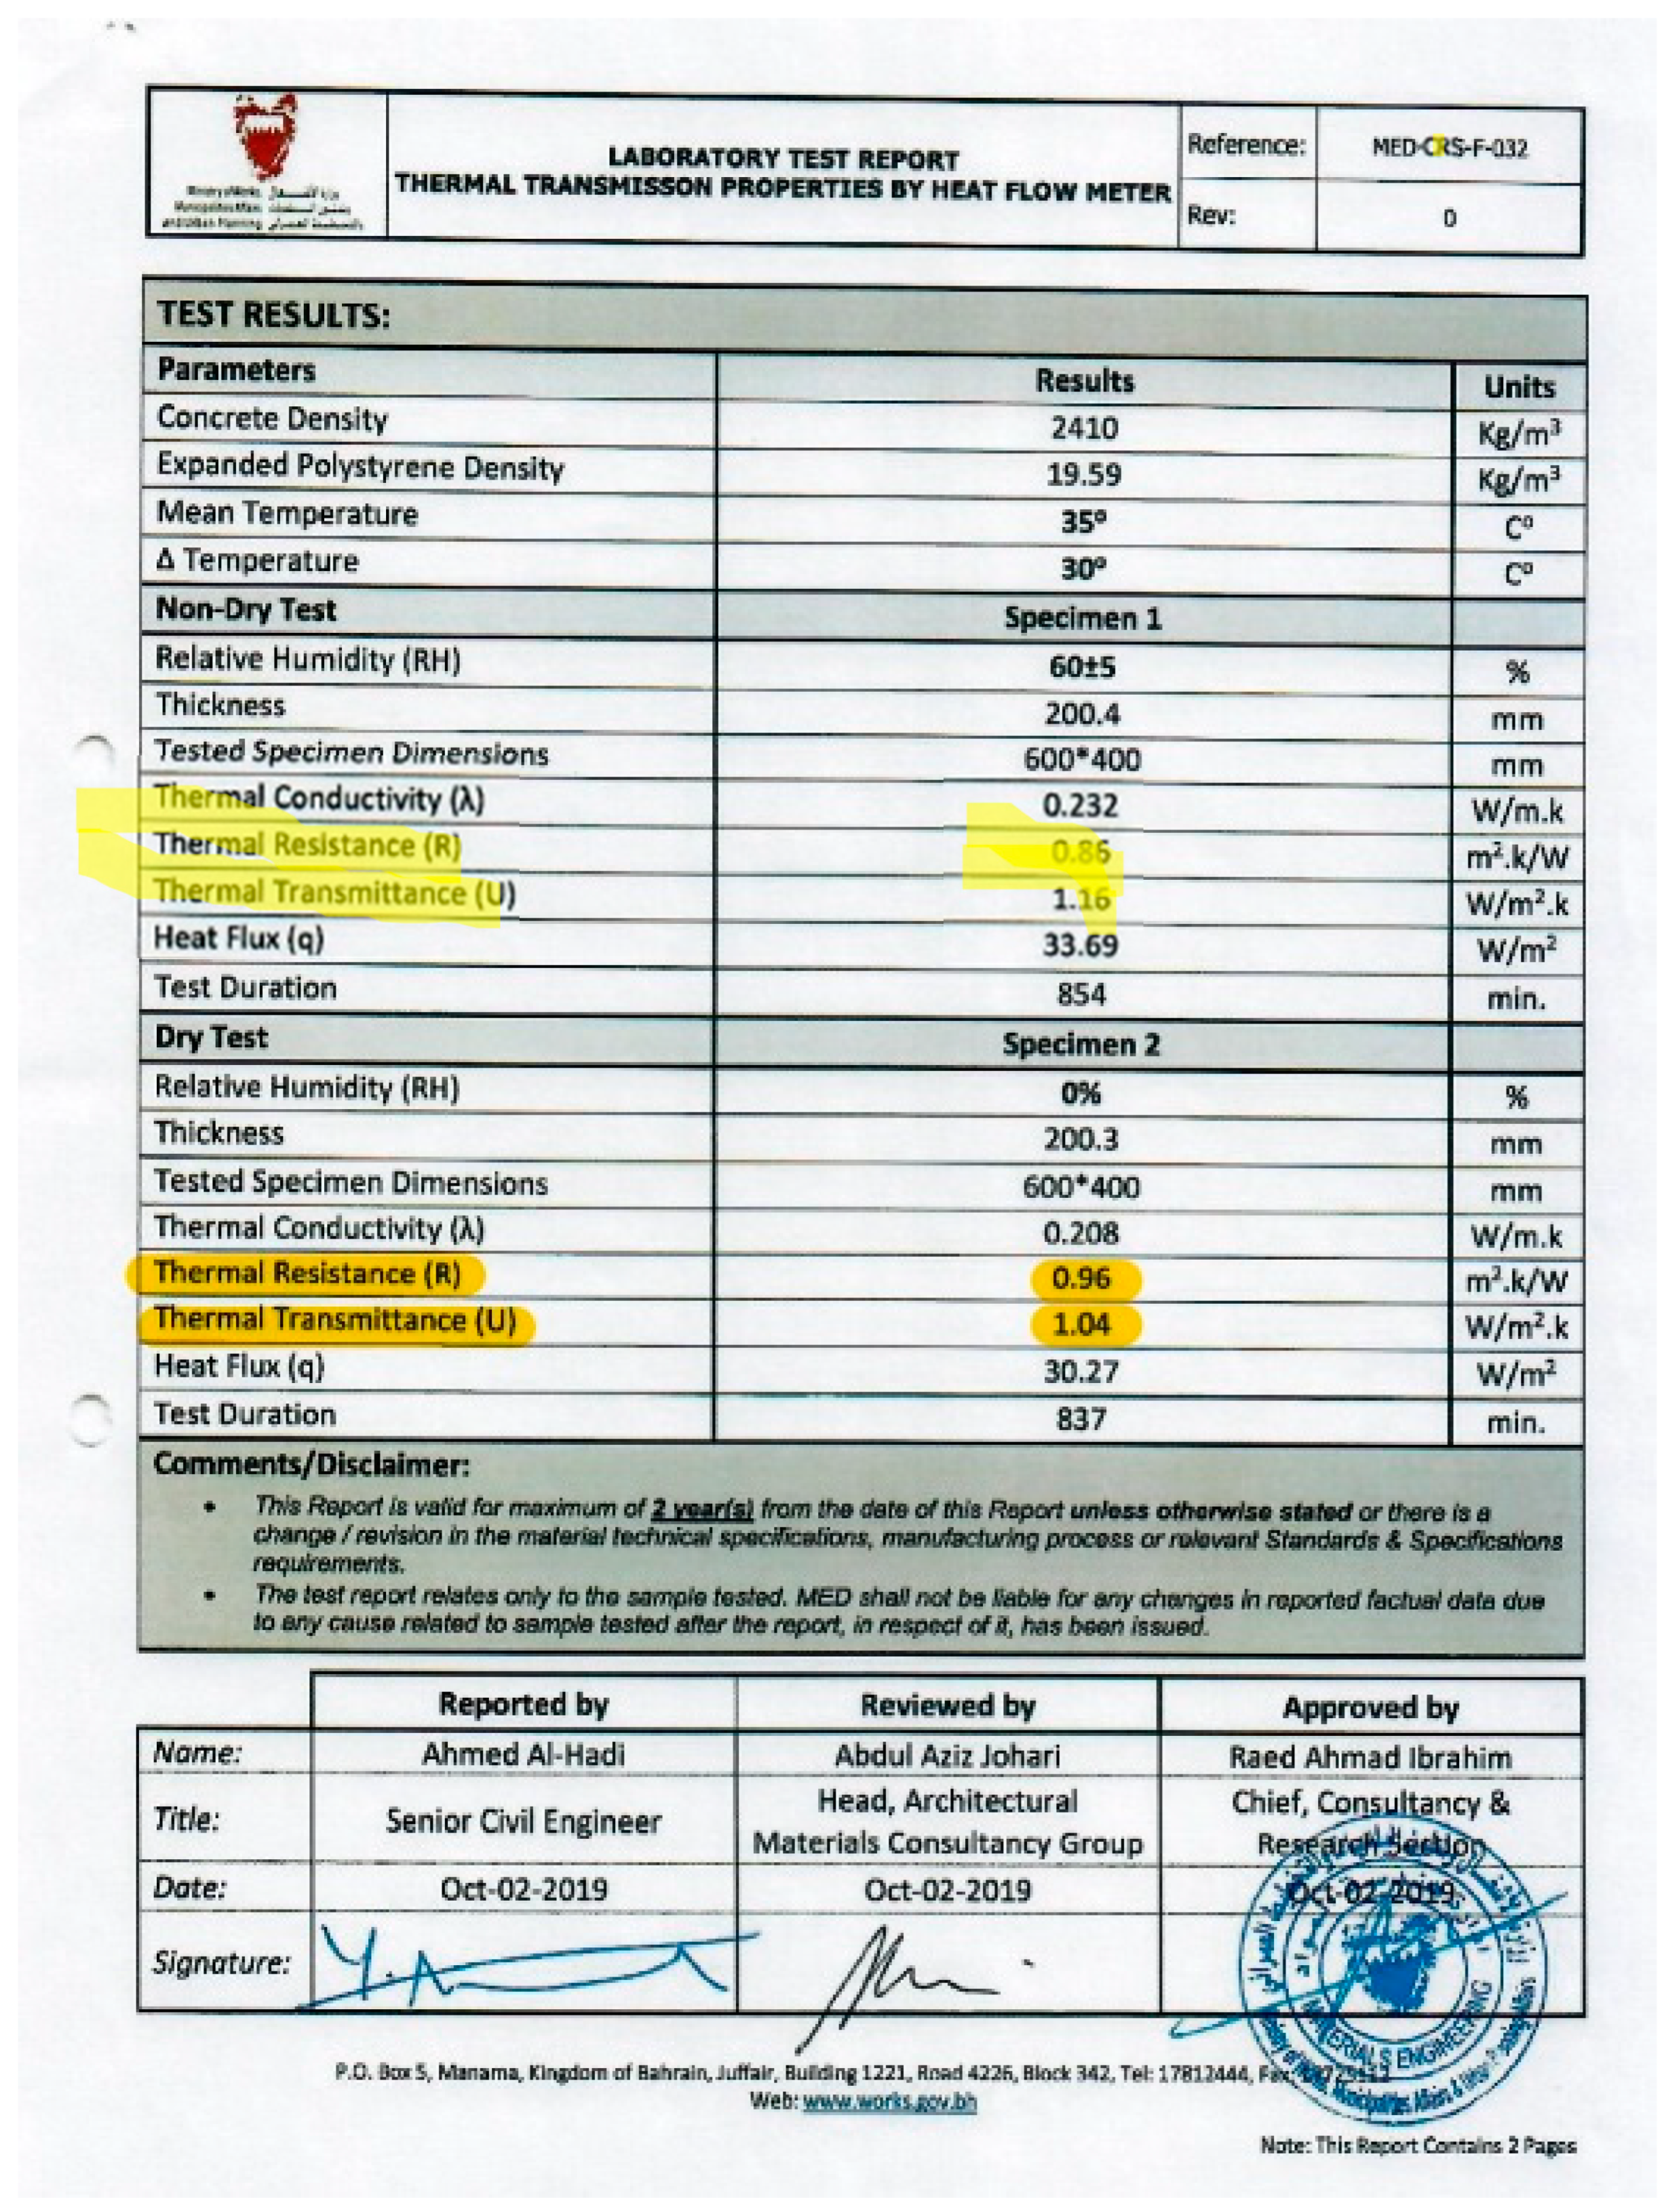
2.2. Thermal Resistance (R-Value)
2.3. Heat Transfer Coefficient of Air
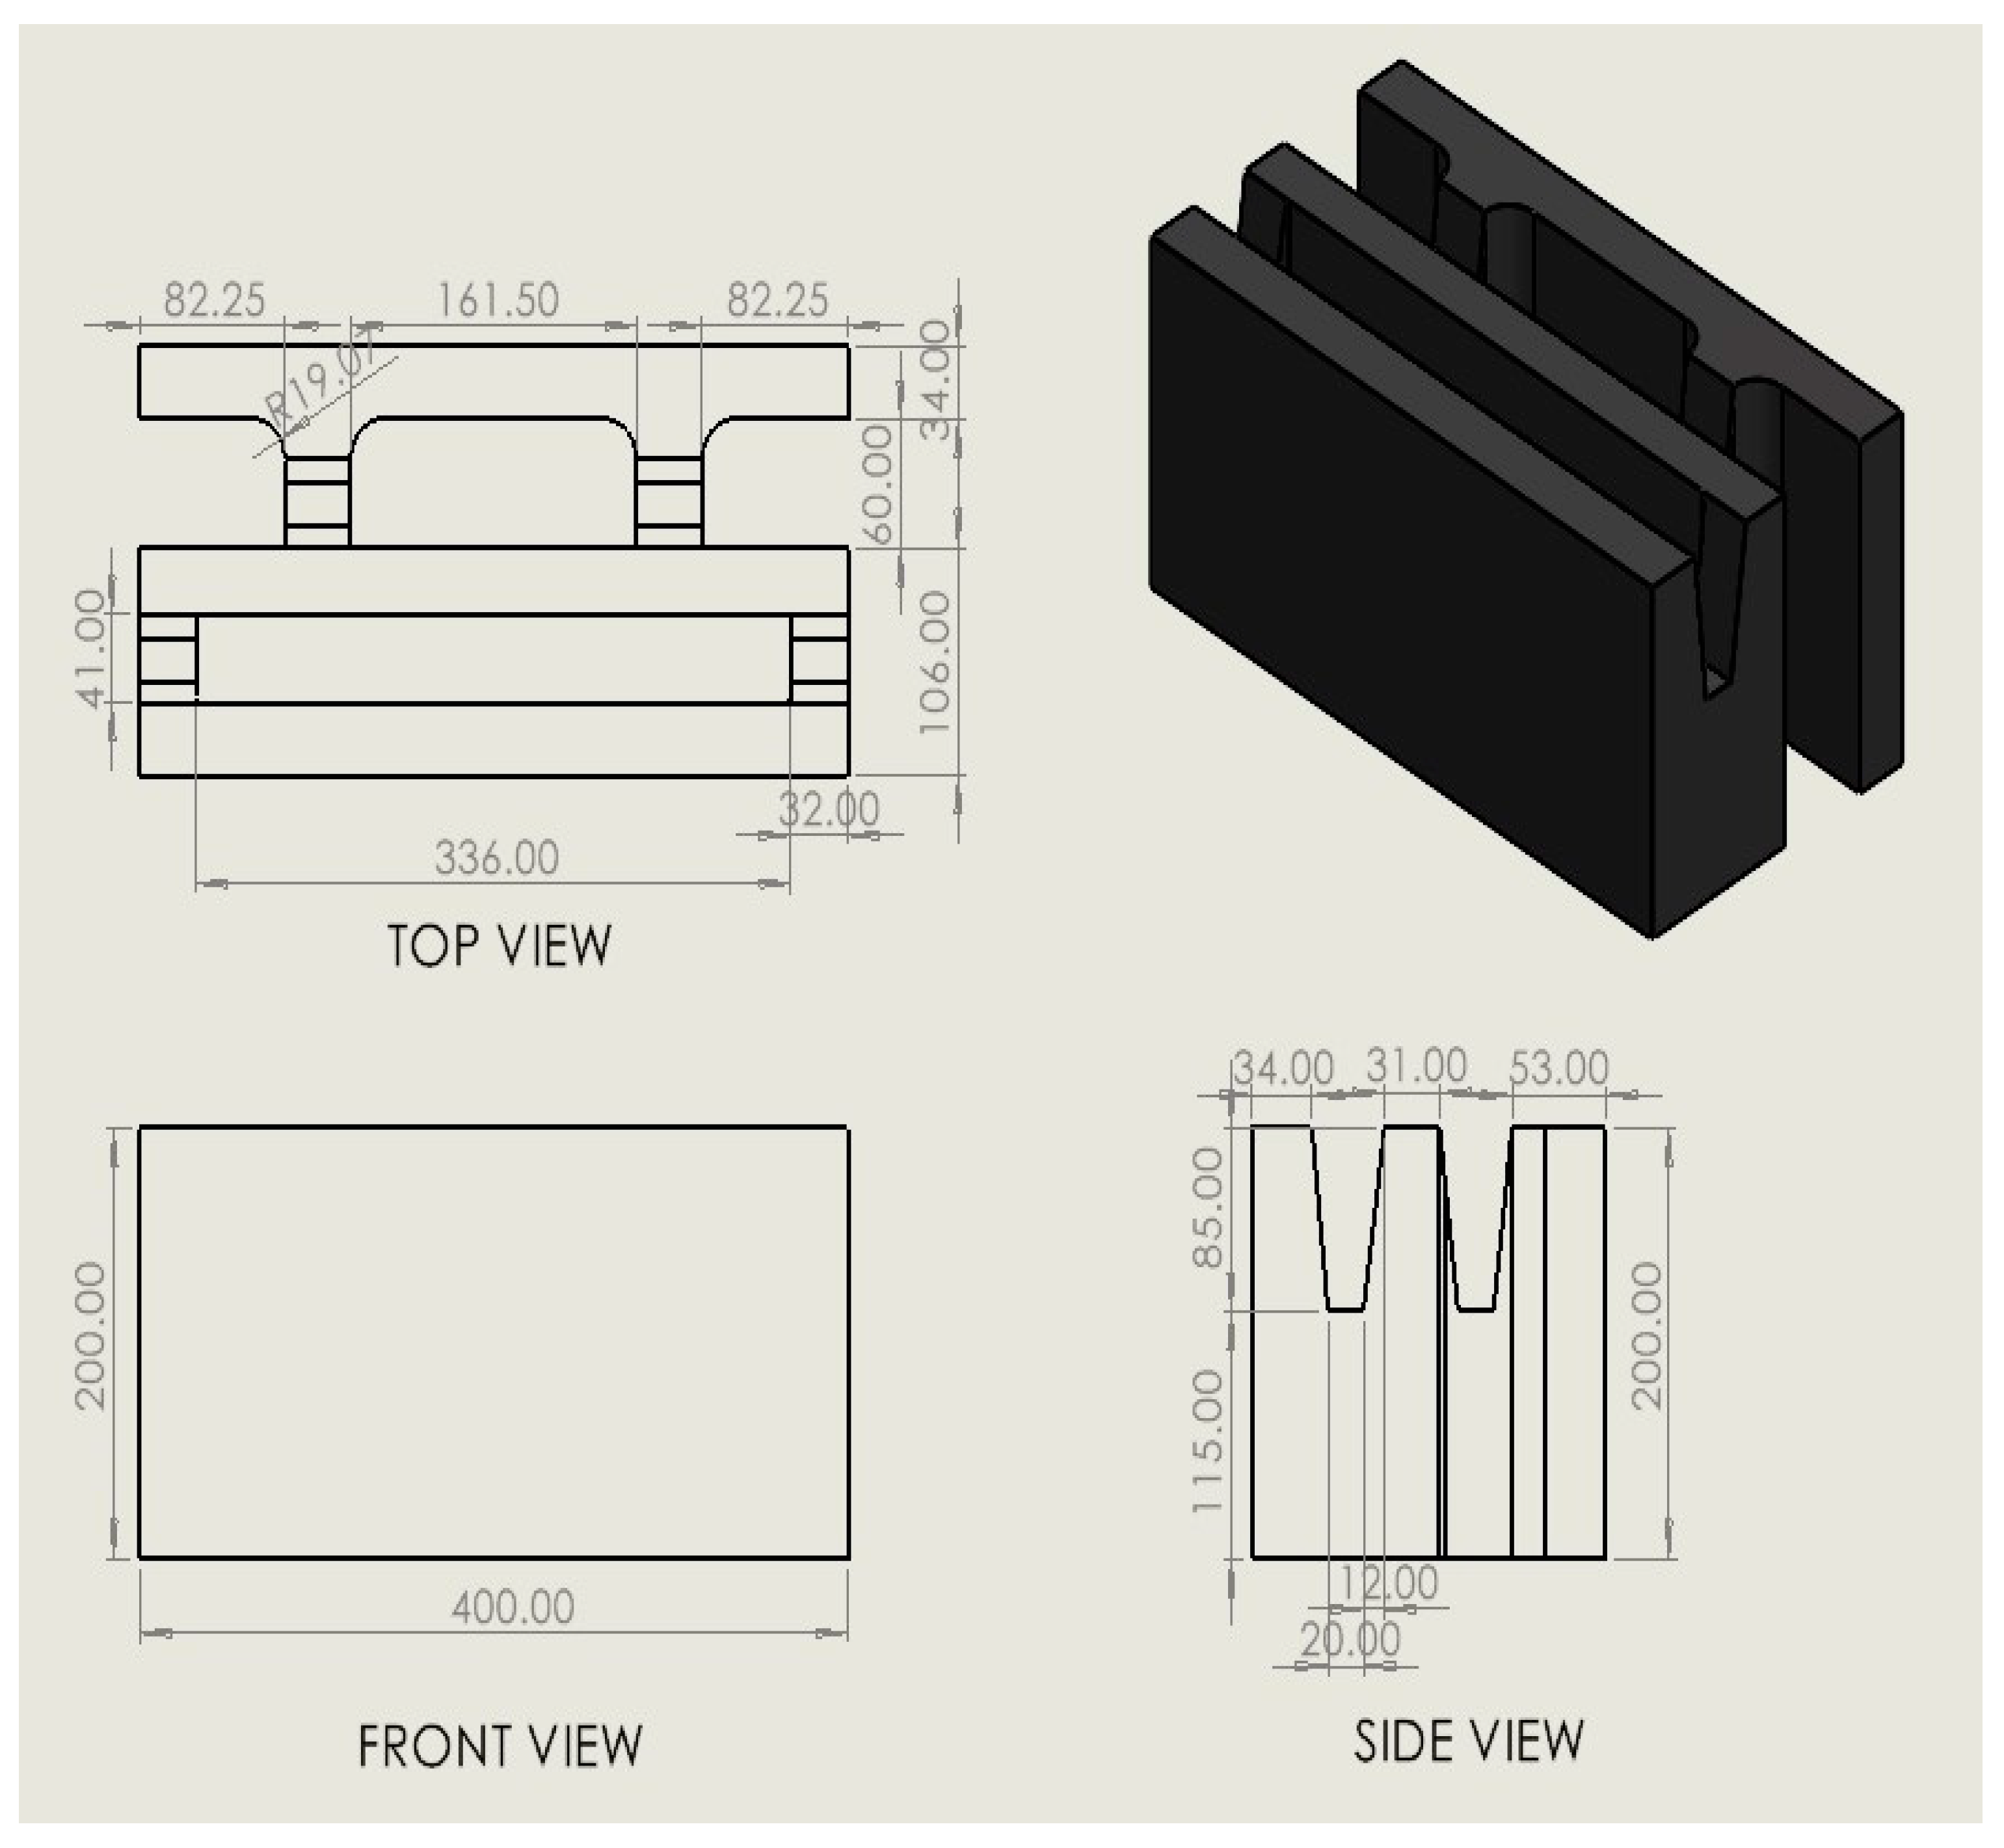
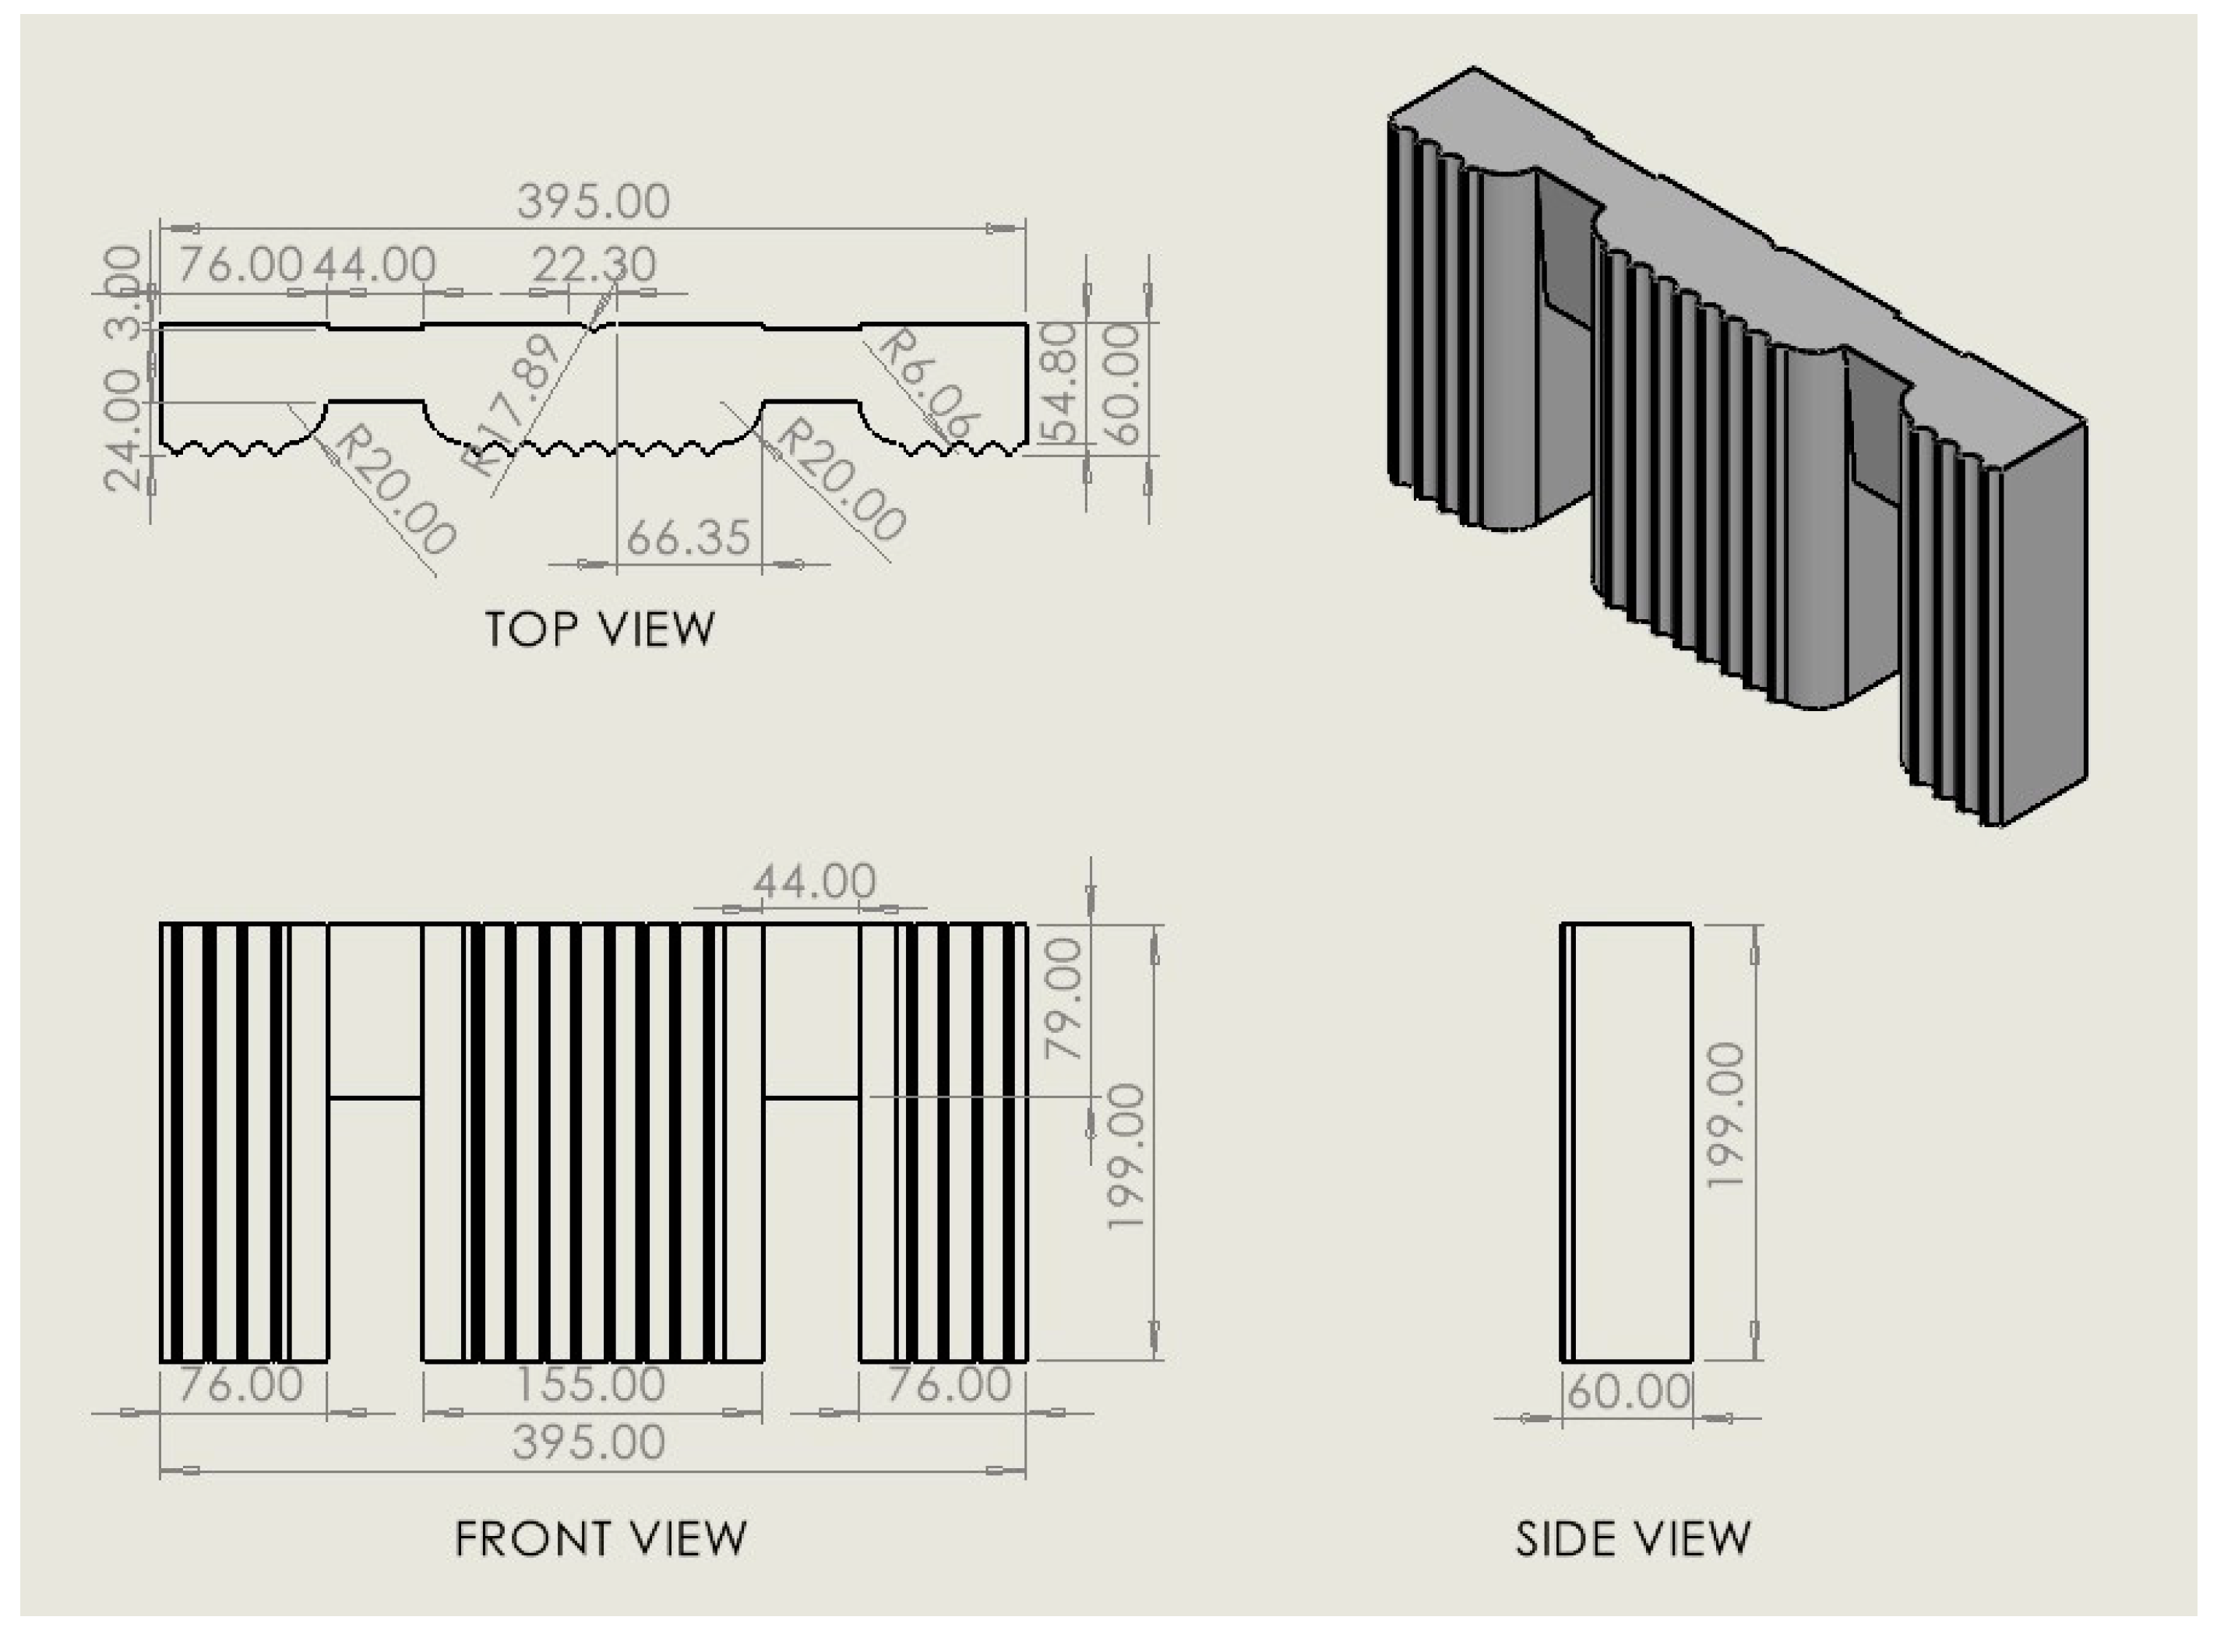
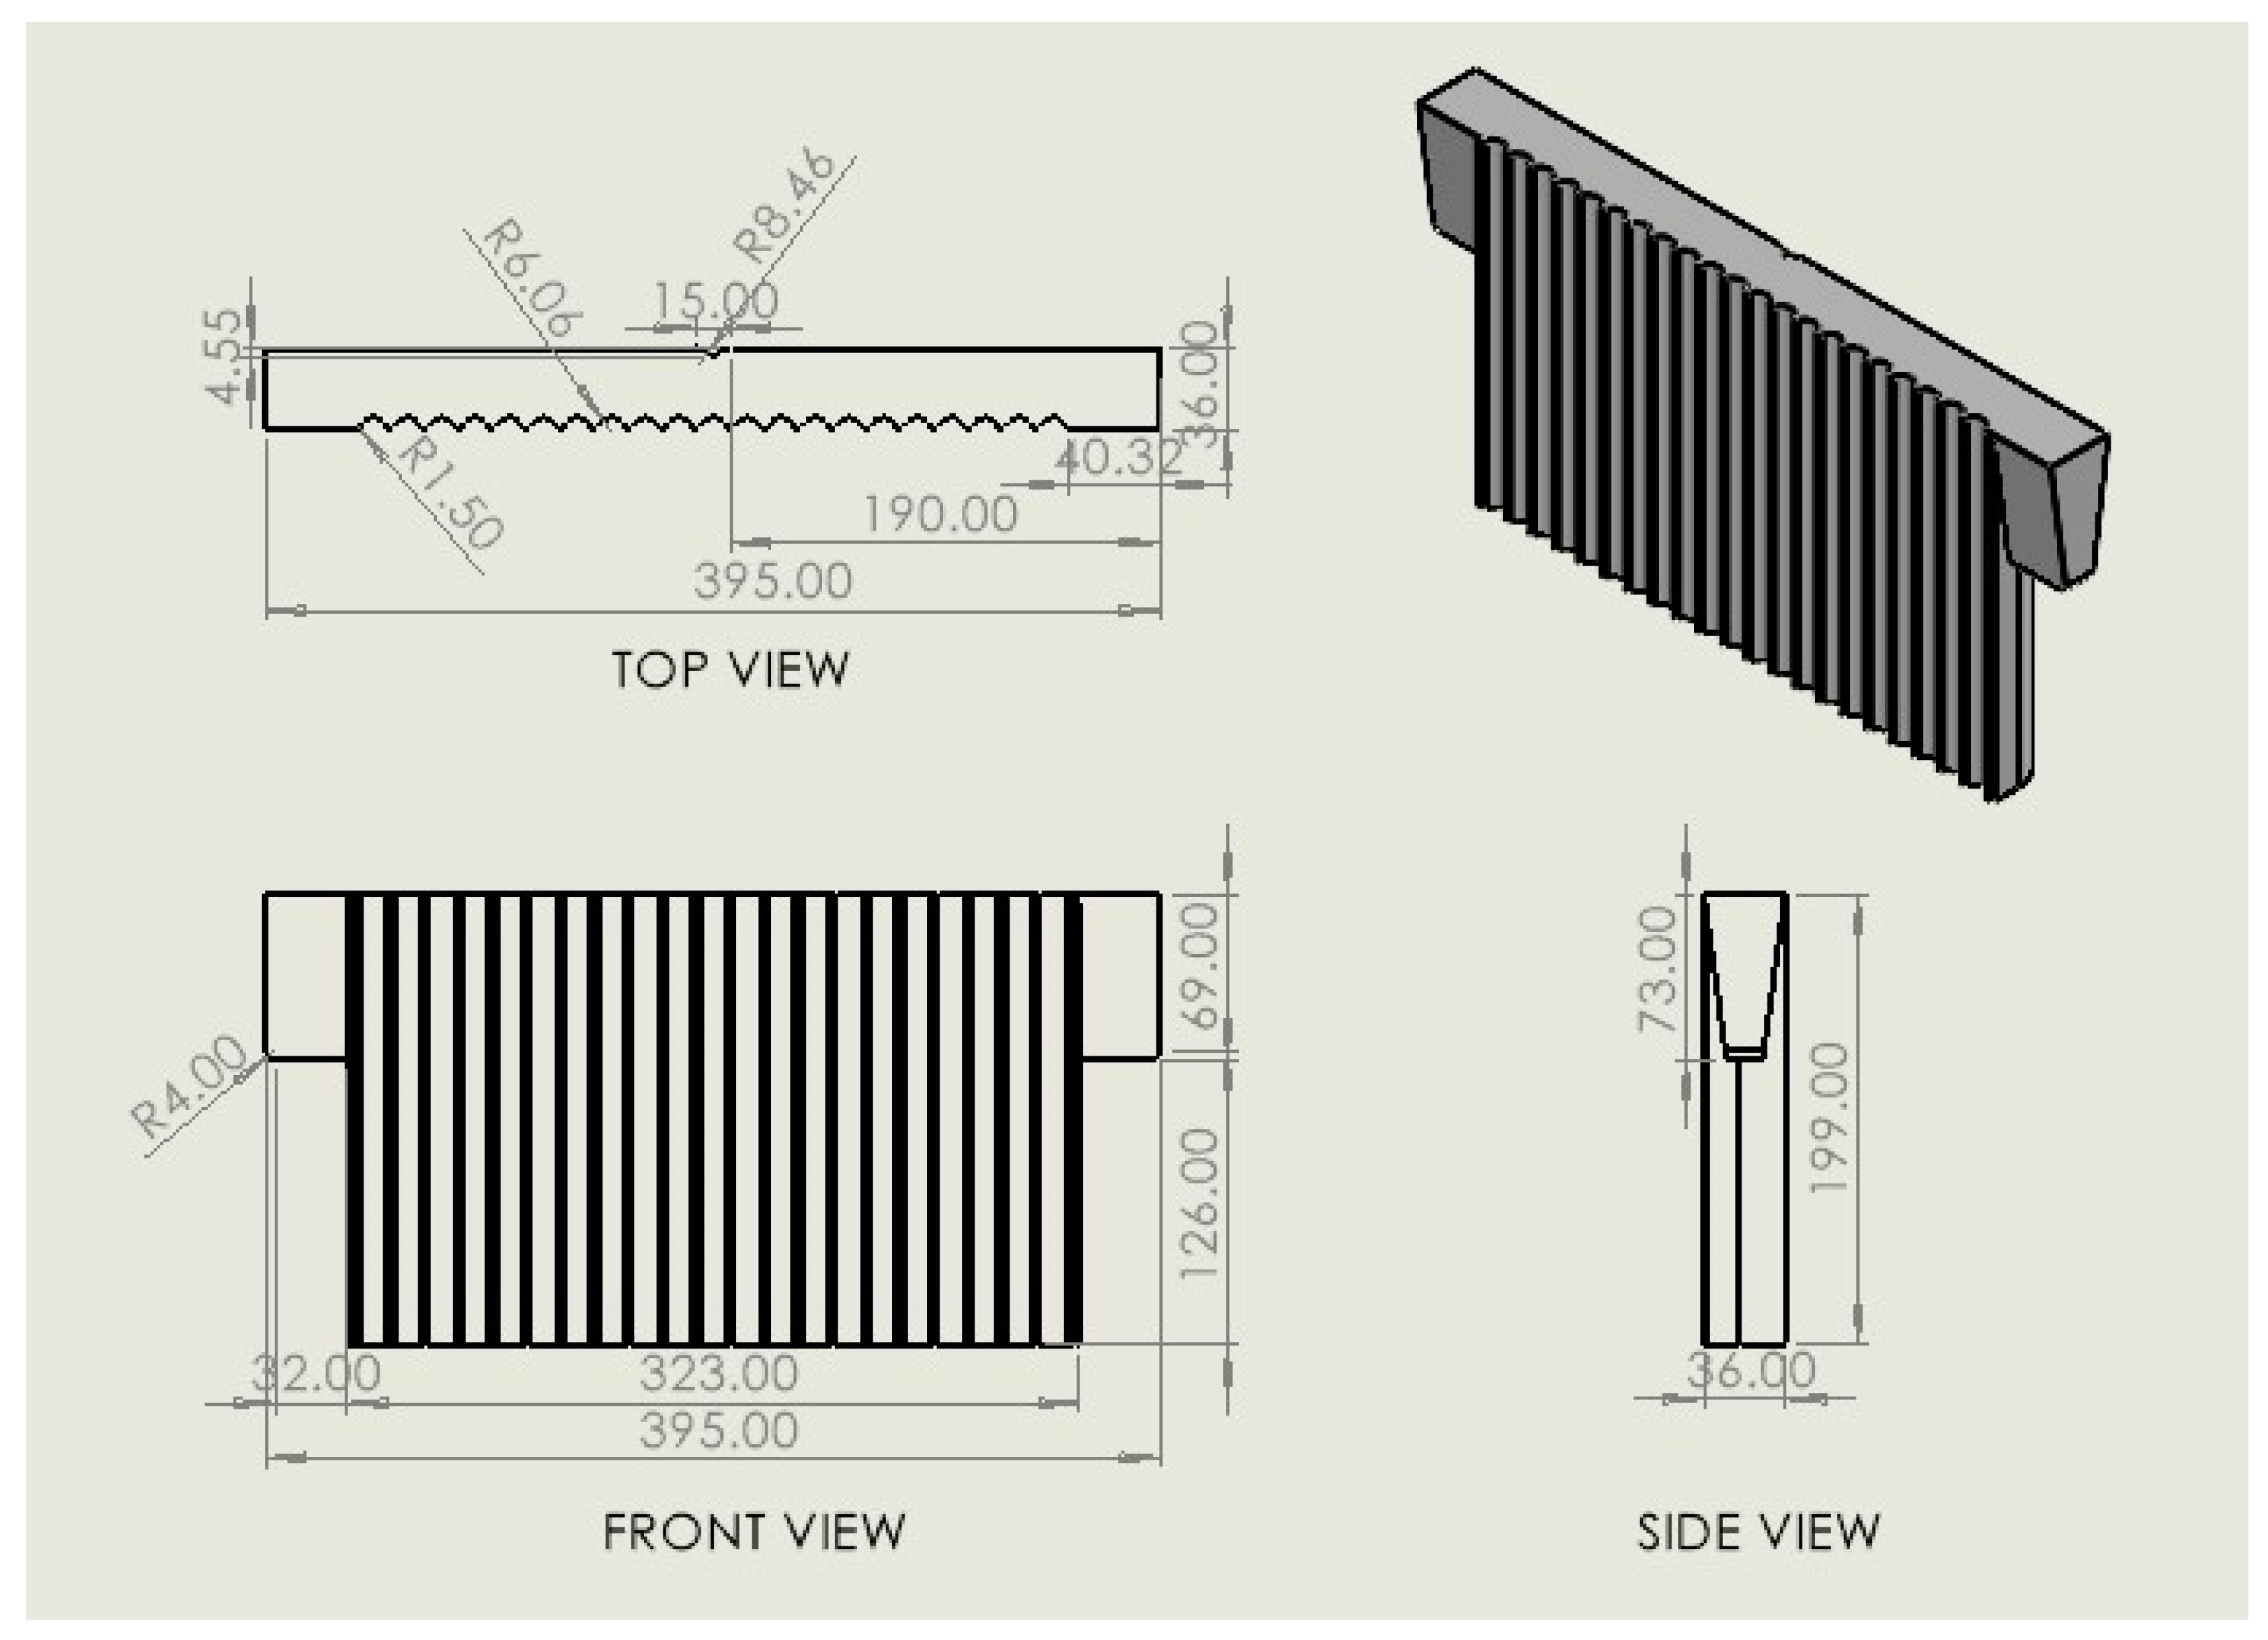
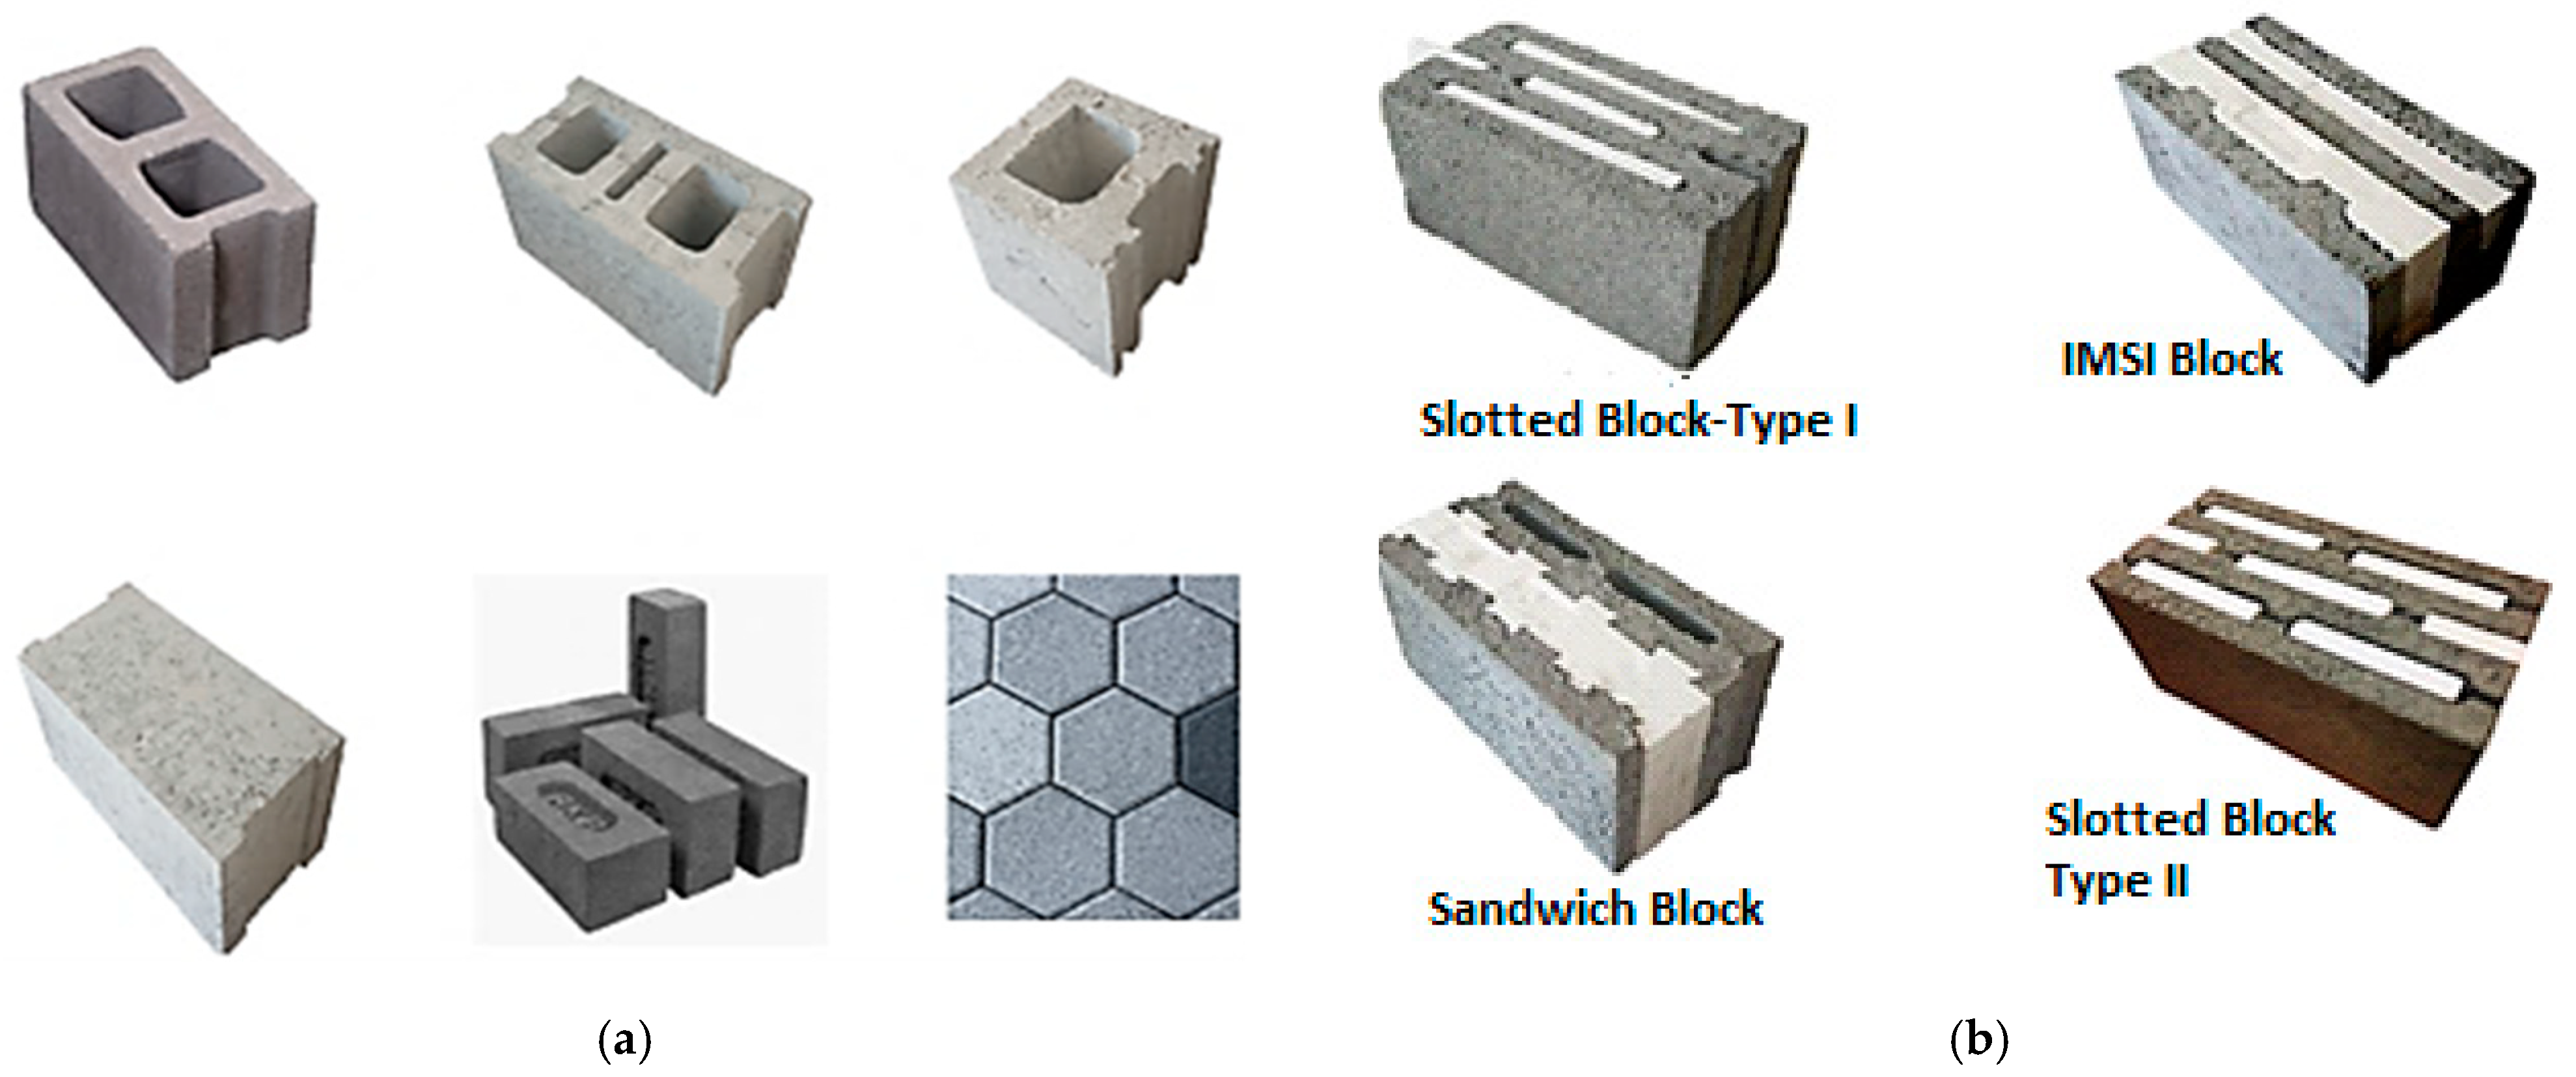
2.4. Concrete Insulation Blocks in Bahrain
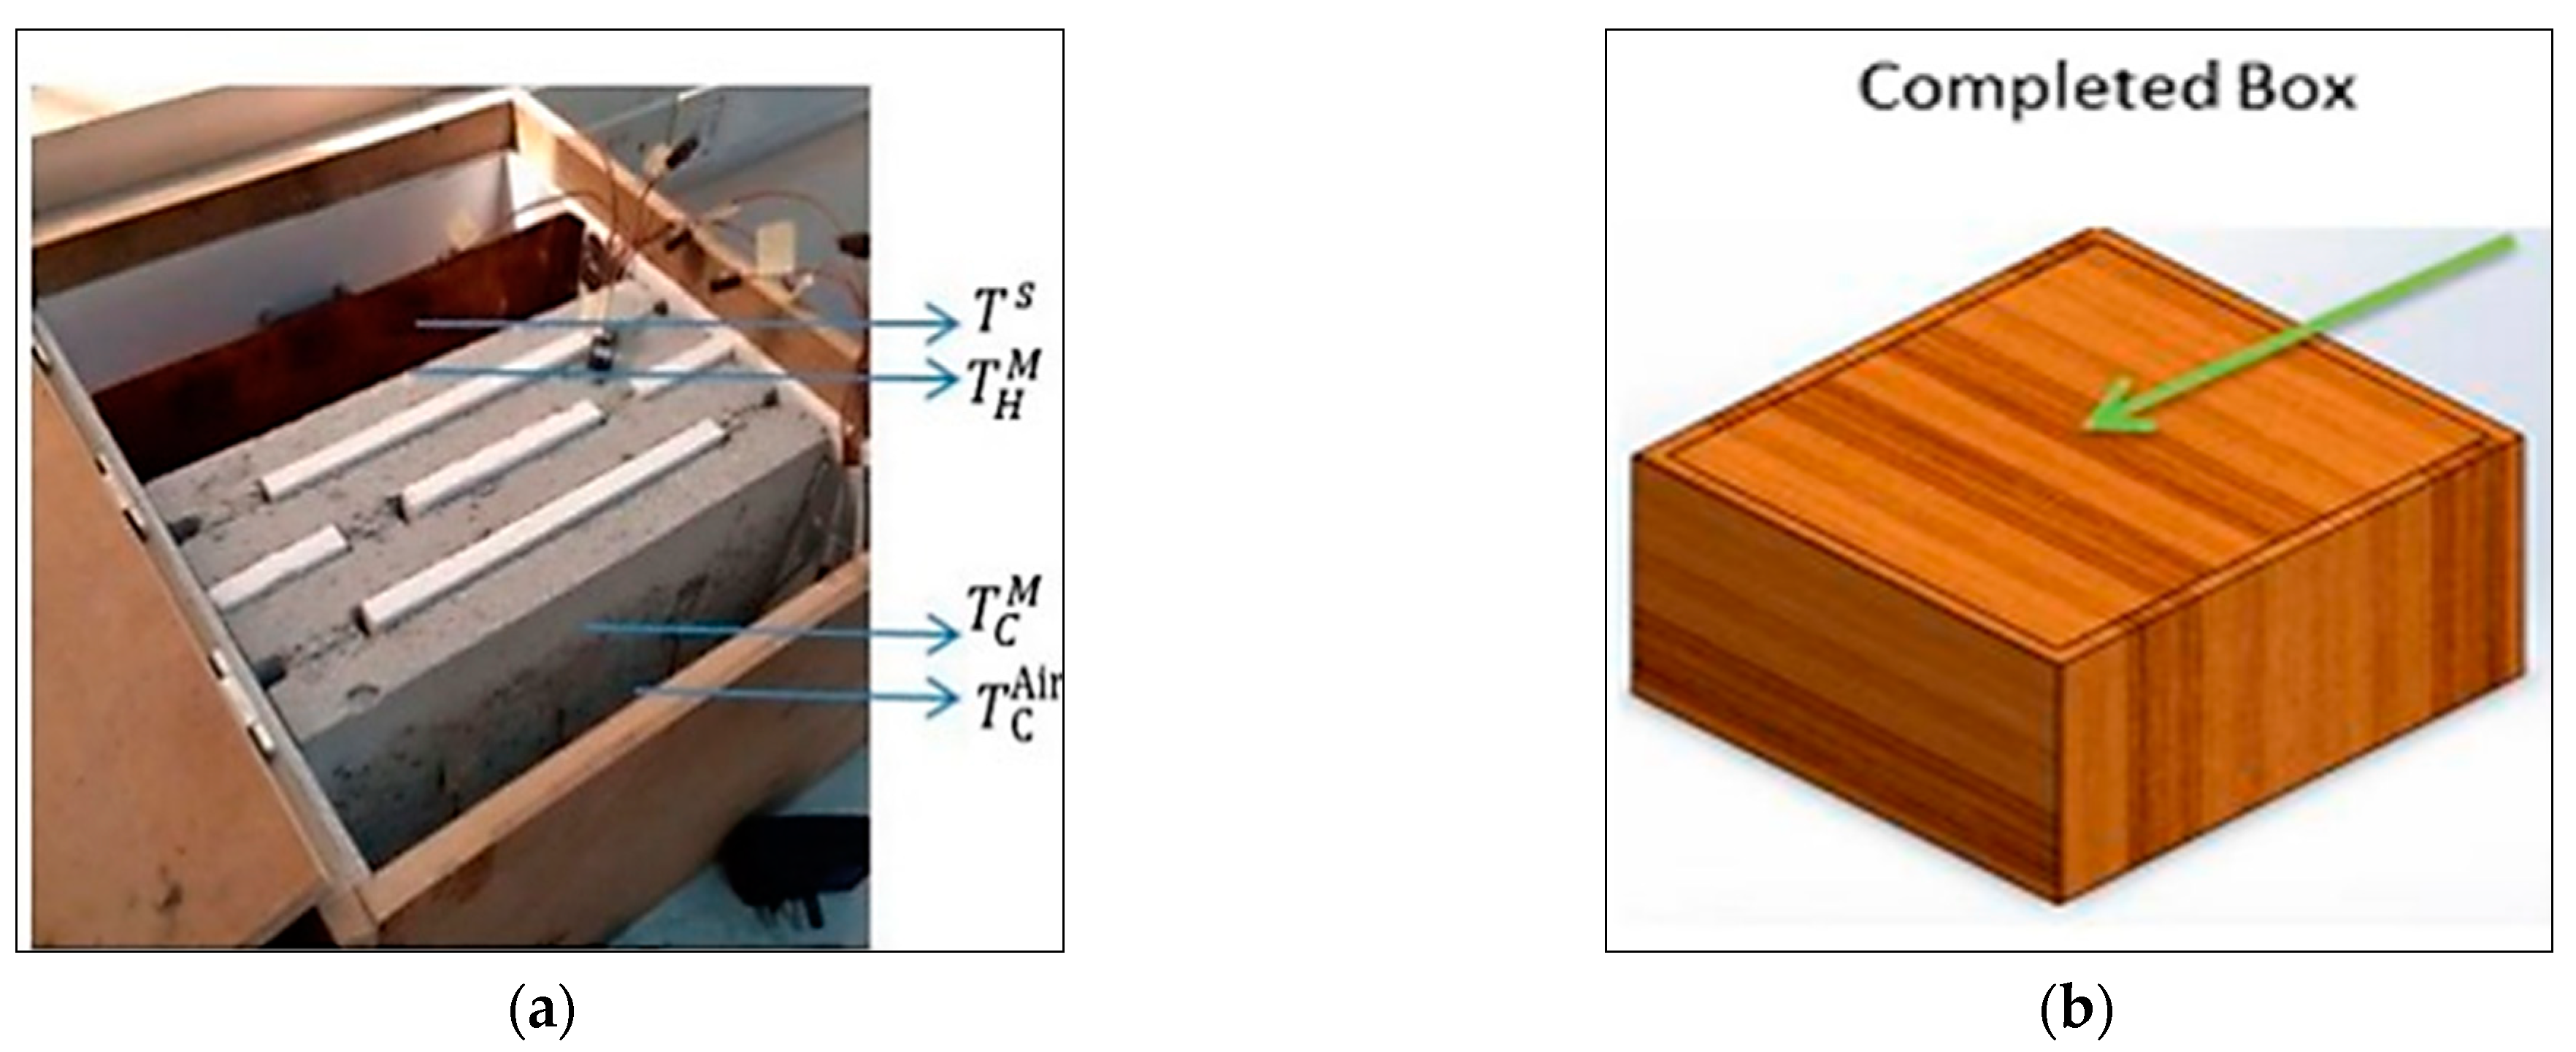
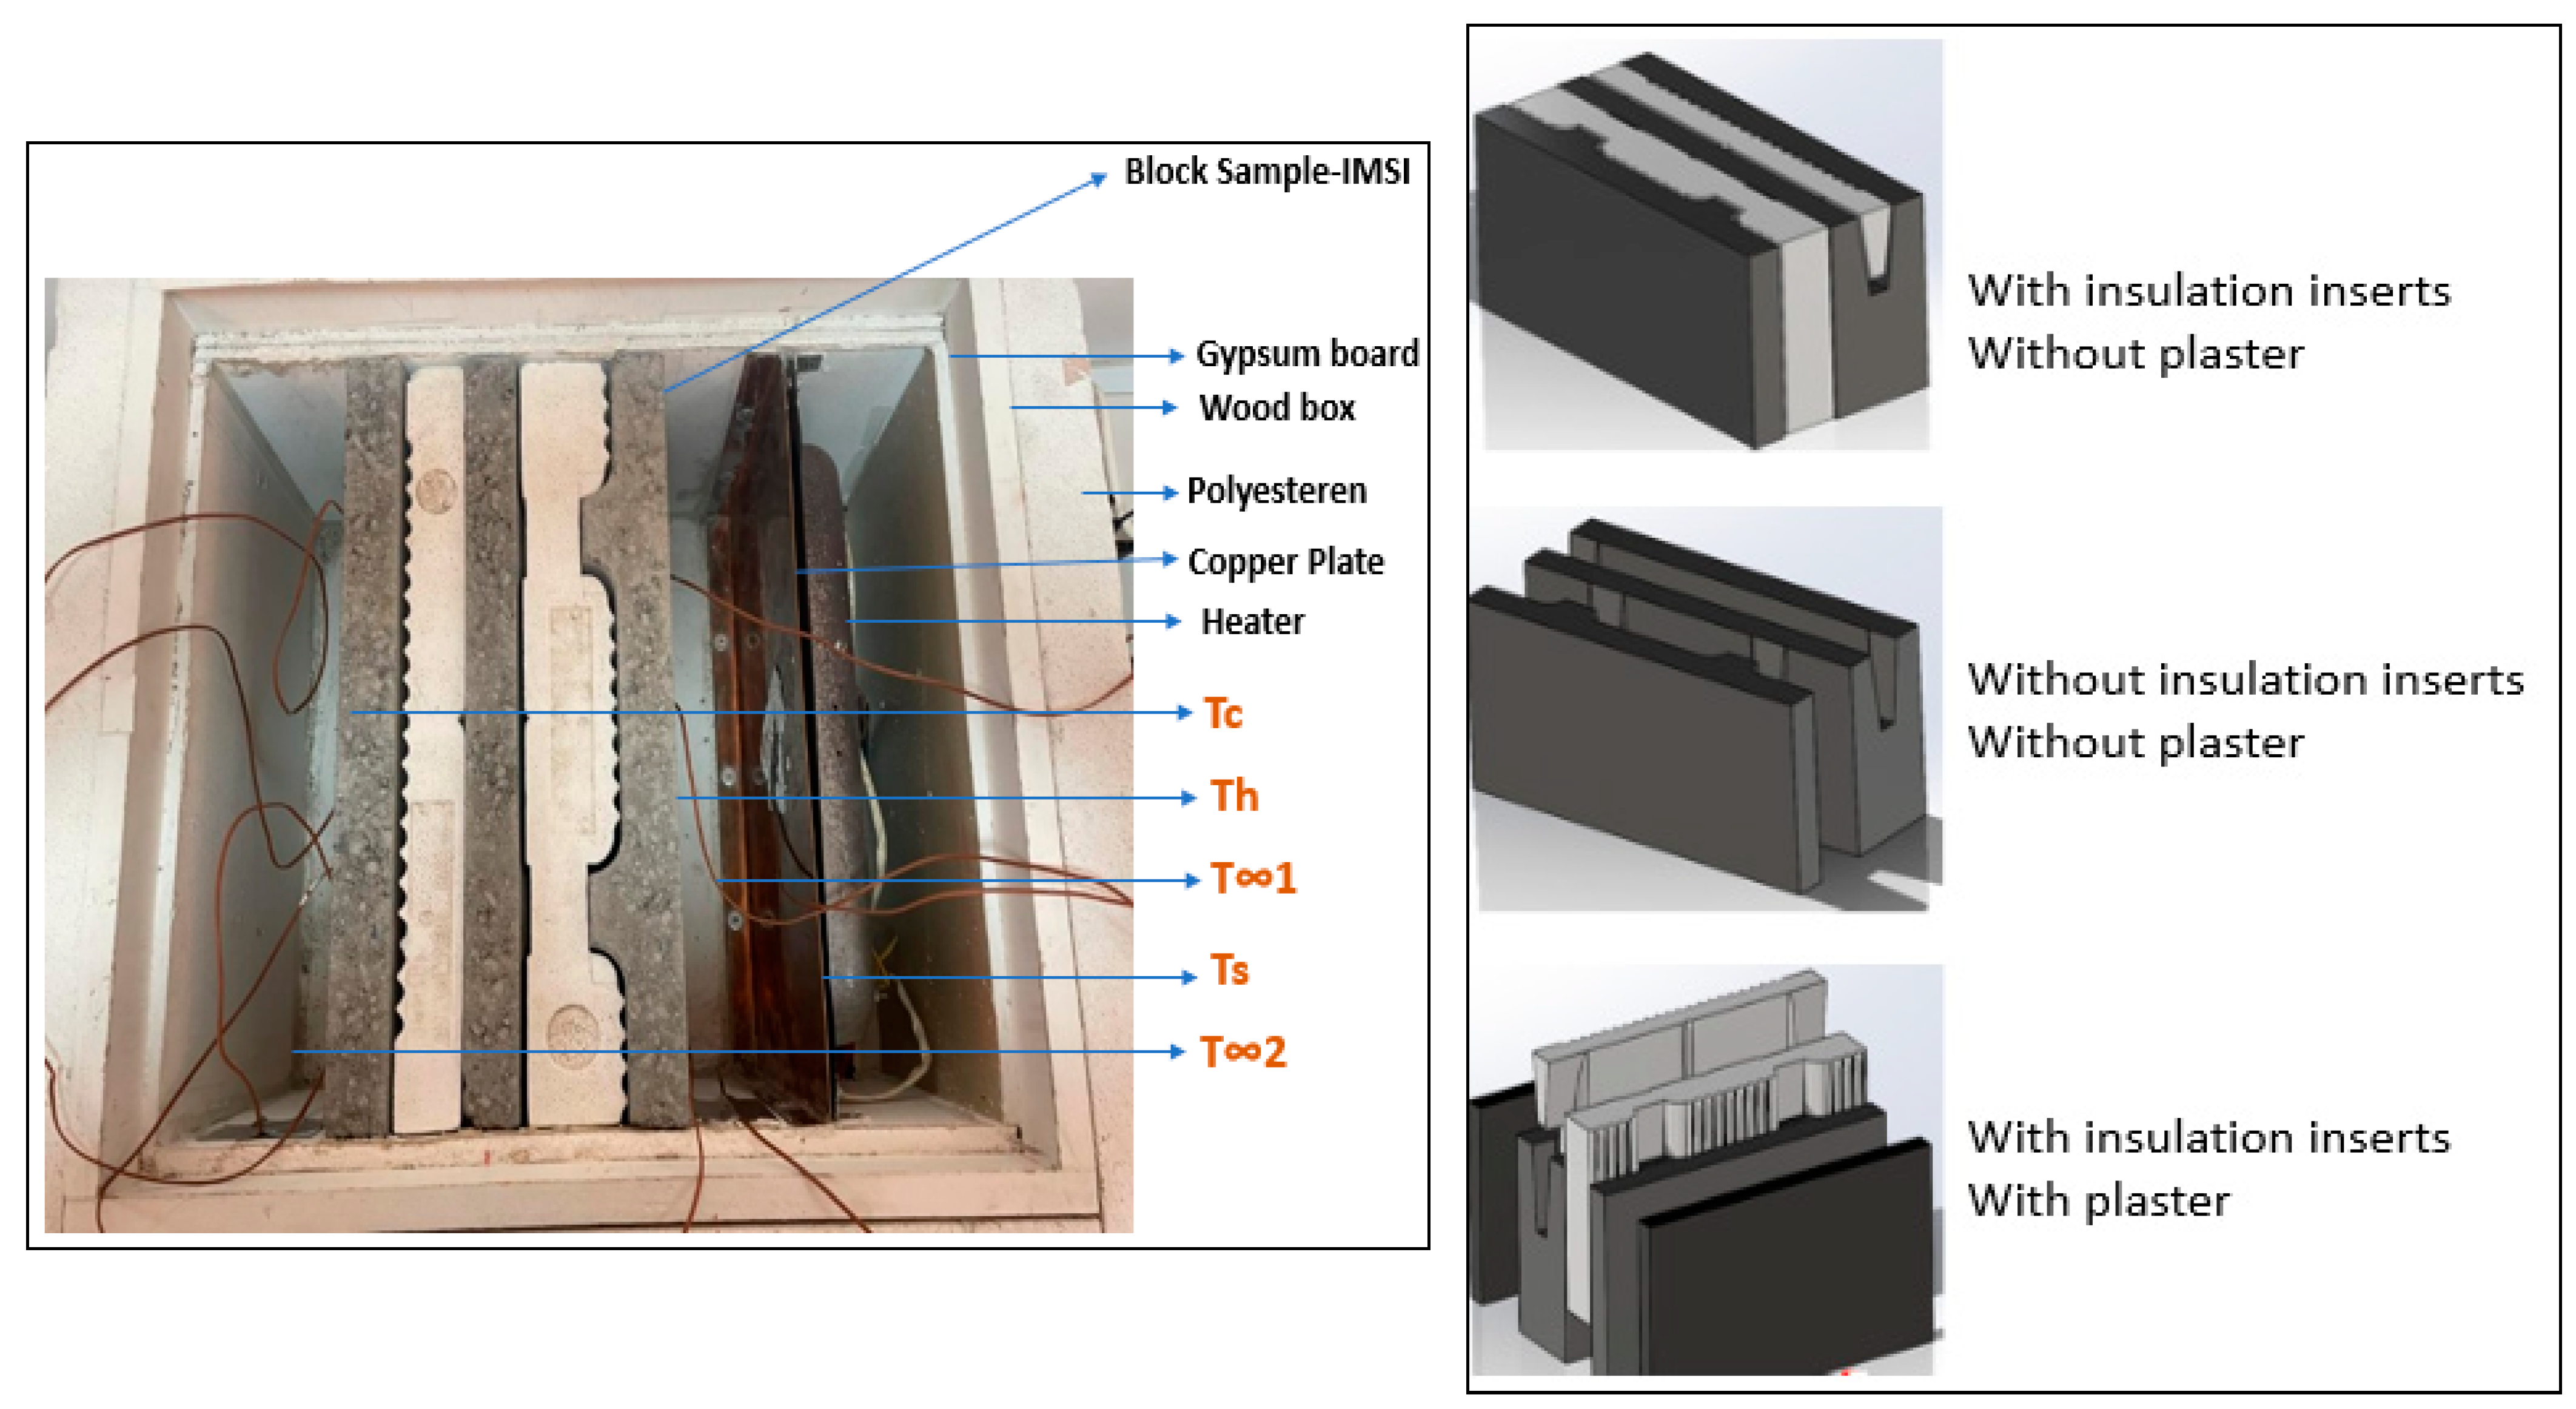
2.5. Experimental Method
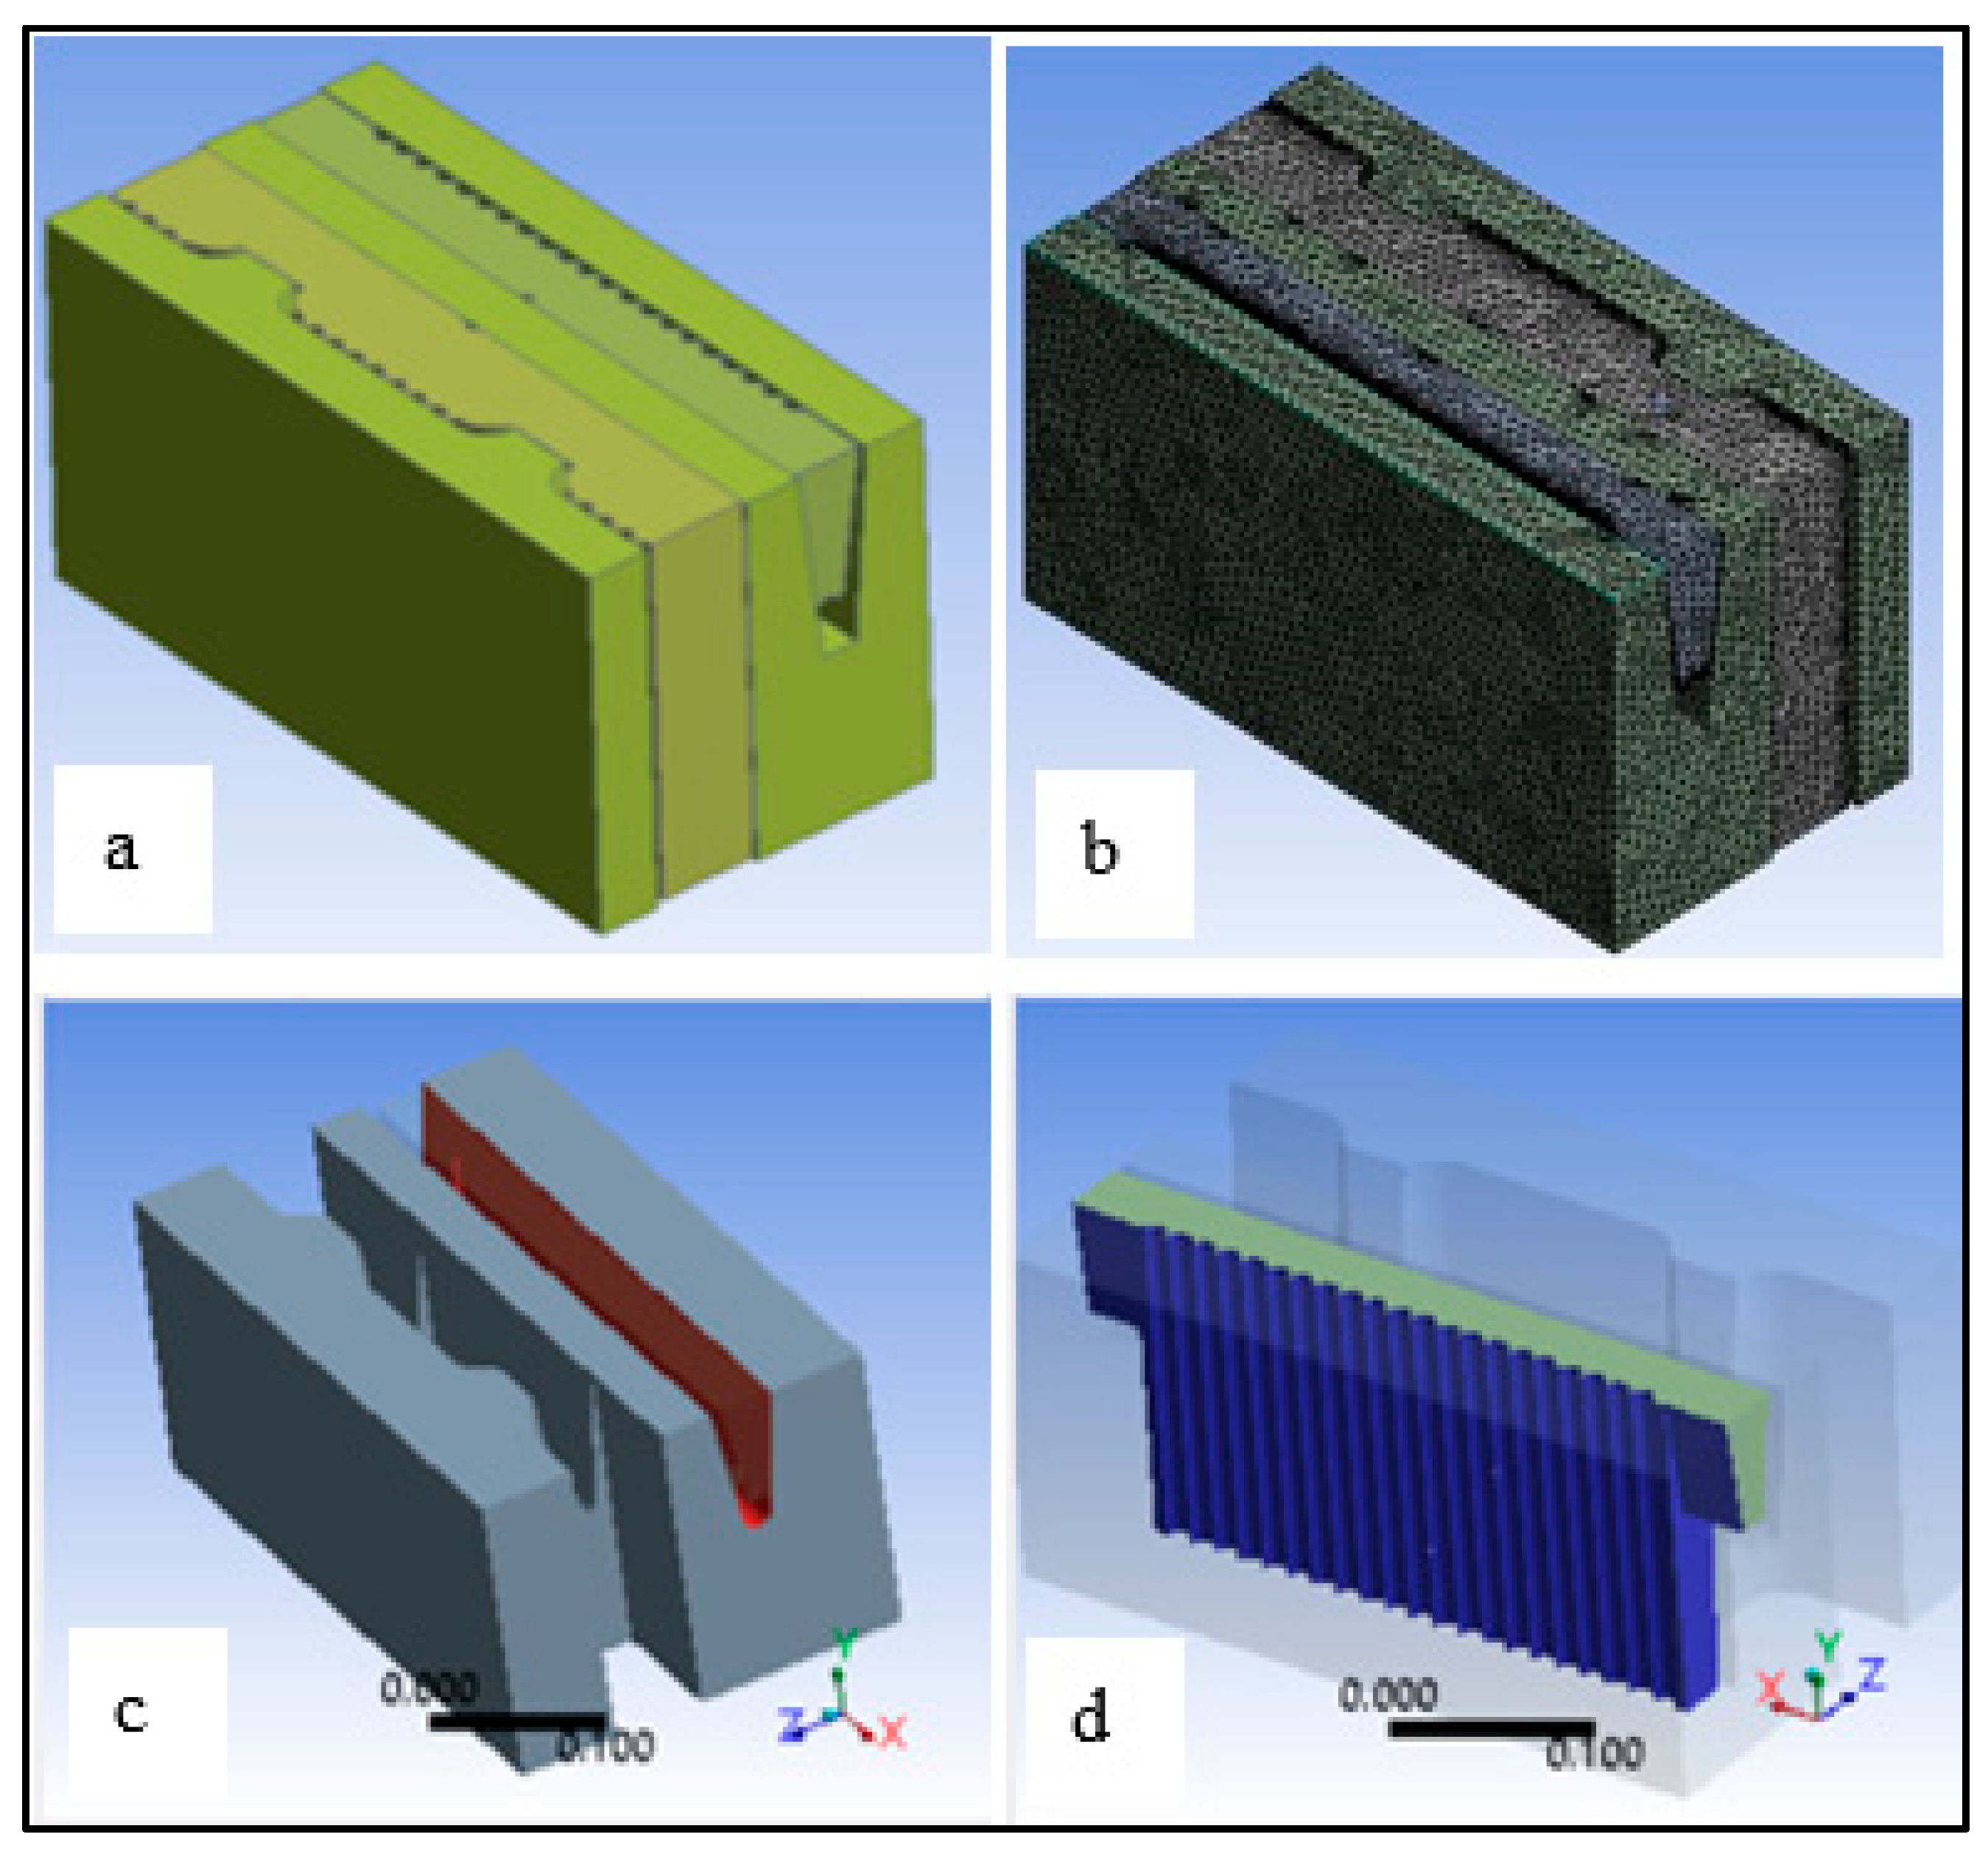
2.6. Numerical Method
3. Results and Discussion
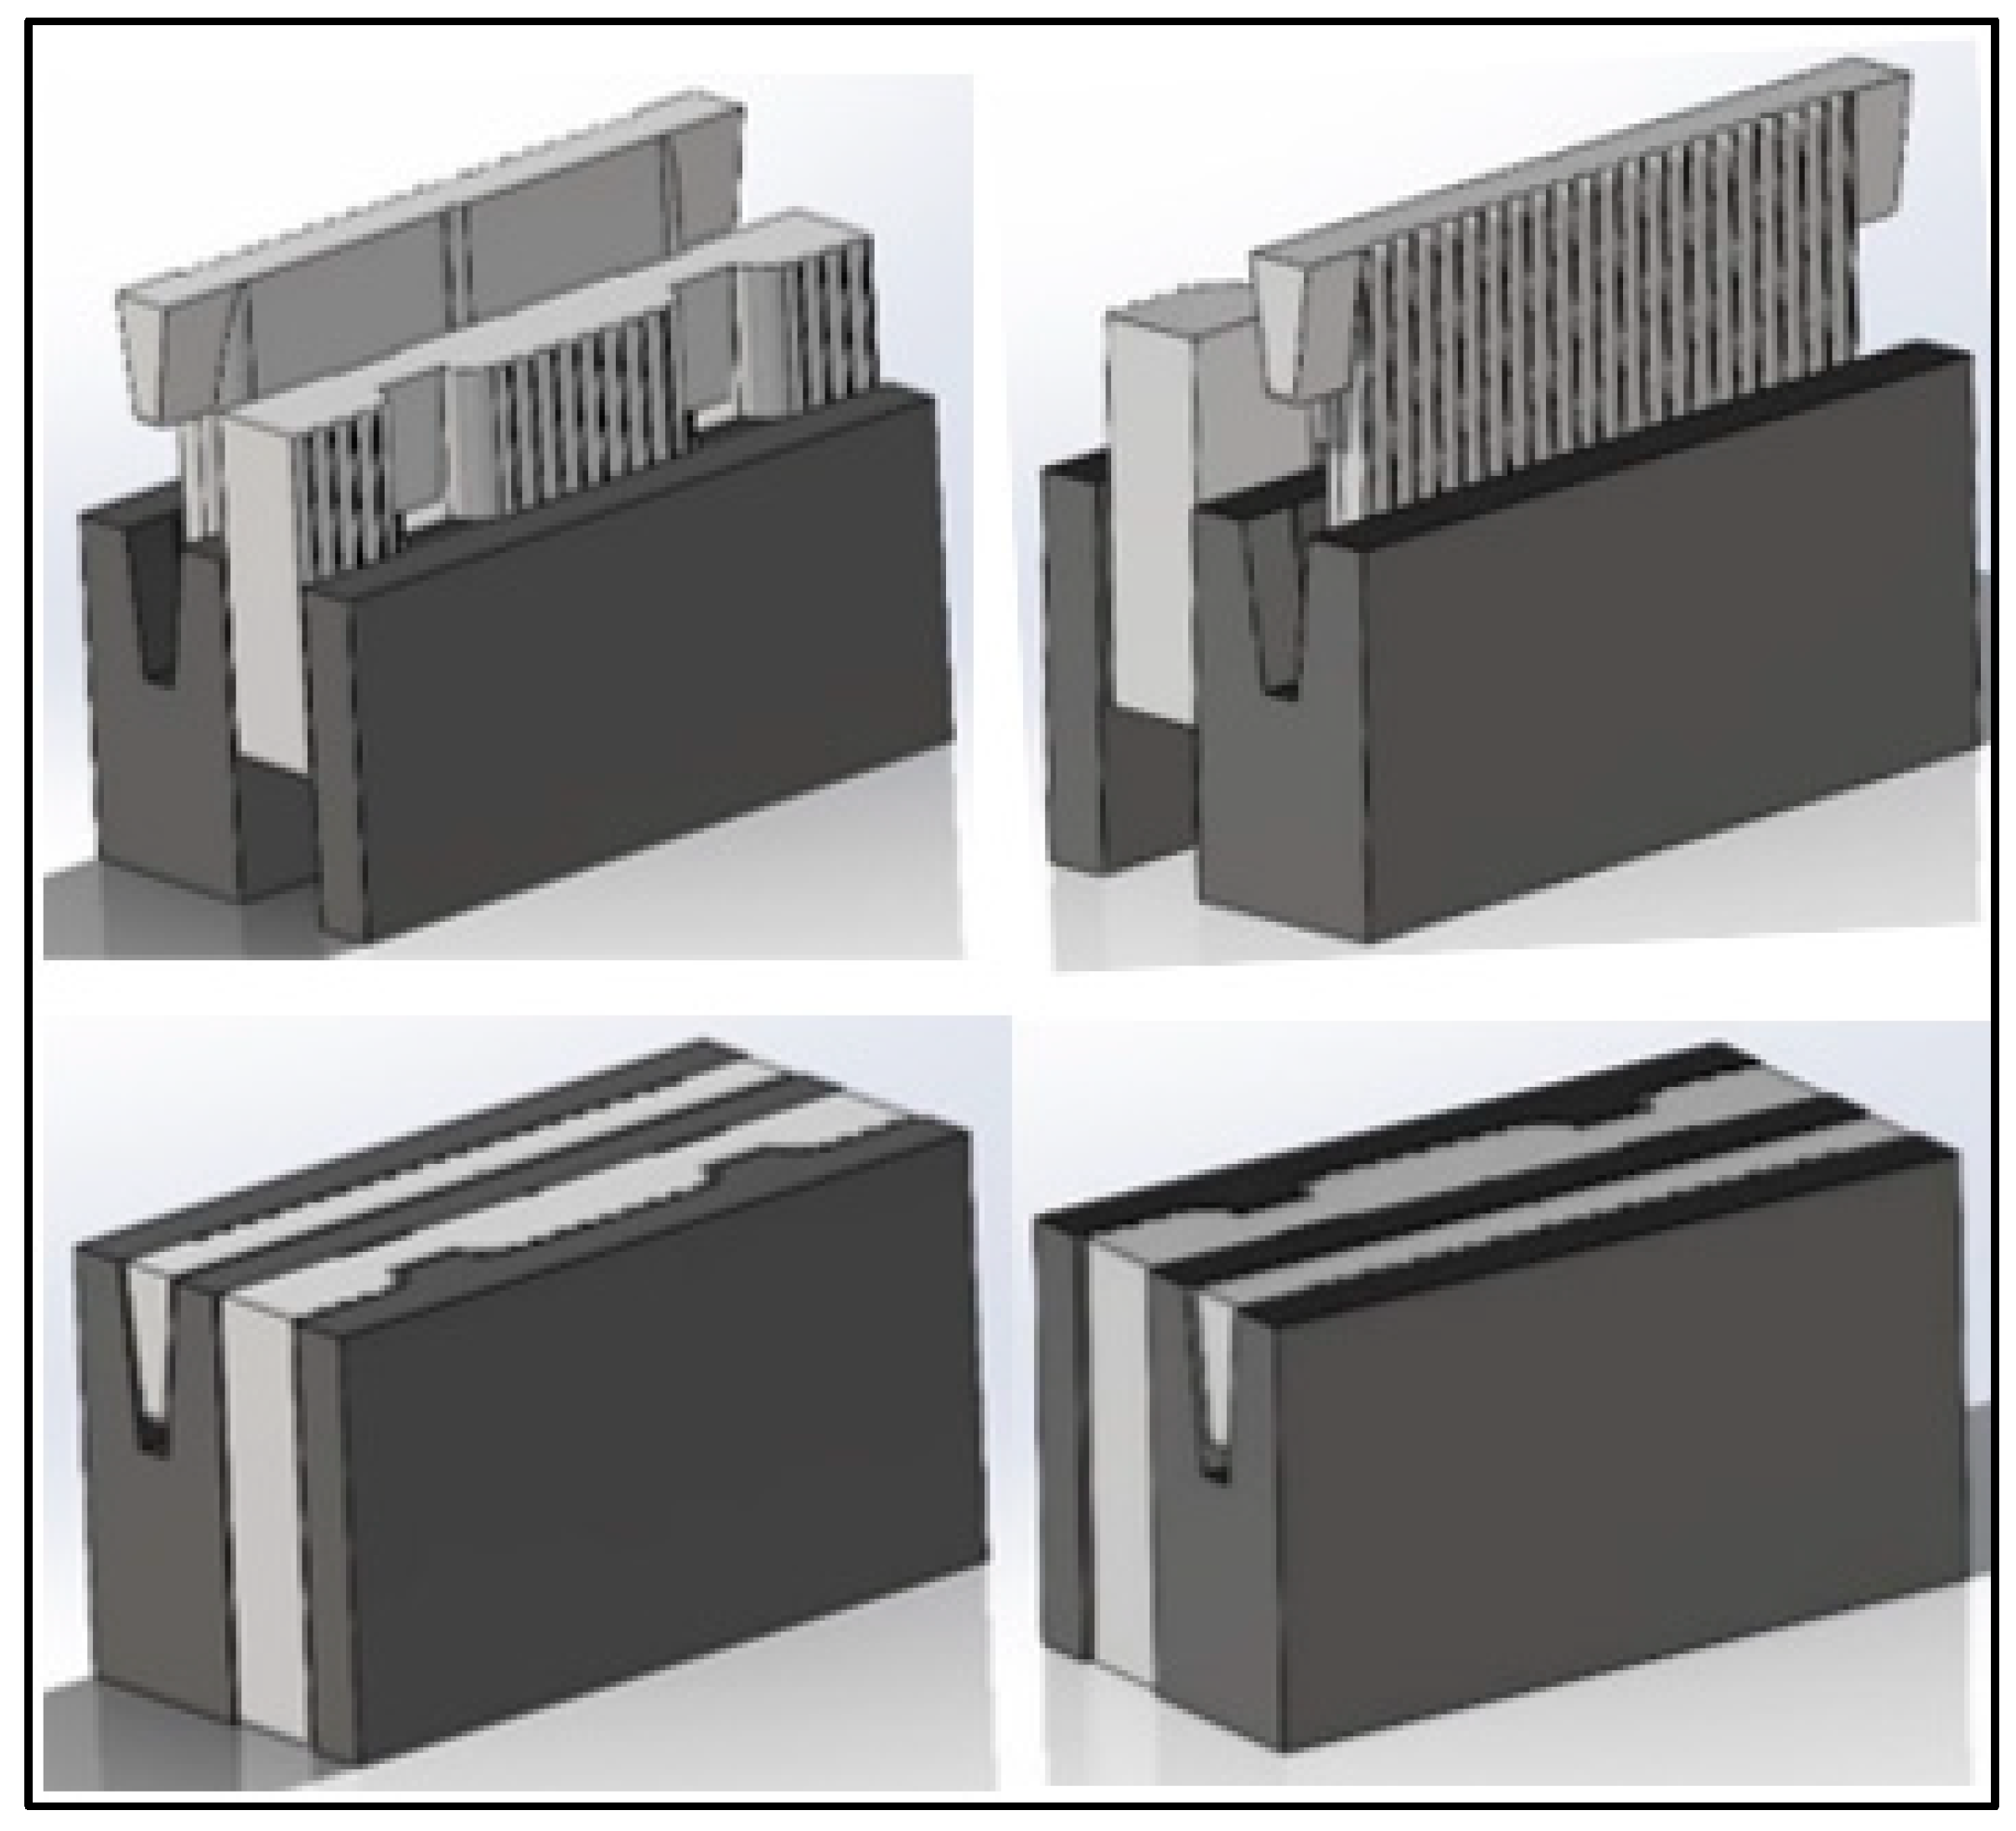
- Study 1: Individual IMSI block system with insulation inserts and without plaster on its surfaces (Experimental).
- Study 2: Individual IMSI block system without insulation inserts and without plaster on its surfaces, insulation is replaced by air (Experimental).
- Study 3: Individual IMSI block system with insulation inserts and with plaster as a study of the block’s usage in real walls of buildings in Bahrain (Experimental).
- Study 4: Individual IMSI block system that further validates studies 1 and 3 by simulation through Ansys (Numerical).
- Study 5: Individual IMSI block system that investigates the optimization process of the height of the results that are obtained from experiment 4 through Ansys (Numerical).
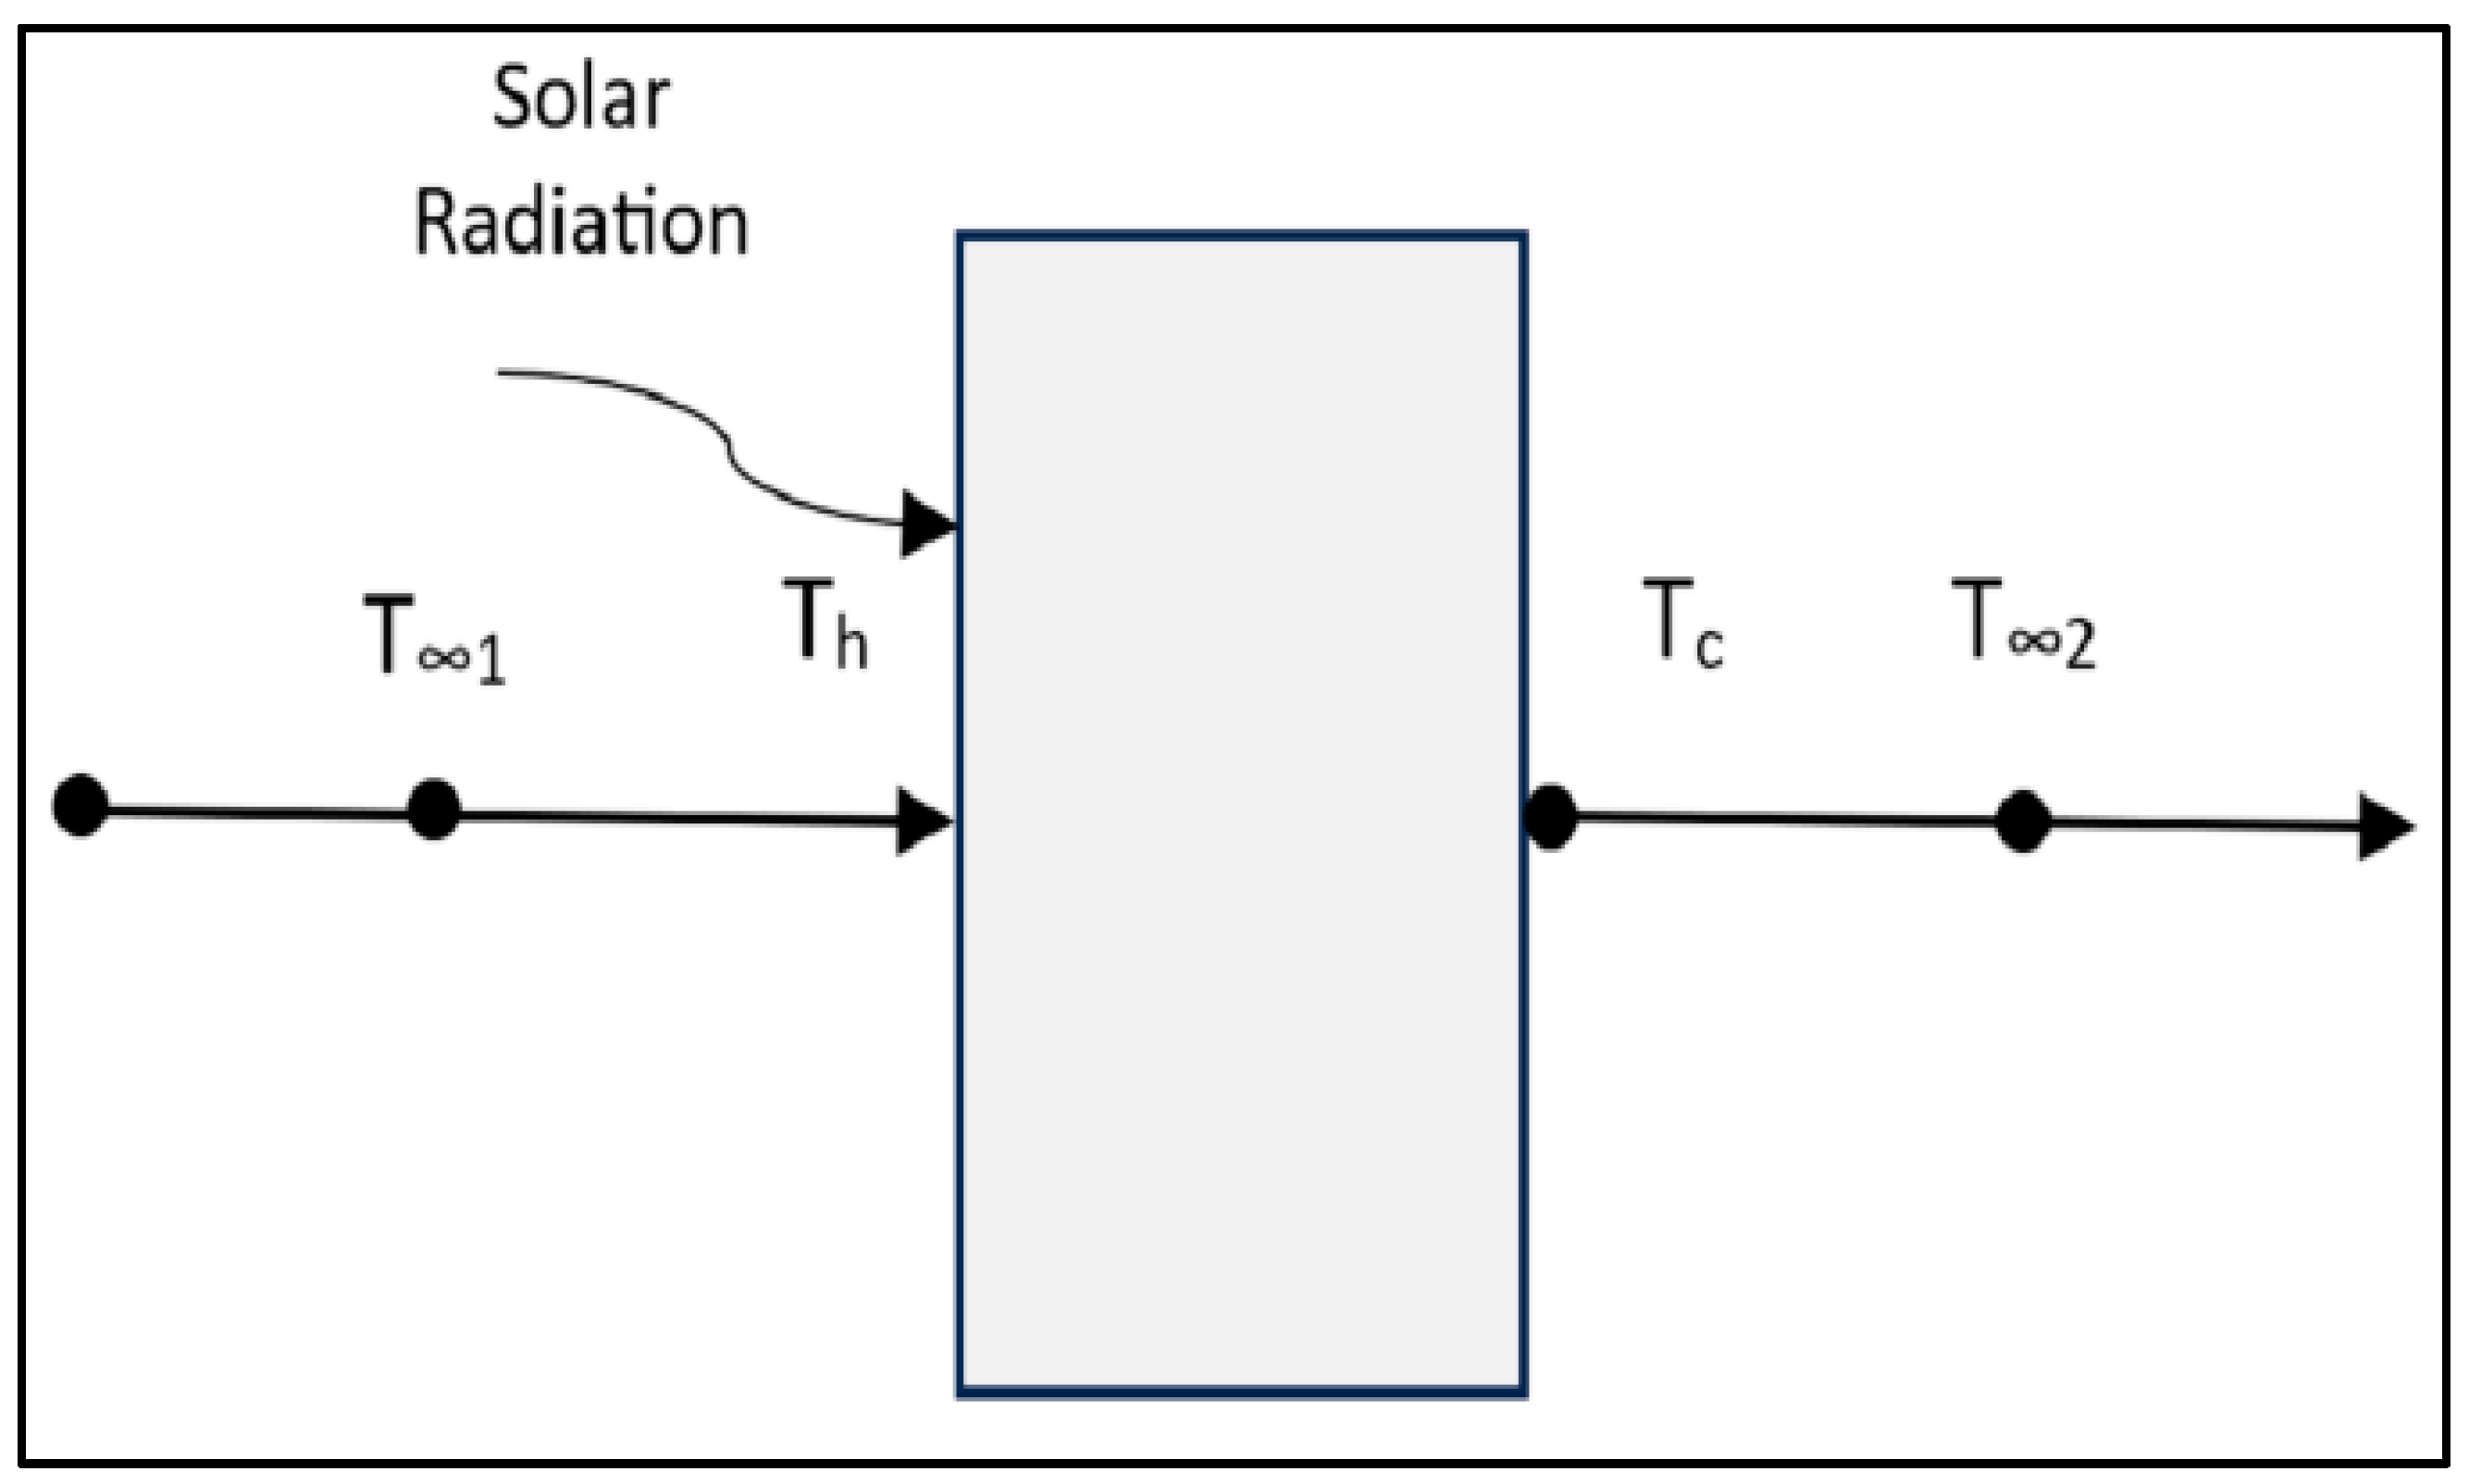
- One-dimensional conduction heat transfer along the x-axis.
- No heat losses take place through the walls of the experimental unit.
- Radiation effects are neglected.
- The effects of the mortar types are neglected.
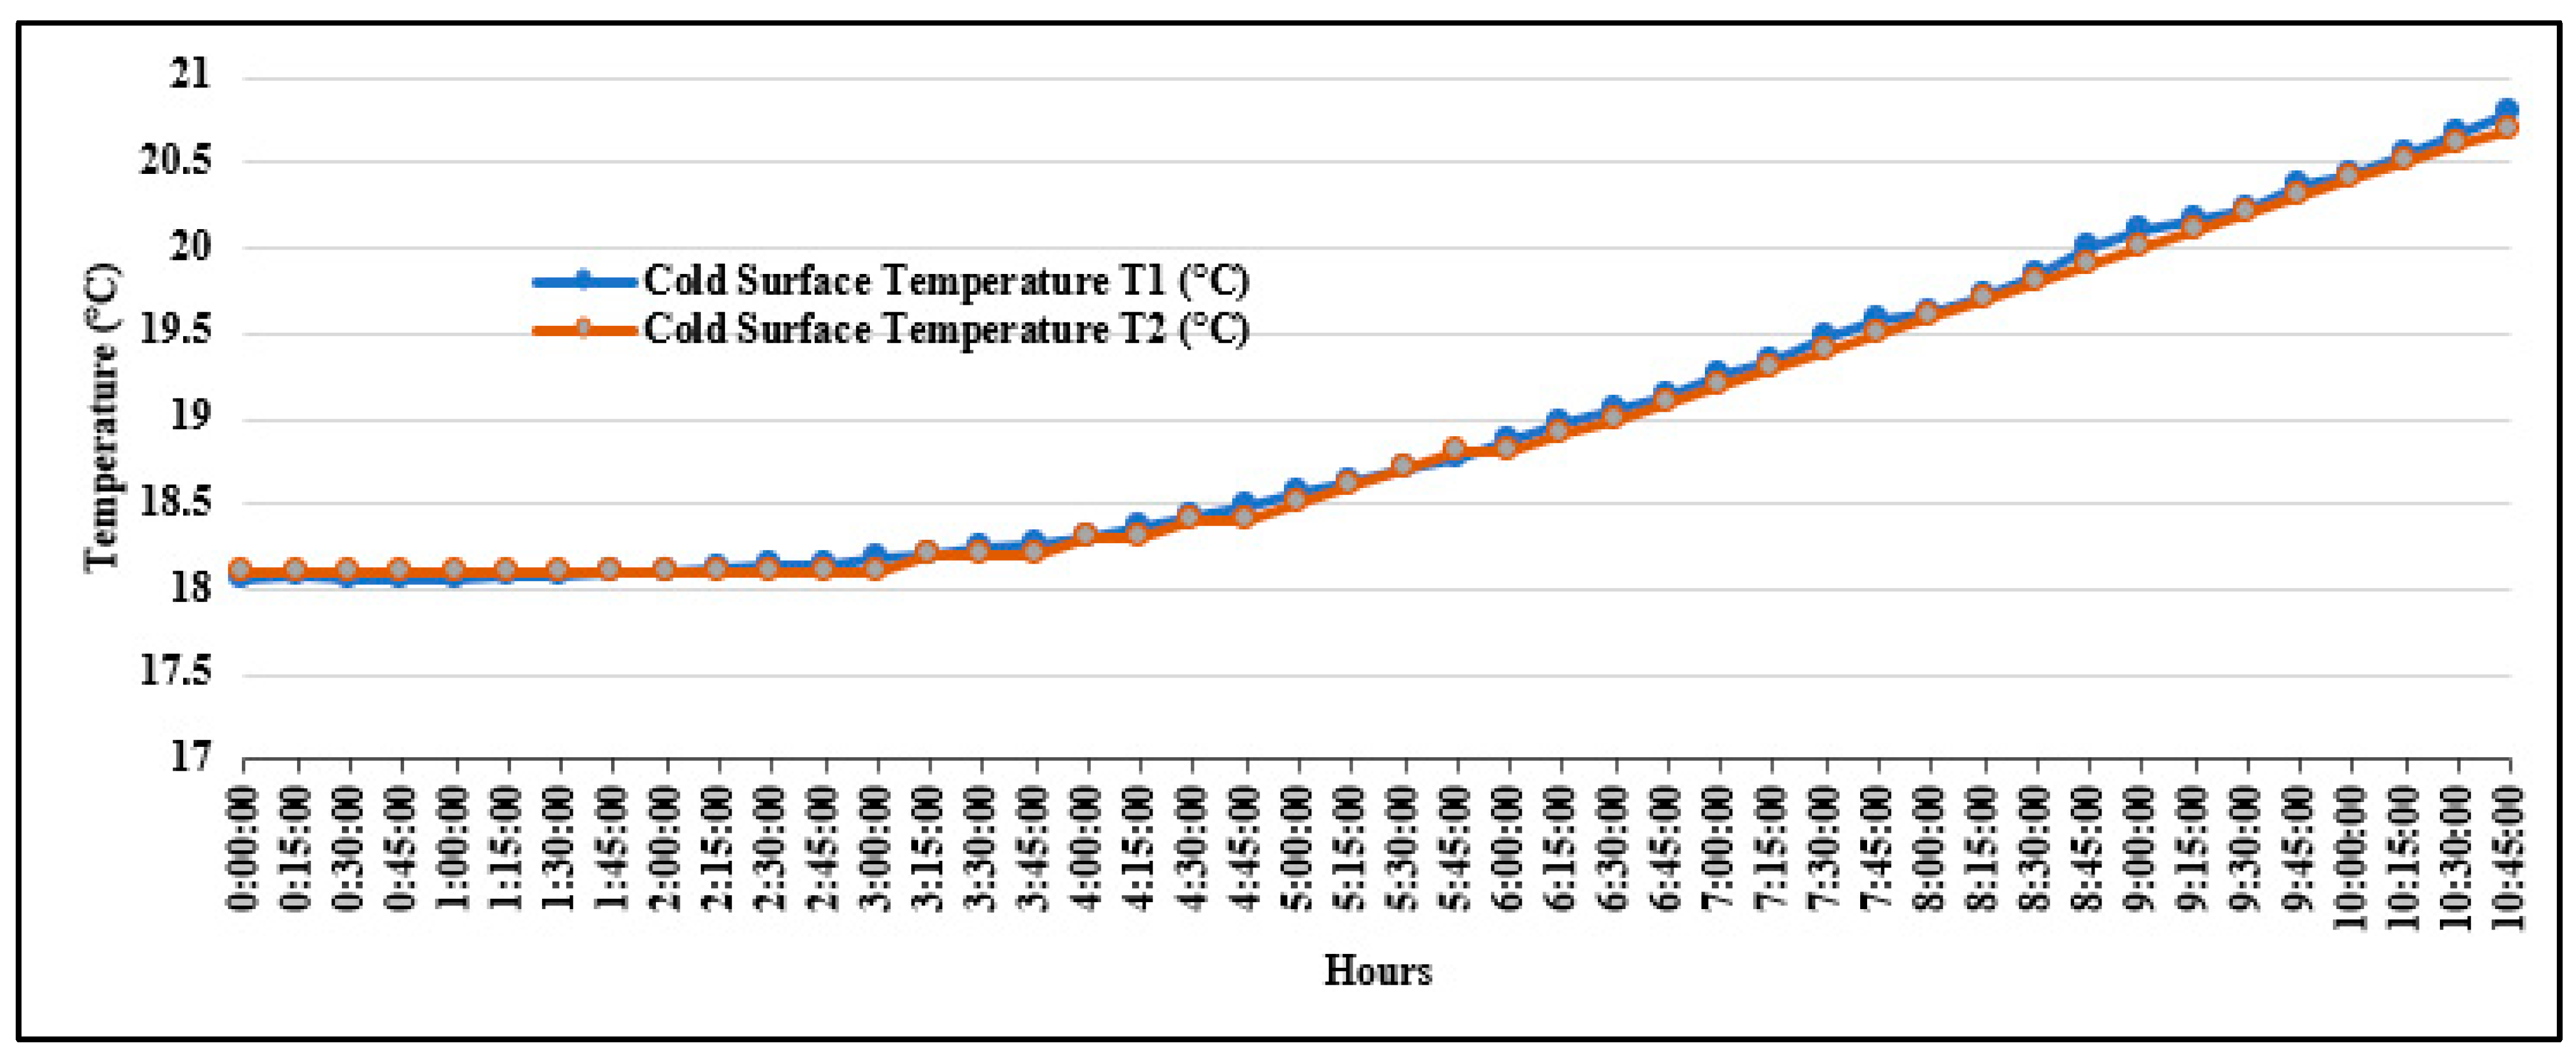
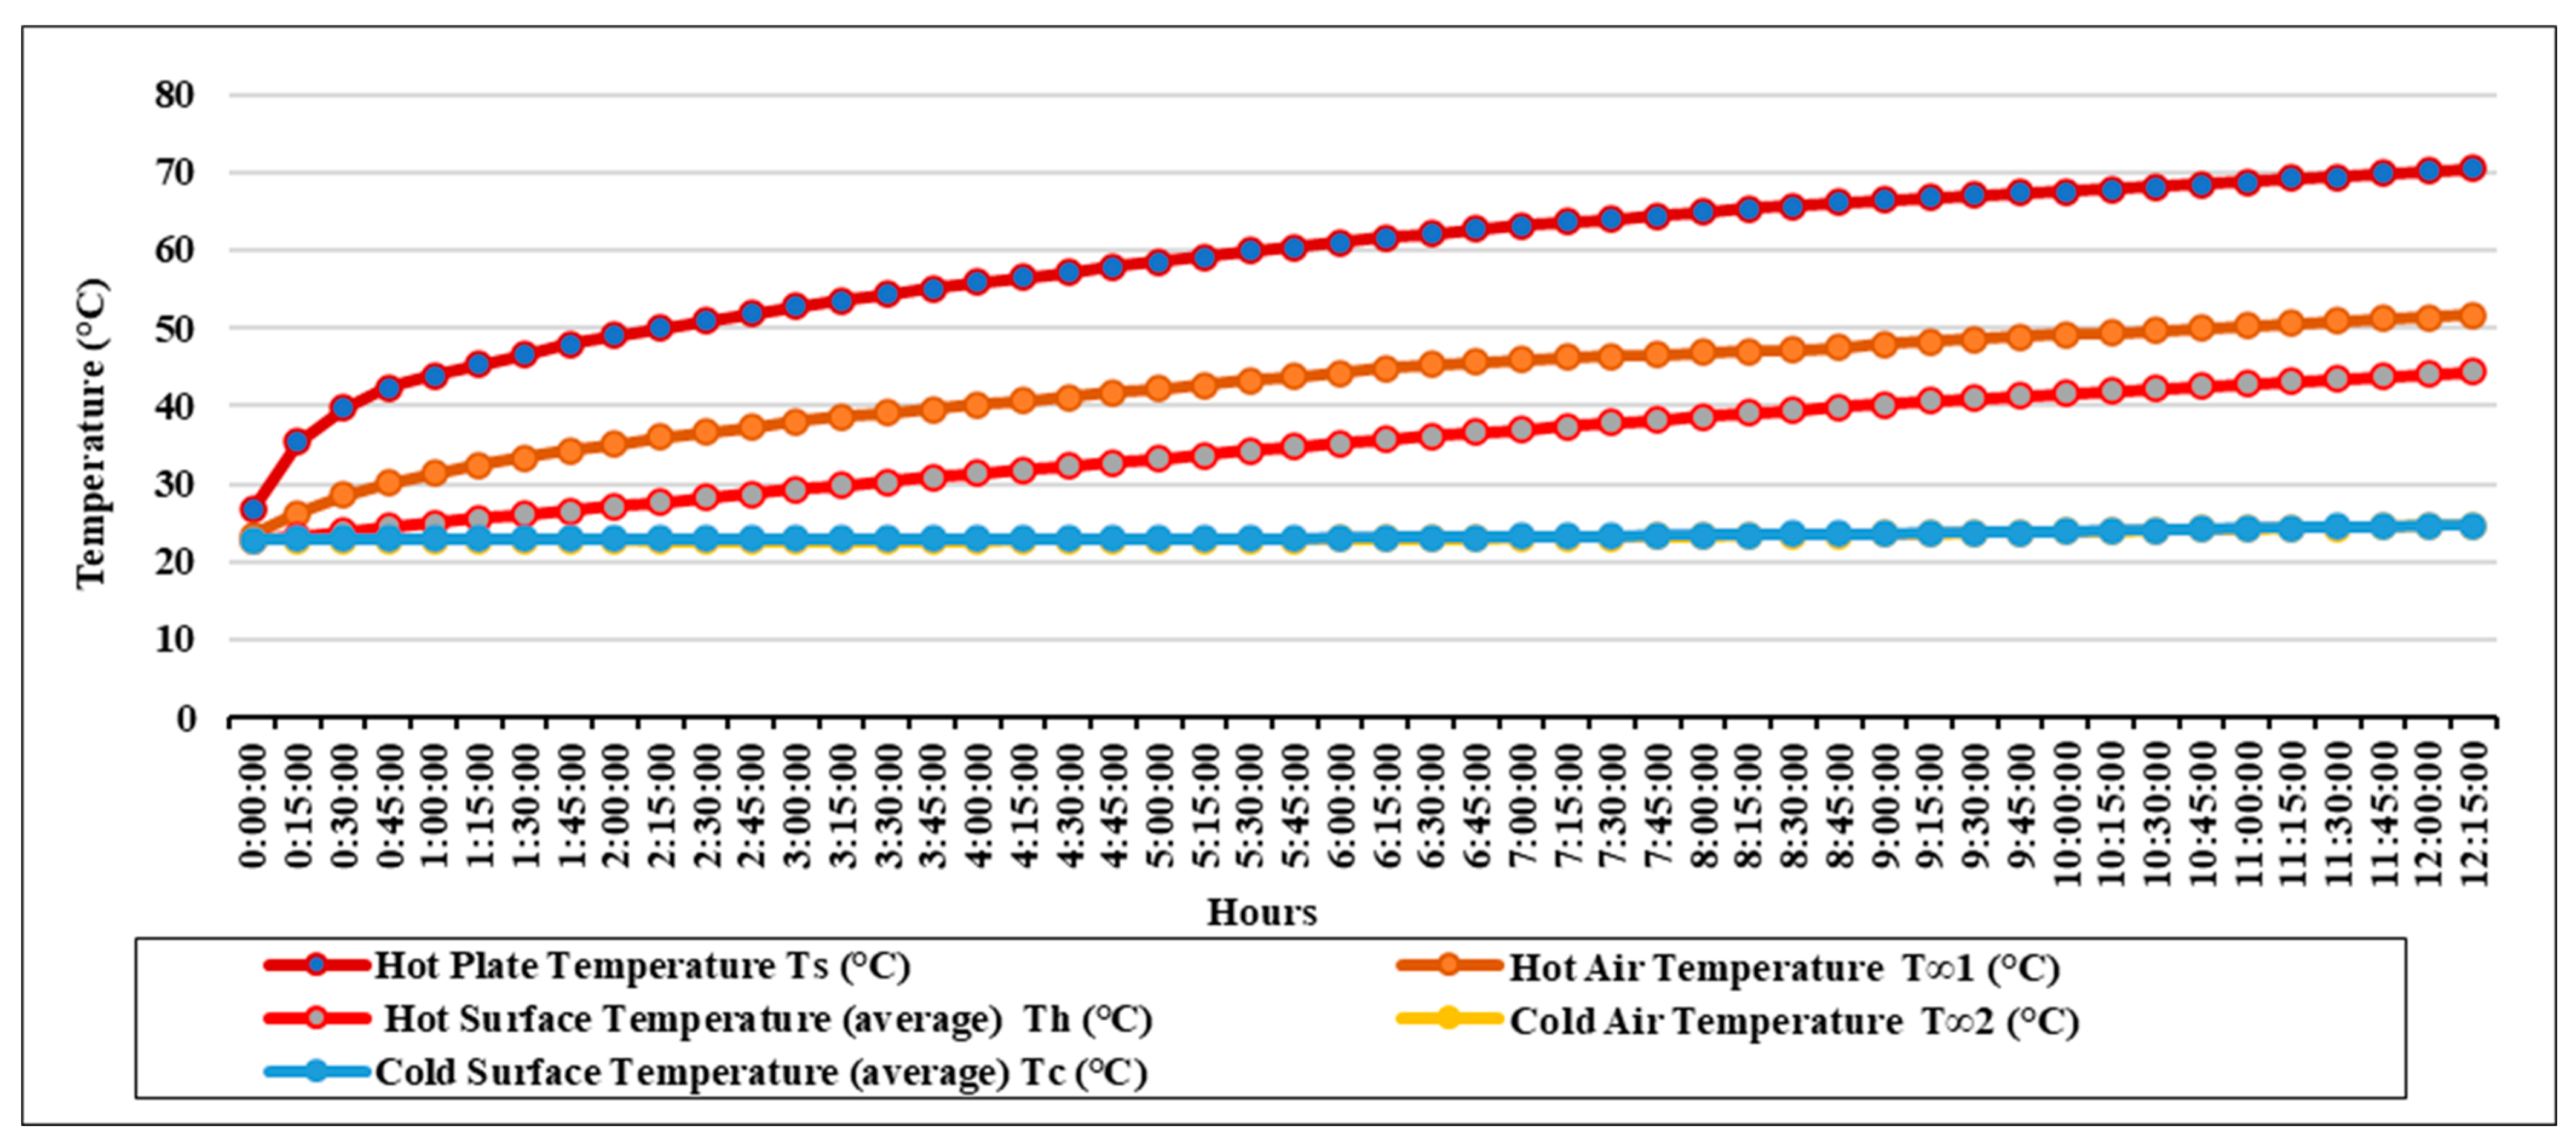
3.1. Temperature Measurements, Discussion and Validation
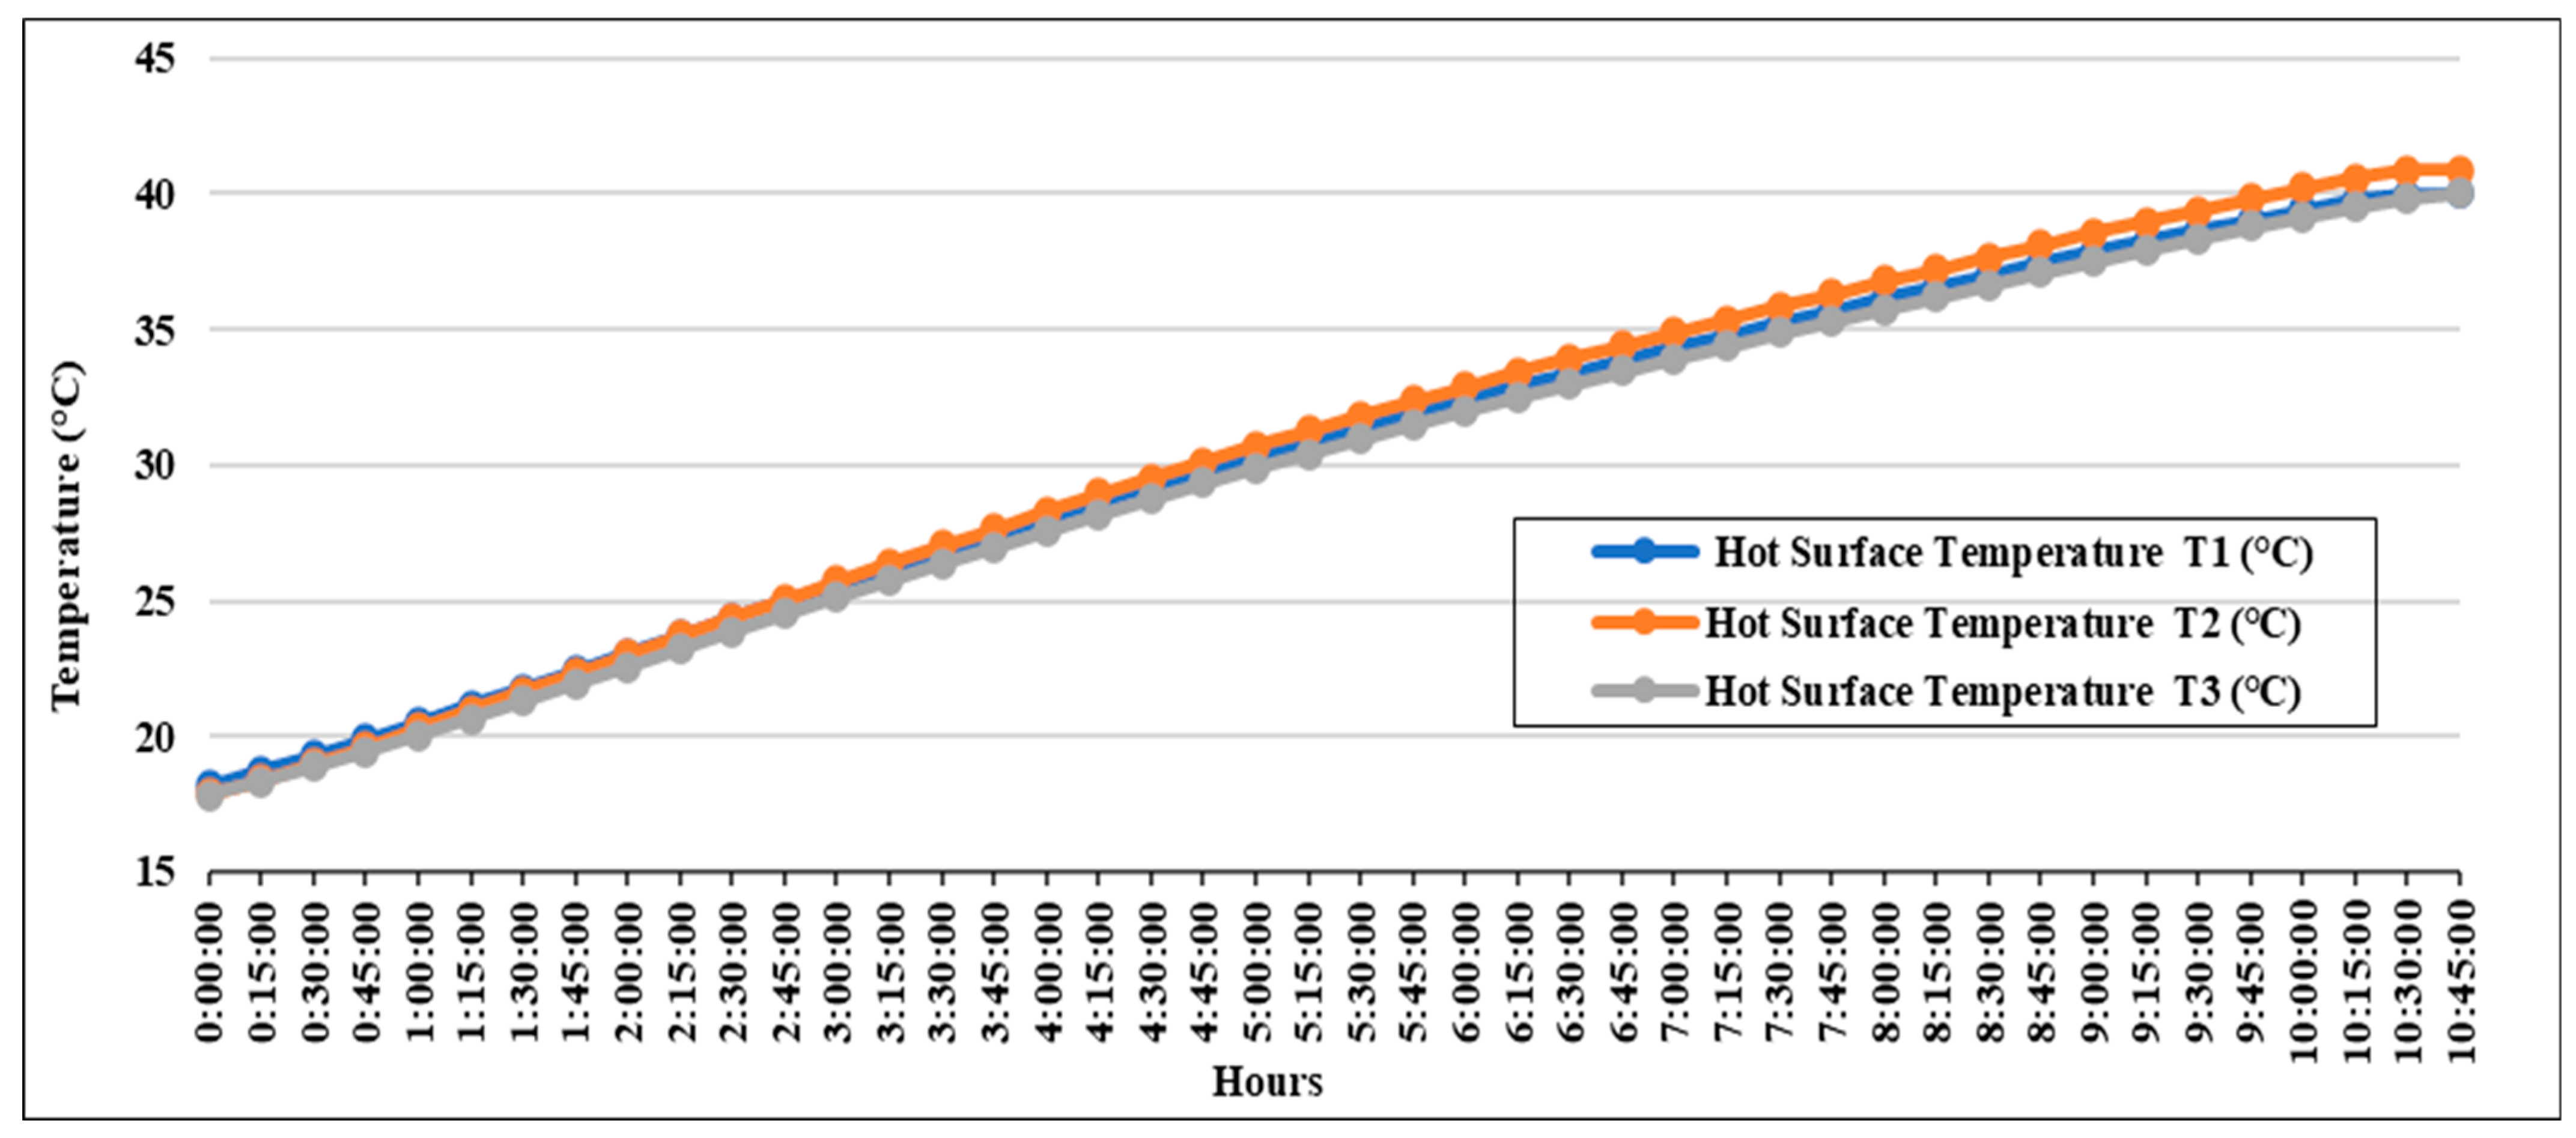
3.1.1. Study 1: Individual Block System with Insulation Inserts and without Plaster Using Hot Box (Experimental)
3.1.2. Study 2: Individual Block System without Insulation Inserts and without Plaster Using Hot Box (Experimental)
3.1.3. Study 3: Individual Block System with Insulation Inserts and with Plaster Using Hot Box (Experimental)
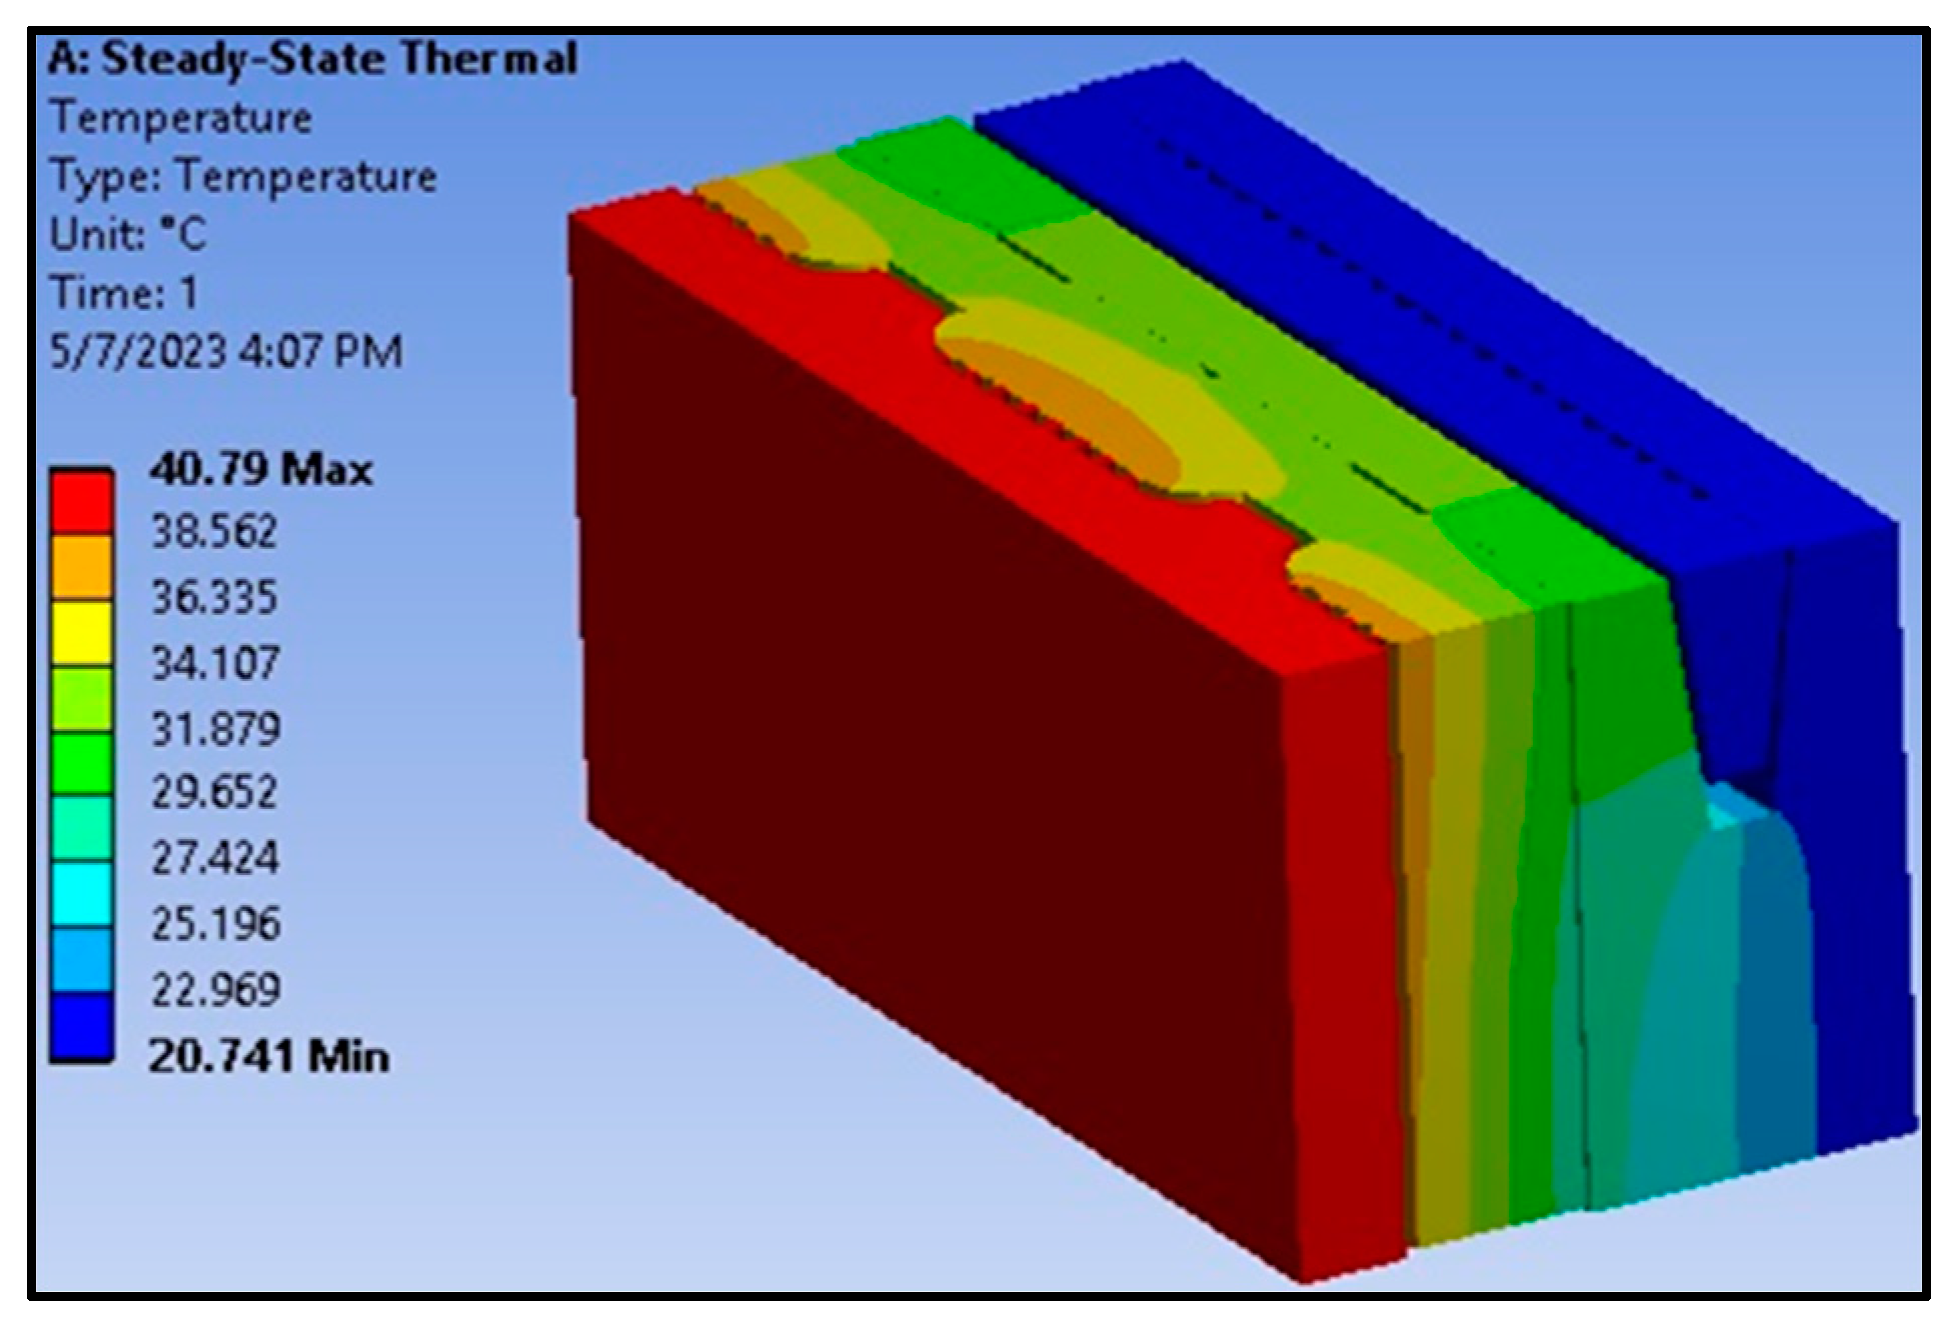
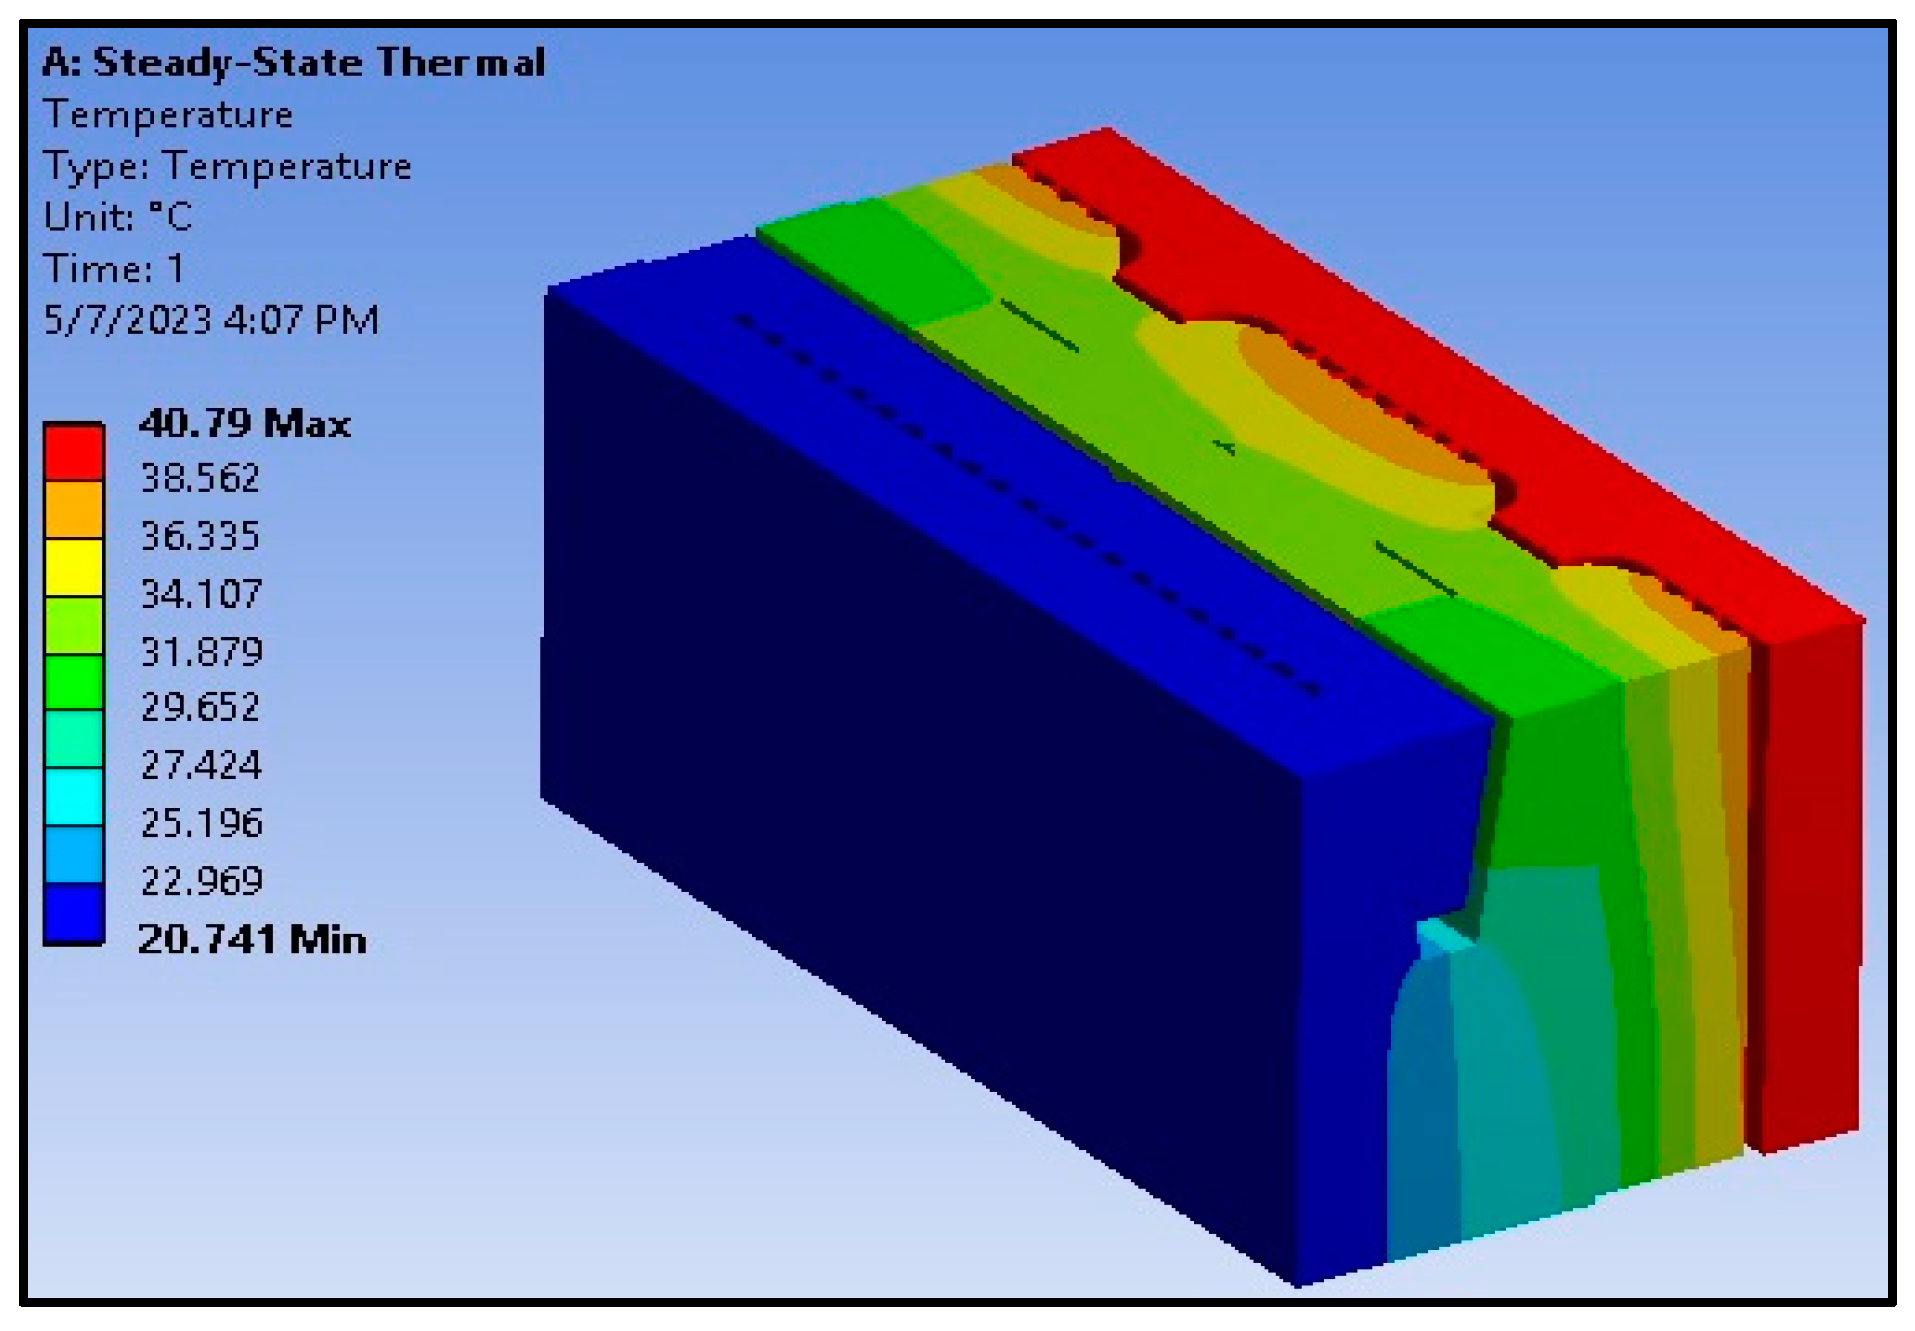
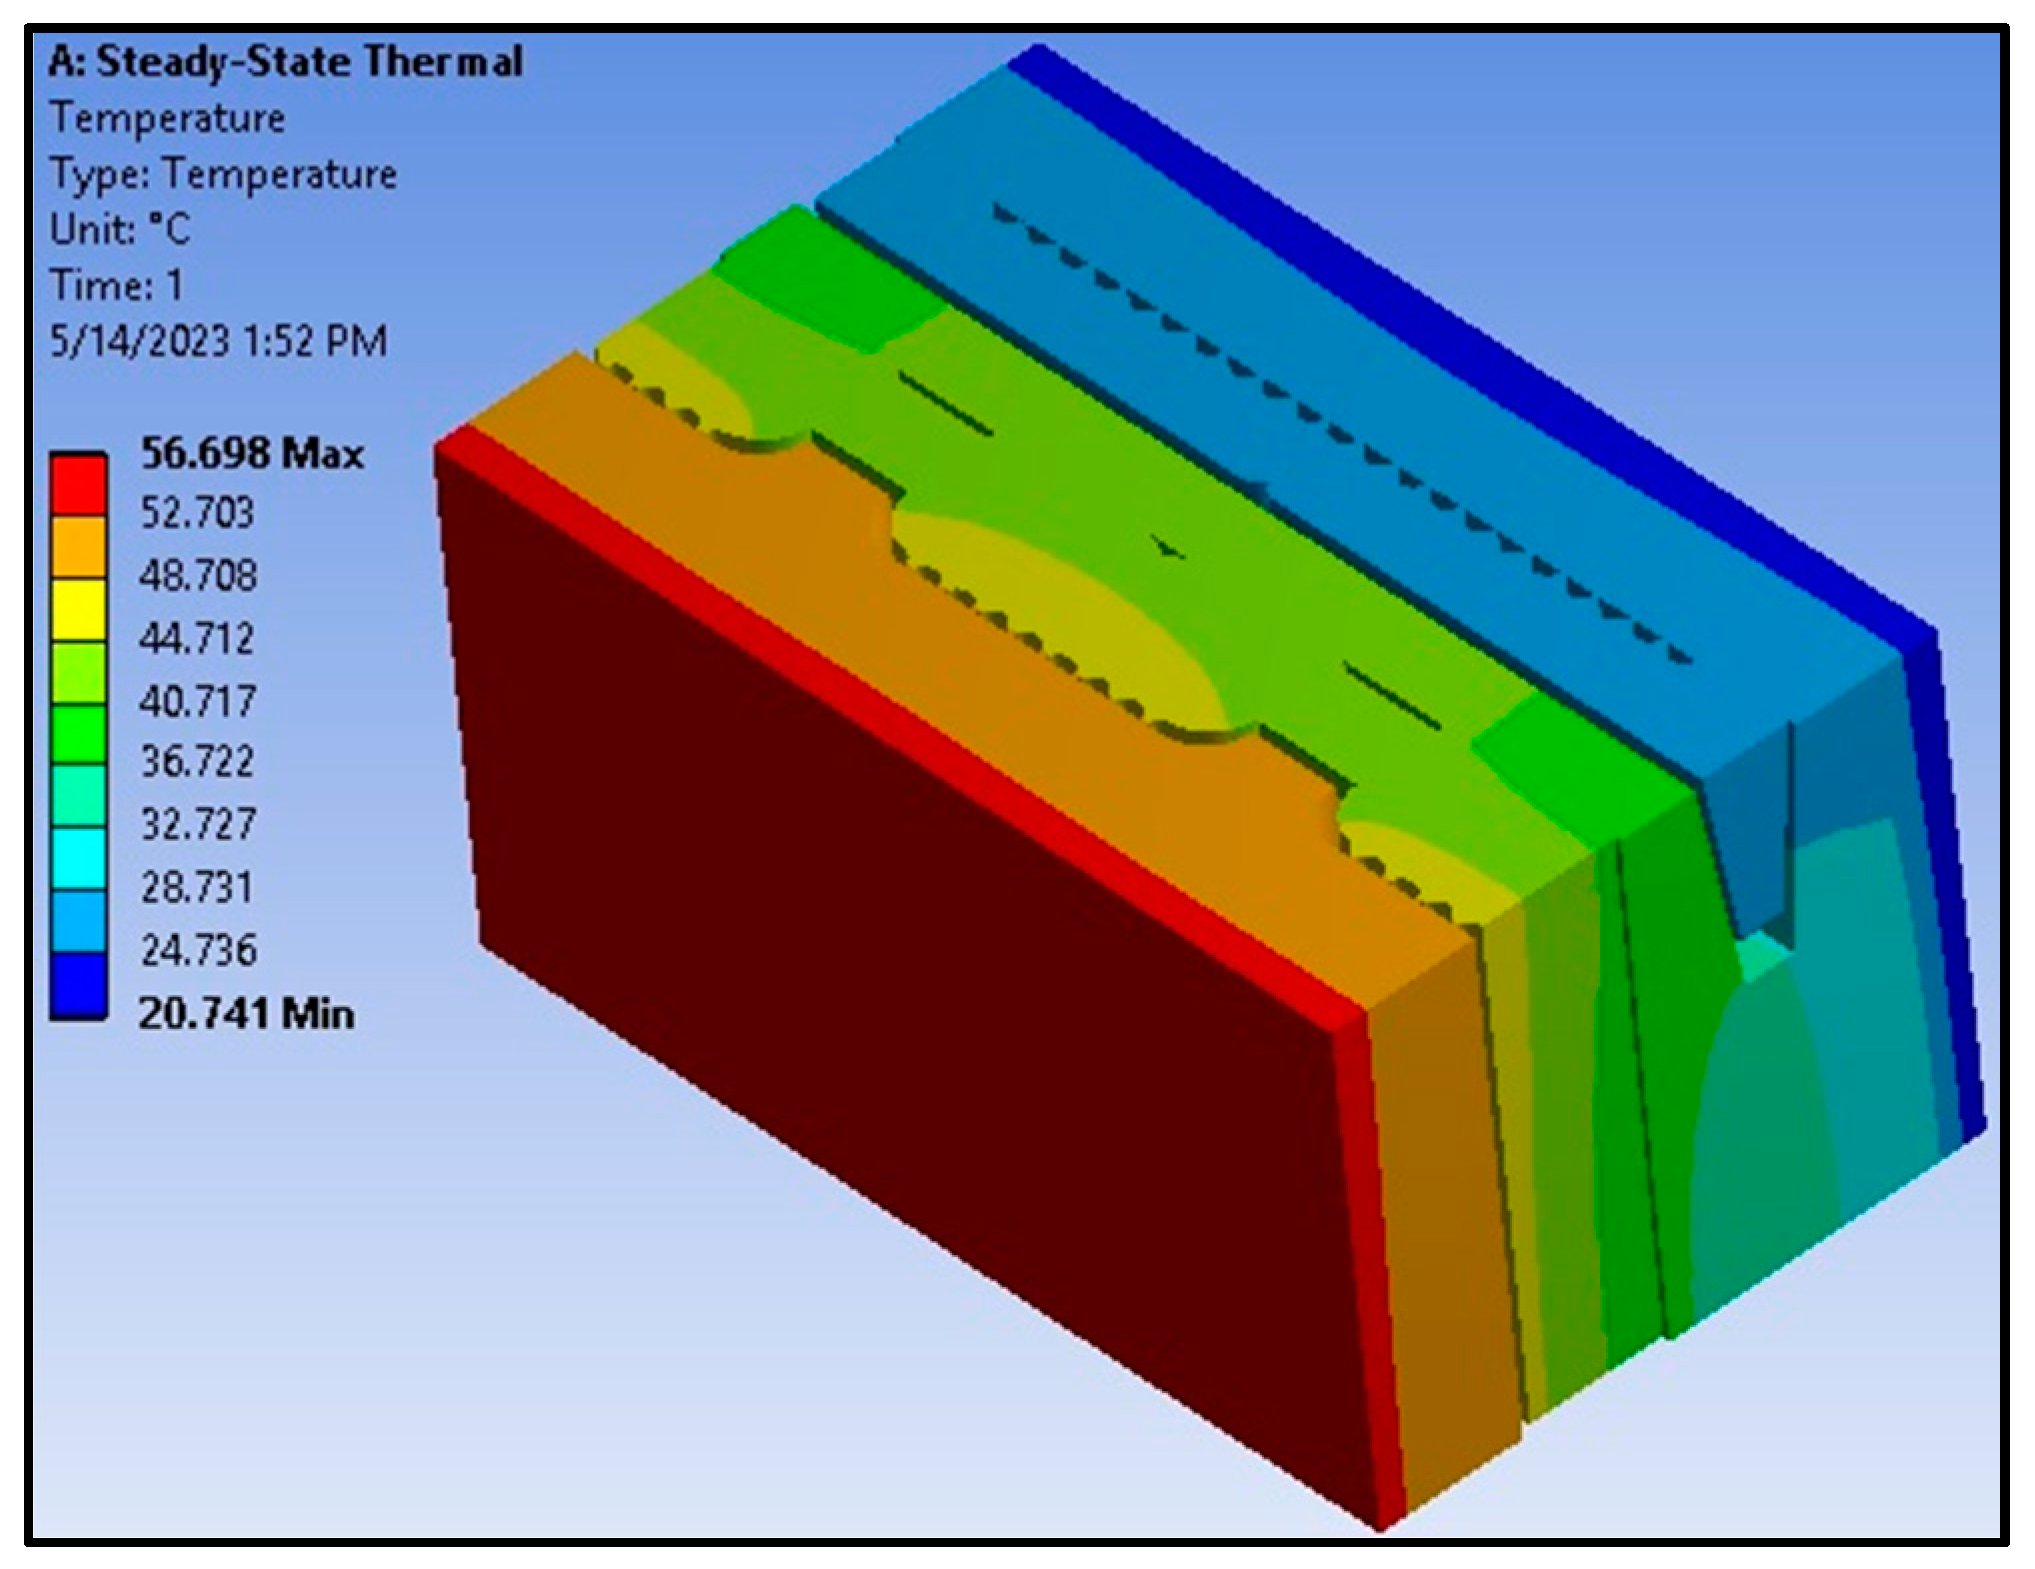
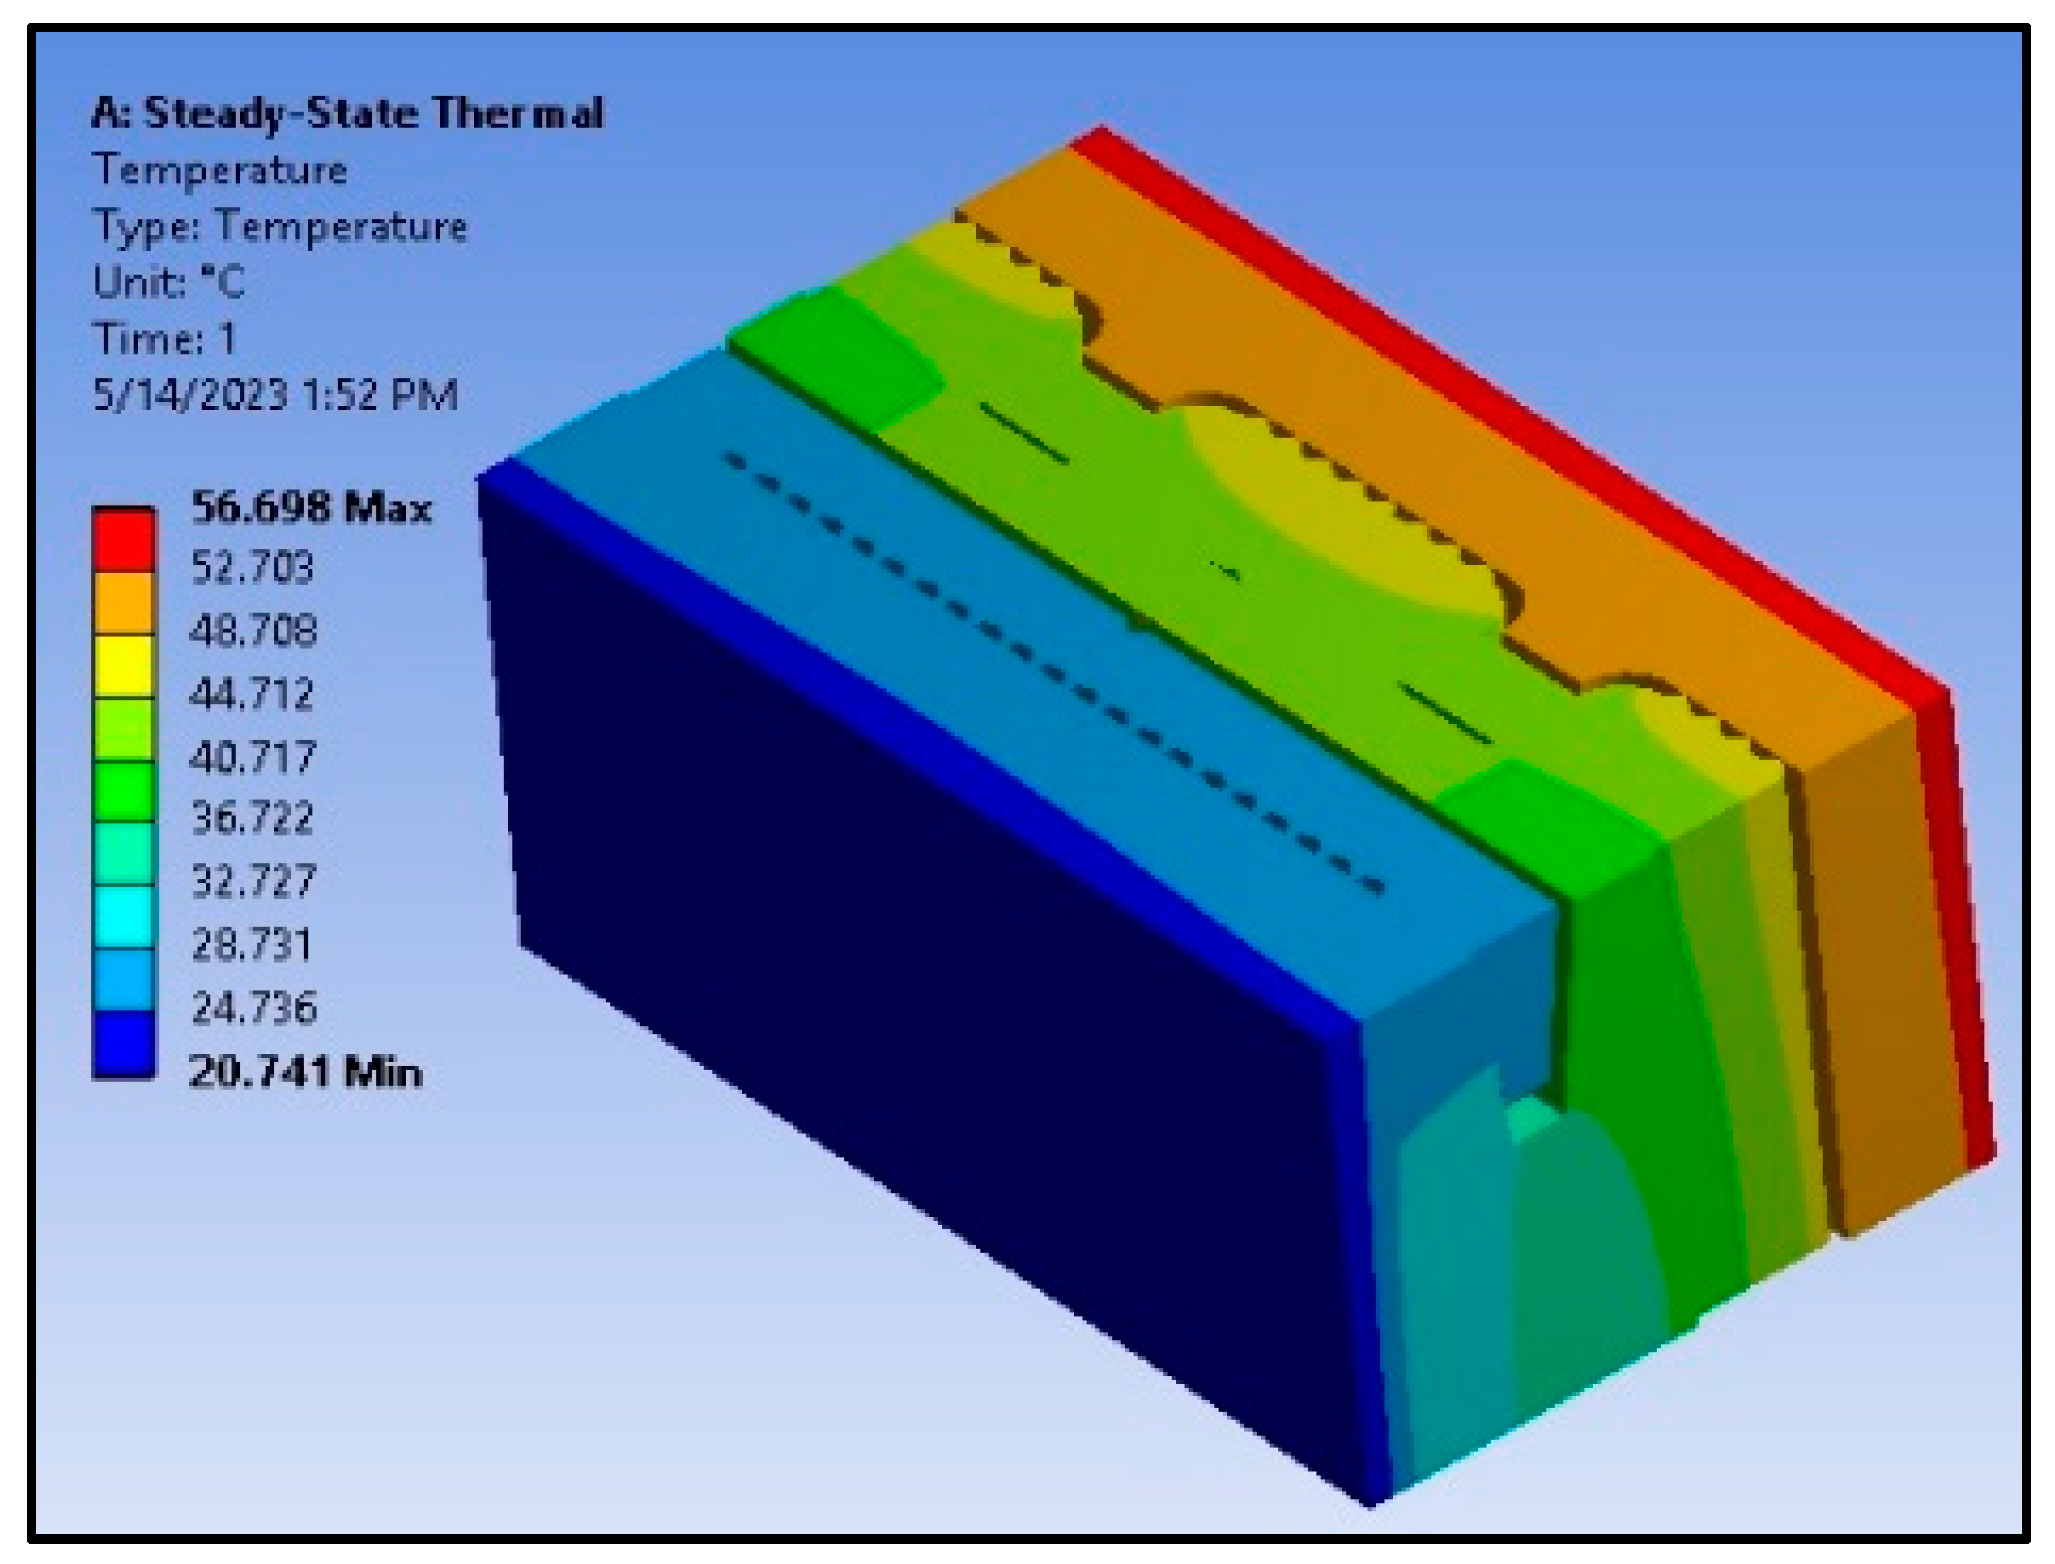
3.1.4. Study 4: Numerical Results
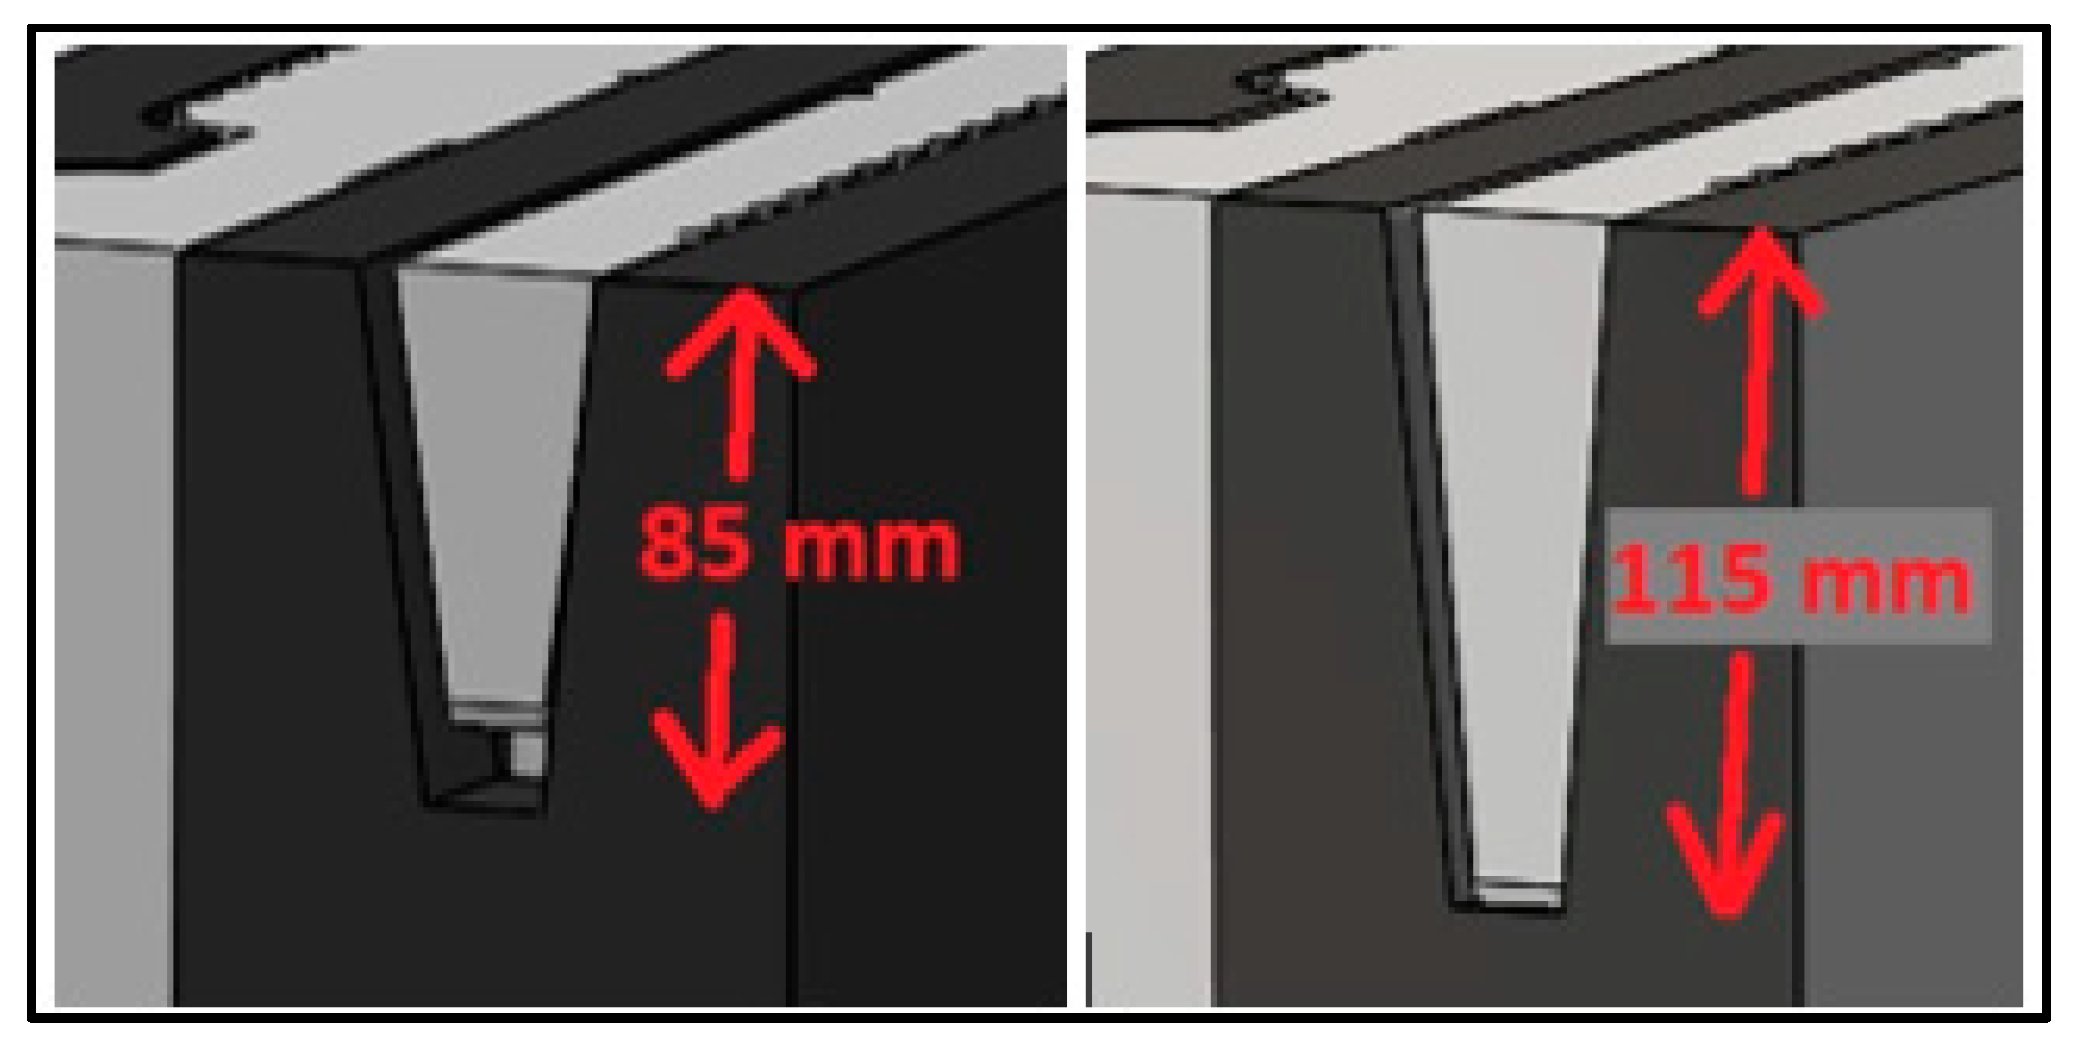
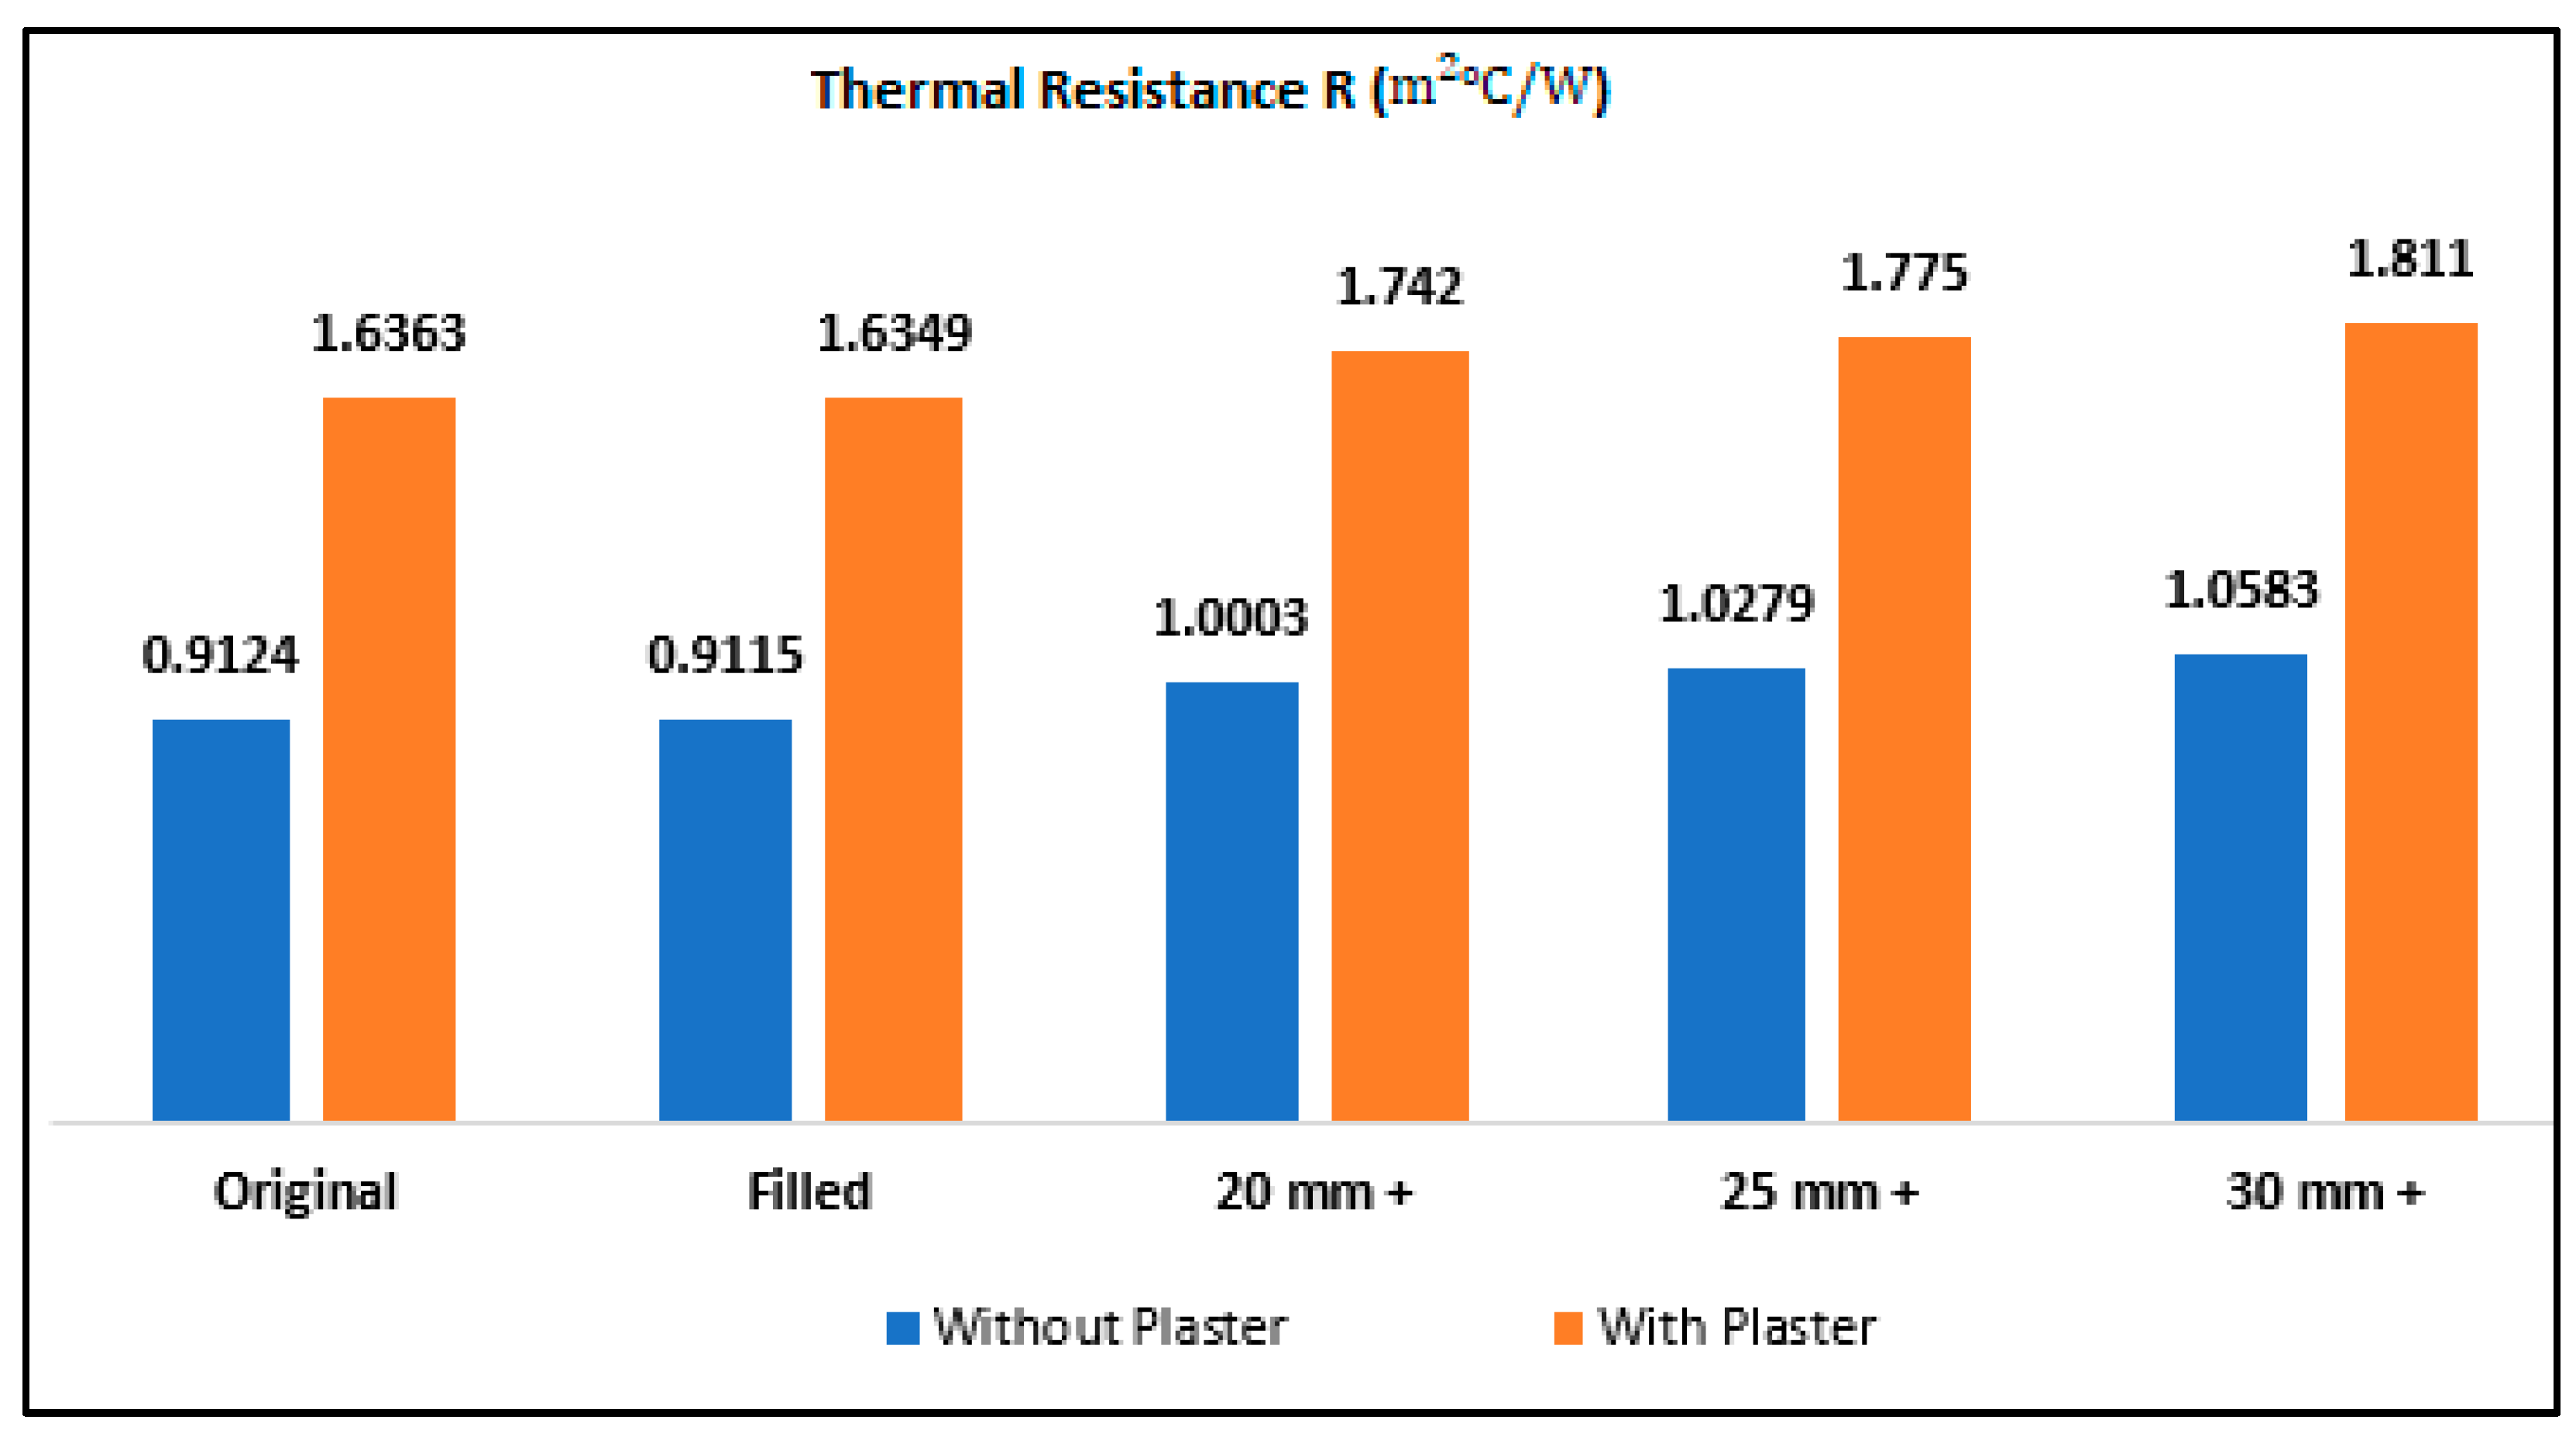
3.1.5. Study 5: Optimization of the Height of Insulation of the Single Block, with and without Plaster
4. Conclusions
Author Contributions
Funding
Data Availability Statement
Conflicts of Interest
Appendix A
References
- Chel, A.; Kaushik, G. Renewable energy technologies for sustainable development of energy efficient building. Alex. Eng. J. 2018, 57, 655–669. [Google Scholar] [CrossRef]
- Cao, X.; Dai, X.; Liu, J. Building energy-consumption status worldwide and the state-of-the-art technologies for zero-energy buildings during the past decade. Energy Build. 2016, 128, 198–213. [Google Scholar] [CrossRef]
- Akkurt, G.G.; Aste, N.; Borderon, J.; Buda, A.; Calzolari, M.; Chung, D.; Costanzo, V.; Del Pero, C.; Evola, G.; Huerto-Cardenas, H.E.; et al. Dynamic thermal and hygrometric simulation of historical buildings: Critical factors and possible solutions. Renew. Sustain. Energy Rev. 2020, 118, 109509. [Google Scholar] [CrossRef]
- Martinez, S.; Singh, P. Thermal Performance of Roof Structures and Their Interaction with Wall Insulation. Energy Build. 2019, 180, 55–67. [Google Scholar] [CrossRef]
- Cho, K.; Cho, D.; Koo, B.; Yun, Y. Thermal Performance Analysis of Windows, Based on Argon Gas Percentages between Window Glasses. Buildings 2023, 13, 2935. [Google Scholar] [CrossRef] [PubMed]
- Rana, A.; Alam, M.S.; Charles, K.; Kaluthantirige, P.P.; Hewage, K.; Sadiq, R. Thermal performance of double and triple glazed windows Experimental results from lab and in-situ measurements. In Proceedings of the 1st International Conference on New Horizons in Green Civil Engineering (NHICE-01), Victoria, BC, Canada, 25–27 April 2018. [Google Scholar]
- Al-Abduljabbar, A.; Al-Mogbel, M.; Danish, S.N.; El-Leathy, A. Insulation Performance of Building Components and Effect on the Cooling Load of Homes in Saudi Arabia. Sustainability 2023, 15, 5685. [Google Scholar] [CrossRef] [PubMed]
- Sustainable Energy for All, Building Efficiency Accelerator. 2015. Available online: https://www.seforall.org/partners/building-efficiency-accelerator (accessed on 15 May 2024).
- World Bank. Kingdom of Bahrain Energy Efficiency Program (KEEP); World Bank: Washington, DC, USA, 2016. [Google Scholar]
- Annual Report 2018; MEW (Ministry of Electricity and Water): Manama, Bahrain, 2018.
- World Data Atlas, Bahrain Energy. 2019. Available online: https://knoema.com/atlas/Bahrain/Primary-energy-consumption#:~:text=In%202019%2C%20primary%20energy%20consumption,average%20annual%20rate%20of%203.14%25 (accessed on 24 April 2024).
- Alnaser, N. Building integrated renewable energy to achieve zero-emission in Bahrain. Energy Build. 2015, 93, 32–39. [Google Scholar] [CrossRef]
- Mahdaoui, M.; Hamdaoui, S.; Msaad, A.A.; Kousksou, T.; El Rhafiki, T.; Jamil, A.; Ahachad, M. Building bricks with phase change material (PCM): Thermal performances. Constr. Build. Mater. 2020, 269, 121315. [Google Scholar] [CrossRef]
- Kishore, R.A.; Bianchi, M.V.; Booten, C.; Vidal, J.; Jackson, R. Optimizing PCM-integrated walls for potential energy savings in U.S. Buildings. Energy Build. 2020, 226, 110355. [Google Scholar] [CrossRef]
- Iffa, E.; Tariku, F.; Simpson, W.Y. Highly Insulated Wall Systems with Exterior Insulation of Polyisocyanurate under Different Facer Materials: Material Characterization and Long-Term Hygrothermal Performance Assessment. Materials 2020, 13, 3373. [Google Scholar] [CrossRef] [PubMed]
- Shanmuham, T.S.S.; Nguyen, P.T.T.; Do, N.H.; Le, D.K.; Thai, Q.B.; Le, P.K.; Phan-Thien, N.; Duong, H.M. Advanced fabrication and multi-properties of aluminium hydroxide aerogels from aluminium wastes. J. Mater. Cycles Waste Manag. 2021, 23, 885–894. [Google Scholar] [CrossRef]
- Al-Tamimi, A.S.; Al-Amoudi, O.S.B.; Al-Osta, M.A.; Ali, M.R.; Ahmad, A. Effect of insulation materials and cavity layout on heat transfer of concrete masonry hollow blocks. Constr. Build. Mater. 2020, 254, 119300. [Google Scholar] [CrossRef]
- Ghailane, H.; Ahamat, M.A.; Padzi, M.M.; Beddu, S. Steady-state heat flow through hollow clay bricks. Mater. Sci. Eng. 2019, 834, 012021. [Google Scholar] [CrossRef]
- Cuce, E.; Cuce, P.; Besir, A. Improving thermal resistance of lightweight concrete hollow bricks: A numerical optimisation research for a typical masonry unit. J. Energy Syst. 2020, 4, 121–144. [Google Scholar] [CrossRef]
- Shehata, N.; Sayed, E.; Abdelkareem, M. Recent progress in environmentally friendly geopolymers: A review. Sci. Total Environ. 2020, 762, 143166. [Google Scholar] [CrossRef]
- Ashraf, N.; Nasir, M.; Al-Kutti, W.; Al-Maziad, F. Assessment of thermal and energy performance of masonry blocks prepared with date palm ash. Mater. Renew. Sustain. Energy 2020, 9, 17. [Google Scholar] [CrossRef]
- Zhang, Q.; Mao, S. Investigation of the bond strength and microstructure of the interfacial transition zone between cement paste and aggregate modified by Bayer red mud. J. Hazard. Mater. 2021, 403, 123482. [Google Scholar] [CrossRef]
- Al-Awsh, W.A.; Qasem, N.A.A.; Al-Amoudi, O.S.B.; Al-Osta, M.A. Experimental and numerical investigation on innovative masonry walls for industrial and residential buildings. Appl. Energy 2020, 276, 115496. [Google Scholar] [CrossRef]
- Martinez, L.; Wang, K. Infrared Thermography for In-Situ Measurement of Thermal Performance of Building Envelopes. Energy Build. 2018, 158, 51–60. [Google Scholar] [CrossRef]
- Alqahtani, S.; Ali, H.M.; Ali, H.; Farukh, F.; Kandan, K. Development of affordable hot box calorimeter to determine the U-value of inhomogeneous building material. J. Mater. Res. Technol. 2023, 25, 6492–6502. [Google Scholar] [CrossRef]
- Patel, S.; Nguyen, T. Evaluation of Thermal Resistance of Sustainable Building Materials Using Heat Flow Meter Method. J. Sustain. Archit. Civ. Eng. 2020, 26, 35–48. [Google Scholar]
- Faraji, M. Numerical study of the thermal behavior of a novel Composite PCM/concrete wall. Energy Procedia 2017, 139, 105–110. [Google Scholar] [CrossRef]
- Kanellopoulos, G.; Koutsomarkos, V.G.; Kontoleon, K.J.; Georgiadis-Filikas, K. Numerical Analysis and Modelling of Heat Transfer Processes through Perforated Clay Brick Masonry Walls. Procedia Environ. Sci. 2017, 38, 492–499. [Google Scholar] [CrossRef]
- Sassine, E.; Cherif, Y.; Dgheim, J.; Antczak, E. Experimental and Numerical Thermal Assessment of Lebanese Traditional Hollow Blocks. Int. J. Thermophys. 2020, 41, 47. [Google Scholar] [CrossRef]
- Domínguez-Muñoz, F.; Anderson, B.; Cejudo-López, J.M.; Carrillo-Andrés, A. Uncertainty in the thermal conductivity of insulation materials. Energy Build. 2010, 42, 764–772. [Google Scholar] [CrossRef]
- Radhi, H.; Sharples, S.; Taleb, H.; Hafmy, M. Will cool roofs improve the thermal performance of our built environment? A study assessing roof systems in Bahrain. Energy Build. 2016, 135, 324–337. [Google Scholar] [CrossRef]
- Modi, P.; Bushehri, R.; Georgantopoulou, C.; Mavromatidis, L. Design and development of a mini scale hot box for thermal efficiency evaluation of an insulation building block prototype used in Bahrain. Adv. Build. Energy Res. 2016, 11, 130–151. [Google Scholar] [CrossRef]
- EWA. Thermal Insulation Wall Cross Section—Welcome to Ewa Website. Electricity and Water Authority. Available online: https://www.ewa.bh/en/Conservation/Electricity/Documents/Thermal%20Insulation_Wall_Cross%20section_2020-06-25.pdf (accessed on 5 June 2024).
- Mavromatidis, L.; Michel, P.; El Mankibi, M.; Santamouris, M. Study on transient heat transfer through multilayer thermal insulation: Numerical analysis and experimental investigation. Build. Simul. 2010, 3, 279–294. [Google Scholar] [CrossRef]
- Mavromatidis, L.; El Mankibi, M.; Michel, P.; Santamouris, M. Numerical estimation of time lags and decrement factors for wall complexes including multilayer thermal insulation in two different climate zones. Appl. Energy 2012, 92, 480–491. [Google Scholar] [CrossRef]
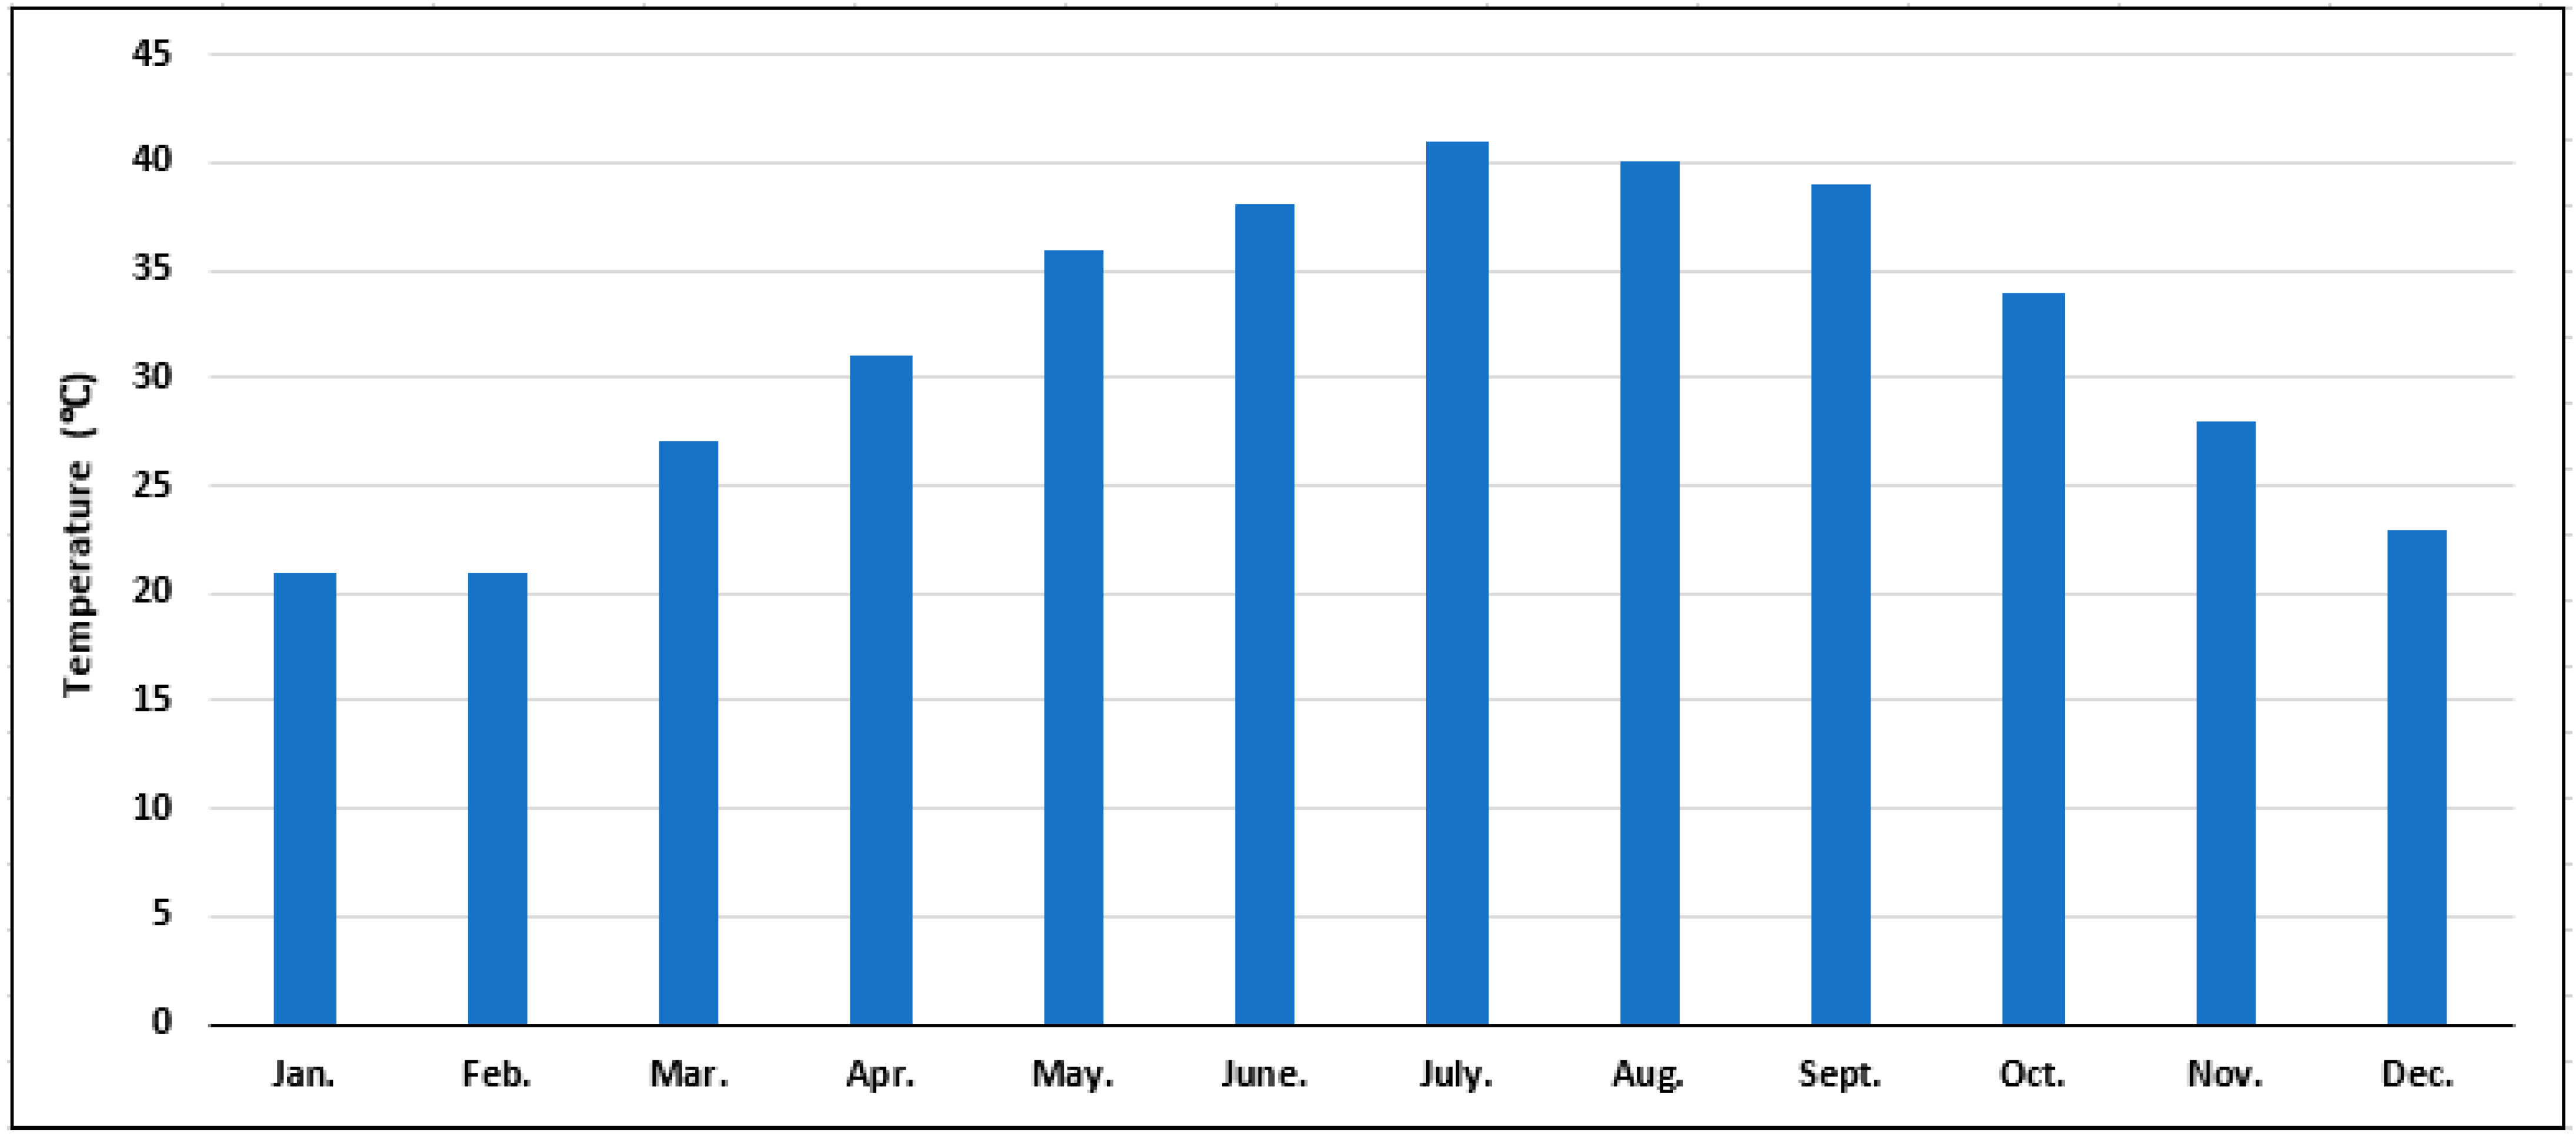
- Weather and Climate for a Trip to Bahrain: When is the Best Time to Go? Available online: https://Hikersbay.com/climate/bahrain (accessed on 5 June 2024).
- Bahrain, Bahrain Climate Averages, Monthly Weather Conditions. Available online: https://www.weatherworld.com/yearly-climate/bh/bahrain.html (accessed on 5 June 2024).
- Bayram, I.; Al-Qahtani, M.; Saddouri, F.; Koc, M. Estimating the Cost of Summer Cooling in Bahrain. In Proceedings of the IEEE GCC Conference and Exhibition (GCCCE), Manama, Bahrain, 8–11 May 2017; Volume 9. [Google Scholar] [CrossRef]
- Picotech.com/TC-08 Thermocouple Data Logger|Specifications. Available online: https://www.picotech.com/data-logger/tc-08/thermocouple-data-logger (accessed on 5 June 2024).
- Yun, T.S.; Jeong, Y.J.; Youm, K.-S. Effect of surrogate aggregates on the thermal conductivity of concrete at ambient and elevated temperatures. Sci. World J. 2014, 2014, 939632. [Google Scholar] [CrossRef]
- Amir, A.; Alibaba, H. Comparison between Heat Conductivity of EPS (Expanded Polystyrene) and XPS (Extruded Polystyrene). Int. J. Recent Res. Civ. Mech. Eng. 2018, 4, 24–31. [Google Scholar]


| Hot Plate Temperature ΔTs | Hot Air Temperature ΔT∞1 |
| 0.02 °C | 0.002 °C |
| Hot Surface Temperature (average) ΔTh | Cold Surface Temperature (average) ΔTc |
| 0.08 °C | 0.103 °C |
| Cold Air Temperature ΔT∞2 | |
| 0 °C | |
| Hot Plate Temperature Ts | Hot Air Temperature T∞1 |
| 65.016 °C | 50.343 °C |
| Hot Surface Temperature (average) Th | Cold Surface Temperature (average) Tc |
| 40.318 °C | 20.741 °C |
| Cold Air Temperature T∞2 | |
| 20.193 °C | |
| Properties of Air at Average of Hot Plate and Hot Air Temperatures (57.68 °C) | |||
|---|---|---|---|
| Density ρ (kg/m3) | Dynamic Viscosity μ (kg/m s) | Specific Heat Cp (J/kg K) | Thermal Conductivity k (W/m K) |
| 1.0671 | 0.000019956 | 1007.9 | 0.028352 |
| Prandtl Number Pr.No. | Kinematic Viscosity ν (m2/s) | Thermal Diffusivity α (m2/s) | Thermal Expansion β (1/K) |
| 0.70945 | 0.000018701 | 0.00002636 | 0.0030227 |
| Dimensionless Numbers | Convective Heat Transfer Coefficient | Heat Flux | Heat Transfer Rate | Thermal Resistance of the Block | ||
|---|---|---|---|---|---|---|
| Grashoff no (Gr) | Rayleigh no (Ra) | Nusselt no (Nu) | h (W/m2 K) | (W/m2) | Q (W) | Rexp. m2·°C /W |
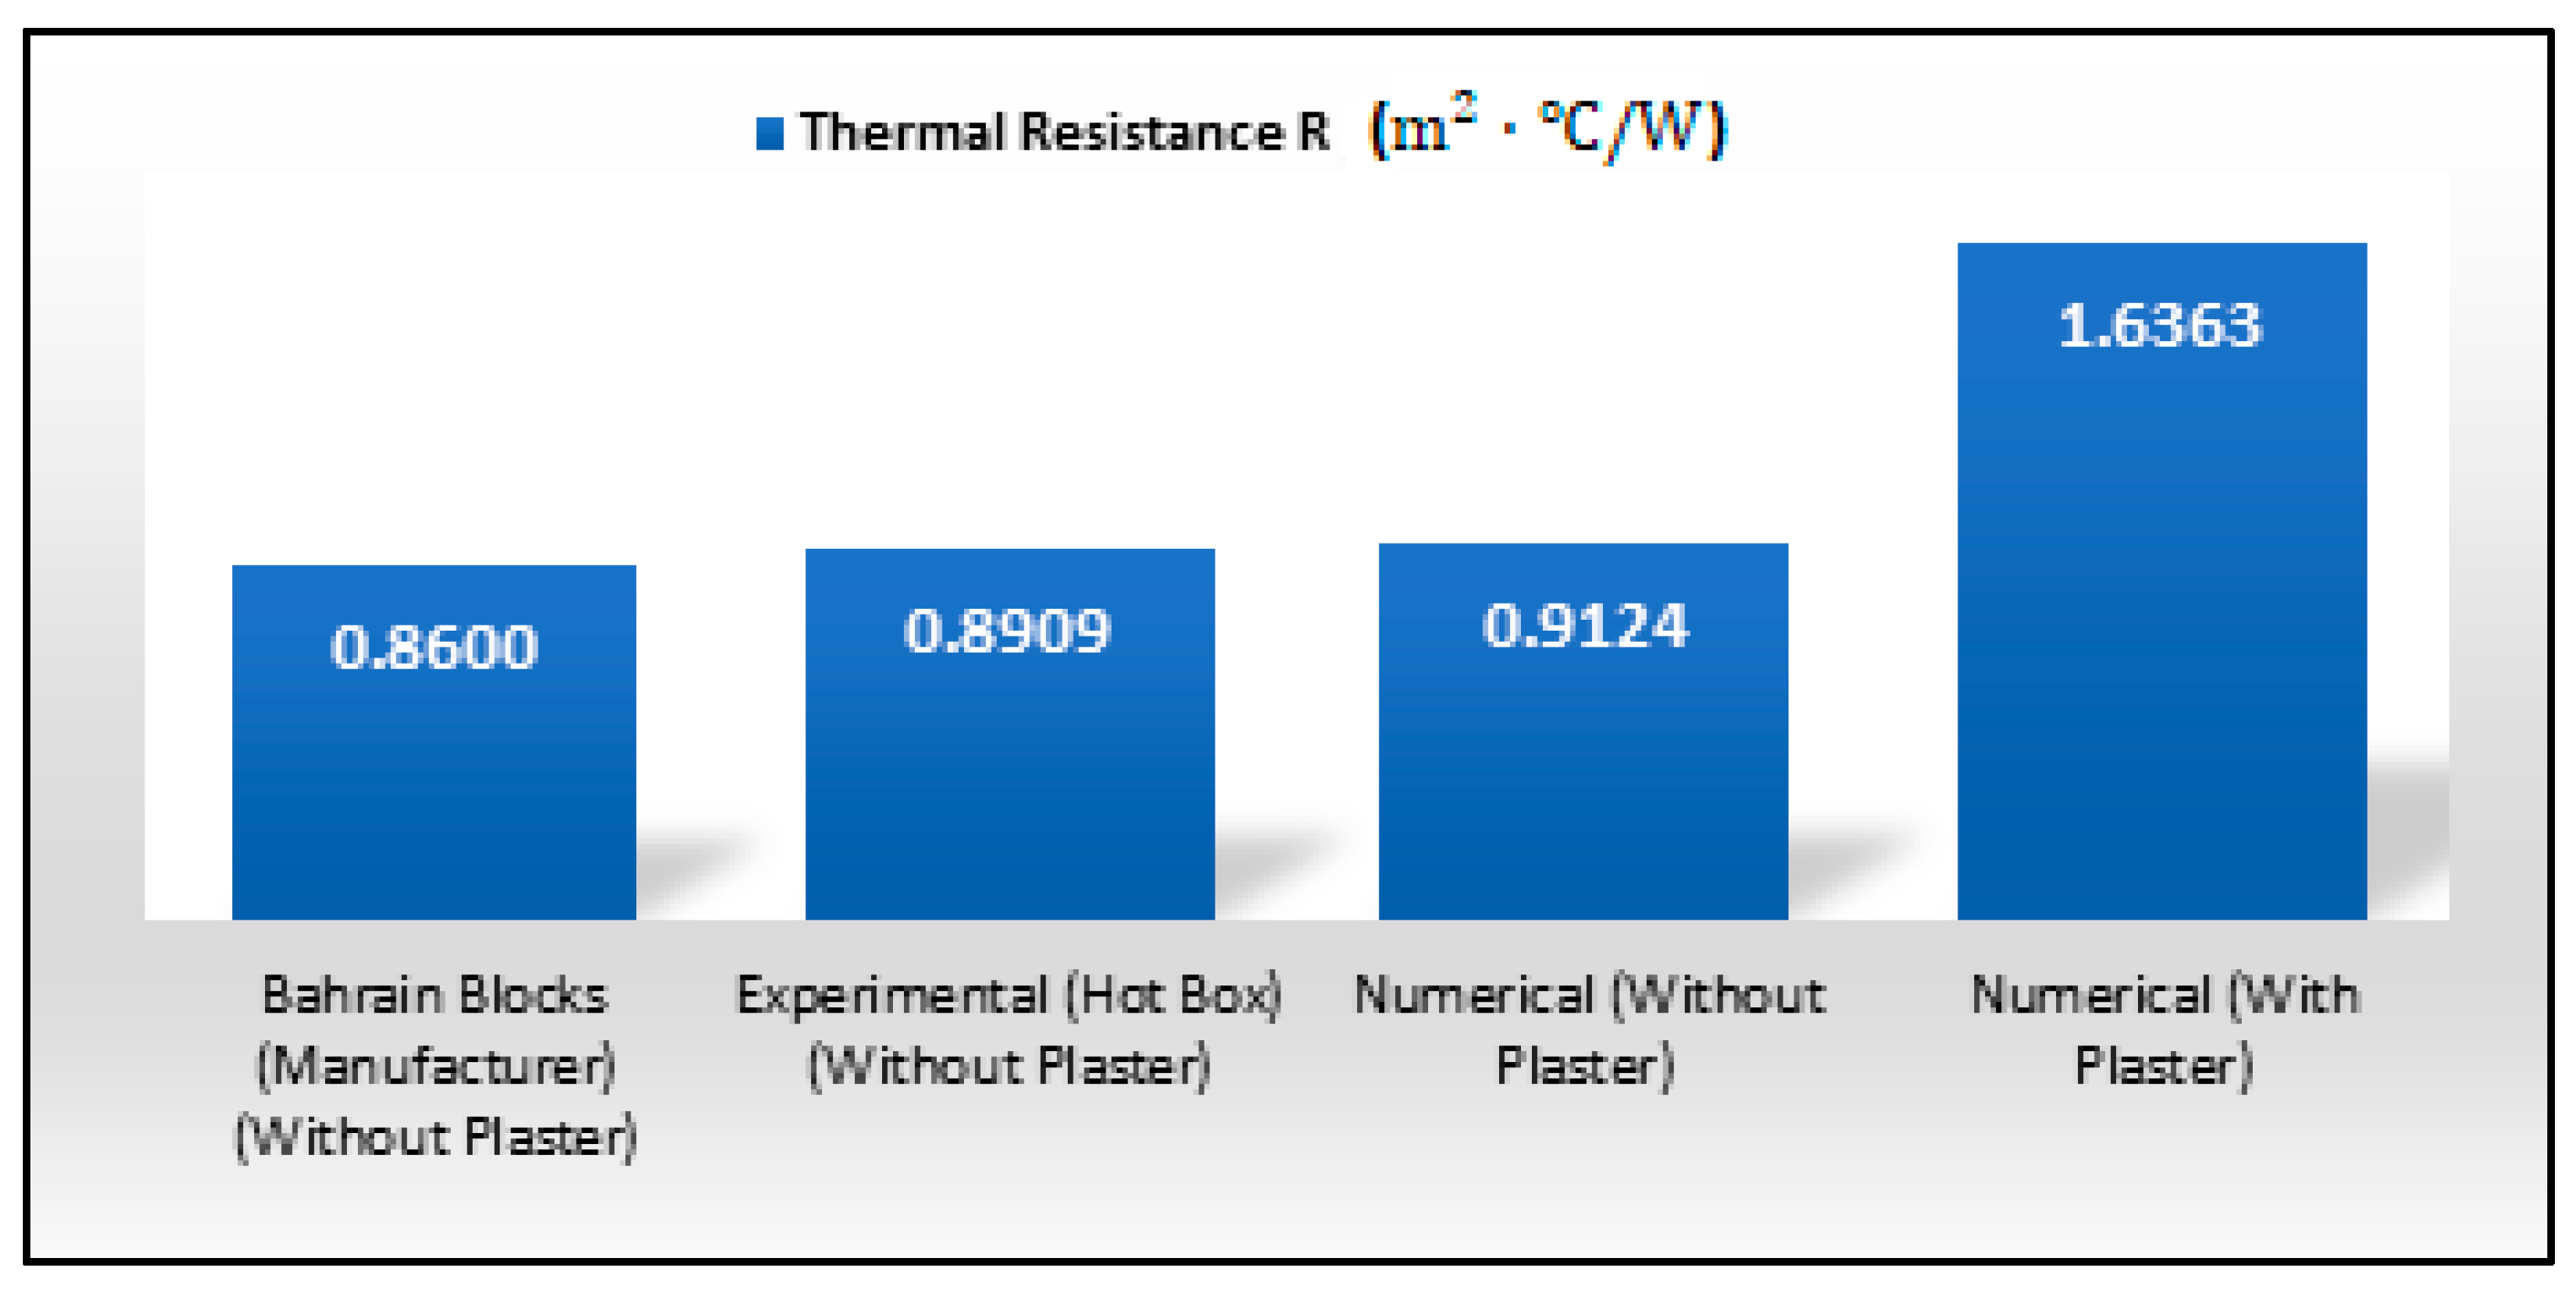
| 9,952,754.63 | 7,060,981.775 | 10.56434671 | 497,601,789 | 21.9743 | 1.75794 | 0.8909 |
| R-Value (Manufacturer) | (Experimental) | Deviation |
|---|---|---|
| 0.86 m2·°C/W | 0.8908 m2·°C/W | 3.59% |
| Different Conditions of Insulation and Plaster | With Insulation Without Plaster | With Insulation With Plaster | With Insulation With Plaster |
|---|---|---|---|
| Variations in temperatures across different layers of the setup | comparison at 10:30 and 10:45 h | comparison at 10:30 and 10:45 h | comparison at 12:00 and 12:15 h |
| Hot Plate Temperature ΔTs | 0.02 °C | 0.326 °C | 0.326 °C |
| Hot Air Temperature ΔT∞1 | 0.002 °C | 0.294 °C | 0.27 °C |
| Hot Surface Temperature (average) ΔTh | 0.08 °C | 0.32 °C | 0.293 °C |
| Cold Surface Temperature (average) ΔTc | 0.103 °C | 0.094 °C | 0.112 °C |
| Cold Air Temperature ΔT∞2 | 0 °C | 0.098 °C | 0.11 °C |
| Optimization of the Back Insulation Insert | |
|---|---|
| Condition 1 | Gap filled with insulation |
| Condition 2 | +20 mm insulation |
| Condition 3 | +25 mm insulation |
| Condition 4 | +30 mm insulation |
| Block Thermal Resistance (Without Plaster) | |||
|---|---|---|---|
| Condition | Th (°C) | R (m2·°C/W) | R (%) |
| Original | 40.79 | 0.9124 | 6.0926 |
| Filled | 40.771 | 0.9115 | 5.9921 |
| +20 mm | 42.721 | 1.0003 | 16.3108 |
| +25 mm | 43.329 | 1.0279 | 19.5282 |
| +30 mm | 43.996 | 1.0583 | 23.0577 |
| Block Thermal Resistance (With Plaster) | |||
|---|---|---|---|
| Condition | Th (°C) | R (m2·°C/W) | R (%) |
| Original | 56.698 | 1.6363 | 72.3946 |
| Filled | 56.666 | 1.6349 | 72.3355 |
| +20 mm | 59.019 | 1.7420 | 74.1695 |
| +25 mm | 59.745 | 1.7750 | 74.7065 |
| +30 mm | 60.535 | 1.8110 | 75.2662 |
Disclaimer/Publisher’s Note: The statements, opinions and data contained in all publications are solely those of the individual author(s) and contributor(s) and not of MDPI and/or the editor(s). MDPI and/or the editor(s) disclaim responsibility for any injury to people or property resulting from any ideas, methods, instructions or products referred to in the content. |
© 2024 by the authors. Licensee MDPI, Basel, Switzerland. This article is an open access article distributed under the terms and conditions of the Creative Commons Attribution (CC BY) license (https://creativecommons.org/licenses/by/4.0/).
Share and Cite
Modi, P.A.; Mahmoud, A.M.; Abakr, Y.A.; Abdulqader, A.E. Experimental and Numerical Heat Transfer Assessment and Optimization of an IMSI Based Individual Building Block System of the Kingdom of Bahrain. Buildings 2024, 14, 2012. https://doi.org/10.3390/buildings14072012
Modi PA, Mahmoud AM, Abakr YA, Abdulqader AE. Experimental and Numerical Heat Transfer Assessment and Optimization of an IMSI Based Individual Building Block System of the Kingdom of Bahrain. Buildings. 2024; 14(7):2012. https://doi.org/10.3390/buildings14072012
Chicago/Turabian StyleModi, Payal Ashish, Abdelgadir Mohamed Mahmoud, Yousif Abdalla Abakr, and Abdulla Ebrahim Abdulqader. 2024. "Experimental and Numerical Heat Transfer Assessment and Optimization of an IMSI Based Individual Building Block System of the Kingdom of Bahrain" Buildings 14, no. 7: 2012. https://doi.org/10.3390/buildings14072012