Article

A Method of Integrating Air Conditioning Usage Models to Building Simulations for Predicting Residential Cooling Energy Consumption

by
Jingyun Ao
1,2,
Chenqiu Du
1,2,*,
Mingyi Jing
1,2,
Baizhan Li
1,2 and
Zhaoyang Chen
1,2
1
Joint International Research Laboratory of Green Buildings and Built Environments, Ministry of Education, Chongqing University, Chongqing 400045, China
2
School of Civil Engineering, Chongqing University, Chongqing 400045, China
*
Author to whom correspondence should be addressed.
Buildings 2024, 14(7), 2026; https://doi.org/10.3390/buildings14072026
Submission received: 15 May 2024 / Revised: 20 June 2024 / Accepted: 27 June 2024 / Published: 3 July 2024

Abstract

:
Great deviations in building energy consumption simulation are attributed to the simplified settings of occupants’ air conditioning (AC) usage schedules. This study was designed to develop a method to quantify the uncertainty and randomness of AC usage behavior and incorporate the model into simulations, in order to improve the prediction performance of AC energy consumption. Based on long-term onsite monitoring of household thermal environments and AC usage patterns, two stochastic models were built using unsupervised cluster and statistical methods. Based on the Monte Carlo method, the AC operation schedule was generated through AC opening duration, setpoints, and other relevant parameters, and was further incorporated into EnergyPlus. The results show that the ideally deterministic AC operation settings from the standard significantly overestimate the cooling energy consumption, where the value based on the fixed mode was 6.35 times higher. The distribution of daily AC energy consumption based on the stochastic modeling was highly consistent with the actual situation, thanks to the accurate prediction of the randomness and dynamics of residents’ AC usage patterns. The total cooling energy consumption based on two stochastic models was found to be much closer to the actual values. The work proposes a method of embedding stochastic AC usage models to EnergyPlus 22.1 benefits for an improvement in building energy consumption simulation and the energy efficiency evaluation regarding occupant behavior in the future.

1. Introduction

1.1. Background

The proportion of energy consumption of residential buildings fluctuates from an average of 20% in developed countries to more than 35% in developing countries [1]. In China, the operation energy consumption of residential buildings is nearly twice that of public buildings [2]. The AC energy consumption accounts for more than 40% of the overall values [3], which is significantly affected by occupant behavior [4]. Compared with office buildings, occupant behavior in residential buildings shows more randomness and diversity [5], while little research is available on residential occupant behavior modeling [6]. In the visible future, the AC energy consumption in residential buildings will continue to increase, calling for further research on the AC usage behavior of residential buildings and its impact on AC energy consumption [7].
Building energy consumption simulations is an essential approach to understand the energy performance of buildings [8]. The simulation accuracy will significantly affect building energy efficiency and carbon emission reduction [9]. However, due to the simplification of occupant behavior in the simulation settings [10], the actual building energy consumption during operation often significantly differs from the prediction [11], which has been a huge problem for building energy evaluation and management [12]. Therefore, accurate descriptions for occupant behavior and input settings are crucial to improve building simulation performance, especially for AC energy consumption prediction [13].
However, most of the current research on building energy efficiency focuses on deterministic factors such as improving HVAC system design or control [14]. In contrast, AC usage behavior is a crucial but highly random factor influencing HVAC energy consumption [15]. The different occupancy pattern inputs could cause a remarkable difference for heating and cooling energy simulation, by up to 15% [16]. Occupant behavior was the most important factor affecting the AC energy consumption for cooling in residential buildings, through the frequency and location of AC usage [17]. However, given it is unpredictable and complex in building simulations [18], the standard recommended static and deterministic settings in simulations cannot reflect its uncertainty and dynamics [19]. Therefore, building stochastic models to provide more reliable inputs for occupant behavior on AC usage is necessary and expected, in order to improve the energy consumption simulation performance.

1.2. Literature Review

Statistical analysis based on a wide range of data has become a major trend in studying occupant behavior and AC usage [20]. Two accurate and quantitative methods commonly used in existing research are data mining and statistical modeling, which are based on the collected data related to occupant behavior [21]. The main occupant behavior of AC usage includes AC setpoint, operation duration, etc. [22]. Statistical modeling establishes the numerical relationship between occupant behavior and relevant influencing factors such as indoor and outdoor temperature, and daily events [23]. Yao [24] proposed a methodological framework to model AC usage behavior, and logistic regression was used to simulate the probability of AC turning on under different indoor temperatures. Combined with stochastic modeling, the simulation accuracy was significantly improved. Liu et al. [25] conducted a wide range of field measurements on AC usage behavior, and machine learning was used to establish the AC usage model to predict AC on/off behavior. Zaki et al. [26] conducted a large-scale field survey on the AC operation duration and the opening/closing time in residential buildings in Malaysia, and then proposed an algorithm to randomly generate the AC operation schedule. However, Uddin et al. [27] pointed out that statistical modeling of single behavior was not conducive to further integrating behavioral models with building simulation tools, while a combination of stochastic modeling would provide more opportunities for integration.
In contrast to the detailed descriptions on specific categories of AC usage behavior, another common method to study AC usage behavior is data mining [28]. Cluster analysis is a representative unsupervised data mining method [29] and has been used to identify domestic electricity load profile characteristics of different households [30], as well as to discover typical AC usage patterns [31]. An et al. [32] used the data of central AC usage in the cooling season. Typical AC usage patterns for cooling obtained by cluster analysis were recommended for different room types of residential buildings in the cold climate zone of China. Chen et al. [33] used indoor temperature variation to determine the operating conditions of air source heat pumps in winter, and the clustering results presented different occupant heating patterns for different heating periods. Zhang et al. [34] applied cluster analysis to subdivide occupant behaviors in student dormitories into three clusters, and modeled energy consumption based on the clustering results, to provide reference for the optimal renovation design. Lu and Liu [35] used the AC energy consumption data to analyze the AC on–off behavior. A k-means cluster algorithm was used to determine the diversity of thermal preference and typical schedules of different AC usage behavior. However, a common feature of these studies is that they are only based on cluster analysis and explore the representative AC usage patterns from a wide range of data. Few studies applied these models to AC energy consumption simulation to optimize the prediction performance.
Taken together, while building occupant behavior has been widely studied over the past decades, the simplified or fixed occupant behavior settings are still commonly used in existing building simulations [36]. Jia et al. [37] suggested that providing robust occupant behavior models as inputs to the building energy model would help to evaluate the occupants’ impact on building performance more comprehensively. Though the occupant behavior models have been widely explored, few combined these models with current simulation software [38]. It is challenging to change or update the underlying features related to occupant behavior based on extensive programming experience. Therefore, a feasible method is needed to incorporate the more accurate stochastic occupant behavior models into building simulations.

1.3. Aims of This Research
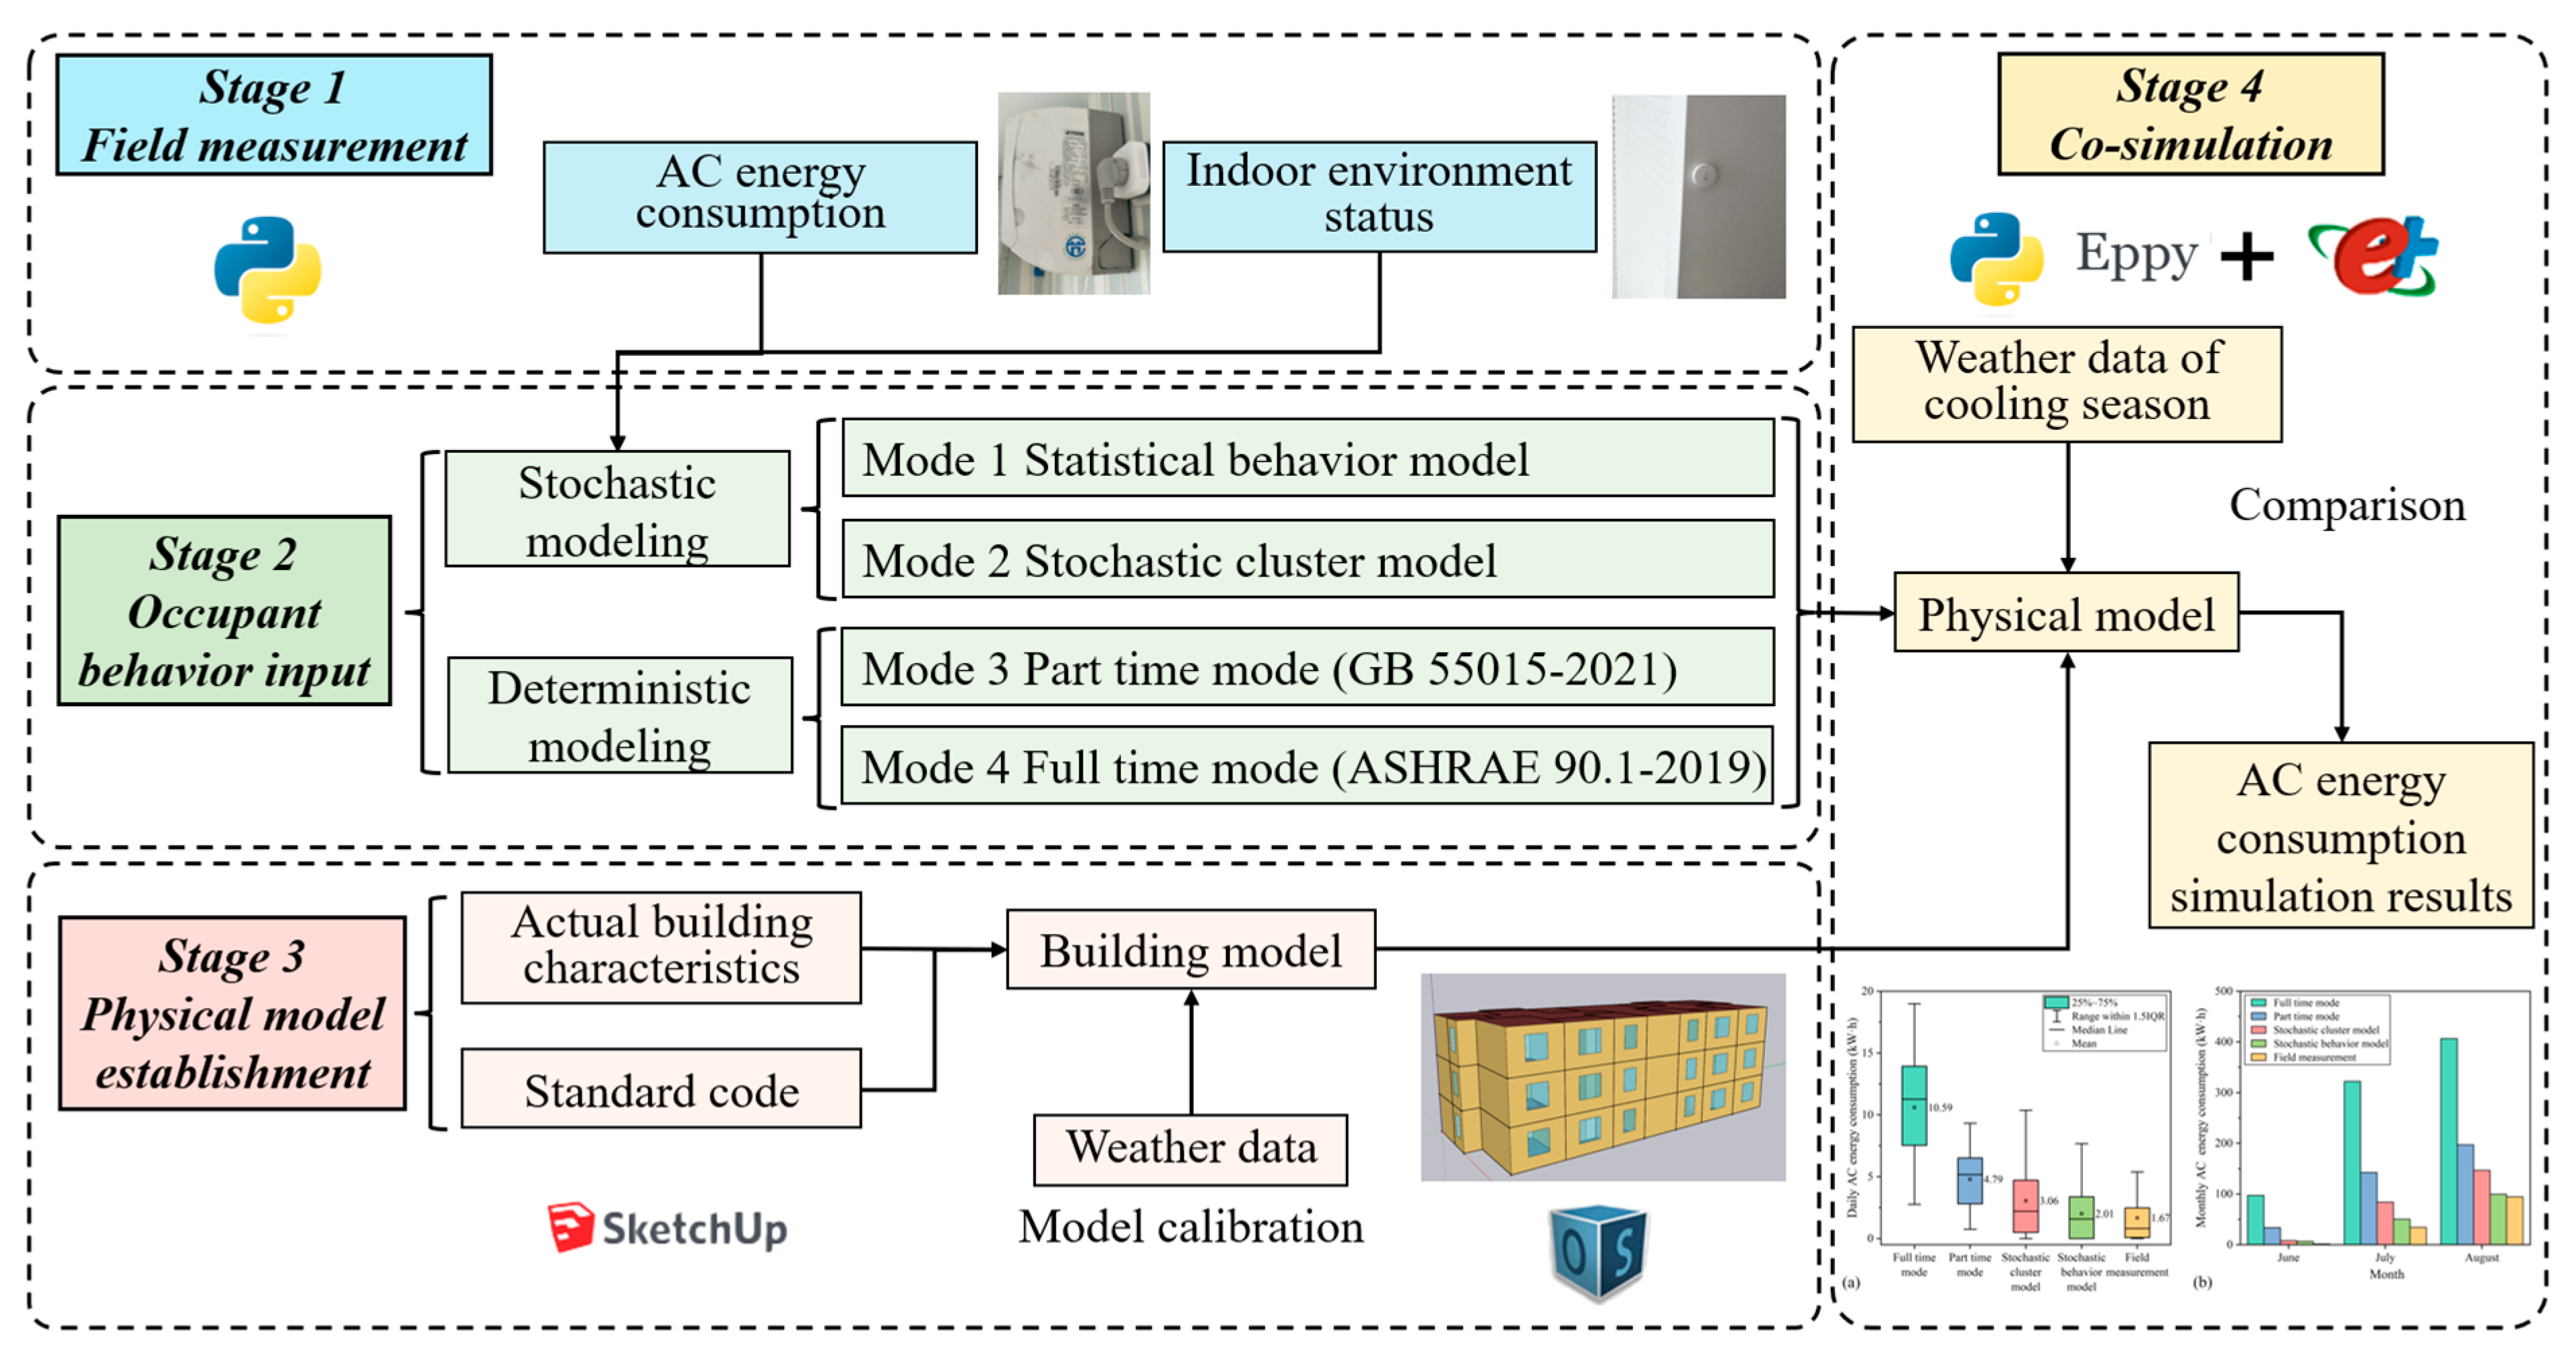
In general, the current studies have verified that the ideal deterministic occupant behavior inputs lead to great differences in building simulations from actual values. The difficulty of embedding the more accurate statistical models into simulation tools limited its application in building simulations. To respond to such research gaps, this study was designed for two aims: (1) to develop two more accurate stochastic models of AC usage, using the data mining method and the statistical modeling method; (2) to develop a method to integrate two stochastic models on AC usage into the commonly used simulation tools, in order to improve the building simulation performance. This study takes the residential building in the hot summer and cold winter (HSCW) zone of China as an example, where the split AC is a typical device for cooling [39,40]. The flexible usage characteristics of the split AC has already brought huge problems to energy consumption and management [41]. This work, for the first time, applies the stochastic model inputs for occupant behavior, and their performances and potentials as the simulation inputs were compared, which opened up a path to improve the accuracy of occupant behavior simulations in future.

2. Methods

The study was designed in two stages. A long period of onsite measurement was carried out in the typical household of the HSCW zone for data collection. Based on the monitored data, the statistical modeling method was employed to define the characteristics of AC usage behavior and its relationship with environmental factors. Then the unsupervised cluster analysis was established to quantify the typical AC usage patterns. Two stochastic AC usage models were finally established using the Monte Carlo method. They were combined with the energy simulation engine EnergyPlus to quantify the influence of occupant behavior on building energy consumption. A reference building was built and the cooling energy consumption for AC was simulated. The performance of the developed AC usage models was compared to the standard base AC usage models. The technical route is shown in Figure 1.

2.1. Data Collection and Pre-Processing

The typical residence in Chongqing, China was selected for field measurement. It was located on the 15th floor (15/32) and was built in 2015. The structure belonged to a three-generation family and the air conditioners were installed in the main bedroom and the secondary bedroom, which enabled a representation of the typical household characteristics in this region. The indoor temperature and relative humidity and AC energy consumption were monitored in these two rooms during typical summer periods (184 days from June to August in 2019 and 2020). In addition, the indoor temperature in the transition season was monitored for model calibration. Details of the devices are shown in Table 1.
The temperature and humidity sensors were installed in the active area of 0.6–1.1 m above the floor. The smart sockets were connected directly to the air conditioners. Data were collected by the online platform, and were pre-processed by eliminating abnormal data and incomplete data. The energy consumption data were used to determine the AC opening state. When the instantaneous AC energy consumption value reached the setting threshold, the AC was considered to be on [42]. The data processing was completed using Python 3.9. The hourly weather data was downloaded from nearby weather station (Shapingba, 5051760) from the National Meteorological Data Sharing Center (https://data.cma.cn/ (accessed on 20 March 2024)) for building simulation. The outdoor weather data used in the data analysis came from the public website [43]. The record interval was 3 h, and verified by the relevant study [22].

2.2. Occupant Modeling Method

As mentioned above, occupant behavior models could be divided into two categories: deterministic and stochastic models. In order to evaluate the influence of occupant behavior on the AC energy consumption, different models were adopted, namely, stochastic AC usage models based on historical collected data and deterministic AC usage models based on standards.

2.2.1. Standard AC Usage Model

Due to the uncertainty and unpredictability, fixed occupant behavior settings from building standards are commonly used in building simulation inputs [16]. To compare, this study initially referred to the General Code for Energy Efficiency and Renewable Energy Application in Buildings (GB 55015-2021) [44] and American Society of Heating, Refrigerating and Air-Conditioning Engineers (ASHRAE) 90.1-2019 [45]. The specific AC usage settings are shown in Table 2. These two standards recommended different AC setpoints and operating modes. The ASHRAE 90.1 adopted the “full-time and full-space” operation mode while the GB 55015 used the “part-time and part-space” mode.

2.2.2. Statistical AC Usage Modeling Method

Statistical modeling refers to establishing the numerical relationship between occupant behavior and related factors such as indoor and outdoor temperature [46], including logistic regression, normal regression, and linear regression, etc. Based on the collected data, the relationship between outdoor temperature and AC usage behavior and the distributions of the AC setpoint and opening duration were analyzed.
The logistic regression was used to predict the probability of AC on and off under different indoor and outdoor environmental conditions. The on and off status of the AC was treated as the dependent variable (1/0). For the indoor logistic regression model, the indoor temperature and humidity data when the AC was turned on and off were used for training [47]. Indoor regression model was used to determine when the occupants would turn on the AC. Similarly, the probability distribution of AC turning on at different average daily outdoor temperatures was obtained for the outdoor logistic regression model. The receiver operating characteristic (ROC) curve and area under curve (AUC) area index were used to verify the accuracy of the models. Data analysis was conducted in Software SPSS 26.0.
Based on the two logistic regression models for AC usage and the two distribution models of the AC opening duration and setpoints, the Monte Carlo method was used to simulate the interaction between the residents and the AC in the master bedroom and the second bedroom, respectively. The Monte Carlo method consists of two steps: random sampling and random number generation [41]. The Monte Carlo method was used to sample according to the probability distribution from all input ranges, and then generated AC operation modes for energy consumption simulation [48].
Since the probability distributions of different variables were obtained, the direct sampling in the Monte Carlo method was adopted. Taking the AC setpoint generation as an example, the algorithm was explained as follows. The cumulative distribution function F(x) can be obtained by integrating the probability density function f(x) through fitting the original data. The inverse function of the probability distribution was shown in Equation (1). For the temperature distribution, the original temperature setting range was simplified to 22~30 °C.
{ F ( x ) = 22 x f ( x ) d x F 1 ( U ) = inf { x [ 22 , 30 ] : F ( x ) U , 0 U 1 }
A random number U [0, 1] was generated to determine the occupant daily AC temperature setpoint. When the random number fell in the divided space, the corresponding AC setpoint was selected, as shown in Equation (2). For example, when the random number was less than F (23), we considered that at this time, the AC setpoint was between 22~23 °C, and took 22 °C in practice. In addition to AC setpoint, the opening time, the operation duration, whether the AC was used, and the operation mode in the two random behavior models were obtained in a similar way. Note that in this study, the daily AC setpoints of the main bedroom and the second bedroom were randomly sampled.
X = F 1 ( U ) = { 22 ,     0 U F ( 23 ) 23 , F ( 23 ) < U F ( 24 )     29 , F ( 29 ) < U F ( 30 ) 30 , F ( 30 ) < U 1
Figure 2 shows the process of establishing stochastic behavior models and integrating models to simulate occupants’ AC usage behavior. First, the average outdoor temperature on a given day during the cooling season was used to determine whether the AC would be turned on via the outdoor logistic regression model. If the AC was turned on that day, the indoor temperature and relative humidity obtained by simulation were used to determine when the AC was turned on, through using the indoor logistic regression model. Finally, the opening duration and setpoints were randomly sampled by the corresponding probability distribution models. The process was repeated until the AC setpoint schedule for the entire cooling season was generated.

2.2.3. Stochastic Cluster Modeling Method

As a commonly used unsupervised machine learning tool [29], cluster analysis was used to obtain the most common AC usage patterns from all the daily AC energy consumption data of two bedrooms. The hourly AC energy consumption of each day was normalized to represent the daily AC usage intensity. The formula used for normalization is shown in Equation (3).
X n o r = X X min X max X min
where X is the hourly AC energy consumption per day, Xmax and Xmin are the maximum and minimum values during one day, respectively, and Xnor is the normalized value whose range is [0, 1].
The k-means ++ clustering method was used to perform cluster analysis [49]. Compared to k-means clustering, the selection process of initial clustering centers of k-means++ is improved and the accuracy is enhanced. The process of clustering is to minimize the sum of the distance of samples in each cluster from its cluster center, as shown in Equation (4). The distance refers to the Euclidean distance, as shown in Equation (5). The set number of clusters would significantly affect the quality of cluster analysis results. This study selected different k values to determine the best clustering number. The Davies–Bouldin index (DBI) was used to judge the rationality of the number [50]. The larger the DBI, the worse the clustering effect, and vice versa [51].
E = i = 1 k s C i d i s t ( s c i )
d i s t ( a , b ) = ( a 1 b 1 ) 2 + ( a 2 b 2 ) 2 + + ( a m b m ) 2
where a = ( a 1 , a 2 , , a m ) , b = ( b 1 , b 2 , , b m ) are two samples in the input dataset with m attributes. d i s t a , b is the Euclidian distance between two samples. k is the number of clusters. s is a sample of the cluster C i , while c i is the center of C i . E is the sum of the Euclidean distances of all samples in C i from the center c i .
Based on the cluster analysis, the typical daily AC usage intensity schedules were built. As the PTHP model in EnergyPlus can only be set in two states of on and off, the cluster results were modified into two states. The conversion results could represent the typical daily AC operation schedules, which were further imported into EnergyPlus input file. The establishment and application flowchart is shown in Figure 3. First, the logistic regression model was used to determine whether the AC was turned on according to the average outdoor temperature of a certain day. If the AC was turned on, the AC operation mode on that day was further determined according to the probability distribution of the clustering results using the Monte Carlo method. Finally, the AC setpoint was determined by the AC setpoint distribution model. The process was repeated until the AC setpoints and operation schedules were developed for the entire cooling season.

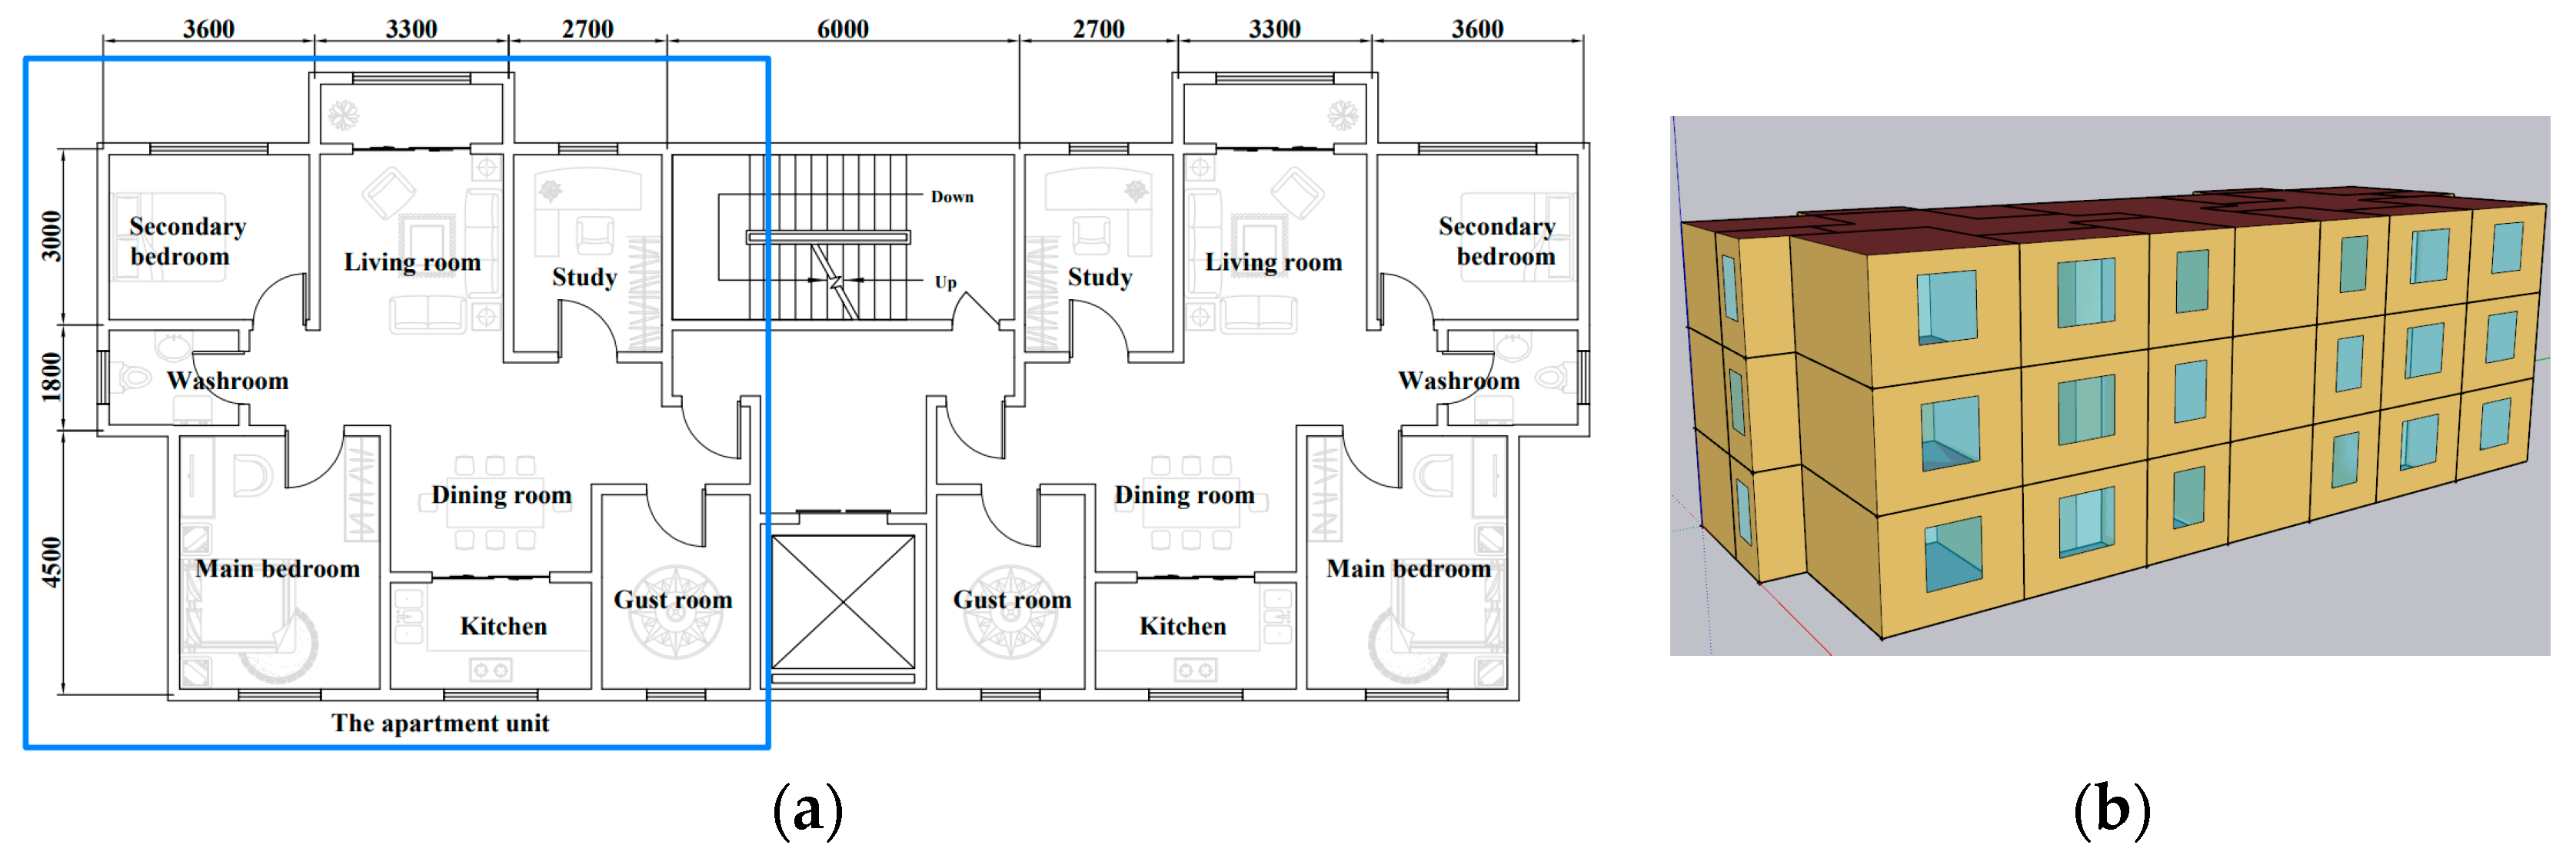
2.3. Energy Simulation Modeling

EnergyPlus is widely used in building energy simulation, and was employed in this study. The target residence was located on the middle floor. Referring to the investigation and the Chinese standard [52], the building plan and physical model were established as shown in Figure 4. The thermal parameters of the building envelope are summarized in Table 3. The internal load and corresponding occupation schedules were based on the mandatory standard in the HSCW zone [53], as shown in Table 4. To avoid the thermal disturbance, the indoor temperatures were measured during non-air-conditioned days of the transition season and were used to verify the parameters of enclosure structure of physical model.
The building cooling period was set from 15 June to 31 August according to Ref. [53]. During the calculation period, the distribution of outdoor temperature is shown in Figure 5, indicating that Chongqing has a significant demand for cooling due to the higher temperature in summer.
The packaged terminal heat pump (PTHP) model was used to represent the AC [54] and was set in two bedrooms in the EnergyPlus model. The capacity settings of the AC referred to the monitored data and were calibrated, to ensure that the setting could reflect the actual AC operation characterizations.
For model calibration, the actual meteorological data of the typical days in transitional season and summer were used. The error index method was used to judge whether the physical model could reflect the running condition of the actual building [55,56]. Mean deviation (NMBE) and root-mean-square error coefficient of variation (CvRMSE) were two commonly used dimensionless error indexes. According to ASHRAE Guideline 14-2014 [57], the threshold of NMBE and CvRMSE were set to 10% and 30%, respectively. The calculation equations of NMBE and CvRMSE are shown in Equations (6) and (7):
C v R M S E = 1 M ¯ i = 1 n ( M i A i ) 2 n
N M B E = i = 1 n ( M i A i ) i = 1 n M i
where Mi and Ai are measured and predicted data at instance i, n is the total number of data values used for the calculation, and M ¯ is the mean value of measured data.
The two developed behavioral models were further incorporated into the EnergyPlus model. Based on the validated building physical model, a custom control algorithm was developed to process the EnergyPlus input IDF files. The control algorithm was written in Python 3.9 with the scripting library Eppy [58] to batch the modified AC setpoint schedules and operation schedules.

3. Results

3.1. Statistical AC Usage Behaviors

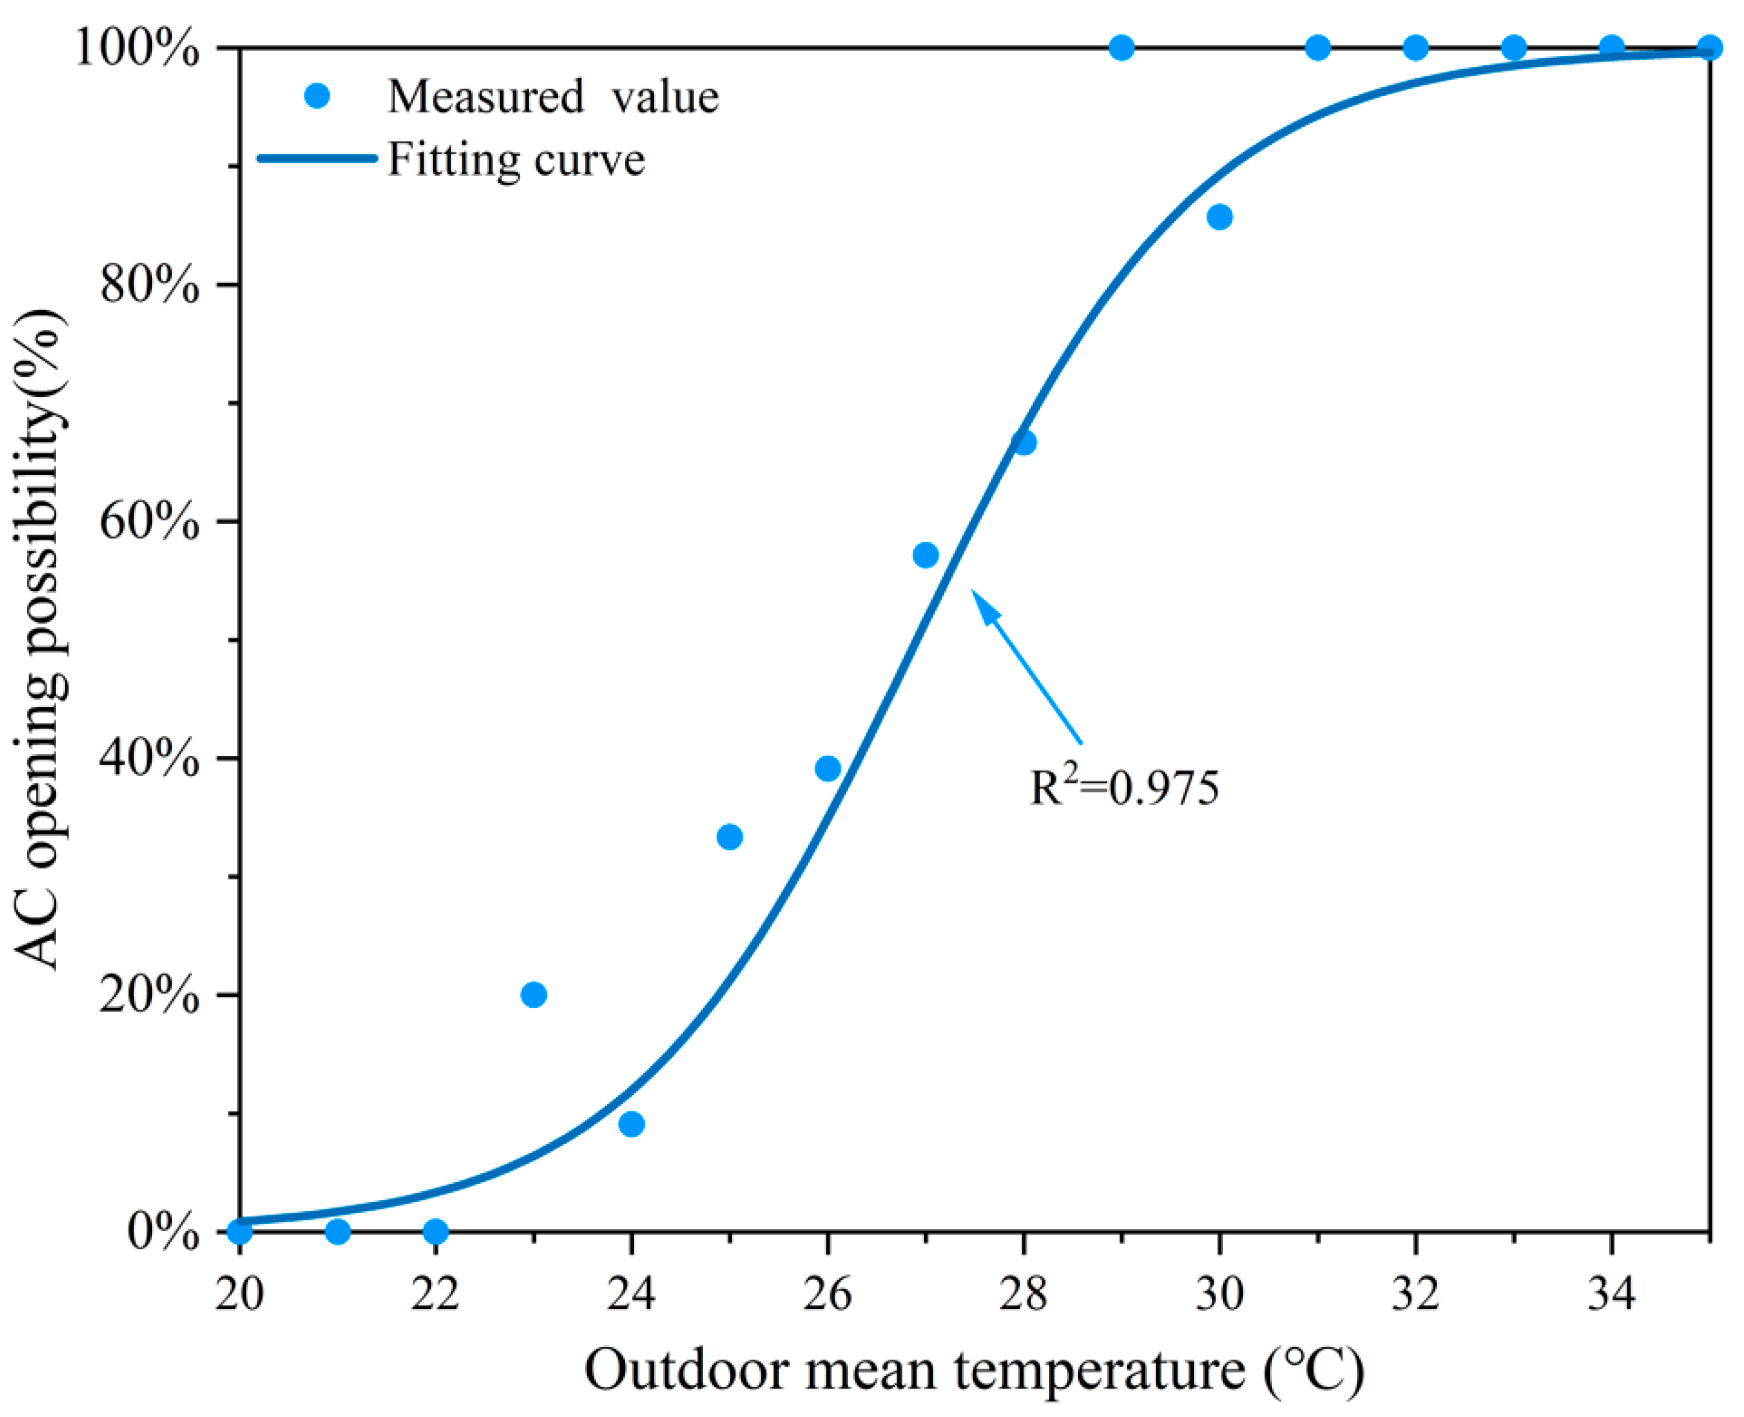
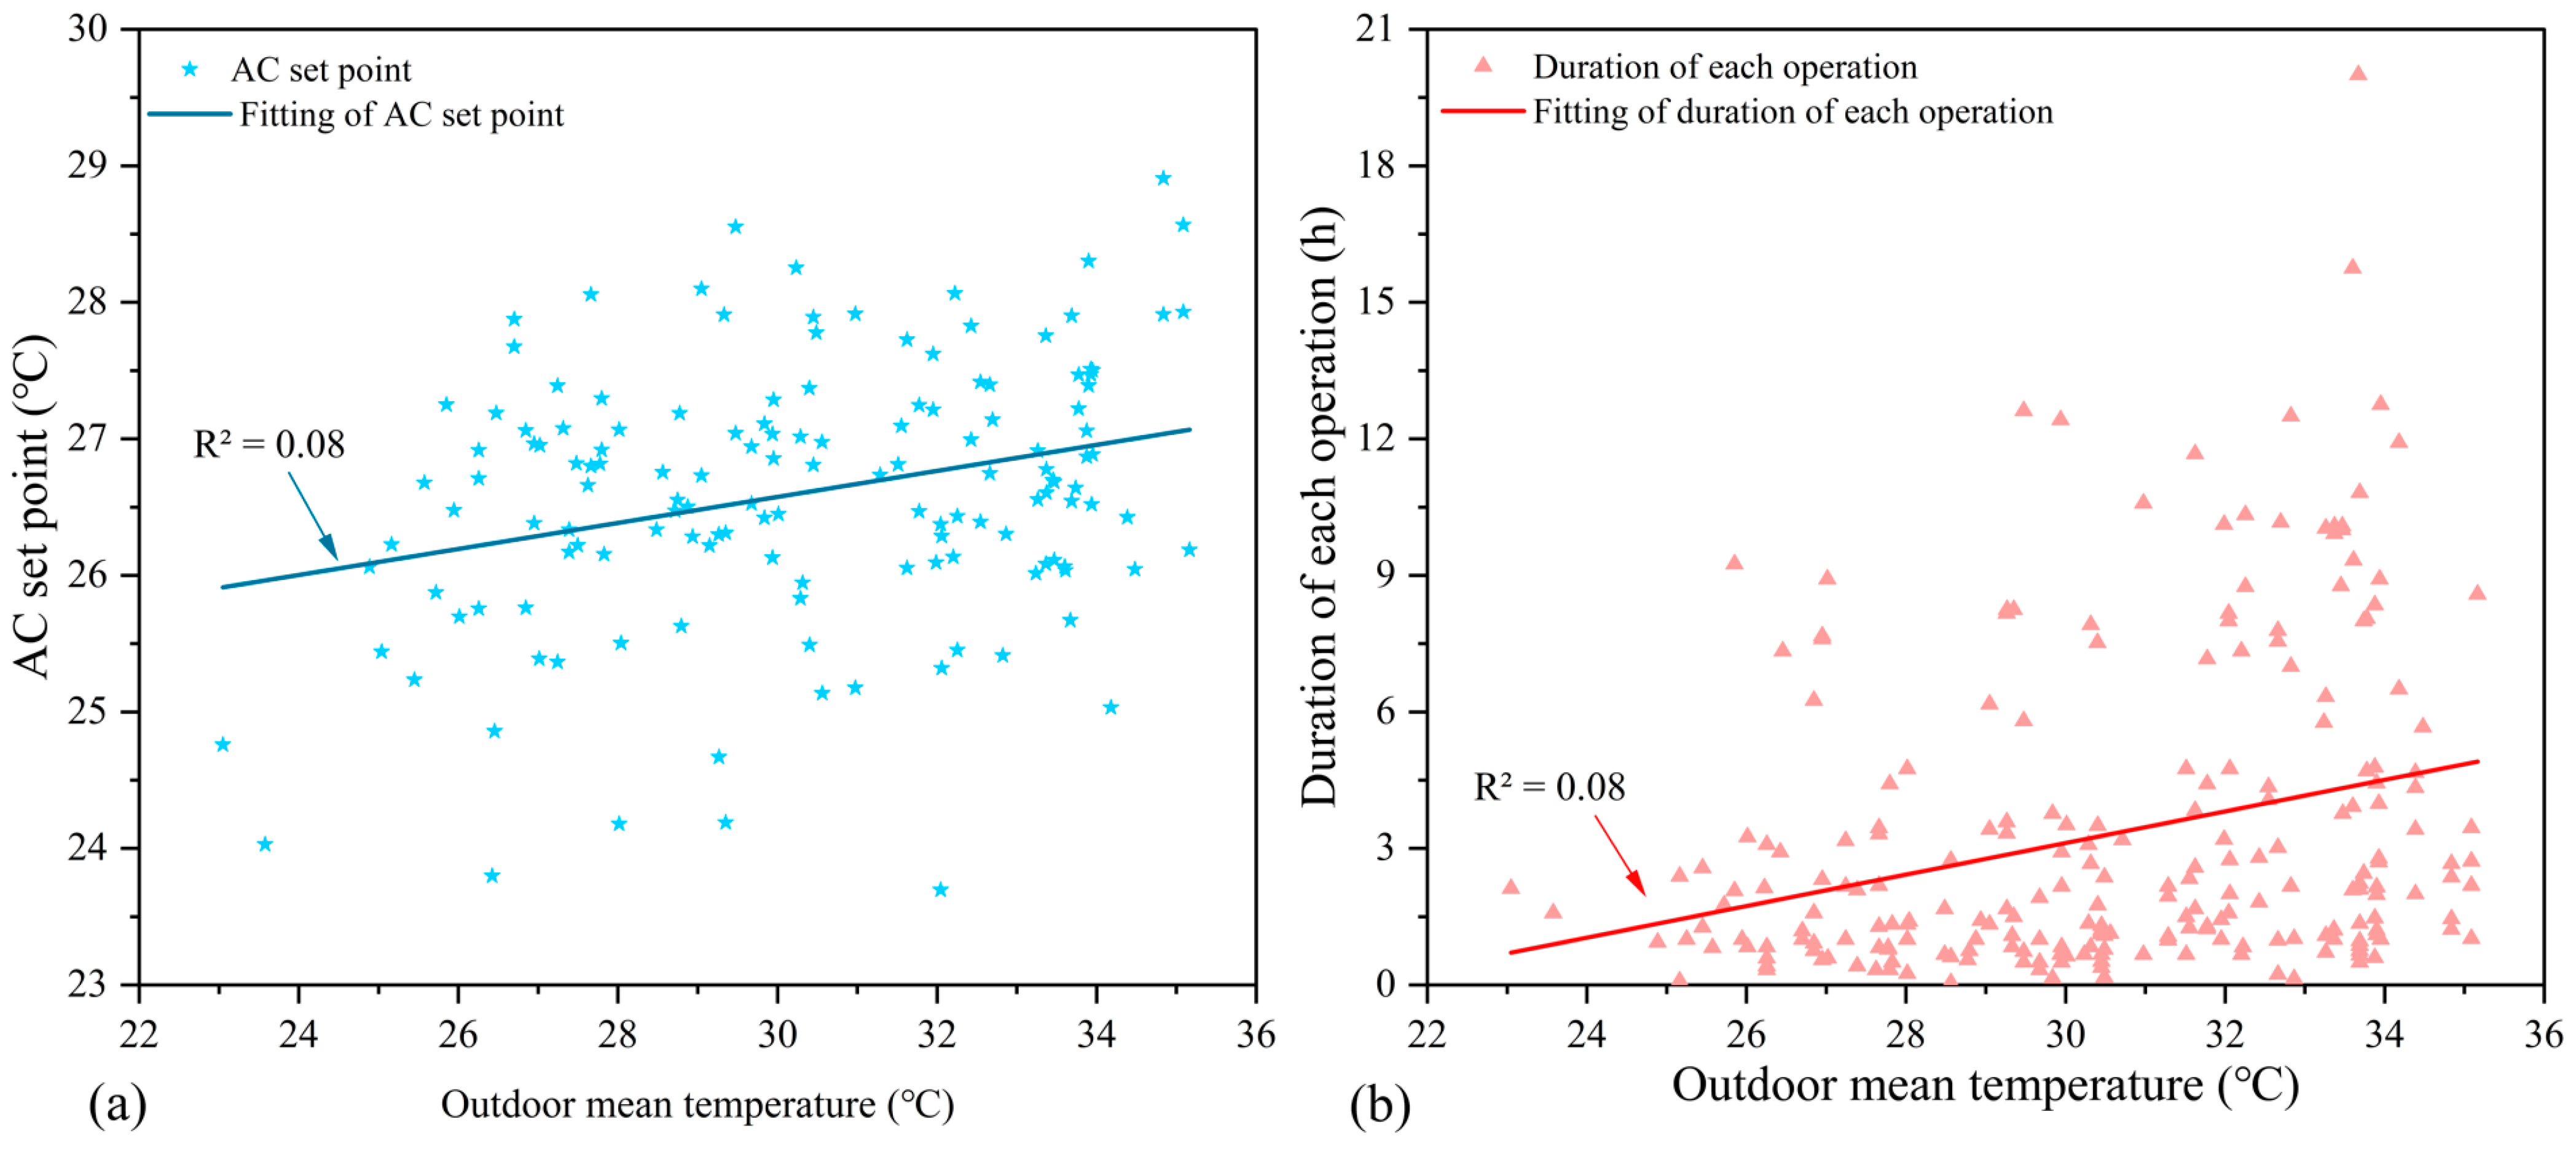
3.1.1. AC Usage Characteristics with Outdoor Temperature

The mean daily outdoor temperature is the most significant statistical variable that affects the AC usage behavior [22]. The AC usage frequency was relatively low in June and July and increased significantly in August during monitoring, when the outdoor temperature was higher. The probabilities of residents turning on AC under different outdoor temperatures was analyzed, using the logistic regression method in Figure 6. The probability equation of AC operating in different daily mean outdoor temperatures is shown in Equation (8). The results show that Hosmer–Lemeshow fit is 0.426 greater than 0.05, and p = 0.000 less than 0.001 [59] for mean outdoor temperature, indicating the outdoor average temperature had a significant impact on whether the AC was on (Exp(B) was 1.606). This logistic regression reveals that the probability of turning on the AC by residents would increase significantly with the increase in daily mean outdoor temperature. To note, we assumed the residents were in homes when there were AC usage records. When there was no occupancy, it indicated no AC usage and was not considered in this study in simulation.
P = exp ( α + β 1 T ¯ ) 1 + exp ( α + β 1 T ¯ )
where P is probability that the AC is turned on at different mean outdoor temperatures, T ¯ is the mean outdoor temperature, expressed in °C, and α and β1 are regression coefficients of −18.458 and 0.686, respectively.

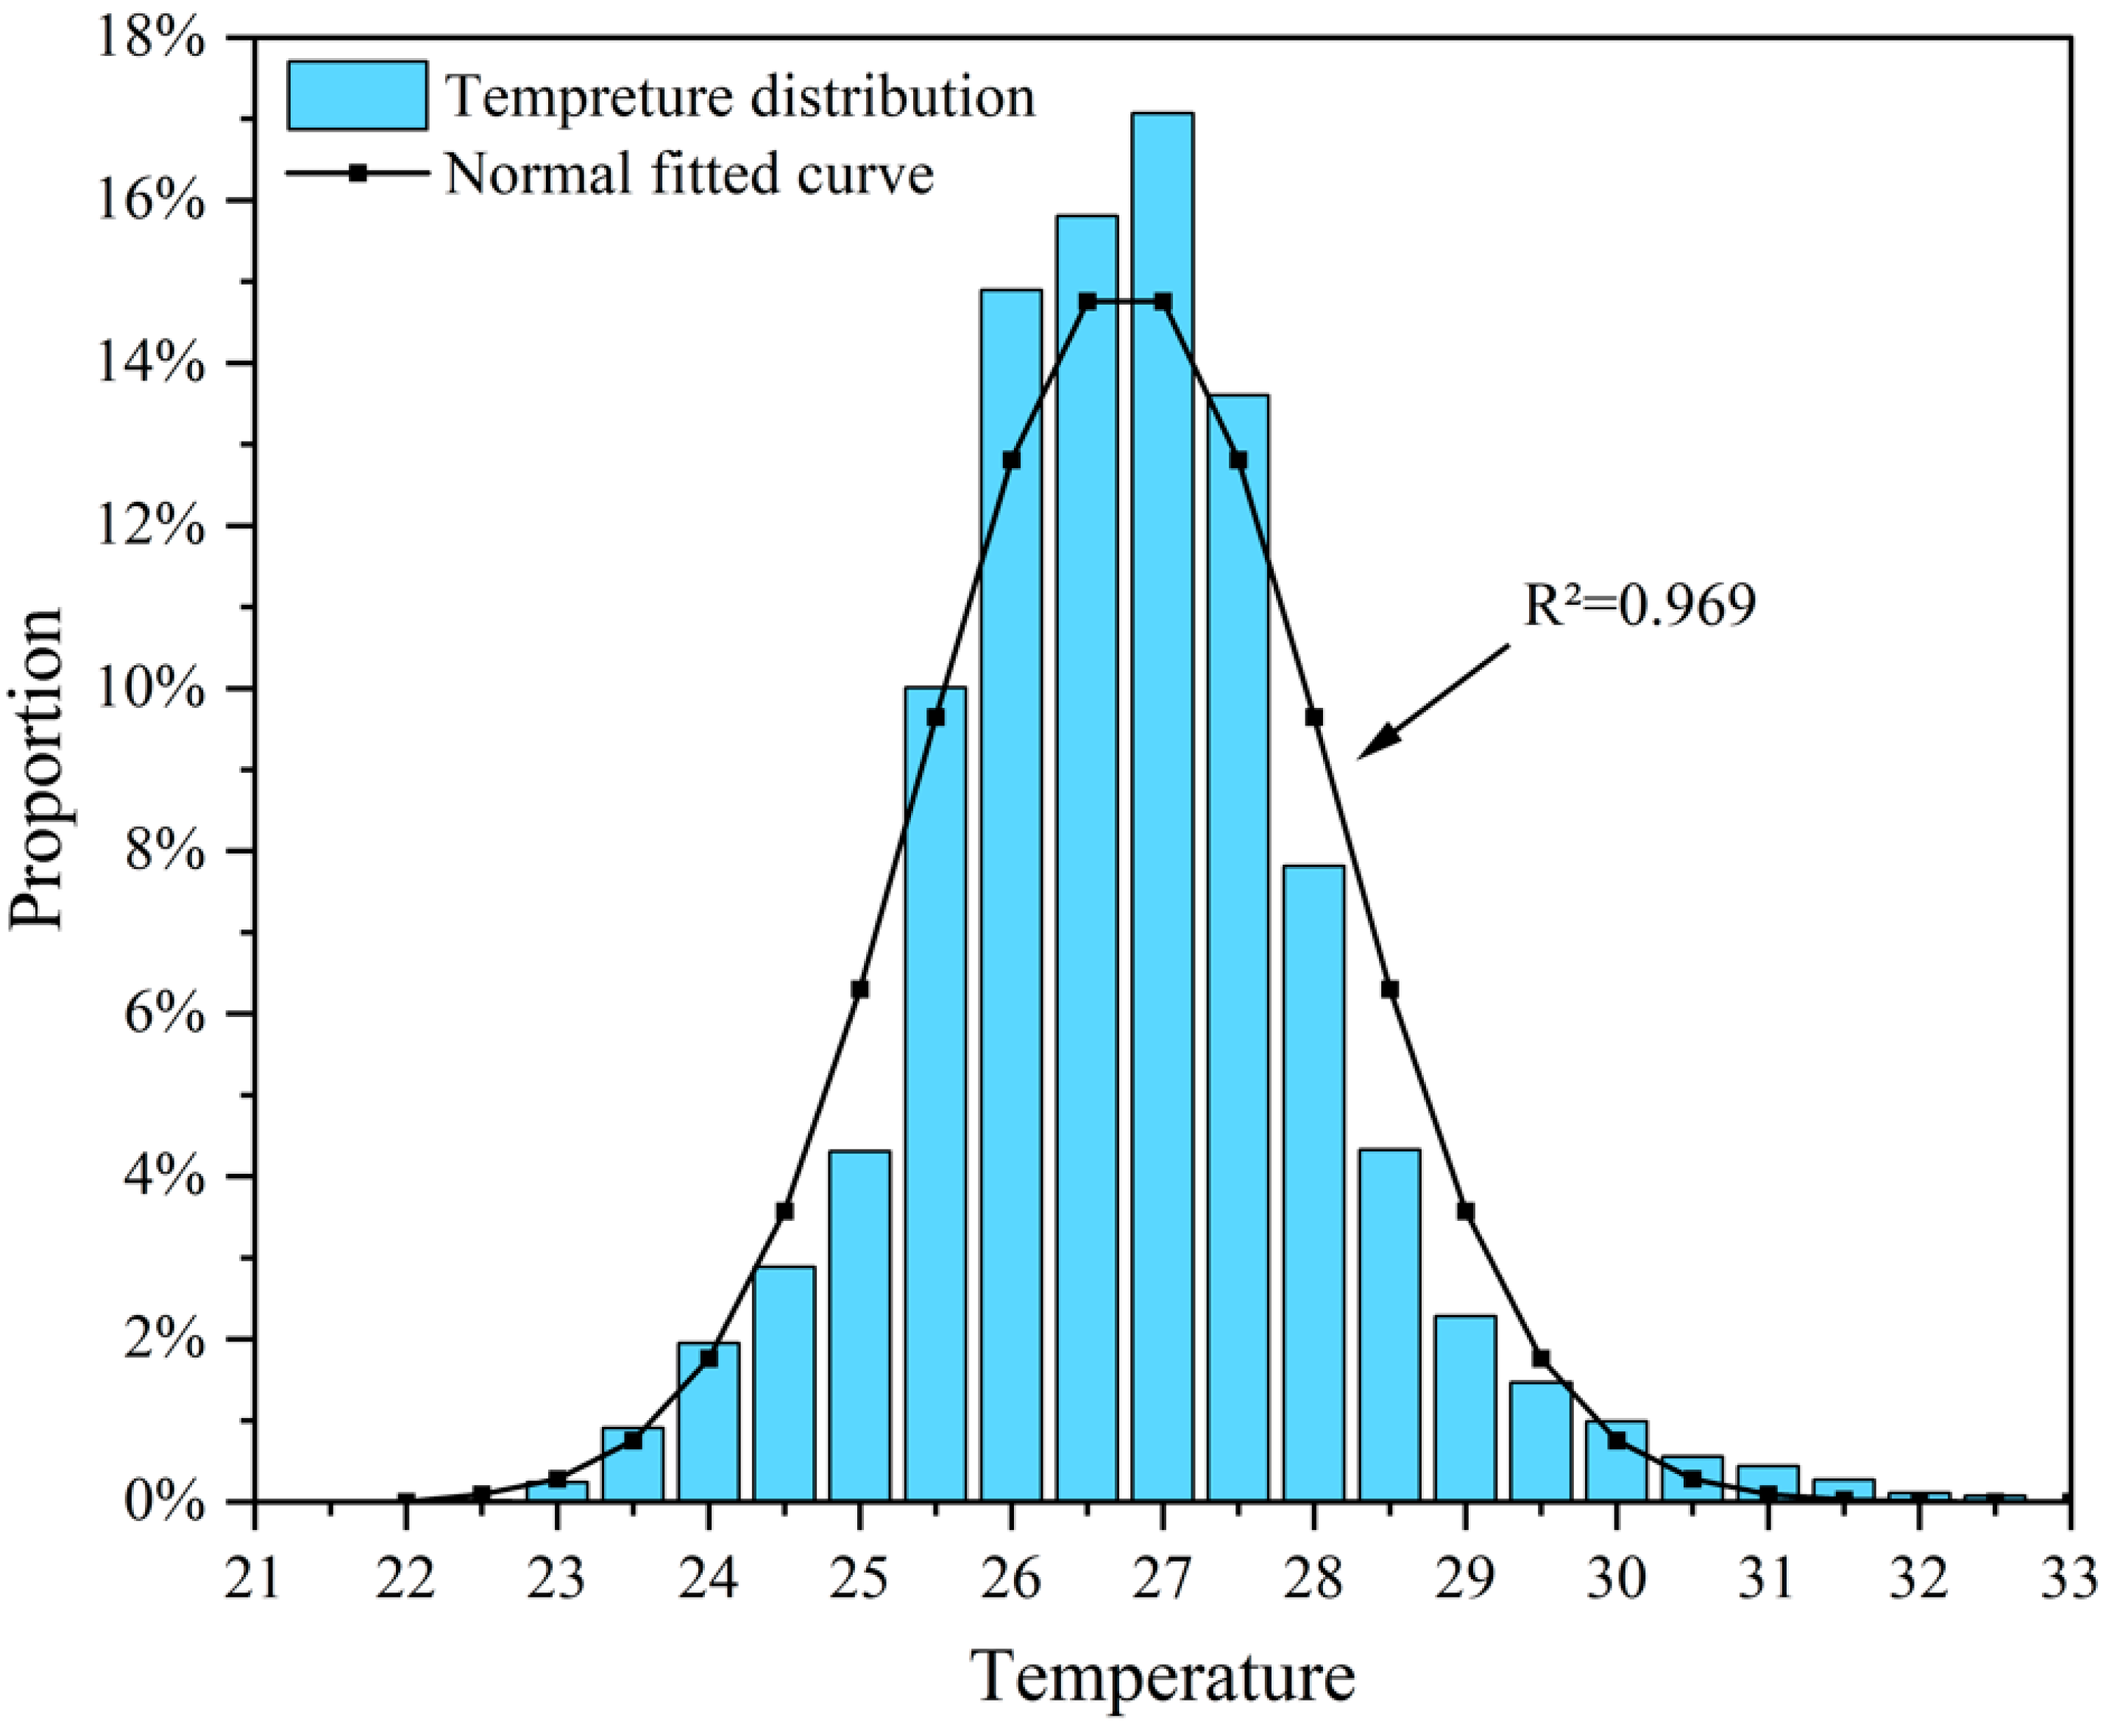
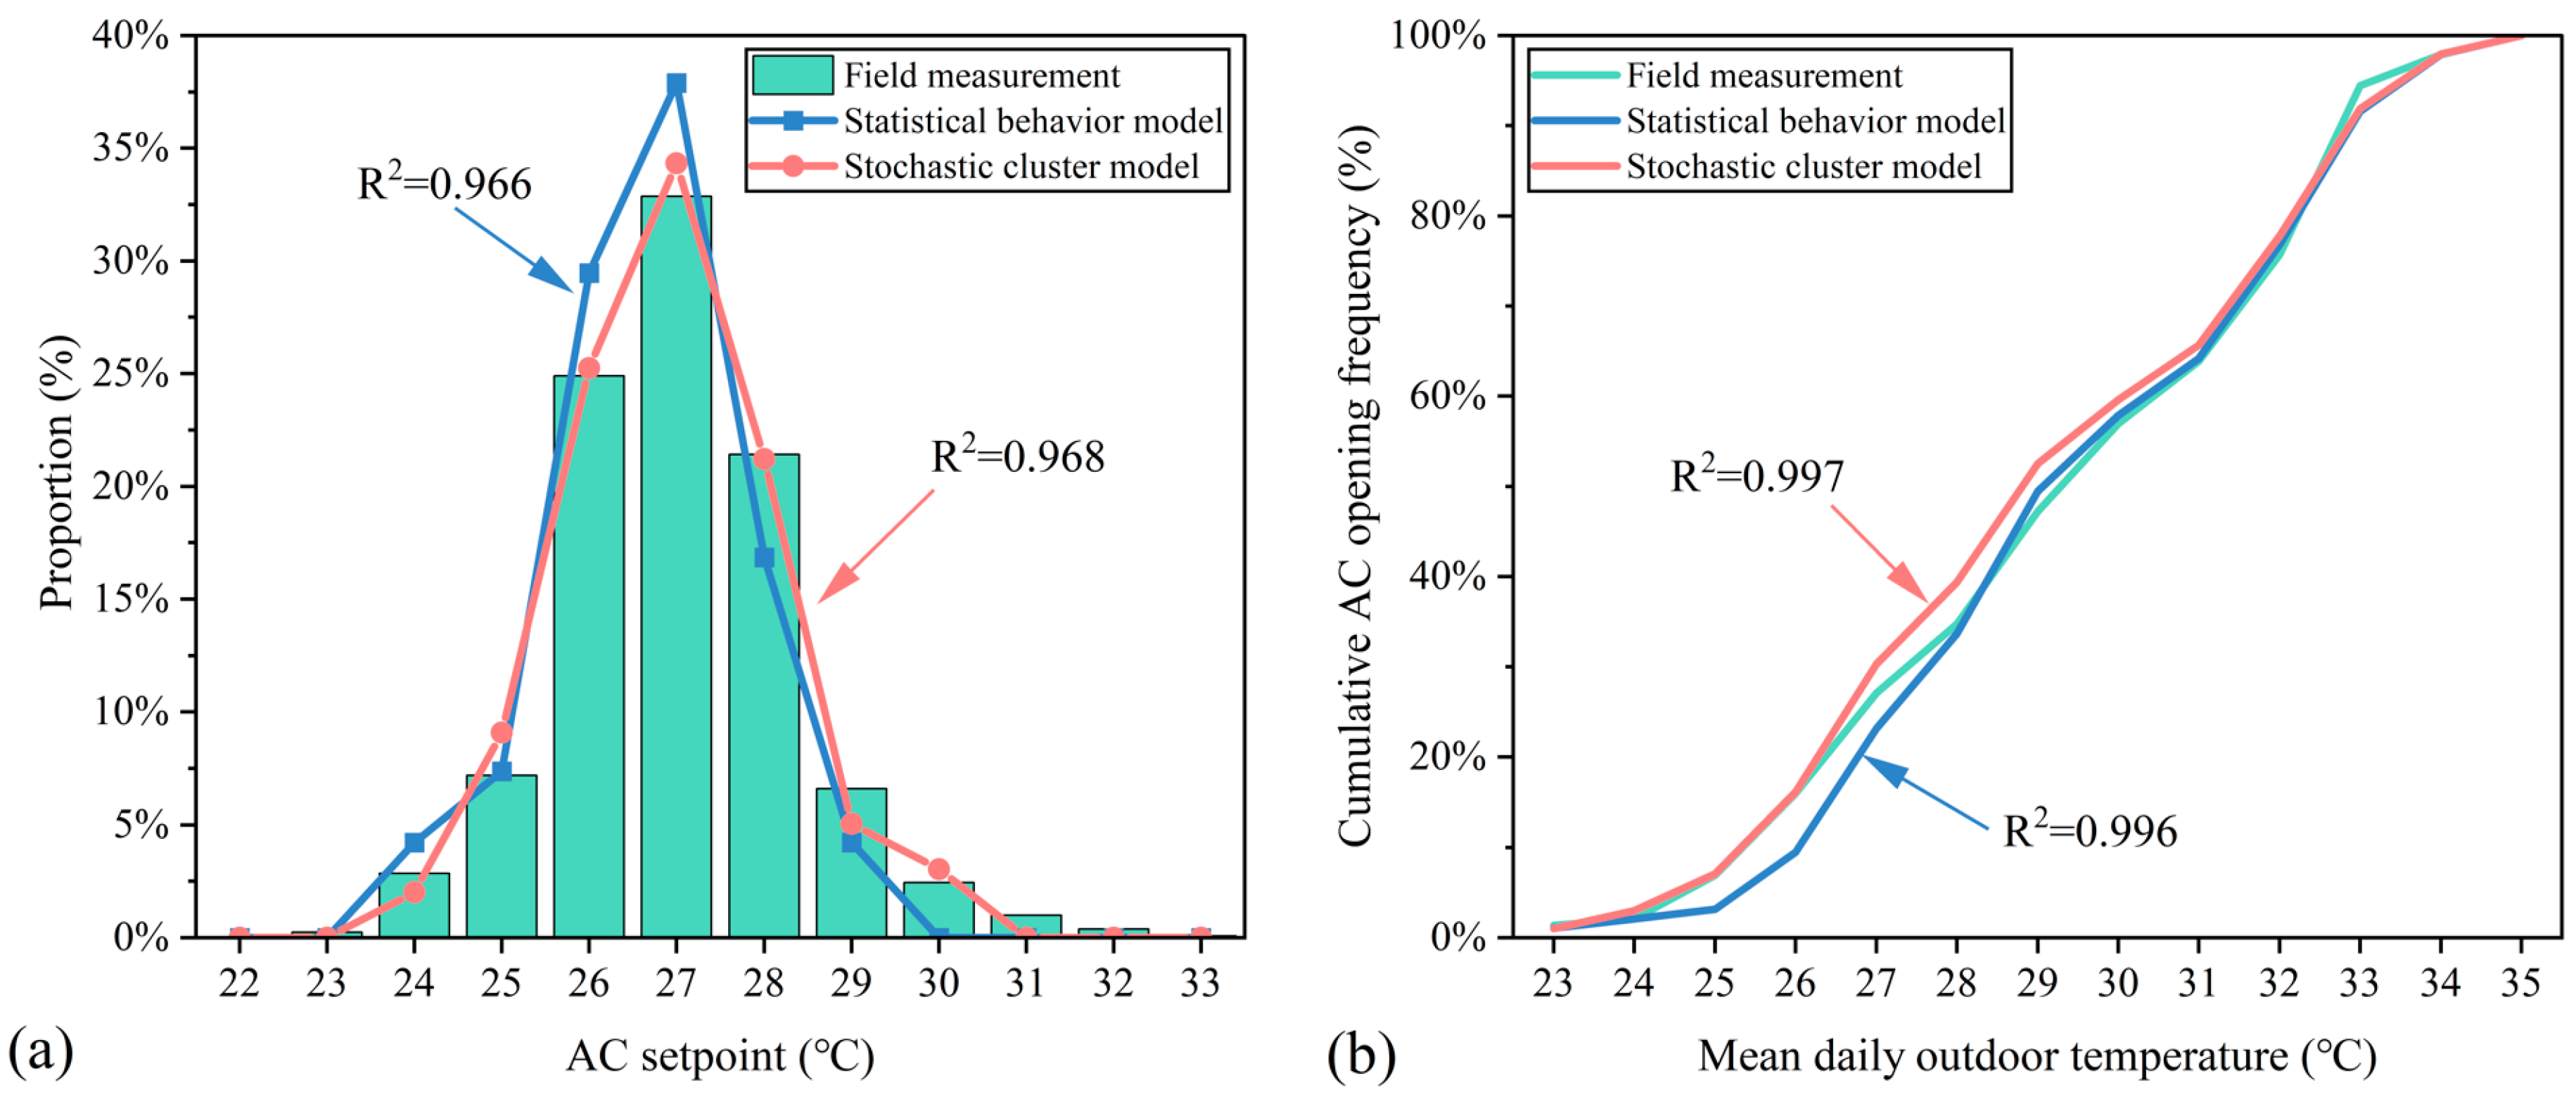
3.1.2. AC Setpoint Distribution

The average indoor temperature when the AC was operating was used to reflect the AC setpoint. The distribution is shown in Figure 7. The distribution of AC setpoint data shows the characteristic of normal distribution, the data conform to the normal distribution curve, with the average and standard deviation being 26.50 °C and 1.32 °C, respectively, with a normal fit R2 of 0.969. The fitting function is shown in Equation (9). Such distributions are highly consistent with big data analysis on AC embedded sensors from multiple cities in the HSCW zone. The AC setpoints within the range of 24–28 °C exceeded 85%, which also shows characteristics of normal distribution [60]. Based on the normal distribution curve, normal sampling was used to determine the residential AC setpoint in simulation stage.
f ( t | μ , σ ) = 1 σ 2 π e ( t μ ) 2 2 σ 2
where μ is the average of setpoints, 26.50 °C and σ is the data standard deviation, 1.32 °C.

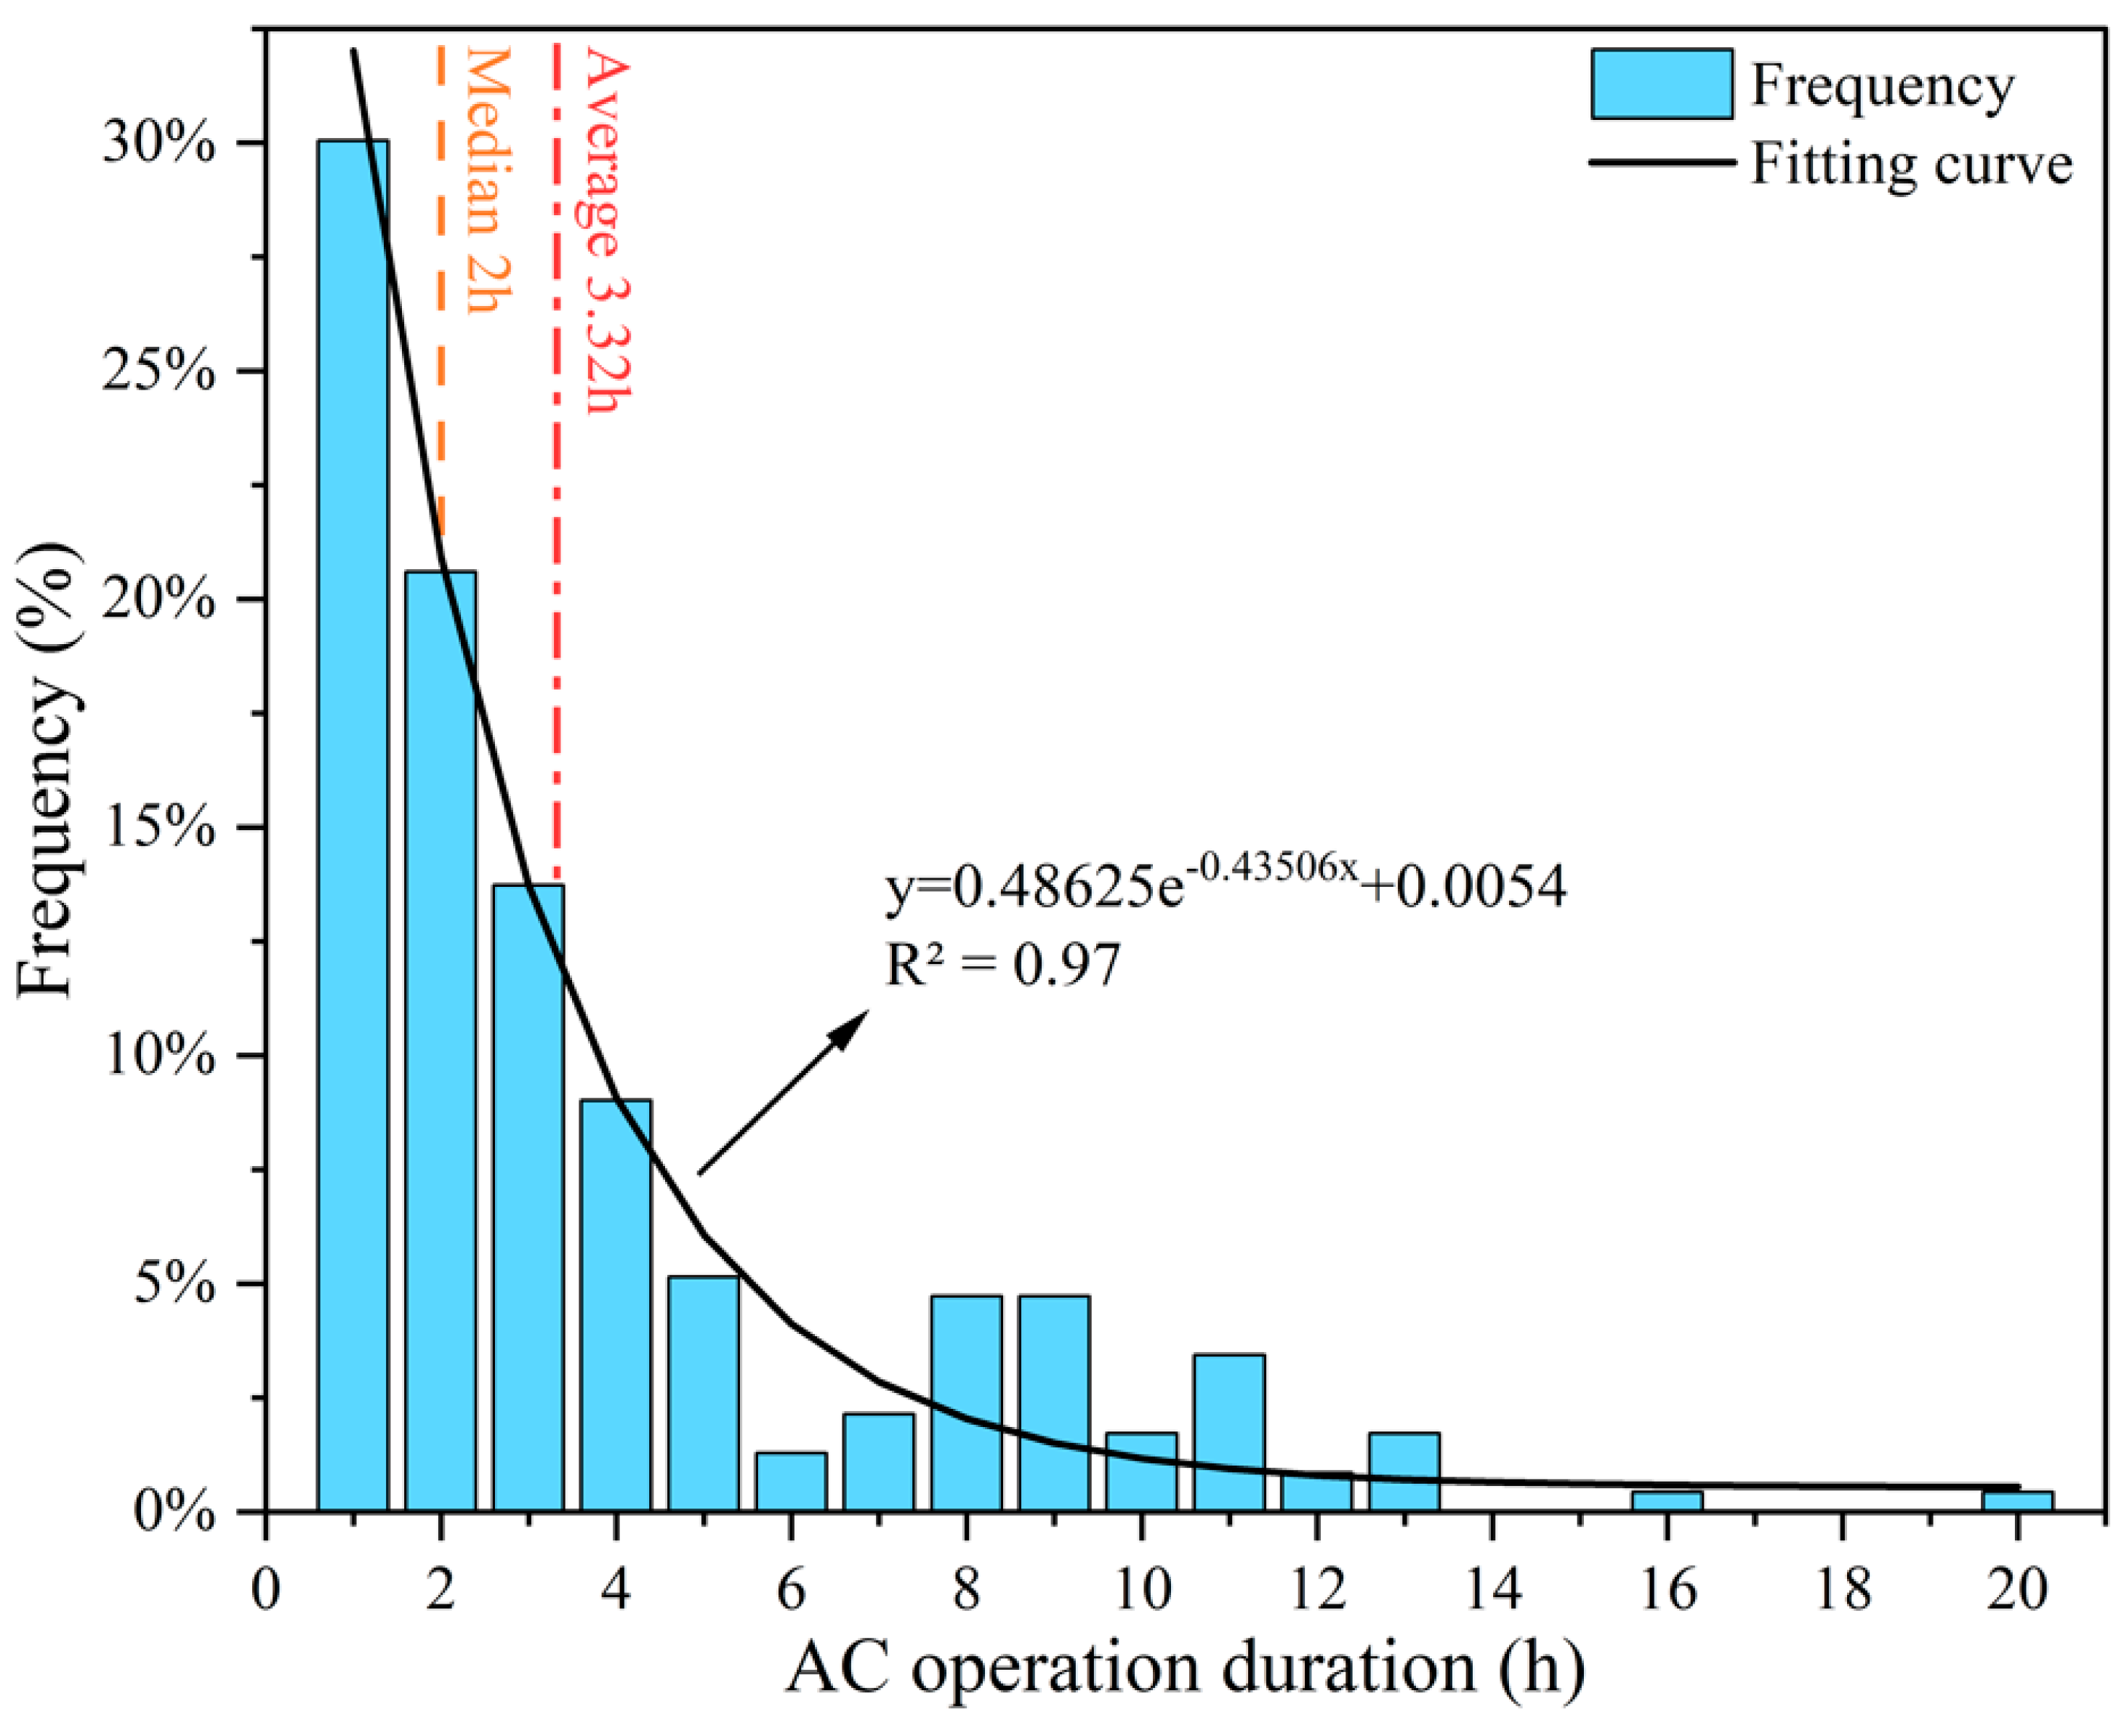
3.1.3. AC Operation Duration

The AC operation duration is shown in Figure 8. Short-term intermittent operation accounted for the majority of cases, which was similar to the distribution of AC opening duration by field survey [42], revealing the “part-time and part-space” mode for AC usage in residential buildings in the HSCW zone [61]. The average AC operation duration was 3.32 h. There was a small peak between 8~11 h, which might be caused by using AC all night during sleep. The regression based on the distribution frequency is also displayed in Figure 8. The results show good fitting performance, as the R2 was about 0.97, which could be used to predict the AC operation duration in the simulation stage.

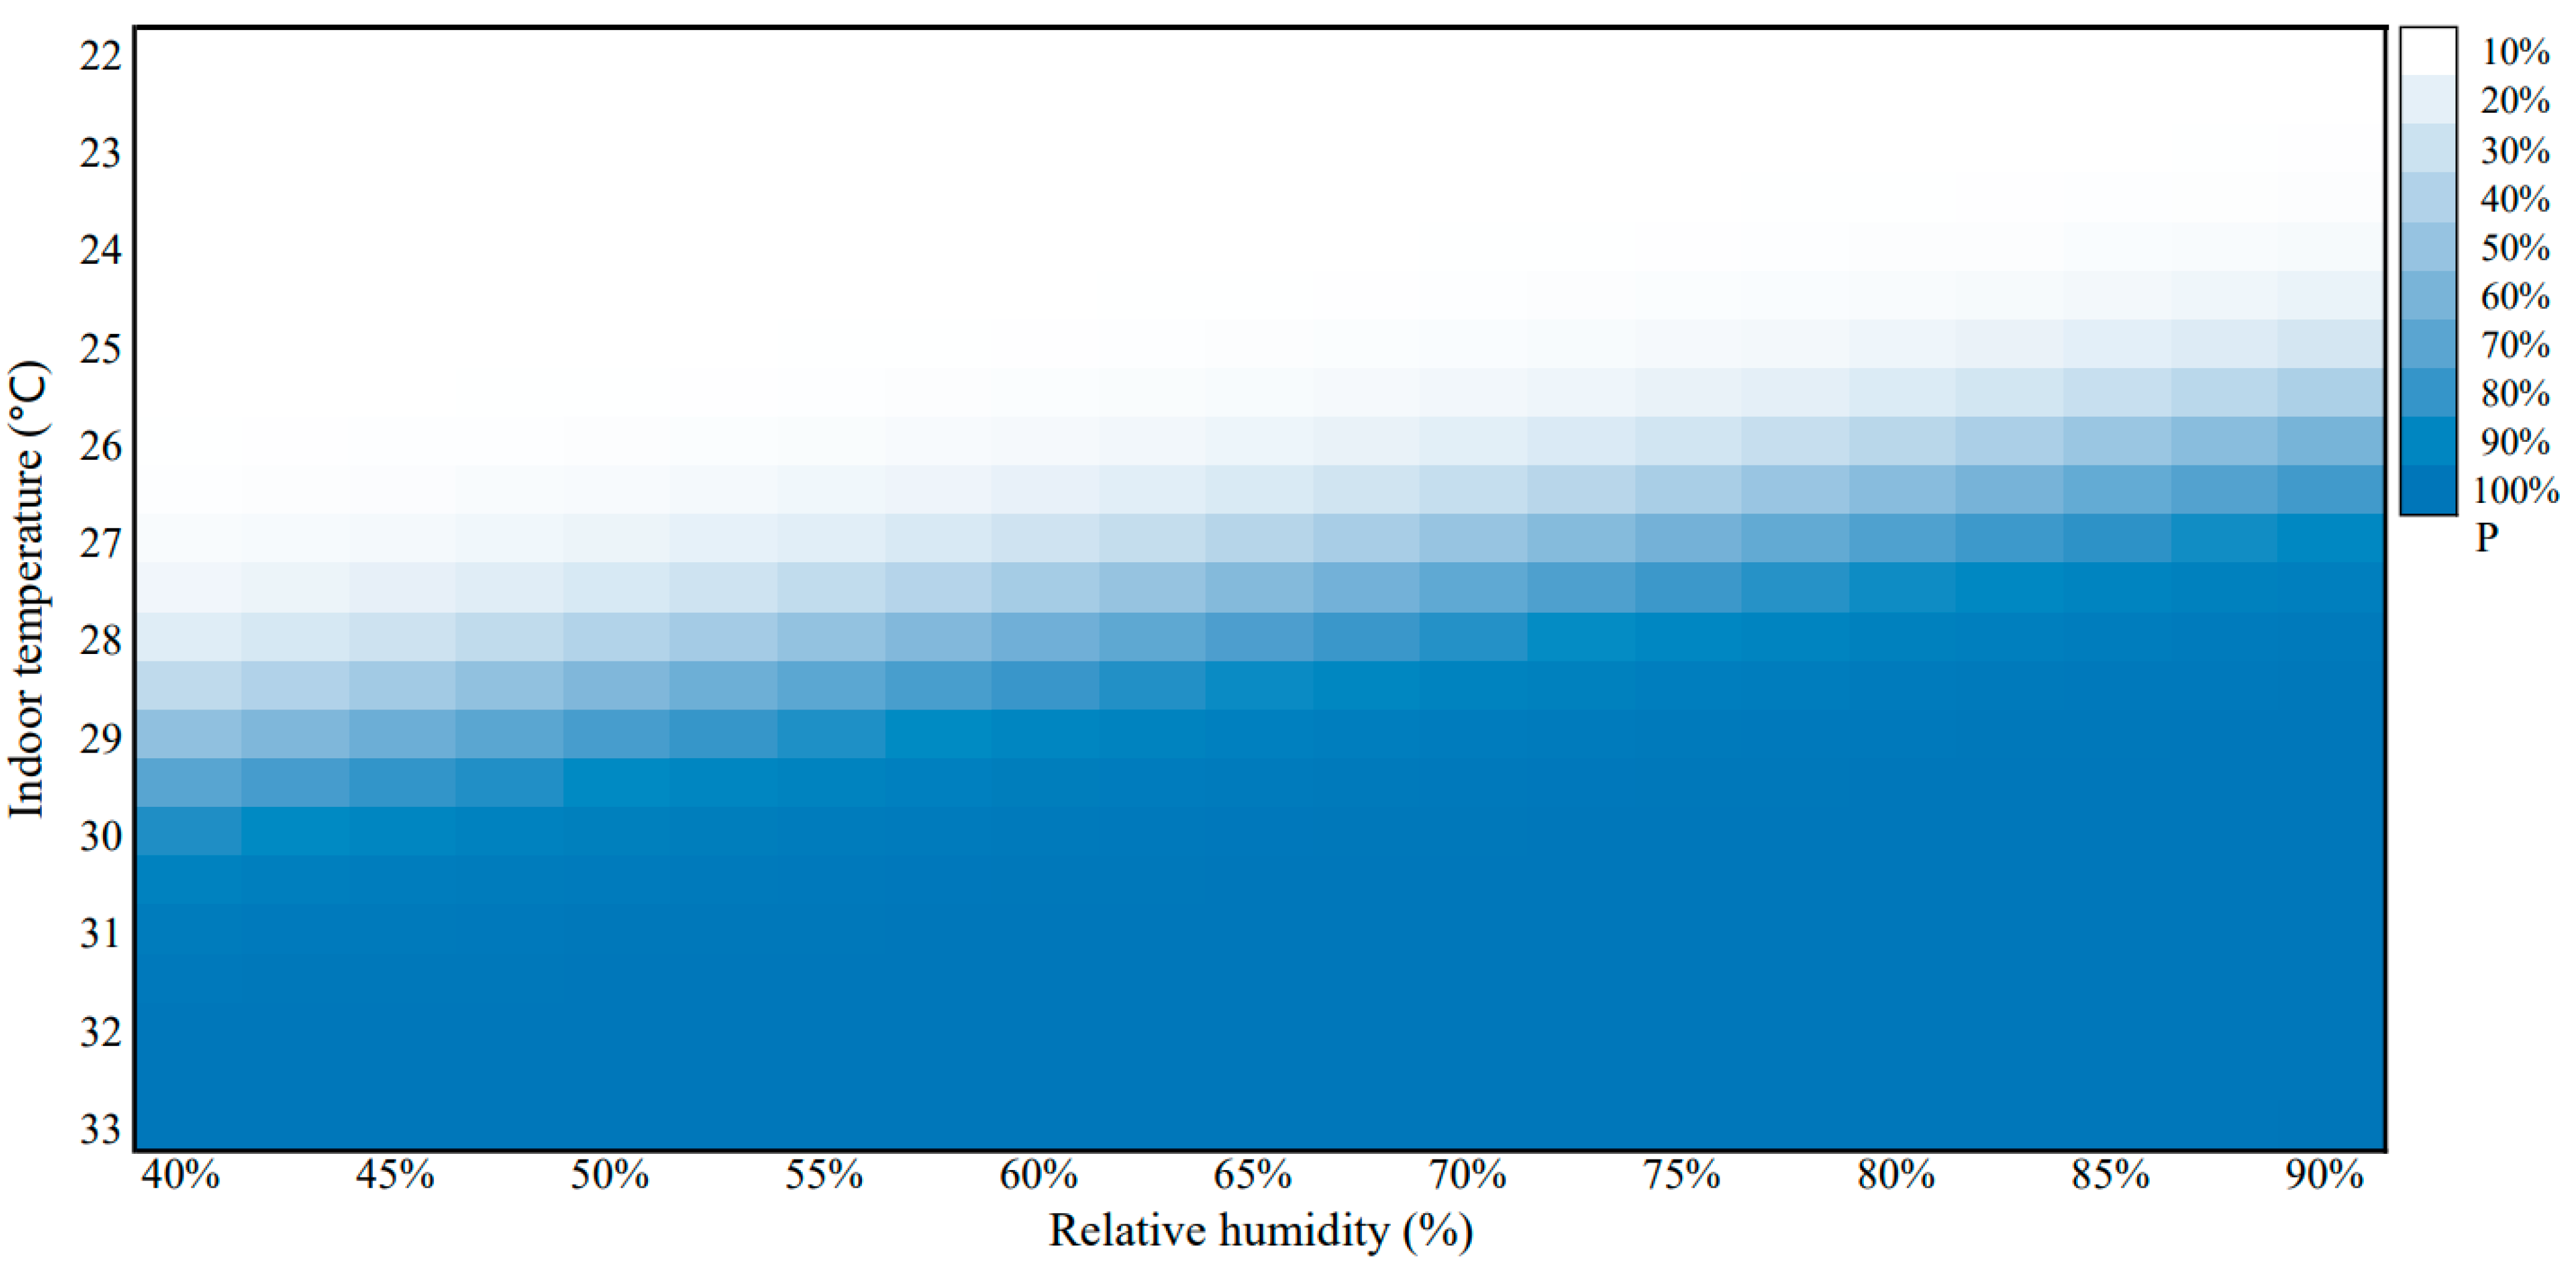
3.1.4. Logistic Regression for AC On/Off Behavior

Logistic regression was carried out for the AC on/off behavior, based on the collected temperature and humidity data and AC start–stop data. The probability of turning on the AC under different indoor temperature and humidity is shown in Figure 9. With the increase in indoor temperature, the probability of turning on the AC increased significantly. The accuracy of model prediction was 89.1%. The AUC value by goodness of fit test was 0.951 (p < 0.05), indicating a good prediction performance.
P = exp ( α + β 1 T + β 2 R H ) 1 + exp ( α + β 1 T + β 2 R H )
where P is probability that the AC is turned on in different indoor environments, T and RH are the indoor temperature and relative humidity, expressed in °C and %, respectively, and α, β1, and β2 are regression coefficients of −53.15, 1.68, and 10.78, respectively.
The fitting results show that indoor relative humidity and temperature have significant impacts on the AC usage. When the humidity was in the range of 60~80% and the indoor temperature was higher than 29.5 °C, the probability of turning on the AC was higher than 88.5%. During the occupant behavior simulation, the indoor logistic regression model was used to determine when to turn on the AC according to the hourly simulated indoor temperature and humidity.

3.2. Stochastic Clustering Modeling

3.2.1. Cluster Analysis Results

Since the number of clusters in cluster analysis was not known a priori, the clustering index (DBI) generated by different cluster numbers is shown in Figure 10a. When the number of clusters was three, the evaluation index DBI was the lowest, indicating the three clusters could represent different typical AC usage patterns in the cooling season. Figure 10b shows the details. Cluster 1 and Cluster 3 had the highest percentages, with a combined of 92.3%, which represented the usage patterns of when residents turned on AC before going asleep at night and turned it off before leaving the bedroom in the morning. Cluster 2 represented the AC usage pattern of when AC was used throughout the day and the usage intensity was highest when the outdoor temperature was highest, which accounted for a small proportion of the overall, only 7.7%. Compared with using AC all day, the intermittent mode was the typical AC usage pattern in the HSCW zone. The clustering results were used to estimate the AC usage intensity.

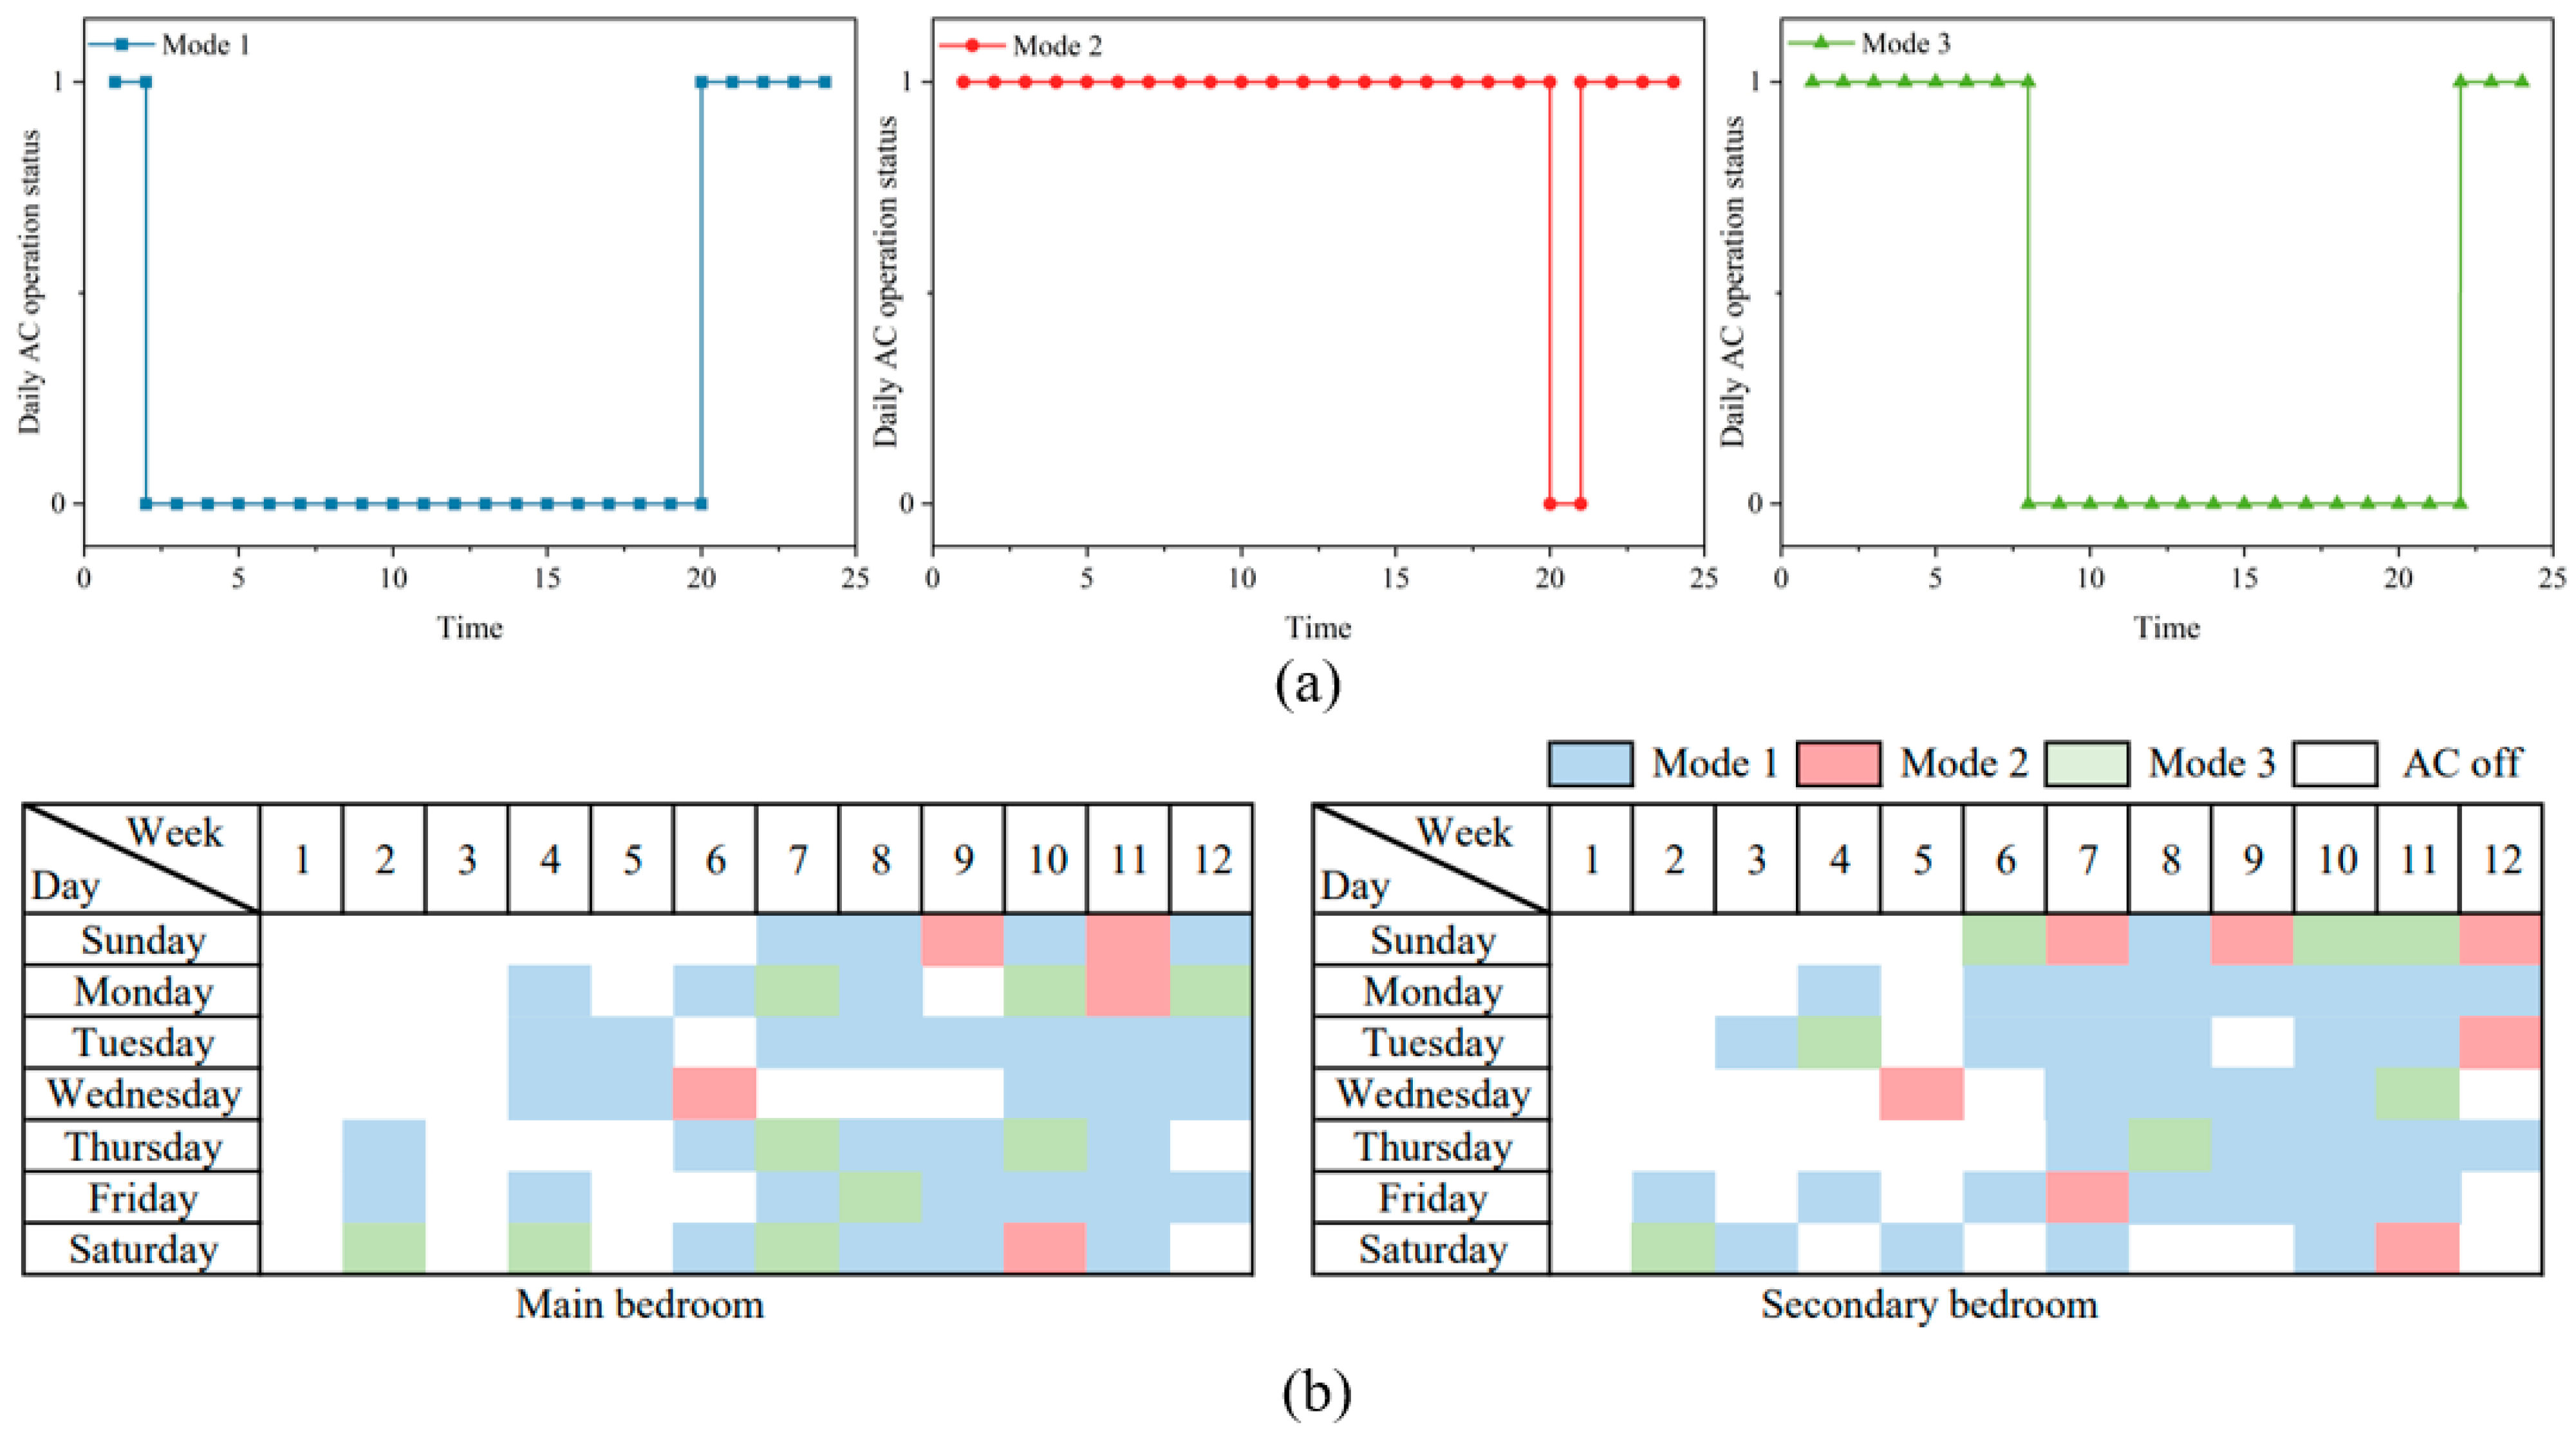
3.2.2. AC Operation Schedule Generating

Since there were only two statuses of AC operation (on/off) in the simulation logic, the clustering results of AC usage modes were converted into the AC operation schedules. With reference to [32], it was assumed that the AC was on when the AC energy consumption intensity was higher than the threshold value of 0.2, otherwise, it was assumed to be off. The detailed modes are shown in Figure 11a. The outdoor logistic regression model was used to determine whether the AC was on during a certain day by using the average outdoor temperature. If the AC was on, the Monte Carlo method was used to generate the AC operation schedules for the two bedrooms, as shown in Figure 11b.

3.3. AC Energy Consumption Simulation

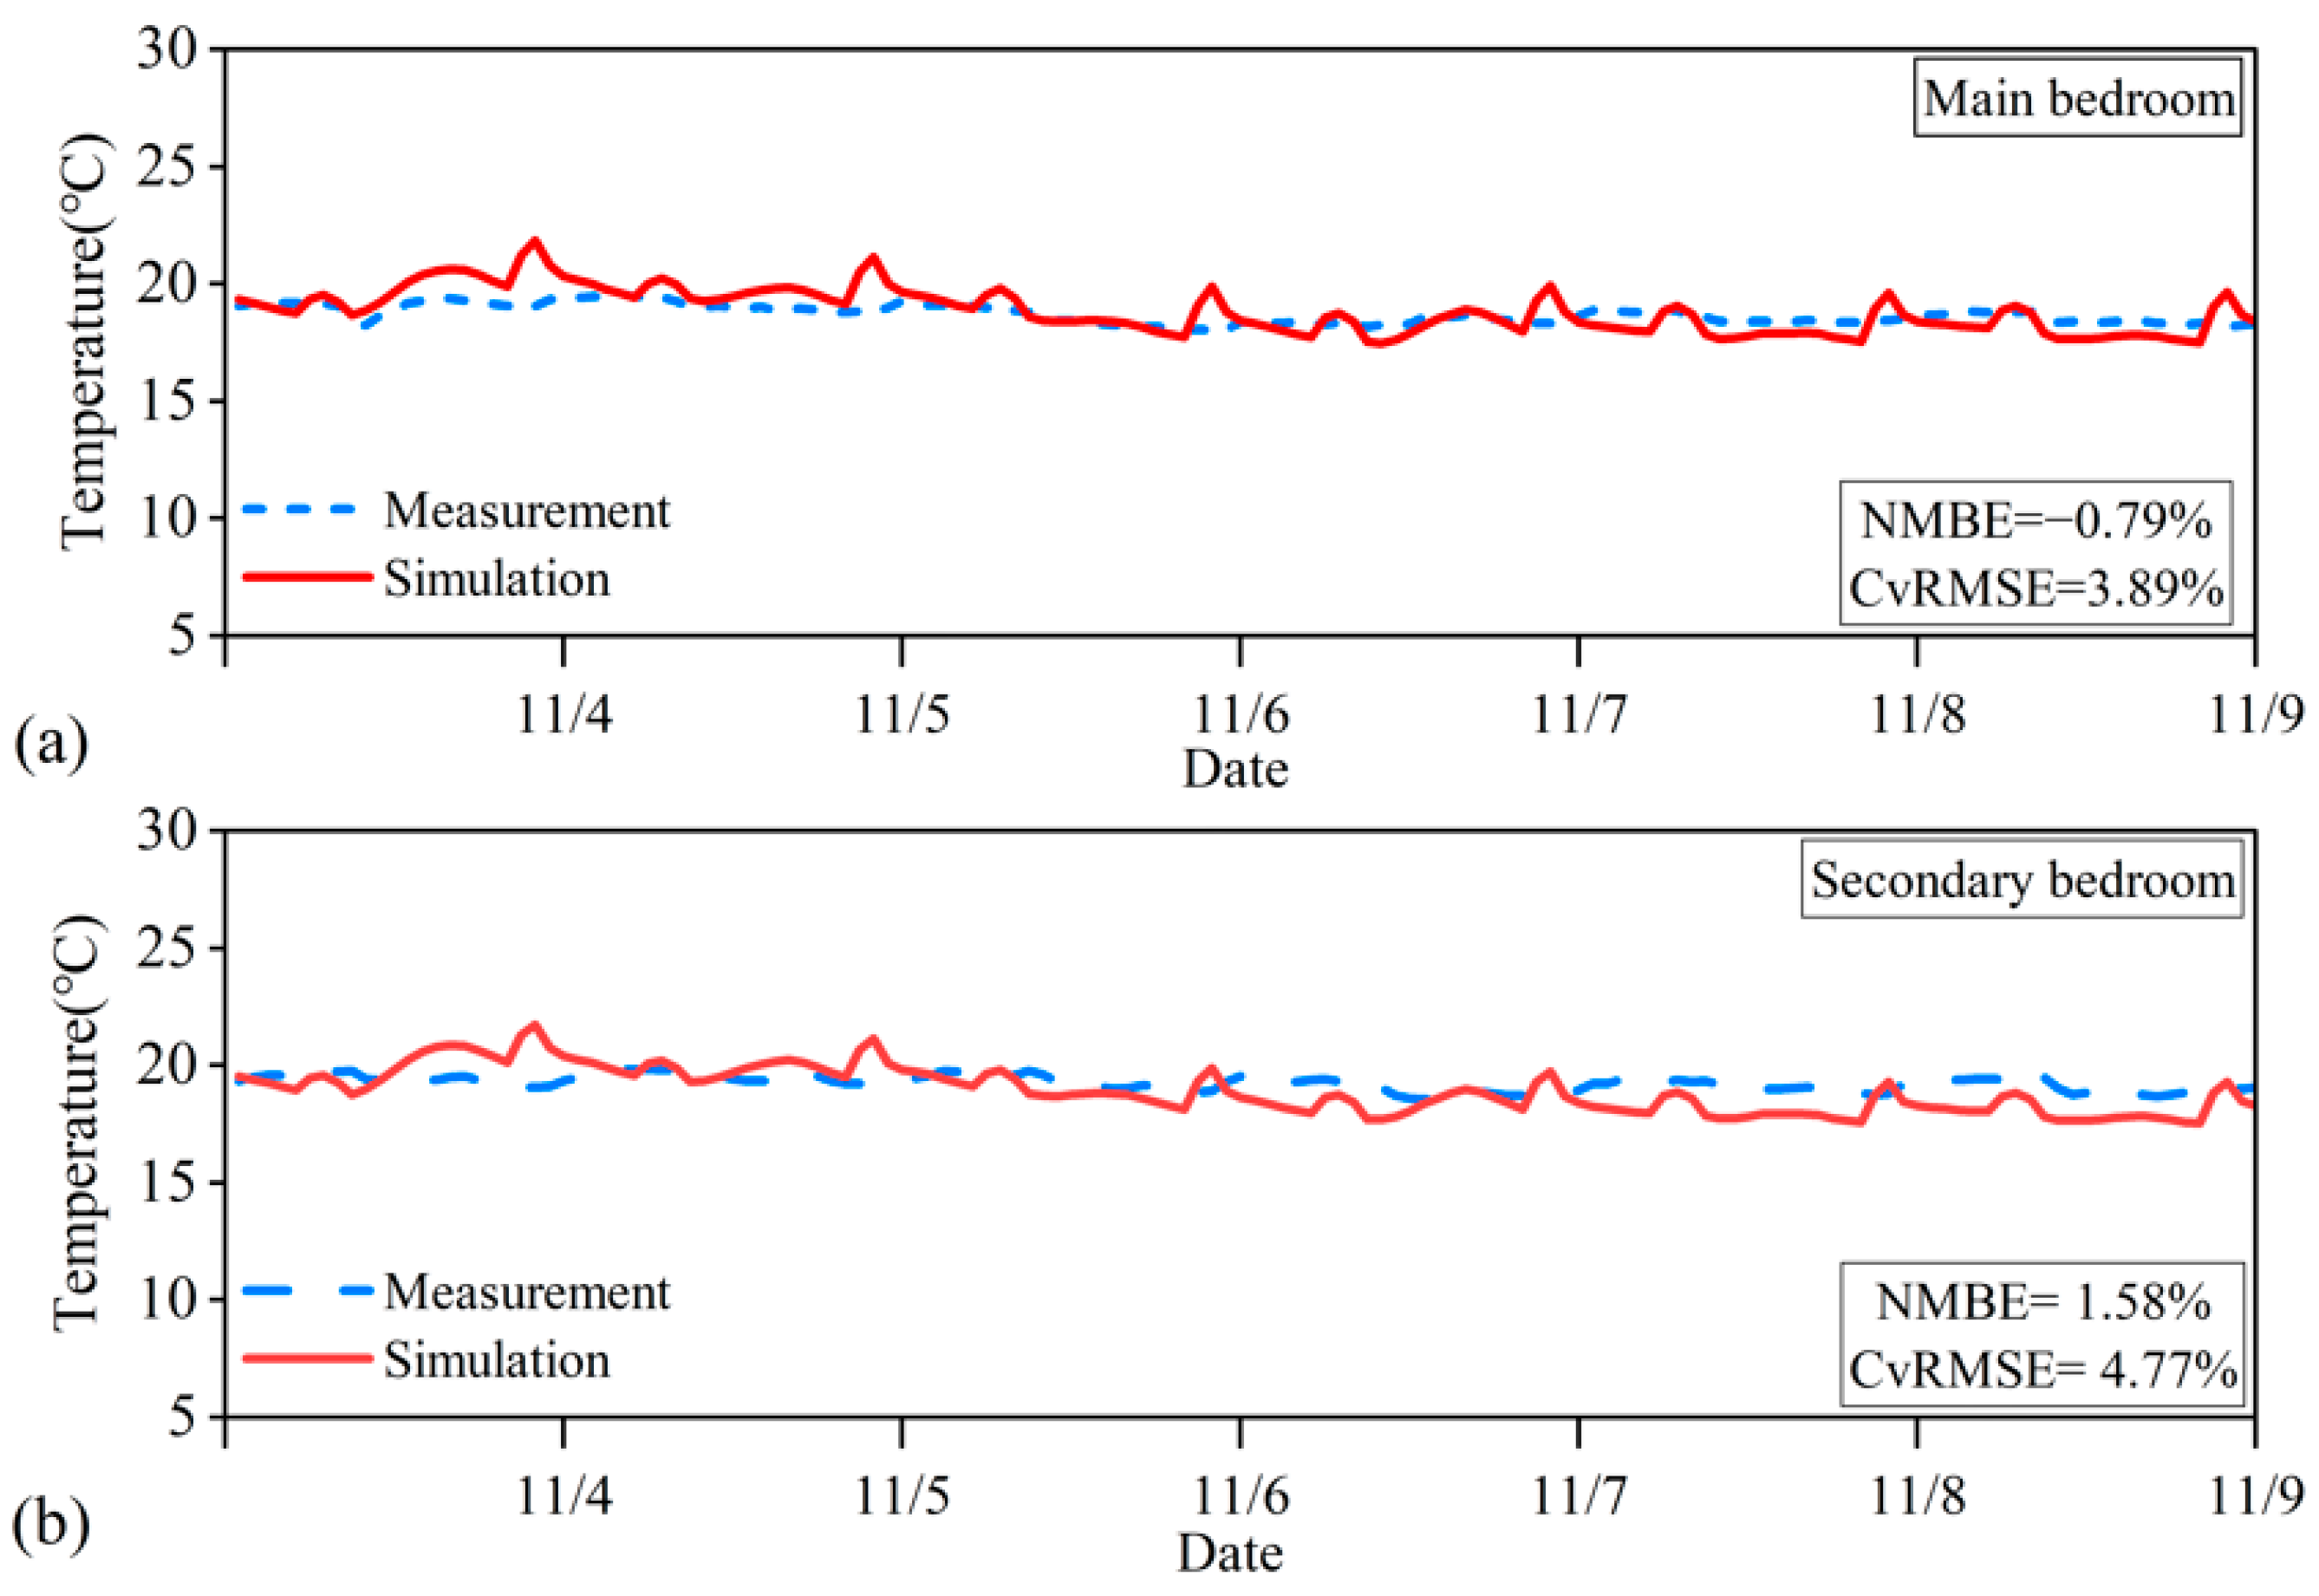
3.3.1. Model Calibration

In this study, the envelope structure of physical building model was first calibrated by the measured thermal environments on typical days in the transition season (between 4 and 9 November 2019), in order to avoid the influence of indoor thermal disturbance. The hourly indoor temperature distributions in the master bedroom and the second bedroom are shown in Figure 12. The NMBE and CvRMSE of the physical model were calculated to be −0.79% and 3.89% for the main bedroom, and 1.58% and 4.77% for the secondary bedroom. Comparing with the hourly error requirements of ASHRAE Guideline 14-2014 [57], two error indexes met the requirements of the standard and the physical model could reflect the thermal characteristics of the actual building and was used for further simulation.
Then, the typical days in summer (from 7 to 16 August 2019) were used to calibrate the setting parameters of the AC. The average daily outdoor temperature during this period were all higher than 26 °C. The actual AC operation schedules from field measurements were used in the calibration process. The daily AC energy consumption obtained by simulation and measurements is shown in Figure 13. The calibration results show that the energy consumption simulation results could meet the error requirements of ASHRAE Guideline 14-2014. Therefore, the established physical model could be used for the subsequent AC energy consumption simulation.

3.3.2. Comparison of AC Energy Consumption with Different AC Usage Models

Based on the verified building model, the AC cooling energy consumption with different AC usage models were simulated, as shown in Figure 14. The daily AC energy consumption distribution in the whole cooling season under different setting modes is shown in Figure 14a. The results show that the two fixed-behavior models based on standards significantly overestimated the AC energy consumption, especially for the ASHRAE standard with the full-occupancy mode. As the typical AC usage pattern in the HSCW zone is “part space and part time”, the simulated cooling energy consumption was up to 825.95 kW·h with the recommended AC usage schedule in ASHRAE standard, which was 6.35 times higher than the actual measured value (only 130.06 kW·h).
This could be explained by the fact that the AC opening duration and AC setting points in the standard situation differed greatly from the actual situations. In contrast, the part-time mode based on the Chinese standard used a shorter AC opening duration setting, and the AC setting temperature was closer to the actual setting. As a result, the predicted cooling energy consumption was 373.26 kW·h, which was 2.87 times higher than the actual value. This was similar to one field investigation combining with the cooling energy consumption simulation in the HSCW zone, in which the simulation results of standard-based fixed AC usage modes was 3.89 times higher [62]. The standard-based fixed behavior pattern significantly overestimated the AC usage intensity [24], and the exaggerated simulation results might lead to misunderstandings of building energy demands, which would potentially affect energy efficiency managements.
In contrast, the simulation results based on the established random models were significantly consistent with the actual values, as shown in Figure 14b. The residents almost did not use AC in June and the AC usage intensity gradually increased over the next two months. Such usage patterns were better reflected in the two stochastic model settings. The energy consumption by the stochastic cluster analysis model was 238.50 kW·h, which was higher than that of the statistical behavior model of 156.58 kW·h. The statistical behavior model slightly overestimated the cooling demand in the early stage of the cooling season, but the simulated AC energy consumption in August was very close to the actual value. Overall, compared to the stochastic cluster model, the simulation results based on statistical behavior model were closer to the actual total AC energy consumption.
To further verify the performance of the two stochastic models, the simulated results were compared to the field measurement data, as shown in Figure 15. Figure 15a exhibits the indoor temperature distributions based on simulation outputs and monitored results. The simulation results from two stochastic models were normally distributed, which was similar to the actual distribution from field measurement. The coefficients of the AC setpoint distribution for the statistical model and stochastic clustering model are 0.966 and 0.968, respectively. Figure 15b shows the increase in cumulative frequency of opening AC with the mean daily outdoor temperature under three situations. Since the established models considered the influence of outdoor temperatures on AC usage, the AC opening frequency generated by two random models showed a high degree of consistency with field measurement, which was believed to benefit the AC cooling energy consumption simulation.
We further explored the distributions of daily AC energy consumption of two stochastic models and the field measurement and this is shown in Figure 16. Compared with the cluster model, the proportion of measured daily energy consumption lower than 4 kW·h was significantly higher, indicating the stochastic cluster model overestimated the daily AC energy consumption. Since the operation modes of the AC in EnergyPlus had only two states, on/off, such deviations might be attributed to the overestimation of the AC operation intensity in the process of converting typical AC usage modes from cluster analysis. In contrast, the distribution of daily AC energy consumption generated from the stochastic behavior model was much closer to the actual distribution, with an R2 of 0.967.

4. Discussion

Identifying key variables that affect occupant behavior is a critical step in modeling occupant behavior. In this study, we found a poor linear correlation between AC setpoints and opening duration and the average daily outdoor temperature, with an R2 of 0.08 in Figure 17. However, the results in Figure 6 show that outdoor temperature significantly affected whether the AC would be turned on or not. As a result, ignoring the influence of environmental factors on AC usage behavior would significantly overestimate AC energy consumption, as set in existing conventional standards in Figure 14. Zaki et al. [26] used the probability density functions of opening time, operation duration, and setpoints to generate the AC operation schedules. However, the method did not consider the influence of environmental factors. Xie et al. [41] adopted a similar strategy in AC usage behavior modeling, generating a AC setpoint schedule based on the monitored data but lacked simulation verification. Though Liu et al. [26] adopted multiple indoor and outdoor environmental parameters to establish a logistic regression model to predict the AC opening schedule, the maximum error was about 25.5%. This was believed to cause great deviations when it was applied to the energy consumption simulation results, considering the error caused by the generation of the AC setpoint and the simulation process. In contrast, the stochastic statistical behavior model established in this study considered the environmental factors and actual AC usage modes obtained from field monitoring, which better predicted the randomness of occupant behavior and the influence of environmental factors on AC usage, leading to improved modeling accuracy, as shown in Figure 14.
A cluster analysis method was used to process the hourly AC energy consumption data to identify the typical AC operation schedules. From the comparative results, the stochastic cluster model was less accurate compared to the statistical behavior modeling model. The PTHP model has only two operating states of on and off. The typical cluster results were simplified in the process of predicting AC operation schedules. In future studies, other data that would affect AC usage behavior, such as AC setpoint, opening time, or occupant thermal preference, could be included in the cluster analysis. In addition, the AC energy consumption intensity in the early part of the cooling season, such as June and July, was much lower than that in the late cooling period, as shown in Figure 14. Due to the limitation of the sample size, cluster analysis was performed without differentiating between different parts of the cooling period, which is subject to further research in the future. With the development of the Internet of Things, it is possible to collect the building heating/cooling energy consumption and environment data to establish a high-precision and large capacity database, which would further promote the stochastic occupant behavior modeling [63].
While existing simulation studies continue to improve the prediction accuracy of building energy consumption, most have focused on the uncertainty analysis of physical factors such as building envelope parameters and HVAC systems. Insufficient consideration of the interaction between people and buildings still leads to significant differences [64]. Studies have demonstrated that the lack of considering occupant behavior is a major source of uncertainty in current simulation [65]. Though the simulation in EnergyPlus enables users to set different types of behavior schedules, it is actually limited to fully consider the randomness and dynamics of occupant behavior. This study was carried out to profile the strong stochastic characteristics of residents’ AC usage behavior in residential buildings in the HSCW zone. The developed stochastic models quantified the stochasticity and uncertainty of AC usage behavior during the cooling season. The modified schedules were combined with EnergyPlus, and the accuracy of AC energy consumption simulation was greatly improved. Of note, targeting occupant behaviors modeling, uncertainty analysis of occupancy, and occupant energy-related behaviors are believed to the main sources of uncertainty in residential building energy consumption. This study mainly focused on the AC-related factors, such as the probability of opening AC with temperature, the setpoints, duration, etc. In future studies, other factors such as lighting, natural ventilation, and occupancy could be explored and simulated using the proposed methodology in this study.
Overall, this study reports the real AC usage intensity, AC usage behavior and patterns at a household level according to long-time monitoring, which provides guidance for building cooling regulations and energy-saving potentials in residential buildings in the HSCW zone [66]. Moreover, the innovation of this study is providing a method of establishing occupants’ AC usage models and combining this with simulation software, contributing to provide reference for improving the accuracy of building energy consumption simulation. More realistic behavior modules, such as ventilation and occupancy patterns are expected to be added to the simulation software in future work. In addition, custom control algorithms were applied to modify EnergyPlus input files. The interoperability of simulation tools could be further enhanced in future, making the integration of occupant behavior models and simulation tools faster and easier, to improve the simulation performance of occupant behavior [67].

5. Conclusions

Based on a long-term monitoring in the typical residence in the HSCW zone of China, this study developed two stochastic AC usage models using the Monte Carlo method. The models were embedded in building simulations and the prediction performance for AC energy consumption were compared. The main conclusions are as follows:
(1)
The exponential fitting model of AC operating duration and the logistic regression model of the AC opening rate under different indoor and outdoor temperatures were established. Three AC usage modes were developed through cluster analysis;
(2)
The Monte Carlo random sampling method was employed in generating AC usage plan and integrated into the EnergyPlus tool in simulation, better predicting the randomness of occupants’ AC usage pattern;
(3)
The AC energy consumption based on the fixed AC usage settings from ASHRAE and Chinese standards were about 6.35 times and 2.87 times higher than the measured values, while the values based on statistic behavior model and stochastic cluster model were 1.20 times and 1.83 times of the monitored values, indicating a better performance to reflect the occupants’ AC usage patterns in residential buildings.
This study verified the effects of stochastic AC usage models on AC energy consumption simulation. The method of building occupants’ AC usage models and integrating them into EnergyPlus is referable for developing random behavior models and applying the more accurate schedules in building simulations, which contributes to building energy simulations and energy efficiency managements.

Author Contributions

Methodology, J.A., C.D. and B.L.; Software, J.A.; Formal analysis, J.A., C.D. and M.J.; Resources, B.L. and Z.C.; Data curation, Z.C.; Writing—original draft, J.A. and M.J.; Writing—review & editing, C.D. and B.L.; Visualization, M.J.; Supervision, C.D. and B.L.; Project administration, C.D.; Funding acquisition, C.D. All authors have read and agreed to the published version of the manuscript.

Funding

The research was financially supported by the National Key R&D program of China (grant no. 2022YFC3801504), and the Fundamental Research Funds for the Central Universities of China (grant no: 2024CDJXY021).

Data Availability Statement

Data are contained within the article.

Conflicts of Interest

The authors declare no conflict of interest.

Nomenclature

Mathematical Notations
TTemperature, °C
RHRelative humidity, %
α, β1, β2Regression coefficients
PProbability
XHourly AC energy consumption per day
XnorNormalized AC usage intensity
Xmax, XminMaximum and minimum hourly AC energy consumption values during one day
CvRMSERoot mean square error change coefficient, %
NMBEStandard root mean square error, %
MiMeasured data
SiPredicted data
NNumber of data
R2Coefficient of determination
Greek letters
μMean AC setpoint (°C)
σData standard deviation (°C)
Abbreviation
ACAir conditioning
HSCWHot summer and cold winter zone
HVACHeating, ventilation, and air conditioning
PTHPPackaged terminal heat pump
ROCReceiver operating characteristic
DBIDavies–Bouldin index
ASHRAEAmerican Society of Heating, Refrigerating, and Air Conditioning Engineers
AUCArea under curve, %

References

  1. Nejat, P.; Jomehzadeh, F.; Taheri, M.M.; Gohari, M.; Majid, M.Z.A. A global review of energy consumption, CO2 emissions and policy in the residential sector (with an overview of the top ten CO2 emitting countries). Renew. Sustain. Energy Rev. 2015, 43, 843–862. [Google Scholar] [CrossRef]
  2. China Building Energy Conservation Association. China building energy consumption research report. Architecture 2019, 2, 26–31. [Google Scholar]
  3. Li, X.; Yao, R. A machine-learning-based approach to predict residential annual space heating and cooling loads considering occupant behaviour. Energy 2020, 212, 118676. [Google Scholar] [CrossRef]
  4. Day, J.K.; McIlvennie, C.; Brackley, C.; Tarantini, M.; Piselli, C.; Hahn, J.; O’Brien, W.; Rajus, V.S.; De Simone, M.; Kjærgaard, M.B.; et al. A review of select human-building interfaces and their relationship to human behavior, energy use and occupant comfort. Build. Environ. 2020, 178, 106920. [Google Scholar] [CrossRef]
  5. Hu, S.; Yan, D.; Guo, S.; Cui, Y.; Dong, B. A survey on energy consumption and energy usage behavior of households and residential building in urban China. Energy Build. 2017, 148, 366–378. [Google Scholar] [CrossRef]
  6. Du, J.; Pan, W.; Yu, C. In-situ monitoring of occupant behavior in residential buildings—A timely review. Energy Build. 2020, 212, 109811. [Google Scholar] [CrossRef]
  7. González-Torres, M.; Pérez-Lombard, L.; Coronel, J.F.; Maestre, I.R.; Yan, D. A review on buildings energy information: Trends, end-uses, fuels and drivers. Energy Rep. 2022, 8, 626–637. [Google Scholar] [CrossRef]
  8. Wei, Y.; Zhang, X.; Shi, Y.; Xia, L.; Pan, S.; Wu, J.; Han, M.; Zhao, X. A review of data-driven approaches for prediction and classification of building energy consumption. Renew. Sustain. Energy Rev. 2018, 82, 1027–1047. [Google Scholar] [CrossRef]
  9. Ahmed, O.; Sezer, N.; Ouf, M.; Wang, L.L.; Hassan, I.G. State-of-the-art review of occupant behavior modeling and implementation in building performance simulation. Renew. Sustain. Energy Rev. 2023, 185, 113558. [Google Scholar] [CrossRef]
  10. Yan, D.; Hong, T.; Dong, B.; Mahdavi, A.; D’Oca, S.; Gaetani, I.; Feng, X. IEA EBC Annex 66: Definition and simulation of occupant behavior in buildings. Energy Build. 2017, 156, 258–270. [Google Scholar] [CrossRef]
  11. Ding, Y.; Han, S.; Tian, Z.; Yao, J.; Chen, W.; Zhang, Q. Review on occupancy detection and prediction in building simulation. In Building Simulation; Springer: Berlin/Heidelberg, Germany, 2022; pp. 1–24. [Google Scholar]
  12. Zou, P.X.; Xu, X.; Sanjayan, J.; Wang, J. Review of 10 years research on building energy performance gap: Life-cycle and stakeholder perspectives. Energy Build. 2018, 178, 165–181. [Google Scholar] [CrossRef]
  13. Yu, C.; Du, J.; Pan, W. Improving accuracy in building energy simulation via evaluating occupant behaviors: A case study in Hong Kong. Energy Build. 2019, 202, 109373. [Google Scholar] [CrossRef]
  14. Dadi, M.; Jani, D.D. TRNSYS simulation of an evacuated tube solar collector and parabolic trough solar collector for hot climate of Ahmedabad. In Proceedings of the 3rd International Conference on “Advances in Power Generation from Renewable Energy Sources” 2019, Banswara, India, 11–12 February 2019. [Google Scholar] [CrossRef]
  15. Zhong, Y.; Knefaty, A.D.; Chen, G.; Yao, J.; Zheng, R. Forecast of air-conditioning duration in office buildings in summer using machine learning and Bayesian theories. J. Build. Eng. 2022, 61, 105218. [Google Scholar] [CrossRef]
  16. Cuerda, E.; Guerra-Santin, O.; Sendra, J.J.; Neila González, F.J. Comparing the impact of presence patterns on energy demand in residential buildings using measured data and simulation models. In Building Simulation; Springer: Berlin/Heidelberg, Germany, 2019; pp. 985–998. [Google Scholar]
  17. Yun, G.Y.; Steemers, K. Behavioural, physical and socio-economic factors in household cooling energy consumption. Appl. Energy 2011, 88, 2191–2200. [Google Scholar] [CrossRef]
  18. Widén, J.; Wäckelgård, E. A high-resolution stochastic model of domestic activity patterns and electricity demand. Appl. Energy 2010, 87, 1880–1892. [Google Scholar] [CrossRef]
  19. Jia, X.; Pan, Y.; Zhu, M.; Zhu, H.; Li, Z.; Zhang, J.; Zhou, X.; Pan, S.; Wang, C.; Yan, D.; et al. Occupant behavior modules development for coupled simulation in DeST 3.0. Energy Build. 2023, 297, 113437. [Google Scholar] [CrossRef]
  20. Wu, Y.; Zhou, X.; Qian, M.; Jin, Y.; Sun, H.; Yan, D. Novel approach to typical air-conditioning behavior pattern extraction based on large-scale VRF system online monitoring data. J. Build. Eng. 2023, 69, 106243. [Google Scholar] [CrossRef]
  21. Zhang, Y.; Bai, X.; Mills, F.P.; Pezzey, J.C. Rethinking the role of occupant behavior in building energy performance: A review. Energy Build. 2018, 172, 279–294. [Google Scholar] [CrossRef]
  22. Yan, L.; Li, J.; Liu, M.; Hu, M.; Xu, Z.; Xue, K. Heating behavior using household air-conditioners during the COVID-19 lockdown in Wuhan: An exploratory and comparative study. Build. Environ. 2021, 195, 107731. [Google Scholar] [CrossRef]
  23. Ren, X.; Yan, D.; Wang, C. Air-conditioning usage conditional probability model for residential buildings. Build. Environ. 2014, 81, 172–182. [Google Scholar] [CrossRef]
  24. Yao, J. Modelling and simulating occupant behaviour on air conditioning in residential buildings. Energy Build. 2018, 175, 1–10. [Google Scholar] [CrossRef]
  25. Liu, H.; Sun, H.; Mo, H.; Liu, J. Analysis and modeling of air conditioner usage behavior in residential buildings using monitoring data during hot and humid season. Energy Build. 2021, 250, 111297. [Google Scholar] [CrossRef]
  26. Zaki, S.A.; Hagishima, A.; Fukami, R.; Fadhilah, N. Development of a model for generating air-conditioner operation schedules in Malaysia. Build. Environ. 2017, 122, 354–362. [Google Scholar] [CrossRef]
  27. Uddin, M.N.; Wei, H.-H.; Chi, H.L.; Ni, M. Influence of occupant behavior for building energy conservation: A systematic review study of diverse modeling and simulation approach. Buildings 2021, 11, 41. [Google Scholar] [CrossRef]
  28. Balvedi, B.F.; Ghisi, E.; Lamberts, R. A review of occupant behaviour in residential buildings. Energy Build. 2018, 174, 495–505. [Google Scholar] [CrossRef]
  29. McLoughlin, F.; Duffy, A.; Conlon, M. A clustering approach to domestic electricity load profile characterisation using smart metering data. Appl. Energy 2015, 141, 190–199. [Google Scholar] [CrossRef]
  30. Pan, S.; Wang, X.; Wei, Y.; Zhang, X.; Gal, C.; Ren, G.; Yan, D.; Shi, Y.; Wu, J.; Xia, L.; et al. Cluster analysis for occupant-behavior based electricity load patterns in buildings: A case study in Shanghai residences. In Building Simulation; Springer: Berlin/Heidelberg, Germany, 2017; pp. 889–898. [Google Scholar]
  31. Xia, D.; Lou, S.; Huang, Y.; Zhao, Y.; Li, D.H.; Zhou, X. A study on occupant behaviour related to air-conditioning usage in residential buildings. Energy Build. 2019, 203, 109446. [Google Scholar] [CrossRef]
  32. An, J.; Yan, D.; Hong, T. Clustering and statistical analyses of air-conditioning intensity and use patterns in residential buildings. Energy Build. 2018, 174, 214–227. [Google Scholar] [CrossRef]
  33. Chen, X.; Li, Z.; Dai, L.; Zeng, W.; Liu, M. Occupant Heating Patterns of Low-Temperature Air-to-Air Heat Pumps in Rural Areas during Different Heating Periods. Buildings 2023, 13, 679. [Google Scholar] [CrossRef]
  34. Zhang, Y.; Zhang, B.; Hou, J. Simulation Study on Student Residential Energy Use Behaviors: A Case Study of University Dormitories in Sichuan, China. Buildings 2024, 14, 1484. [Google Scholar] [CrossRef]
  35. Yan, L.; Liu, M. Predicting household air conditioners’ on/off state considering occupants’ preference diversity: A study in Chongqing, China. Energy Build. 2021, 253, 111516. [Google Scholar] [CrossRef]
  36. Hong, T.; Yan, D.; D’Oca, S.; Chen, C.-F. Ten questions concerning occupant behavior in buildings: The big picture. Build. Environ. 2017, 114, 518–530. [Google Scholar] [CrossRef]
  37. Jia, M.; Srinivasan, R.; Ries, R.J.; Bharathy, G.; Weyer, N. Investigating the impact of actual and modeled occupant behavior information input to building performance simulation. Buildings 2021, 11, 32. [Google Scholar] [CrossRef]
  38. Chen, S.; Zhang, G.; Xia, X.; Chen, Y.; Setunge, S.; Shi, L. The impacts of occupant behavior on building energy consumption: A review. Sustain. Energy Technol. Assess. 2021, 45, 101212. [Google Scholar] [CrossRef]
  39. Du, C.; Li, B.; Yu, W.; Liu, H.; Yao, R. Energy flexibility for heating and cooling based on seasonal occupant thermal adaptation in mixed-mode residential buildings. Energy 2019, 189, 116339. [Google Scholar] [CrossRef]
  40. Duan, J.; Li, N.; Peng, J.; Liu, Q.; Peng, T.; Wang, S. Clustering and prediction of space cooling and heating energy consumption in high-rise residential buildings with the influence of occupant behaviour: Evidence from a survey in Changsha, China. J. Build. Eng. 2023, 76, 107418. [Google Scholar] [CrossRef]
  41. Xie, J.; Pan, Y.; Jia, W.; Xu, L.; Huang, Z. Energy-consumption simulation of a distributed air-conditioning system integrated with occupant behavior. Appl. Energy 2019, 256, 113914. [Google Scholar] [CrossRef]
  42. Duan, J.; Li, N.; Peng, J.; Wang, C.; Liu, Q.; Zhou, X. Study on occupant behaviour using air conditioning of high-rise residential buildings in hot summer and cold winter zone in China. Energy Build. 2022, 276, 112498. [Google Scholar] [CrossRef]
  43. Available online: https://rp5.ru/ (accessed on 4 June 2024).
  44. MOHURD. General Code for Energy Efficiency and Renewable Energy Application in Buildings; China Architecture and Building Press: Beijing, China, 2021. [Google Scholar]
  45. ASHRAE. ASHRAE 90.1-2019 Prototype Building Models High-Rise Apartment. Available online: https://www.energycodes.gov/prototype-building-models (accessed on 15 March 2024).
  46. Xu, X.; Yu, H.; Sun, Q.; Tam, V.W. A critical review of occupant energy consumption behavior in buildings: How we got here, where we are, and where we are headed. Renew. Sustain. Energy Rev. 2023, 182, 113396. [Google Scholar] [CrossRef]
  47. Liu, H.; Wu, Y.; Li, B.; Cheng, Y.; Yao, R. Seasonal variation of thermal sensations in residential buildings in the Hot Summer and Cold Winter zone of China. Energy Build. 2017, 140, 9–18. [Google Scholar] [CrossRef]
  48. Hu, M.; Xiao, F. Quantifying uncertainty in the aggregate energy flexibility of high-rise residential building clusters considering stochastic occupancy and occupant behavior. Energy 2020, 194, 116838. [Google Scholar] [CrossRef]
  49. Li, K.; Zhang, J.; Chen, X.; Xue, W. Building’s hourly electrical load prediction based on data clustering and ensemble learning strategy. Energy Build. 2022, 261, 111943. [Google Scholar] [CrossRef]
  50. Cui, Y.; Zhu, Z.; Zhao, X.; Li, Z. Energy Schedule Setting Based on Clustering Algorithm and Pattern Recognition for Non-Residential Buildings Electricity Energy Consumption. Sustainability 2023, 15, 8750. [Google Scholar] [CrossRef]
  51. Žalik, K.R.; Žalik, B. Validity index for clusters of different sizes and densities. Pattern Recognit. Lett. 2011, 32, 221–234. [Google Scholar] [CrossRef]
  52. Yaoqing, L. Practical Heating and Air Conditioning Design Manual; China Building Industry Press: Beijing, China, 2008. [Google Scholar]
  53. JGJ 134-2010; MOHURD. Design Standard for Energy Efficiency of Residential Buildings in Hot Summer and Cold Winter Zone. China Architecture and Building Press: Beijing, China, 2010.
  54. Alghoul, S.K. A comparative study of energy consumption for residential hvac systems using EnergyPlus. Am. J. Mech. Ind. Eng. 2017, 2, 98–103. [Google Scholar] [CrossRef]
  55. Li, W.; Jing, M.; Li, R.; Gao, J.; Zhu, J.; Li, R. Study of the optimal placement of phase change materials in existing buildings for cooling load reduction-Take the Central Plain of China as an example. Renew. Energy 2023, 209, 71–84. [Google Scholar] [CrossRef]
  56. Royapoor, M.; Roskilly, T. Building model calibration using energy and environmental data. Energy Build. 2015, 94, 109–120. [Google Scholar] [CrossRef]
  57. ASHRAE. Measurement of energy, demand, and water savings. In ASHRAE Guideline; ASHRAE: Corners, GA, USA, 2014; Volume 4, pp. 1–150. [Google Scholar]
  58. Glazer, J. Using python and Eppy for a large national simulation study. In Proceedings of the ASHRAE & IBPSA-USA SimBuild Conference 2016, Salt Lake City, UT, USA, 8–12 August 2016; pp. 230–237. [Google Scholar]
  59. Jian, Y.; Liu, J.; Pei, Z.; Chen, J. Occupants’ tolerance of thermal discomfort before turning on air conditioning in summer and the effects of age and gender. J. Build. Eng. 2022, 50, 104099. [Google Scholar] [CrossRef]
  60. Lyu, J.; Li, J.; Zhao, Z.; Miao, X.; Du, H.; Lai, D.; Yang, Y.; Lian, Z. How do people set air conditioning temperature setpoint in urban domestic–Behavior model in Chinese three climate zones based on historical usage data. Energy Build. 2023, 284, 112856. [Google Scholar] [CrossRef]
  61. Deng, J.; Yao, R.; Yu, W.; Zhang, Q.; Li, B. Effectiveness of the thermal mass of external walls on residential buildings for part-time part-space heating and cooling using the state-space method. Energy Build. 2019, 190, 155–171. [Google Scholar] [CrossRef]
  62. Ouyang, J.; Ge, J.; Hokao, K. Economic analysis of energy-saving renovation measures for urban existing residential buildings in China based on thermal simulation and site investigation. Energy Policy 2009, 37, 140–149. [Google Scholar] [CrossRef]
  63. Dong, B.; Liu, Y.; Mu, W.; Jiang, Z.; Pandey, P.; Hong, T.; Olesen, B.; Lawrence, T.; O’Neil, Z.; Andrews, C. A global building occupant behavior database. Sci. Data 2022, 9, 369. [Google Scholar] [CrossRef] [PubMed]
  64. Hong, T.; Taylor-Lange, S.C.; D’Oca, S.; Yan, D.; Corgnati, S.P. Advances in research and applications of energy-related occupant behavior in buildings. Energy Build. 2016, 116, 694–702. [Google Scholar] [CrossRef]
  65. Belazi, W.; Ouldboukhitine, S.-E.; Chateauneuf, A.; Bouchair, A. Uncertainty analysis of occupant behavior and building envelope materials in office building performance simulation. J. Build. Eng. 2018, 19, 434–448. [Google Scholar] [CrossRef]
  66. Hu, S.; Yan, D.; Qian, M. Using bottom-up model to analyze cooling energy consumption in China’s urban residential building. Energy Build. 2019, 202, 109352. [Google Scholar] [CrossRef]
  67. Hong, T.; Chen, Y.; Belafi, Z.; D’Oca, S. Occupant behavior models: A critical review of implementation and representation approaches in building performance simulation programs. In Building Simulation; Springer: Berlin/Heidelberg, Germany; pp. 1–14.
Figure 1. Technical route of the study.
Buildings 14 02026 g001
Figure 2. Flowchart of establishing and integrating statistical behavior model into building simulation.
Buildings 14 02026 g002
Figure 3. Flowchart of identifying typical AC usage patterns and generating AC operation schedules.
Buildings 14 02026 g003
Figure 4. Building plan (unit: mm) (a), building physical model (b).
Buildings 14 02026 g004
Figure 5. Outdoor dry bulb temperatures distribution during the cooling season of 2019.
Buildings 14 02026 g005
Figure 6. Probability of AC on with mean outdoor temperatures during the cooling season.
Buildings 14 02026 g006
Figure 7. Histogram of AC setpoint distribution and the normal fitting curve.
Buildings 14 02026 g007
Figure 8. AC operation duration in the cooling season.
Buildings 14 02026 g008
Figure 9. Probability of AC turn-on under different temperature and humidity conditions.
Buildings 14 02026 g009
Figure 10. Cluster number selection of AC usage data in cooling season (a), typical AC usage patterns in cooling season (b).
Buildings 14 02026 g010
Figure 11. AC usage schedules by model generation. (a) Typical daily AC operation modes; (b) AC operating schedules in two bedrooms during cooling season.
Buildings 14 02026 g011
Figure 12. Calibration of the parameters of the envelope structure using indoor temperature during the transition season (a) in the main bedroom, (b) in the secondary bedroom.
Buildings 14 02026 g012
Figure 13. Measured and simulated daily AC energy consumption calibration results for the physical model.
Buildings 14 02026 g013
Figure 14. Comparison of energy consumption between random models and deterministic standard settings during cooling season, (a) distribution of daily AC energy consumption, (b) distribution of monthly AC energy consumption.
Buildings 14 02026 g014
Figure 15. Comparison of the AC usage behavior of two stochastic model simulation outputs and field measurement, (a) AC setpoint distribution, (b) the cumulative probability of turning on the air conditioner at different outdoor average temperatures.
Buildings 14 02026 g015
Figure 16. Comparison of the distribution of daily AC energy consumption.
Buildings 14 02026 g016
Figure 17. (a) Relationship between mean outdoor temperature and AC set point, (b) relationship between mean outdoor temperature and duration of each operation.
Buildings 14 02026 g017
Table 1. Basic information for the measuring instruments.
InstrumentTemperature and Humidity RecorderPower Recorder
ModelWSDCGQ01LMKTBL11LM
Working range−20~+60 °C, 0~100%RH−10~+40 °C, 0~95%RH
Accuracy±0.3 °C, ±3% RH±0.01 W
Test interval1 min1 min
Table 2. AC operation settings.
CategoryOperation ModeBedroom AC Usage SettingReference
SetpointSchedule
Residential building bedroomPart-time mode26 °C21:00–07:00[44]
High-rise apartmentFull-time mode24.4 °C00:00–24:00[45]
Table 3. Basic information for the boundary conditions.
Boundary ConditionsHeat Transfer Coefficient of Exterior Envelope (W/m2·K)Infiltration Rate
(h−1)
WallRoofFloorWindow
Variables 0.170.190.192.751
Table 4. Occupancy schedules and internal gains.
RoomLighting GainOccupancy GainEquipment Gain
(W/m2)Schedule(m2/person)Schedule(W/m2)Schedule
Bedroom506:00–07:00 and 21:00–22:002521:00–08:003.807:00–08:00 and 21:00–22:00
Living room506:00–07:00 and 19:00–21:002507:00–21:003.807:00–21:00
Disclaimer/Publisher’s Note: The statements, opinions and data contained in all publications are solely those of the individual author(s) and contributor(s) and not of MDPI and/or the editor(s). MDPI and/or the editor(s) disclaim responsibility for any injury to people or property resulting from any ideas, methods, instructions or products referred to in the content.

