Article

Prestress Force and General Excitation Identification for Plate-like Concrete Bridges

1
School of Transportation and Civil Engineering, Nantong University, Nantong 226019, China
2
MOE Key Lab of Disaster Forecast and Control in Engineering, Jinan University, Guangzhou 510632, China
3
Nantong Municipal Facilities Management Department, Nantong 226006, China
*
Author to whom correspondence should be addressed.
Buildings 2024, 14(7), 2032; https://doi.org/10.3390/buildings14072032
Submission received: 5 February 2024 / Revised: 19 June 2024 / Accepted: 1 July 2024 / Published: 3 July 2024

Abstract

:
Prestress force dominates the carrying capacity of concrete girders, and is vital for bridge health monitoring. Many vibrational-based methods have been proposed to determine prestress using bridge responses induced by known excitations, which means that they can barely use the normal traffic of in-service bridges as excitation to achieve long-term monitoring. Moreover, most studies are based on beam theory, which may not be precise for plate-like bridges. Hence, this paper establishes a motion equation for a prestressed slab via Kirchhoff’s plate theory and proposes a two-step procedure to assess the prestress and general excitation simultaneously through only bridge responses. The excitation is determined in the first step via the Load Shape function method and used as input for the prestress identification via state-space formulation in the second step. A numerical study on a prestressed plate subjected to a moving load is conducted. Considering different levels of measurement noise and load speed, the proposed method can determine the prestress and moving load with 7.33% and 10.18% error, respectively. A laboratory test on a prestressed box girder subjected to a fixed cyclic load is performed, the prestress and cyclic load are both determined to have good stability, and the errors are under 11.32%.

1. Introduction

Afflicted with corroding prestressed tendons and triggered by a strong storm, the Morandi Bridge collapsed and killed 43 people in 2018, in what Italy’s prime minister described as a “national tragedy”. It has been proved that prestressed concrete bridges (PCBs) lose prestress force (PF) due to the influence of loads, fatigue, corrosion, aging and other adverse factors [1], resulting in the attenuation of the carrying capacity, and thus increasing the risk of collapse under strong loads. Therefore, the accurate assessment of PF becomes vital in the maintenance of PCBs.
Practically, direct measurements are the techniques most widely used to detect residual PF [2]; these include the use of embedded sensors or “intelligent steel” in the structure [3], destructive or semi-destructive tests [4], and the acoustic projectile method or electromagnetic method [5]. Direct measurement has the advantages of convenient implementation and high universality, but it is also associated with disadvantages such as structural damage and empty periods of detection.
With the concept of “intelligent bridge” [6] gaining popularity, Structural Health Monitoring (SHM) systems have been widely used in bridges [3] and provide the continuous monitoring of bridges’ dynamic behavior. Hence, prestress force identification (PFI) via vibrational-based methods, which have a high degree of integration with the existing SHM system, becomes beneficial.
Among the vibrational-based methods, modal characteristics [7,8] have been widely studied for PFI. According to the traditional theory, if the prestress is taken as the axial pressure, the “compression softening” effect caused by it will reduce the structural stiffness, so as to reduce the natural vibration frequency of the structure [9,10]. Kim et al. [11] identified the axial pressure loss of simply supported beams by using frequency changes, which verified the feasibility of this idea. However, scholars have found that if PF is simulated as the force inside the beam, the flexural stiffness of the tendon is negligible compared with that of the concrete, so it has no influence on the frequency [12]. Furthermore, a large number of experimental results have shown that the frequency of the beam will increase with a rise in the prestress [13]. A reasonable explanation for this is that the increase in prestress will close the micro cracks at the interface between the concrete aggregate and mortar, thus increasing the strength of the beam and increasing the natural frequency of the beam [14]. This also agrees with study [15], which found that the variation in frequency is only 0.8% despite the increment in PF being 17.7% and stated that the increment in frequency is mainly caused by the enhancement of the concrete’s elastic modulus. Similarly, the increase in concrete stiffness based on the tendon eccentricity or curvature would also lead to an increase in frequency [16]. The authors believe that the frequency of a prestressed girder is influenced by the bidirectional effects of both “compression softening” and “concrete stiffness enhancement”. When the concrete stress brought by PF reaches a high level that causes the closure of micro cracks, the frequency starts to increase. Otherwise, the frequency is dominated by the compression softening effect and is shown to decrease. This explains why a prestressed beam’s frequency usually grows as the PF increases [17], while a T girder or box girder with a higher volume of concrete presents a frequency drop when PF is applied [8,18]. This phenomenon leads to a variety of different studies, and means that frequency is not a suitable indicator for PFI.
On the other hand, methods using dynamic response change as the basic feature for PFI have been proposed and achieved significant results. Law and Lu [19,20] stated that it is feasible to measure PF through strain or displacement excited by an impulse force and proposed a model-updating method to assess the PF. Xu and Sun [21] considered the effect of eccentricity and proposed a velocity–response–sensitivity-based method, but large errors were found in the results. Wang et al. [22] determined the PF using the deflection influence line of a bridge. Zhong and Yang [23] used the vehicle-induced response to estimate the PF loss with the consideration of road roughness. Cruz et al. [24] used generic finite elements to model the forced response of a prestressed beam and used parameter updating to evaluate the PF and achieved good accuracy. All the cited works show that PFI using bridge responses is more promising than the use of modal parameters.
However, most of these methods are based on the theory of the Euler–Bernoulli beam or Timoshenko beam, which can lead to large error in the application of a box girder. Studies [25,26] have stated that the vibration behavior of box girders is greatly influenced by torsional wrapping effects, which are more similar to plates. Moreover, the methods all require a known exciting force for the identification, which means that they cannot use normal traffic on a bridge as excitation, and hence cannot perform continuous monitoring.
These two disadvantages motivate this paper. It innovatively improves a simultaneous identification method to assess PF and excitation in a plate-like bridge through dynamic responses. The motion equation of a prestressed slab based on Kirchhoff’s plate theory is established to simulate a box girder with higher accuracy, a two-step procedure is proposed to determine the excitation and PF using the Duhamel integral and state-space formulation, respectively, and the load shape function (LSF) is introduced to improve the stability and efficiency. Numerical and experimental studies are carried out to validate the proposed method on the plate and box girder, and exhibit its robustness to measurement noise and load variation.
The proposed method can simultaneously monitor the internal and external factors that affect bridge health, significantly improving the value of SHM data and lowering the cost of bridge maintenance.

2. Method

This section proposes the simultaneous identification method. Firstly, the motion equation based on Kirchhoff’s plate theory is established to analyze the relationship between bridge responses and PF and excitation. Secondly, the Duhamel integral is introduced to identify the excitation, and the load shape function (LSF) method is proposed to reduce the ill-conditioned problem. Thirdly, the motion equation with a determined excitation force is transformed into the frequency domain via the modal superposition method, and it presents the PF using state-space formulation. The total identification is concluded as a two-step procedure that is finally clarified.

2.1. Motion Equation of Plate-like Bridge

Considering a prestressed bridge span as a homogeneous plate with a PF applied in x direction, the equation of motion for the prestressed plate subjected to external force can be obtained via D’Alembert’s principle:
k b 4 u x , y , t x 4 + 2 4 u x , y , t x 2 y 2 + 4 u x , y , t y 4 p ( t ) K b 2 u x , y , t x 2 + m 2 u x , y , t t 2 + c 2 u x , y , t t 2 = f x , y , t
where k b is the bending stiffness, m is the mass, t is the time, c is the damping ratio, u x , y , t is the displacement in z direction, and f(x,y,t) is the external force in z direction. As the prestressed tendon will deform during the vibration, the prestress force is defined as a time-related function p ( t ) .
Equation (1) can be solved by modal superposition. For a simply supported bridge, u x , y , t can be defined by the mode shape function φ v , n x , y and modal amplitude u v , n t :
u x , y , t = q = 1 φ x , y u v , n ( t ) = v = 1 n = 1 s i n ( α x ) s i n ( β y ) u v , n t
where α = v π a , β = n π b , v and n are the number of modes in the x and y directions, respectively, a and b are the dimensions of the bridge.
Similarly, the external force f x , y , t is also transformed to the frequency domain via the double Fourier series, as follows:
f x , y , t = v = 1 n = 1 f v , n ( t ) sin ( α x ) sin ( β y )
Hence, the equation of motion of the prestressed bridge in the generalized modal coordinate is obtained by substituting Equations (2) and (3) into Equation (1),
m u ¨ v , n t + c u ˙ v , n t + α 2 + β 2 2 k b α 2 p ( t ) u v , n ( t ) = f v , n t
Equation (4) can be discretized to matrix form:
M U ¨ + C U ˙ + K o α 2 P U = F
where M and C are the generalized mass and damping matrixes, while K o = d i a g ( α 2 + β 2 ) k b , which is the generalized stiffness matrix of an unprestressed bridge. U ¨ , U ˙ and U are the discretized modal acceleration, velocity and displacement of the bridge respectively.   P is the dicretized prestress force matrix, F is the discretized image matrix of the external force. It is found that the equivalent modal stiffness of the prestressed bridge is reduced by the effect of compression softening.
In order to determine the prestress P, the modal responses and excitation load should all be known. The former can be calculated by the measured response and mode shape function, while the latter should be determined by the following method.

2.2. Excitation Force Identification Method

Duhamel Integral is a basic time domain method used to determine the excitations. Performing its matrix form in Equation (6), the measured response vector U x , y , t is presented by the product of external force vector F x , y , t and its impulse response matrix I .
U x , y , t = I F x , y , t
However, in practical cases, I is very sensitive to noise and the metering noise is likely to cause an ill-conditioned problem in Equation (6). In addition, the dimension of I is huge when dealing with a high sampling rate or long-term measurement, which makes it difficult to calculate. Introducing a load shape function (LSF) can significantly restrain the issues caused by the problems above. LSF is referenced from the shape function of the Finite Element Method (FEM), which was originally used to describe the displacement of a beam element. In this paper, the LSF compares the time history of the excitation force to the span of a “finite element beam”. The amplitude of the force is regarded as the displacement of the “beam”, which can be calculated via the LSF of the beam element
F x , y , t = N γ
where N is the LSF matrix (Equation (8)), and γ is the fitting coefficient vector.
N = 1 0 0 0 0 0 1 3 1 l 2 + 2 ( 1 l ) 3 1 l [ 1 1 l 2 ] ( 1 l ) 2 [ 3 2 1 l ] 1 l 2 [ 1 1 l ] 1 3 2 l 2 + 2 ( 2 l ) 3 2 l [ 1 2 l 2 ] ( 2 l ) 2 [ 3 2 2 l ] 2 l 2 [ 1 2 l ] 0 0 1 0 0 0 0 0 1 3 1 l 2 + 2 ( 1 l ) 3 1 l [ 1 1 l 2 ] ( 1 l ) 2 [ 3 2 1 l ] 1 l 2 [ 1 1 l ] 0 0 0 0 1 0
l was originally the length of the “finite element” but here denotes the time steps of each element, which could be determined by the sampling rate f s and the main frequency of the excitation force f e (Equation (9)). Also, the “time steps” l multiplied by the number of “time element” m equals the total sampling number, as shown in Equation (10), where f s and T are the sampling rate and measuring time, respectively.
l = f s / 2 f e
l × m = T f s
By substituting Equation (7) into Equation (6), the identification of external force is turned into the determination of the fitting coefficient γ by the LSF influence matrix L, which is the product of I and N. Its physical meaning is the bridge responses excited by the LSFs applied at the location of the real load.
γ = ( I N ) 1 U x , y , t = L 1 U x , y , t
Hence, the external force is able to be reconstructed by Equation (7).
Compared to the impulse matrix I, the LSF influence matrix L has good robustness to singularity as the LSF smoothens the estimated force to some degree and minimizes the influence of noise even without regularization [27]. In addition, because the number of columns in L is far less than its rows, it makes γ much smaller in dimension than F x , y , t . The calculation effort of Equation (6) is therefore remarkably reduced, as shown in Figure 1.
It should be mentioned that L is simulated via the bridge response when the LSF is applied to the real load position. Hence, the load location should be known in advance.
Herein, the excitation load is determined; it will then be regarded as an input to aid in the identification of PF.

2.3. Prestress Force Identification Method

According to Equation (5), the motion of the equation is solved in the frequency domain. The measured response U x , y , t needs to be turned into the frequency domain. By defining the number of measurements and modes as p and q, the matrix form of Equation (2) is
U x , y , t = Φ U
U x , y , t is the measured response vector with the dimension ( p × 1 ) , Φ is the mode shape matrix whose dimension is ( p × q ) , while U ’s dimension is ( q × 1 ) . Hence,
U = Φ T Φ 1 Φ T U x , y , t
Usually, Φ T Φ 1 is highly ill-conditioned. Therefore, it is recommended that Tikhonov regularization is used in the calculation:
U = Φ T Φ + Γ 1 Φ T U x , y , t
where Γ is the regularization term. Similarly, the modal velocity U ˙ and acceleration U ¨ can also be obtained by the measured responses, respectively.
Therefore, the modal amplitudes become known variables in Equation (5). Meanwhile, the determined force F x , y , t is transformed to the frequency domain via double Fourier transformation to obtain F . Equation (5) can be rewritten to the state-space formulation
A P = B
where A = α 2 U , B = M U ¨ + C U ˙ F .
Then, the prestress P can be obtained using the damped least squared method
P = A T A + λ D 1 A T B
where λ is the non-negative damping coefficent that can be obtained via the L-curve. D is the identity matrix. It should be mentioned that the generalized mass and damping matrixes should be known in advance; these can be acquired by the frequency domain decomposition of acceleration signals from the modal test.

2.4. Two-Step Identification Procedure

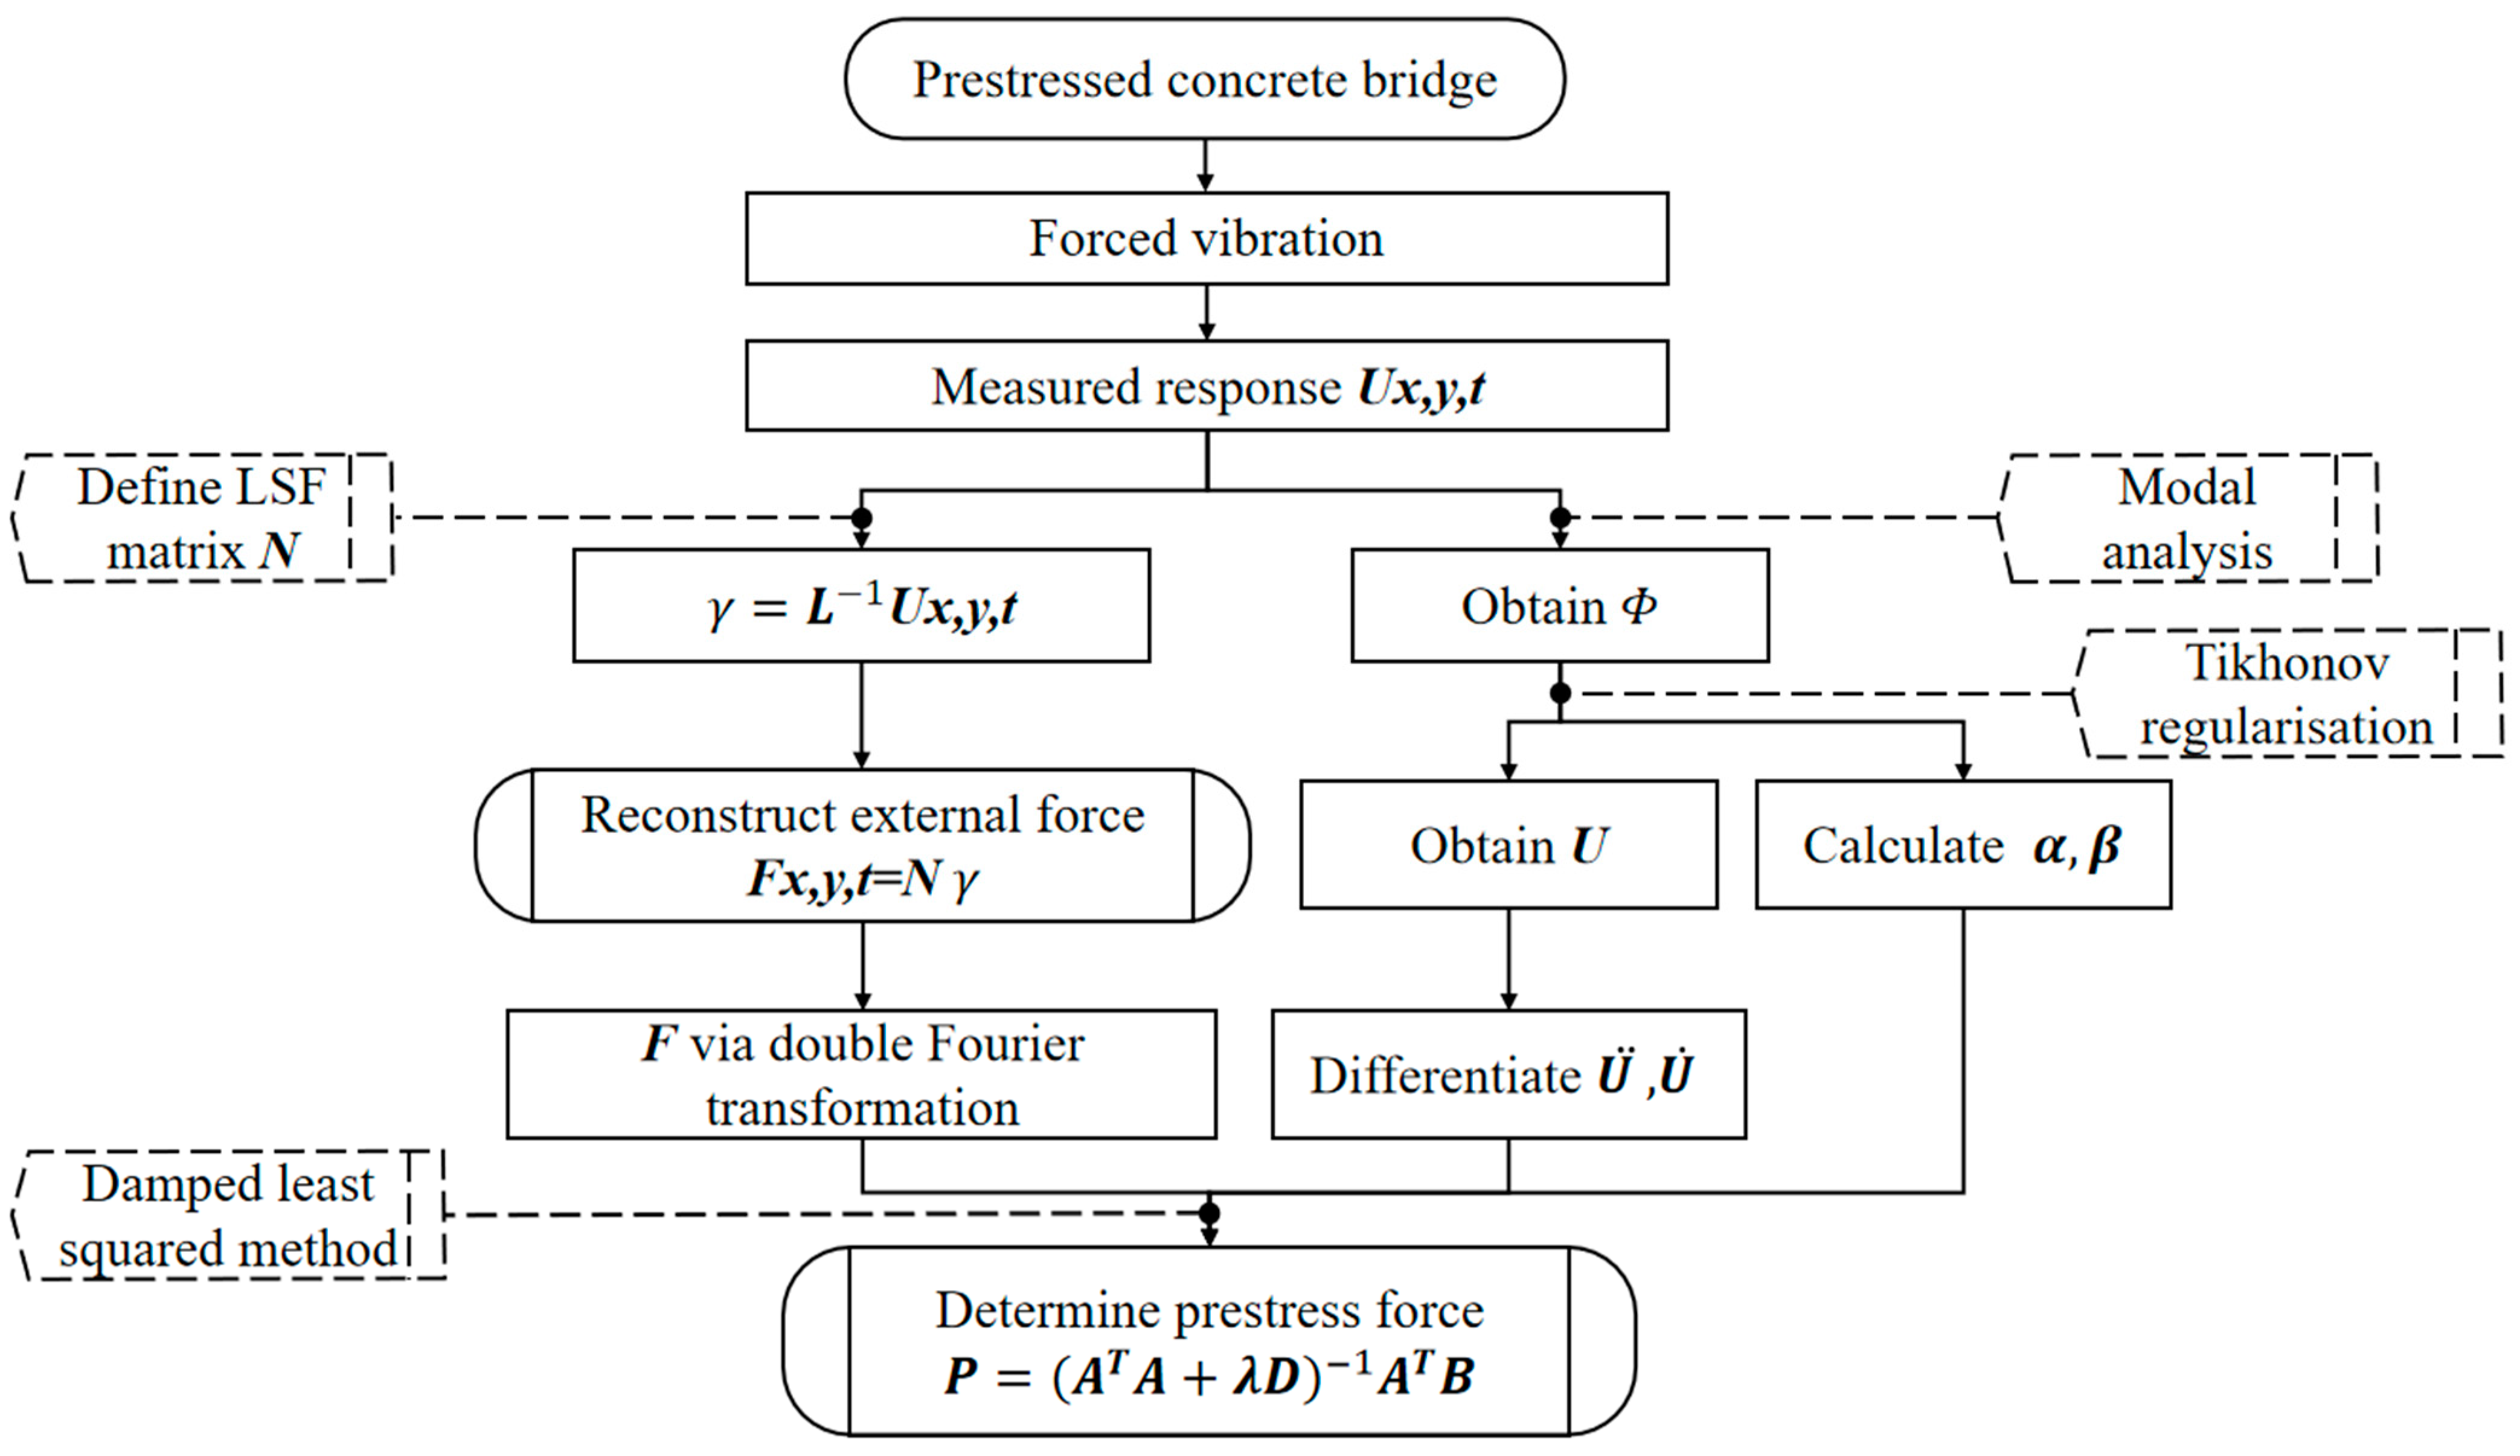
The methods proposed above can be concluded as a two-step identification procedure, as follows (Figure 2):
Step 1
  • measure the bridge response U x , y , t induced by unknown excitation,
  • define the LSF matrix N according to the frequency spectrum of U x , y , t ,
  • determine the coefficient γ via the LSF method,
  • reconstruct the moving force F x , y , t .
Step 2
  • obtain the mode shape matrix Φ by modal analysis,
  • calculate the modal responses U using the measured response and shape matrix via Tikhonov regularization,
  • transform the determined moving force F x , y , t into image matrix F via double Fourier transformation,
  • establish the state-space formulation of prestress P ,
  • identify the prestress P via the least squared method.

3. Results and Discussion

This section presents a numerical study on a prestressed plate subjected to a moving load and a laboratory study on a prestressed box girder subjected to a periodic load. The accuracy and stability of the proposed method are validated with the consideration of the PF level, excitation speed, measurement noise and sensor numbers.

3.1. Numerical Study on Prestressed Plate Subjected to a Moving Load

3.1.1. Model Design

Considering a 1/6 scaled-down model of an average bridge deck [28], a 6 m long simply supported prestressed concrete plate is established, as shown in Figure 3; its dimensions are 6   m × 3   m × 0.2   m . The concrete elastic modulus is 3.45 × 1 0 10   N / m 2 and the density is 2.4 × 1 0 3   k g / m 3 . A prestressed tendon is applied in the middle of the plate; its cross-section area is 1.39 × 1 0 4   m 2 , and the elastic modulus and density are 2.95 × 1 0 11   N / m 2   a n d   7.9 × 1 0 3   k g / m 3 , respectively. The PF is set as 200 and 400 kN. A moving force f ( t ) = 12 + 0.8 sin ( 10 π t ) + 1.6 cos ( 15 π t ) + 0.4 cos ( 3 π t + 0.2 π ) k N that simulates 1/6 of a heavy vehicle. The speeds are 4 m/s and 10 m/s. The sampling rate is 200 Hz.
The simulation is conducted under the environment of ANSYS APDL 2021 R1. The model is established with a 3D solid element. Four acceleration sensors are placed at the bottom of the plate, as shown in Figure 3, and the sampling rate is taken at 500 Hz.

3.1.2. Modal Analysis for Numerical Study

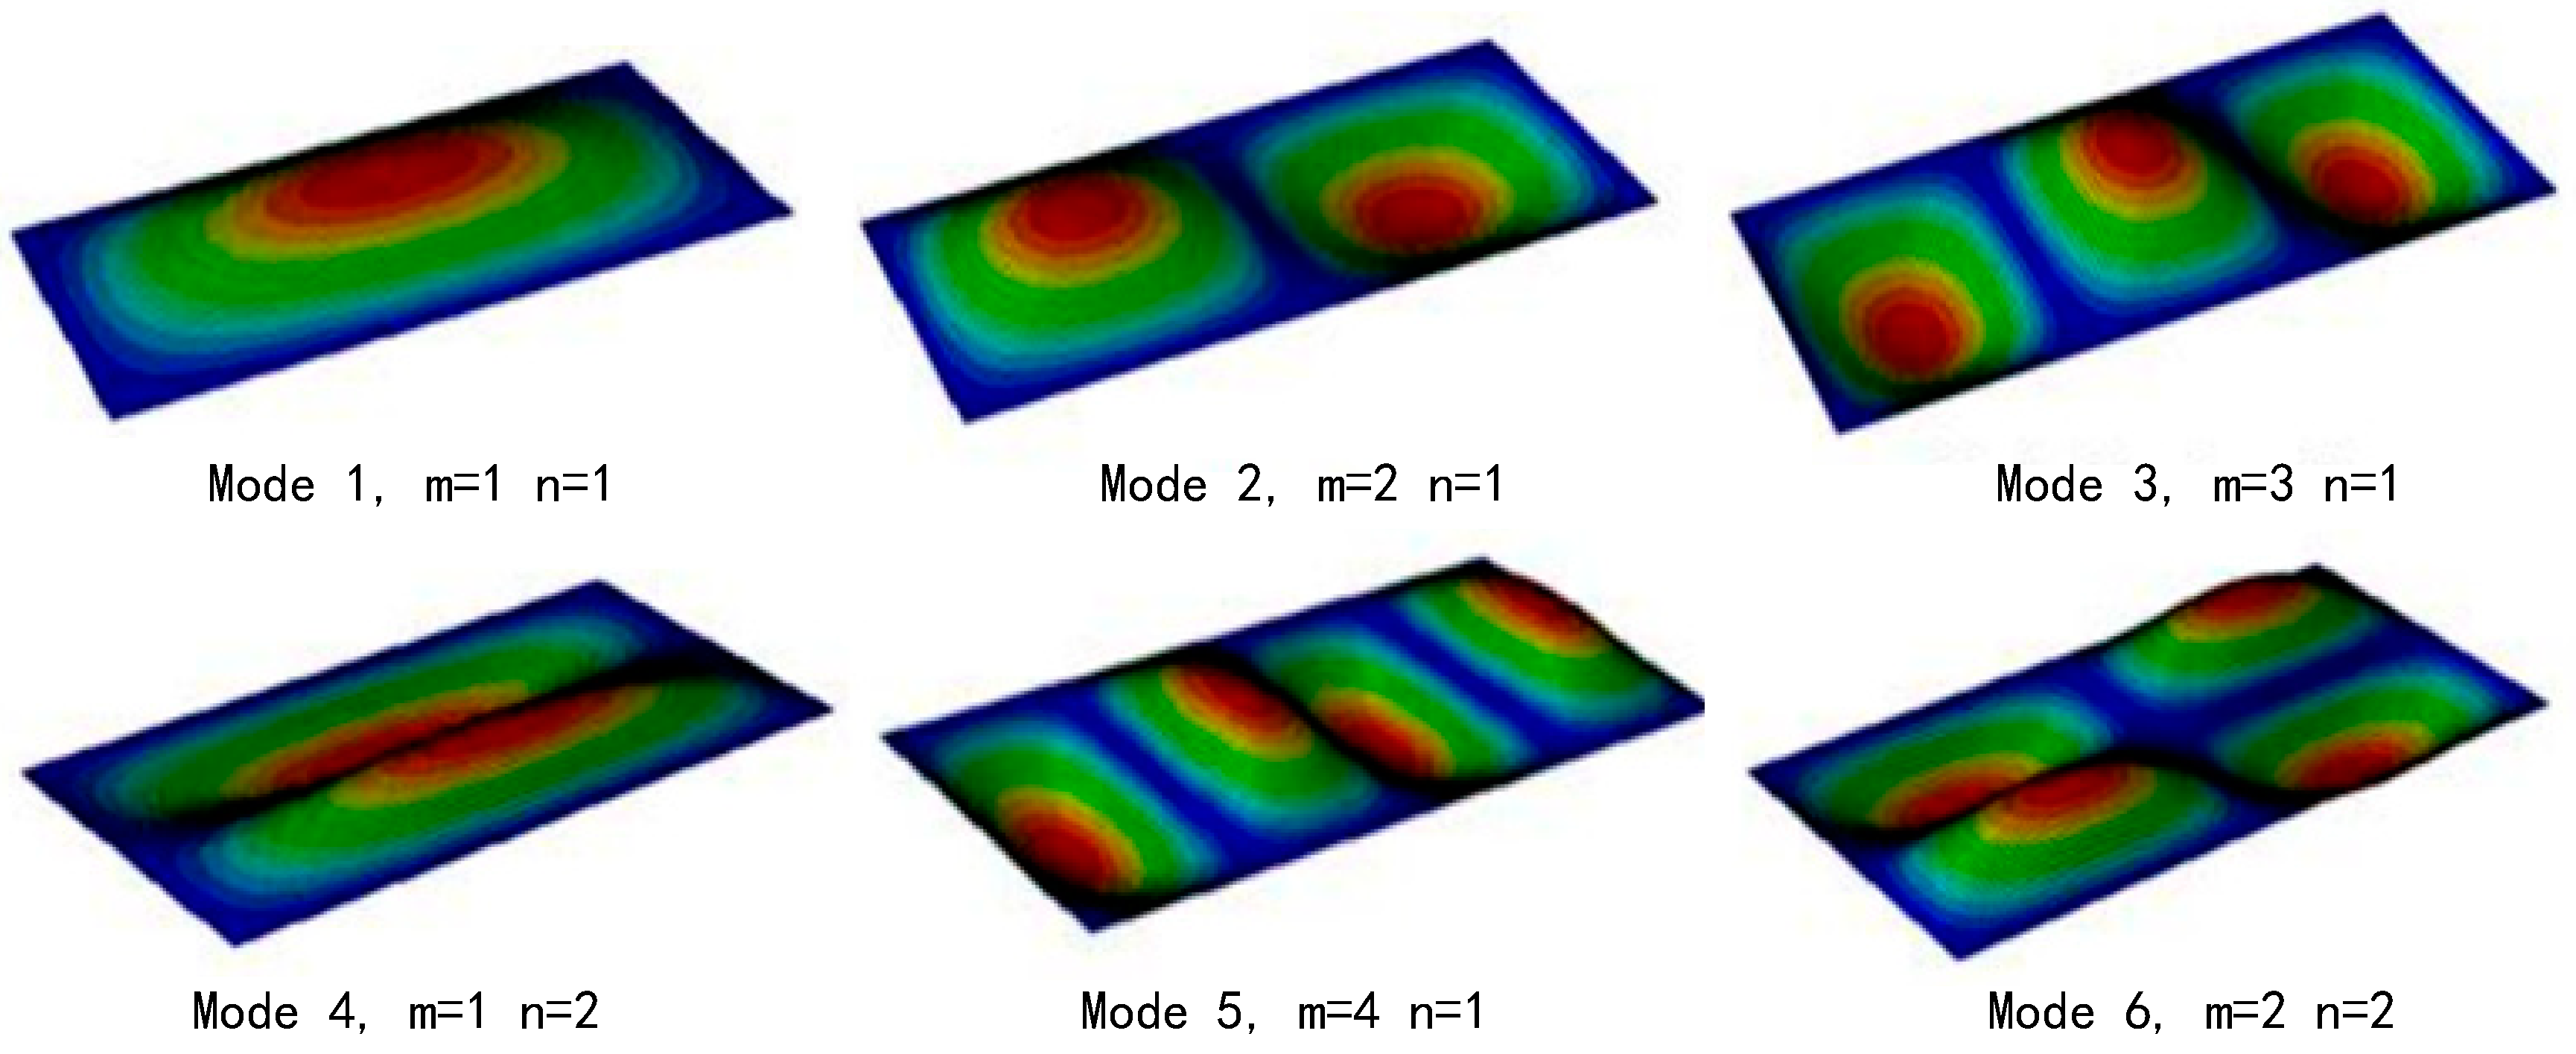
A modal analysis was carried out to evaluate the effect of prestressing on the natural frequency of vibration. The first six vibration modes and corresponding m and n values are shown in Figure 4, and the variation in modal frequencies with the PF is shown in Table 1. It is found that the frequency slightly decreases when applying the PF, while the mode shapes are almost identical.

3.1.3. Case Setting for Numerical Study

As the road surface roughness and measurement noise may affect identification [29], different levels of white noise are considered in the case study in order to account for the adverse road condition and measurement uncertainties:
Y n = Y × [ 1 + ψ N 0,1 ]
where Y n and Y are the responses with and without noise, respectively; ψ is a relative amount of noise percentage, with 10% selected in this study; and N 0,1 is a matrix containing pseudorandom values drawn from the standard normal distribution.
Considering the influence of the force speed, sensor arrangement and noise level, eight cases are established, as follows Table 2:

3.1.4. Moving Force Identification Results

The moving force is determined by the proposed LSF method. Here, case 1.1 is used to demonstrate the application of the LSF. The measuring time T is 1 s, and the main frequency of excitation can be obtained by the Fast Fourier Transform of the responses, which is under 10 Hz. According to Equations (9) and (10), the time step l and time element m are calculated as 10 and 20, respectively, which means that 10 LSFs are applied and that each function has 20 steps. Thus, the dimensions of the LSF influence matrix L are 200 × 10, while the dimensions of the impulse matrix I are 200 × 200, with the amount of inversion decreased over 400 times.
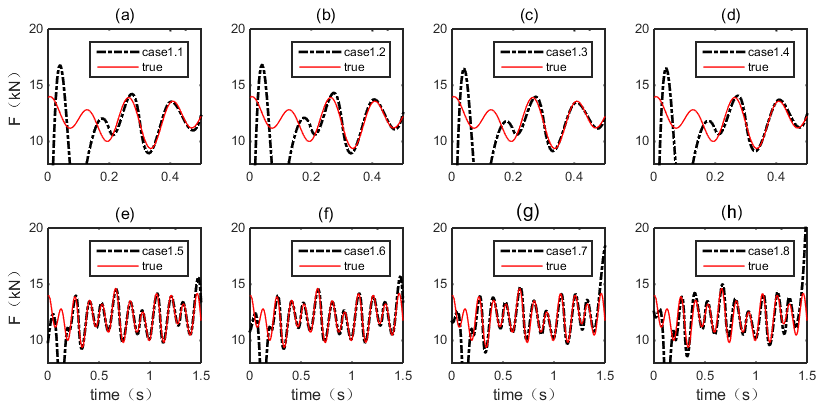
The MFI results are shown in Figure 5, and the relative percentage errors (RPEs) are listed in Table 3. Generally, the moving force in all cases is determined with good accuracy. Relatively large errors are found close to the start of the time histories, which is a typical problem caused by the instability of vibration responses when the load enters the bridge. Hence, cases 1.1~1.4 show large RPEs. But once the response is stable (after 0.2 s), the results show great agreement with the true value. In cases 1.5~1.6, the RPEs are less than 7.33%. Compared to a practical weighting system whose error is around 10%, the accuracy of the proposed method is verified.
Comparing case 1.1 and case 1.5, it is found that the PF level and vehicle speed have almost no influence on the accuracy. This is expected because the accuracy is dominated by the precision of the LSF influence matrix L, or the precision of the FE model. Both the PF and vehicle speed have no relation to it. Referring to cases 1.1 and 1.2 (cases 1.5 and 1.6), it is found that using more sensors can slightly increase the accuracy, but this is not worth the added cost. In cases 1.2~1.4 (cases 1.6~1.8), the levels of noises show almost no influence on the results and only a small deviation is observed at the crest, with the RPE increasing by around 2%. This highlights the advantage of the LSF. Because the LSF smoothens the fluctuation induced by noise in the system matrix and hence eliminates its singularity, the robustness to noise is significantly improved.

3.1.5. Prestress Force Identification Results

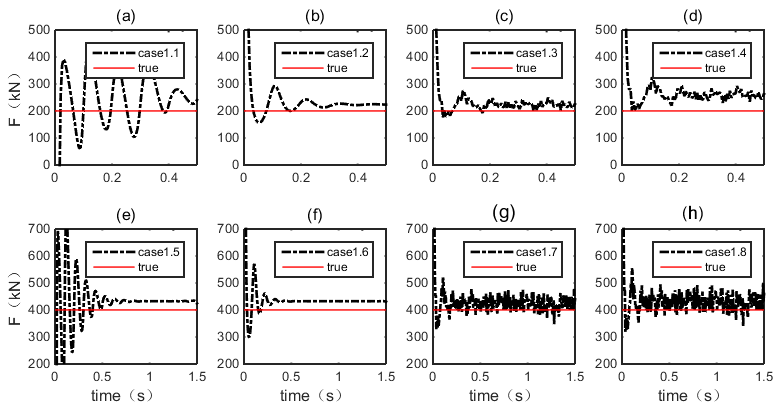
Figure 6 displays the results of the PFI, the errors are shown in Table 4. It is found that most cases are well determined. Also, they are highly correlated with the MFI results. This is because, in this step, the PF is determined via state-space formulation (Equation (16)), where the determined MF is used as input. Therefore, the instability of responses as well as the error in the MFI will influence the PFI results. Large deviation is observed at the beginning of the period where the determined MF is too with error, but soon after the responses are steady, the identified results converge with the true value.
Referring to cases 1.1 and 1.5, the instability at the beginning is severer than that in MFI. Compared to the MFI results in the same cases, the unstable time is around 0.5 s in PF, while it is only 0.2 s in MF. Case 1.1 even fails to identify the PF due to this large fluctuation. However, by comparing cases 1.2 and 1.5, which use two sensors, the unstable period is significantly decreased and the accuracy is improved by around 2%. Therefore, in practice, it is suggested that the unstable responses for this method are not used, and that at least two sensors are used for stable results.
The figures also demonstrate that noise has some impact on the results (Cases 1.3 and 1.4), leading to an increment in the roughness of the PF curves. Even though the ill-conditioned problem is controlled by Tikhonov regularization, some local fluctuations induced by noise remain and cause around 2% error. By looking at the results of cases 1.2 and 1.6, two levels of PF, 200 kN and 400 kN, are both determined with good agreement; their RPEs are 9.54% and 6.83%, respectively. Actually, this difference is mainly caused by the accumulated error of MFI, and the PF level barely affects the accuracy.

3.2. Experimental Study on Prestressed Box-Girder Subjected to a Periodic Load

From the results presented in the above section, it is evident that the proposed method has the ability to identify the PF and general excitation on plate. According to research [30,31], the dynamic behavior of box girders is similar to the top flange supported along its longitudinal edges. Hence, along with appropriate boundary condition, it is able to use plate to simulate the box girder behavior. A laboratory test was conducted for validation.

3.2.1. Model Design and Construction

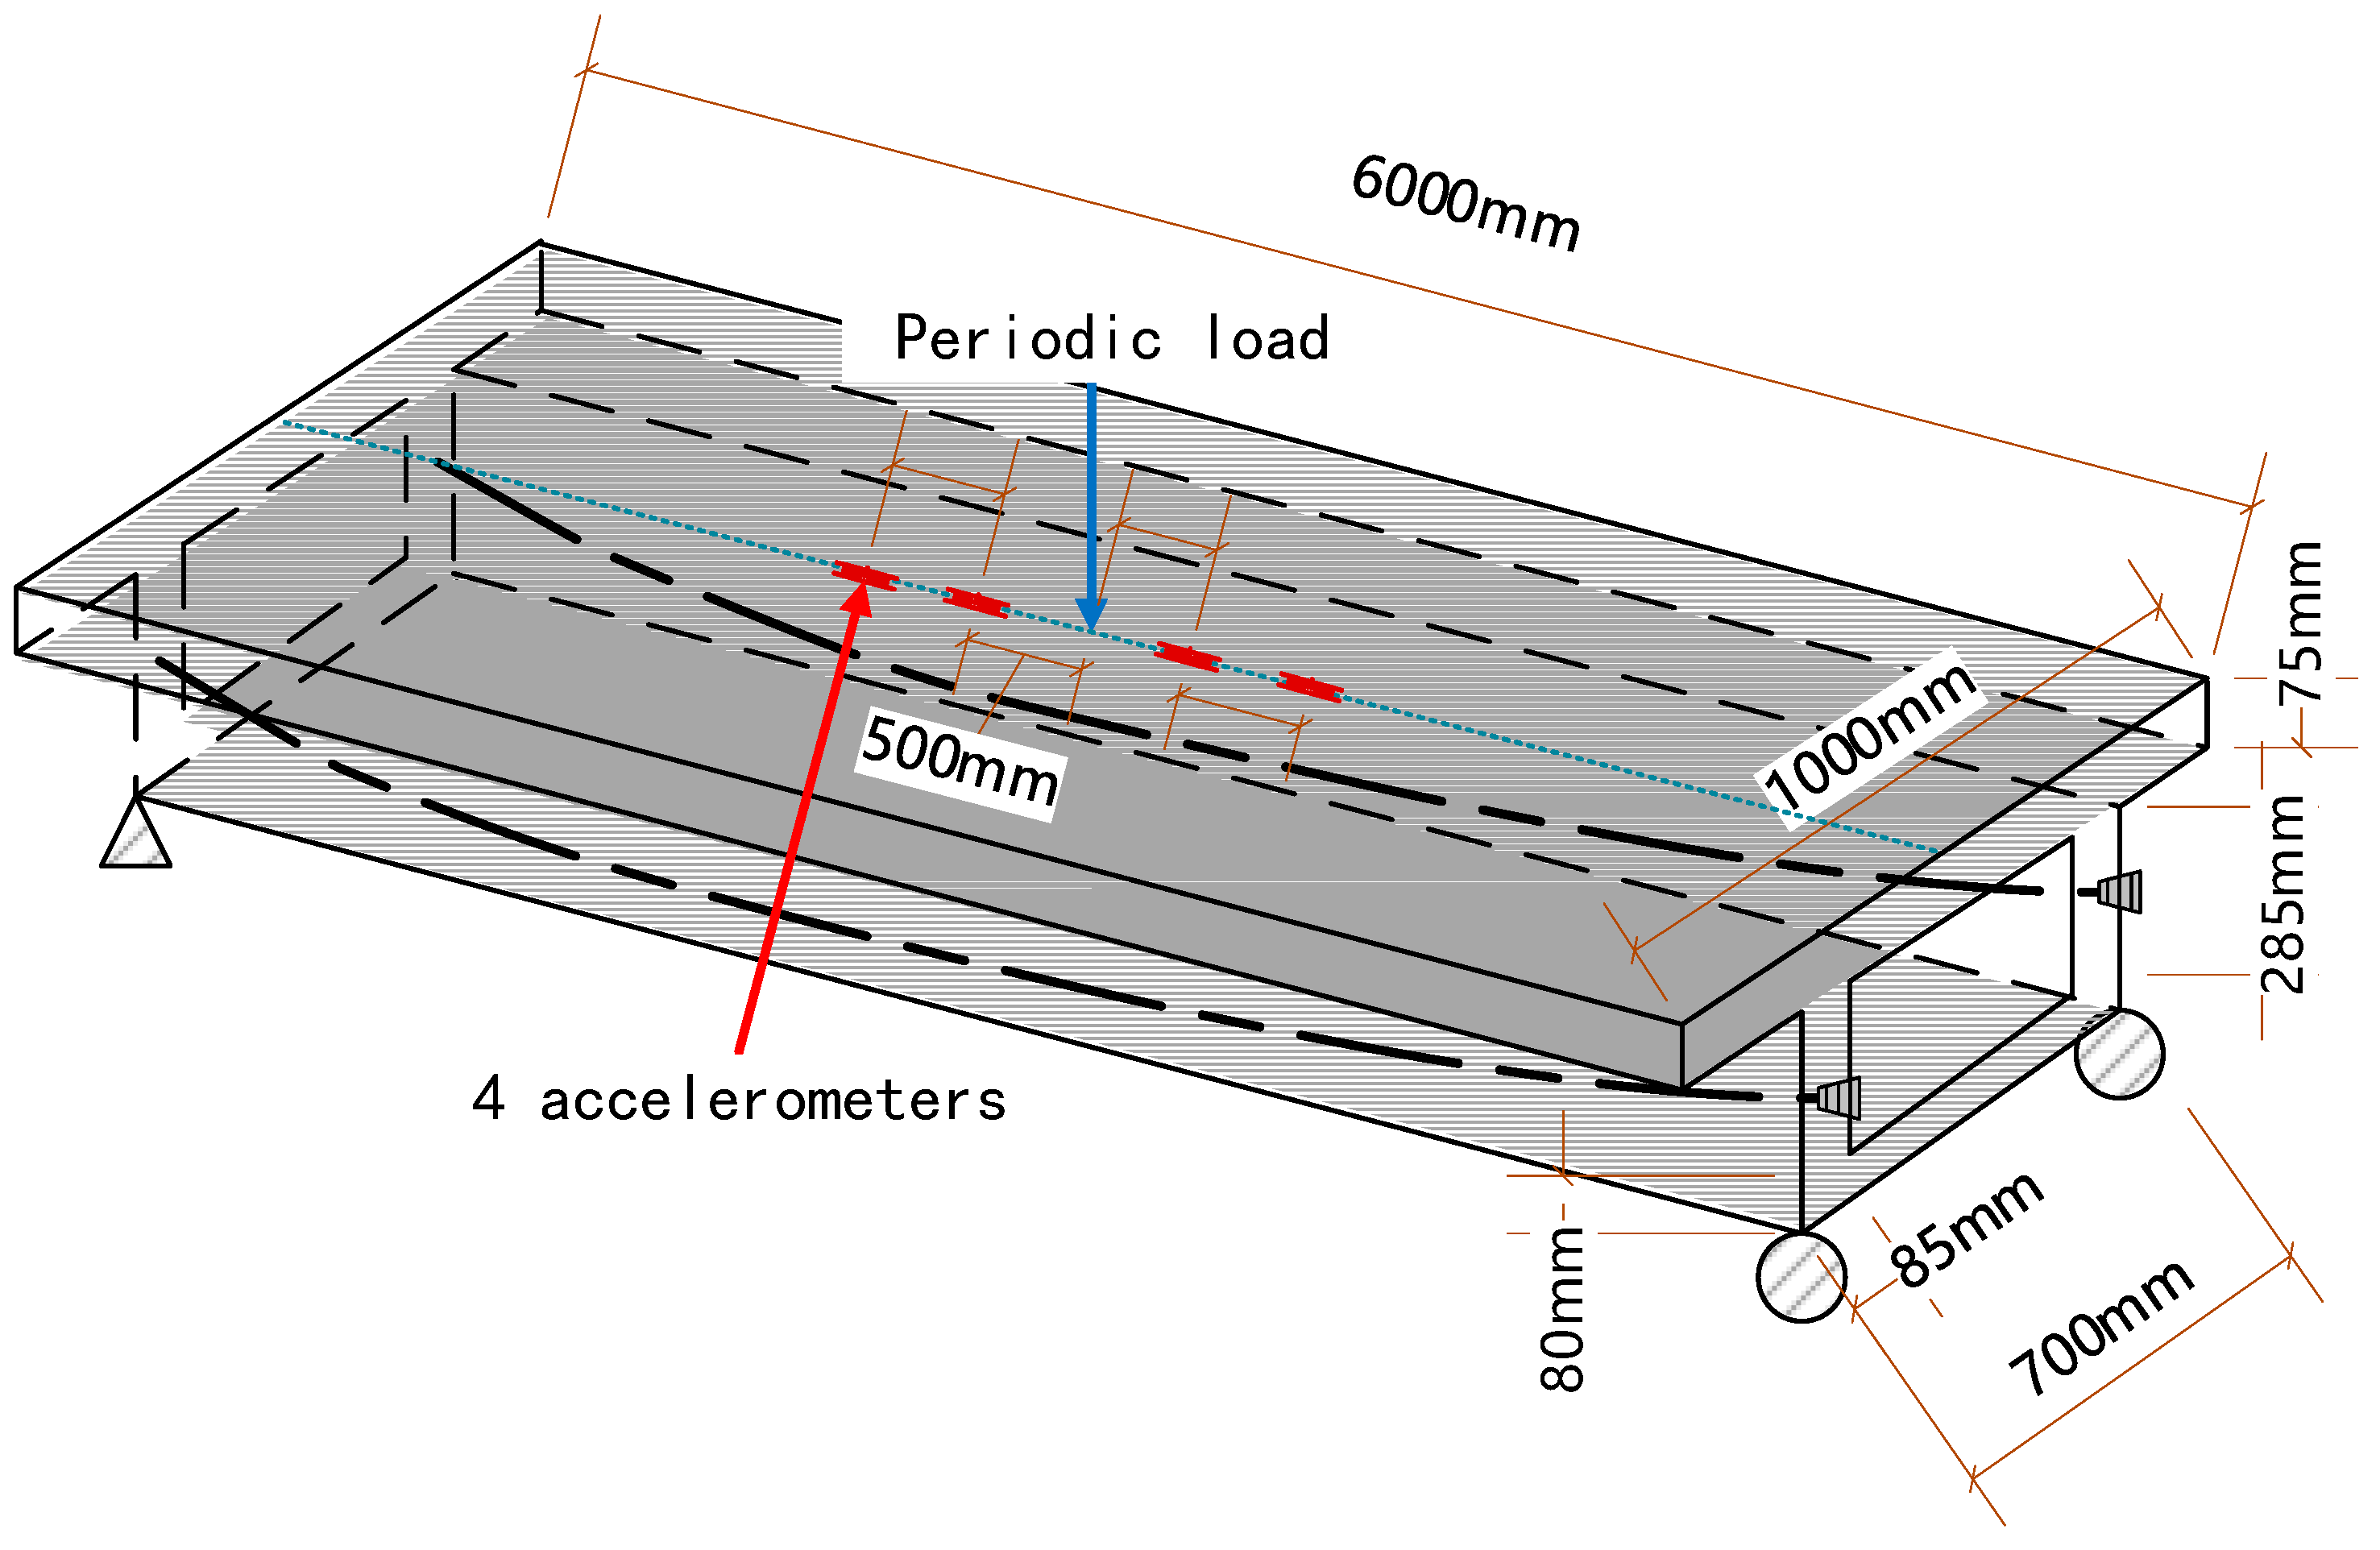
The model is designed according to study [32]; it is a 6 m long box girder with two unbounded prestressed strands, and is a 1/6 scaled-down model of the girders used in the Mass Rapid Transit System Bridge in Chennai, India. The geometry is shown below (Figure 7). The tendon profile is selected as parabolic with eccentricity; the distance of the tendon to the bottom slab along the longitudinal direction is shown in Table 5. Four accelerometers are placed on the top slab as shown, and the sampling rate is 1000 Hz.
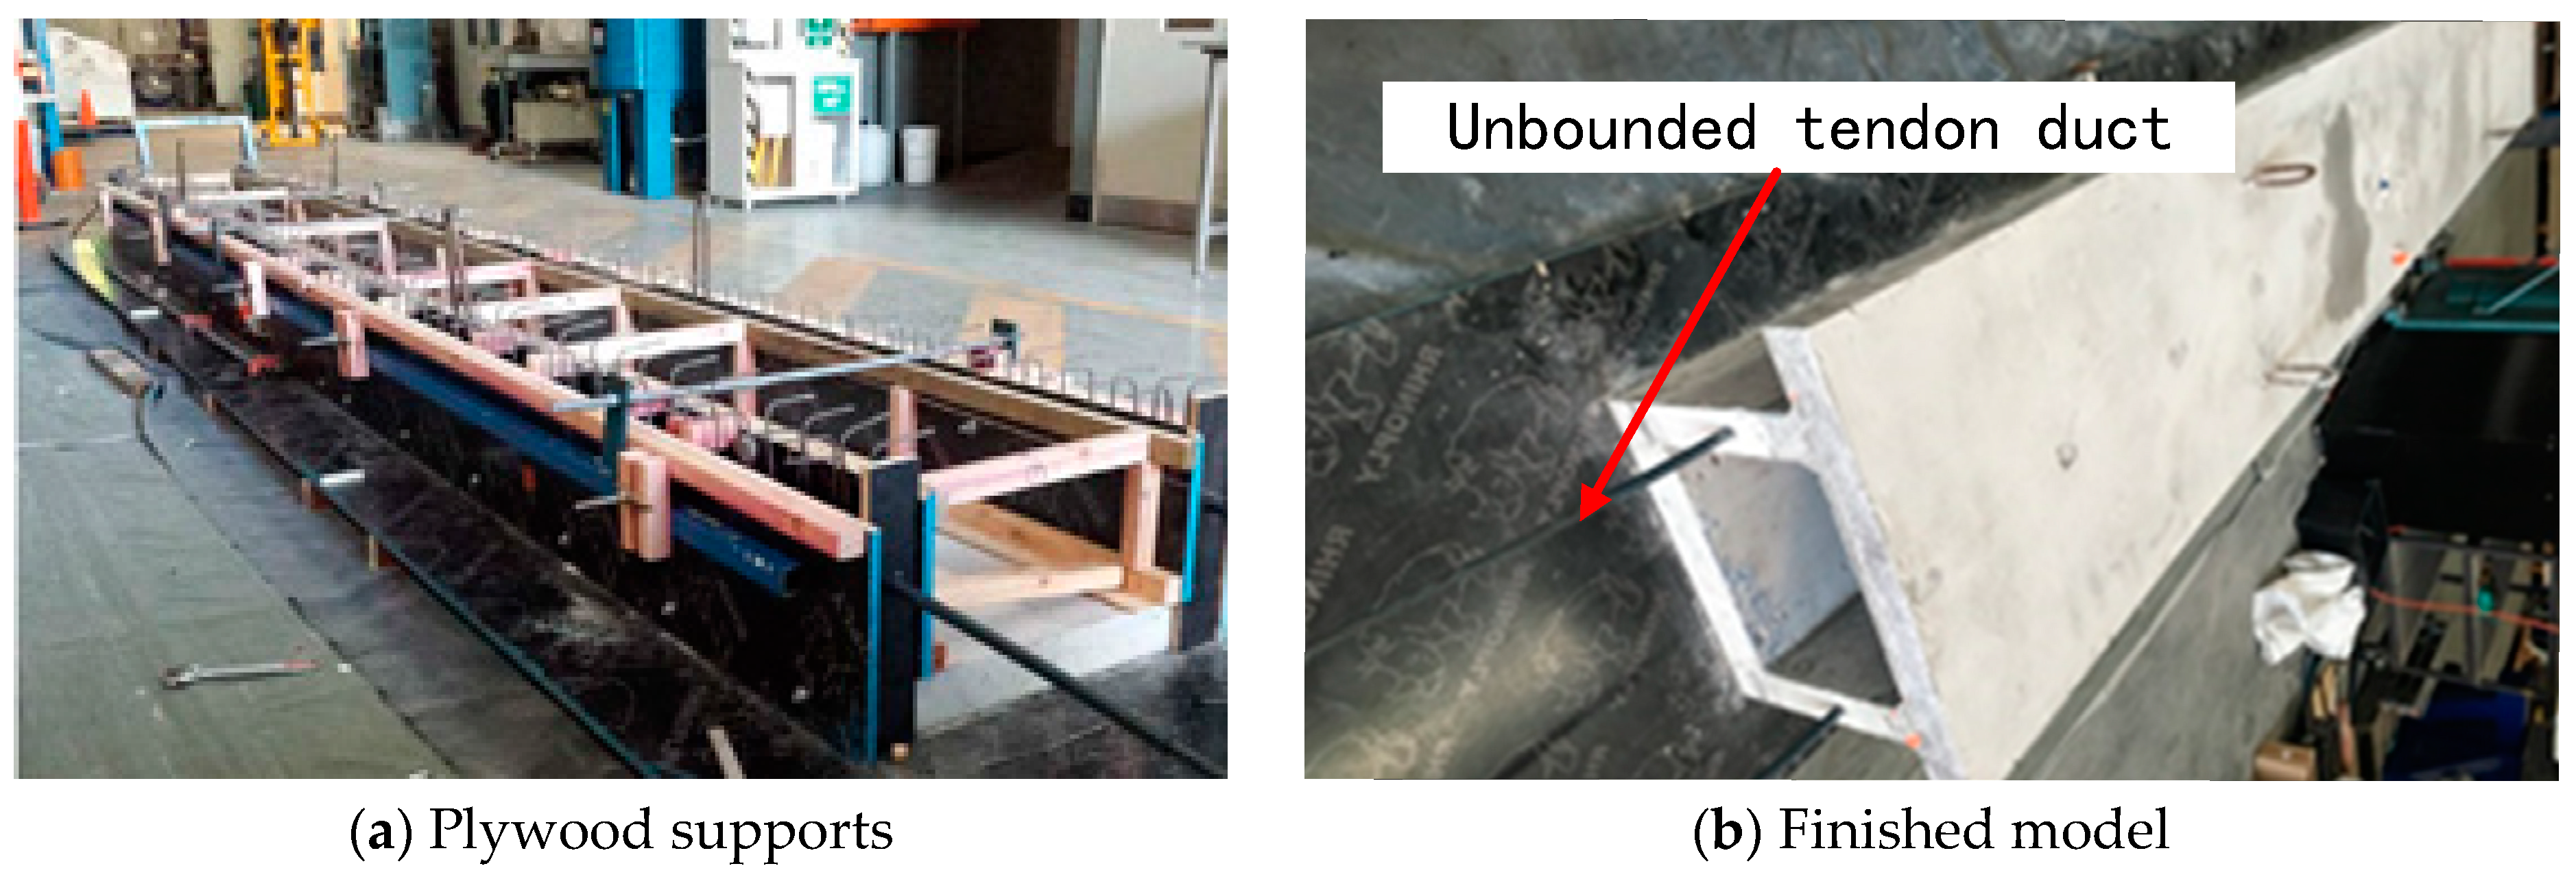
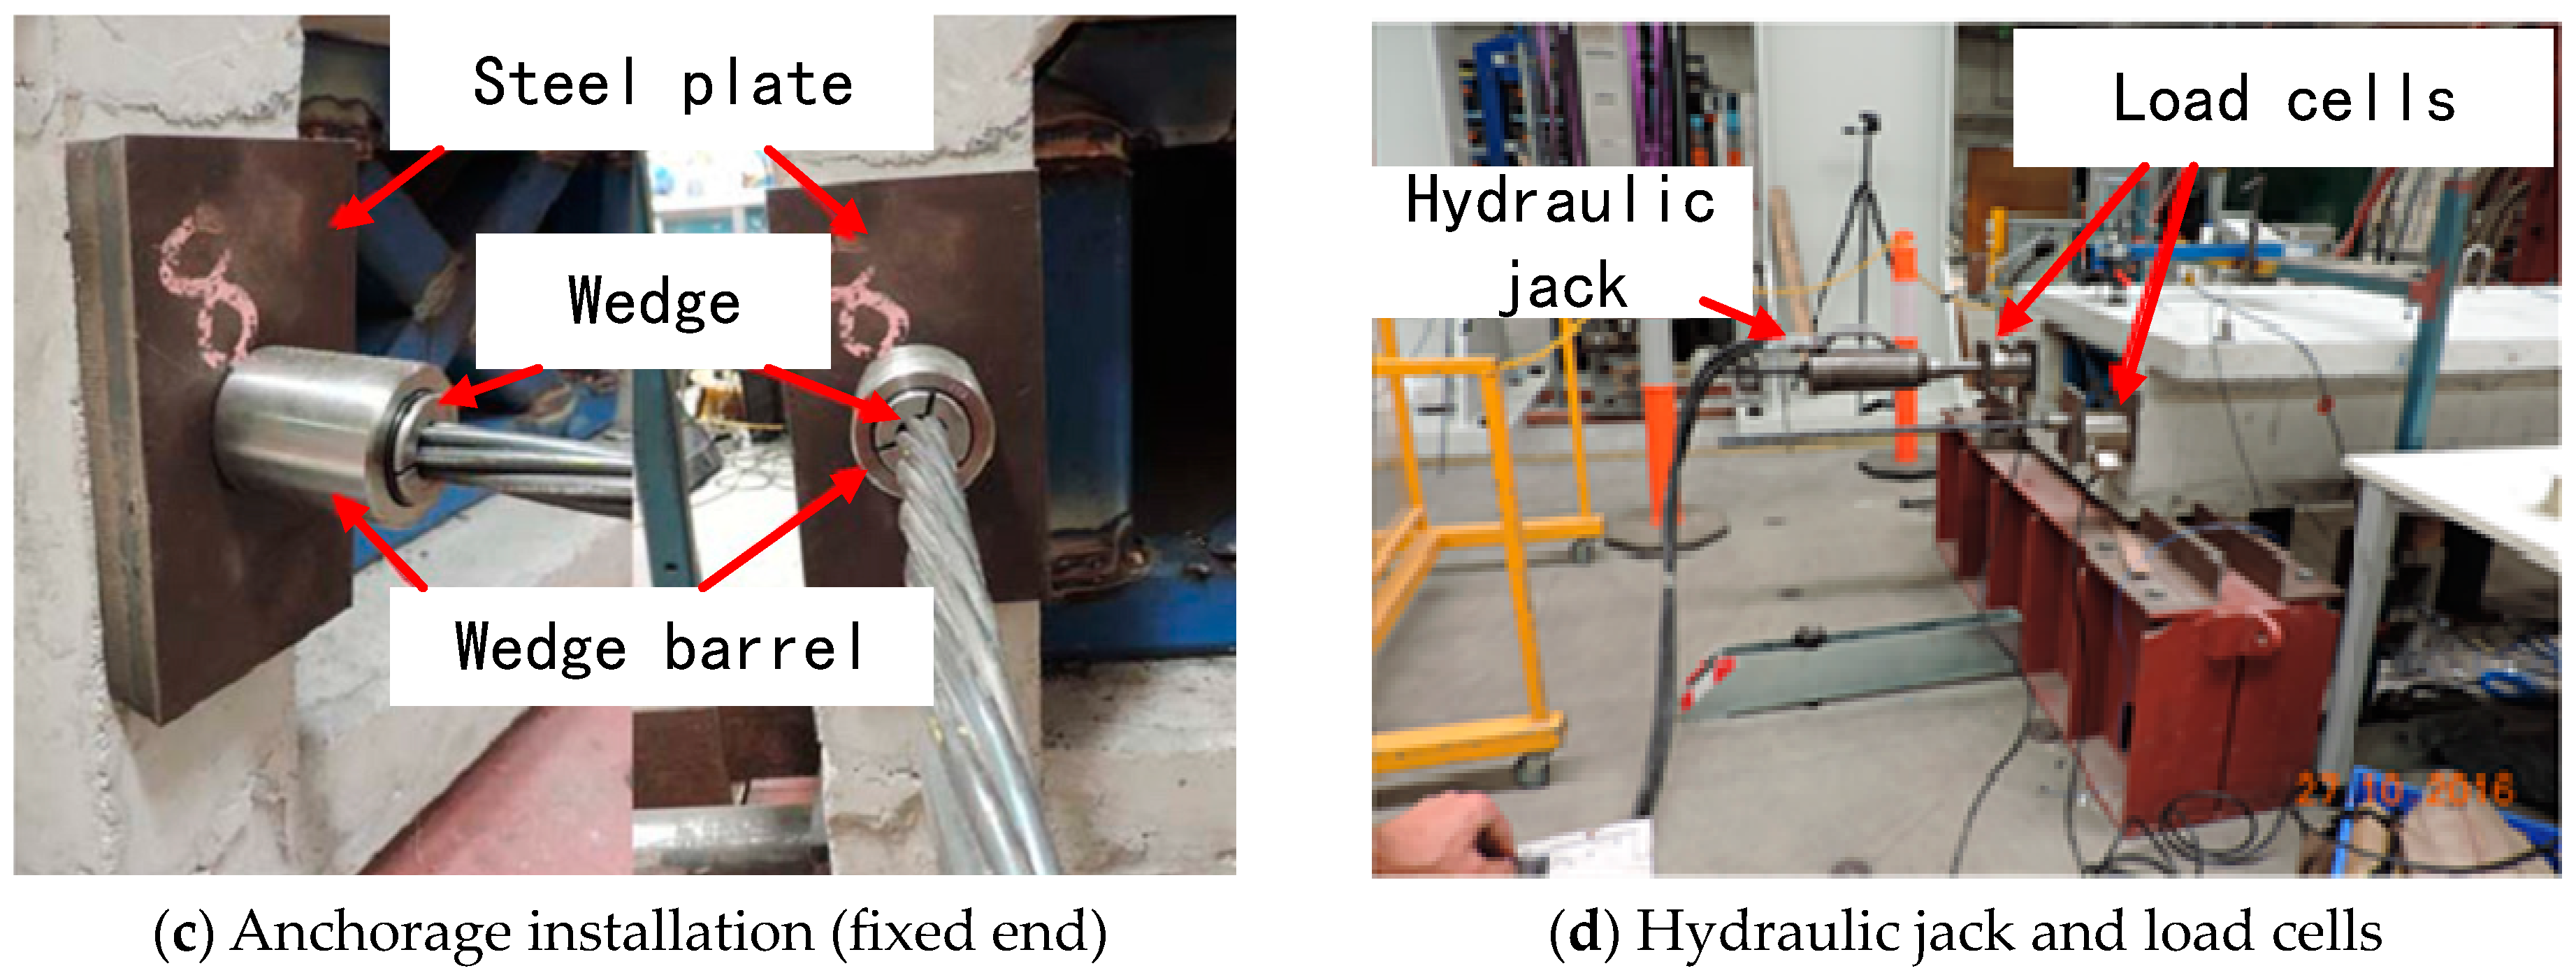
The model is constructed under the guidelines of ACI 318-08 [33], with a supportive framework using plywood being arranged before concreting, as presented in Figure 8a. Sufficient reinforcements are implemented in Figure 8b. Two ducts of the prestressed cables are embedded in the webs, as shown in Figure 8c. The final model is illustrated in Figure 8d. Rebound hammer tests and cylinder compression tests are conducted to estimate the actual strength of the concrete. The elastic modulus of concrete for each specimen is calculated according to AS 3600-2009 [34]. The final results are listed in Table 6. The elastic values of the top slab, web, and bottom slab are 30.6 GPa, 31.38 GPa, and 32.38 Gpa, respectively.
Two prestressing cables are embedded through the ducts and anchored to the girder. A cellular load cell is installed between the live end anchor and concrete surface to monitor the effective PF in the tendon when a hydraulic mono jack is used to apply the PF. (Figure 8d). Referencing study [32] and standard AS5100 [35], the designed PFs are 200, 300 and 400 kN. The effective PFs measured from load cells are 171.277, 284.009 and 378.293 kN, respectively.

3.2.2. Modal Analysis for Experimental Study

Output-only modal analysis is carried out to estimate the natural frequency and mode shapes of the box girder subjected to different PFs. The model is excited by random impulse forces produced by rubber hammers. In total, 28 accelerometers are installed at 1 m intervals at the middle and edge of both top and bottom slabs. All results are extracted with ArtemiS SUITE 14 software.
The extruded natural frequencies are listed in Table 7. It can be seen that the frequency variations are quite small. The relative differences are around −2% in the first three modes, which proves that the frequency of the PCB is influenced by the bidirectional effects of compression softening and microcrack closure. In this case, the microcrack closure area is small as only two tendons are applied in the webs. The compression softening effect dominates and hence reduces the frequency of the girder.
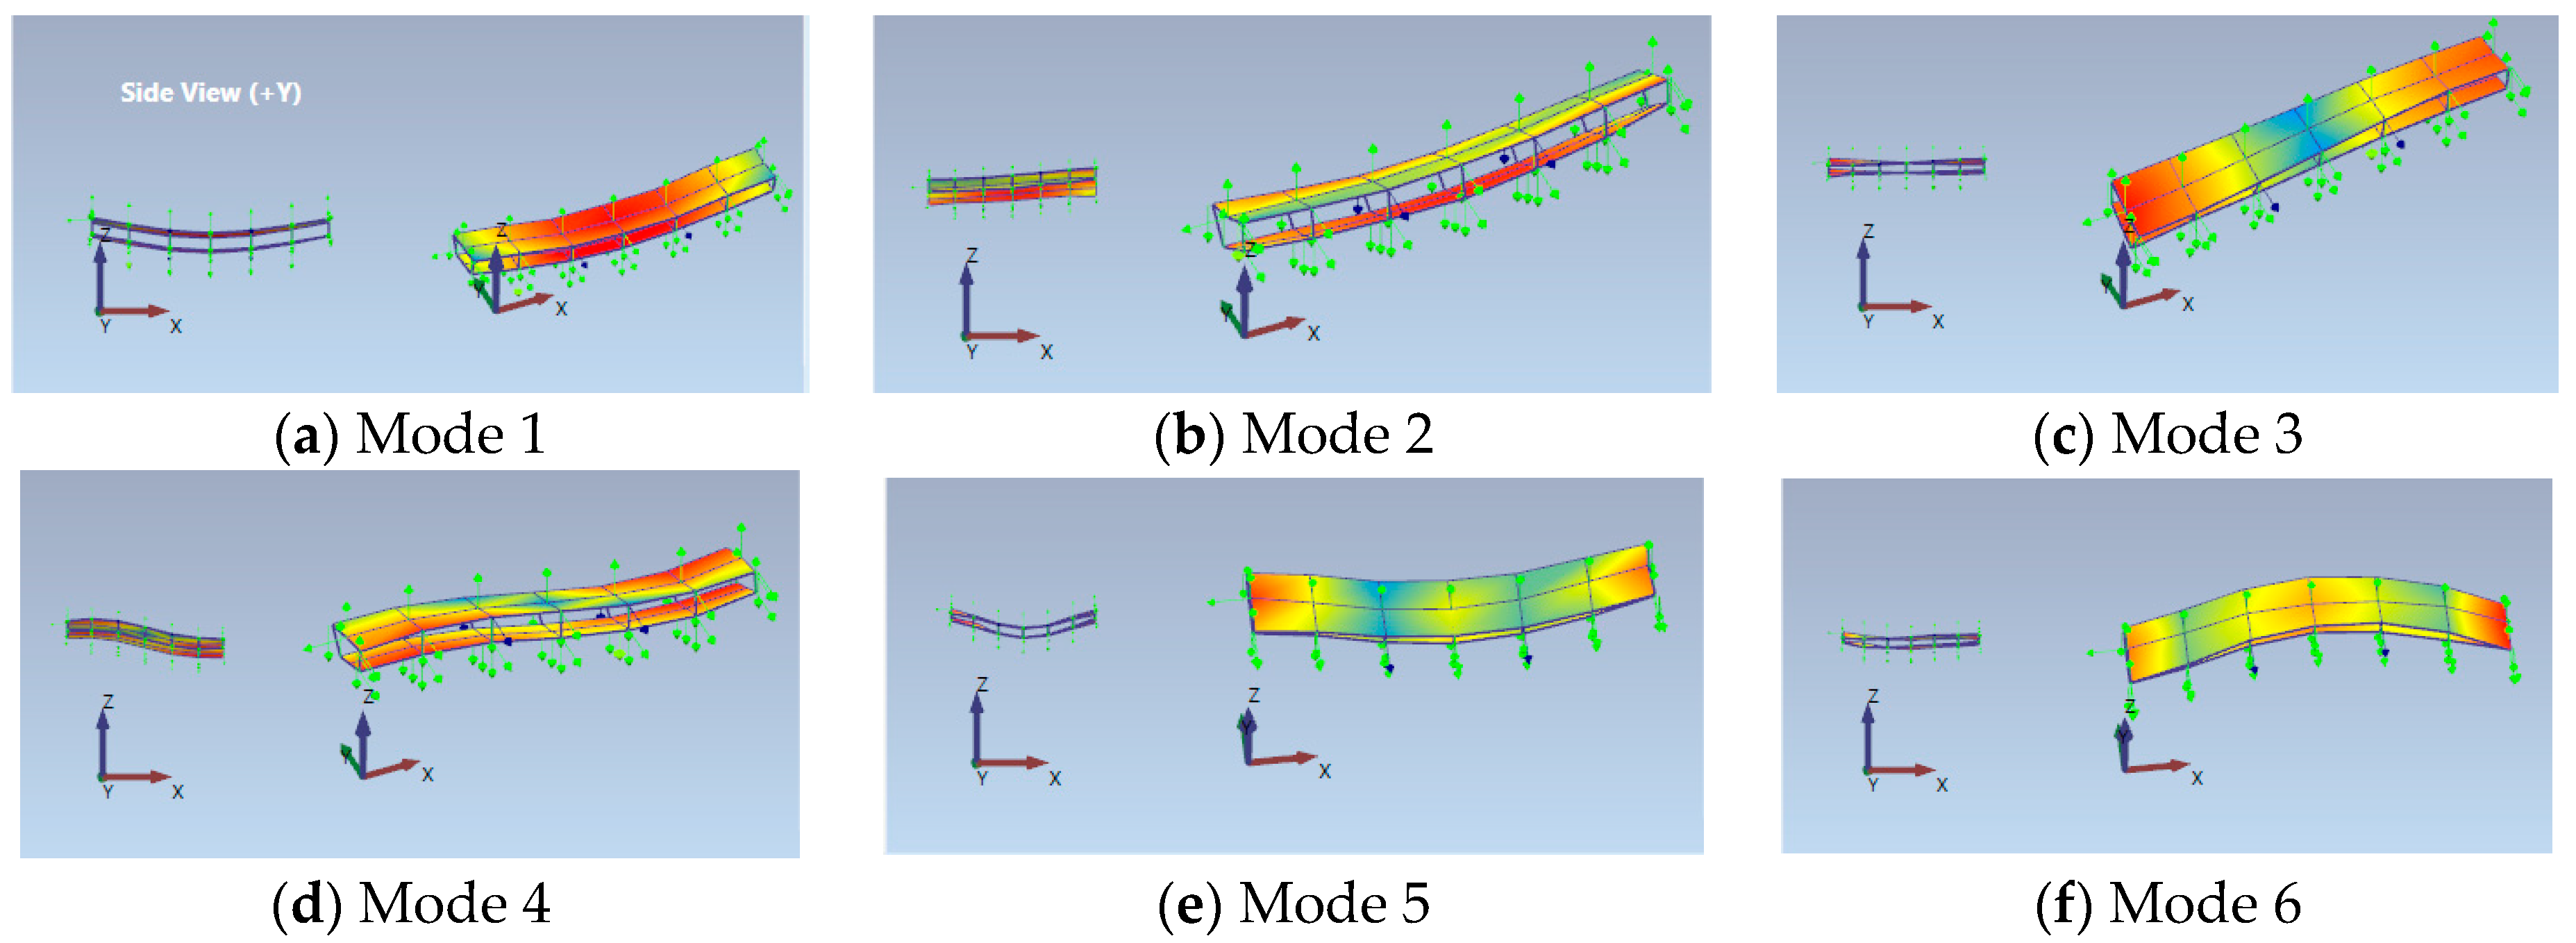
Figure 9 shows the mode shapes of the prestressed girder. Similarly, the shapes are almost identical before and after being prestressed, which agrees with study [36] and shows the difficulty of PFI via the frequency or mode shape. However, it simplifies the calculation of the modal response U . As shown in Equation (13), U is calculated via the mode shape and measured response. This invariance in the mode shape makes it easier to obtain U in different PF scenarios.

3.2.3. Case Setting for Experimental Study

In the dynamic test, a periodic force generated by a hydraulic pressure system is subjected to the center of the mid-span. Its value, as presented in Figure 10, simulates a 1/6 scaled-down dynamic load from a light van (1.8–6 t). Four cases are shown in Table 8.

3.2.4. Identified Results

The results of the force identification are presented in Figure 11. As expected, the loads are determined with very good agreement, and the measurement noise only causes some small errors at the peaks of the curve. The RPEs are listed in Table 9, showing that most cases could limit the error to under 10%. Unlike in the numerical study, no instability occurs at the beginning of the determined period. That is because the measured times are selected at the end of the vibration when the coupled vibration follows a steady state.
Comparing cases 2.2 and 2.3, a different measuring time has almost no effect on the accuracy. In fact, the identified results are time independent at a certain level. According to Equation (11), the system matrix only indicates the spatial dynamic relationship between the load and response, and changing the measuring time only varies the matrix’s dimension but does not affect its singularity. Hence, the accuracy is not influenced. In cases 2.1 and 2.4, it is observed that the RPEs increase 2% with the increment in PF. This is due to the deformation incorporation of the prestressed box girder, which could be improved by the sensor optimization. Looking into case 2.3, it can be found that the periodic and decline parts of the load are both determined, which proves the feasibility of the proposed method for different load types.
The superiority of solving the ill-posedness of the proposed method is worth noting. As time domain methods eventually solve linear algebraic equations (Equation (11)), the ill-posedness of the system matrix is problematic since noise becomes very influential and results in inaccurate or non-unique results. Traditional techniques such as singular value decomposition (SVD), conjugate gradient (CG), and preconditioned conjugate gradient (PCG) are widely used as solutions. Essentially, these methods maintain a proper level to filtrate the cluster of small singular values and hence stabilize the problem. However, determining the level is not easy. On the other hand, the proposed method uses smooth continuous basis function (LSF) to reduce the difference between the singular values in the system matrix and hence decrease the ill-posedness. More importantly, the dimension of the LSF implied matrix is largely reduced, which means it not only solves the ill-posed problem with no extra effort, but also boosts the calculation efficiency. A comparison study [37] on a simply supported beam subjected to a moving vehicle was conducted and verified the performance of these techniques. With 5% measurement noise, SVD failed to identify the load, CG could assess the load but the error was up to 33.8%, and PCG determined it with 10% error. It is obvious that the proposed method could achieve a similar level of accuracy to PCG but with much lower computational work. Another study [38] was performed to determine the stationary load of a port container crane. The load contained an incline part and a periodic part, which is very comparable to this study. They proposed a fitting function (MWLST) to approximate the dynamic load. MWLST considered the continuity and correlation of loads between two adjacent sampling points, so it could simulate more detail of the loads and obtain higher accuracy. But it also amplifies the influence of ill-posedness and needs regularization. In contrast, the proposed LSF neglects the high-frequency part of the load to achieve better efficiency. The results showed that the RPE of MWLST was 6%, better than the results in this paper. But both of them meet the requirements of a standard weight-in-motion system (±10%). The balance between accuracy and efficiency will be discussed further.
Overall, the numerical and laboratory studies prove that the proposed method could determine the moving load and periodic load with good accuracy and stability. Moreover, the method can also determine multiple loads. A previous study by the authors [39] demonstrated the identification of two-axle vehicle loads, so this will not be covered again here. However, an important premise of using this method is that the location of the load must be known. Hence, random excitation is not accessible when using this method.
The proposed method requires idealizing the top slab using boundary characteristic orthogonal polynomials. The boundary conditions of the top slab are considered to be simply supported at the diaphragm walls and cast into a beam along its longitudinal edges. Due to the lower width of the section, no significant rotation of the plate about the longitudinal edge is observed for the applied excitation force. Hence, the rotation of the plate along the web line is assumed as zero. Numerical studies have stated that the measurement noise would slightly decrease the accuracy. Therefore, a low-pass filter with a cut-off frequency of 100 Hz is used to remove most of the high-frequency noises.
The PFI results are displayed in Figure 12. Generally, all cases show good agreement with the true PF. It is observed that the identified values are less than the true value, which is caused by the error of MFI. Even with the denoise responses, local variations are still found in the results, which are caused by the deformation of the prestressed tendons. Especially in case 2.3, it can be seen that the variation remarkably decreases when the excitation changes from periodical to decreasing (from 69 s). Moreover, the profile in case 2.3 also reveals that different types of excitation do not affect the identification. The final values are presented in Table 10. Comparing the RPEs, the PF level and measuring time barely affect the accuracy, which agrees with the simulation results. The precision is more related to the accuracy of MFI.
Law et al. [40] proposed a similar study to determine the PF and MF simultaneously. It transformed the PF into a virtual external load via geometric stiffness, and used the Wavelet–Galerkin approximation to solve the motion equation with both PF and MF being unknown. However, because the MF and PF are applied in varies positions with significantly different amplitudes, the identification matrix of this method is seriously ill-conditioned. Even with regularization, a more than 15% error was found in the results. Hence, the authors propose the two-step procedure to avoid this problem. The results prove that the error could be limited to 12%.
In general, this section presents two studies to validate that the two-step procedure could determine the PF and general excitation with good agreement, with the errors from PF and excitation all being controlled under 12%. Compared to other studies, the proposed procedure is shown to prioritize calculation stability and efficiency, but also reveals drawbacks regarding accuracy to a certain degree.

4. Conclusions

Prestress force assessment using a bridge’s dynamic responses has been proved promising. However, most methods require the responses to be induced by known excitation, which is inconvenient for in-service bridges. This paper puts forward a two-step procedure to identify the prestress and the general excitation using only bridge responses. Through this, the PF can be determined with the responses induced by normal traffic, and the vehicle load can also be monitored in the meantime. It can make full use of the SHM system data and perform long-term monitoring at a low cost.
In the two-step procedure, the motion equation based on plate theory is established, which can demonstrate the behavior of a prestressed plate or box girder bridges more accurately than beam theory. The excitation is determined in the first step with the proposed LSF method, which significantly reduces the computational cost and the ill-conditioned problem. Then, in the second step, the PF is determined by the state-space formula of the motion equation with known excitation, and the least squared method is introduced to minimize error.
Both numerical and experimental studies are performed. The identification of PF in the plate and box girder, with moving load and periodic load, is validated. The results show that the moving force and cycling force can be identified with around 10% error, which is quite competitive with the weight-in-motion system, while the PF is determined with an error of around 11%, which is also impressive compared to current studies. The PF level, load speed and type, and sampling time have almost no influence on the result. The measurement noise and sensor number have a slight influence on the load identification. The proposed method has strong robustness to noise, and only requires the number of sensors to not be less than the number of unknown excitations. On the other hand, the noise causes local fluctuations in the PF results and hence decreases its accuracy. Using only one sensor can lead to large deviations at the beginning of the identification. Hence, a multiple sensor arrangement and the performance of measurement denoise are preferred in practice.
It should be noted that due to limited resources, this paper focuses on a simply supported bridge and single excitation. However, in practice, different boundary conditions, a large amount of vehicle loads, and environmental effects should all be considered. This work will be performed in the future.

Author Contributions

Conceptualization and methodology, Z.X.; data curation and software, W.W. and Y.W.; validation, X.S. and J.L. All authors have read and agreed to the published version of the manuscript.

Funding

This work was supported by the National Natural Science Foundation of China grant number 52208395, the Nantong Natural Science Foundation grant number JC2023110, and the MOE Key Lab of Disaster Forecast and Control in Engineering. The authors appreciatively acknowledge the financial support of the agencies mentioned above.

Data Availability Statement

The original contributions presented in the study are included in the article, further inquiries can be directed to the corresponding author.

Conflicts of Interest

The authors declare no conflict of interest.

References

  1. Bonopera, M.; Chang, K. Novel method for identifying residual prestress force in simply supported concrete girder-bridges. Adv. Struct. Eng. 2021, 24, 3238–3251. [Google Scholar] [CrossRef]
  2. Kraľovanec, J.; Moravčík, M.; Bujňáková, P.; Jošt, J. Indirect determination of residual prestressing force in post-tensioned concrete beam. Materials 2021, 14, 1338. [Google Scholar] [CrossRef] [PubMed]
  3. Nguyen, T.T.; Hoang, N.D.; Nguyen, T.H.; Huynh, T.C. Analytical impedance model for piezoelectric-based smart Strand and its feasibility for prestress force prediction. Struct. Control Health Monit. 2022, 29, e3061. [Google Scholar] [CrossRef]
  4. Bagge, N.; Nilimaa, J.; Elfgren, L. In-situ methods to determine residual prestress forces in concrete bridges. Eng. Struct. 2017, 135, 41–52. [Google Scholar] [CrossRef]
  5. Zhang, H.; Xia, J.; Zhou, J.; Liao, L.; Xiao, Y.; Tong, K.; Zhang, S. Prestress monitoring for prestress tendons based on the resonance-enhanced magnetoelastic method considering the construction process. Struct. Health Monit. 2024, 23, 958–970. [Google Scholar] [CrossRef]
  6. Zhou, X.; Zhang, X. Thoughts on the development of bridge technology in China. Engineering 2019, 5, 1120–1130. [Google Scholar] [CrossRef]
  7. Noble, D.; Nogal, M.; O’Connor, A.; Pakrashi, V. The effect of prestress force magnitude and eccentricity on the natural bending frequencies of uncracked prestressed concrete beams. J. Sound Vib. 2016, 365, 22–44. [Google Scholar] [CrossRef]
  8. Ho, D.-D.; Kim, J.-T.; Stubbs, N.; Park, W.-S. Prestress-force estimation in PSC girder using modal parameters and system identification. Adv. Struct. Eng. 2012, 15, 997–1012. [Google Scholar] [CrossRef]
  9. Li, J.; Miki, T.; Yang, Q.; Mao, M. Experimental Study on Prestressing Force of Corroded Prestressed Concrete Steel Strands. J. Adv. Concr. Technol. 2022, 20, 550–563. [Google Scholar] [CrossRef]
  10. Bonopera, M.; Chang, K.-C.; Chen, C.-C.; Sung, Y.-C.; Tullini, N. Prestress force effect on fundamental frequency and deflection shape of PCI beams. Struct. Eng. Mech. Int. J. 2018, 67, 255–265. [Google Scholar]
  11. Kim, J.T.; Yun, C.B.; Ryu, Y.S.; Cho, H.M. Identification of prestress-loss in PSC beams using modal information. Struct. Eng. Mech. 2004, 17, 467–482. [Google Scholar] [CrossRef]
  12. Dall’Asta, A.; Dezi, L. Discussion of “Prestress Force Effect on Vibration Frequency of Concrete Bridges” by M. Saiidi, B. Douglas, and S. Feng. J. Struct. Eng. 1996, 122, 458. [Google Scholar] [CrossRef]
  13. Abdel Jaber, H.; Glisic, B. Monitoring of prestressing forces in prestressed concrete structures—An overview. Struct. Control Health Monit. 2019, 26, e2374. [Google Scholar] [CrossRef]
  14. Aloisio, A.J.I. Aspects of vibration-based methods for the prestressing estimate in concrete beams with internal bonded or unbonded tendons. Infrastructures 2021, 6, 83. [Google Scholar] [CrossRef]
  15. Bonopera, M.; Liao, W.-C.; Perceka, W. Experimental-theoretical investigation of the short-term vibration response of uncracked prestressed concrete members under long-age conditions. Structures 2022, 35, 260–273. [Google Scholar] [CrossRef]
  16. Jaiswal, O.R. Effect of prestressing on the first flexural natural frequency of beams. Struct. Eng. Mech. 2008, 28, 515–524. [Google Scholar] [CrossRef]
  17. Wang, Y. Research on fundamental frequencies and dynamic characteristics of pre-stressed concrete beams based on experiment and numerical simulation. Mechanika 2017, 23, 552–561. [Google Scholar] [CrossRef]
  18. Xiang, Z.; Chan, T.H.T.; Thambiratnam, D.P.; Nguyen, A. Prestress and excitation force identification in a prestressed concrete box-girder bridge. Comput. Concr. 2017, 20, 617–625. [Google Scholar] [CrossRef]
  19. Lu, Z.; Law, S. Identification of prestress force from measured structural responses. Mech. Syst. Signal Process. 2006, 20, 2186–2199. [Google Scholar] [CrossRef]
  20. Law, S.; Lu, Z. Time domain responses of a prestressed beam and prestress identification. J. Sound Vib. 2005, 288, 1011–1025. [Google Scholar] [CrossRef]
  21. Xu, J.; Sun, Z. Prestress force identification for eccentrically prestressed concrete beam from beam vibration response. Struct. Longev. 2011, 5, 107–115. [Google Scholar]
  22. Wang, N.; Can, W.; Wei, S.; Litian, H. Prestress identification method based on actual influence line information of bridge. J. Vib. Eng. 2023, 36, 688–697. [Google Scholar]
  23. Zhong, H.; Yang, M. Prestress loss identification based on dynamic vehicle responses. J. Eng. Mech. 2018, 144, 04018088. [Google Scholar] [CrossRef]
  24. Cruz, A.; Vélez, W.; Thomson, P. A novel and robust technique for identifying prestress forces in prestressed concrete beams using generic finite elements and simulated annealing algorithms. J. Appl. Res. Technol. 2021, 19, 250–262. [Google Scholar] [CrossRef]
  25. Fu, C.C.; Wang, S. Computational Analysis and Design of Bridge Structures; CRC Press: Boca Raton, FL, USA, 2014. [Google Scholar]
  26. Ji, W.; Deng, L.; Liu, S.Z.; Lin, P.Z. Study of vertical bending vibration behavior of continuous prestressed concrete box girders with corrugated steel webs. Adv. Struct. Eng. 2016, 19, 953–965. [Google Scholar] [CrossRef]
  27. Jacquelin, E.; Bennani, A.; Hamelin, P. Force reconstruction: Analysis and regularization of a deconvolution problem. J. Sound Vib. 2003, 265, 81–107. [Google Scholar] [CrossRef]
  28. Hu, W.H.; Tang, D.H.; Teng, J.; Said, S.; Rohrmann, R.G. Structural Health Monitoring of a Prestressed Concrete Bridge Based on Statistical Pattern Recognition of Continuous Dynamic Measurements over 14 years. Sensors 2018, 18, 4117. [Google Scholar] [CrossRef] [PubMed]
  29. Li, H.; Lv, Z.; Liu, J. Assessment of prestress force in bridges using structural dynamic responses under moving vehicles. Math. Probl. Eng. 2013, 2013, 435939. [Google Scholar] [CrossRef]
  30. Dozio, L. On the use of the Trigonometric Ritz method for general vibration analysis of rectangular Kirchhoff plates. Thin-Walled Struct. 2011, 49, 129–144. [Google Scholar] [CrossRef]
  31. Wang, Z.C.; Ren, W.X. Dynamic Analysis of Prestressed Concrete Box-girders by Using the Beam Segment Finite Element Method. Int. J. Struct. Stab. Dyn. 2011, 11, 379–399. [Google Scholar] [CrossRef]
  32. Madhavi, N.C.; Sekar, M.; Paramasivam, V. Experimental investigations on the structural behaviour of prestressed concrete box girders using innovative construction technology. J. Struct. Eng. 2006, 33, 171–175. [Google Scholar]
  33. ACI 318-08; Building Code Requirements for Structural Concrete (ACI 318-08) and Commentary. American Concrete Institute: Farmington Hills, MI, USA, 2018.
  34. Loo, Y.C.; Chowdhury, S. Introduction to prestressed concrete. In Reinforced and Prestressed Concrete; Cambridge University Press: Cambridge, UK, 2013; pp. 377–388. [Google Scholar] [CrossRef]
  35. AS5100; Bridge Design. Standards Australia: Sydney, Australia, 2004.
  36. Jia, J.; Zhang, L.; Ou, J.; Chen, X. Nondestructive Testing and Health Monitoring Techniques for Structural Effective Prestress. Struct. Control. Health Monit. 2023, 2023, 8940008. [Google Scholar] [CrossRef]
  37. Chen, Z.; Chan, T.H.T.; Nguyen, A. Moving force identification based on modified preconditioned conjugate gradient method. J. Sound Vib. 2018, 423, 100–117. [Google Scholar] [CrossRef]
  38. Sun, Y.; Luo, L.; Chen, K.; Qin, X.; Zhang, Q. A time-domain method for load identification using moving weighted least square technique. Comput. Struct. 2020, 234, 106254. [Google Scholar] [CrossRef]
  39. Zhong, J.; Xiang, Z.; Li, C. Synchronized Assessment of Bridge Structural Damage and Moving Force via Truncated Load Shape Function. Appl. Sci. 2022, 12, 691. [Google Scholar] [CrossRef]
  40. Law, S.S.; Wu, S.Q.; Shi, Z.Y. Moving load and prestress identification using wavelet-based method. J. Appl. Mech. -Trans. Asme 2008, 75, 021014. [Google Scholar] [CrossRef]
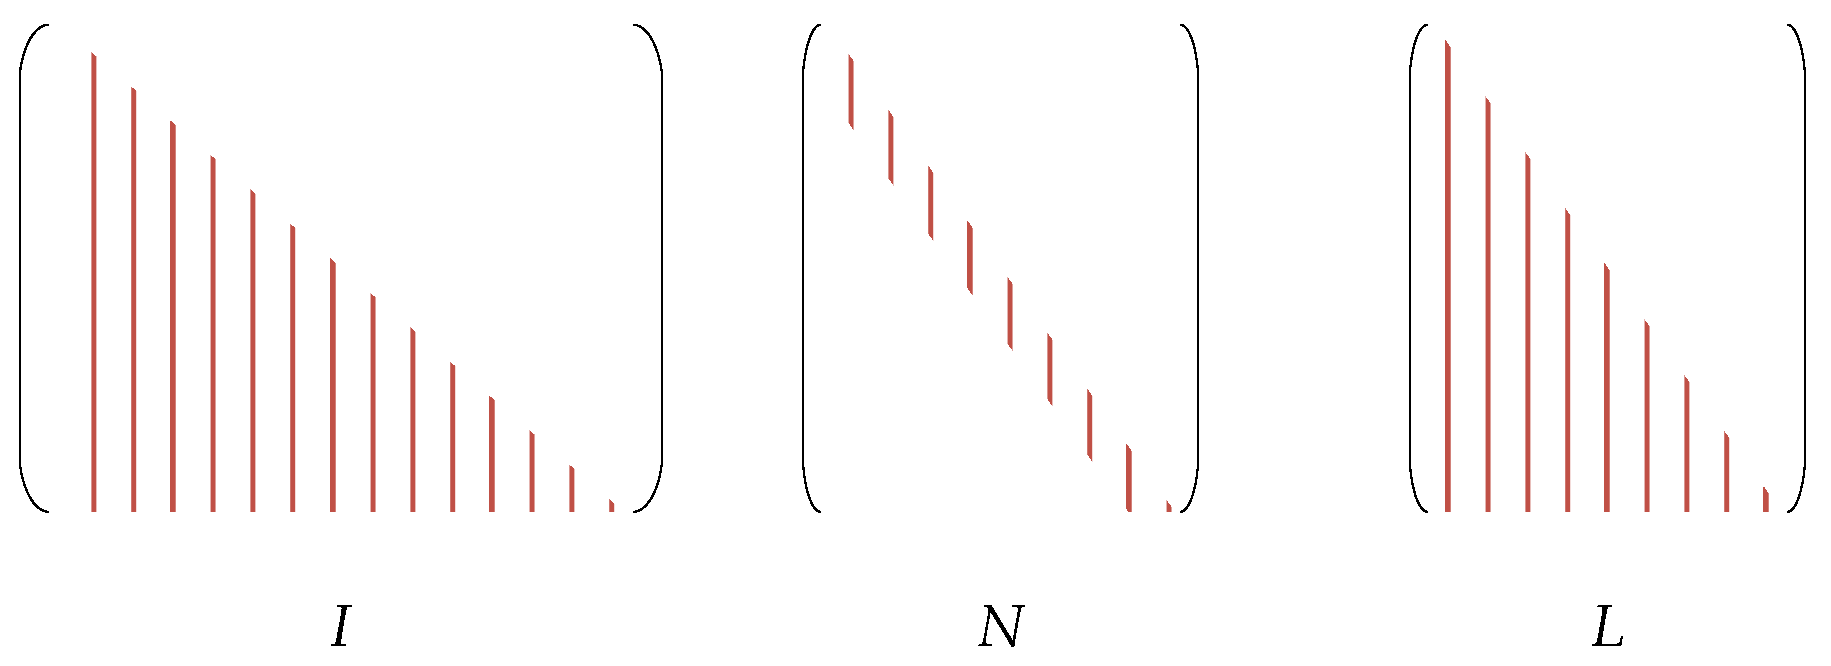
Figure 1. Development of system matrix.
Buildings 14 02032 g001
Figure 2. Two-step identification procedure.
Buildings 14 02032 g002
Figure 3. Simulation model sketch.
Buildings 14 02032 g003
Figure 4. Vibration modes of prestressed plate.
Buildings 14 02032 g004
Figure 5. MFI results of cases 1.1~1.8.
Buildings 14 02032 g005
Figure 6. PFI results of cases 1.1~1.8.
Buildings 14 02032 g006
Figure 7. Prestressed box girder model.
Buildings 14 02032 g007
Figure 8. Prestressed concrete box girder model.
Buildings 14 02032 g008aBuildings 14 02032 g008b
Figure 9. Tested Mode shapes.
Buildings 14 02032 g009
Figure 10. Periodic force.
Buildings 14 02032 g010
Figure 11. MFI results of cases 2.1~2.4.
Buildings 14 02032 g011
Figure 12. PFI results of cases 2.1~2.4.
Buildings 14 02032 g012
Table 1. Effect of PF on natural frequencies.
ModeFrequency (Hz)
mnNo PFPF = 850 kNPF = 1200 kN
1145.4545.3245.24
2172.7272.5671.83
31118.17117.92116.95
12154.53154.60154.32
41181.81181.32180.85
22181.90181.70181.56
Table 2. Case setting for prestressed concrete plate.
Case No.PF (kN) Noise   ψ (%)Vehicle Speed (m/s)Sensors
1.1850010S2
1.2850010S1, S2
1.3850510S1, S2, S3
1.48501010S1, S2, S3
1.5120004S2
1.6120004S2, S3
1.7120054S1, S2, S3, S4
1.81200104S1, S2, S3, S4
Table 3. RPE of MFI.
Case No.1.11.21.31.41.51.61.71.8
RPE (%)−16.41−15.12−16.91−17.30−5.64−5.08−5.93−7.33
Table 4. Averaged PFI results.
Case No.1.11.21.31.41.51.61.71.8
Regressed-219.08223.10227.98437.76427.32434.52440.72
True200200200200400400400400
error -9.54%11.55%13.99%9.44%6.83%8.63%10.18%
Table 5. Prestressed tendon arrangement.
Longitude (mm)050010001500200025003000
Distance (mm)235209184163146134130
Table 6. Elastic modulus correction.
PropertySection
Top SlabWebBottom Slab
Rebound hammer reading (average)42.1444.547.29
Cylinder compressive strength (without correction) (MPa)47.4328.9934.18
Derived strength from Hammer test44.246.549.5
E value from lab test (GPa)47.43Not availableNot available
Corrected Strength (MPa)47.4349.8953.12
Corrected E Value (GPa)30.631.3832.38
Table 7. Tested natural frequencies (Hz).
Mode123456
PF = 0 kN23.45143.98057.89361.85791.52195.874
PF = 171.277 kN23.025
(−1.817%)
43.785
(−0.443%)
57.768
(−0.216%)
61.745
(−0.181%)
89.229
(−2.504%)
94.720
(−1.204%)
PF = 284.009 kN22.973
(−2.038%)
43.502
(−1.087%)
57.204
(−1.190%)
61.432
(−0.687%)
84.864
(−7.274%)
94.014
(−1.940%)
PF = 378.293 kN22.902
(−2.341%)
43.536
(−1.010%)
57.235
(−1.137%)
61.414
(−0.716%)
83.954
(−8.268%)
91.718
(−4.335%)
() shows the relative difference compared to the frequency of the girder with no PF.
Table 8. Case setting of laboratory test.
Case No.2.12.22.32.4
PF (kN)171.277284.009284.009378.293
Measuring time (s)3 (31.5~34.5 s)3 (31.5~34.5 s)10 (61~71 s)10 (31.5~41.5 s)
Table 9. RPE of MFI (laboratory test).
Case No.2.12.22.32.4
RPE (%)7.099.129.6410.43
Table 10. RPE of PFI (laboratory tests).
Case No.2.12.22.32.4
Regressed results153.16253.39254.45335.44
True171.277284.009284.009378.293
RPE (%)−10.57−10.81−10.41−11.32
Disclaimer/Publisher’s Note: The statements, opinions and data contained in all publications are solely those of the individual author(s) and contributor(s) and not of MDPI and/or the editor(s). MDPI and/or the editor(s) disclaim responsibility for any injury to people or property resulting from any ideas, methods, instructions or products referred to in the content.