

ALdamage-seg: A Lightweight Model for Instance Segmentation of Aluminum Profiles

Abstract
1. Introduction
- The research introduces a novel lightweight instance segmentation model called AL-damage-seg, specifically designed for detecting defects in aluminum profiles. This model performs instance segmentation on aluminum profile damage and exhibits reduced weight and lower GFLOP requirements, making it suitable for deployment on edge devices with limited computational resources.
- Two new modules have been proposed: MFEM and C2f_LSKA. These modules not only reduce the model’s weight but also enhance feature extraction capabilities.
- By utilizing MobileNetV3 as the backbone network and incorporating MFEM, C2f_LSKA, and DPConv, AL-damage-seg achieves significant lightweighting while maintaining high detection accuracy.
2. Methods
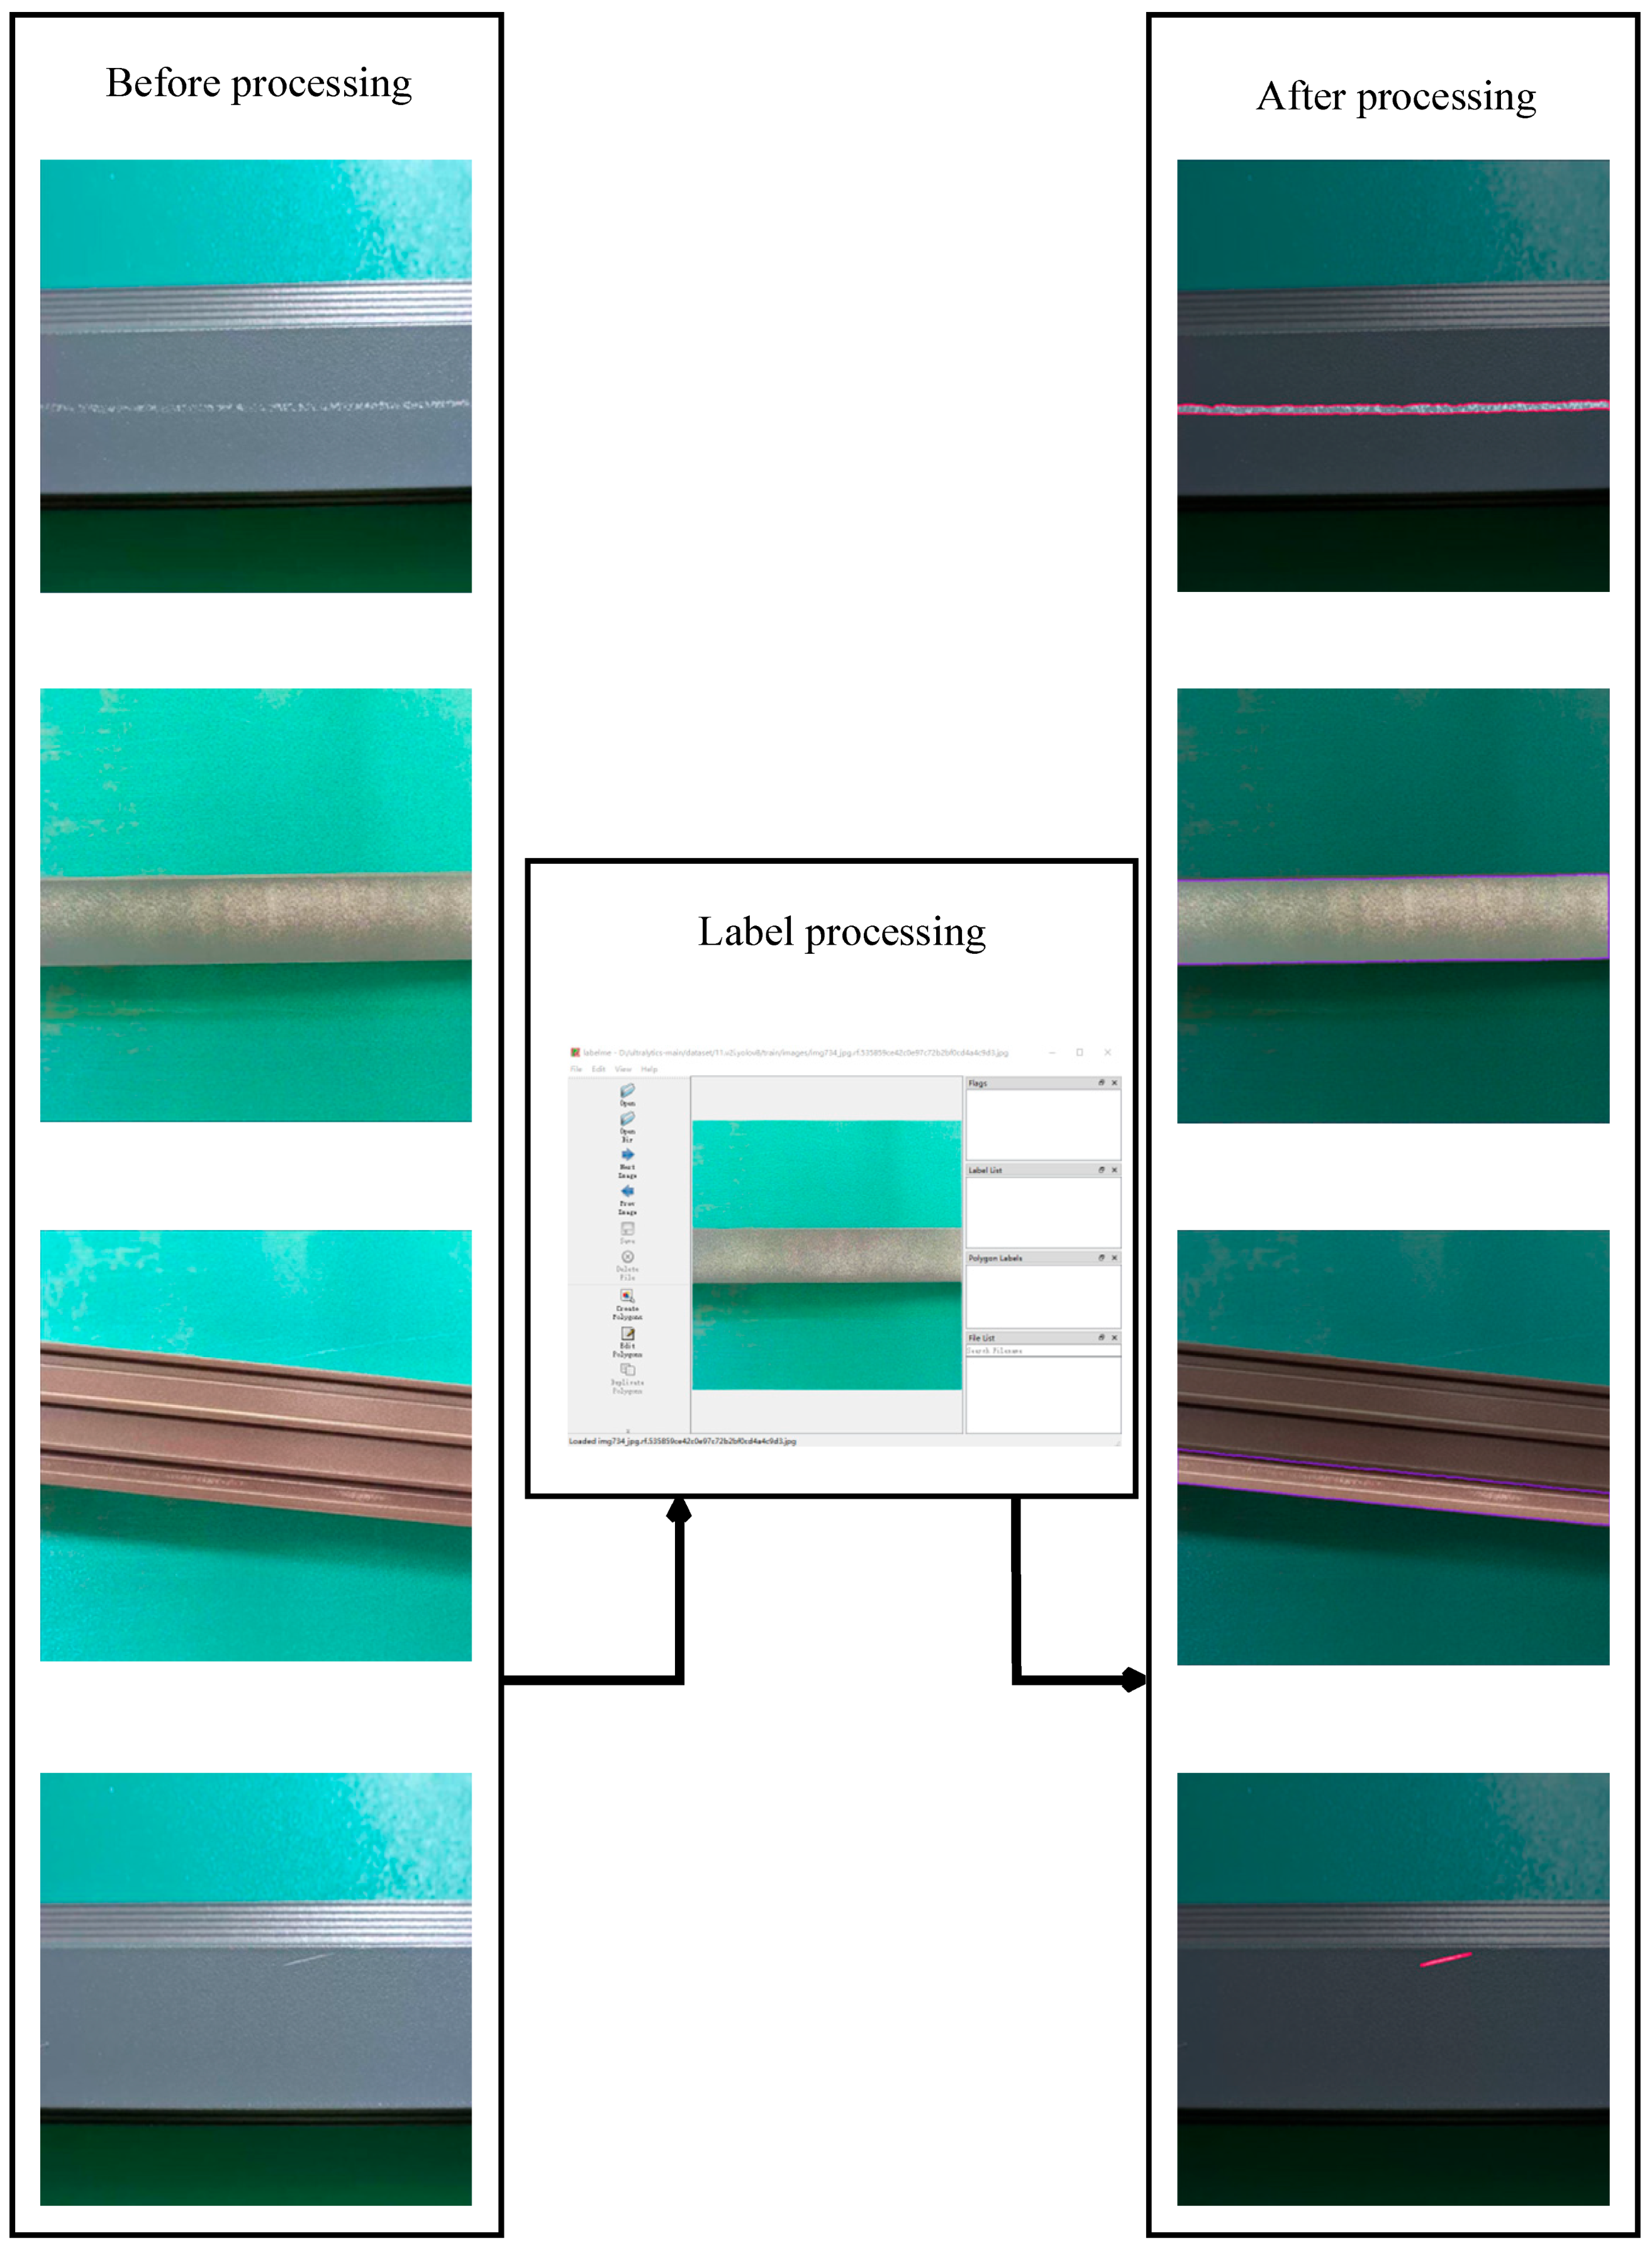
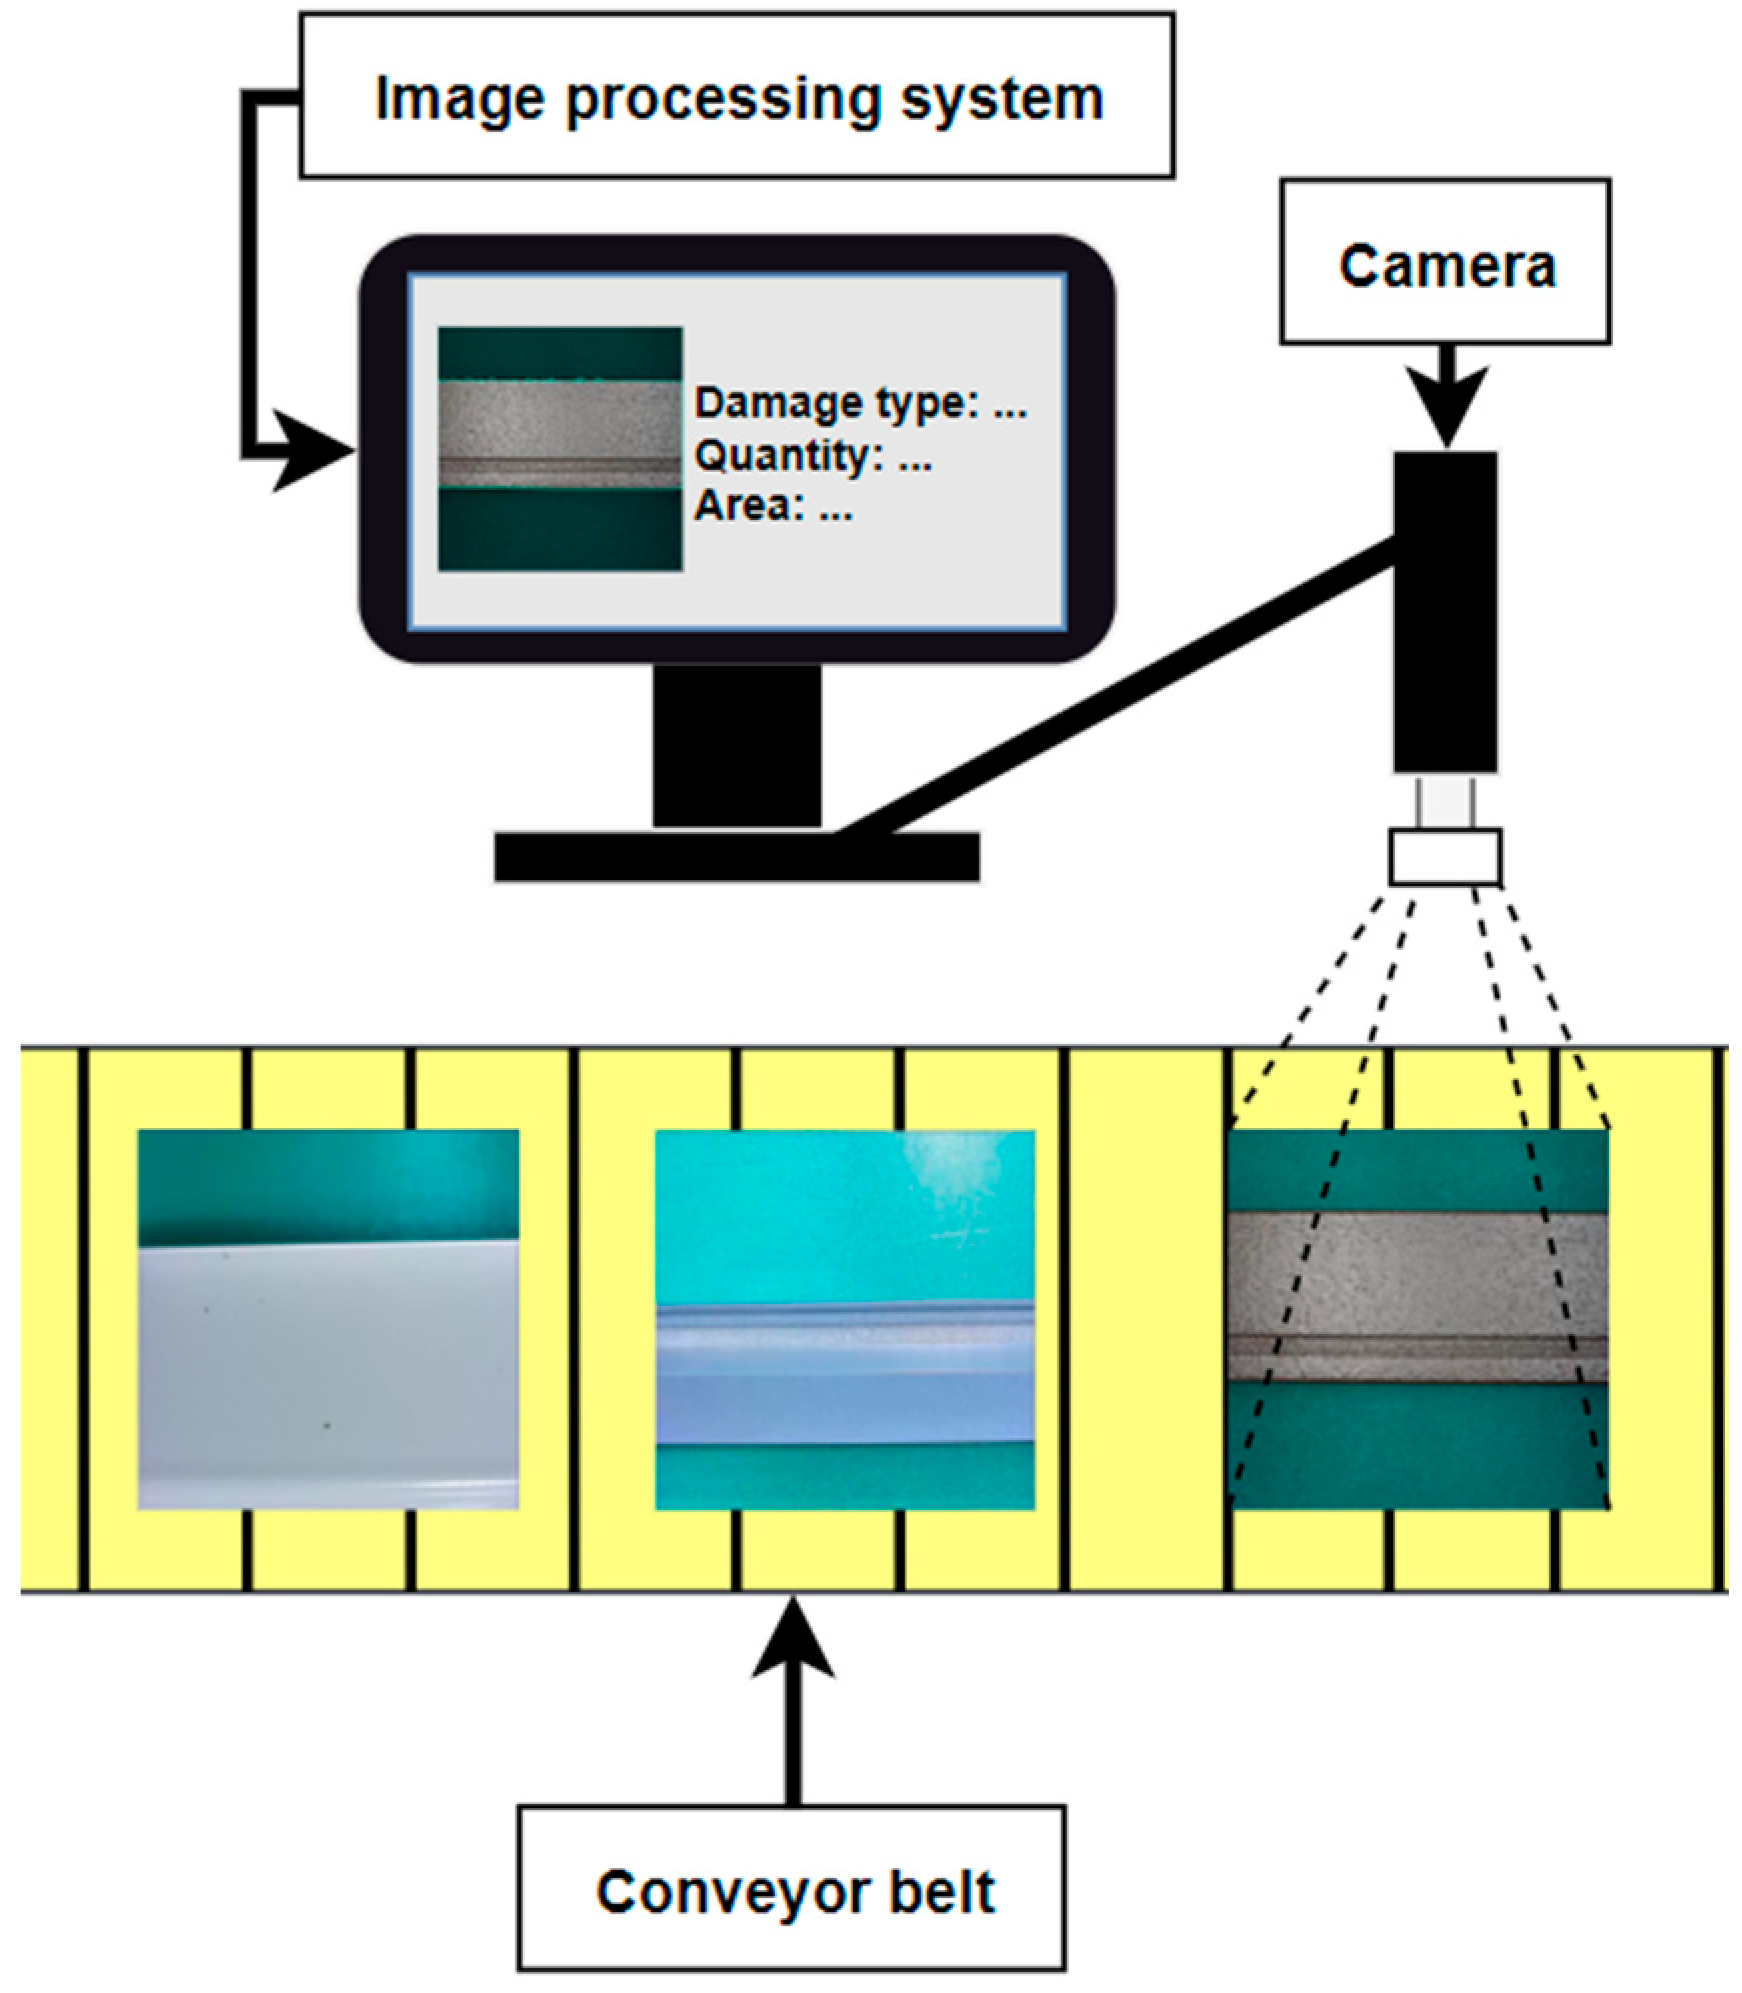
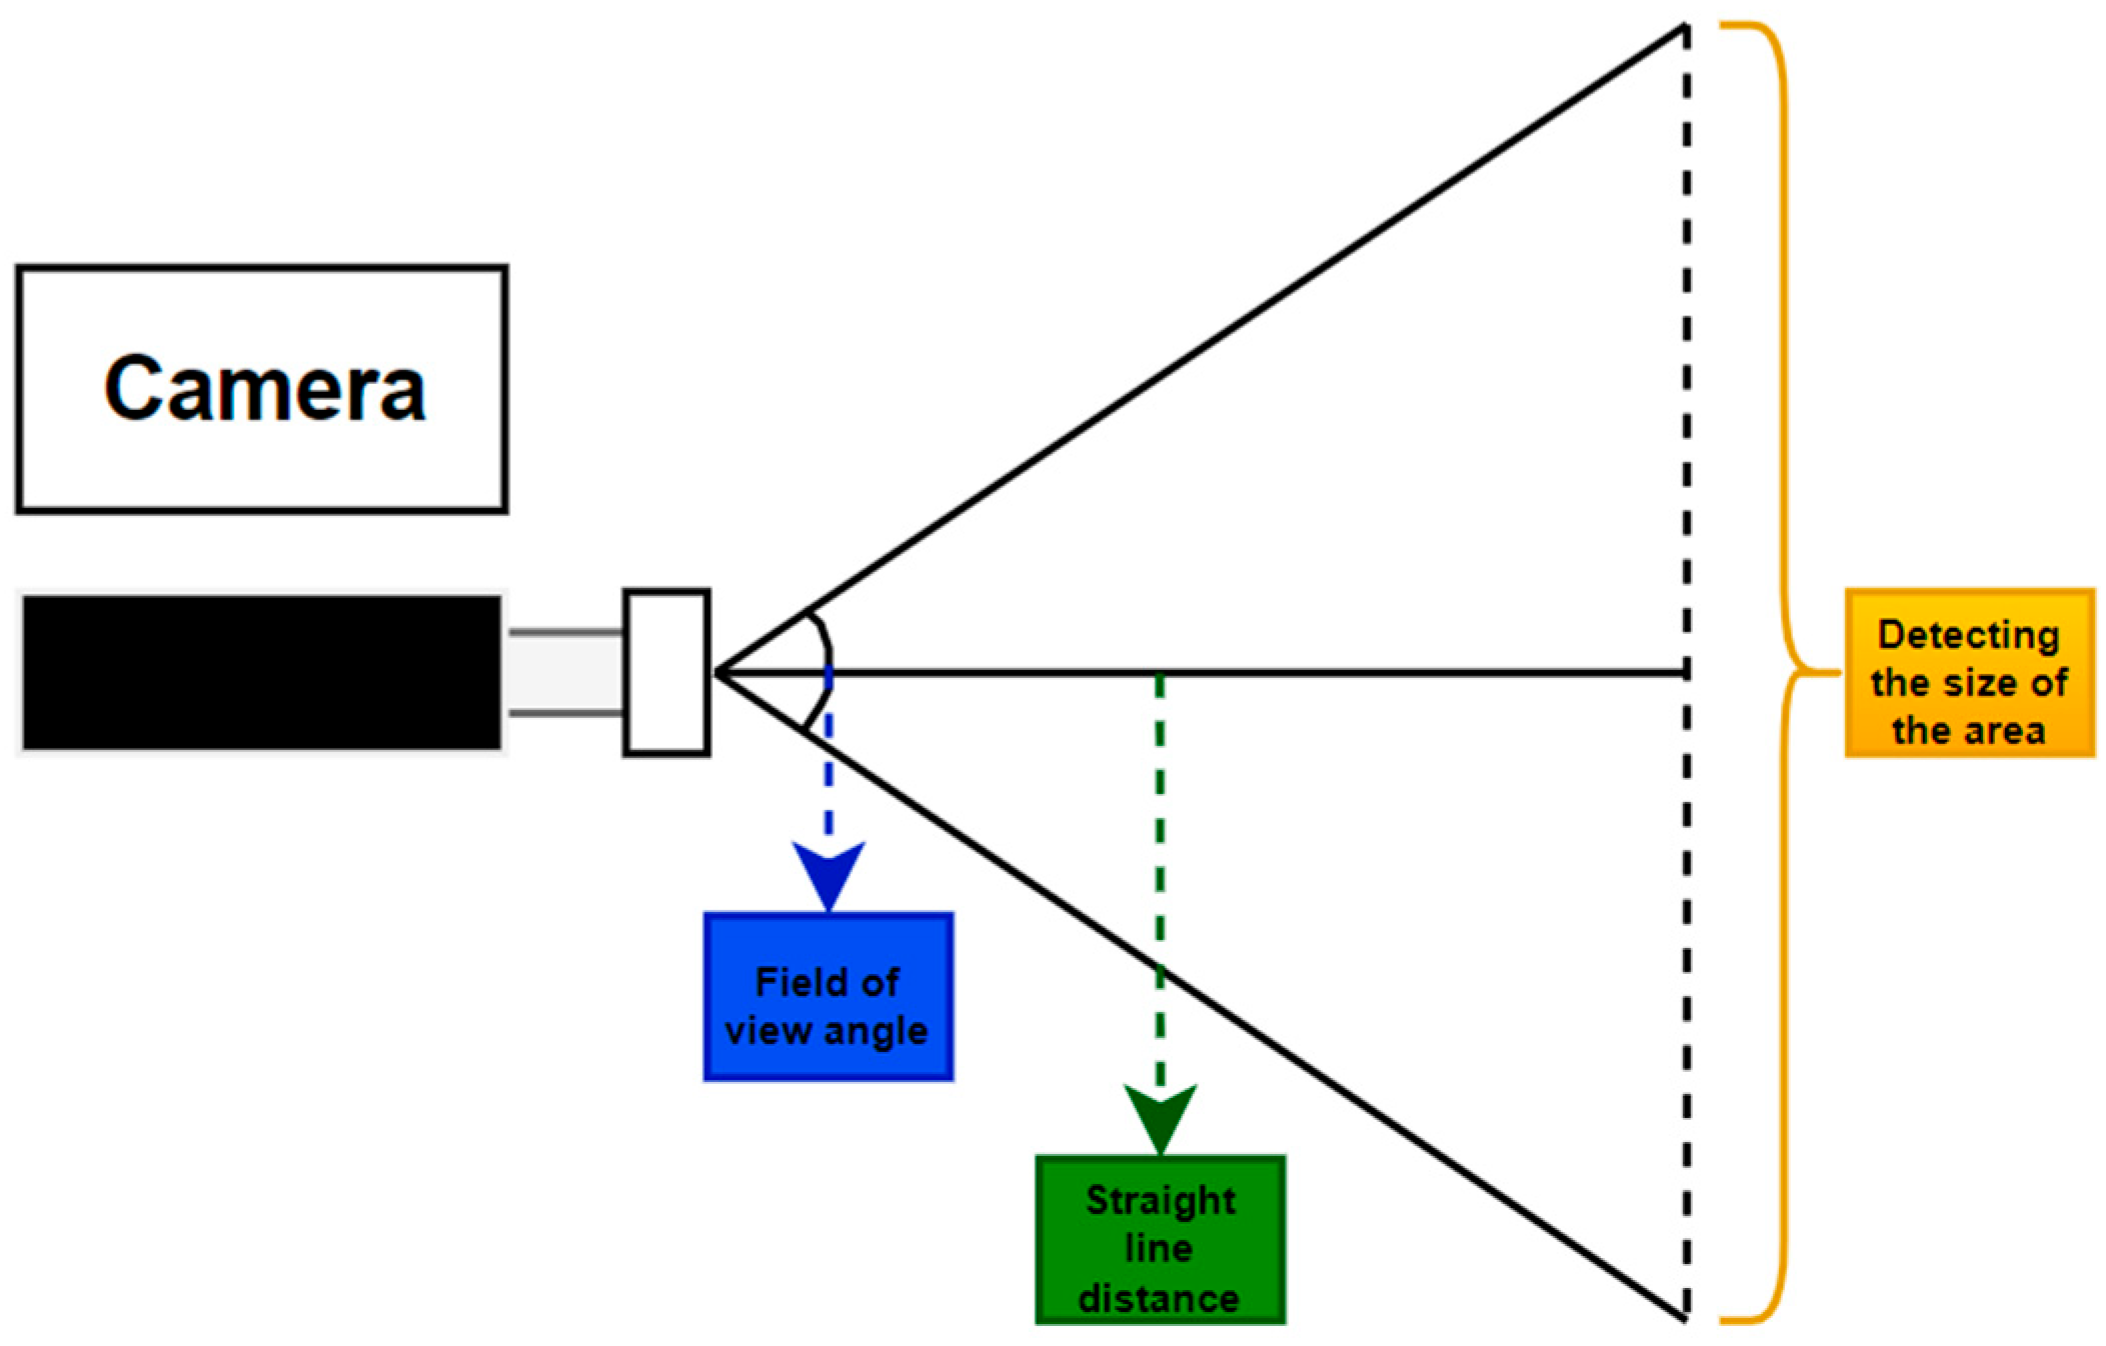
2.1. Methodological Flow and Data Collection
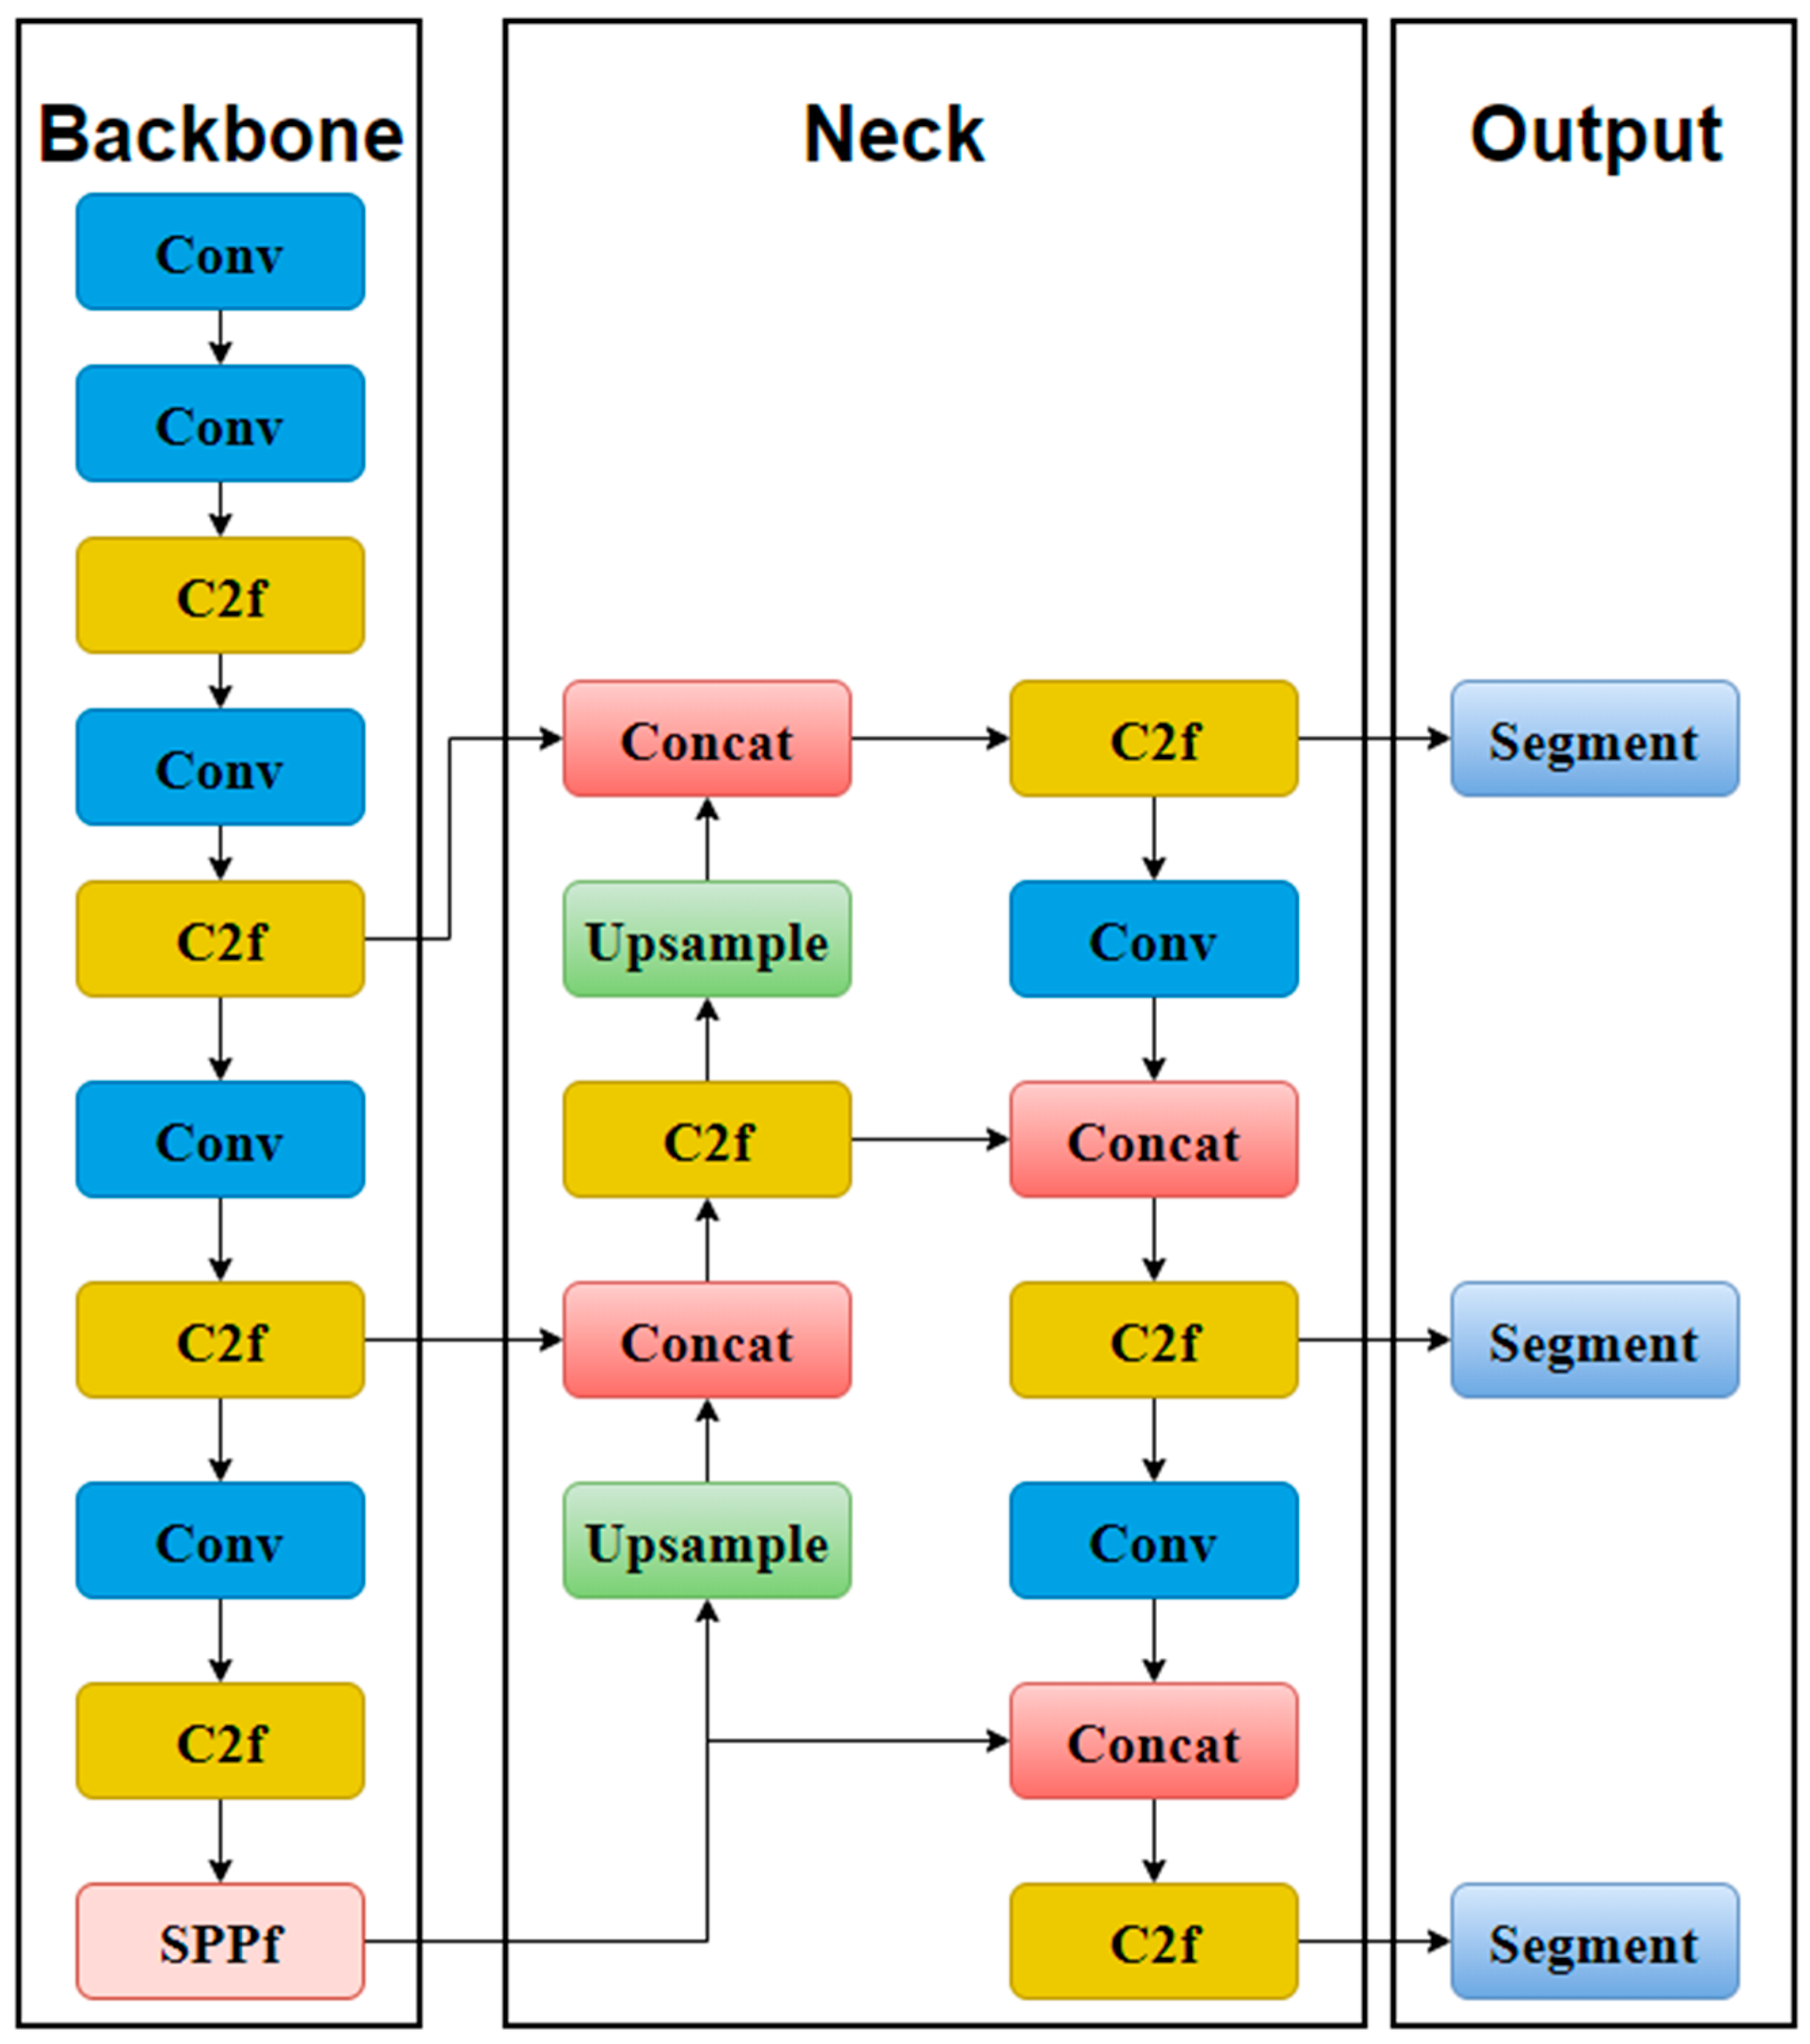
2.2. YOLO Introduction
2.3. Construction of ALdamage-seg
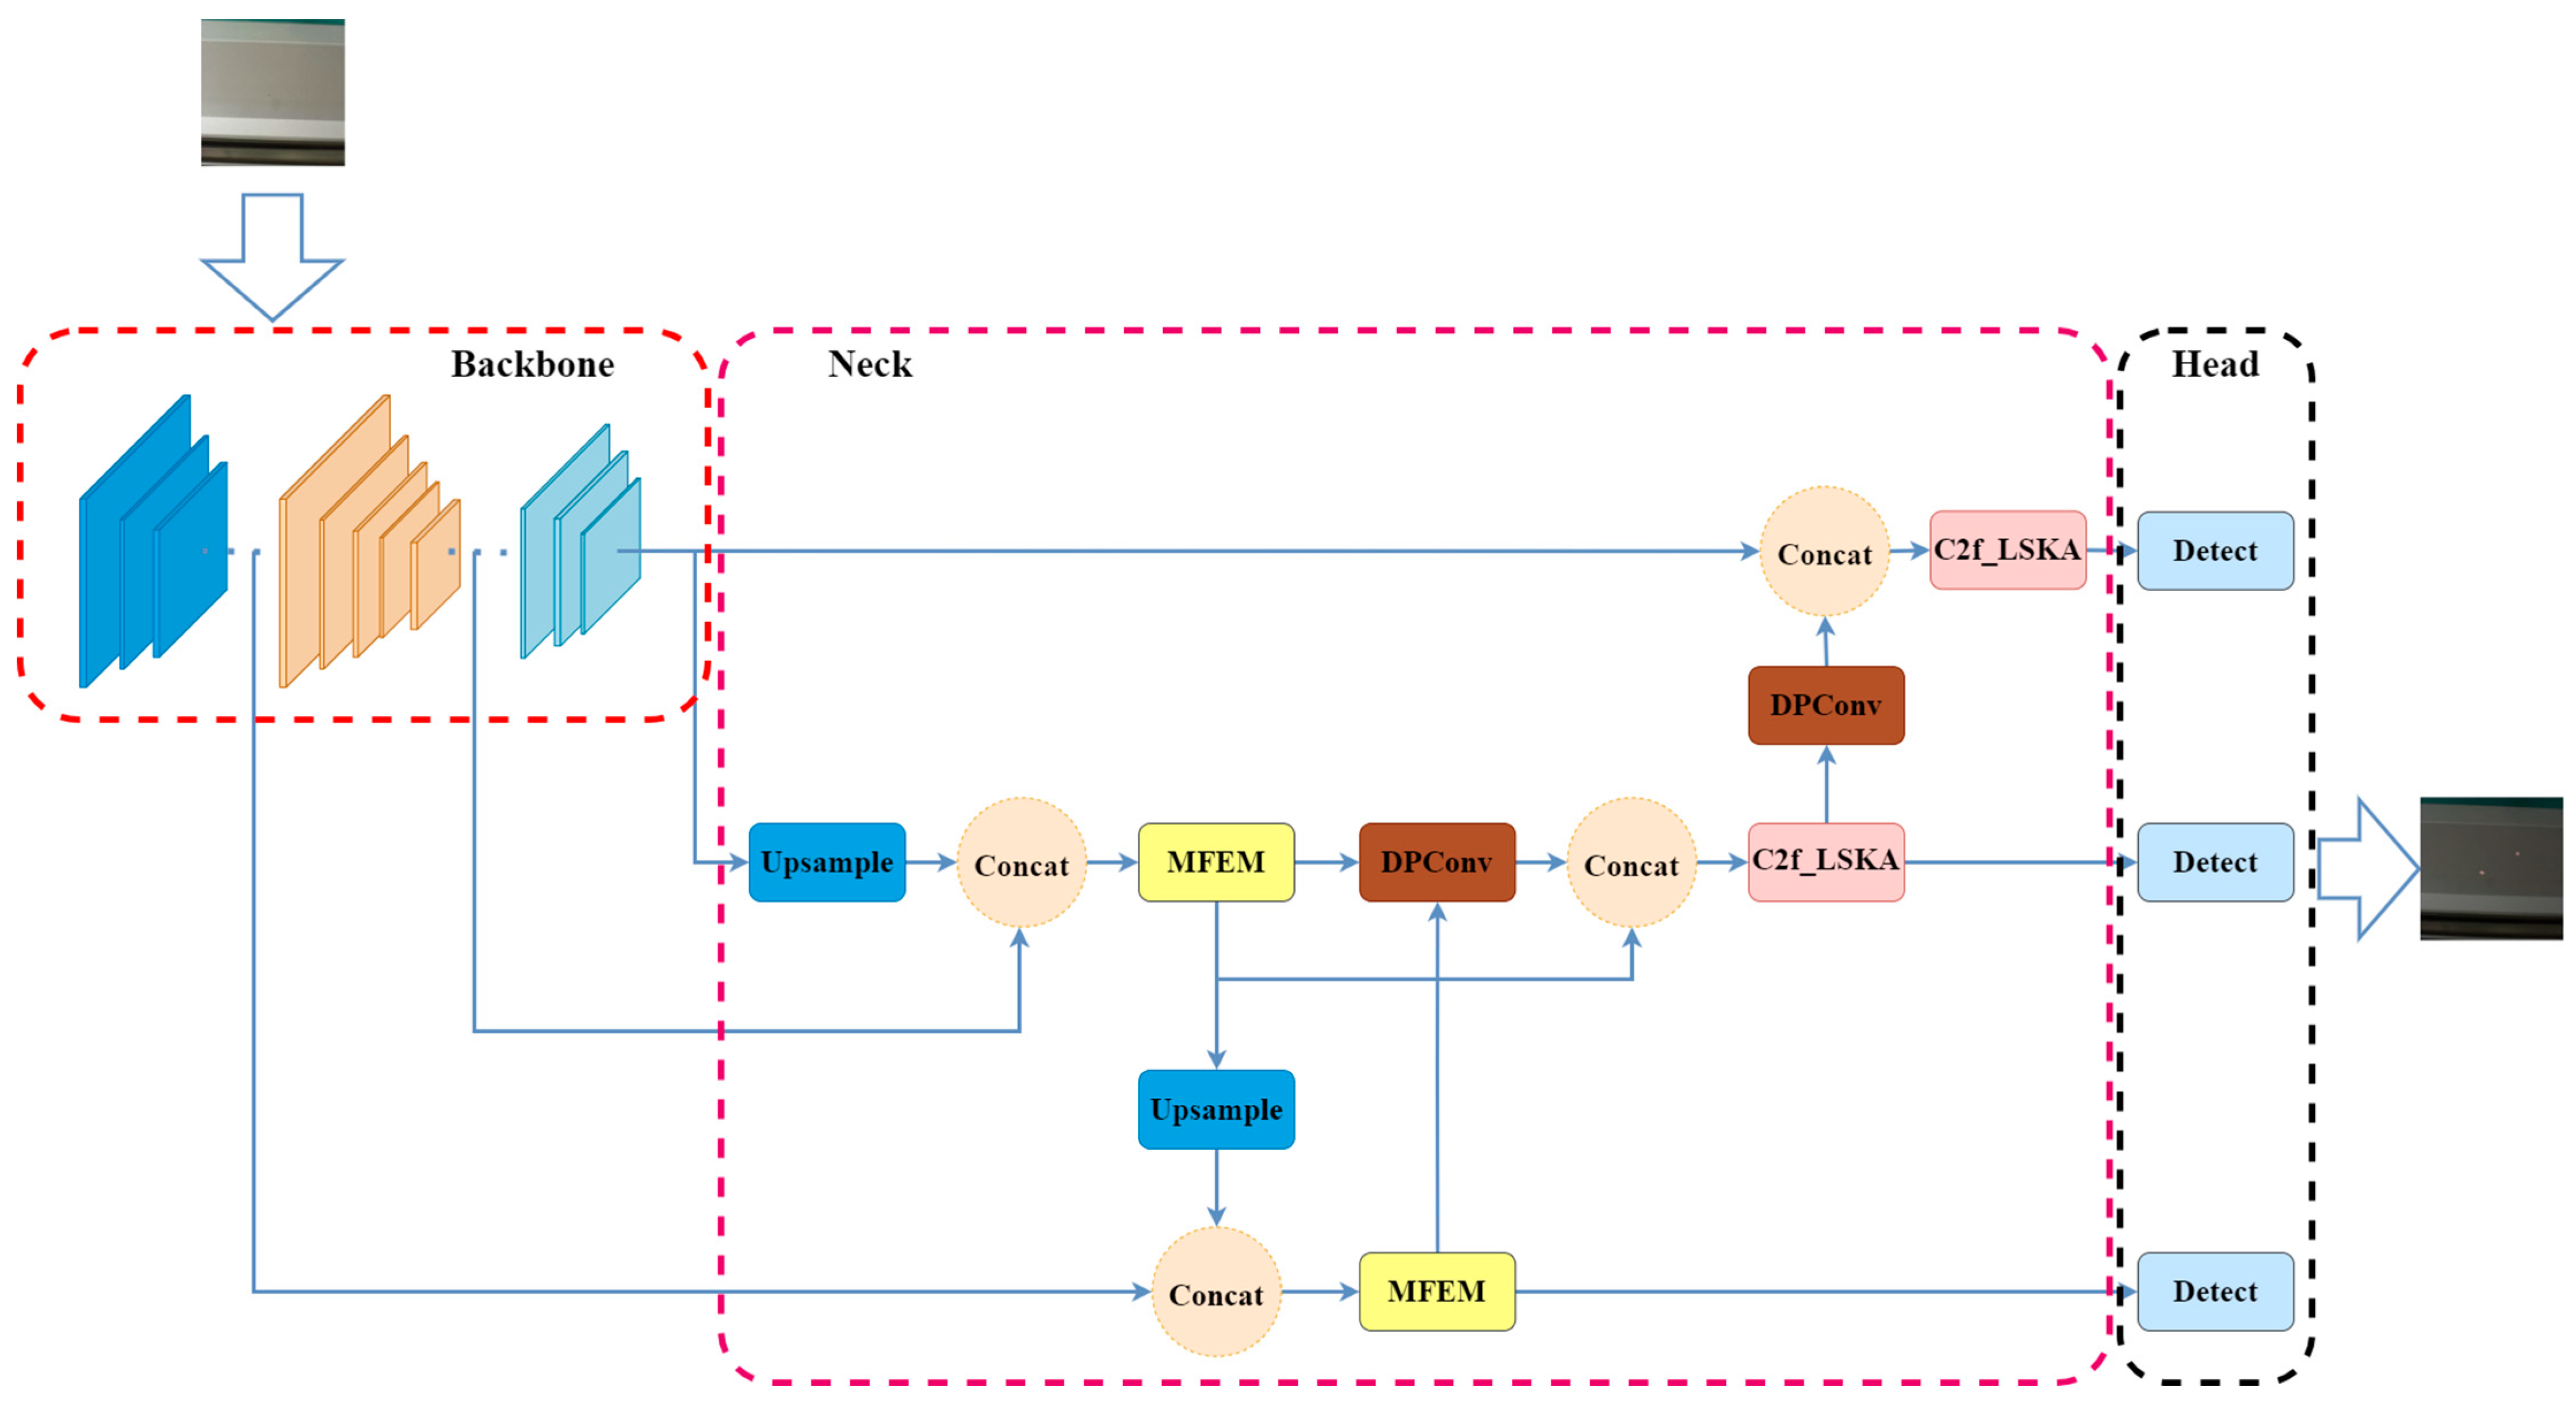
2.3.1. General Architecture
2.3.2. Backbone
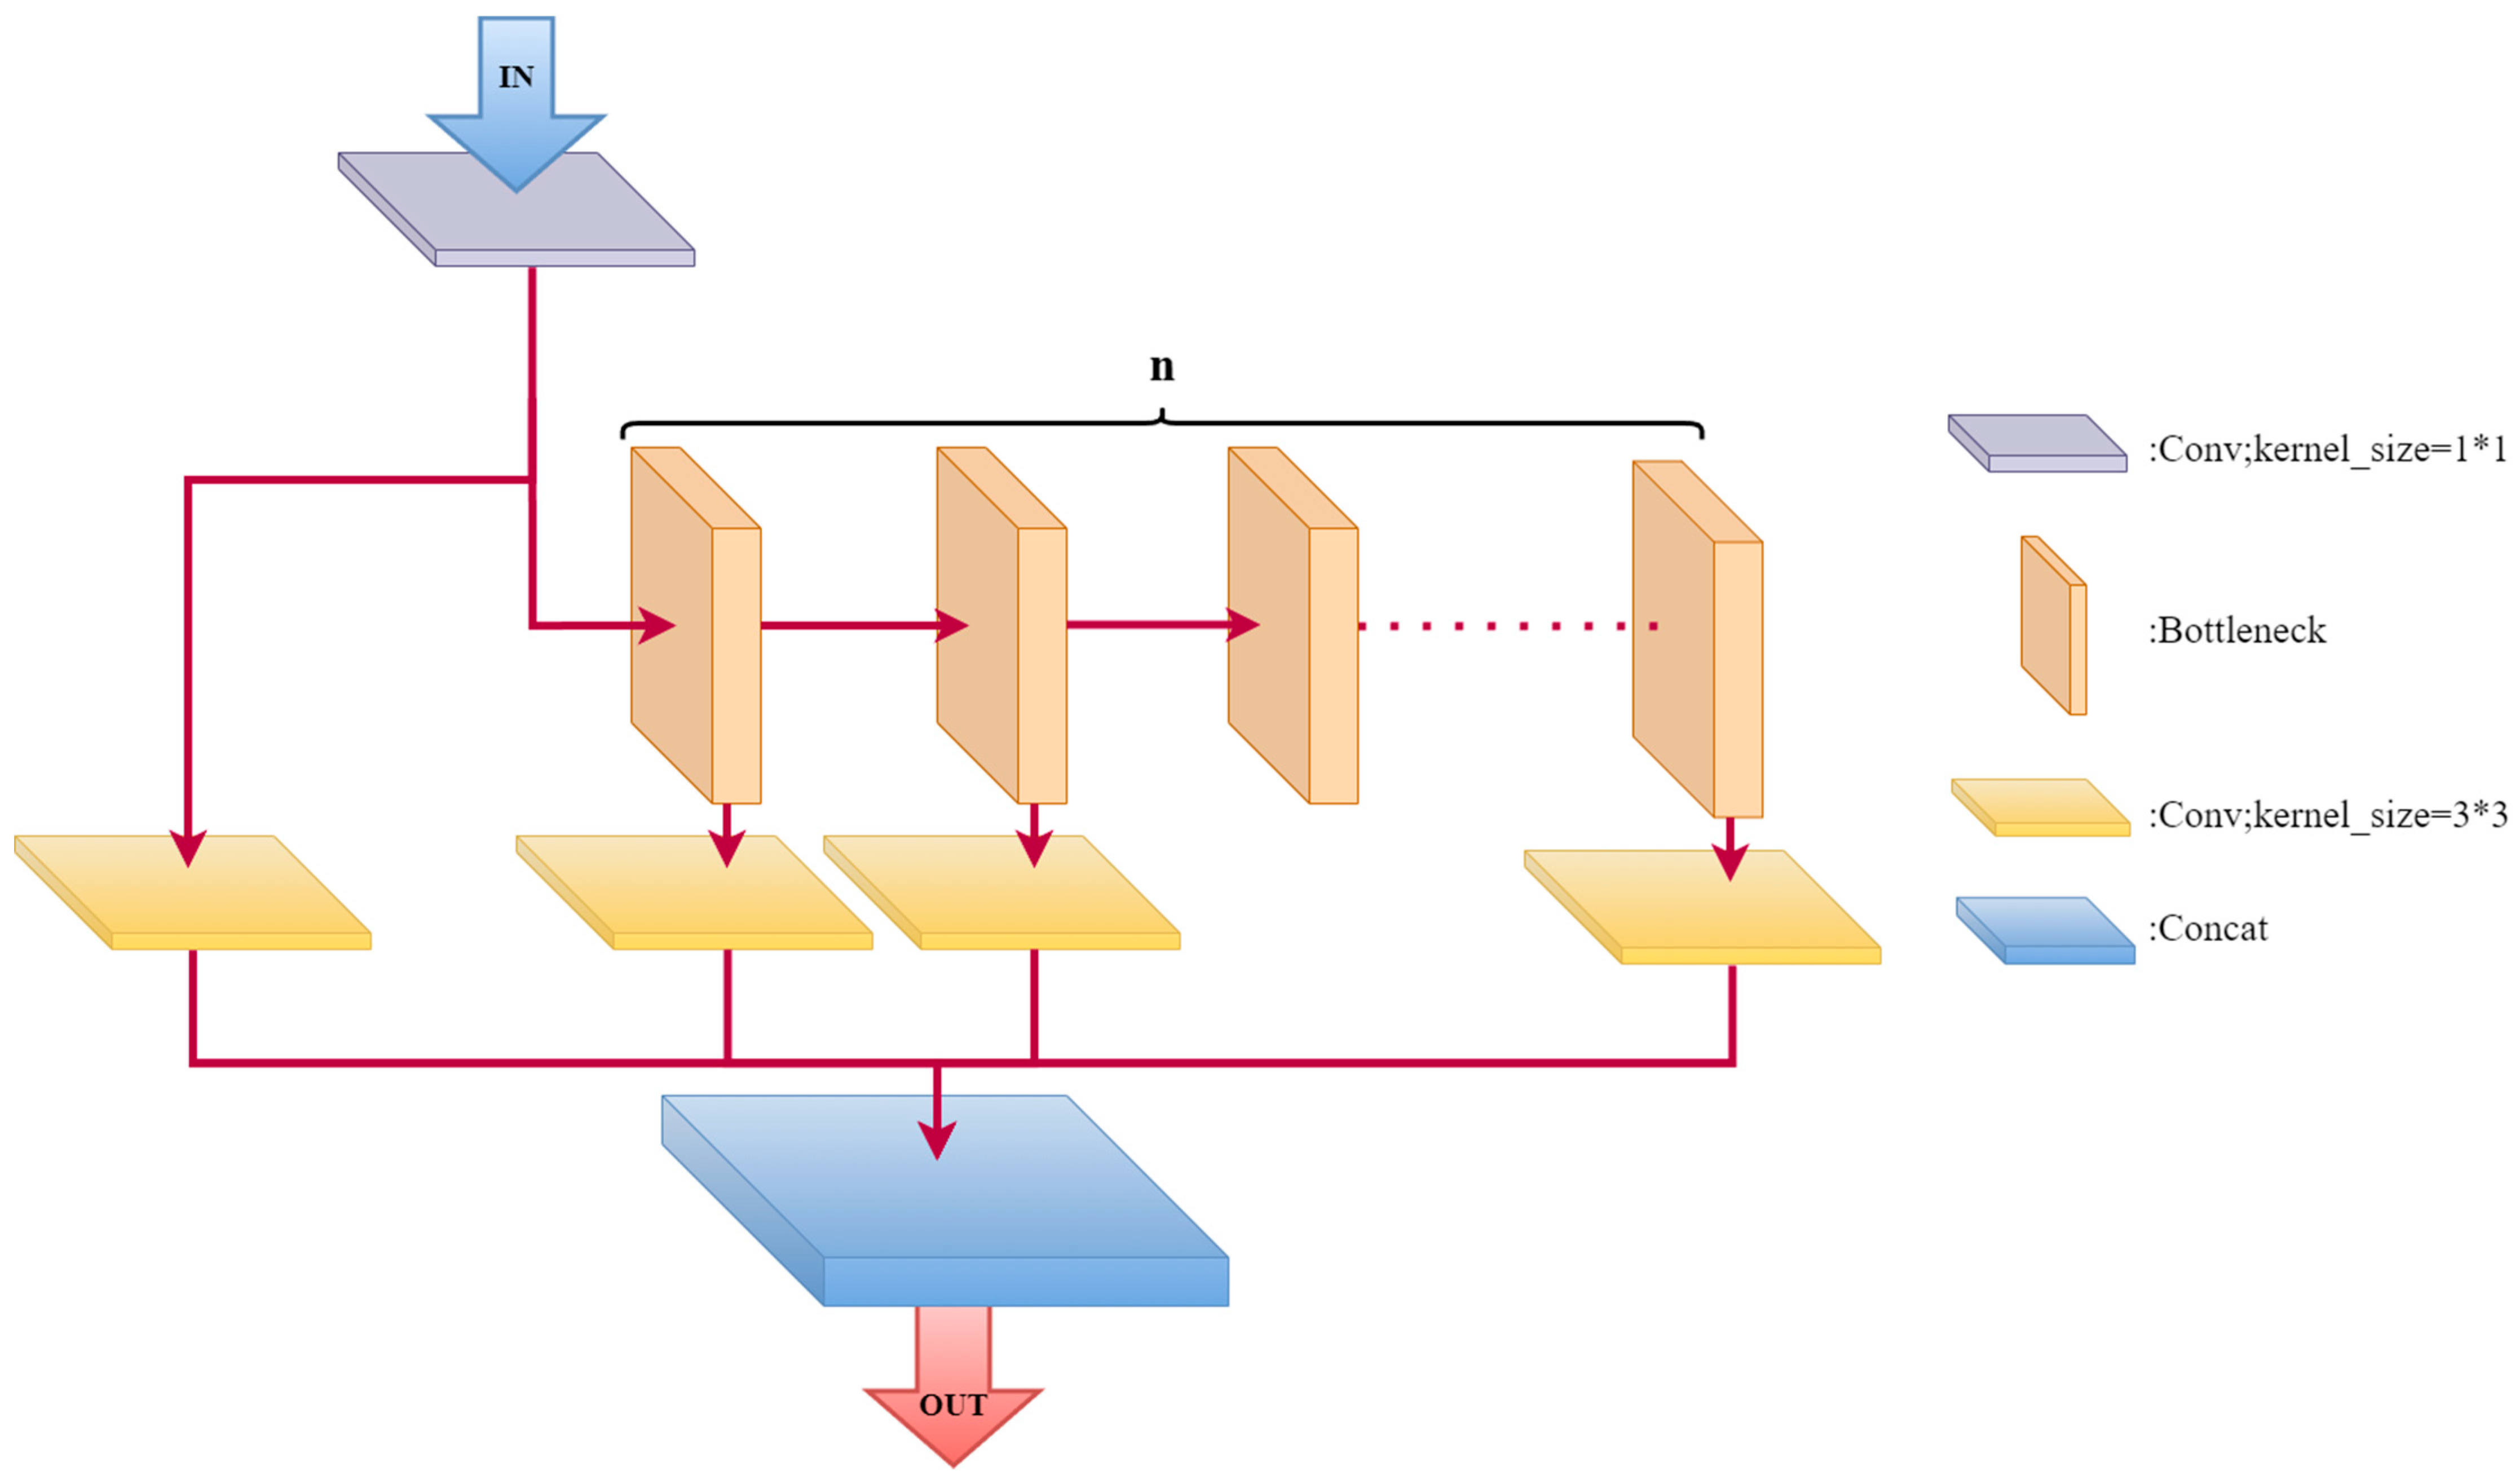
2.3.3. MFEM Module
2.3.4. DPConv
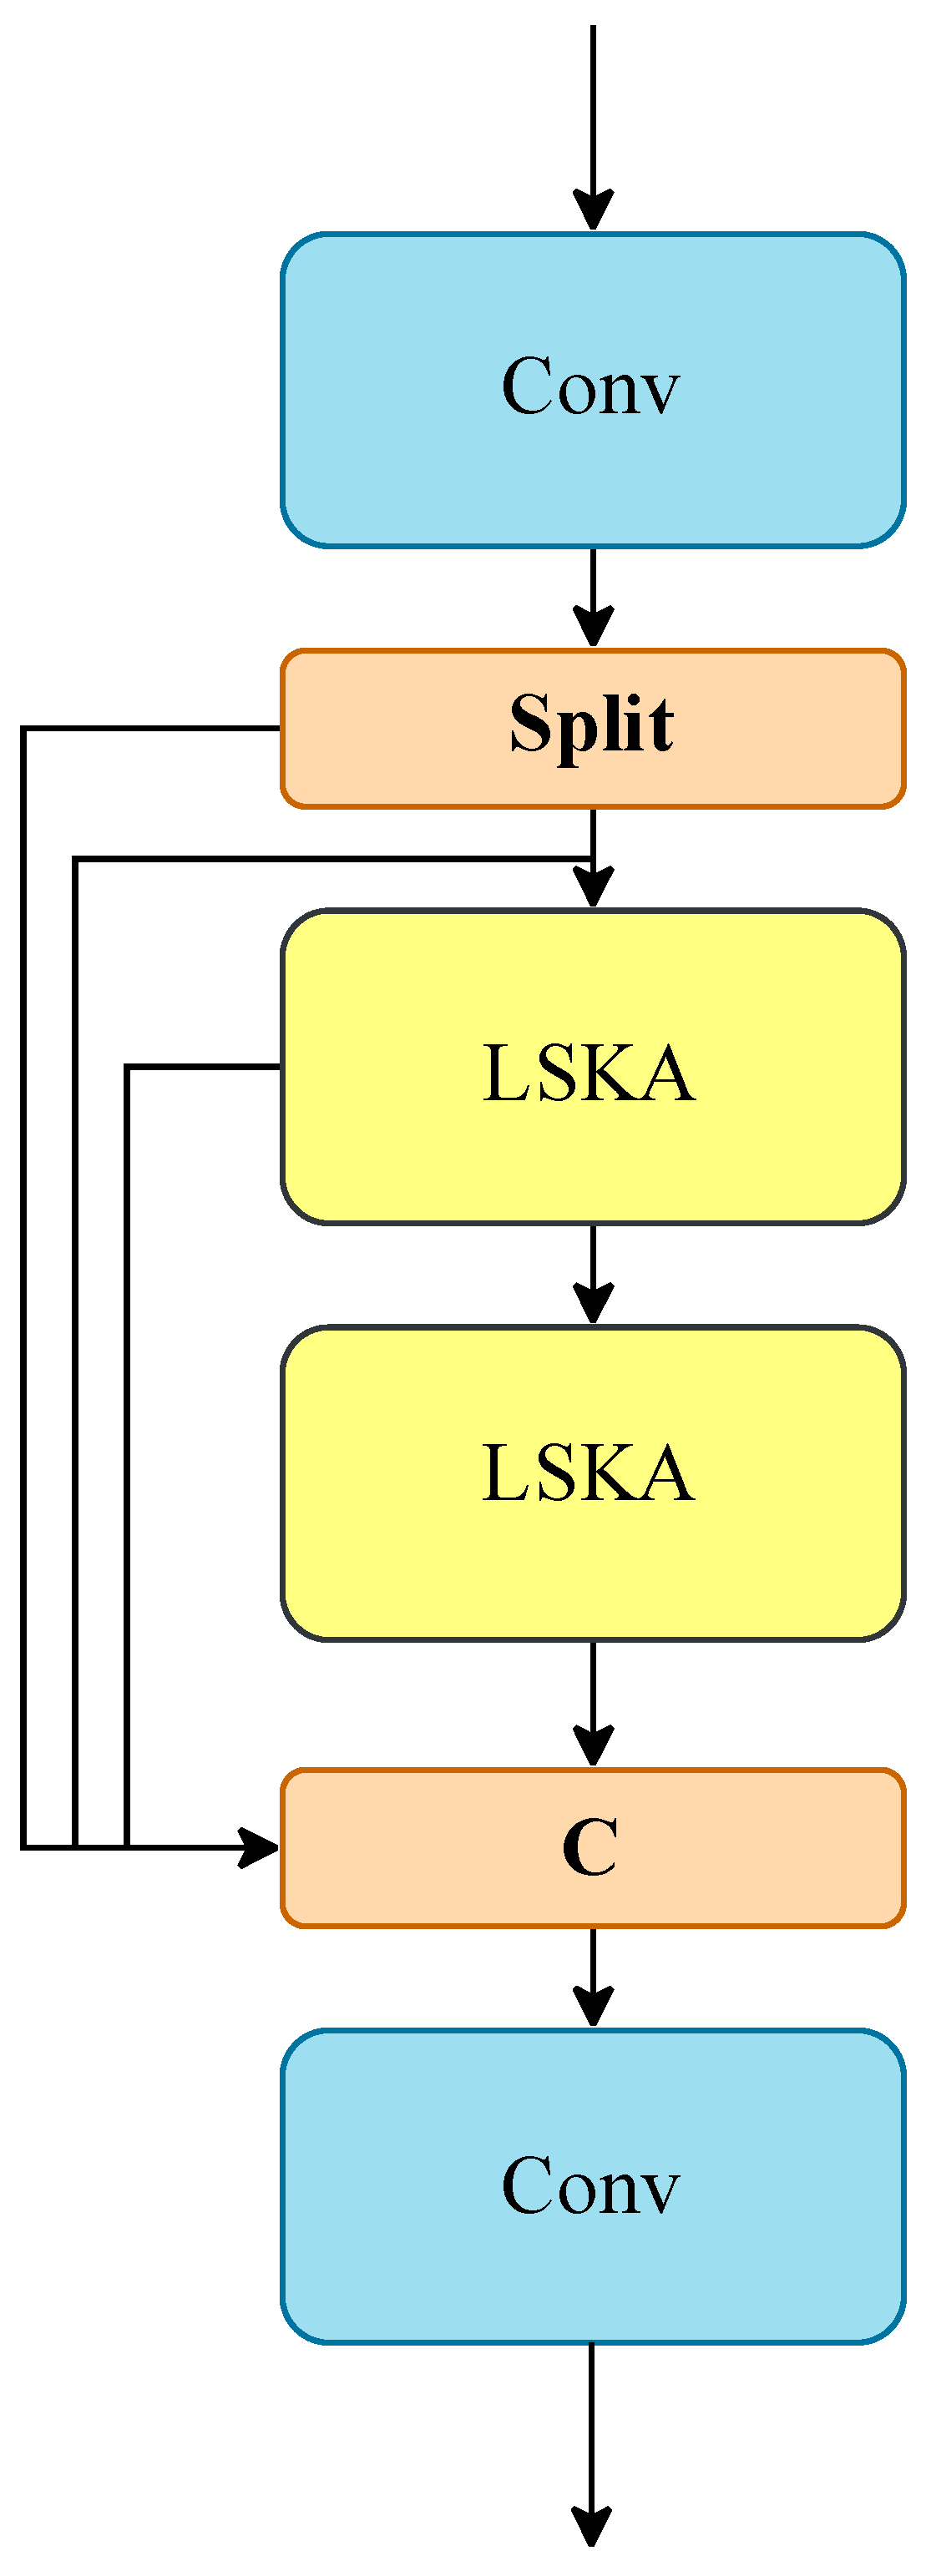
2.3.5. C2f_LSKA: LSKA Attention Mechanism Fusion Part
3. Training and Testing Results
3.1. Data Set and Experiment Setup
3.2. Evaluations Metrics
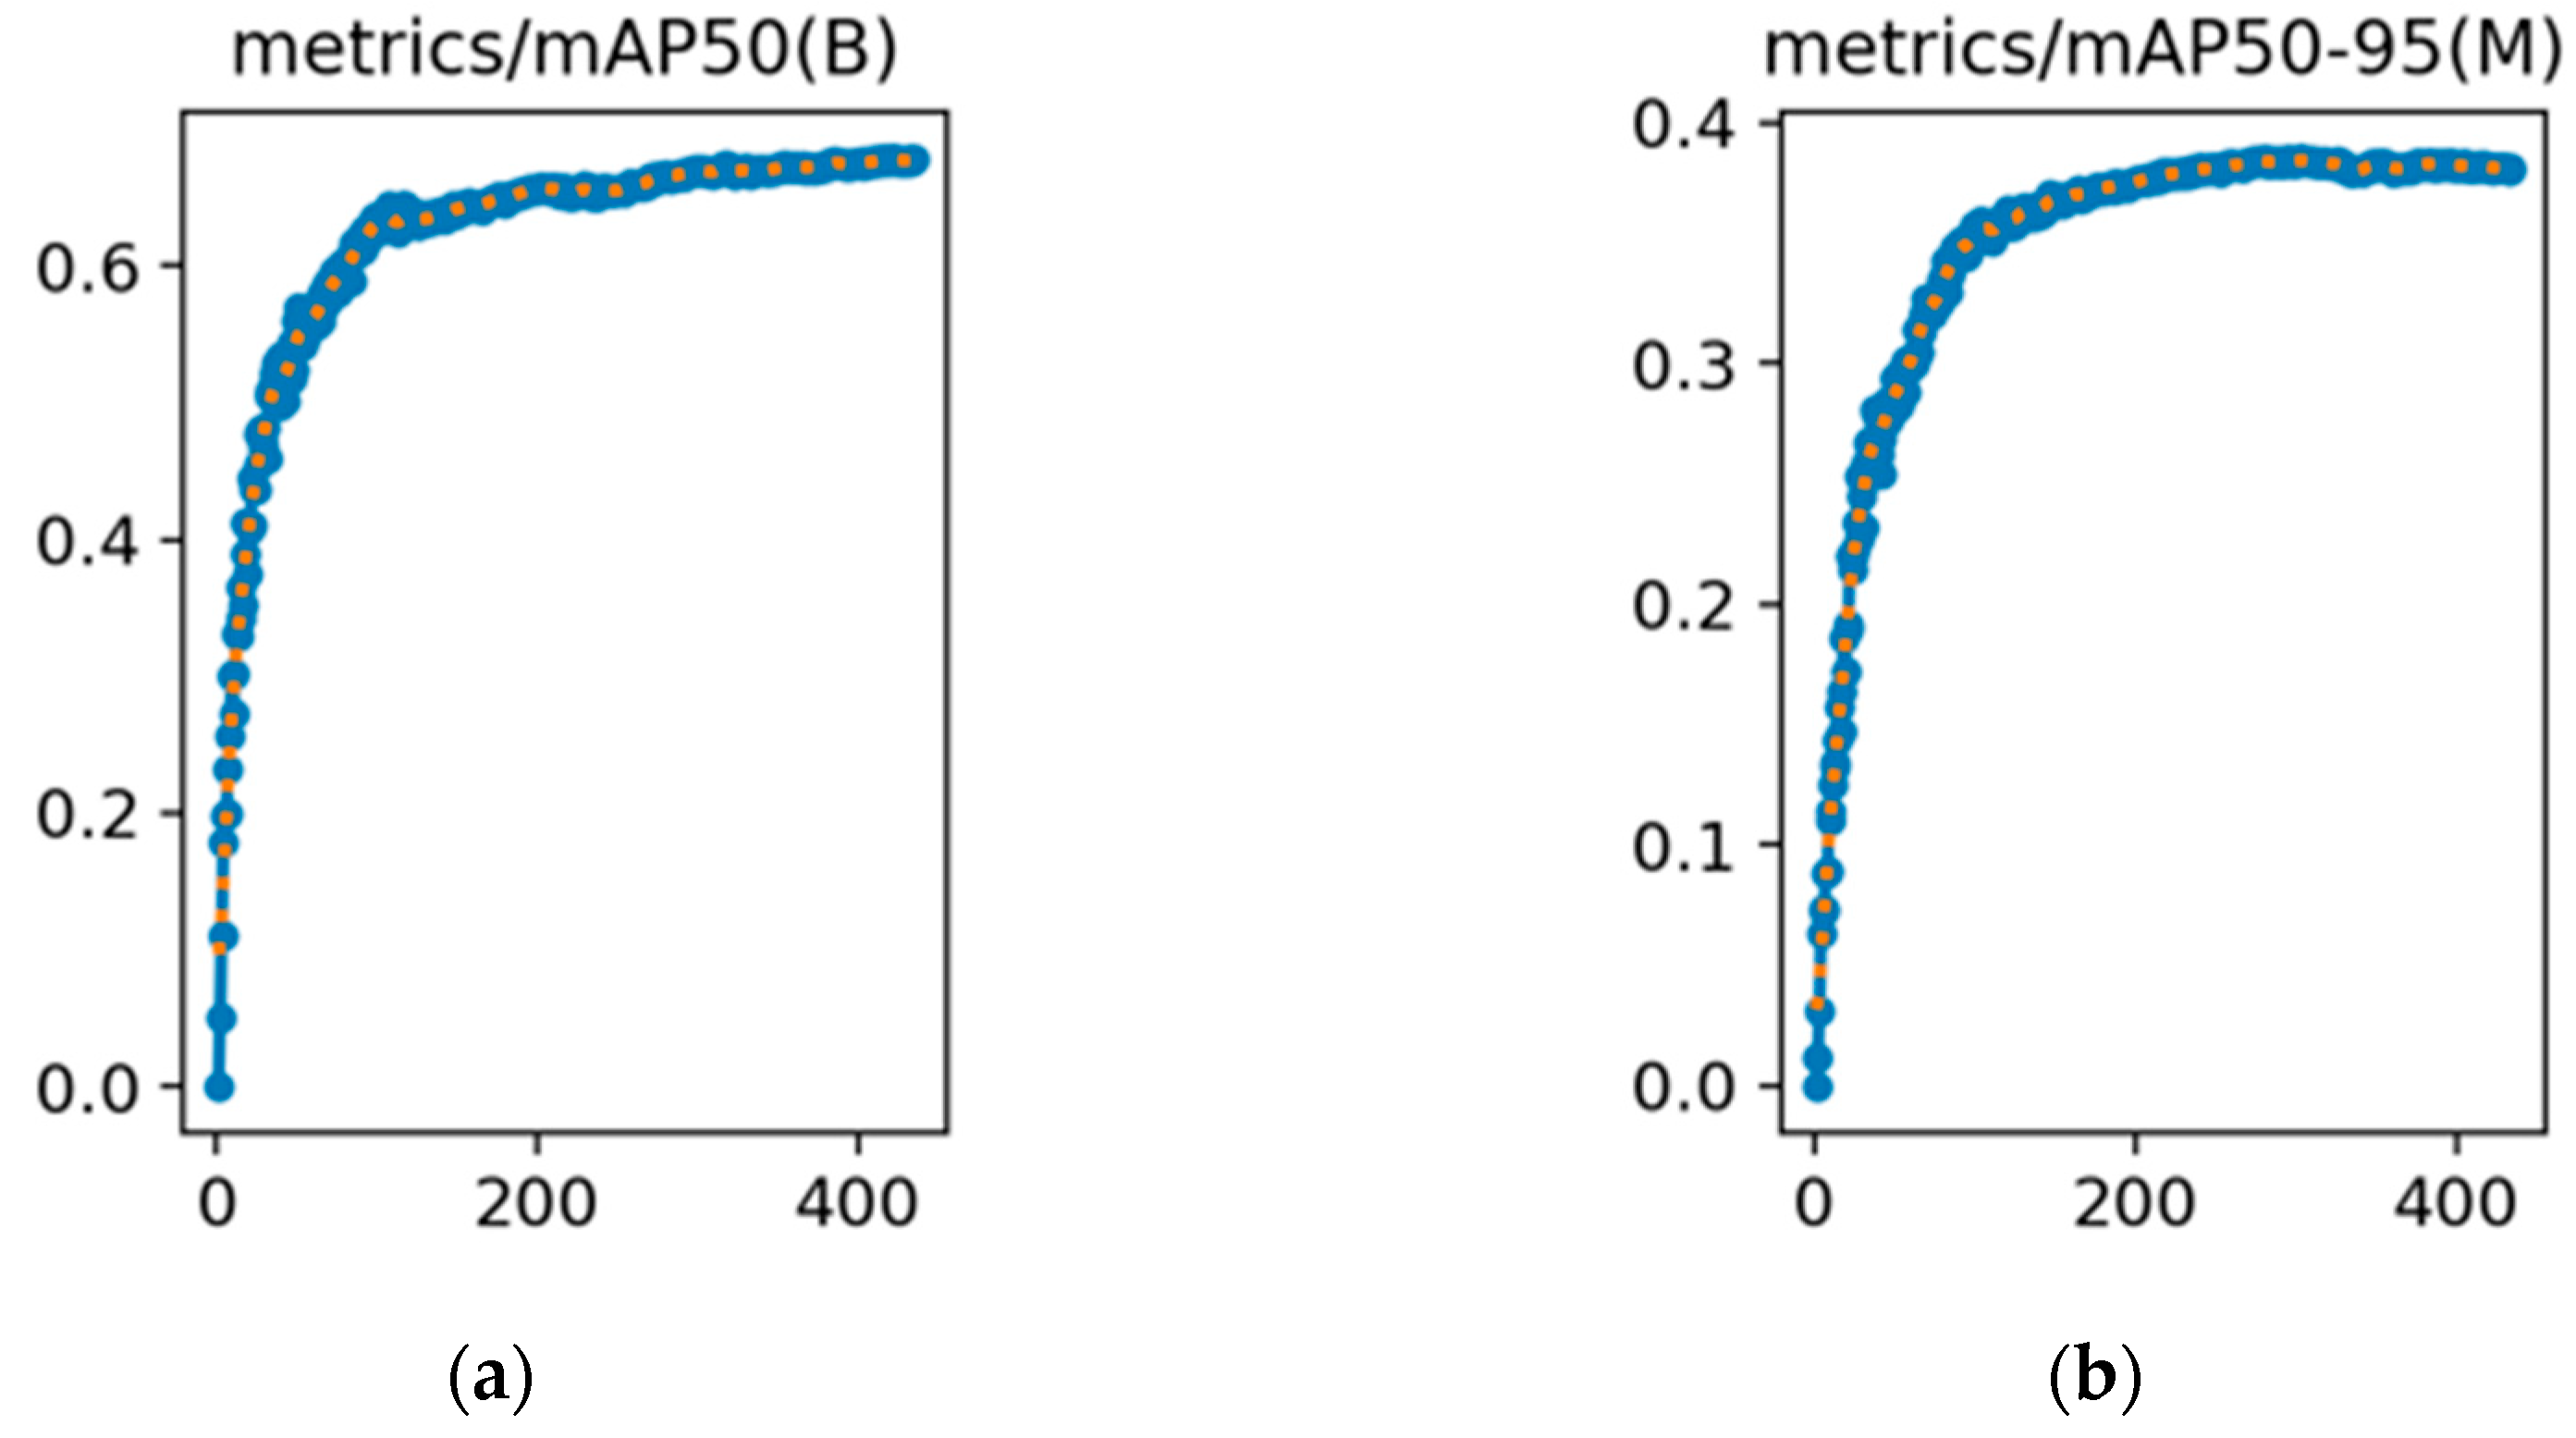
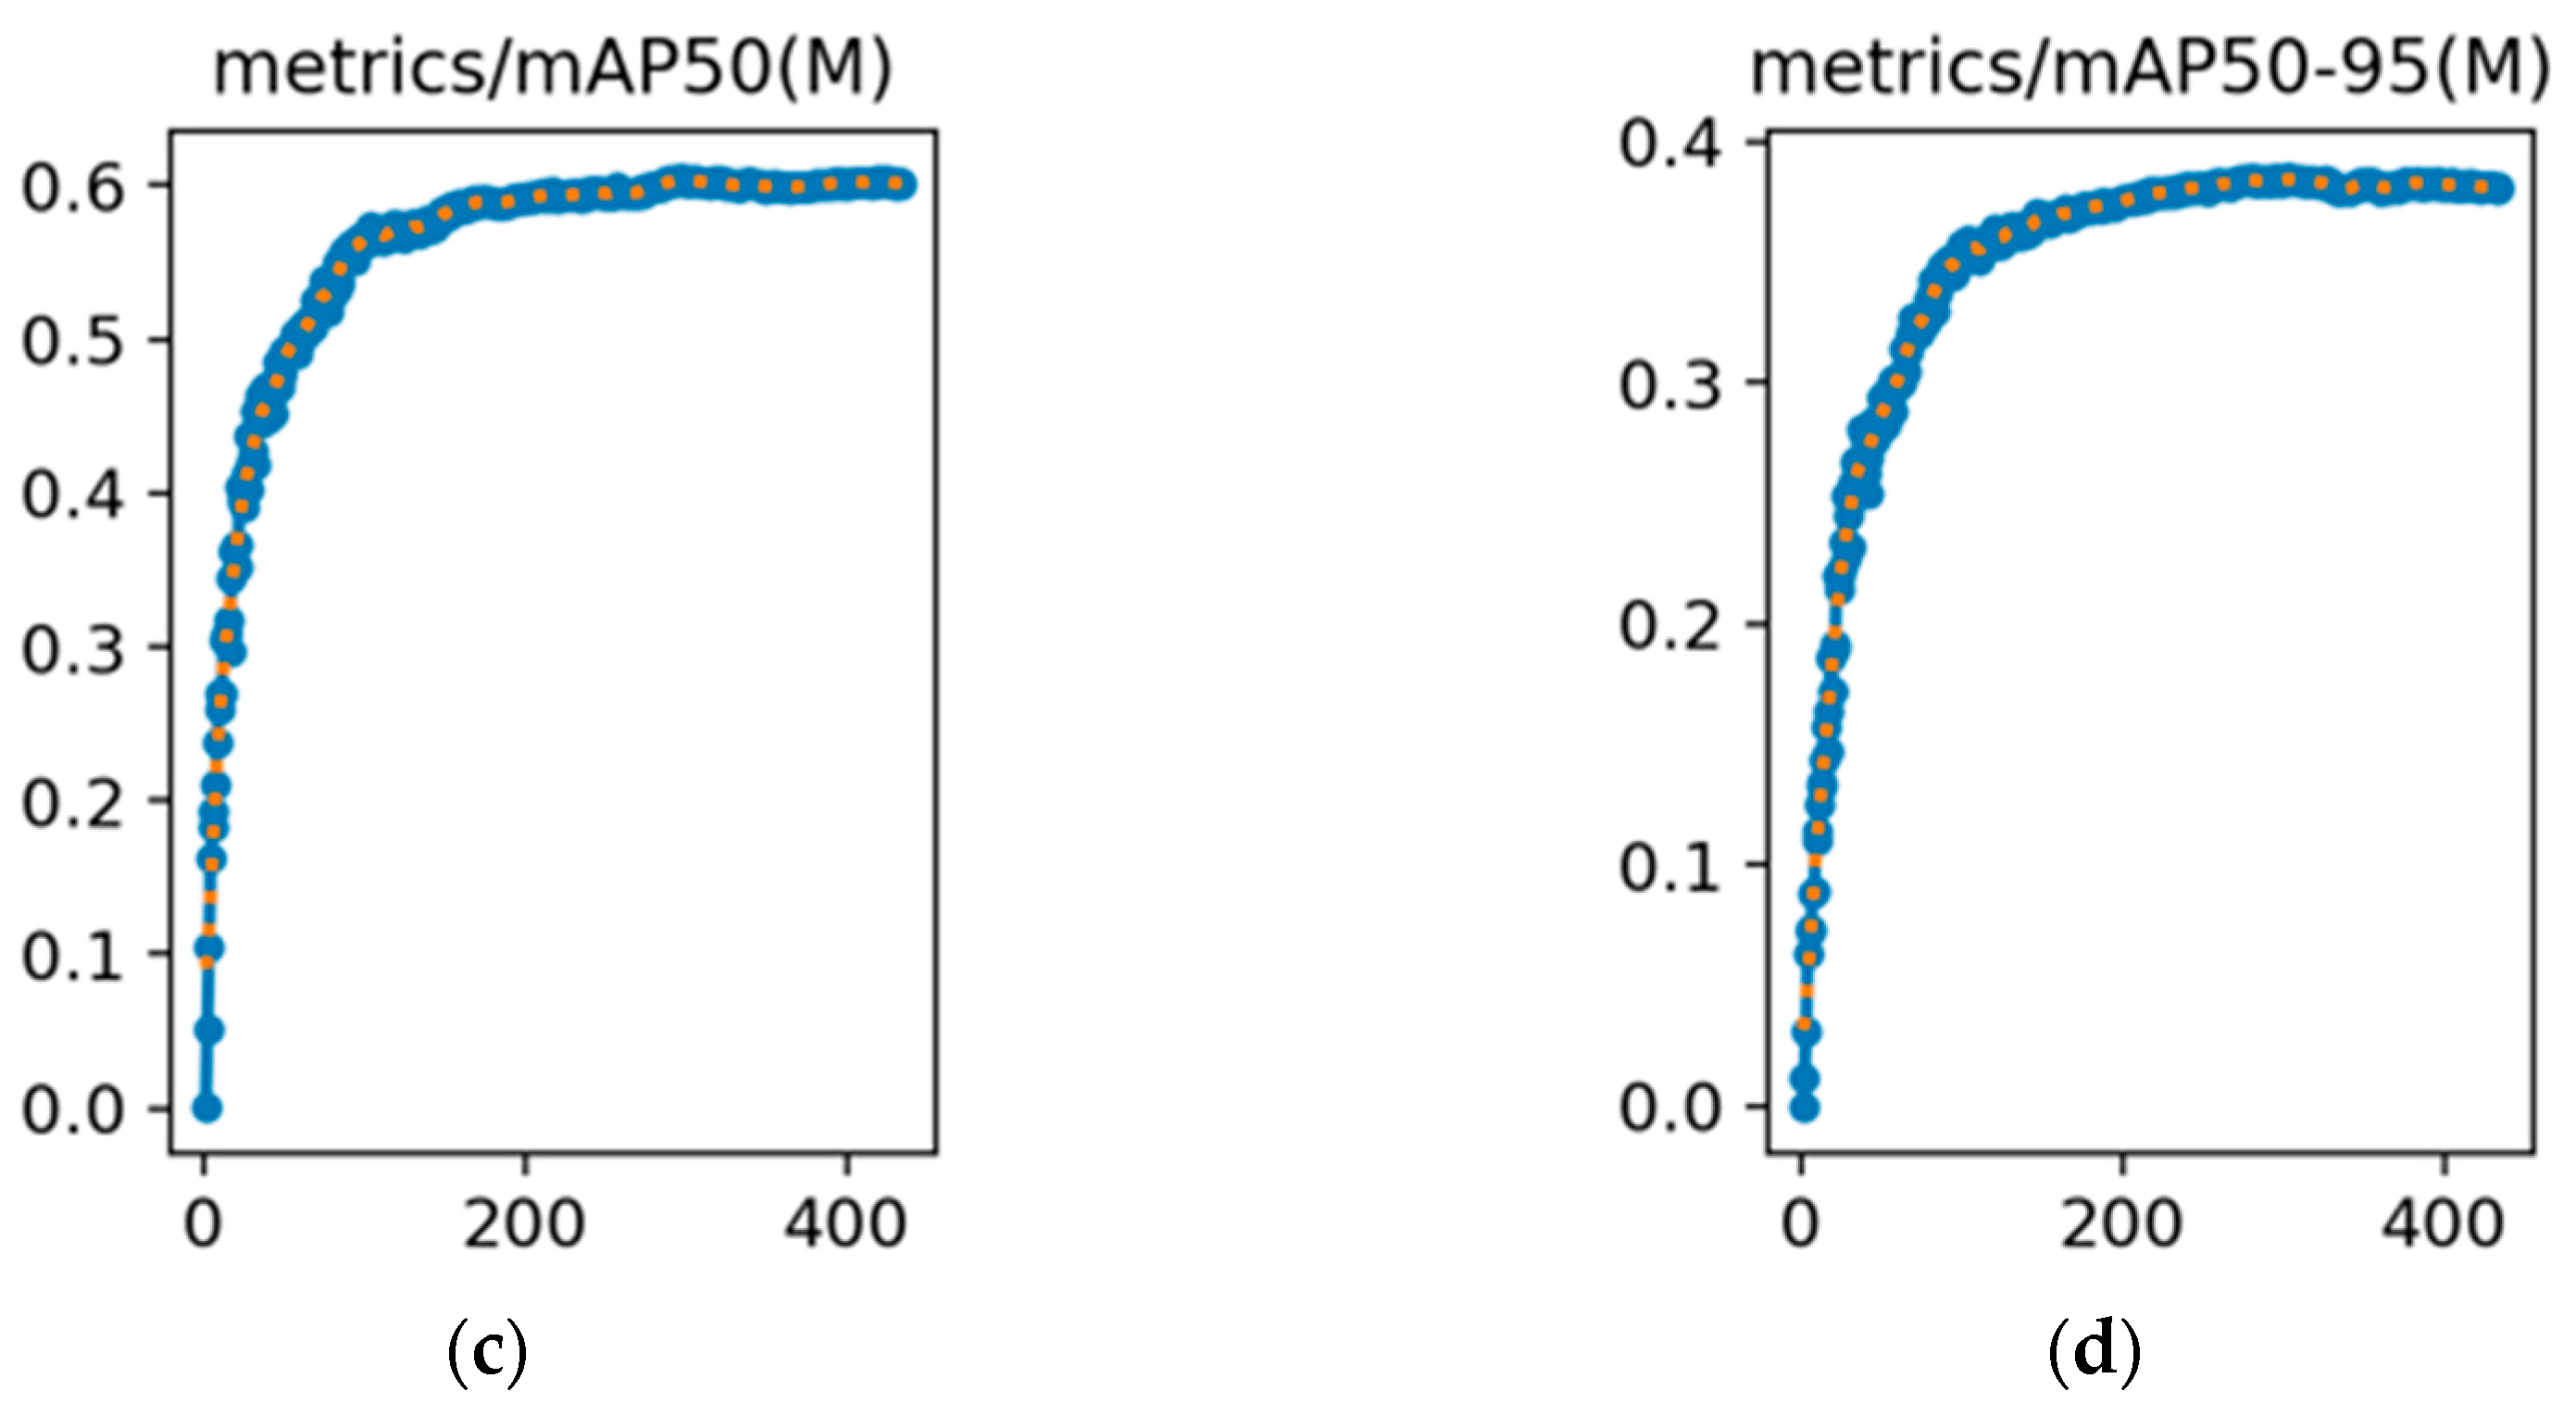
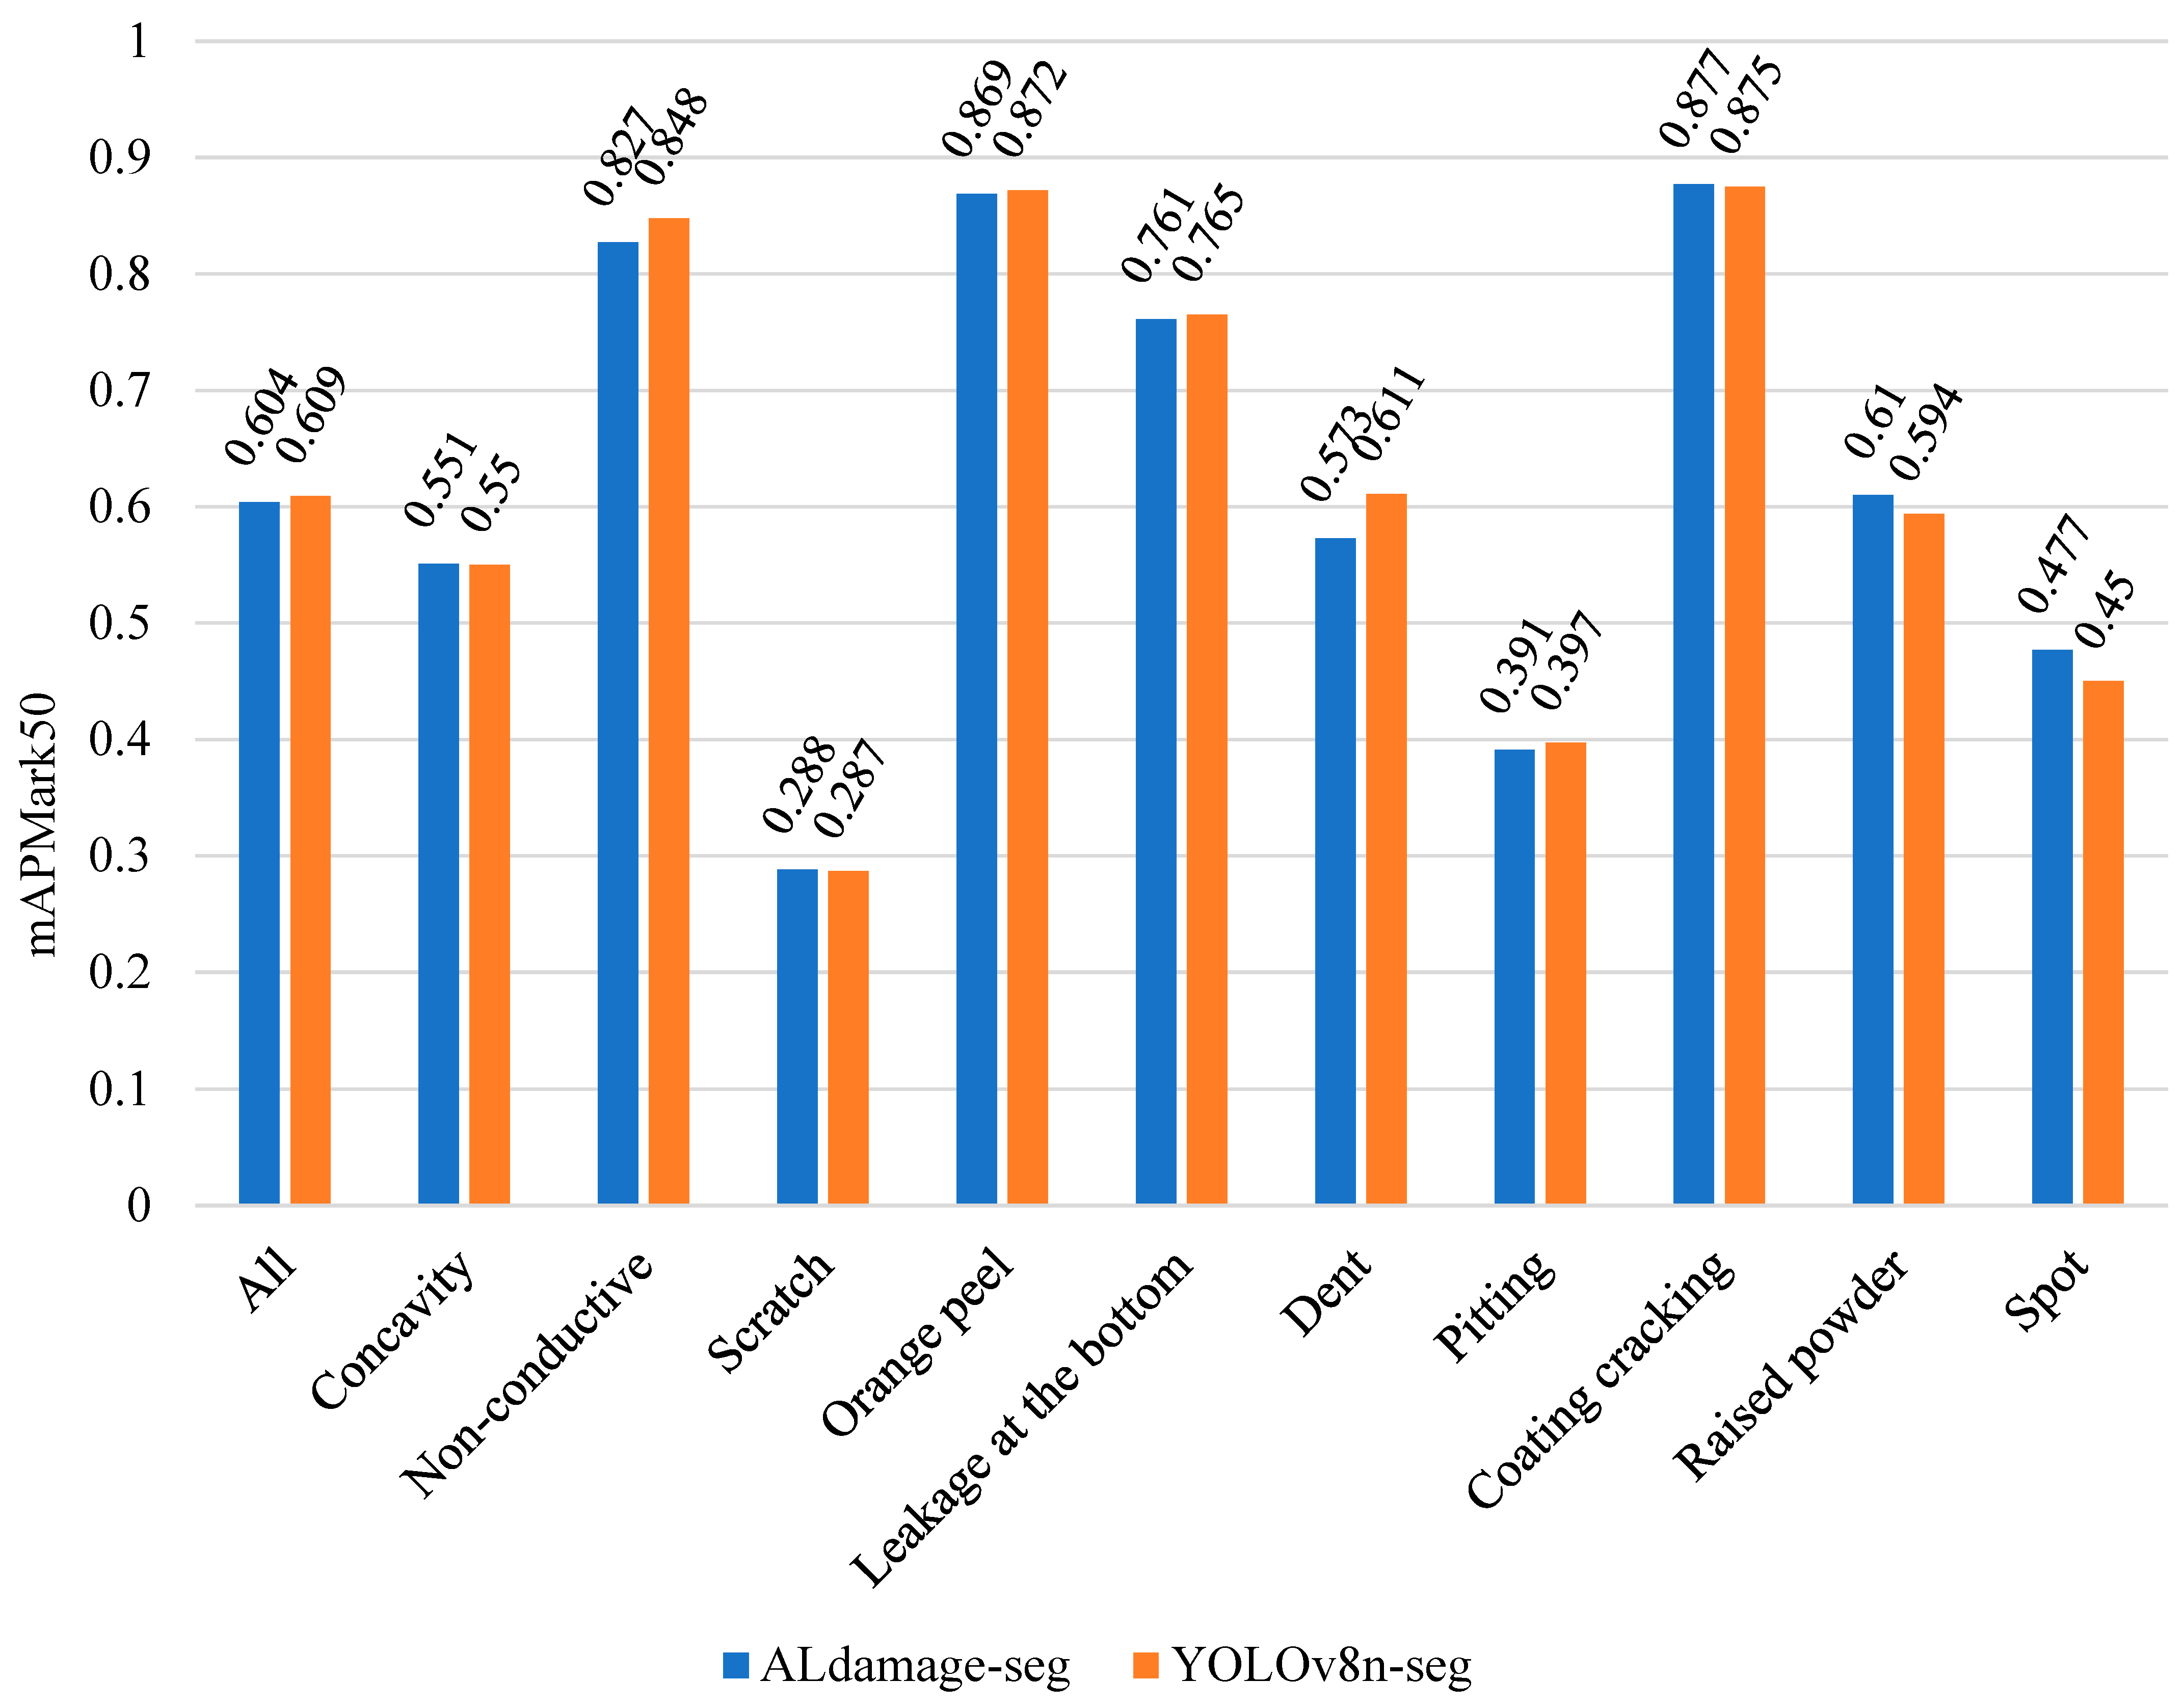
3.3. Experimental Results
3.4. Ablation Experiment
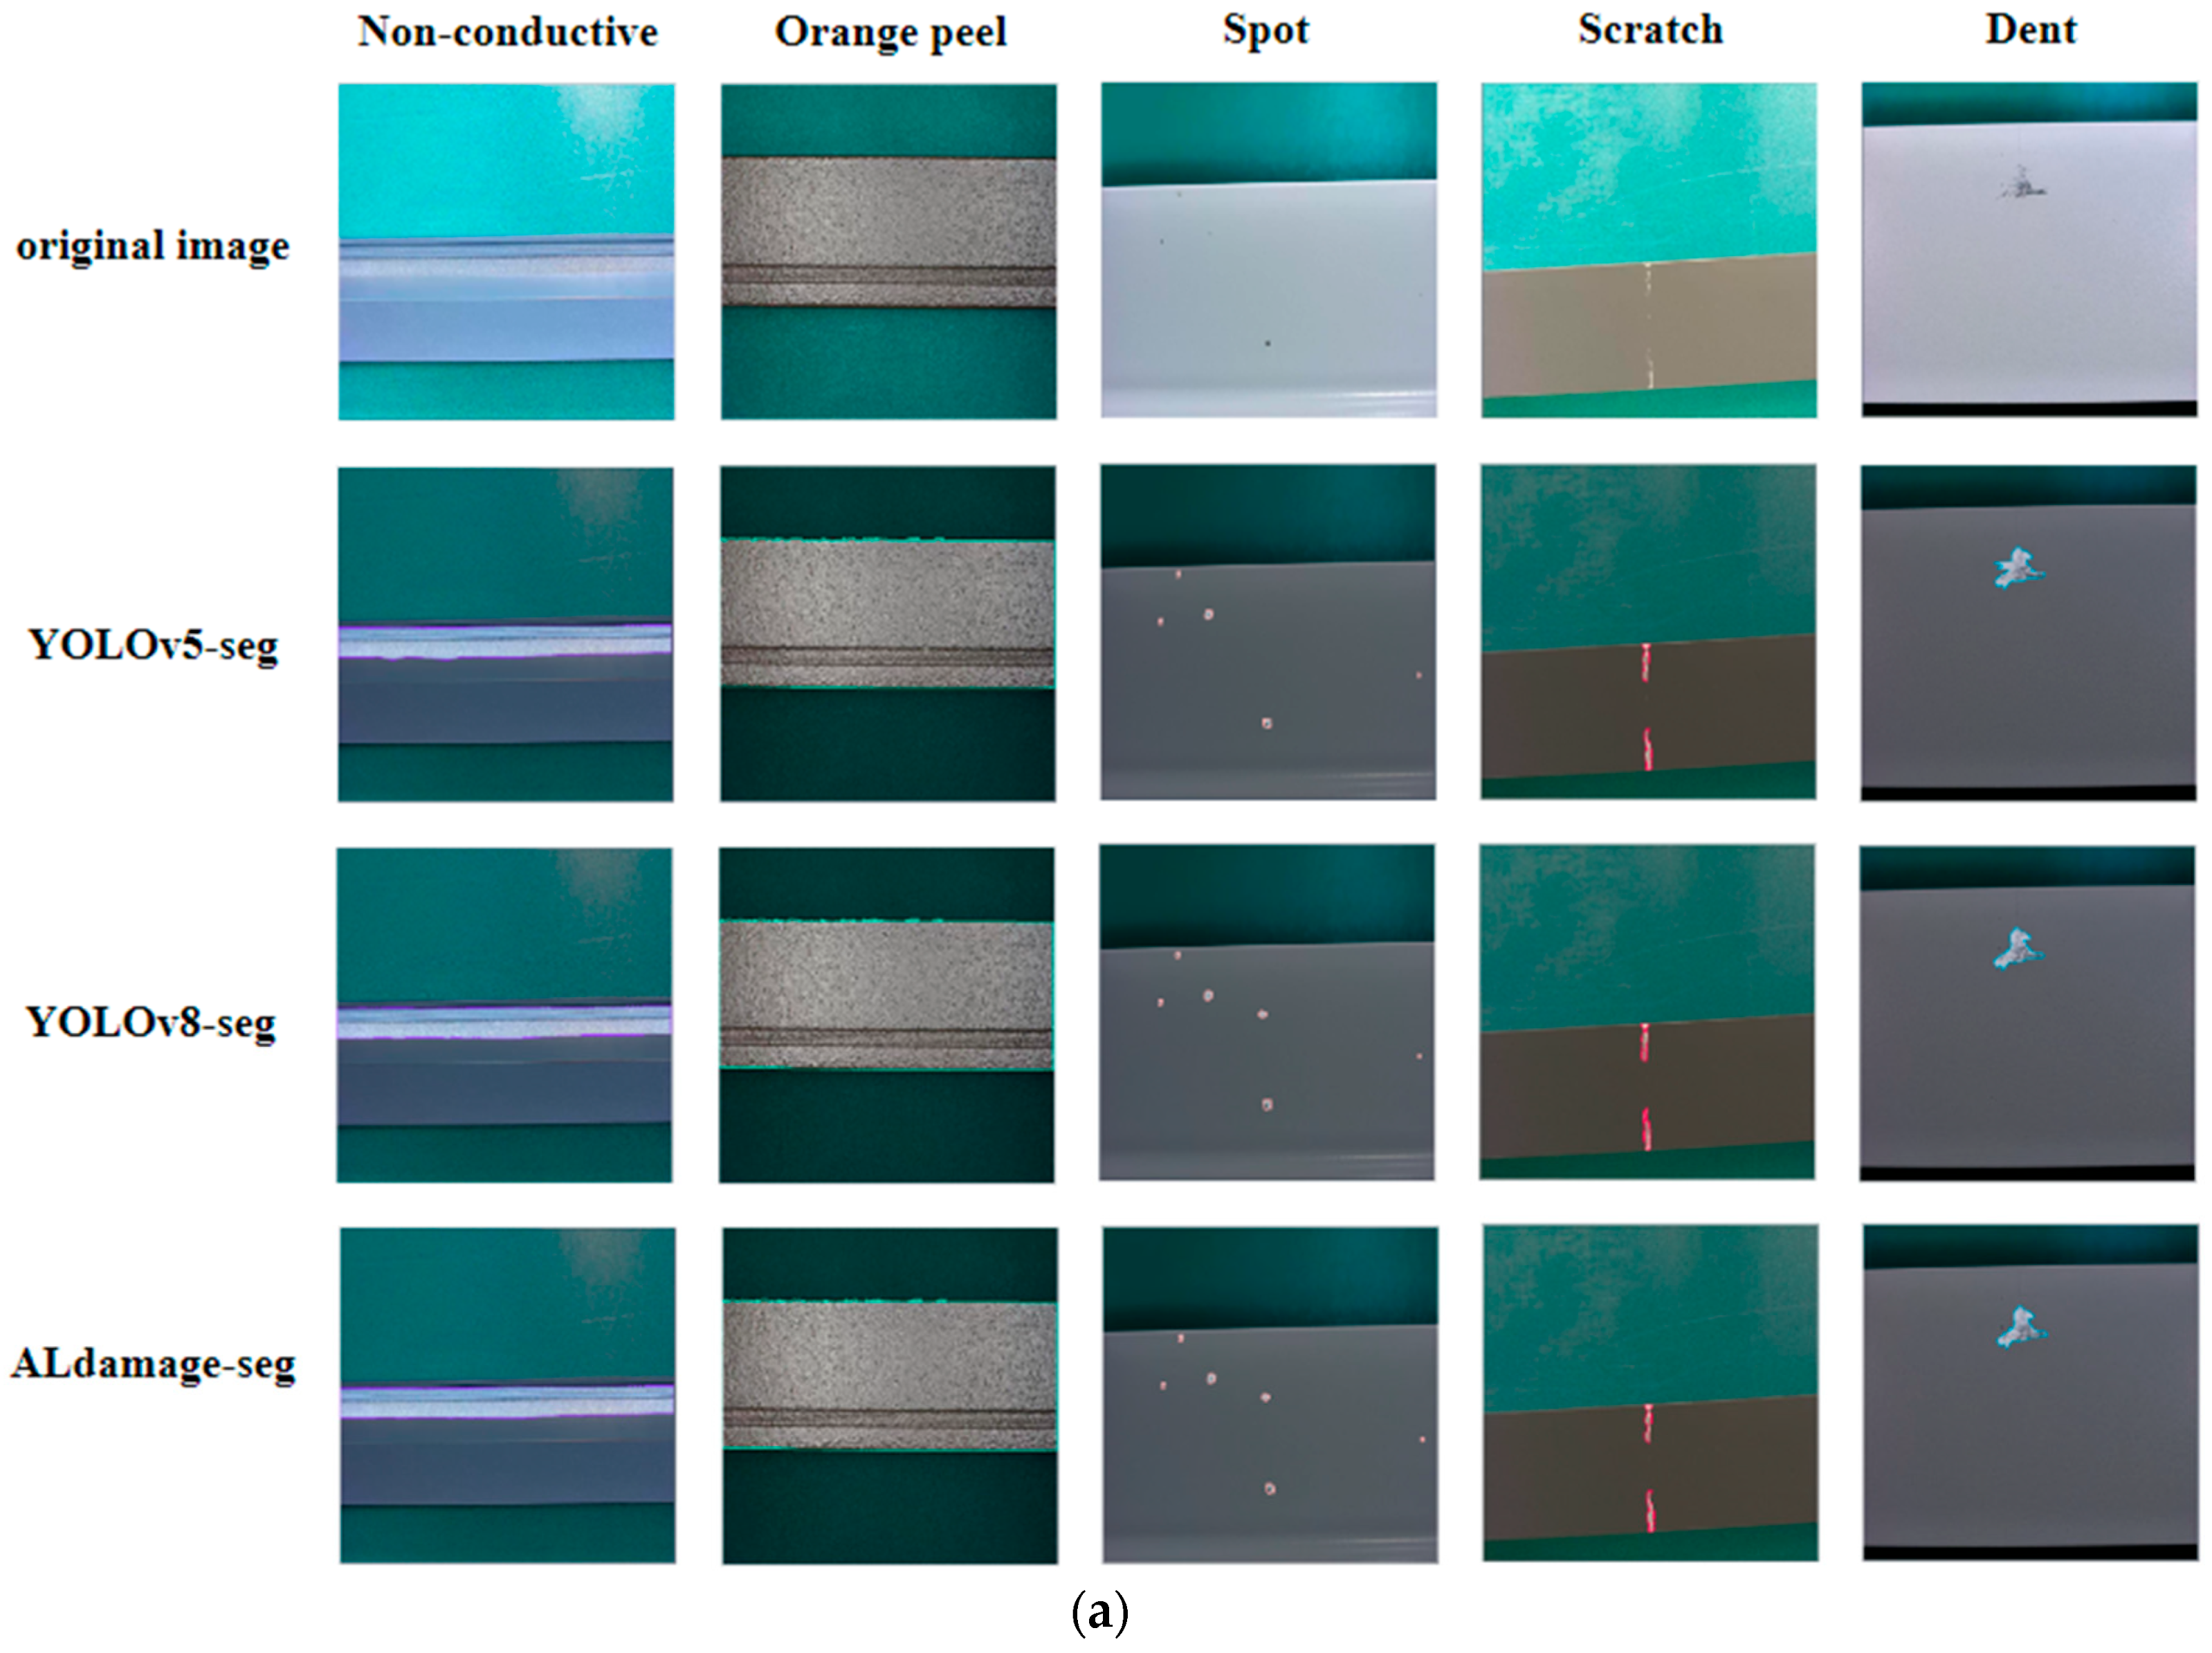
3.5. Results of Detection
4. Discussion
5. Conclusions
Author Contributions
Funding
Institutional Review Board Statement
Informed Consent Statement
Data Availability Statement
Conflicts of Interest
References
- Chen, J. Research on Aluminum Alloy Materials and Application Technology for Automotive Lightweighting. J. Mater. Chem. 2023, 4, 1–7. [Google Scholar] [CrossRef]
- Yu, Y.; Ti, J.; Lu, Z. Law and Fracture Characteristics of Stress Corrosion Cracking for 7B04 Aluminum Alloy. Mater. Sci. Forum 2021, 6181, 207–212. [Google Scholar] [CrossRef]
- Pratim, D.M.; Larry, M.; Shreyansh, D. Online Photometric Calibration of Automatic Gain Thermal Infrared Cameras. IEEE Robot. Autom. Lett. 2021, 6, 2453–2460. [Google Scholar] [CrossRef]
- Dionysios, L.; Vaia, K.; Niki, M.; Anastasios, K.; Athanasios, B.; George, F.; Ioannis, V.; Christos, M. On the Response of a Micro Non-Destructive Testing X-ray Detector. Materials 2021, 14, 888. [Google Scholar] [CrossRef] [PubMed]
- Li, X.; Chao, D.; Yan, Z.; Yin, P. Wafer Crack Detection Based on Yolov4 Target Detection Method. J. Phys. Conf. Ser. 2021, 1802, 022101. [Google Scholar] [CrossRef]
- Chen, L.; Yan, H.; Xiang, Q.; Zhu, S.; Zhu, P.; Liao, C.; Tian, H.; Xiu, L.; Wang, X.; Li, X. A Domain Adaptation YOLOv5 Model for Industrial Defect Inspection. Measurement 2023, 213, 112725. [Google Scholar] [CrossRef]
- Liu, S.; Chen, J.; Liang, L.; Bai, H.; Dang, W. Light-Weight Semantic Segmentation Network for UAV Remote Sensing Images. IEEE J. Sel. Top. Appl. Earth Obs. Remote Sens. 2021, 14, 8287–8296. [Google Scholar] [CrossRef]
- Wang, Y.; Qi, Q.; Jun, W.; Wang, M.; Ye, Y. The Potential of Image Segmentation Applied to Sampling Design for Improving Farm-level Multi-soil Property Mapping Accuracy. Precis. Agric. 2023, 24, 2350–2373. [Google Scholar] [CrossRef]
- Zheng, Q.; Xu, L.; Wang, F.; Xu, Y.; Chao, L.; Zhang, G. HilbertSCNet: Self-attention Networks for Small Target Segmentation of Aerial Drone Images. Appl. Soft Comput. 2024, 150, 111035. [Google Scholar] [CrossRef]
- Bijal, C.; Nikolas, O.; Jonne, T.; Nicklas, N.; Jon, E.; Ismo, A. Automated Mapping of Bedrock-fracture Traces from UAV-acquired Images Using U-Net Convolutional Neural Networks. Comput. Geosci. 2024, 182, 105463. [Google Scholar] [CrossRef]
- Li, J.; Xiang, L.; Li, M.; Yan, P. A Dual-path Instance Segmentation Network Based on Nuclei Contour in Histology Image. Discov. Artif. Intell. 2023, 3, 35. [Google Scholar] [CrossRef]
- Chen, C.; Guo, Y.; Tian, F.; Liu, S.; Yang, W.; Wang, Z.; Jing, W.; Hang, S.; Hanspeter, P.; Liu, S. A Unified Interactive Model Evaluation for Classification, Object Detection, and Instance Segmentation in Computer Vision. IEEE Trans. Vis. Comput. Graph. 2023, 30, 76–86. [Google Scholar] [CrossRef] [PubMed]
- Park, J.J.; Doiphode, N.; Zhang, X.; Pan, L.; Blue, R.; Shi, J.; Buch, V.P. Developing the Surgeon-machine Interface: Using a Novel Instance-segmentation Framework for Intraoperative Landmark Labelling. Front. Surg. 2023, 10, 1259756. [Google Scholar] [CrossRef] [PubMed]
- García-Aguilar, I.; García-González, J.; Luque-Baena, R.M.; López-Rubio, E.; Domínguez, E. Optimized Instance Segmentation by Super-resolution and Maximal Clique Generation. Integr. Comput.-Aid. Eng. 2023, 30, 243–256. [Google Scholar] [CrossRef]
- Kim, K.; Kim, K.; Jeong, S. Application of YOLO v5 and v8 for Recognition of Safety Risk Factors at Construction Sites. Sustainability 2023, 15, 15179. [Google Scholar] [CrossRef]
- Li, G.; Zhao, S.; Zhou, M.; Li, M.; Shao, R.; Zhang, Z.; Han, D. YOLO-RFF: An Industrial Defect Detection Method Based on Expanded Field of Feeling and Feature Fusion. Electronics 2022, 11, 4211. [Google Scholar] [CrossRef]
- Pedro, A.; Vítor, S. Comparative Analysis of Multiple YOLO-based Target Detectors and Trackers for ADAS in Edge Devices. Robot. Auton. Syst. 2024, 171, 104558. [Google Scholar] [CrossRef]
- Sayyad, J.; Ramesh, B.T.; Attarde, K.; Bongale, A. Hexacopter-Based Modern Remote Sensing Using the YOLO Algorithm. Adv. Scitechnol.-Res. 2023, 6680, 75–84. [Google Scholar] [CrossRef]
- Chen, J.; Bao, E.; Pan, J. Classification and Positioning of Circuit Board Components Based on Improved YOLOv5. Procedia Comput. Sci. 2022, 208, 613–626. [Google Scholar] [CrossRef]
- Lv, L.; Li, X.; Mao, F.; Zhou, L.; Xuan, J.; Zhao, Y.; Yu, J.; Song, M.; Huang, L.; Du, H. A Deep Learning Network for Individual Tree Segmentation in UAV Images with a Coupled CSPNet and Attention Mechanism. Remote Sens. 2023, 15, 4420. [Google Scholar] [CrossRef]
- Rui, S.; Osvaldo, G.F.; Pedro, M.-P. Boosting the performance of SOTA convolution-based networks with dimensionality reduction: An application on hyperspectral images of wine grape berries. Intell. Syst. Appl. 2023, 19, 200252. [Google Scholar] [CrossRef]
- Hussain, M. YOLO-v1 to YOLO-v8, the Rise of YOLO and Its Complementary Nature toward Digital Manufacturing and Industrial Defect Detection. Machines 2023, 11, 677. [Google Scholar] [CrossRef]
- Wu, Y.; Han, Q.; Jin, Q.; Li, J.; Zhang, Y. LCA-YOLOv8-Seg: An Improved Lightweight YOLOv8-Seg for Real-Time Pixel-Level Crack Detection of Dams and Bridges. Appl. Sci. 2023, 13, 10583. [Google Scholar] [CrossRef]
- Wai, L.K.; Lai-Man, P.; Ur, R.Y.A. Large Separable Kernel Attention: Rethinking the Large Kernel Attention design in CNN. Expert Syst. Appl. 2024, 236, 121352. [Google Scholar] [CrossRef]
- Zhang, H.; Tang, C.; Sun, X.; Fu, L. A Refined Apple Binocular Positioning Method with Segmentation-Based Deep Learning for Robotic Picking. Agronomy 2023, 13, 1469. [Google Scholar] [CrossRef]
- Song, X.; Cao, S.; Zhang, J.; Hou, Z. Steel Surface Defect Detection Algorithm Based on YOLOv8. Electronics 2024, 13, 988. [Google Scholar] [CrossRef]


| Model | Weight | GFLOPs | Parameters | ||
|---|---|---|---|---|---|
| Mask R-CNN [25] | 170M | 0.661 | 0.73 | 136 | 43,970,546 |
| YOLOv5n-seg | 5.5M | 0.586 | 0.677 | 10.8 | 2,672,590 |
| YOLOv7-seg | 79.6M | 0.655 | 0.727 | 151 | 38,760,121 |
| YOLOv8m-seg | 57.4M | 0.649 | 0.72 | 112 | 28,462,981 |
| YOLOv8s-seg | 24.8M | 0.631 | 0.714 | 43.7 | 12,746,134 |
| YOLOv8n-seg | 6.6M | 0.609 | 0.7 | 12 | 3,260,014 |
| YOLOv8n-seg * | 6.3M | 0.585 | 0.681 | 11 | 3,480,724 |
| YOLOv8n-seg * | 5.6M | 0.587 | 0.68 | 10.4 | 2,721,230 |
| YOLOv8n-seg * | 5.2M | 0.554 | 0.642 | 9.1 | 2,494,420 |
| ALdamage-seg | 2.9M | 0.604 | 0.688 | 6.4 | 1,373,412 |
| Methodology | Weight | GFLOPs | ||
|---|---|---|---|---|
| +MobileNetV3+DPConv +MFEM * | 4.8M | 0.582 | 0.67 | 7.5 |
| +MobileNetV3+DPConv+C2f_LSKA * | 2.5M | 0.56 | 0.621 | 5.4 |
| +MobileNetV3+MFEM+C2f_LSKA * | 4.9M | 0.598 | 0.68 | 9.4 |
| +DPConv+MFEM+C2f_LSKA * | 3.9M | 0.572 | 0.633 | 7.2 |
| +MobileNetV3+MFEM * | 7.2M | 0.591 | 0.672 | 10.5 |
| + MobileNetV3+C2f_LSKA * | 4.3M | 0.558 | 0.654 | 8.4 |
| +MobileNetV3+DPConv * | 4.5M | 0.544 | 0.647 | 7 |
| +DPConv+MFEM * | 5.9M | 0.581 | 0.66 | 8.2 |
| +MFEM+C2f_LSKA * | 5.2M | 0.583 | 0.663 | 9.7 |
| +DPConv+C2f_LSKA * | 3.6M | 0.541 | 0.631 | 6.6 |
| +MFEM * | 7.8M | 0.611 | 0.695 | 12.4 |
| +C2f_LSKA * | 4.7M | 0.56 | 0.64 | 8 |
| +DPConv * | 5.4M | 0.551 | 0.632 | 7.5 |
| +MobileNetV3 | 6.3M | 0.585 | 0.681 | 11 |
| ALdamage-seg | 2.9M | 0.604 | 0.688 | 6.4 |
Disclaimer/Publisher’s Note: The statements, opinions and data contained in all publications are solely those of the individual author(s) and contributor(s) and not of MDPI and/or the editor(s). MDPI and/or the editor(s) disclaim responsibility for any injury to people or property resulting from any ideas, methods, instructions or products referred to in the content. |
© 2024 by the authors. Licensee MDPI, Basel, Switzerland. This article is an open access article distributed under the terms and conditions of the Creative Commons Attribution (CC BY) license (https://creativecommons.org/licenses/by/4.0/).
Share and Cite
Zhu, W.; Su, B.; Zhang, X.; Li, L.; Fang, S. ALdamage-seg: A Lightweight Model for Instance Segmentation of Aluminum Profiles. Buildings 2024, 14, 2036. https://doi.org/10.3390/buildings14072036
Zhu W, Su B, Zhang X, Li L, Fang S. ALdamage-seg: A Lightweight Model for Instance Segmentation of Aluminum Profiles. Buildings. 2024; 14(7):2036. https://doi.org/10.3390/buildings14072036
Chicago/Turabian StyleZhu, Wenxuan, Bochao Su, Xinhe Zhang, Ly Li, and Siwen Fang. 2024. "ALdamage-seg: A Lightweight Model for Instance Segmentation of Aluminum Profiles" Buildings 14, no. 7: 2036. https://doi.org/10.3390/buildings14072036
APA StyleZhu, W., Su, B., Zhang, X., Li, L., & Fang, S. (2024). ALdamage-seg: A Lightweight Model for Instance Segmentation of Aluminum Profiles. Buildings, 14(7), 2036. https://doi.org/10.3390/buildings14072036